Highlights
What are the main findings?
- A novel method (DMSB-DG) was developed that integrates both magnitude and direction of InSAR-derived deformation gradients with ISODATA clustering to delineate mining-induced subsidence boundaries.
- The method significantly outperforms existing approaches, achieving over 85% in key accuracy metrics and showing robustness against noise, secondary disturbances, and different SAR tracks.
What is the implication of the main finding?
- The proposed method provides a reliable and high-precision tool for identifying mining-affected areas, even in complex geological conditions with limited ground observations.
- It offers practical support for surface stability assessment and illegal mining detection, enhancing the applicability of InSAR for sustainable mining management.
Abstract
Mining-induced subsidence boundaries, i.e., the surface areas affected by underground mining, play an important role in surface damage assessment and illegal mining identification. Traditional boundary delineation methods rely on field surveys, which restrict their applicability in regions with limited ground observations. Interferometric Synthetic Aperture Radar (InSAR) technology provides a cost-effective and non-contact solution for delineating subsidence boundaries. However, existing InSAR-based methods for subsidence boundary delineation are susceptible to observation noise and other deformation sources, which reduce the accuracy of boundary identification. To this end, this study proposes a novel method for delineating mining-induced subsidence boundaries by integrating both the magnitude and direction of InSAR-derived deformation gradients, referred to as DMSB-DG. First, time-series line-of-sight (LOS) deformation is obtained based on InSAR technology over mining areas. Then, the Roberts operator is employed to compute the magnitude and direction of the deformation gradients, which serve as the basis for boundary delineation. Finally, the ISODATA clustering algorithm is used, incorporating both the magnitude and direction of the deformation gradients as dual constraints to achieve accurate delineation of mining-affected boundaries. The combination of the two features effectively enhances the completeness and accuracy of boundary delineation. The performance of the proposed DMSB-DG method has been verified by simulation and field data. Specifically, compared with the adaptive mining subsidence boundary delimitation (ASBD) method, the proposed method achieved Kappa coefficients of 91.96% and 87.28%, representing improvements of 21.23% and 27.14% in two field tests, respectively. Furthermore, the influence of ascending and descending SAR images, as well as observational noise, on the performance of the proposed algorithm is also evaluated. The results demonstrate that the proposed method effectively suppresses InSAR noise and other interfering deformations, enabling high-precision delineation of mining impact boundaries.
1. Introduction
Coal, as one of the main energy sources in the world, provides strong support for high-quality economic and social development worldwide. In 2024, the total global coal production reached approximately 8.318 billion tons and is expected to continue increasing through 2027 [1,2,3]. With the continuous extraction of underground coal resources, a range of environmental and safety issues have emerged, including surface subsidence, structural damage, landslides, ground fissures, and even threat to the lives and property of nearby residents [4,5,6,7,8]. The area affected by subsidence is typically closely associated with the spatial distribution of underground mined-out areas. Therefore, accurately delineating mining-induced subsidence boundaries is essential for the safety assessment of surface structures in mining areas [9,10]. In addition, precise identification of mining-affected zones can also assist in the detection of illegal mining activities [11,12,13,14].
Traditional methods for delineating mining-induced subsidence boundaries can be classified into two categories [15]: (1) data-driven methods [16,17], which delineate boundaries directly based on surface subsidence measurements obtained through geophysical observation techniques such as leveling surveys, GNSS, and LiDAR; (2) model-based methods [18,19], which predict surface subsidence using theoretical models such as the probability integral model (PIM) [20,21,22] and subsequently delineate the subsidence boundaries. However, both approaches rely heavily on in situ data from mining areas, making them difficult to apply in data-scarce regions and thus limiting their applicability.
Interferometric Synthetic Aperture Radar (InSAR) is an active microwave remote sensing technology characterized by wide coverage, high precision, and high spatial resolution [23,24]. Currently, the InSAR technique has been widely applied in mining-induced deformation monitoring and prediction, surface stability risk assessment, and subsidence boundary delineation [25,26,27,28,29,30]. In particular, InSAR-based methods for delineating mining-induced subsidence boundaries can effectively compensate for the limitations of traditional methods [30]. InSAR-based methods can be broadly categorized into fixed threshold methods [30,31], adaptive threshold methods [32], and machine learning approaches [33,34]. The fixed threshold method (FTM) delineates the mining-affected boundary by setting a critical deformation value, typically designating regions exceeding 10 mm of displacement [35,36] as subsidence areas. However, the accuracy of InSAR deformation measurements is influenced by factors such as temporal and spatial decorrelation, atmospheric delays, and systematic noise, which often result in significant discrepancies between the boundaries delineated by FTMs and the actual subsidence boundaries. To address this, Yang et al. proposed an adaptive subsidence boundary delimitation method (ASBD) that uses non-deformation zones as reference samples to adaptively evaluate the overall precision of InSAR-derived deformation measurements, and delineates boundaries based on confidence levels [32]. However, ASBD fails to effectively distinguish mining-induced deformation from other interfering sources and thus tends to cause boundary over extension when historical goafs or other deformation sources are present near the active mining face. Xu et al. developed a method for the rapid identification of subsidence basins based on the temporal evolution trends of mining-induced deformation [33]. Although this method is efficient, it relies on predefined reference deformation curves and requires high-quality sample and field data. Wang et al. introduced an automated detection model that employs Histogram of Oriented Gradient (HOG) features and a Support Vector Machine (SVM) classifier to extract subsidence basins from InSAR interferograms [34]. While effective in outlining the general extent of subsidence zones, this method cannot accurately delineate the detailed spatial characteristics of mining-affected boundaries.
Recently, deformation gradients have been widely applied to the identification of different deformation regions. Zhang et al. [37] proposed an improved phase gradient stacking (IPGS) method for large-scale identification of geological hazards such as landslides, successfully detecting potential landslide areas. Sun et al. [38] integrated the IPGS method with the AttU-Net network, which significantly improved identification accuracy and efficiency. Hu et al. [39] developed a D-InSAR-based system for detecting illegal mining activities, in which the gradient magnitude was used to identify mining boundaries and the correlation between shape and direction was employed to exclude abnormal boundaries. However, these methods all neglect gradient direction and rely solely on gradient magnitude for deformation region identification, which can easily lead to missed detections and misclassifications of local deformation areas. Moreover, the threshold settings for gradient-based boundary determination in these methods largely depend on empirical values without solid theoretical support, resulting in limited regional adaptability and difficulty in maintaining stable performance across different geological conditions.
To address the above issues, this study proposes a method for delineating mining-induced subsidence boundaries based on deformation gradients, called DMSB-DG. In mining-affected areas, deformation gradients typically exhibit larger magnitudes and strong directional consistency, whereas in unaffected areas, they tend to be smaller and more directionally dispersed. Therefore, using deformation gradients as the basis for subsidence boundary delineation can effectively suppress the influence of measurement noise and other interfering deformation sources, such as tectonic activity and secondary disturbances from historical goafs. Specifically, time-series surface deformation in the LOS direction is first derived from InSAR over the mined-out areas. Then, the Roberts operator is used to calculate the magnitude and direction of the deformation gradients. Subsequently, the ISODATA classification algorithm is applied by jointly incorporating both gradient magnitude and direction as dual constraints to delineate the subsidence boundaries. By superimposing and fusing the identification results of the magnitude and direction of the deformation gradient, the morphology of the subsidence boundary is further refined and completed. The effectiveness of the proposed method is validated through both simulated and real-case experiments, demonstrating significant improvements in the accuracy of mining-induced subsidence boundary delineation.
The structure of this study is organized as follows. Section 2 provides a detailed description of the proposed algorithm. Section 3 and Section 4 present the simulation and real data experiment to validate the effectiveness of the proposed approach. Section 5 and Section 6 offer relevant discussions and conclusions, respectively.
2. Methods
The proposed DMSB-DG method follows the main workflow illustrated in Figure 1 and consists of the following three steps:
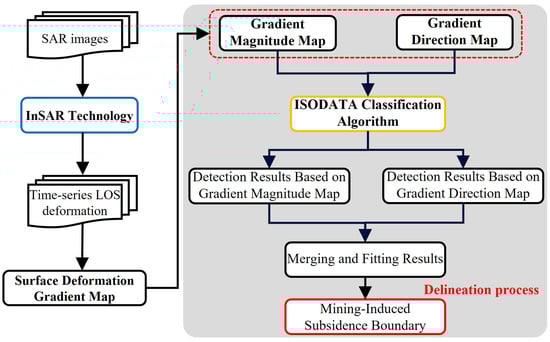
Figure 1.
Flowchart of the proposed algorithm. The dark background represents the boundary delineation process based on deformation gradient features.
- (1)
- Obtaining LOS surface deformation information using InSAR technology (Section 2.1);
- (2)
- Calculating the gradient magnitude and direction characteristics of the deformation field based on the extracted LOS deformation (Section 2.2);
- (3)
- Applying the ISODATA clustering algorithm by integrating both the gradient magnitude and direction of the deformation gradient to accurately delineate the mining-induced subsidence boundary (Section 2.3).
- (4)
- Determining the accuracy of the delineated boundary based on the accuracy evaluation metric (Section 2.4).
2.1. Surface Deformation Acquisition
Differential Interferometric Synthetic Aperture Radar (D-InSAR) technology is used to obtain time-series surface deformation within the study area [24]. Taking a single interferogram as an example, the deformation retrieval process is briefly described. In interferometric processing, the interferometric phase can be expressed as follows [23]:
where represents the deformation phase in the LOS direction, is the flat phase, denotes the topographic phase, indicates the atmospheric phase, refers to the noise phase. In the D-InSAR technique, can be retrieved by removing and mitigating the remaining four phase components. Specifically, is estimated and removed based on the imaging geometry and precise orbital ephemeris, while is removed using external Digital Elevation Model (DEM) data. can be mitigated using external meteorological data, empirical models, and other methods. The interferogram is then unwrapped using appropriate phase unwrapping algorithms, such as the Minimum Cost Flow (MCF) [40] or Branch-Cut methods [41]. Subsequently, the unwrapped phase is converted into surface deformation values based on the phase-to-deformation mapping relationship, as shown in Equation (2):
where and represent the surface deformation and the unwrapped phase, respectively, and denotes the SAR wavelength. Finally, the deformation measurements are geocoded and projected into a geographic coordinate system for subsequent spatial analysis.
2.2. Calculation of Deformation Gradient Magnitude and Direction
This study proposes a method to identify mining-affected pixels based on deformation gradients, i.e., DMSB-DG. The core principle is that deformation gradients in mining-affected areas exhibit significant spatial clustering, whereas those in stable regions tend to be irregular and disordered. To accurately calculate the magnitude and direction of the deformation gradients, various operators can be used, such as Sobel, Prewitt, and Roberts. Among them, the Roberts operator is particularly sensitive to local details and capable of capturing subtle gradient variations. Therefore, the Roberts operator is employed in the proposed DMSB-DG method to compute the gradient magnitude and direction. The Roberts operator calculates the deformation gradients along the ±45° directions using a 2 × 2 pixel window, as follows:
where represents the deformation in the LOS direction; and denote the deformation gradients in the ±45° directions of the pixel with row m and column n, respectively. Subsequently, the gradient magnitude and direction of each pixel are calculated based on the computed results:
where denotes the computed deformation gradient magnitude at pixel , and represents the calculated gradient direction at pixel .
2.3. Delineation of Mining-Induced Deformation Boundaries
Based on the principle that the deformation gradient in mining-affected areas differs significantly from those in the background, the ISODATA algorithm is adopted for classification and identification [42]. As an extension of the traditional K-means algorithm, the ISODATA algorithm has the ability to dynamically adjust the number of clusters, eliminating the need to predefine the parameter K. This makes it particularly suitable for scenarios where the number of classes is unknown or variable. The basic principle of the ISODATA algorithm is summarized as follows:
- (1)
- Randomly select K cluster centers and their corresponding cluster blocks . Define the minimum and maximum number of clusters and , the minimum sample threshold , the cluster splitting threshold , the cluster merging threshold , and the maximum number of iterations t. For each sample point in the dataset, the distances to all cluster centers are calculated, and the sample is assigned to the nearest cluster block , i.e., .
- (2)
- Check whether the number of samples in each cluster exceeds the minimum sample threshold . If so, the cluster is removed. Then, new cluster centers are generated, and the average intra-cluster distance is calculated for each remaining cluster.where is the number of samples in cluster .
- (3)
- If the average intra-cluster distance exceeds the splitting threshold , the cluster is split into two sub-clusters. The new cluster centers are defined aswhere is a perturbation vector, typically applied as a small offset along the principal direction.
- (4)
- For any two clusters and , if the distance between the two centers is less than the merging threshold , i.e., , they are merged into a new cluster with a new center .
Steps (2) to (4) are executed iteratively until the maximum number of iterations is reached or the clustering results converge. Since both the magnitude and direction of the deformation gradient reflect the spatiotemporal variations in the mining impact boundary, they are independently utilized to accurately delineate the mining-induced subsidence boundary. The two results are then superimposed and fused to comprehensively capture the boundary information. Subsequently, the fused result is subjected to curve fitting to further enhance the completeness and continuity of the identified region, thereby enabling the precise extraction of the mining impact boundary. Notably, the same ISODATA parameters were used in this study. According to the parameter settings in [42], the parameters of the ISODATA algorithm were configured as follows: the minimum and maximum number of clusters and were set to 5 and 15, the maximum number of iterations t was 15, the minimum sample threshold was 40, the cluster splitting threshold was 5, and the cluster merging threshold was 2. In addition, this study adopts a fusion strategy that takes the union of all identification results from both gradient magnitude and direction. This approach ensures that all mining-affected pixels are effectively identified, and by introducing both gradient magnitude and direction as dual constraints, the fusion results keep both omissions and false detections within a reasonable range.
2.4. Accuracy Evaluation
This study employs the true positive rate (TPR), miss rate (MR), false positive rate (FPR), false discovery rate (FDR), accuracy (ACC), precision (PRE), Kappa coefficient, and F1 score to evaluate the accuracy of boundary delineation. The TPR is the proportion of all actual mining-affected pixels that are correctly identified, while MR represents the opposite. FPR indicates the proportion of all actual non-mining-affected pixels that are incorrectly identified. FDR denotes the proportion of identified subsidence-affected pixels that are actually non-subsidence-affected. ACC reflects the proportion of all pixels that are correctly identified, including both subsidence-affected and non-affected pixels. Kappa is used to measure the agreement between the identification and the reference results. The F1 score provides a balanced measure between the PRE and TPR. The corresponding calculation formulas are summarized in Table 1.

Table 1.
Evaluation metrics formula summary.
3. Simulation Experiment and Results
3.1. Simulation of InSAR-Derived Deformation Observations
This study first validated the feasibility of the proposed DMSB-DG method through simulation experiments. Specifically, the probability integral model (PIM) was employed to simulate the three-dimensional surface deformation induced by underground mining. The geometric parameters of the working face were as follows: the strike length 500 m, the dip length 300 m, the mean mining depth 500 m, the dip angle , the azimuth angle , and the mining thickness 2 m. The incident angle () and heading angle () of the SAR satellite were and , respectively. The parameters for the probability integral method were as follows: the subsidence factor 0.3, the horizontal displacement factor 0.25, the influence propagation angle , the tangent of the main influence angle 1.79, and the offsets of the break points 20 m. Then, the simulated three-dimensional surface deformation was projected onto the LOS direction . The specific relationship between them was as follows:
To approximate real observation conditions, actual noise was added to the simulated LOS-direction deformation. Specifically, a deformation-free region was randomly cropped from the D-InSAR monitoring result derived from two ALOS-2 images acquired on 3 December 2023 and 25 February 2024. This region was treated as real noise and superimposed onto the simulated LOS-direction deformation. The noisy deformation field is shown in Figure 2a.
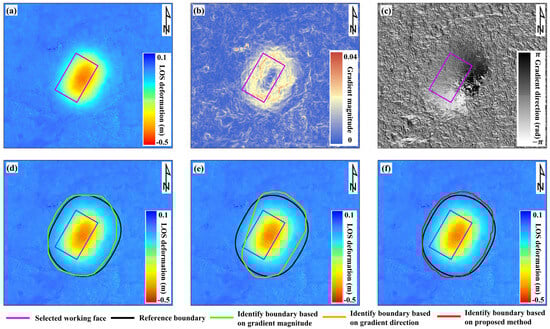
Figure 2.
Simulated ground deformation and the corresponding boundary identification result. (a) shows the simulated LOS-direction deformation. (b,c) represent the deformation gradient magnitude and direction derived from the simulated deformation. (d,e) are the boundaries identified by the gradient magnitude and direction in comparison with the reference boundary. (f) presents a comparison between the boundary identified by the DMSB-DG algorithm and the reference boundary.
3.2. InSAR-Based Delineation of Subsidence Boundaries
To accurately delineate the subsidence boundary, the magnitude and direction of the deformation gradient were first calculated from the simulated LOS-direction deformation using the Roberts operator, as shown in Figure 2b,c. Subsequently, the ISODATA classification algorithm was applied to identify pixels within the mining-affected area based on the magnitude and direction of the extracted deformation gradient. The delineation results based on the deformation gradient magnitude and direction are shown in Figure 2d,e. Finally, the two identification results were superimposed and fused, and a curve fitting algorithm was applied to obtain a complete and coherent boundary. The final delineated boundary is shown in Figure 2f. During mining, a vertical subsidence of 10 mm is typically regarded as the point where ground settlement begins. Therefore, this point is usually adopted as the standard for delineating the subsidence boundary. Under this condition, the horizontal displacement is relatively small and can be neglected. The relationship between and can further be expressed as follows:
Accordingly, in this study, the reference boundary was established using a subsidence threshold of mm to evaluate the precision of the delineated boundary [35,36].
As shown in Figure 2d,e, the identification results based solely on gradient magnitude are better than direction. This is because, in simulation scenarios, surface deformation is often regular, and the magnitude discontinuities at the boundaries are more intuitive than directional variations (see Figure 2b,c). To better complement and depict the morphology of mining-induced subsidence boundaries, the results of combining the two features are shown in Figure 2f. Although this approach may increase the probability of misidentification, it ensures the comprehensive inclusion of pixels affected by mining activities, thereby enhancing the robustness of the methodology. Moreover, in real experiments, InSAR observations often deviate from the idealized regular subsidence basin, and gradient magnitude information is insufficient to accurately delineate the boundaries. Therefore, gradient direction is introduced as an additional constraint, and the fusion of both features enables more reliable identification of mining-induced subsidence boundaries.
To quantitatively assess the effectiveness of the proposed method, several evaluation metric—including the true positive rate (TPR), miss rate (MR), false positive rate (FPR), false discovery rate (FDR), accuracy (ACC), precision (PRE), Kappa coefficient, and F1 score—were calculated, as presented in Table 2. As shown in Table 2, the proposed DMSB-DG method achieves better performance in TPR (96.20%) and MR (3.80%) compared with using gradient magnitude or direction alone. This indicates that integrating these two features maximizes the inclusion of mining-affected pixels. Meanwhile, for other key indicators (FPR, FDR, ACC, Kappa, PRE, and F1 score), the maximum difference between the DMSB-DG method and the optimal values is only 3.40% and remains in an acceptable range.
Table 2.
Performance evaluation of the simulation experiment (%).
4. Real Experiment and Results
4.1. Study Areas
Two coalfields, Qianyingzi and Yueliangtian, were selected as study areas. The Qianyingzi coalfield is located in the northern part of Anhui Province, China, as shown in Figure 3b. It lies within the Huang-Huai alluvial plain and is characterized by flat terrain, with the elevation ranging from approximately 25 to 40 m. The strata are mainly composed of sandstone and sandy mudstone, with the main coal seam buried at depths of 400 to 800 m. The Yueliangtian coalfield is situated in western Guizhou Province, China, as shown in Figure 3d. The area is predominantly mountainous and hilly, with significant terrain variations with elevations ranging from approximately 1400 to 1800 m. The geological strata are mainly composed of limestone and sandstone, and the coal-bearing layers are buried at relatively great depths. Two known working faces were selected from these coalfields to evaluate the effectiveness of the proposed method, as shown in Figure 3c,e. Some old goafs are distributed around the selected working face. The mining activities in the selected working faces may induce secondary disturbances in the adjacent old goafs, potentially affecting the accurate delineation of the mining-induced subsidence boundaries. The parameters of the 3212 working face (Area A) in the Qianyingzi coalfield are as follows: strike length of 1148.0 m, dip length of 194.2 m, dip angle of 14°, mining depth of 616 m, and mining thickness of 3 m. For the 130,621 working face (Area B) in the Yueliangtian coalfield, the parameters are as follows: strike length of 396.2 m, dip length of 198.9 m, dip angle of 11°, mining depth of 460.4 m, and mining thickness of 4.47 m. In addition, leveling data were only used to validate the accuracy of the InSAR data. The boundary delineation process was based solely on the InSAR deformation results, without using leveling data.
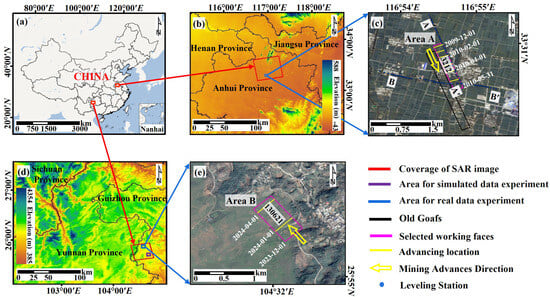
Figure 3.
Geographic location of the study area. (a) shows the geographical location of the two study areas in China. (b,c) are the specific geographical location and mining conditions of the working faces in Study Area A. (d,e) indicate the specific geographical location and mining conditions of the working faces in Study Area B. The purple rectangle region in (d) is used to represent the deformation noise in the simulated data experiment.
4.2. SAR Data Acquisition and Processing
This study collected four ascending ALOS-1 images over the Qianyingzi coalfield, acquired between 13 October 2009 and 31 May 2010, as well as three ascending ALOS-2 images over the Yueliangtian coalfield, acquired between 3 December 2023 and 21 April 2024. The coverage of the SAR images is indicated by the red rectangles in Figure 3b,d. In addition, SRTM with 30 m resolution covering the study areas was used as external reference DEMs. The D-InSAR technique was applied to derive time-series surface deformation in both regions. The specific processing steps were as follows: (i) Multi-looking was applied to the original SAR images to suppress speckle noise. (ii) The first image in each dataset was selected as the reference, and the remaining SAR images were co-registered to it with high precision. (iii) The interferometric pairs were generated based on the shortest temporal baseline principle, as listed in Table 3. (iv) The topographic phase was removed using the external DEM. (v) Phase unwrapping was performed using the MCF method and coherence mask (0.25) to obtain LOS deformation in the radar coordinates. (vi) The inverse distance weighting (IDW) interpolation was applied to the deformation results and the deformation was geocoded and projected into the WGS-84 geographic coordinate system. (vii) The biquadratic polynomial model [43] was employed to mitigate noise caused by atmospheric artifacts and orbital errors, thereby improving the accuracy of InSAR-derived deformation measurements. The surface deformation for the two study areas is presented in Figure 4 and Figure 5.
Table 3.
Parameters of the formed interferometric pairs.
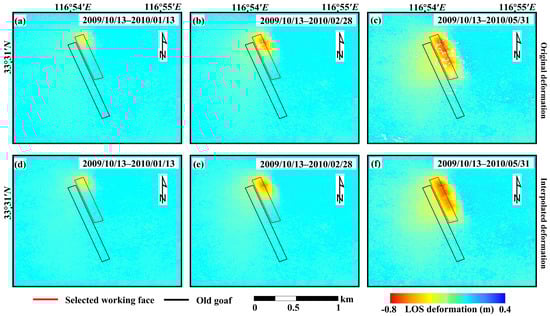
Figure 4.
InSAR-derived LOS deformation of study area A. The red line is the 3212 working face. (a–c) show the original deformation results. (d–f) present the interpolated deformation results.
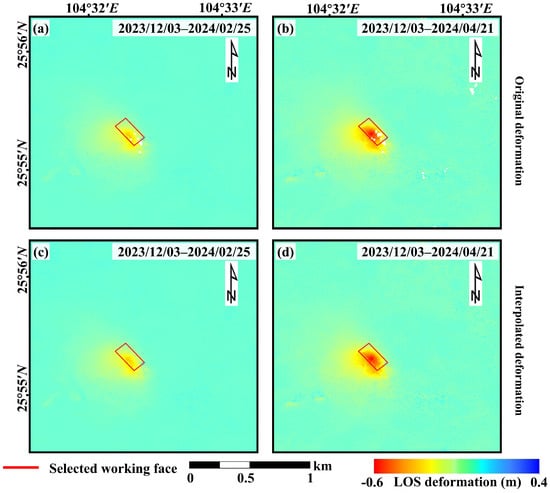
Figure 5.
InSAR-derived LOS deformation of study area B. The red line is the 130,621 working face. (a,b) show the original deformation results. (c,d) present the interpolated deformation results.
When a small area of monitoring points is missing in the deformation results (see Figure 4 and Figure 5), interpolation algorithms can be applied to fill the gaps. In addition, in study area A, the leveling data shown in Figure 3c were used to validate the accuracy of the interpolated deformation results. The leveling data were collected from 14 January to 26 February 2010, while the InSAR observations spanned from 13 January to 28 February 2010, indicating good temporal consistency between the two datasets. The comparison of deformation results is presented in Figure 6. Since the horizontal displacement near the main section along the strike can be neglected [44], the InSAR LOS deformation was converted to the vertical direction based on Equation (13). The RMSE between the leveling data and the interpolated deformation is 23 mm, demonstrating that the interpolated deformation meets the accuracy requirements and can be used for subsequent boundary delineation. In study area B, the validation of the interpolated results could not be performed due to the lack of sufficient leveling data. However, as observed from the original results, the number of missing monitoring points is relatively small, suggesting that the interpolation algorithm introduces only minor errors. Moreover, this study focuses on boundary delineation rather than large-scale deformation monitoring. The InSAR technique provides sufficient accuracy for deformation monitoring in boundary zones, while most of the missing points are concentrated in areas with steep deformation gradients. This indicates that interpolated data is more suitable for calculating gradient magnitude and direction, without introducing significant errors in boundary delineation. Therefore, the interpolated results are used for subsequent analyses in this study.
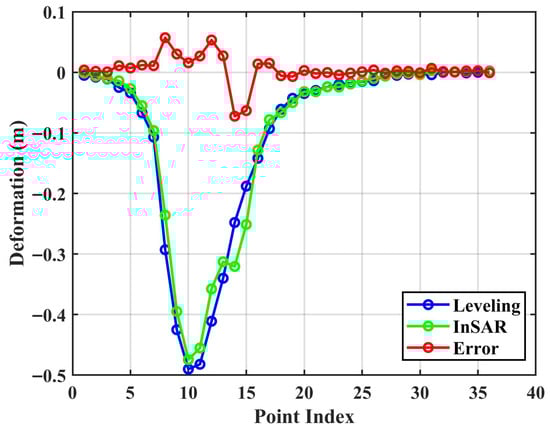
Figure 6.
Comparison between the interpolated InSAR results and the leveling measurements in study area A. The red points indicate the differences between the two datasets.
In study area A, only the 3212 working face was actively mined during the InSAR observation period, as shown in Figure 3c. When the 3212 working face was mined, the overlying strata above the old goafs inevitably experienced secondary disturbances, resulting in the final surface subsidence basin that was biased toward the location of the old goaf, as shown in Figure 4c. Therefore, directly delineating the mining-affected boundary based on the final deformation pattern may lead to a bias toward the old goafs, thus reducing the delineation accuracy. Additionally, in study area B, only the working face extracted in 2024 is available, as shown in Figure 3e, and there is no definitive information on whether there are old goafs adjacent to the selected working face. However, as shown in Figure 5b, the InSAR-derived deformation pattern clearly exhibits a southeast trend. Given that the dip angle of the 130,621 working face is 11°, it is inferred that unreported adjacent old goafs may exist in the southeast direction. Their potential disturbances could influence the observed deformation, thus affecting the precision of boundary delineation in this area.
4.3. InSAR Deformation Accuracy Analysis
To better evaluate the quality of the InSAR results, coherence maps were generated for two study areas: study area A (Figure 7a) and study area B (Figure 7b). As shown in Figure 7a,b, the coherence in study area A is generally higher than in study area B, with the average coherence values of 0.55 (study area A) and 0.35 (study area B). This difference can be attributed to the fact that study area A is located in a plain area, where coherence is generally superior than in mountainous regions such as study area B. In addition, Non-deformation areas ( pixels) were randomly extracted from the two study areas, as shown in Figure 7c,d. The mean and standard deviation of the Non-deformation areas were calculated to assess the accuracy of InSAR deformation monitoring. In area A, the deformation-free area shows a mean of 2.34 mm and a standard deviation of 15.27 mm, whereas in study area B, the corresponding mean and standard deviation are 14.93 mm and 33.29 mm, respectively. From the above results, the accuracy of InSAR deformation monitoring in study area A is higher than that in study area B.
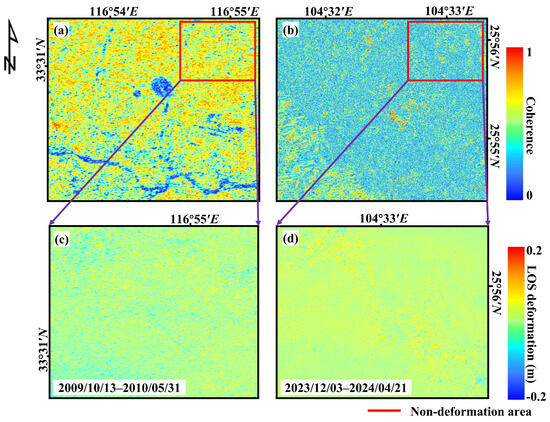
Figure 7.
Coherence maps and Non-deformation areas of the study regions. (a,b) represent the coherence maps of study areas A and B. (c,d) are the non-mining-affected areas of study areas A and B, as indicated by the red rectangles in (a,b).
4.4. Delineation of Subsidence Boundaries
4.4.1. Delineation Result in Study Area A
Based on the deformation data of study area A, the magnitude and direction of the deformation gradient were calculated, as shown in Figure 8a,b. It can be seen from Figure 8b that the directions of the deformation gradient display a clear clustering pattern in the mining-affected area, while other regions show dispersed and disordered directional features. In addition, the direction of the deformation gradient on both sides of the strike section (see in Figure 2c) is opposite, consistent with the typical characteristics of mining-induced deformation. The delineation results obtained separately from the deformation gradient magnitude and direction are shown in Figure 8c,d. Based on the calculated magnitude and direction of the deformation gradient, the DMSB-DG algorithm was applied to delineate the area affected by underground mining, as shown in Figure 8e. To validate the effectiveness of the proposed method, the reference mining-affected boundary was determined based on the PIM. Specifically, the mining-induced deformation was estimated using the PIM with relevant geological and mining parameters. Subsequently, a reference boundary was defined by applying a subsidence threshold of mm, which accounts for the projection from vertical to LOS deformation, where represents the satellite incidence angle for study area A (i.e., 38.74°). Notably, the objective of the proposed DMSB-DG method is to delineate the mining influence boundary of a single working face. This method suppresses the extension of the delineated boundary toward old goaf areas or potential overlapping zones of multiple working faces by utilizing the consistency and continuity characteristics of deformation gradient magnitude and direction. In addition, the boundary delineated using the PIM method is a reference boundary rather than the actual ground truth. The PIM parameters are determined based on the detailed geological and mining information of the selected working face, which gives the delineated boundary practical significance.
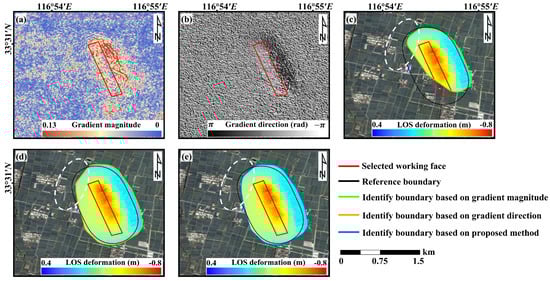
Figure 8.
Comparison between the delineated boundary and the reference boundary in study area A. (a,b) are the deformation gradient magnitude and direction calculated from the InSAR-derived deformation. (c,d) indicate the boundaries identified by gradient magnitude and direction in comparison with the reference boundary. (e) shows the comparison between the boundary delineated by the proposed algorithm and the reference boundary.
As shown in Figure 8c, single-gradient magnitude is inadequate for identifying mining-affected pixels, resulting in large unidentified areas. Therefore, gradient direction needs to be introduced as an additional constraint to characterize the mining-induced boundary, as shown in Figure 8d. Gradient direction identifies most of the mining-affected areas and excludes the secondary disturbance effects of old goafs. Moreover, the proposed DMSB-DG method integrates both gradient magnitude and direction, thereby maximizing the inclusion of mining-affected pixels. In particular, the mining-affected area delineated by the DMSB-DG method (see the white circle in Figure 8c–e) aligns most closely with the reference boundary, achieving the best delineation performance. To quantitatively assess performance in study area A, evaluation metrics were calculated, as summarized in Table 4. The boundary delineated by gradient magnitude shows the lowest FPR (0.16%) and FDR (4.48%), but most of the mining-affected pixels are not effectively identified. The proposed DMSB-DG method performs better than using only gradient magnitude or direction in most evaluation metrics, indicating that integrating both types of features can achieve higher boundary delineation accuracy. Specifically, both the ACC and the TPR exceed 96%, while the MR is only 3.65%, indicating that the majority of mining-affected pixels were correctly identified. The F1 score of 92.38% reflects the method’s ability to maintain a high PRE and TPR. In addition, the high Kappa coefficient of 91.96% further confirms the reliability of the proposed method in accurately delineating the mining-affected boundary. These results demonstrate that the proposed DMSB-DG method provides a stable and reliable tool for mining impact boundary identification.
Table 4.
Performance evaluation of delineation results in study area A (%).
4.4.2. Delineation Result in Study Area B
The magnitude and direction of the deformation gradient were calculated using the Roberts operator, as shown in Figure 9a,b. Subsequently, the mining-induced subsidence boundary in study area B was delineated using the proposed DMSB-DG method. For comparison, the reference boundary was generated using the PIM combined with the geological and goaf-related parameters. It should be noted that the incidence angle is 32.41° in study area B. The identify and reference boundaries are presented in Figure 9c–e. Both single-gradient magnitude and direction lead to insufficient identification of mining-induced pixels. In particular, in the white circle, the DMSB-DG method identifies more mining-affected pixels compared with using gradient magnitude or direction. The boundary delineated by the DMSB-DG method is highly consistent with the reference boundary in most regions, with the exception of small omissions in Subarea I. This demonstrates the strong boundary detection capability of the proposed method. The omissions are mainly attributed to the low deformation gradient and weak directional clustering in Subarea I, which limits the effectiveness of the ISODATA algorithm in recognizing it as the mining-affected area. Quantitative evaluation metrics were also calculated for the identification results in study area B, as shown in Table 5. When single-gradient magnitude is used, only a small portion in the reference boundary is delineated, resulting in an FPR and FDR of 0% and a PRE of 100%. The proposed method achieved strong overall performance, with the ACC and TPR reaching 98.66% and 90.05%, respectively. Although the MR only is 9.95%, slightly higher than in study area A (3.65%), it remains within a reasonable range. The F1 score of 87.99%, and the Kappa coefficient of 87.28%, further validate the effectiveness and robustness of the proposed algorithm. In summary, the results confirm the applicability and performance of the proposed DMSB-DG method for boundary delineation in study area B.
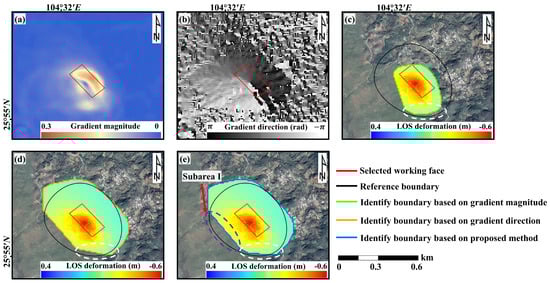
Figure 9.
Comparison between the delineated boundary and the reference boundary in study area B. (a,b) is the deformation gradient magnitude and direction calculated from the InSAR-derived deformation. (c,d) indicate the boundaries identified by the gradient magnitude and direction in comparison with the reference boundary. (e) shows the comparison between the boundary delineated by the proposed algorithm and the reference boundary.
Table 5.
Performance evaluation of delineation results in study area B (%).
5. Discussion
5.1. Comparison with Existing Methods
5.1.1. Comparison Results of Different Algorithms in Study Area A
To verify the effectiveness of the proposed DMSB-DG method, a comparative test was conducted with the fixed threshold method (FTM) [30,31] and the adaptive subsidence boundary delimitation method (ASBD) [32]. The boundary delineation results are shown in Figure 10. It should be noted that in the FTM, the threshold was defined based on the standard subsidence threshold of 10mm and the incidence angle , specifically set as mm. Due to the influence of the selected working face, the overlying strata above the adjacent old goaf experienced secondary disturbances. As a result, both the FTM and ASBD method significantly overestimated the extent of mining-affected areas in this region. Fortunately, the proposed DMSB-DG method effectively suppressed misidentification caused by secondary disturbances, thereby producing a more accurate and reasonable identification result for the mining-affected boundary.
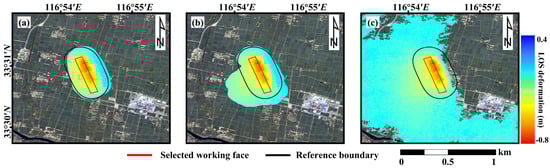
Figure 10.
Comparison results of different delineation algorithms in study area A. (a) shows the identification results based on the proposed method (DMSB-DG). (b) shows the identification results based on the ASBD method. (c) shows the identification results based on the FTM.
In addition, the evaluation metrics of the three methods are also calculated, as shown in Table 6.
Table 6.
Evaluation metrics of different delineation algorithms in study area A (%).
As shown in Table 6, the DMSB-DG method outperforms both the FTM and ASBD method across key evaluation metrics. Specifically, it achieves an ACC of 99.20%, a PRE of 88.73%, and an F1 score of 92.38%, demonstrating superior boundary delineation performance. In addition, the FDR and FPR of DMSB-DG are significantly lower than those of the comparison methods, highlighting its effectiveness in minimizing misclassifications and improving identification accuracy. Notably, the Kappa coefficient of the DMSB-DG method reaches 91.96%, representing improvements of 21.23% and 92.07% compared to the ASBD method (72.44%) and FTM (7.29%), respectively. This further confirms its high consistency with the reference boundary. In summary, the DMSB-DG method demonstrates strong capabilities in reducing both false positives and false negatives, achieving high identification precision for mining-induced deformation. These results indicate its strong potential for practical application in mining subsidence boundary delineation.
5.1.2. Comparison Results of Different Algorithms in Study Area B
To verify the performance of the proposed algorithm in different regions, the two aforementioned reference methods were also employed to delineate the mining-affected boundary in study area B, as shown in Figure 11. It can be observed from Figure 11 that both the FTM and the ASBD method, affected by InSAR observation errors and residual interference deformation, significantly overestimate the extent of the mining-affected area. Additionally, the ASBD method underestimates the affected area in the upper-right corner of the study area. In contrast, the boundary delineated by the proposed method exhibits a high consistency with the reference, demonstrating its robustness and effectiveness.
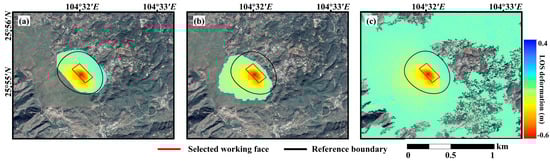
Figure 11.
Comparison results of different delineation algorithms in study area B. (a) shows the identification results based on the proposed method (DMSB-DG). (b) shows the identification results based on the ASBD method. (c) shows the identification results based on the FTM.
To more accurately evaluate the effectiveness of different algorithms, the performance metrics of the three methods were calculated for study area B, as shown in Table 7. It can be seen from Table 7 that the FTM achieved the lowest MR of 3.29% and the highest TPR of 96.72%. This is because it lacks the ability to adapt the local InSAR deformation characteristics; thus, it results in significant over-identification, leading to abnormally high FPR and FDR values. These deficiencies substantially reduce its overall ACC and PRE, indicating limited identification performance. In contrast, the ASBD method dynamically adjusts the identification threshold based on the noise level of the InSAR deformation measurements. This adaptability helps reduce the FDR to a certain extent and improves the ACC. However, its TPR and F1 score remain relatively low. Compared with these methods, the proposed DMSB-DG approach demonstrates superior performance across all evaluation metrics. Notably, it achieves the highest values in PRE, F1 score, and Kappa coefficient. Specifically, the DMSB-DG method achieved a Kappa coefficient of 87.28%, representing an improvement of 27.14% and 94.58% over the ASBD method (63.59%) and the FTM (4.73%), respectively. These results indicate that that the proposed method achieves a well-balanced trade-off between missed and false detections, making it well-suited for delineating mining-affected boundaries under complex geological and deformation conditions.
Table 7.
Evaluation metrics of different delineation algorithms in study area B (%).
5.2. Comparison of Subsidence Boundary Delineation Results Using Ascending and Descending Track Data
The applicability of the proposed method to both ascending and descending track images was verified through simulation experiments. Specifically, the PIM was used to estimate the three-dimensional surface deformation caused by underground mining operations. Subsequently, the simulated 3D deformation was projected onto the LOS direction of the ascending (39°, 350°) and descending (34°, 190°) tracks, respectively. And then, the observation noise consistent with that described in Section 3.1 was added to the projected LOS deformation of both ascending and descending tracks. The simulated LOS deformation results for the ascending and descending tracks are shown in Figure 12a and Figure 12b, respectively. Furthermore, assuming that the north–south horizontal displacement component is negligible, the vertical subsidence was calculated using ascending and descending line-of-sight (LOS) deformation measurements (Equation (14)) and used as combined deformation data [45].
where and represent the incidence angles of the ascending and descending satellite tracks. and denote the flight heading angles of the ascending and descending satellites. and are the InSAR LOS deformation observations from the ascending and descending tracks.
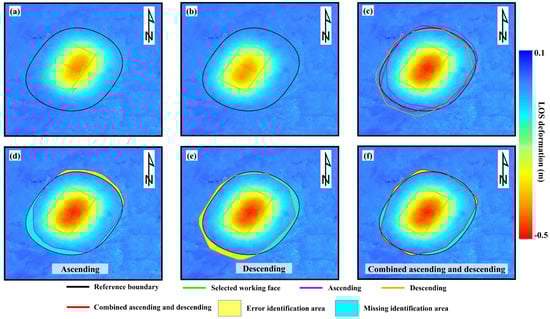
Figure 12.
Subsidence boundary delineation results using ascending and descending track data. (a,b) show the deformation results projected onto the LOS direction from the ascending and descending track, respectively. (c) shows the identification results from the ascending track, descending track, and the combined ascending and descending tracks. (d,e) present the comparisons between the identification results from the ascending and descending tracks and the reference boundary, respectively. (f) shows the comparison between the combined ascending and descending track identification results and the reference boundary.
To evaluate the influence of ascending and descending track data on the delineation of mining-induced subsidence boundaries, the proposed algorithm was applied separately to ascending track, descending track, and their combined deformation data. The resulting boundaries were then compared with the reference boundary, as shown in Figure 12c–f.
The following is shown in Figure 12: (1) The delineation boundaries derived using either ascending or descending track data individually exhibit strong agreement with the reference boundary. This indicates that acceptable accuracy in delineating mining-induced boundaries can be achieved using single-track InSAR observations. (2) Based on the spatial relationship between the delineated results and the reference boundary, the ascending track results tend to overestimate the boundary extent in the northeast direction and underestimate it in the southwest direction, as shown in Figure 12d. In contrast, the descending track results exhibit an underestimation in the northeast and an overestimation in the southwest, as shown in Figure 12e. This phenomenon is primarily attributed to the difference in the imaging geometry, which leads to inconsistent contributions of mining-induced three-dimensional deformation to the LOS measurements, particularly in terms of horizontal displacement, as shown in Equation (12). Specifically, horizontal movement in the southwest direction contributes positively to the LOS deformation in descending track observations and negatively in ascending track deformation, while northeastward displacement shows the opposite pattern [44]. (3) Compared to single-track results, the combined ascending and descending track deformation shows the highest agreement with the reference boundary in the southwest and northeast directions, as shown in Figure 12f. This result demonstrates that the integration of dual-track deformation enables more accurate delineation of mining-induced subsidence boundaries while also validating the effectiveness of the proposed method.
To more accurately assess the identification precision based on ascending and descending track data, the corresponding performance metrics were calculated, as shown in Table 8. The results indicate the following: (1) Both the single descending and ascending tracks achieved over 90% in TPR, ACC, PRE, F1 score, and Kappa coefficient, indicating that an accurate delineation of the mining-affected subsidence boundaries can be obtained using single-track data with the proposed method. (2) The FPR values (1.25% for descending and 0.69% for ascending) and FDR values (6.74% and 3.95%, respectively) for the single-track results are higher than those of the combined-track data, suggesting that single-view observations carry a higher risk of both omission and misidentification. (3) The combined results of the ascending and descending track results outperform the single-track results across all evaluation metrics, demonstrating superior overall performance in boundary delineation. By integrating the deformation from both viewing geometries, the combined data significantly improve the identification performance, particularly in key indicators such as ACC (98.74%), F1 score (95.89%), and Kappa coefficient (95.15%).
Table 8.
Evaluation metrics of different observational data (%).
5.3. Impact of InSAR Observation Noise
Based on both simulation and real experiments, it can be observed that InSAR observation errors affect the accuracy of mining-impacted boundary delineation. To analyze the impact of observation noise, we simulated 20 groups of normally distributed errors with a mean of 0mm, and standard deviation distributions ranged from 0 m to 0.2 m at 10 mm intervals. These errors were then added to the simulated deformation obtained in Section 5.2. The boundary delineation evaluation results are presented in Figure 13.
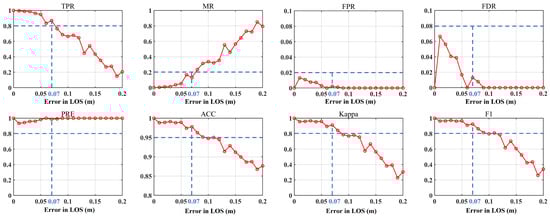
Figure 13.
Influence of InSAR measurement errors on the delineation of mining-impacted boundaries. The blue line represents the critical threshold for accurate boundary identification.
As shown in Figure 13, with the increase in noise, the TPR, ACC, Kappa coefficient, and F1 score of the subsidence boundary delineation results gradually decrease, while the MR increases. This is because increasing noise reduces the distinguishability between the subsidence basin and the background area in terms of deformation gradients, thereby decreasing the correctly identified regions. When the noise level is below 0.07 m, all performance metrics can reach or exceed the 80% threshold, indicating reliable identification performance [46]. However, when the measurement error exceeds 0.07 m, these metrics drop sharply, particularly in TPR, F1 score, and Kappa coefficient. Therefore, in practical applications, it is essential to minimize InSAR measurement errors to ensure accurate delineation of the mining-induced subsidence boundary.
6. Conclusions
In this study, a method to delineate mining-induced subsidence boundaries by integrating both the magnitude and direction of deformation gradients, i.e., DMSB-DG, has been proposed. By incorporating the ISODATA clustering algorithm, the method applies dual constraints based on the amplitude and direction of the deformation gradient to delineate subsidence boundaries, effectively enhancing boundary delineation accuracy. The effectiveness of the proposed method has been verified through simulation and field experiments and comparisons tests. Based on the results, the following conclusions can be drawn:
- By integrating both the magnitude and direction of the deformation gradient, the proposed DMSB-DG method effectively suppresses InSAR noise and secondary disturbances from old goafs, enabling accurate and morphologically refined delineation of mining-impacted boundaries. The boundary delineation results based on the DMSB-DG method outperform those obtained using single-gradient magnitude or direction.
- In both simulation and real experiments, the proposed DMSB-DG method achieved over 85% in key evaluation metrics, including TPR, ACC, PRE, F1, and Kappa. Meanwhile, the MR, FPR, and FDR remained below 15%, with the FPR consistently below 1%. These results demonstrate that the proposed method exhibits strong adaptability and robustness across different scenarios, providing reliable support for the high-precision delineation of mining subsidence boundaries. Notably, compared to the ASBD method and FTM, the DMSB-DG method showed significant improvements in boundary identification accuracy. Specifically, the Kappa coefficient increased by 21.23% and 92.07% in area A, and by 27.14% and 94.58% in area B, respectively.
- Through simulation experiments, the proposed DMSB-DG method demonstrated the ability to delineate mining-induced subsidence boundaries with high precision using single-track data (either ascending or descending). It should be noted that integrating both ascending and descending LOS measurements can further improve delineation accuracy. Furthermore, when the deformation observation errors are relatively small (with a noise standard deviation below 0.07 m), the proposed method maintains high accuracy in identifying mining-induced subsidence boundaries, indicating strong robustness. However, as observation errors increase, the accuracy of the delineation decreases significantly. Therefore, it is important to obtain high-precision deformation measurements to accurately delineate mining-induced subsidence boundaries.
Author Contributions
Conceptualization, Z.S., Y.W., T.W., F.Z. and S.D.; methodology, Z.S. and T.W.; software, Z.S., T.W. and J.L.; validation, Z.S., Y.W., T.W., F.Z. and S.D.; formal analysis, Z.S. and T.W.; investigation, L.L., X.X. and G.Z.; writing—original draft preparation, Z.S. and T.W.; writing—review and editing, Z.S., Y.W., T.W., F.Z., S.D. and J.L.; visualization, Z.S. and T.W.; supervision, Z.S., Y.W., T.W., F.Z. and S.D.; project administration, F.Z., W.H. and Y.W. All authors have read and agreed to the published version of the manuscript.
Funding
This work has been supported in part by the National Key R & D Program of China (Grant No. 2022YFE0102600), in part by the National Natural Science Foundation of China (Grant No. 52474184, No. 42474018),in part by the Fundamental Research Funds for the Central Universities (Grant No. 2025ZDPYQB1007), in part by the Young Elite Scientists Sponsorship Program by CAST (Grant No. 2023QNRC001-YESS20230599), in part by the China Postdoctoral Science Foundation (Grant No. 2023T160685, No. 2020M671646) and in part by the the China Scholarship Council (Grant No. 202406420081).
Data Availability Statement
The original contributions presented in the study are included in the article; further inquiries can be directed to the corresponding author.
Acknowledgments
The authors would like to thank the anonymous reviewers for their constructive suggestions that improve the manuscript greatly. The authors would also like to thank the Japan Aerospace Exploration Agency for providing the ALOS images over the study areas.
Conflicts of Interest
Authors Liyong Li and Xianlong Xu was employed by the company Minmetals Mining Holdings Limited. The remaining authors declare that the research was conducted in the absence of any commercial or financial relationships that could be construed as a potential conflict of interest.
References
- International Energy Agency. Coal 2024: Analysis and Forecast to 2027; International Energy Agency: Paris, France, 2024. [Google Scholar]
- Wang, X.; Liu, C.; Chen, S.; Chen, L.; Li, K.; Liu, N. Impact of coal sector’s de-capacity policy on coal price. Appl. Energy 2020, 265, 114802. [Google Scholar] [CrossRef]
- Chen, P. Study on integrated classification system for Chinese coal. Fuel Process. Technol. 2000, 62, 77–87. [Google Scholar] [CrossRef]
- Bian, Z.; Inyang, H.I.; Daniels, J.L.; Frank, O.; Struthers, S. Environmental issues from coal mining and their solutions. Min. Sci. Technol. China 2010, 20, 215–223. [Google Scholar] [CrossRef]
- Basommi, P.L.; Guan, Q.; Cheng, D. Exploring Land use and Land cover change in the mining areas of Wa East District, Ghana using Satellite Imagery. Open Geosci. 2015, 7, 20150058. [Google Scholar] [CrossRef]
- Malinowska, A.; Hejmanowski, R. Building damage risk assessment on mining terrains in Poland with GIS application. Int. J. Rock Mech. Min. Sci. 2010, 47, 238–245. [Google Scholar] [CrossRef]
- Yang, K.; Hu, Z.; Liang, Y.; Fu, Y.; Yuan, D.; Guo, J.; Li, G.; Li, Y. Automated extraction of ground fissures due to coal mining subsidence based on UAV photogrammetry. Remote Sens. 2022, 14, 1071. [Google Scholar] [CrossRef]
- Lai, Q.; Zhao, J.; Shi, B.; Liu, H.; Ji, L.; Li, Q.; Huang, R. Deformation evolution of landslides induced by coal mining in mountainous areas: Case study of the Madaling landslide, Guizhou, China. Landslides 2023, 20, 2003–2016. [Google Scholar] [CrossRef]
- Wang, J.; Yan, L.; Yang, K.; Tang, W.; Xie, H.; Yao, S.; Xu, Z.; Yang, J. Deriving mining-induced 3-D deformations at any moment and assessing building damage by integrating single InSAR interferogram and gompertz probability integral model (SII-GPIM). IEEE Trans. Geosci. Remote Sens. 2022, 60, 4709817. [Google Scholar] [CrossRef]
- Li, J. Study on Deformation Disaster Monitoring in Huainan Mining Area Based on InSAR and Sentinel-1A. Ph.D. Thesis, Hefei University of Technology, Hefei, China, 2021. [Google Scholar]
- Zhang, K.; Wang, Y.; Sen, D.; Zhao, F.; Wang, T.; Zhang, N.; Zhou, D.; Diao, X. A goaf-locating method based on the D-InSAR technique and stratified Okada dislocation model. Remote Sens. 2024, 16, 2741. [Google Scholar] [CrossRef]
- Wang, T.; Zhao, F.; Wang, Y.; Zhang, N.; Zhou, D.; Diao, X.; Zhao, X. An Algorithm for Locating Subcritical Underground Goaf Based on InSAR Technique and Improved Probability Integral Model. IEEE Trans. Geosci. Remote Sens. 2023, 61, 5214914. [Google Scholar] [CrossRef]
- Du, S.; Wang, Y.; Zheng, M.; Zhou, D.; Xia, Y. Goaf locating based on InSAR and probability integration method. Remote Sens. 2019, 11, 812. [Google Scholar] [CrossRef]
- Yang, Z.; Li, Z.; Zhu, J.; Yi, H.; Feng, G.; Hu, J.; Wu, L.; Preusse, A.; Wang, Y.; Papst, M. Locating and defining underground goaf caused by coal mining from space-borne SAR interferometry. ISPRS J. Photogramm. Remote Sens. 2018, 135, 112–126. [Google Scholar] [CrossRef]
- Deng, W.; Zhang, H.; Xu, N. Multi-method comparison evaluation mode of mining damage influence range and its application. J. Min. Strat. Control Eng. 2013, 18, 105–107. [Google Scholar]
- Bo, H.; Li, Y.; Tan, X.; Dong, Z.; Zheng, G.; Wang, Q.; Yu, K. Estimation of ground subsidence deformation induced by underground coal mining with GNSS-IR. Remote Sens. 2022, 15, 96. [Google Scholar] [CrossRef]
- Yang, Q.; Tang, F.; Yuan, T.; Wang, W.; Li, P.; Xue, J.; Zhu, C. High-precision Three-dimensional Deformation Information Extraction of Mine Surfaces using UAV LiDAR Technology. IEEE Trans. Geosci. Remote Sens. 2025, 63, 4403316. [Google Scholar]
- Bo, H.; Lu, G.; Li, H.; Guo, G.; Li, Y. Development of a dynamic prediction model for underground coal-mining-induced ground subsidence based on the hook function. Remote Sens. 2024, 16, 377. [Google Scholar] [CrossRef]
- Chi, S.; Wang, L.; Yu, X.; Fang, X.; Jiang, C. Research on prediction model of mining subsidence in thick unconsolidated layer mining area. IEEE Access 2021, 9, 23996–24010. [Google Scholar] [CrossRef]
- Cui, X.; Wang, J.; Liu, Y. Prediction of progressive surface subsidence above longwall coal mining using a time function. Int. J. Rock Mech. Min. Sci. 2001, 38, 1057–1063. [Google Scholar] [CrossRef]
- Djamaluddin, I.; Mitani, Y.; Ikemi, H. GIS-based computational method for simulating the components of 3D dynamic ground subsidence during the process of undermining. Int. J. Geomech. 2012, 12, 43–53. [Google Scholar] [CrossRef]
- Li, Z.; Yang, Z.; Zhu, J.; Hu, J.; Wang, Y.; Li, P.; Chen, G. Retrieving three-dimensional displacement fields of mining areas from a single InSAR pair. J. Geod. 2015, 89, 17–32. [Google Scholar] [CrossRef]
- Zhu, J.; Li, Z.; Hu, J. Research progress and methods of InSAR for deformation monitoring. Acta Geod. Cartogr. Sin. 2017, 46, 1717. [Google Scholar]
- Crosetto, M.; Monserrat, O.; Cuevas-González, M.; Devanthéry, N.; Crippa, B. Persistent scatterer interferometry: A review. ISPRS J. Photogramm. Remote Sens. 2016, 115, 78–89. [Google Scholar] [CrossRef]
- Liu, X.; Wang, Y.; Yan, S.; Shao, Y.; Zhou, H.; Li, Y. Ground subsidence characteristics associated with urbanization in East China analyzed with a Sentinel-1A-based InSAR time series approach. Bull. Eng. Geol. Environ. 2019, 78, 4003–4015. [Google Scholar] [CrossRef]
- Zhang, N.; Wang, Y.; Zhao, F.; Wang, T.; Zhang, K.; Fan, H.; Zhou, D.; Zhang, L.; Yan, S.; Diao, X.; et al. Monitoring and analysis of the collapse at Xinjing Open-Pit Mine, Inner Mongolia, China, using multi-source remote sensing. Remote Sens. 2024, 16, 993. [Google Scholar] [CrossRef]
- Pawluszek-Filipiak, K.; Borkowski, A. Integration of DInSAR and SBAS Techniques to determine mining-related deformations using sentinel-1 data: The case study of Rydułtowy mine in Poland. Remote Sens. 2020, 12, 242. [Google Scholar] [CrossRef]
- Chen, B.; Li, Z.; Yu, C.; Fairbairn, D.; Kang, J.; Hu, J.; Liang, L. Three-dimensional time-varying large surface displacements in coal exploiting areas revealed through integration of SAR pixel offset measurements and mining subsidence model. Remote Sens. Environ. 2020, 240, 111663. [Google Scholar] [CrossRef]
- Zhu, J.; Yang, Z.; Li, Z. Recent progress in retrieving and predicting mining-induced 3D displace-ments using InSAR. Acta Geod. Cartogr. Sin. 2019, 48, 135. [Google Scholar] [CrossRef]
- Yuan, M.; Li, M.; Liu, H.; Lv, P.; Li, B.; Zheng, W. Subsidence monitoring base on SBAS-InSAR and slope stability analysis method for damage analysis in mountainous mining subsidence regions. Remote Sens. 2021, 13, 3107. [Google Scholar] [CrossRef]
- Guo, Q.; Meng, X.; Li, Y.; Lv, X.; Liu, C. A prediction model for the surface residual subsidence in an abandoned goaf for sustainable development of resource-exhausted cities. J. Clean. Prod. 2021, 279, 123803. [Google Scholar] [CrossRef]
- Yang, Z.; Ma, Z.; Qiao, S. Delimitation Method of Mining Subsidence Boundary Based on InSAR Technique. Met. Mine 2023, 52, 119–125. [Google Scholar]
- Xu, J.; Yan, C.; Boota, M.W.; Chen, X.; Li, Z.; Liu, W.; Yan, X. Research on automatic identification of coal mining subsidence area based on InSAR and time series classification. J. Clean. Prod. 2024, 470, 143293. [Google Scholar] [CrossRef]
- Wang, Z.; Li, L.; Wang, J.; Liu, J. A method of detecting the subsidence basin from InSAR interferogram in mining area based on HOG features. J. China Univ. Min. Technol. 2021, 50, 404–410. [Google Scholar]
- Li, N.; Wang, L.; Chi, S.; Wei, T.; Lv, T. Monitoring Method of Surface Subsidence in Mining Area Based on D-InSAR. Met. Mine 2017, 46, 23–27. [Google Scholar]
- Liu, Z.; Bian, Z.; Lv, F.; Dong, B. Subsidence monitoring caused by repeated excavation with time-series DInSAR. J. Min. Saf. Eng. 2013, 30, 390–395. [Google Scholar]
- Zhang, D.; Zhang, L.; Dong, J.; Wang, Y.; Yang, C.; Liao, M. Improved phase gradient stacking for landslide detection. Landslides 2024, 21, 1829–1847. [Google Scholar] [CrossRef]
- Sun, Q.; Li, C.; Xiong, T.; Gui, R.; Han, B.; Tan, Y.; Guo, A.; Li, J.; Hu, J. Automatic Landslide Detection in Gansu, China, Based on InSAR Phase Gradient Stacking and AttU-Net. Remote Sens. 2024, 16, 3711. [Google Scholar] [CrossRef]
- Hu, Z.; Ge, L.; Li, X.; Zhang, K.; Zhang, L. An underground-mining detection system based on DInSAR. IEEE Trans. Geosci. Remote Sens. 2012, 51, 615–625. [Google Scholar] [CrossRef]
- Chen, C.W.; Zebker, H.A. Phase unwrapping for large SAR interferograms: Statistical segmentation and generalized network models. IEEE Trans. Geosci. Remote Sens. 2002, 40, 1709–1719. [Google Scholar] [CrossRef]
- Goldstein, R.M.; Zebker, H.A.; Werner, C.L. Satellite radar interferometry: Two-dimensional phase unwrapping. Radio Sci. 1988, 23, 713–720. [Google Scholar] [CrossRef]
- Wang, Q.; Li, Q.; Liu, H.; Wang, Y.; Zhu, J. An improved ISODATA algorithm for hyperspectral image classification. In Proceedings of the 2014 7th International Congress on Image and Signal Processing, Dalian, China, 14–16 October 2014; IEEE: Piscataway, NJ, USA, 2014; pp. 660–664. [Google Scholar]
- Xu, B.; Li, Z.W.; Wang, Q.J.; Jiang, M.; Zhu, J.J.; Ding, X.L. A refined strategy for removing composite errors of SAR interferogram. IEEE Geosci. Remote Sens. Lett. 2013, 11, 143–147. [Google Scholar] [CrossRef]
- Ma, Z.; Yang, Z.; Xing, X. Analyzing the Error Pattern of InSAR-Based Mining Subsidence Estimation Caused by Neglecting Horizontal Movements. Remote Sens. 2022, 14, 1963. [Google Scholar] [CrossRef]
- Ilieva, M.; Polanin, P.; Borkowski, A.; Gruchlik, P.; Smolak, K.; Kowalski, A.; Rohm, W. Mining Deformation Life Cycle in the Light of InSAR and Deformation Models. Remote Sens. 2019, 11, 745. [Google Scholar] [CrossRef]
- Chefira, R.; Rakrak, S. Accuracy assessment of applied supervised machine learning models on usual data probability distributions. J. Phys. Conf. Ser. 2021, 1743, 012011. [Google Scholar] [CrossRef]
Disclaimer/Publisher’s Note: The statements, opinions and data contained in all publications are solely those of the individual author(s) and contributor(s) and not of MDPI and/or the editor(s). MDPI and/or the editor(s) disclaim responsibility for any injury to people or property resulting from any ideas, methods, instructions or products referred to in the content. |
© 2025 by the authors. Licensee MDPI, Basel, Switzerland. This article is an open access article distributed under the terms and conditions of the Creative Commons Attribution (CC BY) license (https://creativecommons.org/licenses/by/4.0/).