Systematic Review

Monitoring Biodiversity and Ecosystem Services Using L-Band Synthetic Aperture Radar Satellite Data

1
Institute for Global Environmental Strategies, 2108-11 Kamiyamaguchi, Hayama 240-0115, Kanagawa, Japan
2
Earth Observation Research Center, Japan Aerospace Exploration Agency (JAXA), 2-1-1 Sengen, Tsukuba 305-8505, Ibaraki, Japan
*
Author to whom correspondence should be addressed.
Remote Sens. 2025, 17(20), 3489; https://doi.org/10.3390/rs17203489
Submission received: 25 August 2025 / Revised: 7 October 2025 / Accepted: 17 October 2025 / Published: 20 October 2025
(This article belongs to the Special Issue Global Biospheric Monitoring with Remote Sensing (2nd Edition))

Abstract

Highlights

What are the main findings?
  • PALSAR-1/-2 annual mosaic images are the most frequently used L-band SAR data for biodiversity and ecosystem services monitoring.
  • Most studies (86%) are subnational in scale, while national/global data are also needed to support global biodiversity agreements.
  • L-band SAR data has been frequently used with optical data (54% of studies) and/or C-band SAR data (20% of studies), and more recently with satellite lidar data.
What is the implication of the main finding?
  • New free L-band SAR datasets (e.g., PALSAR-2 ScanSAR and NISAR data) with high temporal resolution may open new possibilities for biodiversity/ecosystem services monitoring.

Abstract

Over the last decade, L-band synthetic aperture radar (SAR) satellite data has become more widely available globally, providing new opportunities for biodiversity and ecosystem services (BES) monitoring. To better understand these opportunities, we conducted a systematic scoping review of articles that utilized L-band synthetic aperture radar (SAR) satellite data for BES monitoring. We found that the data have mainly been analyzed using image classification and regression methods, with classification methods attempting to understand how the extent, spatial distribution, and/or changes in different types of land use/land cover affect BES, and regression methods attempting to generate spatially explicit maps of important BES-related indicators like species richness or vegetation above-ground biomass. Random forest classification and regression algorithms, in particular, were used frequently and found to be promising in many recent studies. Deep learning algorithms, while also promising, have seen relatively little usage thus far. PALSAR-1/-2 annual mosaic data was by far the most frequently used dataset. Although free, this data is limited by its low temporal resolution. To help overcome this and other limitations of the existing L-band SAR datasets, 64% of studies combined them with other types of remote sensing data (most commonly, optical multispectral data). Study sites were mainly subnational in scale and located in countries with high species richness. Future research opportunities include investigating the benefits of new free, high temporal resolution L-band SAR datasets (e.g., PALSAR-2 ScanSAR data) and the potential of combining L-band SAR with new sources of SAR data (e.g., P-band SAR data from the “Biomass” satellite) and further exploring the potential of deep learning techniques.

1. Introduction

Spatiotemporal monitoring of biodiversity and ecosystem services (BES) is essential for the implementation of several global environmental agreements, including the Kunming-Montreal Global Biodiversity Framework (GBF) [1], the UN Sustainable Development Goals (SDGs) [2], and the Paris Agreement [3]. These agreements all contain specific targets related to BES, with associated indicators for tracking progress towards achieving the targets. Satellite remote sensing data is an important data source for calculating many of the indicators (see Table A1 for examples). The Kunming-Montreal GBF is the main global agreement related to BES, and notably, more than one-third of its adopted indicators (41% of the headline indicators and 34% of component indicators) can be calculated using spatial data [4]. Typically, satellite images are analyzed using (semi-)automated image analysis techniques to generate the spatial datasets related to these indicators, e.g., maps of forest extent (or change), species richness, or ecosystem services like carbon storage in vegetation above-ground biomass (AGB). Aside from these international initiatives, spatial data related to BES is also needed to support a wide range of local and national environmental initiatives, e.g., for invasive species management [5], conservation of habitat for keystone or rare species [6,7], and agricultural land management [8].
Optical satellite data, i.e., imagery collected at visible to mid-infrared electromagnetic wavelengths, is the principal type of remote sensing data used to generate spatial datasets related to BES. This is at least in part because relatively high spatial resolution (~10–30 m) optical satellite images, e.g., from Landsat and Sentinel-2, have been freely available for many years [9]. Optical images acquired by airborne sensors (e.g., mounted on airplanes or uncrewed aerial vehicles) can also be used for this, but due to higher costs, airborne data is typically less frequently updated, and recent images may not be available in many locations. Other types of satellite remote sensing data, including synthetic aperture radar (SAR) and lidar (Light Detection and Ranging) data, also have potential for calculating indicators related to BES, especially when used in combination with optical remote sensing data [10].
Figure 1 illustrates how optical, SAR (X-band, C-band, L-band, and P-band wavelengths), and lidar remote sensing data is reflected by forest canopies, as an example of how these data can be used to retrieve information related to BES. Having the shortest wavelengths, optical data can retrieve information about the top of the vegetation canopy, including vegetation greenness and health, but its ability to penetrate the canopy top and obtain structural information like canopy height and above-ground biomass (AGB) is limited. Of the different types of SAR data, X-band SAR has the shortest wavelength, and is often used to retrieve information about the top of the vegetation canopy (e.g., vegetation height [11]). C-band, L-band, and P-band SAR data have increasingly longer wavelengths, allowing for the retrieval of information from deeper within the canopy (e.g., stem volume [12]). Lidar remote sensing data can extract height information from various parts of the vegetation canopy, making it extremely useful for monitoring canopy height and AGB [13]. However, compared with optical and SAR data, lidar data is typically limited in terms of its geographic and temporal coverage [14]. Each of these types of remote sensing data have particular advantages and disadvantages for monitoring different types of ecosystems/ecosystem services, so it is often useful to utilize multiple types of data in practice.
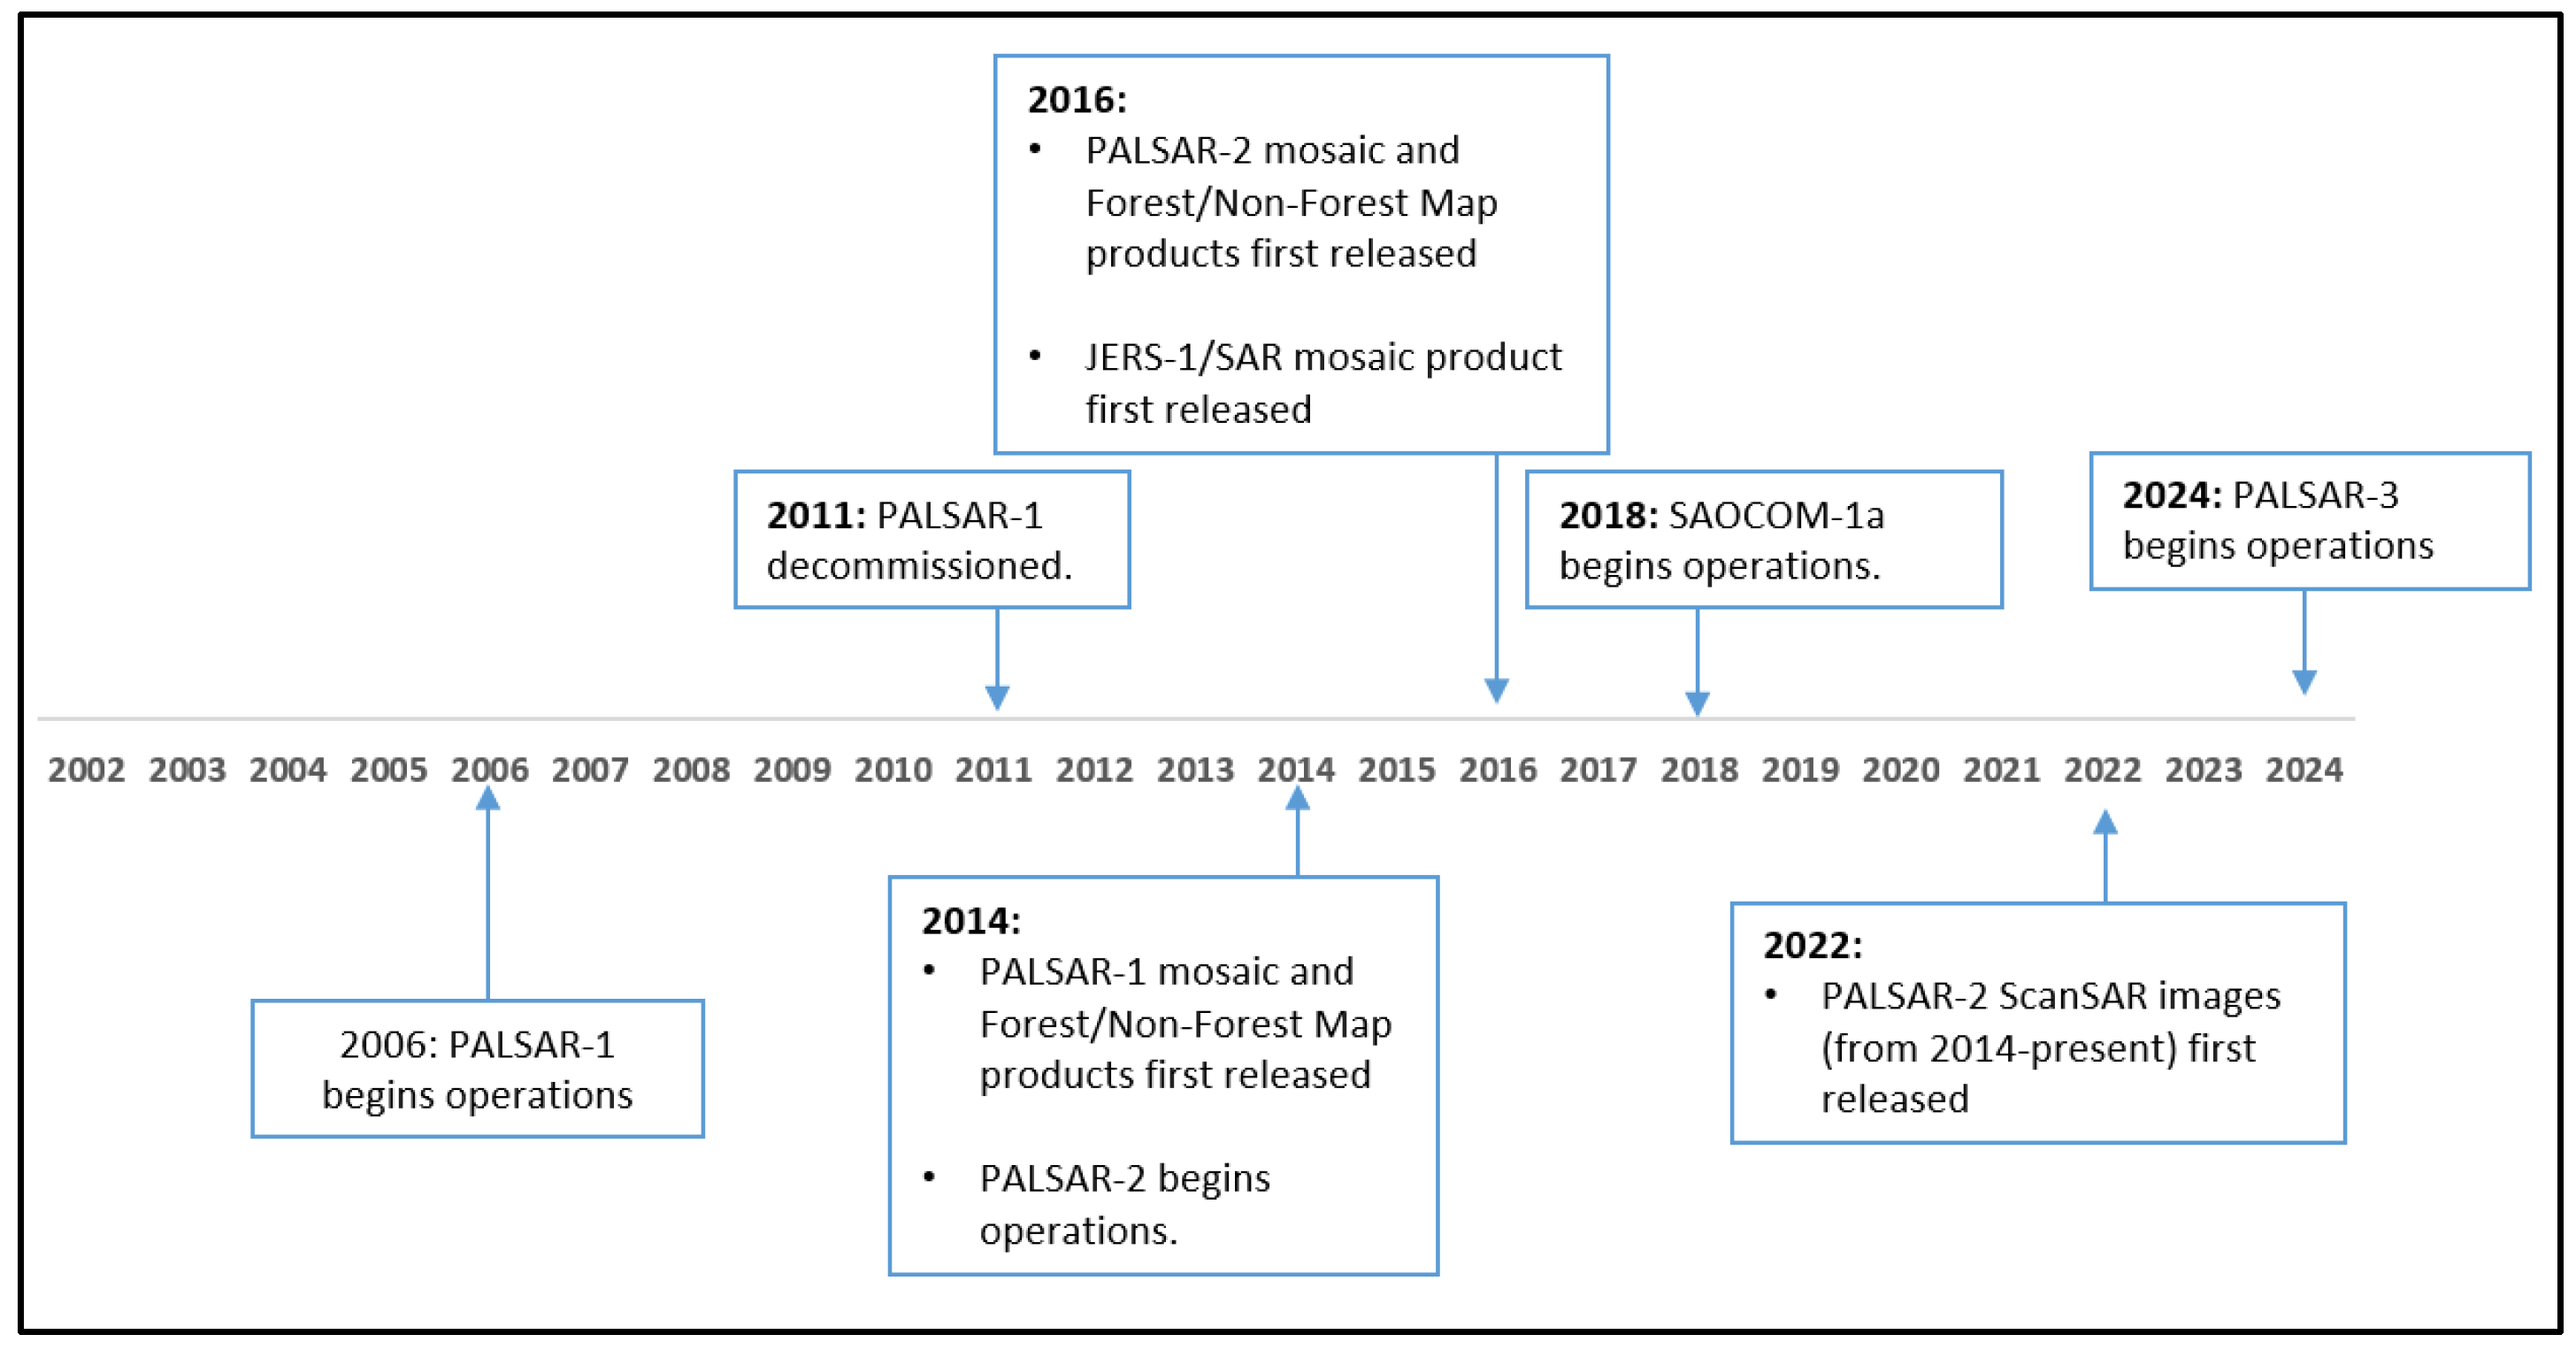
In this study, we focus on the use of L-band SAR satellite data for BES monitoring. L-band SAR has been shown to be a promising source of data for calculating BES indicators, e.g., the extent of different types of tree covered ecosystems like inland forests and mangrove forests (an indicator for the GBF Target 1 and for SDG 15 (Table A1)), as well as the AGB of these ecosystems (an indicator for the GBF Target 11 and for the Paris Agreement (Table A1)) [15,16,17]. L-band SAR sensors have several advantages in comparison with optical sensors due to their longer wavelengths, e.g., they can observe ecosystems in any weather conditions due to their ability to penetrate cloud cover, and can accurately monitor vegetation structure and above-ground biomass due to the scattering of L-band radar signal by tree twigs and branches [18]. As shown in the timeline in Figure 2, the amount (and types of) L-band SAR satellite data freely available to the public has significantly increased considerably since 2014, which will lead to increased usage of this data.
L-band SAR data comes in various polarizations, including HH (signal horizontally transmitted and horizontally retrieved), HV (signal horizontally transmitted and vertically retrieved), VH (signal vertically transmitted and horizontally retrieved), and VV (signal vertically transmitted and vertically retrieved). Past studies have monitored BES using SAR images generated at these different SAR polarizations, e.g., images of normalized radar backscatter per unit area (i.e., gamma naught; γ0) [18,19]. Some studies have also extracted additional L-band SAR features for classification, including SAR vegetation indices [20], image texture metrics [21], and polarimetric decomposition features [22].
While many primary studies have used L-band SAR satellite data for monitoring BES at scales ranging from subnational to global, we are unaware of any comprehensive reviews of the existing research on this topic. Our objective in this study was thus to conduct a scoping review to better understand how L-band SAR data has been used for monitoring BES in past research. A scoping review is a particular type of literature review that primarily aims to assess the size and scope of the available literature on a topic [23]. Scoping reviews involve systematically searching a literature database to retrieve potentially relevant papers, screening the retrieved papers using a set of exclusion criteria to identify the relevant papers, and finally analyzing these relevant papers qualitatively and/or quantitatively to draw some conclusions about the scope of the existing literature [24]. Scoping reviews also often aim to identify viable topics for more focused (i.e., less broad in scope) systematic reviews to be conducted in future works [24]. The research of interest in our study was, specifically, primary studies that (i) self-identified as being related to BES and (ii) utilized L-band SAR satellite data or maps derived from L-band SAR satellite data for their analysis.

2. Materials and Methods

Our methodology involved a systematic review of peer-reviewed studies following the Preferred Reporting Items for Systematic reviews and Meta-Analyses (PRISMA) guidelines [25]. First, we conducted a search of the Scopus database (https://www.scopus.com/home.uri, accessed on 17 January 2025) to retrieve potentially relevant papers for further analysis. We used the following title/keyword/abstract search query: (“biodiversity” OR “biological diversity” OR “ecosystem service*”) AND (“L-band” OR “PALSAR-*” OR “SAOCOM*”). The three terms in the first part of the query were used to identify papers related to biodiversity or ecosystem services, while the three terms in the second part of the query were used to identify papers which utilized L-band SAR data (PALSAR and SAOCOM were the two sources of L-band SAR satellite data available internationally at the time of the search). We limited our search to journal articles to ensure that only fully peer-reviewed papers were included. The Scopus search was conducted most recently on 17 January 2025, and all articles published until the end of 2024 were retrieved.
Some additional terms in the literature are often used similarly to or interchangeably with “ecosystem services”, including “nature’s contributions to people” [26] and “natural capital” [27]. Because of this, we also tried adding these terms to the first part of the Scopus query, but their inclusion did not result in the retrieval of any additional papers. Search terms related to specific plant/animal species, biodiversity indicators, ecosystem types, or ecosystem services were not included in the Scopus query to avoid unintentionally introducing bias towards a particular topic/application/geographic area in our analysis. However, our reliance on English search terms means that our results have an English language bias. A limitation of using this relatively narrow set of search terms in our review is that we likely missed many studies that used L-band SAR for BES-related applications. Thus, the papers analyzed in our literature review should be understood as representing a sample of the total number of primary studies on this topic, i.e., those that self-identified as relating to biodiversity and/or ecosystem services.
After downloading the full texts of the articles identified using Scopus, we screened all of them to determine which ones were relevant for further analysis. Articles deemed irrelevant were those that (i) did not relate to BES, (ii) did not use L-band SAR satellite data or existing maps derived from L-band SAR satellite data for their analysis, or (iii) did not contain new primary research (e.g., literature reviews or editorials). After excluding the irrelevant articles, we extracted several different types of information from the remaining studies, including the following:
  • The approaches used to analyze BES information from L-band SAR satellite data;
  • The types of BES information analyzed;
  • The types of L-band SAR satellite data used;
  • The types of other remote sensing data used in addition to L-band SAR data;
  • The geographic scales of analysis and locations of study sites.
Finally, we analyzed the extracted information quantitatively and qualitatively to understand the methodological, thematic, and geographic scopes of the existing research. Our results are intended to, in a broad sense, help researchers and policymakers understand how L-band SAR data is contributing to BES monitoring. Our results also highlight commonly used analysis techniques and datasets for BES monitoring and identify potential future research areas.

3. Results and Discussion

3.1. Number of Papers Published per Year

Our Scopus search query returned a total of 124 journal papers, of which 107 were deemed relevant for further analysis (Figure 3). Of the papers deemed irrelevant for further analysis, most (n = 14) were excluded because they did not use L-band SAR satellite data or existing maps derived from L-band SAR satellite data; some used airborne L-band SAR data rather than satellite data, while others used C-band or X-band SAR data, and one was an erratum. Aside from these, one paper was excluded because it was purely a literature review (on the use of SAR data for wetland monitoring [28]), one because it was a duplicate of another paper already included in our analysis, and one because we were unable to acquire the full-text of the paper (which was written in Chinese).
All but one of the relevant papers was published after 2006, the year that PALSAR-1 started operating. The number of papers published per year fluctuated considerably from year to year between 2006 and 2024, but there was a generally increasing trend (Figure 4). There are a couple of likely factors for this. The first is the increasing volume of freely available L-band SAR data, including PALSAR-1/-2 annual mosaic images, JERS-1 mosaic images, and most recently, PALSAR-2 ScanSAR images (see Figure 2 for a summary of when these different datasets were released). The second is the growing interest of national governments and other stakeholders in BES monitoring due to the important role of BES in the Kunming-Montreal GBF and other international environmental agreements. For example, the number of papers sharply increased in 2023 and 2024, shortly following the adoption of the Kunming-Montreal GBF in December 2022.
Based on the current trend, it is likely that usage of L-band SAR data for BES monitoring will continue increasing in the future. The volume of freely available satellite data will continue to increase with regular updates to the PALSAR-2 annual mosaic and PALSAR-2 ScanSAR datasets, as well as the release of several new datasets, including data from the new PALSAR-3 satellite (launched in July 2024) and NASA-ISRO Synthetic Aperture Radar (NISAR) satellite (launched in July 2025). The inclusion of several indicators related to BES monitoring in the Kunming-Montreal Framework (Table A1) also suggests policy interest on the topic will remain high until at least 2030, the target year for many of the indicators.

3.2. Approaches Used to Analyze Biodiversity and Ecosystem Service Information

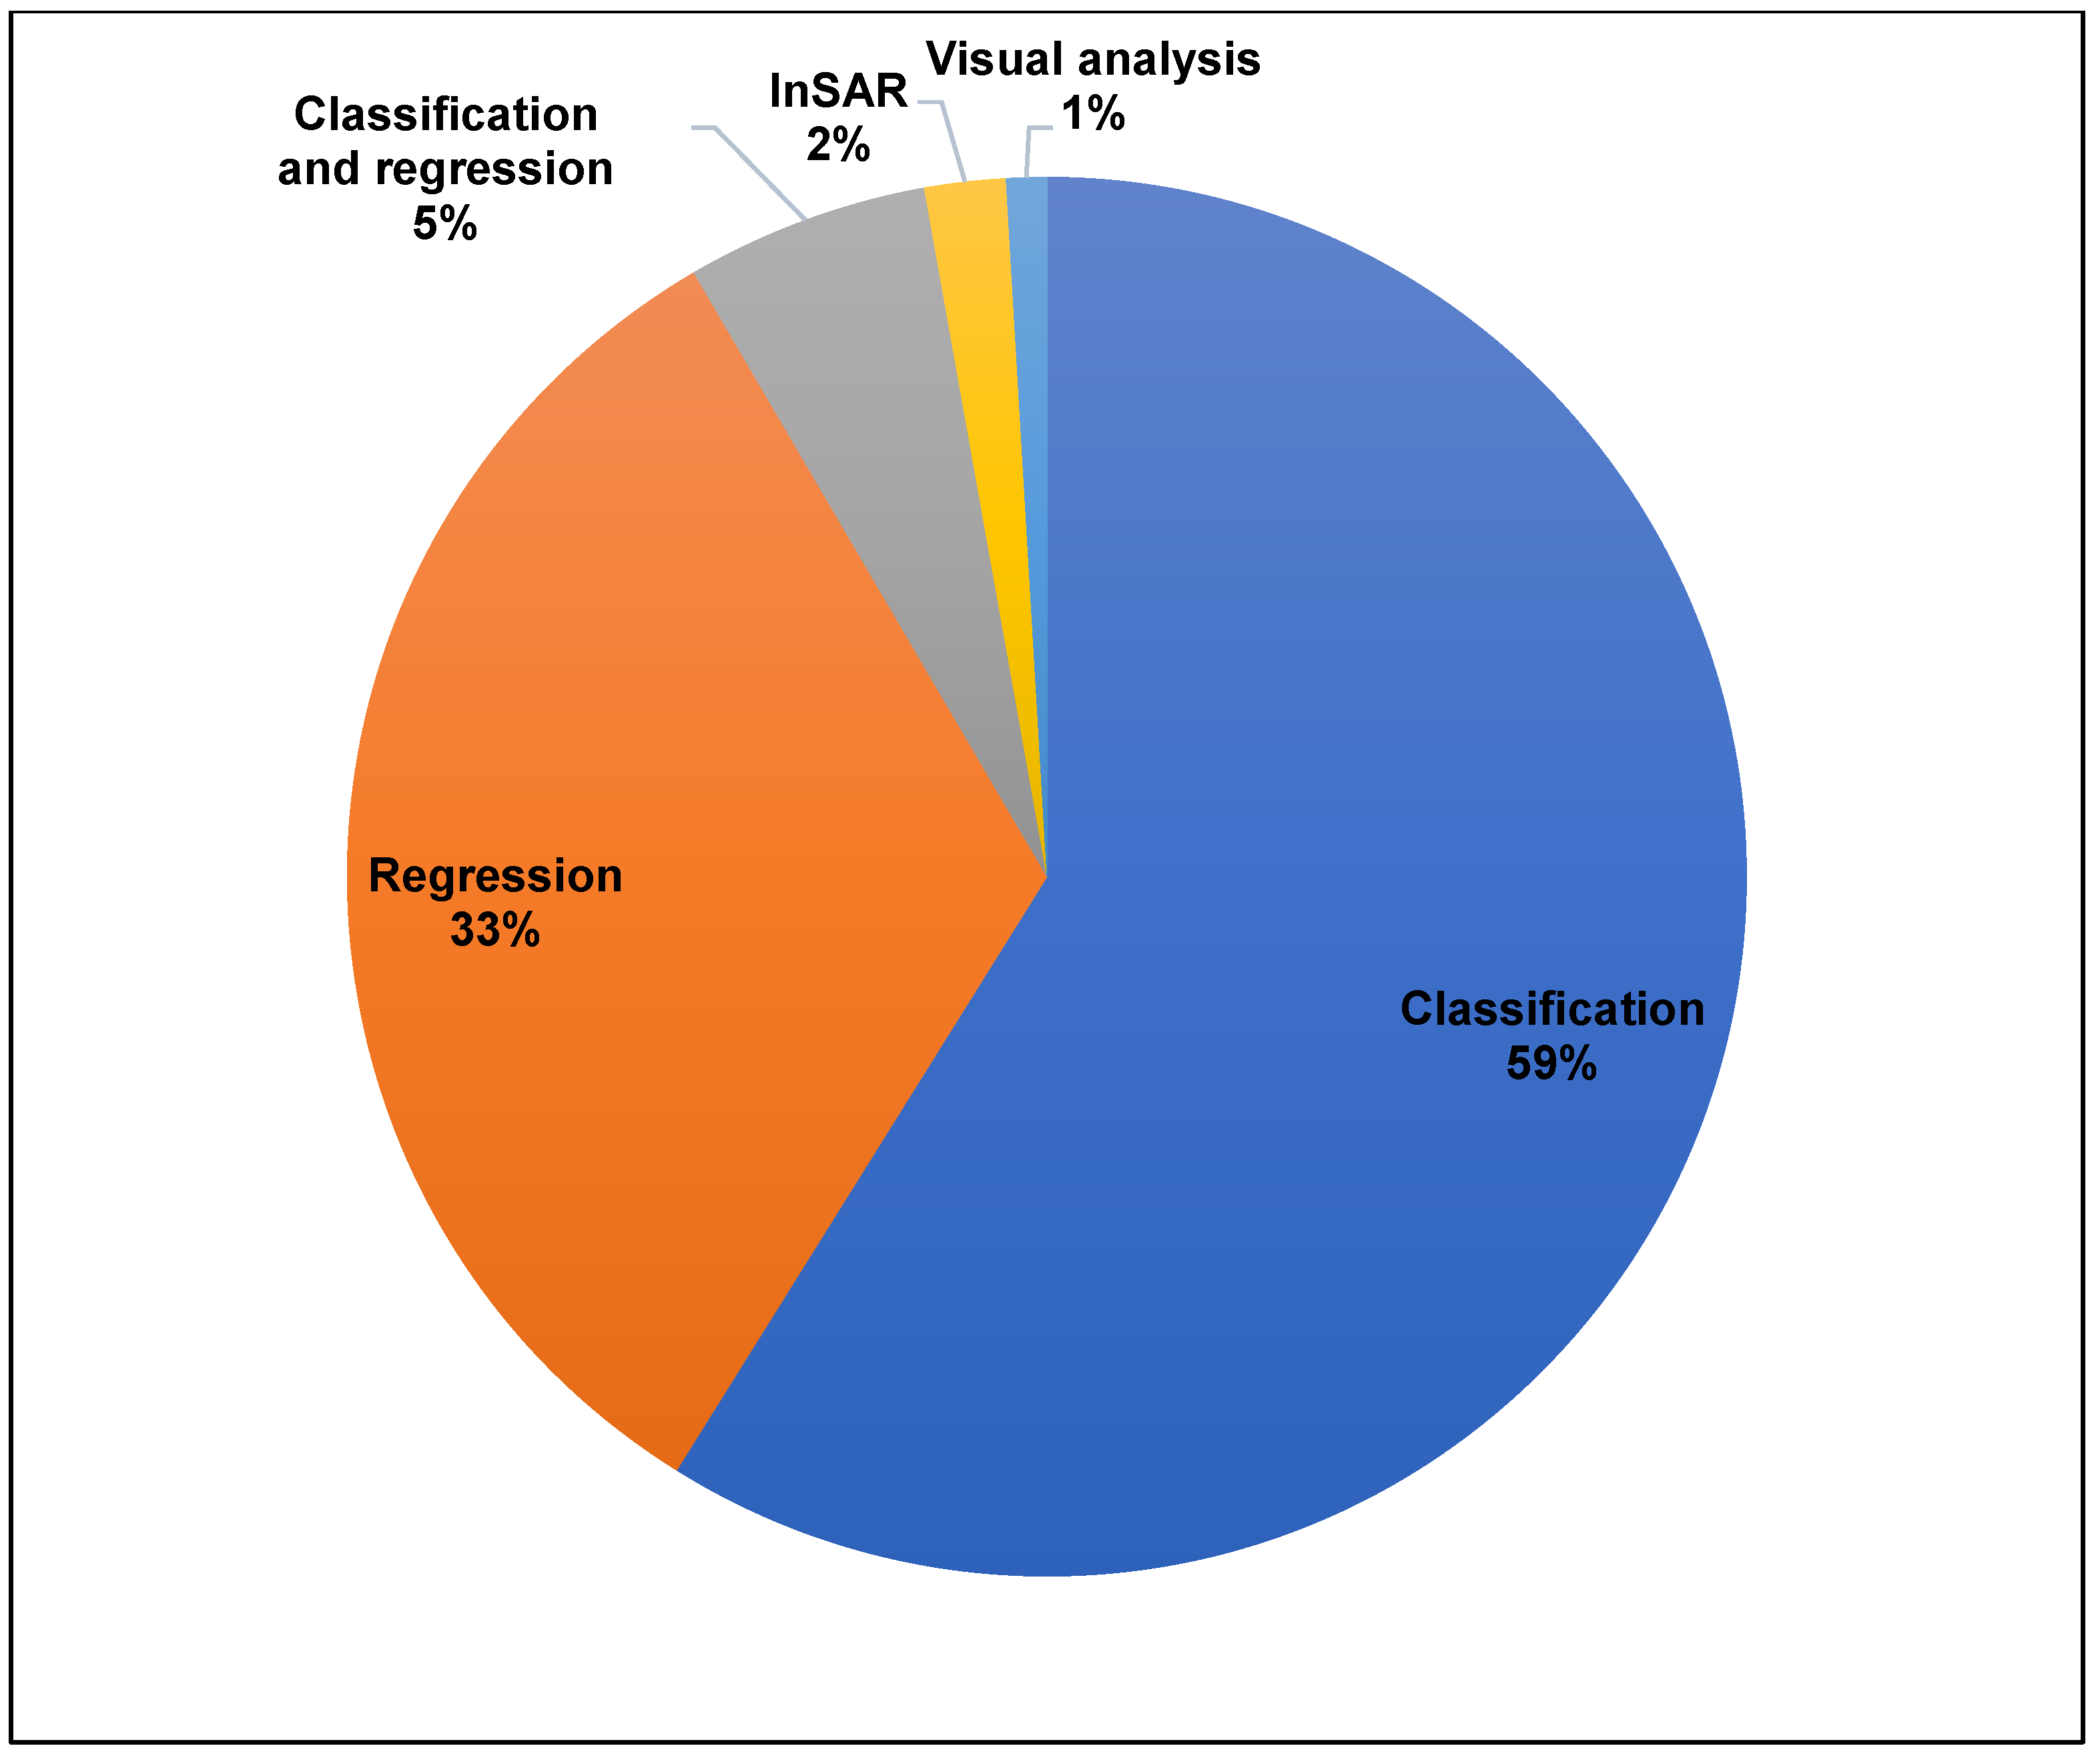
Information related to BES was extracted from SAR data using five general approaches, with image classification (n = 63) and regression (n = 35) approaches being the most common (Figure 5). The typical procedures for these two approaches are shown in Figure 6. Aside from these, six studies used a combination of classification and regression approaches, two used interferometric SAR (InSAR) processing, and one used purely visual analysis of the imagery to extract information related to BES. The following subsections include more details on each of these five different approaches.

3.2.1. Image Classification Approaches

In total, 64% of studies (n = 69) used image classification approaches to extract BES information, with 63 using only classification for analysis, and an additional 6 using a combination of classification and regression. Most of the classification-based studies involved generating new land use/land cover (LULC) maps of their study sites using L-band SAR data (n = 57), while a few (n = 6) used existing LULC maps classified using L-band SAR data (typically the 25 m PALSAR Forest/Non-Forest Maps provided by JAXA [19,29]). These studies typically discussed the linkages between information in the LULC map(s) and the BES of the study site, e.g., how human activities like urbanization and oil exploration have affected the spatial distribution and fragmentation of natural ecosystems [30] or how oil palm expansion has affected the natural ecosystems located in protected areas [31]. Additionally, some studies used LULC maps as inputs to ecosystem service models to help quantify the ecosystem services provided by different types of LULC features [32]. A benefit of using the L-band SAR data for these kinds of studies involving classification of LULC changes is its ability to acquire imagery even in cloudy conditions, which may allow changes to be detected more rapidly than when optical satellite data is used alone, particularly in regions with frequent cloud cover (e.g., tropical or mountainous areas).
Various image classification methods were used in the prior studies, including image thresholding (i.e., defining specific backscatter value(s) as thresholds to distinguish between different LULC classes), statistical classifiers, and machine-learning algorithms. The most commonly used classification method was image thresholding (n = 29). Papers published in earlier years nearly all used image thresholding for classification, perhaps due to its simple and fast computation and the ease of interpretation of this approach. As one example, Thapa et al. [33] found that a threshold of −11.5 dB in the HV band of PALSAR-1 HV images could be used to generally separate natural forests from other land cover in Sumatra, Indonesia. The second most commonly used method (n = 19) was random forest classification, a machine-learning algorithm [34]. Other machine-learning classification algorithms used multiple times included support vector machines (n = 5) and Extreme Gradient Boosting (n = 2). Random forest and support vector machines are used extensively for many types of remote sensing image classification tasks [35,36], so their frequent use for BES monitoring was, while not unexpected, still important to confirm in our study. Random forest classification was found to outperform other common approaches for classifying L-band SAR imagery in several past studies, e.g., achieving higher accuracy than support vector machines [37,38] and image thresholding [19], suggesting it is among the most promising methods for biodiversity monitoring using L-band SAR data. Some its advantages relevant to BES monitoring include its ability to model non-linear relationships between dependent and independent variables (e.g., between above-ground biomass and SAR backscatter metrics [39]), and its relative insensitivity to errors in training data (which allows lower quality reference data, e.g., citizen science data, to be used for training) and model overfitting (which makes it easier to train the model with limited training samples) [35]. Although deep learning classification methods have also recently become popular for remote sensing image classification [40], we found only two studies included in our analysis had used them [22,41]. Deep learning methods often require comparatively large amounts of training data (which is not always available) to achieve high levels of classification accuracy [42], which may be a factor limiting their usage. Notably, no papers included in our analysis compared the accuracy of deep learning and conventional machine-learning classification approaches, so this could be another interesting future research topic.
Compared with other BES information extraction approaches, classification approaches benefit from having greater reference data availability for model training and validation. Large reference (“class-labeled”) LULC datasets with global coverage have been made openly available by various authors [43,44]. Global citizen science initiatives like OpenStreetMap (https://www.openstreetmap.org/, accessed on 20 June 2025) also contain a massive amount of class-labeled data that can be used for L-band SAR image classification [45]. Additionally, LULC reference data can often be obtained remotely through visual interpretation of freely available high-resolution satellite images. Classification approaches, however, cannot easily provide information on within-class variations in BES (e.g., variations in tree canopy cover or tree species diversity within a specific LULC class), or on changes in BES that occur over time but do not result in LULC changes (e.g., subtle changes in tree canopy cover or species richness over time). Thus, it can be beneficial to extract additional information related to BES using other analysis approaches like regression.

3.2.2. Regression Approaches

38% of studies (n = 41) used regression approaches to analyze BES information, with 35 studies using only regression approaches, and an additional 6 using a combination of regression and classification approaches. In comparison with the classification-based studies, these studies used regression approaches to estimate BES-related indicators directly from the L-band SAR data, without requiring the generation of a LULC map first. Reference data for the dependent variable(s) of interest in the regression model came in the form of field observations or other higher accuracy remote sensing measurements (e.g., lidar-derived vegetation height data).
The large majority of the existing studies used regression to generate maps of forest (or other tree cover) structural parameters like above-ground biomass/wood density (n = 28) and canopy height (n = 9). Tree biomass and height information is relevant to many types of biodiversity analyses (e.g., identifying habitats of different species [46,47]) and ecosystem services analysis (e.g., carbon sequestration estimation [48]). Tree structural analysis studies were conducted in various types of environments, e.g., in mangrove [39,49], natural, and plantation forests [50], savannas [51,52], and dryland [53] ecosystems. Several studies (n = 10) also used regression to estimate and map species distributions and/or abundance. For example, Cerrejón et al. [46] used random forest regression to map the species richness of different types of bryophytes in Canadian boreal forests using PALSAR-1 annual mosaic imagery as well as optical remote sensing, climate, soil, and topographic data. Field measurements of bryophyte species richness were used as the reference data. Kobayashi et al. [47] used a generalized linear regression model to map the occurrence rates of several rare bird species (i.e., number of birds of each species present) across a study site in Sumatra, Indonesia, using two PALSAR-1 quad polarization images. Reference data was obtained from a bird census conducted at multiple field sites. The rationale for using L-band SAR data to estimate species distributions/abundance was that forest structure information observable from SAR backscatter features (SAR intensity or texture metrics) can be helpful for identifying suitable habitats for different species [54].
Random forest regression was the most commonly used regression method (used in 17 studies). In the papers included in our analysis, it was found to outperform linear regression and several machine-learning methods (including regression trees and support vector machines regression) for various tasks, e.g., canopy height mapping [55] and vegetation volume and AGB estimation [52,56], and its ability to rank the importance of the independent variables (including different L-band SAR bands) was also highlighted as useful to support BES monitoring efforts [50,57]. These findings once again demonstrate the potential of the random forest algorithm for monitoring BES using L-band SAR data. The second most commonly used regression method was linear regression (used in 11 studies). The “Water Cloud Model”, which is actually a radiative transfer model [58], was used in 3 studies. However, the parameters of this model are generally estimated using regression approaches [59,60], so we have included it in the same group as the regression approaches in this study. As noted in Mulatu et al., [61], the choice to use regression models for BES monitoring is often determined based on the amount of reference data available; simpler parametric models like linear regression are more suitable for when reference samples are very few, while non-parametric models like random forest regression are more suitable when more reference data is available (because non-linear relationships between the dependent and independent variables can more reliably be detected).
Compared with classification approaches, regression approaches have the advantage of being able to monitor variations in BES even within a specific LULC class, as well as changes in BES over time that do not result in LULC changes. This allows for the monitoring of more subtle variations in BES within specific ecosystems and/or more subtle temporal changes. On the other hand, a comparative disadvantage of regression methods is the lack of reference data available related to many variables of interest like species richness [62], which means that researchers often need to conduct extensive (and often costly) field work for data collection. As discussed in Section 3.4, however, reference data for several variables related to forest structure (e.g., tree height and above-ground biomass) can now be collected remotely with reasonable accuracy from airborne or satellite lidar data. Indeed, this may be one reason for our finding that forest structural parameters were the most common types of BES information extracted using regression methods. Various efforts are also currently ongoing to collect and centralize information on species distributions (and abundance), which may enable more studies on this in the future.
As already mentioned, several studies compared the performance of different classification/regression methods for BES monitoring tasks. It is difficult to know a priori which method will have the highest accuracy, so in practice it can be useful to compare a few different commonly used methods (e.g., linear regression, random forest regression, and support vector regression) to help determine the most suitable one for a particular BES monitoring task and study site.

3.2.3. Other and Combined (Classification and Regression) Approaches

Studies that used a combination of classification and regression approaches mainly involved first generating a LULC map using classification techniques, and then estimating vegetation structural parameters related to BES using regression techniques. For example, Geremew et al. [63] used random forest classification to map forests, woodlands, and other types of LULC in a study site in Ethiopia, and then applied random forest regression to estimate canopy heights for each type of LULC. Morel et al. [64] used the maximum likelihood classifier to map natural forests and timber plantations in a study site in Malaysian Borneo, and then applied a logarithmic regression model to estimate the above-ground biomass of the natural forests and plantations. These kinds of combination approaches are undoubtably useful for BES monitoring, as they leverage the relative strengths and weaknesses of classification and regression approaches alone. One challenge, however, is collecting sufficient reference data to properly train and validate both the classification and regression models. For example, if a LULC map with low accuracy or unknown accuracy is used as an input for a subsequent regression model to estimate forest AGB, the estimated values for the site (e.g., the total or average forest AGB) will be unreliable.
Aside from classification and regression approaches, InSAR represents another approach for BES monitoring. Studies that used InSAR attempted to map changes in land or water surface elevation (extracted by InSAR processing) and discuss how this affected BES. Xie et al. [65] used InSAR to detect seasonal changes in water level across different types of wetlands in China’s Yellow River Delta wetlands, with the rationale that this can help explain the wetland carbon cycle and habitat availability for different types of wildlife. Chen et al. [66] used InSAR to monitor surface deformation in a permafrost environment of China’s Tibet Plateau, and highlighted that this was important for BES monitoring due to the effects of permafrost changes on water and carbon storage.
Only one study included in our analysis used purely visual analysis to analyze BES information. Hoekman [67] conducted visual analysis of time-series JERS-1 images over Indonesian peat swamps to monitor disturbances like (storm-induced) flooding and (human-induced) excess drainage. This was one of the earliest papers to analyze BES using L-band SAR satellite data, and it helped point out the potential of this data for wetland monitoring. However, in comparison with classification or regression approaches, which can both generate wall-to-wall maps of a site of interest, reliance solely on visual analysis limits the scale at which BES monitoring can be conducted.

3.3. L-Band SAR Datasets Used

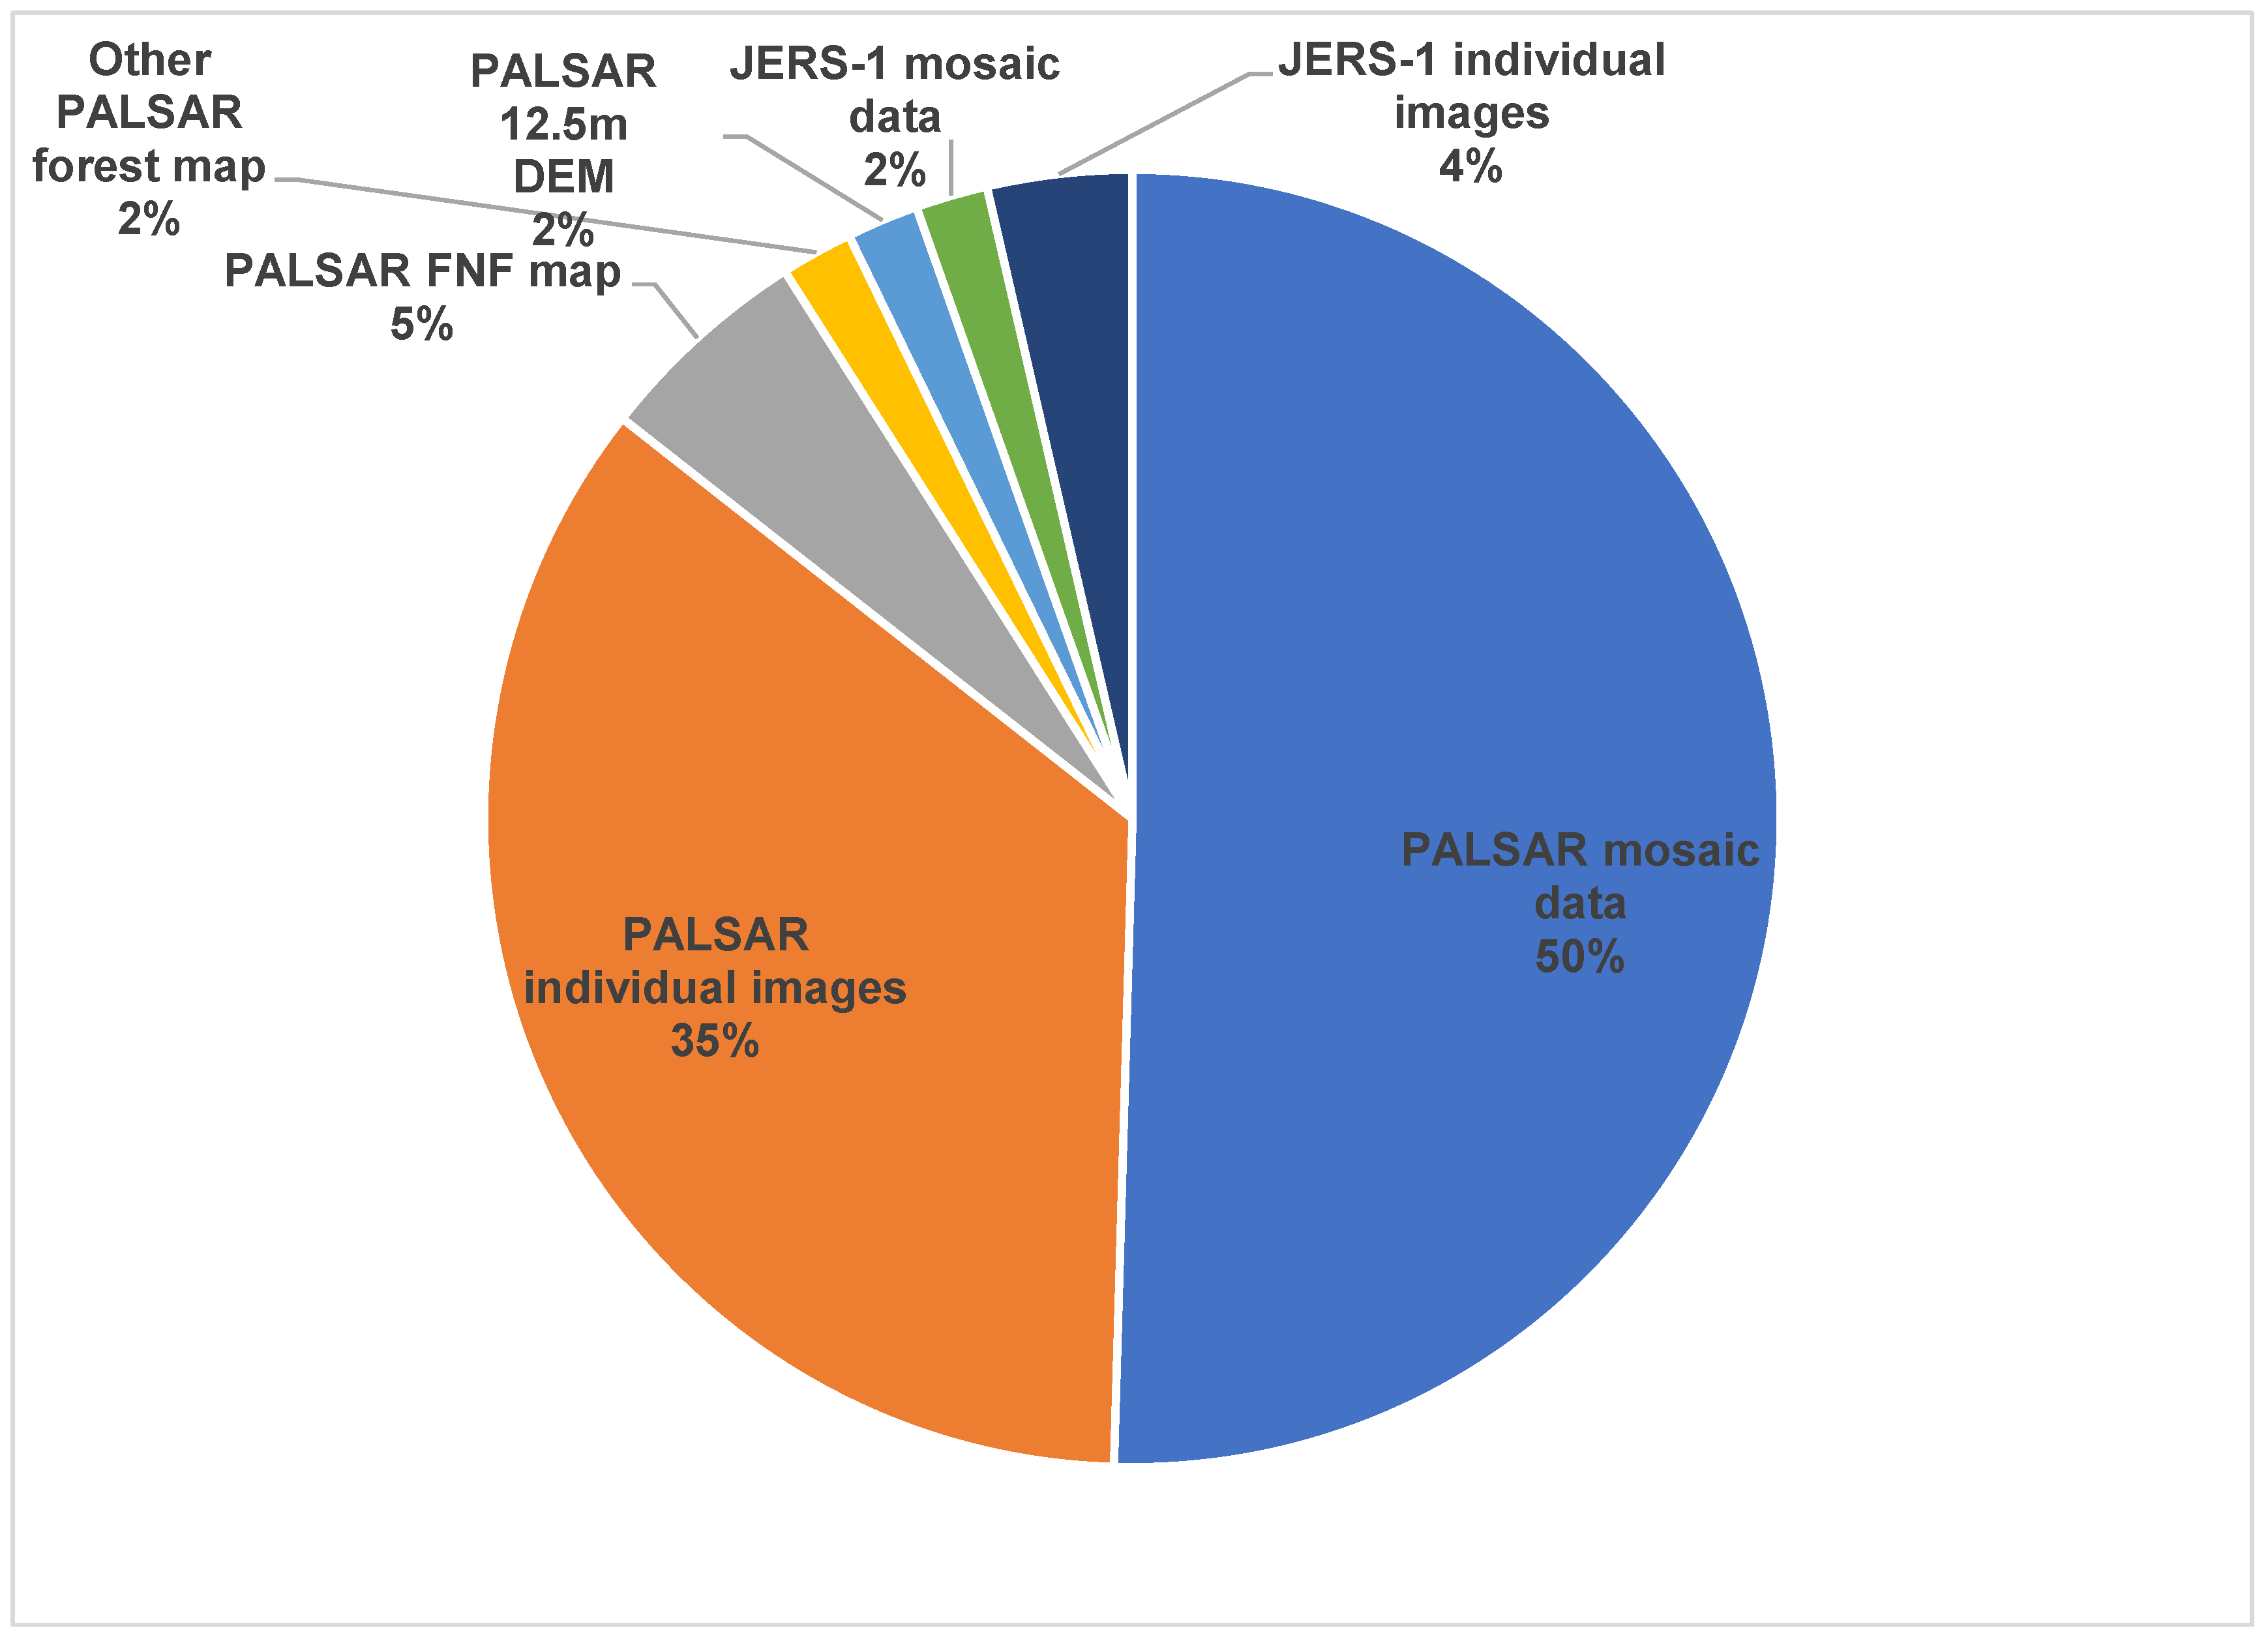
Nearly all of the articles included in our analysis used PALSAR-1/-2 data as their source of L-band SAR satellite data, while a few used JERS-1 data alone or in combination with PALSAR-1/-2 data (Figure 7).
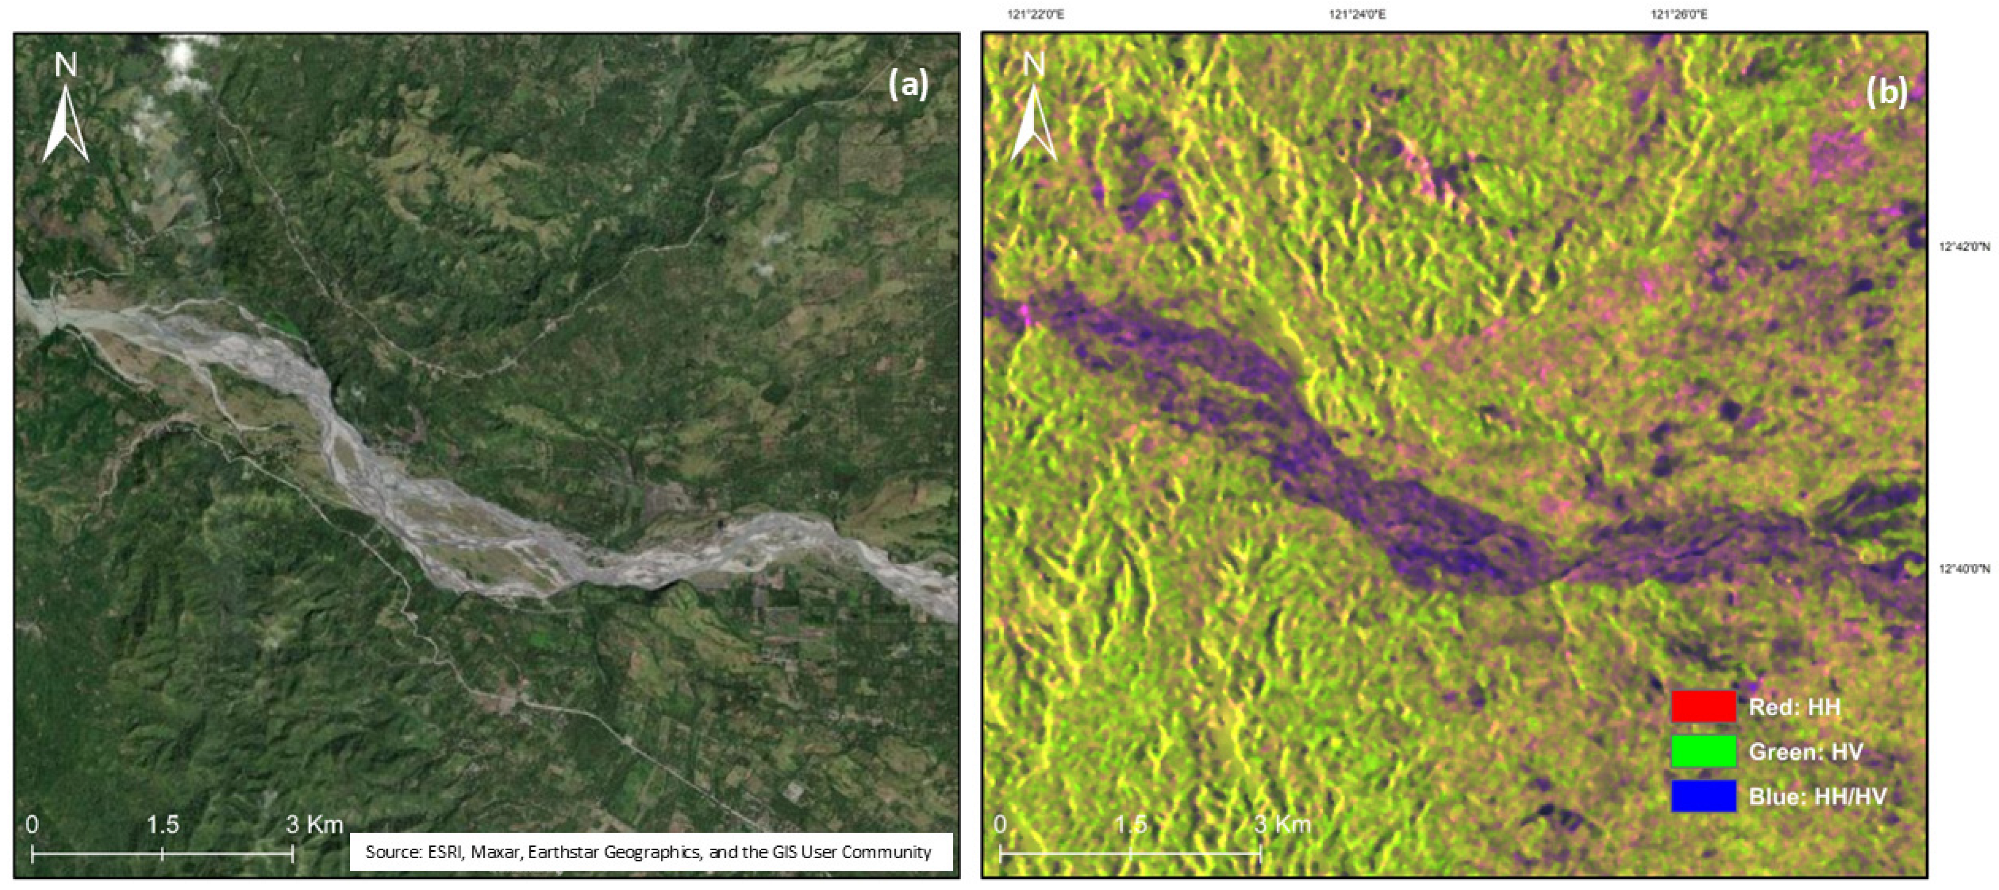
The PALSAR-1/-2 annual mosaic product, which includes HH and HV polarization images with a spatial resolution of 25 m, was used in 50% of the studies (n = 56) included in our analysis. Currently, PALSAR-1/-2 annual mosaic data for the years 2007–2010 and 2015–2024 are freely available on the JAXA website (https://www.eorc.jaxa.jp/ALOS/en/dataset/fnf_e.htm, accessed on 17 June 2025) and Google Earth Engine (https://earthengine.google.com/, accessed on 17 June 2025). PALSAR-1/-2 annual mosaic images are provided as pre-processed images, with corrections applied to reduce geometric distortions (through orthorectification), topographic distortions (radiometric slope correction), and radiometric differences between adjacent scenes (due to, e.g., different image acquisition dates) [68]. Figure 8 shows an example of a PALSAR-2 annual mosaic false color composite image acquired over a mixed landscape for illustration purposes. This annual mosaic data has the benefit of being freely available to the public, which is likely the major reason for its wide use. However, the fact that only one image per year is available for a given site in this annual mosaic dataset is a significant limitation of its use for BES monitoring, because important applications like seasonal monitoring of ecosystem dynamics (e.g., inter-seasonal changes in wetland hydrology or vegetation leaf area index [69]) require at least one image from each season of interest. Another challenge is that the acquisition date of the images included in the annual mosaic vary from year to year, which may complicate monitoring of inter-annual changes related to BES. To help users account for this issue, the acquisition date of each mosaic image is also provided as a raster file [68]. Several past studies have attempted to overcome the limitations of the PALSAR-1/-2 annual mosaic images by combining them with additional satellite images from other optical and/or SAR sensors, allowing for multiple images of a site to be analyzed within a single year [48,70].
The second most commonly used type of data was individual PALSAR-1/-2 images (n = 39). These individual PALSAR-1/-2 images are acquired in various modes, with different spatial resolutions (ranging from 3 m to 100 m), swath widths (ranging from 25 km to 490 km), and/or SAR polarization(s) (i.e., single, dual, or quad polarization). Unlike the annual mosaic images, these original images were not freely available, but in November 2022 all individual PALSAR-2 ScanSAR images (2014–present, HH and HV polarizations) became available at 25 m spatial resolution through JAXA’s G-Portal website (https://gportal.jaxa.jp/gpr/?lang=en#English, accessed on 13 February 2025) and Google Earth Engine. Compared with the annual mosaic dataset, these images have much higher temporal resolutions, e.g., a 14-day revisit cycle for PALSAR-2 (https://www.eorc.jaxa.jp/ALOS/en/alos-2/a2_about_e.htm, accessed on 16 June 2025). Because these individual ScanSAR images are now freely available, they may soon become more widely used than PALSAR-1/-2 annual mosaic images due to their relative advantages for BES monitoring, e.g., their ability to be used for monitoring of seasonal trends or intra-annual changes related to BES. The main challenges with using these higher temporal resolution images may be the additional methodological complexity and/or image processing time necessary to analyze the larger number of images per year.
While many L-band SAR image features were used for BES monitoring, the useful (or optimal) features for classification and regression modeling varied depending on the study site and type of BES information monitored. For example, for estimating forest above-ground biomass, Morin et al. [48] found that HH and HV backscatter were the most useful L-band SAR predictor variables for a coniferous forest site, while Huang et al. [21] found that gray level correlation matrix texture features were more useful than backscatter values for Chinese forests. As an example related to species richness estimation, Cerrejón et al. [46] found that a ratio image of HV/HH normalized backscatter was the best predictor of Bryophyte species richness, while HH backscatter was the best predictor of Sphagna species richness. Due to the challenge of identifying the useful (or optimal) L-band SAR features a priori, it may thus be beneficial to extract several potentially useful features, including normalized backscatter values and a few texture features (e.g., gray level correlation matrix features [21,71]), and apply an attribute selection procedure prior to conducting classification or regression. Alternatively, a noise tolerant classification or regression algorithm could be used to handle the high number of input variables to the models, e.g., random forest classification or regression [57,72]. These are also typical approaches for analyzing other types of high dimensional remote sensing data, including optical multispectral and hyperspectral images [35,73].
Aside from studies that used L-band SAR images (annual mosaic or individual images) for their analysis, a few studies used existing forest maps (n = 8) or elevation maps (n = 2) generated from L-band SAR data in previous studies. Most of these studies (n = 6) used the PALSAR-1 or PALSAR-2 Global Forest/Non-Forest Maps generated by JAXA [19,29]. For example, Johnson et al. [16] integrated the PALSAR-2 Global Forest/Non-Forest Map with a Sentinel-2 derived land cover map of the Philippines to better identify the extent and annual CO2 sinks of areas corresponding to FAO definitions of “Forest” and “Other land with tree cover” [74]. As another example, Altunel et al. [75] used the PALSAR-2 Forest/Non-Forest Map to assess the performance of afforestation works around hydroelectric dam reservoirs in Turkey. Alternatively, Parada Alzate et al. [76] used a slope map derived from a 12.5 m resolution PALSAR-1 digital elevation model, in combination with various other spatial datasets, to help identify high conservation areas in Colombia (using multicriteria analysis).

3.4. Other Satellite Data Used in Combination with L-Band SAR Data

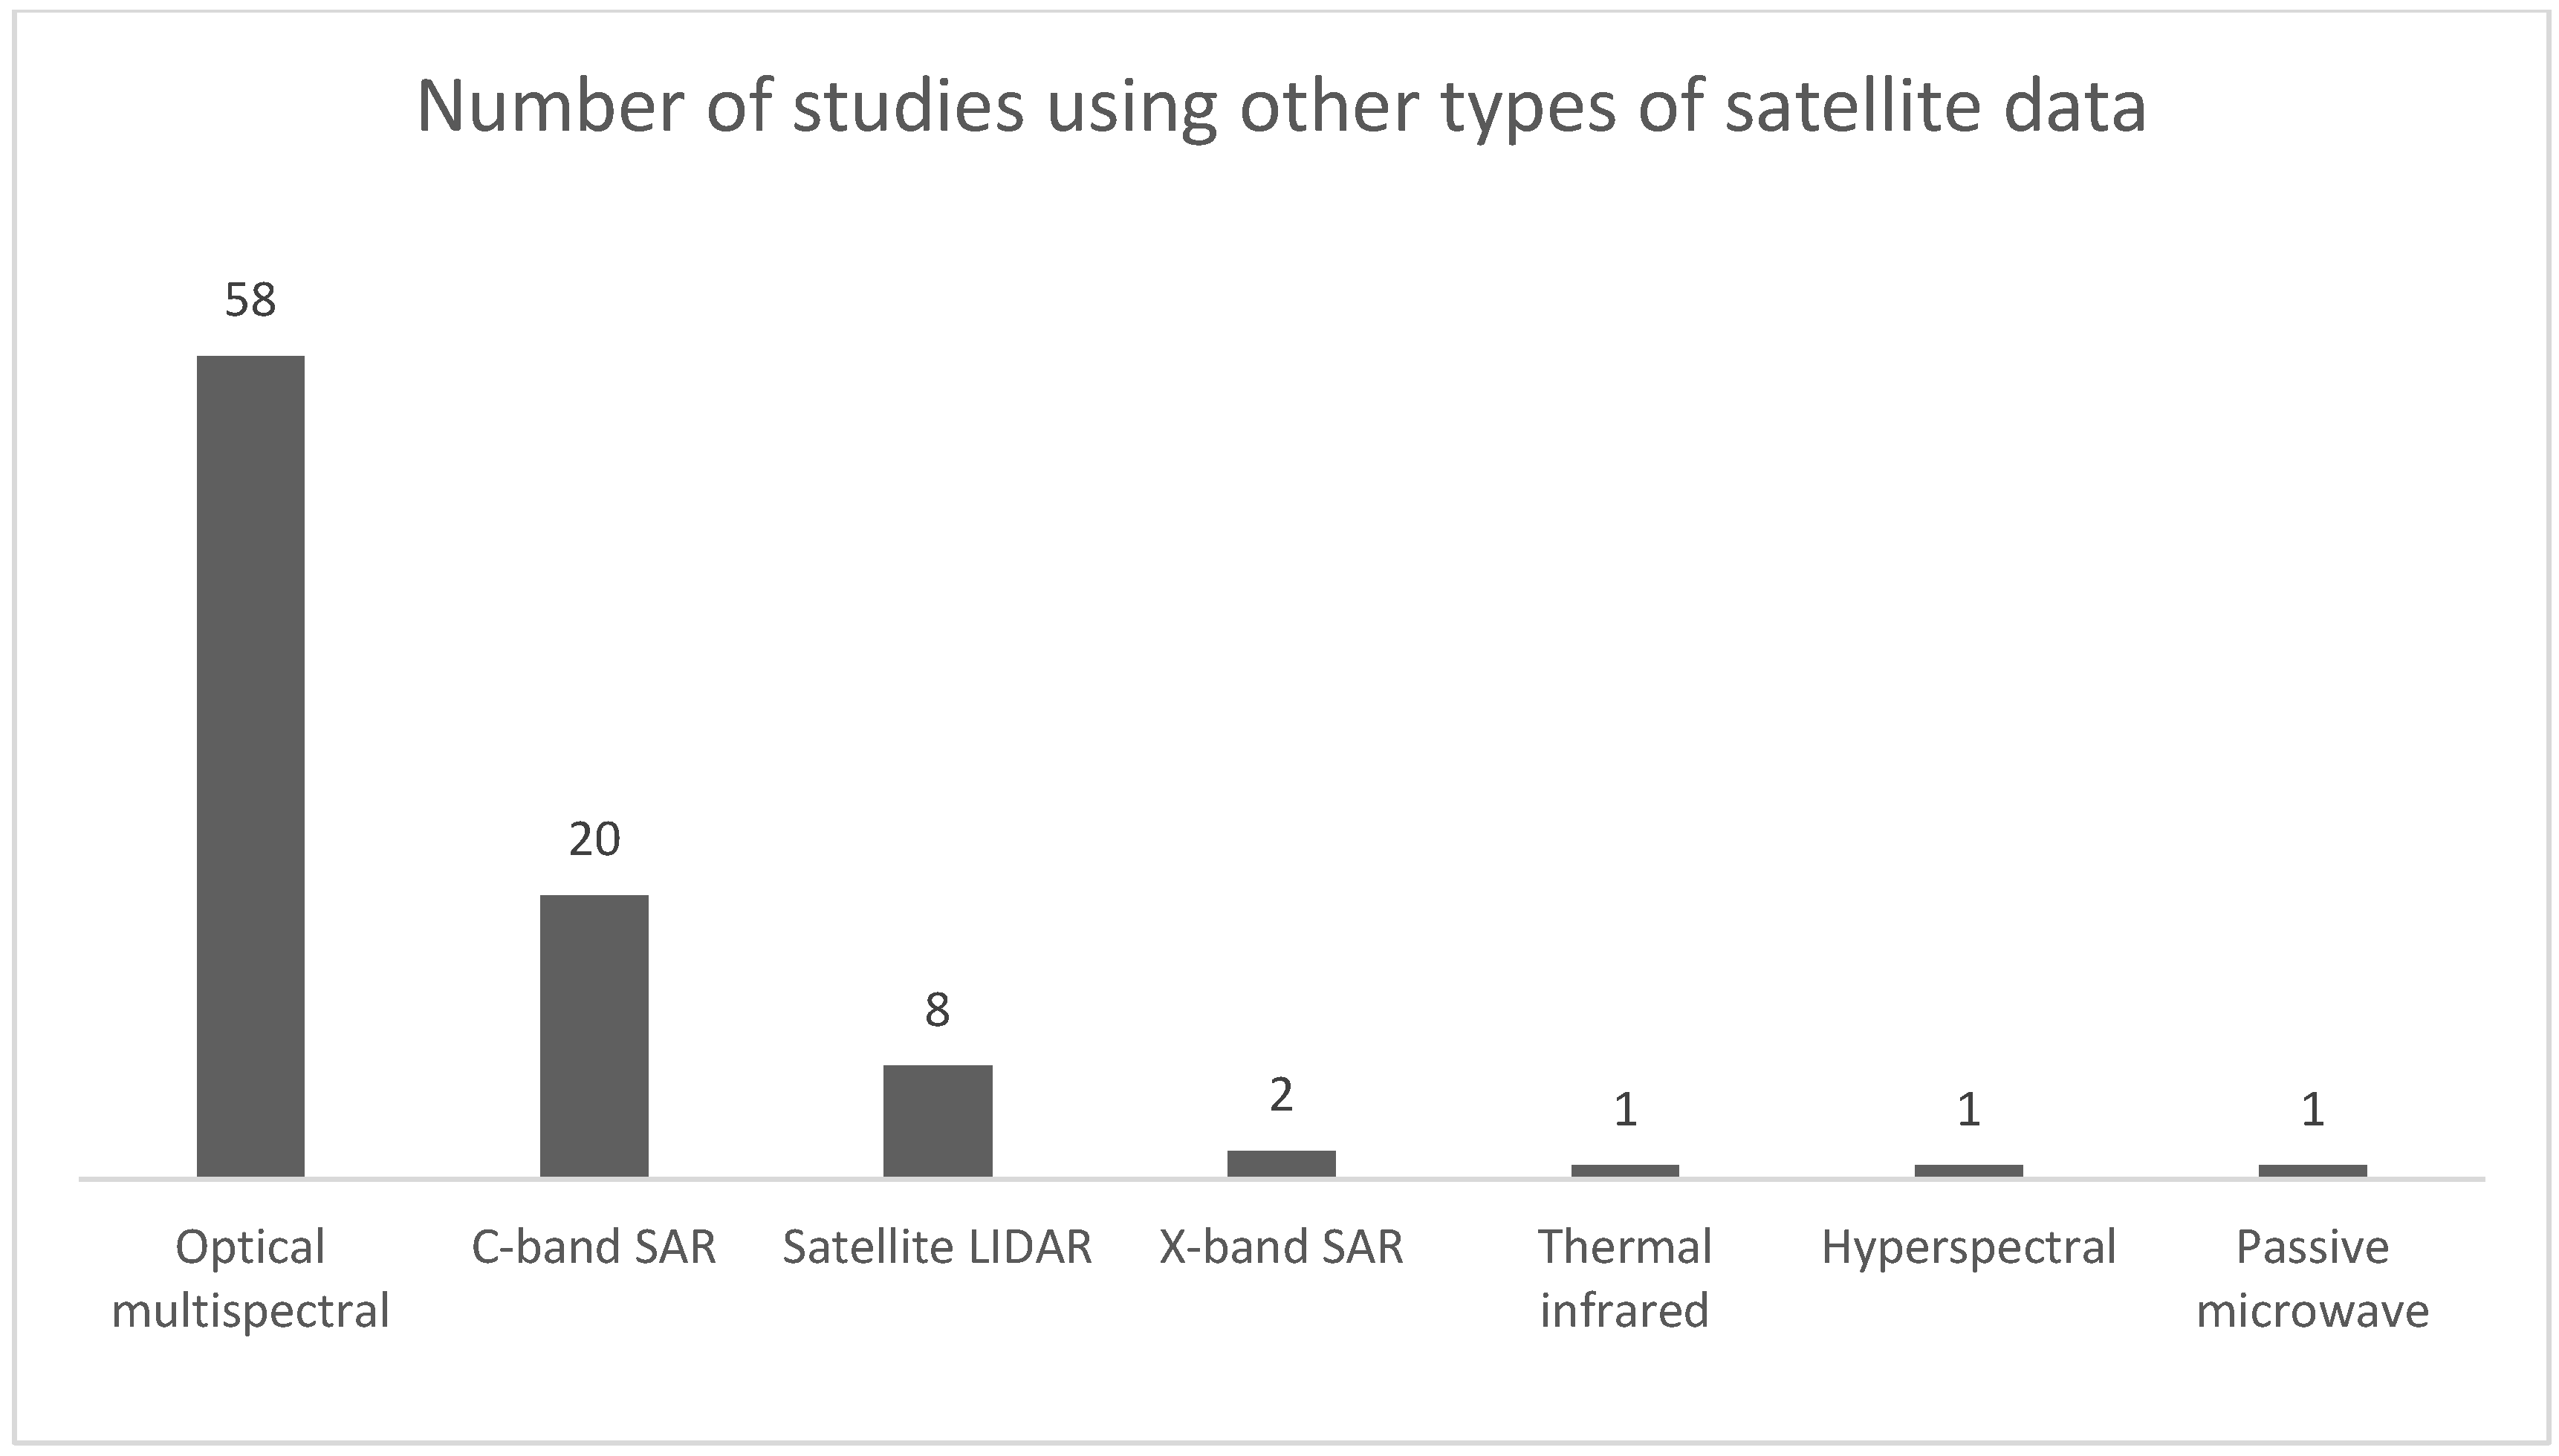
L-band SAR data was used in combination with other types of satellite remote sensing data in 64% of the studies analyzed (n = 68). Optical multispectral imagery was used in 54% of the studies (Figure 9), making it the most common type of data used with L-band SAR data. This optical data was mainly moderate spatial resolution imagery (10–30 m) from the Landsat and Sentinel-2 series of satellites, likely due to their free availability and similar spatial resolution to the 25 m PALSAR-1/-2 annual mosaic imagery. In a few cases, low resolution data (e.g., MODIS 250 m data [31]) or very high resolution data (e.g., WorldView-2 [77]) were used. The frequent use of optical data with L-band SAR is not completely surprising, as these two types of remote sensing data are known to be highly complementary; L-band SAR data is effective for monitoring vegetation structural information, while optical imagery is effective for monitoring other important vegetation parameters related to vegetation greenness (e.g., phenology and leaf area index).
Other types of SAR data were used in combination with L-band data in 20% of studies (n = 21). Of these, 19 studies used only C-band SAR data (either Sentinel-1 or RADARSAT data), one study used only X-band SAR data (TerraSAR-X data), and one study used both C-band and X-band SAR data in combination with L-band data. Of the three SAR bands, the L-band has the longest wavelength, which allows it to penetrate deepest into the vegetation canopy, while X-band SAR has the shortest wavelength, which makes it the most sensitive to features at the top of the vegetation canopy [18]. Because each SAR band is sensitive to different vegetation features, the use of L-band SAR data in combination with C-band and/or X-band data potentially allows for the extraction of more accurate information about BES within a study site. For example, Peng et al. [78] found that L-band data could more accurately estimate above-ground biomass in closed forests (where biomass was higher), while C-band data could more accurately estimate it for open forests (where biomass was lower).
Satellite lidar data was used in combination with L-band SAR data in 7% of studies (n = 8). In the context of BES monitoring, satellite lidar data is often used to estimate vegetation structure information like height and above-ground biomass, as the laser signal emitted from the satellite can measures the height from different parts of the vegetation canopy (e.g., tree tops, branches, and trunk), resulting in a three-dimensional point cloud of an ecosystem of interest [13]. The satellite lidar data used came from two sensors: the geoscience laser altimeter system (GLAS) onboard the ICESat satellite, and the global ecosystem dynamics investigation (GEDI) sensor onboard the International Space Station. Because satellite lidar data coverage is typically sparse, to generate wall-to-wall maps relevant to BES, the lidar-derived information needs to be extrapolated. This is typically performed by developing regression models that relate lidar-derived information, e.g., estimates of vegetation structure, with L-band SAR image characteristics (backscatter and texture metrics) [79,80]. Perhaps because of this, we found that almost all studies (7 out of 8) that used satellite lidar data employed regression techniques for analysis of BES information (the remaining study used an unsupervised classification approach to extrapolate lidar-derived information to image clusters). In six studies, regression techniques were used to map canopy height [50,63,80,81,82,83], while in two they were used to map above-ground biomass [21,84].

3.5. Scales and Locations of Studies

The large majority of the previous studies (n = 94) were conducted on a subnational scale, as shown in Figure 10. Many focused on understanding BES within the context of a particularly important ecosystem in the country of interest—e.g., tropical forests [64,80], savannas [51], and mangrove forests and other wetlands [30,67]. These subnational studies were predominantly located in Asia (China, Indonesia, and India, in particular) and the Americas (Colombia, the United States of America, and Mexico, in particular). National-scale studies were limited to Asia-Pacific countries, including Australia, China, Indonesia, the Philippines, and Vietnam. Interestingly, the countries with the highest number of national/subnational studies were also among the countries with the highest species richness (i.e., highest number of reported plant and animal species) globally, as shown in Table 1. For example, the three countries with the highest reported number of studies (China, Brazil, and Indonesia) were also the three countries with the highest species richness. In total, eight of the top ten countries in terms of species richness were also in the top ten in terms of the number of national/subnational studies (only Peru and Ecuador were missing), suggesting that BES monitoring efforts using L-band SAR data are prioritizing countries with high biodiversity. At the same time, this strong focus on countries with high species richness may also be considered as a limitation of the existing research, as the approaches developed for monitoring BES in these (often highly forested) countries may lack validation and transferability to other less studied regions (e.g., boreal or (semi-) arid regions) that are also highly important for particular species of interest and/or provide important ecosystem services. Thus, this is a key finding of our systematic review.
Regional-scale studies were also heavily focused on Asia (e.g., on Monsoon Asia [85], Southeast Asia [86], oil-palm-producing countries in Asia [31], and Borneo Island [87,88]). Aside from these, two regional studies covered South America [89] and its Amazon Basin [90], and one study covered Africa [59]. There were no global studies found in the papers retrieved from our Scopus search. However, we know from other sources that a few global studies do exist. For example, Bunting et al. [91] classified JERS-1 and PALSAR-1/-2 annual mosaic images to map global mangrove extent (and change) from 1996 to 2020, while JAXA [19] classified PALSAR-1/-2 annual mosaic images to map forest extent (and change) from 2007 to 2020, and Santoro et al. [92] used the water cloud model (with PALSAR-2 ScanSAR data and Sentinel-1 C-band SAR data) to generate a global forest above-ground biomass map. These global studies are undoubtedly valuable contributions to BES monitoring. As already mentioned, however, our analysis in this study is limited to only a sample of the total available literature (i.e., studies that self-identified as relating to “biodiversity”/“biological diversity”/“ecosystem services” in their title/keywords/abstract).
Since PALSAR-1/-2 annual mosaic images (the most widely used source of L-band SAR images) have already been freely available for over a decade, the prevalence of subnational studies is possibly due to factors other than L-band SAR data availability. One factor may be the limited availability of reference data related to BES at the national to global scale. Although LULC reference data is becoming more widely available, e.g., through the sharing of global reference datasets [43], the amount of data available for various other BES indicators, e.g., species occurrence data or vegetation structural data like tree height or above-ground biomass, remains limited [92]. Citizen science data related to these BES indicators may help supplement the limited data being shared by researchers and government sources, although challenges also exist in using citizen science observations as reference data due to, for example, the variable quality and uneven spatial distribution of citizen science data related to BES [62,93]. In addition to overcoming reference data limitations, it may also be necessary to provide technical support, e.g., capacity building and/or technology transfer, to national government agencies who conduct BES monitoring, so that they can better utilize L-band SAR satellite data for national reporting. This technical support would also contribute to the implementation of the Kunming-Montreal GBF, which has goals/targets related to strengthening national capacities for BES monitoring (e.g., Goal D and Target 20) [1].

3.6. Limitations of This Study and Potential Future Research Directions

As already mentioned, one limitation of our review is that it was based on just a sample of the total amount of studies that used L-band SAR satellite data for BES monitoring (articles that self-identified as relating to biodiversity or ecosystem services). Subsequent systematic reviews could build on our work by focusing more specifically on one or more of the sub-topics we highlighted, e.g., on the use of L-band SAR data for common BES monitoring applications like LULC mapping/AGB estimation/species distribution modeling, or on common analysis techniques or multi-sensor data fusion approaches. These more focused reviews could include additional relevant search terms in their literature searches to allow more papers on these sub-topics to be retrieved. Another limitation of our study is that, while we identified several commonly used analysis approaches (e.g., random forest classification/regression), L-band SAR datasets (PALSAR-1/-2 annual mosaic data), and approaches for combining data from multiple sensors, we did not attempt to quantify the relative performance of each approach/dataset/dataset combination through meta-analysis (e.g., calculation of mean classification accuracies, root-mean-square errors, or other accuracy metrics across all studies). This type of meta-analysis is not part of scoping reviews, which are mainly descriptive and used to broadly chart/map the existing literature [94]. However, subsequent systematic reviews focusing on one or more of these analysis approaches, datasets, or multi-sensor data fusion methods could include this meta-analysis to help quantify the advantages/disadvantages of different methods.
Several potential research areas for future primary studies were also identified through our review. For example, in comparison with studies using L-band SAR data for monitoring vegetation type and/or structure, we found that relatively few have used it for modeling species distributions and abundance. Relationships between vegetation type/vegetation structure and species distributions often exist (e.g., because a particular animal species may select a specific vegetation condition for its preferred habitat), which can allow for indirect monitoring with satellite data. Future studies could thus focus on species distribution modeling, potentially using citizen science species observations to help overcome the limited reference data available for species presence/absences [93]. Future studies could also investigate the use of high temporal resolution L-band SAR data for BES monitoring, as most existing studies have relied on annual mosaic data, while some recently released/soon-to-be released datasets like PALSAR-2 ScanSAR data and NISAR data have revisit periods as short at 12–14 days (see Table A2). Another potential research area includes the combination of L-band SAR data with other new sources of satellite data, e.g., P-band SAR data from the European Space Agency’s “Biomass” satellite launched in April 2025 (which may be effective for AGB monitoring due to its long wavelength), or S-band SAR data from the NISAR satellite launched in August 2025, as we did not find any studies that attempted to combine L-band data with P-band/S-band data for BES monitoring. As a final example, because our review found that most prior studies have been subnational in scale and located in countries with high species richness (mainly countries with high forest cover), future studies may wish to focus on less biodiverse countries as well, e.g., those with large semi-arid or arid ecosystems that provide valuable ecosystem services, or on global/regional BES monitoring efforts.

4. Conclusions

L-band SAR satellite data is being increasingly used in studies involving BES monitoring, particularly in ecosystems containing woody vegetation cover or wetlands. It is typically used in combination with optical (multispectral), C-band SAR, and/or lidar satellite data due to the distinct advantages of each for monitoring BES. The majority of studies (64%) have used image classification techniques to extract BES-related information from the remote sensing data, e.g., by generating LULC or LULC change maps. Regression approaches were also used frequently (in 38% of studies) to relate L-band SAR image properties (e.g., backscatter or texture metrics) with specific BES-related parameters like species richness, vegetation above-ground biomass, and canopy height. The maps generated using these classification and regression approaches were often indicators (or sub-indicators) for the Kunming-Montreal GBF’s Target 1 (“extent of natural ecosystems”) and Target 11 (“services provided by ecosystems”), the Paris Agreement (GHG emissions and removals associated with land use change and forestry), and SDG 15 (“forest area as a proportion of total land area”) (see Table A1). PALSAR-1/-2 annual mosaic data was the most commonly used SAR dataset (used in 50% of studies), demonstrating the importance of free data accessibility for BES monitoring. At present, 86% of studies have been conducted at the subnational scale, but due to the need for monitoring at the national and global scale to support international initiatives like the Kunming-Montreal GBF, future research may also focus on integrating L-band SAR with other types of remote sensing data for global BES monitoring systems. This is already being performed in some recent cases, e.g., for global-scale mapping of above-ground biomass [92]. Finally, it may be beneficial to develop technical support programs, e.g., academia–government partnerships, to help national governments learn how to effectively utilize L-band SAR data for BES monitoring.

Author Contributions

B.A.J.: Conceptualization, methodology, formal analysis, investigation, data curation, writing—original draft, validation, and visualization. C.U.: Formal analysis, data curation, writing—review and editing, and project administration. K.M.: Writing—original draft, writing—review and editing. T.T.: Writing—review and editing, funding acquisition, and supervision. K.H.: Writing—review and editing, funding acquisition, and supervision. Y.T.: Writing—original draft and writing—review and editing. M.H.: Writing—review and editing, funding acquisition, and supervision. O.O.: Writing—review and editing, funding acquisition, and supervision. All authors have read and agreed to the published version of the manuscript.

Funding

This research received no external funding.

Data Availability Statement

Data extracted from the studies included in our literature analysis will be made available upon request. A review protocol was not pre-registered before conducting the systematic review, so our protocol for the literature review and analysis is fully explained in this paper.

Acknowledgments

We would like to thank the anonymous reviewers for their valuable input on this manuscript.

Conflicts of Interest

The authors declare no conflict of interest.

Appendix A

Table A1. Examples of global targets and associated indicators related to biodiversity and ecosystem services that may utilize satellite remote sensing data (not an inclusive list).
Global Environmental InitiativeTarget Related to Biodiversity and Ecosystem ServicesRemote Sensing-Derived Indicators Used for Tracking Progress Towards the Target (Not a Comprehensive List)
Kunming-Montreal Global Biodiversity Framework [95]Target 1: Bring the loss of areas of high
biodiversity importance close to zero by 2030, while respecting the rights of indigenous and local people.
  • Extent of natural ecosystems
Target 2: Restore 30% of all degraded ecosystems.
  • Area under restoration
Target 7: Reduce pollution to levels that are not harmful to biodiversity.
  • Index of coastal eutrophication potential
  • Floating plastic debris density (by micro and macro plastics)
Target 8: Minimize the impacts of climate change on biodiversity and build resilience.
  • Bioclimatic Ecosystem Resilience Index (BERI)
Target 11: Restore, maintain, and enhance nature’s contributions to people.
  • Services provided by ecosystems
Target 12: Enhance green spaces and urban planning for human well-being and biodiversity.
  • Average share of the built-up area of cities that is green/blue space for public use for all
Target 22: Ensure participation in decision-making and access to justice and information related to biodiversity for all.
  • Land use change and land tenure in the traditional territories of indigenous peoples and local communities
Paris Agreement [3]“Each Party shall regularly provide the following information: …, Information necessary to track progress made in implementing and
achieving its nationally determined contribution under Article 4”.
  • Indicator(s) to track progress towards the implementation and achievement of nationally determined contribution, e.g., national greenhouse gas (GHG) emissions and removal, based on national GHG inventories [96]
Sustainable Development Goals [2]Goal 15: “Protect, restore and promote sustainable use of terrestrial ecosystems, sustainably manage forests, combat desertification, and halt and reverse land degradation and halt biodiversity loss”.
  • Forest area as a proportion of total land area
Table A2. Specifications of L-band SAR satellites with data available at 100 m spatial resolution or finer for BES monitoring.
L-Band SAR DatasetSpatial Resolution(s)PolarizationsRevisit PeriodYears of Data AvailableSource
JERS-1 individual images18 mHH44 days1992–1998https://earth.esa.int/eogateway/missions/jers-1, accessed on 7 October 2025
PALSAR-1 individual images10–100 mHH, HV, VV, and/or VH46 days2007–2011https://www.eorc.jaxa.jp/ALOS/en/alos/sensor/palsar_e.htm, accessed on 7 October 2025
PALSAR-2 individual images2–100 mHH, HV, VV, and/or VH14 days2014–presenthttps://www.eoportal.org/satellite-missions/alos-2#spacecraft, accessed on 7 October 2025
JERS-1 annual mosaic images25 mHHAnnual1992–1998https://www.eorc.jaxa.jp/ALOS/en/dataset/fnf_e.htm, accessed on 7 October 2025
PALSAR-1 annual mosaic images25 mHH, HVAnnual2007–2010https://www.eorc.jaxa.jp/ALOS/en/dataset/fnf_e.htm, accessed on 7 October 2025
PALSAR-2 annual mosaic images25 mHH, HVAnnual2015–2024https://www.eorc.jaxa.jp/ALOS/en/dataset/fnf_e.htm, accessed on 7 October 2025
PALSAR-1/-2 “Forest/Non-Forest Map”25 mn/aAnnual2007–2010, 2015–2020https://www.eorc.jaxa.jp/ALOS/en/dataset/fnf_e.htm, accessed on 7 October 2025
SAOCOM individual images10–100 mHH, HV, VV, VH16 days2018–presenthttps://earth.esa.int/eogateway/missions/saocom, accessed on 7 October 2025
NISAR individual images3–48 mHH, HV, VV, VH12 daysAugust 2025–presenthttps://www.eoportal.org/satellite-missions/nisar#sensor-complement, accessed on 7 October 2025

References

  1. CBD. CBD/COP/15/L.25. 2022. Available online: https://www.cbd.int/doc/c/e6d3/cd1d/daf663719a03902a9b116c34/cop-15-l-25-en.pdf (accessed on 7 October 2025).
  2. United Nations. A/RES/70/1; United Nations: New York, NY, USA, 2015. [Google Scholar]
  3. UNFCCC. FCCC/CP/2015/10/Add.1. 2016. Available online: https://www.un.org/en/development/desa/population/migration/generalassembly/docs/globalcompact/FCCC_CP_2015_10_Add.1.pdf (accessed on 7 October 2025).
  4. UNDP; UNEP-WCMC. Using Spatial Data to Support the Development of Plans for National Monitoring Systems for the Kunming-Montreal Global Biodiversity Framework; United Nations: New York, NY, USA, 2024. [Google Scholar]
  5. Bourgeau-Chavez, L.L.; Kowalski, K.P.; Carlson Mazur, M.L.; Scarbrough, K.A.; Powell, R.B.; Brooks, C.N.; Huberty, B.; Jenkins, L.K.; Banda, E.C.; Galbraith, D.M.; et al. Mapping Invasive Phragmites Australis in the Coastal Great Lakes with ALOS PALSAR Satellite Imagery for Decision Support. J. Great Lakes Res. 2013, 39, 65–77. [Google Scholar] [CrossRef]
  6. Arenas-Castro, S.; Regos, A.; Gonçalves, J.F.; Alcaraz-Segura, D.; Honrado, J. Remotely Sensed Variables of Ecosystem Functioning Support Robust Predictions of Abundance Patterns for Rare Species. Remote Sens. 2019, 11, 2086. [Google Scholar] [CrossRef]
  7. Nagendra, H.; Lucas, R.; Honrado, J.P.; Jongman, R.H.G.; Tarantino, C.; Adamo, M.; Mairota, P. Remote Sensing for Conservation Monitoring: Assessing Protected Areas, Habitat Extent, Habitat Condition, Species Diversity, and Threats. Ecol. Indic. 2013, 33, 45–59. [Google Scholar] [CrossRef]
  8. Johnson, B.A.; Arino, Y.; Magcale-Macandog, D.B.; Liu, X.; Yamanoshita, M. Potential of Agrivoltaics in ASEAN Considering a Scenario Where Agroforestry Expansion Is Also Pursued. Resour. Conserv. Recycl. 2024, 209, 107808. [Google Scholar] [CrossRef]
  9. Wulder, M.A.; Masek, J.G.; Cohen, W.B.; Loveland, T.R.; Woodcock, C.E. Opening the Archive: How Free Data Has Enabled the Science and Monitoring Promise of Landsat. Remote Sens. Environ. 2012, 122, 2–10. [Google Scholar] [CrossRef]
  10. Kuenzer, C.; Ottinger, M.; Wegmann, M.; Guo, H.; Wang, C.; Zhang, J.; Dech, S.; Wikelski, M. Earth Observation Satellite Sensors for Biodiversity Monitoring: Potentials and Bottlenecks. Int. J. Remote Sens. 2014, 35, 6599–6647. [Google Scholar] [CrossRef]
  11. Simard, M.; Fatoyinbo, L.; Thomas, N.M.; Stovall, A.E.; Parra, A.; Barenblitt, A.; Bunting, P.; Hajnsek, I. A New Global Mangrove Height Map with a 12 Meter Spatial Resolution. Sci. Data 2025, 12, 15. [Google Scholar] [CrossRef]
  12. Santoro, M.; Cartus, O.; Fransson, J.E.S.; Wegmüller, U. Complementarity of X-, C-, and L-Band SAR Backscatter Observations to Retrieve Forest Stem Volume in Boreal Forest. Remote Sens. 2019, 11, 1563. [Google Scholar] [CrossRef]
  13. Coops, N.C.; Tompalski, P.; Goodbody, T.R.H.; Queinnec, M.; Luther, J.E.; Bolton, D.K.; White, J.C.; Wulder, M.A.; van Lier, O.R.; Hermosilla, T. Modelling Lidar-Derived Estimates of Forest Attributes over Space and Time: A Review of Approaches and Future Trends. Remote Sens. Environ. 2021, 260, 112477. [Google Scholar] [CrossRef]
  14. Tian, L.; Wu, X.; Tao, Y.; Li, M.; Qian, C.; Liao, L.; Fu, W. Review of Remote Sensing-Based Methods for Forest Aboveground Biomass Estimation: Progress, Challenges, and Prospects. Forests 2023, 14, 1086. [Google Scholar] [CrossRef]
  15. Bunting, P.; Rosenqvist, A.; Lucas, R.M.; Rebelo, L.M.; Hilarides, L.; Thomas, N.; Hardy, A.; Itoh, T.; Shimada, M.; Finlayson, C.M. The Global Mangrove Watch—A New 2010 Global Baseline of Mangrove Extent. Remote Sens. 2018, 10, 1669. [Google Scholar] [CrossRef]
  16. Johnson, B.A.; Umemiya, C.; Magcale-Macandog, D.B.; Estoque, R.C.; Hayashi, M.; Tadono, T. Better Monitoring of Forests According to FAO’s Definitions through Map Integration: Significance and Limitations in the Context of Global Environmental Goals. Int. J. Appl. Earth Obs. Geoinf. 2023, 122, 103452. [Google Scholar] [CrossRef]
  17. Nesha, M.K.; Hussin, Y.A.; Van Leeuwen, L.M.; Sulistioadi, Y.B. Modeling and Mapping Aboveground Biomass of the Restored Mangroves Using ALOS-2 PALSAR-2 in East Kalimantan, Indonesia. Int. J. Appl. Earth Obs. Geoinf. 2020, 91, 102158. [Google Scholar] [CrossRef]
  18. Committee on Earth Observation Satellites. A Layman’s Interpretation Guide to L-Band and C-Band Synthetic Aperture Radar Data Version 2.0; Committee on Earth Observation Satellites: Washington, DC, USA, 2023. [Google Scholar]
  19. JAXA. Global 25 m Resolution PALSAR-2 Forest/Non-Forest Map (FNF) (Ver.2.0.0) Dataset Description; JAXA: Tokyo, Japan, 2022. [Google Scholar]
  20. Hu, X.; Li, L.; Huang, J.; Zeng, Y.; Zhang, S.; Su, Y.; Hong, Y.; Hong, Z. Radar Vegetation Indices for Monitoring Surface Vegetation: Developments, Challenges, and Trends. Sci. Total Environ. 2024, 945, 173974. [Google Scholar] [CrossRef]
  21. Huang, H.; Liu, C.; Wang, X.; Zhou, X.; Gong, P. Integration of Multi-Resource Remotely Sensed Data and Allometric Models for Forest Aboveground Biomass Estimation in China. Remote Sens. Environ. 2019, 221, 225–234. [Google Scholar] [CrossRef]
  22. Fu, B.; Li, H.; Liu, M.; Yao, H.; Gao, E.; Sun, W.; Zhang, S.; Fan, D. Performance Evaluation of Backscattering Coefficients and Polarimetric Decomposition Parameters for Marsh Vegetation Mapping Using Multi-Sensor and Multi-Frequency SAR Images. Ecol. Indic. 2023, 157, 111246. [Google Scholar] [CrossRef]
  23. Leenaars, C.; Tsaioun, K.; Stafleu, F.; Rooney, K.; Meijboom, F.; Ritskes-Hoitinga, M.; Bleich, A. Reviewing the Animal Literature: How to Describe and Choose between Different Types of Literature Reviews. Lab. Anim. 2021, 55, 129–141. [Google Scholar] [CrossRef]
  24. Grant, M.J.; Booth, A. A Typology of Reviews: An Analysis of 14 Review Types and Associated Methodologies. Health Inf. Libr. J. 2009, 26, 91–108. [Google Scholar] [CrossRef]
  25. Page, M.J.; McKenzie, J.E.; Bossuyt, P.M.; Boutron, I.; Hoffmann, T.C.; Mulrow, C.D.; Shamseer, L.; Tetzlaff, J.M.; Akl, E.A.; Brennan, S.E.; et al. The PRISMA 2020 Statement: An Updated Guideline for Reporting Systematic Reviews. BMJ 2021, 372, n71. [Google Scholar] [CrossRef]
  26. Kadykalo, A.N.; López-Rodriguez, M.D.; Ainscough, J.; Droste, N.; Ryu, H.; Ávila-Flores, G.; Le Clec’h, S.; Muñoz, M.C.; Nilsson, L.; Rana, S.; et al. Disentangling ‘Ecosystem Services’ and ‘Nature’s Contributions to People’. Ecosyst. People 2019, 15, 269–287. [Google Scholar] [CrossRef]
  27. Guerry, A.D.; Polasky, S.; Lubchenco, J.; Chaplin-Kramer, R.; Daily, G.C.; Griffin, R.; Ruckelshaus, M.; Bateman, I.J.; Duraiappah, A.; Elmqvist, T.; et al. Natural Capital and Ecosystem Services Informing Decisions: From Promise to Practice. Proc. Natl. Acad. Sci. USA 2015, 112, 7348–7355. [Google Scholar] [CrossRef]
  28. Adeli, S.; Salehi, B.; Mahdianpari, M.; Quackenbush, L.J.; Brisco, B.; Tamiminia, H.; Shaw, S. Wetland Monitoring Using SAR Data: A Meta-Analysis and Comprehensive Review. Remote Sens. 2020, 12, 2190. [Google Scholar] [CrossRef]
  29. Shimada, M.; Itoh, T.; Motooka, T.; Watanabe, M.; Shiraishi, T.; Thapa, R.; Lucas, R. New Global Forest/Non-Forest Maps from ALOS PALSAR Data (2007–2010). Remote Sens. Environ. 2014, 155, 13–31. [Google Scholar] [CrossRef]
  30. Nababa, I.; Symeonakis, E.; Koukoulas, S.; Higginbottom, T.; Cavan, G.; Marsden, S. Land Cover Dynamics and Mangrove Degradation in the Niger Delta Region. Remote Sens. 2020, 12, 3619. [Google Scholar] [CrossRef]
  31. Yu, L.; Cao, Y.; Cheng, Y.; Zhao, Q.; Xu, Y.; Kanniah, K.; Lu, H.; Yang, R.; Gong, P. A Study of the Serious Conflicts between Oil Palm Expansion and Biodiversity Conservation Using High-Resolution Remote Sensing. Remote Sens. Lett. 2023, 14, 654–668. [Google Scholar] [CrossRef]
  32. Posner, S.; Verutes, G.; Koh, I.; Denu, D.; Ricketts, T. Global Use of Ecosystem Service Models. Ecosyst. Serv. 2016, 17, 131–141. [Google Scholar] [CrossRef]
  33. Thapa, R.B.; Itoh, T.; Shimada, M.; Watanabe, M.; Takeshi, M.; Shiraishi, T. Evaluation of ALOS PALSAR Sensitivity for Characterizing Natural Forest Cover in Wider Tropical Areas. Remote Sens. Environ. 2014, 155, 32–41. [Google Scholar] [CrossRef]
  34. Breiman, L. Random Forests. Mach. Learn. 2001, 45, 5–32. [Google Scholar] [CrossRef]
  35. Belgiu, M.; Drăguţ, L. Random Forest in Remote Sensing: A Review of Applications and Future Directions. ISPRS J. Photogramm. Remote Sens. 2016, 114, 24–31. [Google Scholar] [CrossRef]
  36. Sheykhmousa, M.; Mahdianpari, M.; Ghanbari, H.; Mohammadimanesh, F.; Ghamisi, P.; Homayouni, S. Support Vector Machine Versus Random Forest for Remote Sensing Image Classification: A Meta-Analysis and Systematic Review. IEEE J. Sel. Top. Appl. Earth Obs. Remote Sens. 2020, 13, 6308–6325. [Google Scholar] [CrossRef]
  37. Acharki, S.; Frison, P.L.; Amharref, M.; Khoj, H.; Bernoussi, S. Complémentarité des images optiques SENTINEL-2 avec les images radar SENTINEL-1 et ALOS-PALSAR-2 pour la cartographie de la couverture végétale: Application à une aire protégée et ses environs au Nord-Ouest du Maroc via trois algorithmes d’apprentissage automatique. RFPT 2021, 223, 143–158. [Google Scholar] [CrossRef]
  38. Shiraishi, T.; Motohka, T.; Thapa, R.B.; Watanabe, M.; Shimada, M. Comparative Assessment of Supervised Classifiers for Land Use–Land Cover Classification in a Tropical Region Using Time-Series PALSAR Mosaic Data. IEEE J. Sel. Top. Appl. Earth Obs. Remote Sens. 2014, 7, 1186–1199. [Google Scholar] [CrossRef]
  39. Selvaraj, J.J.; Gallego Pérez, B.E. Estimating Mangrove Aboveground Biomass in the Colombian Pacific Coast: A Multisensor and Machine Learning Approach. Heliyon 2023, 9, e20745. [Google Scholar] [CrossRef] [PubMed]
  40. Ma, L.; Liu, Y.; Zhang, X.; Ye, Y.; Yin, G.; Johnson, B.A. Deep Learning in Remote Sensing Applications: A Meta-Analysis and Review. ISPRS J. Photogramm. Remote Sens. 2019, 152, 166–177. [Google Scholar] [CrossRef]
  41. Zhang, P.; Hu, X.; Ban, Y.; Nascetti, A.; Gong, M. Assessing Sentinel-2, Sentinel-1, and ALOS-2 PALSAR-2 Data for Large-Scale Wildfire-Burned Area Mapping: Insights from the 2017–2019 Canada Wildfires. Remote Sens. 2024, 16, 556. [Google Scholar] [CrossRef]
  42. Jozdani, S.E.; Johnson, B.A.; Chen, D. Comparing Deep Neural Networks, Ensemble Classifiers, and Support Vector Machine Algorithms for Object-Based Urban Land Use/Land Cover Classification. Remote Sens. 2019, 11, 1713. [Google Scholar] [CrossRef]
  43. Carlos, J.; Bayas, L.; Lesiv, M.; Waldner, F.; Schucknecht, A.; Duerauer, M.; See, L.; Fritz, S.; Fraisl, D.; Moorthy, I.; et al. A Global Reference Database of Crowdsourced Cropland Data Collected Using the Geo-Wiki Platform. Sci. Data 2017, 4, 170136. [Google Scholar] [CrossRef]
  44. Stanimirova, R.; Tarrio, K.; Turlej, K.; McAvoy, K.; Stonebrook, S.; Hu, K.-T.; Arévalo, P.; Bullock, E.L.; Zhang, Y.; Woodcock, C.E.; et al. A Global Land Cover Training Dataset from 1984 to 2020. Sci. Data 2023, 10, 879. [Google Scholar] [CrossRef]
  45. Johnson, B.A.; Iizuka, K.; Bragais, M.A.; Endo, I.; Magcale-Macandog, D.B. Employing Crowdsourced Geographic Data and Multi-Temporal/Multi-Sensor Satellite Imagery to Monitor Land Cover Change: A Case Study in an Urbanizing Region of the Philippines. Comput. Environ. Urban Syst. 2017, 64, 184–193. [Google Scholar] [CrossRef]
  46. Cerrejón, C.; Valeria, O.; Mansuy, N.; Barbé, M.; Fenton, N.J. Predictive Mapping of Bryophyte Richness Patterns in Boreal Forests Using Species Distribution Models and Remote Sensing Data. Ecol. Indic. 2020, 119, 106826. [Google Scholar] [CrossRef]
  47. Kobayashi, S.; Fujita, M.S.; Omura, Y.; Haryadi, D.S.; Muhammad, A.; Irham, M.; Shiodera, S. Evaluating Threatened Bird Occurrence in the Tropics by Using L-Band SAR Remote Sensing Data. Remote Sens. 2023, 15, 947. [Google Scholar] [CrossRef]
  48. Morin, D.; Planells, M.; Guyon, D.; Villard, L.; Mermoz, S.; Bouvet, A.; Thevenon, H.; Dejoux, J.-F.; Le Toan, T.; Dedieu, G. Estimation and Mapping of Forest Structure Parameters from Open Access Satellite Images: Development of a Generic Method with a Study Case on Coniferous Plantation. Remote Sens. 2019, 11, 1275. [Google Scholar] [CrossRef]
  49. Datta, D.; Dey, M.; Ghosh, P.K.; Pal, A.P. Development of a Spatially Explicit Model of Blue Carbon Storages in Tropical Mudflat Environment through Integrated Radar-Optical Approach and Ground-Based Measurements. Ecol. Inform. 2024, 80, 102509. [Google Scholar] [CrossRef]
  50. Huang, H.; Liu, C.; Wang, X. Constructing a Finer-Resolution Forest Height in China Using ICESat/GLAS, Landsat and ALOS PALSAR Data and Height Patterns of Natural Forests and Plantations. Remote Sens. 2019, 11, 1740. [Google Scholar] [CrossRef]
  51. Wessels, K.; Li, X.; Bouvet, A.; Mathieu, R.; Main, R.; Naidoo, L.; Erasmus, B.; Asner, G.P. Quantifying the Sensitivity of L-Band SAR to a Decade of Vegetation Structure Changes in Savannas. Remote Sens. Environ. 2023, 284, 113369. [Google Scholar] [CrossRef]
  52. Zimbres, B.; Rodríguez-Veiga, P.; Shimbo, J.Z.; Da Conceição Bispo, P.; Balzter, H.; Bustamante, M.; Roitman, I.; Haidar, R.; Miranda, S.; Gomes, L.; et al. Mapping the Stock and Spatial Distribution of Aboveground Woody Biomass in the Native Vegetation of the Brazilian Cerrado Biome. For. Ecol. Manag. 2021, 499, 119615. [Google Scholar] [CrossRef]
  53. Wingate, V.R.; Phinn, S.R.; Kuhn, N.; Scarth, P. Estimating Aboveground Woody Biomass Change in Kalahari Woodland: Combining Field, Radar, and Optical Data Sets. Int. J. Remote Sens. 2018, 39, 577–606. [Google Scholar] [CrossRef]
  54. Singh, M.; Friess, D.A.; Vilela, B.; Alban, J.D.T.D.; Monzon, A.K.V.; Veridiano, R.K.A.; Tumaneng, R.D. Spatial Relationships between Above-Ground Biomass and Bird Species Biodiversity in Palawan, Philippines. PLoS ONE 2017, 12, e0186742. [Google Scholar] [CrossRef]
  55. Fagua, J.C.; Jantz, P.; Rodriguez-Buritica, S.; Duncanson, L.; Goetz, S.J. Integrating LiDAR, Multispectral and SAR Data to Estimate and Map Canopy Height in Tropical Forests. Remote Sens. 2019, 11, 2697. [Google Scholar] [CrossRef]
  56. Lehmler, S.; Förster, M.; Frick, A. Modelling Green Volume Using Sentinel-1, -2, PALSAR-2 Satellite Data and Machine Learning for Urban and Semi-Urban Areas in Germany. Environ. Manag. 2023, 72, 657–670. [Google Scholar] [CrossRef]
  57. Endres, A.; Mountrakis, G.; Jin, H.; Zhuang, W.; Manakos, I.; Wiley, J.J.; Beier, C.M. Relative Importance Analysis of Landsat, Waveform LIDAR and PALSAR Inputs for Deciduous Biomass Estimation. Eur. J. Remote Sens. 2016, 49, 795–807. [Google Scholar] [CrossRef]
  58. Attema, E.P.W.; Ulaby, F.T. Vegetation Modeled as a Water Cloud. Radio Sci. 1978, 13, 357–364. [Google Scholar] [CrossRef]
  59. Bouvet, A.; Mermoz, S.; Le Toan, T.; Villard, L.; Mathieu, R.; Naidoo, L.; Asner, G.P. An Above-Ground Biomass Map of African Savannahs and Woodlands at 25 m Resolution Derived from ALOS PALSAR. Remote Sens. Environ. 2018, 206, 156–173. [Google Scholar] [CrossRef]
  60. Kumar, K.; Hari Prasad, K.S.; Arora, M.K. Estimation of Water Cloud Model Vegetation Parameters Using a Genetic Algorithm. Hydrol. Sci. J. 2012, 57, 776–789. [Google Scholar] [CrossRef]
  61. Mulatu, K.A.; Decuyper, M.; Brede, B.; Kooistra, L.; Reiche, J.; Mora, B.; Herold, M. Linking Terrestrial LiDAR Scanner and Conventional Forest Structure Measurements with Multi-Modal Satellite Data. Forests 2019, 10, 291. [Google Scholar] [CrossRef]
  62. Valdez, J.W.; Callaghan, C.T.; Junker, J.; Purvis, A.; Hill, S.L.L.; Pereira, H.M. The Undetectability of Global Biodiversity Trends Using Local Species Richness. Ecography 2023, 2023, e06604. [Google Scholar] [CrossRef]
  63. Geremew, T.; Zewdie, W.; Pellikka, P. Ecosystem Extent Mapping by Integrating Landsat 8, PALSAR-2, and GEDI Lidar. Appl. Geomat. 2023, 15, 61–76. [Google Scholar] [CrossRef]
  64. Morel, A.C.; Saatchi, S.S.; Malhi, Y.; Berry, N.J.; Banin, L.; Burslem, D.; Nilus, R.; Ong, R.C. Estimating Aboveground Biomass in Forest and Oil Palm Plantation in Sabah, Malaysian Borneo Using ALOS PALSAR Data. For. Ecol. Manag. 2011, 262, 1786–1798. [Google Scholar] [CrossRef]
  65. Xie, C.; Shao, Y.; Xu, J.; Wan, Z.; Fang, L. Analysis of ALOS PALSAR InSAR Data for Mapping Water Level Changes in Yellow River Delta Wetlands. Int. J. Remote Sens. 2013, 34, 2047–2056. [Google Scholar] [CrossRef]
  66. Chen, F.; Lin, H.; Zhou, W.; Hong, T.; Wang, G. Surface Deformation Detected by ALOS PALSAR Small Baseline SAR Interferometry over Permafrost Environment of Beiluhe Section, Tibet Plateau, China. Remote Sens. Environ. 2013, 138, 10–18. [Google Scholar] [CrossRef]
  67. Hoekman, D.H. Satellite Radar Observation of Tropical Peat Swamp Forest as a Tool for Hydrological Modelling and Environmental Protection. Aquat. Conserv. 2007, 17, 265–275. [Google Scholar] [CrossRef]
  68. JAXA. Global 25 m Resolution PALSAR-2/PALSAR Mosaic (Ver.2.5.0) Dataset Description; JAXA: Tokyo, Japan, 2024. [Google Scholar]
  69. Hidayat, H.; Teuling, A.J.; Vermeulen, B.; Taufik, M.; Kastner, K.; Geertsema, T.J.; Bol, D.C.C.; Hoekman, D.H.; Haryani, G.S.; Van Lanen, H.A.J.; et al. Hydrology of Inland Tropical Lowlands: The Kapuas and Mahakam Wetlands. Hydrol. Earth Syst. Sci. 2017, 21, 2579–2594. [Google Scholar] [CrossRef]
  70. Xu, W.; Qin, Y.; Xiao, X.; Di, G.; Doughty, R.B.; Zhou, Y.; Zou, Z.; Kong, L.; Niu, Q.; Kou, W. Quantifying Spatial-Temporal Changes of Tea Plantations in Complex Landscapes through Integrative Analyses of Optical and Microwave Imagery. Int. J. Appl. Earth Obs. Geoinf. 2018, 73, 697–711. [Google Scholar] [CrossRef]
  71. Zhen, J.; Mao, D.; Shen, Z.; Zhao, D.; Xu, Y.; Wang, J.; Jia, M.; Wang, Z.; Ren, C. Performance of XGBoost Ensemble Learning Algorithm for Mangrove Species Classification with Multisource Spaceborne Remote Sensing Data. J. Remote Sens. 2024, 4, 0146. [Google Scholar] [CrossRef]
  72. Johnson, B.A.; Xie, Z. Classifying a High Resolution Image of an Urban Area Using Super-Object Information. ISPRS J. Photogramm. Remote Sens. 2013, 83, 40–49. [Google Scholar] [CrossRef]
  73. Ma, L.; Li, M.; Ma, X.; Cheng, L.; Du, P.; Liu, Y. A Review of Supervised Object-Based Land-Cover Image Classification. ISPRS J. Photogramm. Remote Sens. 2017, 130, 277–293. [Google Scholar] [CrossRef]
  74. FAO. Guidelines for Country Reporting to FRA 2010; FAO: Rome, Italy, 2010. [Google Scholar]
  75. Altunel, A.O.; Akturk, E.; Altunel, T. Examining the PALSAR-2 Global Forest/Non-Forest Maps through Turkish Afforestation Practices. Int. J. Remote Sens. 2020, 41, 6071–6088. [Google Scholar] [CrossRef]
  76. Parada Alzate, L.M.; Andramunio Acero, C.P.; López Muñoz, M.T.; Rondón Martínez, Y.F.; Moreno Pérez, L.A. Zonificación de Altos Valores de Conservación (AVC) del Complejo Cenagoso de Zapatosa (Colombia) a partir de una evaluación multicriterio. Investig. Geogr. 2024, 115, e60945. [Google Scholar] [CrossRef]
  77. Lucas, R.; Van De Kerchove, R.; Otero, V.; Lagomasino, D.; Fatoyinbo, L.; Omar, H.; Satyanarayana, B.; Dahdouh-Guebas, F. Structural Characterisation of Mangrove Forests Achieved through Combining Multiple Sources of Remote Sensing Data. Remote Sens. Environ. 2020, 237, 111543. [Google Scholar] [CrossRef]
  78. Zeng, P.; Zhang, W.; Li, Y.; Shi, J.; Wang, Z. Forest Total and Component Above-Ground Biomass (AGB) Estimation through C- and L-Band Polarimetric SAR Data. Forests 2022, 13, 442. [Google Scholar] [CrossRef]
  79. European Space Agency. CCI Biomass Algorithm Theoretical Basis Document Version 4; ESA: Didcot, UK, 2023. [Google Scholar]
  80. Gupta, R.; Sharma, L.K. Mixed Tropical Forests Canopy Height Mapping from Spaceborne LiDAR GEDI and Multisensor Imagery Using Machine Learning Models. Remote Sens. Appl. Soc. Environ. 2022, 27, 100817. [Google Scholar] [CrossRef]
  81. Martins, F.C.; Godinho, S.; Guiomar, N.; Medinas, D.; Rebelo, H.; Segurado, P.; Marques, J.T. Vegetation Canopy Height Shapes Bats’ Occupancy: A Remote Sensing Approach. GISci. Remote Sens. 2024, 61, 2374150. [Google Scholar] [CrossRef]
  82. Morin, D.; Planells, M.; Baghdadi, N.; Bouvet, A.; Fayad, I.; Le Toan, T.; Mermoz, S.; Villard, L. Improving Heterogeneous Forest Height Maps by Integrating GEDI-Based Forest Height Information in a Multi-Sensor Mapping Process. Remote Sens. 2022, 14, 2079. [Google Scholar] [CrossRef]
  83. Scarth, P.; Armston, J.; Lucas, R.; Bunting, P. A Structural Classification of Australian Vegetation Using ICESat/GLAS, ALOS PALSAR, and Landsat Sensor Data. Remote Sens. 2019, 11, 147. [Google Scholar] [CrossRef]
  84. Pandey, P.C. Relationship of Bioclimatic and Topographic Variation on Species-Biomass Distribution in Tropical Forest Reserve. Trop. Ecol. 2024, 65, 677–691. [Google Scholar] [CrossRef]
  85. Qin, Y.; Xiao, X.; Dong, J.; Zhang, G.; Roy, P.S.; Joshi, P.K.; Gilani, H.; Murthy, M.S.R.; Jin, C.; Wang, J.; et al. Mapping Forests in Monsoon Asia with ALOS PALSAR 50-m Mosaic Images and MODIS Imagery in 2010. Sci. Rep. 2016, 6, 20880. [Google Scholar] [CrossRef]
  86. Dong, J.; Xiao, X.; Sheldon, S.; Biradar, C.; Zhang, G.; Dinh Duong, N.; Hazarika, M.; Wikantika, K.; Takeuhci, W.; Moore, B. A 50-m Forest Cover Map in Southeast Asia from ALOS/PALSAR and Its Application on Forest Fragmentation Assessment. PLoS ONE 2014, 9, e85801. [Google Scholar] [CrossRef]
  87. Gaveau, D.L.A.; Sloan, S.; Molidena, E.; Yaen, H.; Sheil, D.; Abram, N.K.; Ancrenaz, M.; Nasi, R.; Quinones, M.; Wielaard, N.; et al. Four Decades of Forest Persistence, Clearance and Logging on Borneo. PLoS ONE 2014, 9, e101654. [Google Scholar] [CrossRef]
  88. Xu, Y.; Yu, L.; Li, W.; Ciais, P.; Cheng, Y.; Gong, P. Annual Oil Palm Plantation Maps in Malaysia and Indonesia from 2001 to 2016. Earth Syst. Sci. Data 2020, 12, 847–867. [Google Scholar] [CrossRef]
  89. Qin, Y.; Xiao, X.; Dong, J.; Zhou, Y.; Wang, J.; Doughty, R.B.; Chen, Y.; Zou, Z.; Moore, B. Annual Dynamics of Forest Areas in South America during 2007–2010 at 50-m Spatial Resolution. Remote Sens. Environ. 2017, 201, 73–87. [Google Scholar] [CrossRef]
  90. Oakes, G.; Hardy, A.; Bunting, P.; Rosenqvist, A. RadWet-L: A Novel Approach for Mapping of Inundation Dynamics of Forested Wetlands Using ALOS-2 PALSAR-2 L-Band Radar Imagery. Remote Sens. 2024, 16, 2078. [Google Scholar] [CrossRef]
  91. Bunting, P.; Rosenqvist, A.; Hilarides, L.; Lucas, R.M.; Thomas, N.; Tadono, T.; Worthington, T.A.; Spalding, M.; Murray, N.J.; Rebelo, L.-M. Global Mangrove Extent Change 1996–2020: Global Mangrove Watch Version 3.0. Remote Sens. 2022, 14, 3657. [Google Scholar] [CrossRef]
  92. Santoro, M.; Cartus, O.; Quegan, S.; Kay, H.; Lucas, R.M.; Araza, A.; Herold, M.; Labrière, N.; Chave, J.; Rosenqvist, Å.; et al. Design and Performance of the Climate Change Initiative Biomass Global Retrieval Algorithm. Sci. Remote Sens. 2024, 10, 100169. [Google Scholar] [CrossRef]
  93. Johnson, B.A.; Mader, A.D.; Dasgupta, R.; Kumar, P. Citizen Science and Invasive Alien Species: An Analysis of Citizen Science Initiatives Using Information and Communications Technology (ICT) to Collect Invasive Alien Species Observations. Glob. Ecol. Conserv. 2020, 21, 00812. [Google Scholar] [CrossRef]
  94. Sargeant, J.M.; O’Connor, A.M. Scoping Reviews, Systematic Reviews, and Meta-Analysis: Applications in Veterinary Medicine. Front. Vet. Sci. 2020, 7, 11. [Google Scholar] [CrossRef]
  95. CBD CBD/COP/16/WG.I/CRP.11. 2024. Available online: https://www.cbd.int/doc/c/53a2/9483/b5a9d4084465052fcca69d94/cop-16-wg1-crp-11-en.pdf (accessed on 7 October 2025).
  96. Intergovernmental Panel on Climate Change. Agriculture, Forestry, and Other Land Use. In 2006 IPCC Guidelines for National Greenhouse Gas Inventories; Institute for Global Environmental Strategies: Hayama, Japan, 2006; Volume 4, ISBN 4-88788-032-4. [Google Scholar]
Figure 1. Differences in how optical, SAR, and lidar remote sensing data are reflected by forest canopies. Source: Tian et al. [14].
Remotesensing 17 03489 g001
Figure 2. Timeline of important events related to L-band SAR satellite data in the 21st century (up to 31 December 2024).
Remotesensing 17 03489 g002
Figure 3. Flow diagram of the literature search and screening process, following the PRISMA guidelines [25].
Remotesensing 17 03489 g003
Figure 4. Publication year of all articles included in our analysis (n = 107).
Remotesensing 17 03489 g004
Figure 5. Percentage of studies that used each image processing approach to monitor biodiversity/ecosystem services from L-band SAR imagery (n = 107).
Remotesensing 17 03489 g005
Figure 6. General procedure for extracting BES information from L-band SAR satellite images using classification and regression approaches.
Remotesensing 17 03489 g006
Figure 7. Percentage of studies that used each type of L-band SAR data (n = 107).
Remotesensing 17 03489 g007
Figure 8. True color image of a mixed landscape containing forests, agricultural lands, and a large river surrounded by bare soil (a). PALSAR-2 mosaic image of the same area, shown as a false color composite (HH image shown in red, HV image shown in green, and HH/HV image shown in blue) (b). Forest and other tree-covered areas can be seen in the left part of the images, agricultural areas can be seen in the right part of the images, and a large river runs horizontally through the center.
Remotesensing 17 03489 g008
Figure 9. Types of other satellite remote sensing data used in combination with L-band SAR data.
Remotesensing 17 03489 g009
Figure 10. Scales at which analyses were conducted using L-band SAR satellite data.
Remotesensing 17 03489 g010
Table 1. Number of national and subnational studies per country, and “global biodiversity ranking” of the country considering the total number of recorded plants, amphibians, birds, fish, mammals, and reptiles (https://worldrainforests.com/03highest_biodiversity.htm, accessed on 16 June 2025). Only countries with three or more studies are shown.
Countries, Ordered by the Number of National/Subnational StudiesGlobal Rank,
Total Species Richness
Number of National/Subnational Studies
1.
China
319
2.
Brazil
112
3.
Indonesia
211
4.
India
89
5.
Colombia
46
6.
USA
104
7.
Mexico
63
8.
Nigeria
363
9.
Russia
593
10.
Australia
73
Disclaimer/Publisher’s Note: The statements, opinions and data contained in all publications are solely those of the individual author(s) and contributor(s) and not of MDPI and/or the editor(s). MDPI and/or the editor(s) disclaim responsibility for any injury to people or property resulting from any ideas, methods, instructions or products referred to in the content.