Article

WRF Simulations of Passive Tracer Transport from Biomass Burning in South America: Sensitivity to PBL Schemes

by
Douglas Lima de Bem
1,2,
Vagner Anabor
1,
Damaris Kirsch Pinheiro
1,
Luiz Angelo Steffenel
2,
Hassan Bencherif
3,
Gabriela Dornelles Bittencourt
4,
Eduardo Landulfo
5 and
Umberto Rizza
6,*
1
Department of Physics, Federal University of Santa Maria (UFSM), Santa Maria 97105-900, Brazil
2
Laboratoire d’Informatique en Calcul Intensif et Image pour la Simulation (LICIIS), Université de Reims Champagne-Ardenne, 51100 Reims, France
3
Laboratoire de l’Atmosphère et des Cyclones, Lacy 8105 CNRS, Université de la Réunion, 97400 Reunion Island, France
4
National Institute for Space Research INPE/COESU, Santa Maria 97105-900, Brazil
5
Nuclear and Energy Research Institute (IPEN), Center for Lasers and Applications (CLA), São Paulo 05508-000, Brazil
6
National Research Council—Institute of Atmospheric Sciences and Climate (CNR-ISAC), 73100 Lecce, Italy
*
Author to whom correspondence should be addressed.
Remote Sens. 2025, 17(20), 3483; https://doi.org/10.3390/rs17203483
Submission received: 27 August 2025 / Revised: 5 October 2025 / Accepted: 17 October 2025 / Published: 19 October 2025

Abstract

Highlights

What are the main findings?
  • This is a single-event case study from 15 to 20 August 2019 on Amazon smoke. Long-range transport to SE Brazil occurred when a persistent 2–4 km lofted layer coexisted for hours with a favorable 700–600 hPa projected flow, opening a corridor for outflow.
  • There is a PBL sensitivity in this case. MYNN 2.5 best matched the observed arrival altitude and timing over MASP, YSU produced thicker yet delayed plumes, and BouLac showed intermittent pulses.
What is the implication of the main finding?
  • There is a two-ingredient diagnostic from this case that can flag long-range smoke outflow risk for operations. The presence of a 2–4 km lofted layer together with favorable 700–600 hPa flow is reported.
  • The evidence remains case-specific. Broader use needs multi-event and multi-season evaluation with additional validation datasets.

Abstract

This single high-impact case study investigates the impact of planetary boundary layer (PBL) representation on long-range transport of Amazon fire smoke that reached the Metropolitan Area of São Paulo (MASP) from 15 to 20 August 2019, using the WRF model to compare three PBL schemes (MYNN 2.5, YSU, and BouLac) and three source-tagged tracers. The simulations are evaluated against MODIS-derived aerosol optical depth (AOD), the Light Detection and Ranging (LiDAR) time–height curtain over MASP, and HYSPLIT forward trajectories. Transport is diagnosed along the source-to-MASP pathway using six-hourly cross-sections and two integrative metrics: the projected mean wind in the 700–600 hPa layer and the vertical moment of tracer mass above the boundary layer. Outflow and downwind impact are strongest when a persistent reservoir between 2 and 4 km coexists with projected winds for several hours. In this episode, MYNN maintains an elevated 2–5 km transport layer and matches the observed arrival time and altitude, YSU yields a denser but delayed column, and BouLac produces discontinuous pulses with reduced coherence over the city. A negatively tilted trough, jet coupling, and a nearly stationary front establish a northwest-to-southeast corridor consistent across model fields, trajectories, and satellite signal. Seasonal robustness should be assessed with multi-event, multi-model analyses.

1. Introduction

The increasing influence of human activities on the global environment has resulted in significant changes in atmospheric chemical composition [1]. As highlighted by [2], aerosols and their distribution within different atmospheric layers, despite being critically important, still represent a significant area of uncertainty when examining climate change and its consequences. This uncertainty is concerning because aerosols play a pivotal role in cloud microphysics, meaning that variations in their quantity can markedly affect cloud formation. Furthermore, changes in aerosol composition can modify the optical properties of clouds, which have repercussions for precipitation patterns [3]. Estimates have indicated that human activities may have led to a 5% increase in cloud cover and a 6% increase in cloud field albedo, associated with higher aerosol concentrations in the atmosphere. One outcome is the enhanced reflectivity of clouds, driven by an elevated droplet count. This observation is consistent with findings showing that the aerosol optical depth (AOD) in the stratospheric aerosol layer, between 20 and 30 km altitude, has been rising by 4% to 10% annually since 2000 [4].
In South America, forest fires and agricultural burning, especially during the austral winter, constitute significant sources of these carbonaceous aerosols. In Brazil, the region known as the “Arc of Deforestation” frequently records these events, whose gases and particles are transported by atmospheric currents to other regions and even distant continents. Specific studies on smoke transport in the Amazon are still limited. Ref. [5] investigated the extreme event of August 2019, when smoke from Amazon fires reached MASP, using a multi-instrumental approach with data from MODIS, IASI, AERONET, and LiDAR and a Lagrangian model (FLEXPART) to track aerosol and CO transport, showing strong coherence between simulations and observations. Ref. [6] developed a climatology of smoke plume heights in the Amazon based on MISR, MODIS, and CALIOP data, finding that most plumes remained below 2.5 km, with few reaching the free troposphere. The SAMBBA campaign also validated global models using aircraft, satellite, and surface measurements, demonstrating that models such as GLOMAP frequently underestimate aerosol concentrations in certain regions [7,8]. However, studies specifically using the Weather Research and Forecasting (WRF) model with detailed comparisons among different PBL schemes integrated with remote observations remain scarce in the Amazon region, highlighting the originality and relevance of this study.
To understand these processes, the use of atmospheric numerical models such as WRF is essential. Particularly important is the correct representation of the PBL, a region characterized by intense mixing processes and turbulent transport directly influenced by surface interactions. Studies have shown that PBL parameterization directly influences atmospheric aerosol transport simulations. For example, Ref. [9] indicates that Yonsei University (YSU) and ACM2 schemes tend to reduce biases in pollutant simulations due to better representation of vertical transport and entrainment. Other studies have also attempted to evaluate the impact of the type of PBL scheme on pollutant transport. For instance, Ref. [10] compared four PBL schemes in the WRF model (YSU, ACM2, MYJ, and BouLac) to assess their performance in simulating meteorological variables and pollutants, indicating that ACM2 showed the best bias. Focusing on the Amazon region, Ref. [11] evaluated eight PBL schemes in the WRF model, comparing them with observations from the GoAmazon2014/5 campaign, and found that non-local schemes performed better in 2014, while the local MYNN2.5 scheme provided the best prediction of the PBL height (PBLH), especially at night. Ref. [12] developed a new forecasting system using WRF-Chem [13] to model the dispersion of forest fire smoke from the Amazon over South America, with 48 h simulations during August and September in 2018 and 2019, showing good accuracy in predicting CO. However, there are still a few studies that evaluate the sensitivity of PBL schemes on pollutant transport in the Amazon region, highlighting the need for further investigation.
To evaluate the performance of these schemes under real conditions, it is essential to compare the model with independent observations. In regions such as South America, where surface monitoring stations are scarce or absent, remote sensing techniques become crucial for validating and calibrating numerical model results. Data from satellites and LiDAR systems have been widely employed to address this gap, allowing robust evaluations of aerosol transport and physical and optical characteristics. Studies such as Ref. [14] employed an enhanced aerosol-retrieval algorithm applied to MODIS data to quantify aerosol pollution associated with the extreme Amazon wildfires between July and September 2019. In the same sense, Ref. [15] combined aircraft, surface, and satellite observations within a global aerosol model driven by multiple emission inventories (FINN, GFED, and QFED). The authors show that the model underestimates aerosol optical depth (AOD) by a factor of 2–5 in the regions most affected by fires. These findings underscore the central role of satellite-derived products in characterizing wildfire events and, in this context, highlight the contribution of LiDAR, which, owing to its high vertical resolution, enables detailed validation of simulated vertical profiles, something often unattainable with conventional surface measurements [16,17]. In this study, it was employed to detect the arrival of particulate matter since no measurements were available during the day of the event itself.
In this context, the WRF model is applied to the single extreme smoke episode of 15–20 August 2019, used as a natural laboratory to examine how three widely used PBL parameterizations, Mellor–Yamada–Nakanishi–Niino (MYNN 2.5), Yonsei University (YSU), and Bougeault–Lacarrère (BouLac), modulate the pathway and timing of biomass-burning aerosol transport over South America. To represent upwind emission sources while avoiding chemical and microphysical feedbacks, we employ source-tagged passive tracers that carry no chemical, radiative, or cloud-microphysical properties and, therefore, do not feedback on the flow. This design aims to isolate the PBL’s dynamical control on outflow altitude, timing, and pathway. Model output is evaluated against independent remote-sensing observations, with emphasis on multi-wavelength LiDAR profiles over the MASP that resolve the plume’s vertical structure. The analysis quantifies scheme-dependent differences in trajectory, arrival time, and vertical distribution for this episode and lays out a reproducible observation–model workflow (MODIS AOD, LiDAR, and HYSPLIT trajectories) that can be reused in future case studies. This is a single high-impact case study conducted during the dry season, where results are framed at the process level and are not intended to be generalized beyond this episode.

2. Materials and Methods

For ease of reading Section 2, Figure 1 presents a schematic of the experimental design. The diagram lays out the inputs (ERA5, FIRMS, MODIS AOD, IPEN LiDAR, and GFS), the WRF experiment (PBL schemes and passive source-tagged tracers), the diagnostics, and the validation steps.

2.1. Description of Event

It is known that from June to September, referred to as the dry season, fires occur primarily in the central region of South America due to the dry weather and agricultural activities taking place there. On 19 August 2019, a high concentration of particulates from biomass burning was transported across the southeastern region, reaching MASP. Based on previous studies, these particulates are composed of approximately 50–60% organic carbon (OC) and about 5–10% black carbon (BC) [18]. These particles served as cloud condensation nuclei (CCN) [19], aiding in the development of cloudiness over the city. Due to the high concentration of OC and the possibility of contribution to the absorption of solar radiation [20], a darkening of the sky was observed in the afternoon. Such an event can be associated with the impact of aerosols on radiation and cloud microphysics [21,22].
Figure 2 displays the daily aerosol optical depth at 550 nm (AOD) from the MODIS sensor aboard NASA’s Terra and Aqua satellites. We use Collection 6.1 Level-3 daily 1 × 1 products (MOD08_D3 and MYD08_D3), variable “Deep Blue Aerosol Optical Depth 550 Land Mean”, accessed via Giovanni [23]. Terra and Aqua fields are combined by averaging valid retrievals in each grid cell/day, and no additional Quality Control (QC) was applied beyond the native MODIS cloud screening and aggregation [24]. Because this variable is land-only, ocean pixels are masked, and blank areas denote cloud-induced sampling gaps. Between 17 and 20 August 2019 (Figure 2a–d), an intense smoke-transport episode is evident: on 17 August (Figure 2a), the largest AOD values (>1.0) were confined to central South American source regions. During the following days, the plume progressed rapidly southeastward, ultimately reaching the MASP region.
This persistent zonal transport likely reflects the influence of low and mid-level winds, which will be discussed later. By 20 August (Figure 2d), AOD values remained elevated, with cores above 1.0, indicating the accumulation of particles and potential degradation of air quality in the densely populated area of MASP. The persistence and spatial extent of the event reflect the influence of stable atmospheric conditions. According to data from CETESB (Environmental Agency of the State of São Paulo), concentrations of fine particulate matter ( P M 2.5 ) reached significantly elevated levels at various monitoring stations. Studies such as [12] indicate that P M 2.5 levels increased during 17 and 18 August, reaching values of up to 60 μg m−3, nearly three times higher than the daily limit recommended by the World Health Organization (WHO). This increase in particulate matter contributed to the occurrence of an anomalous darkening of the sky during the afternoon as smoke-laden clouds associated with a cold front moved over the region.
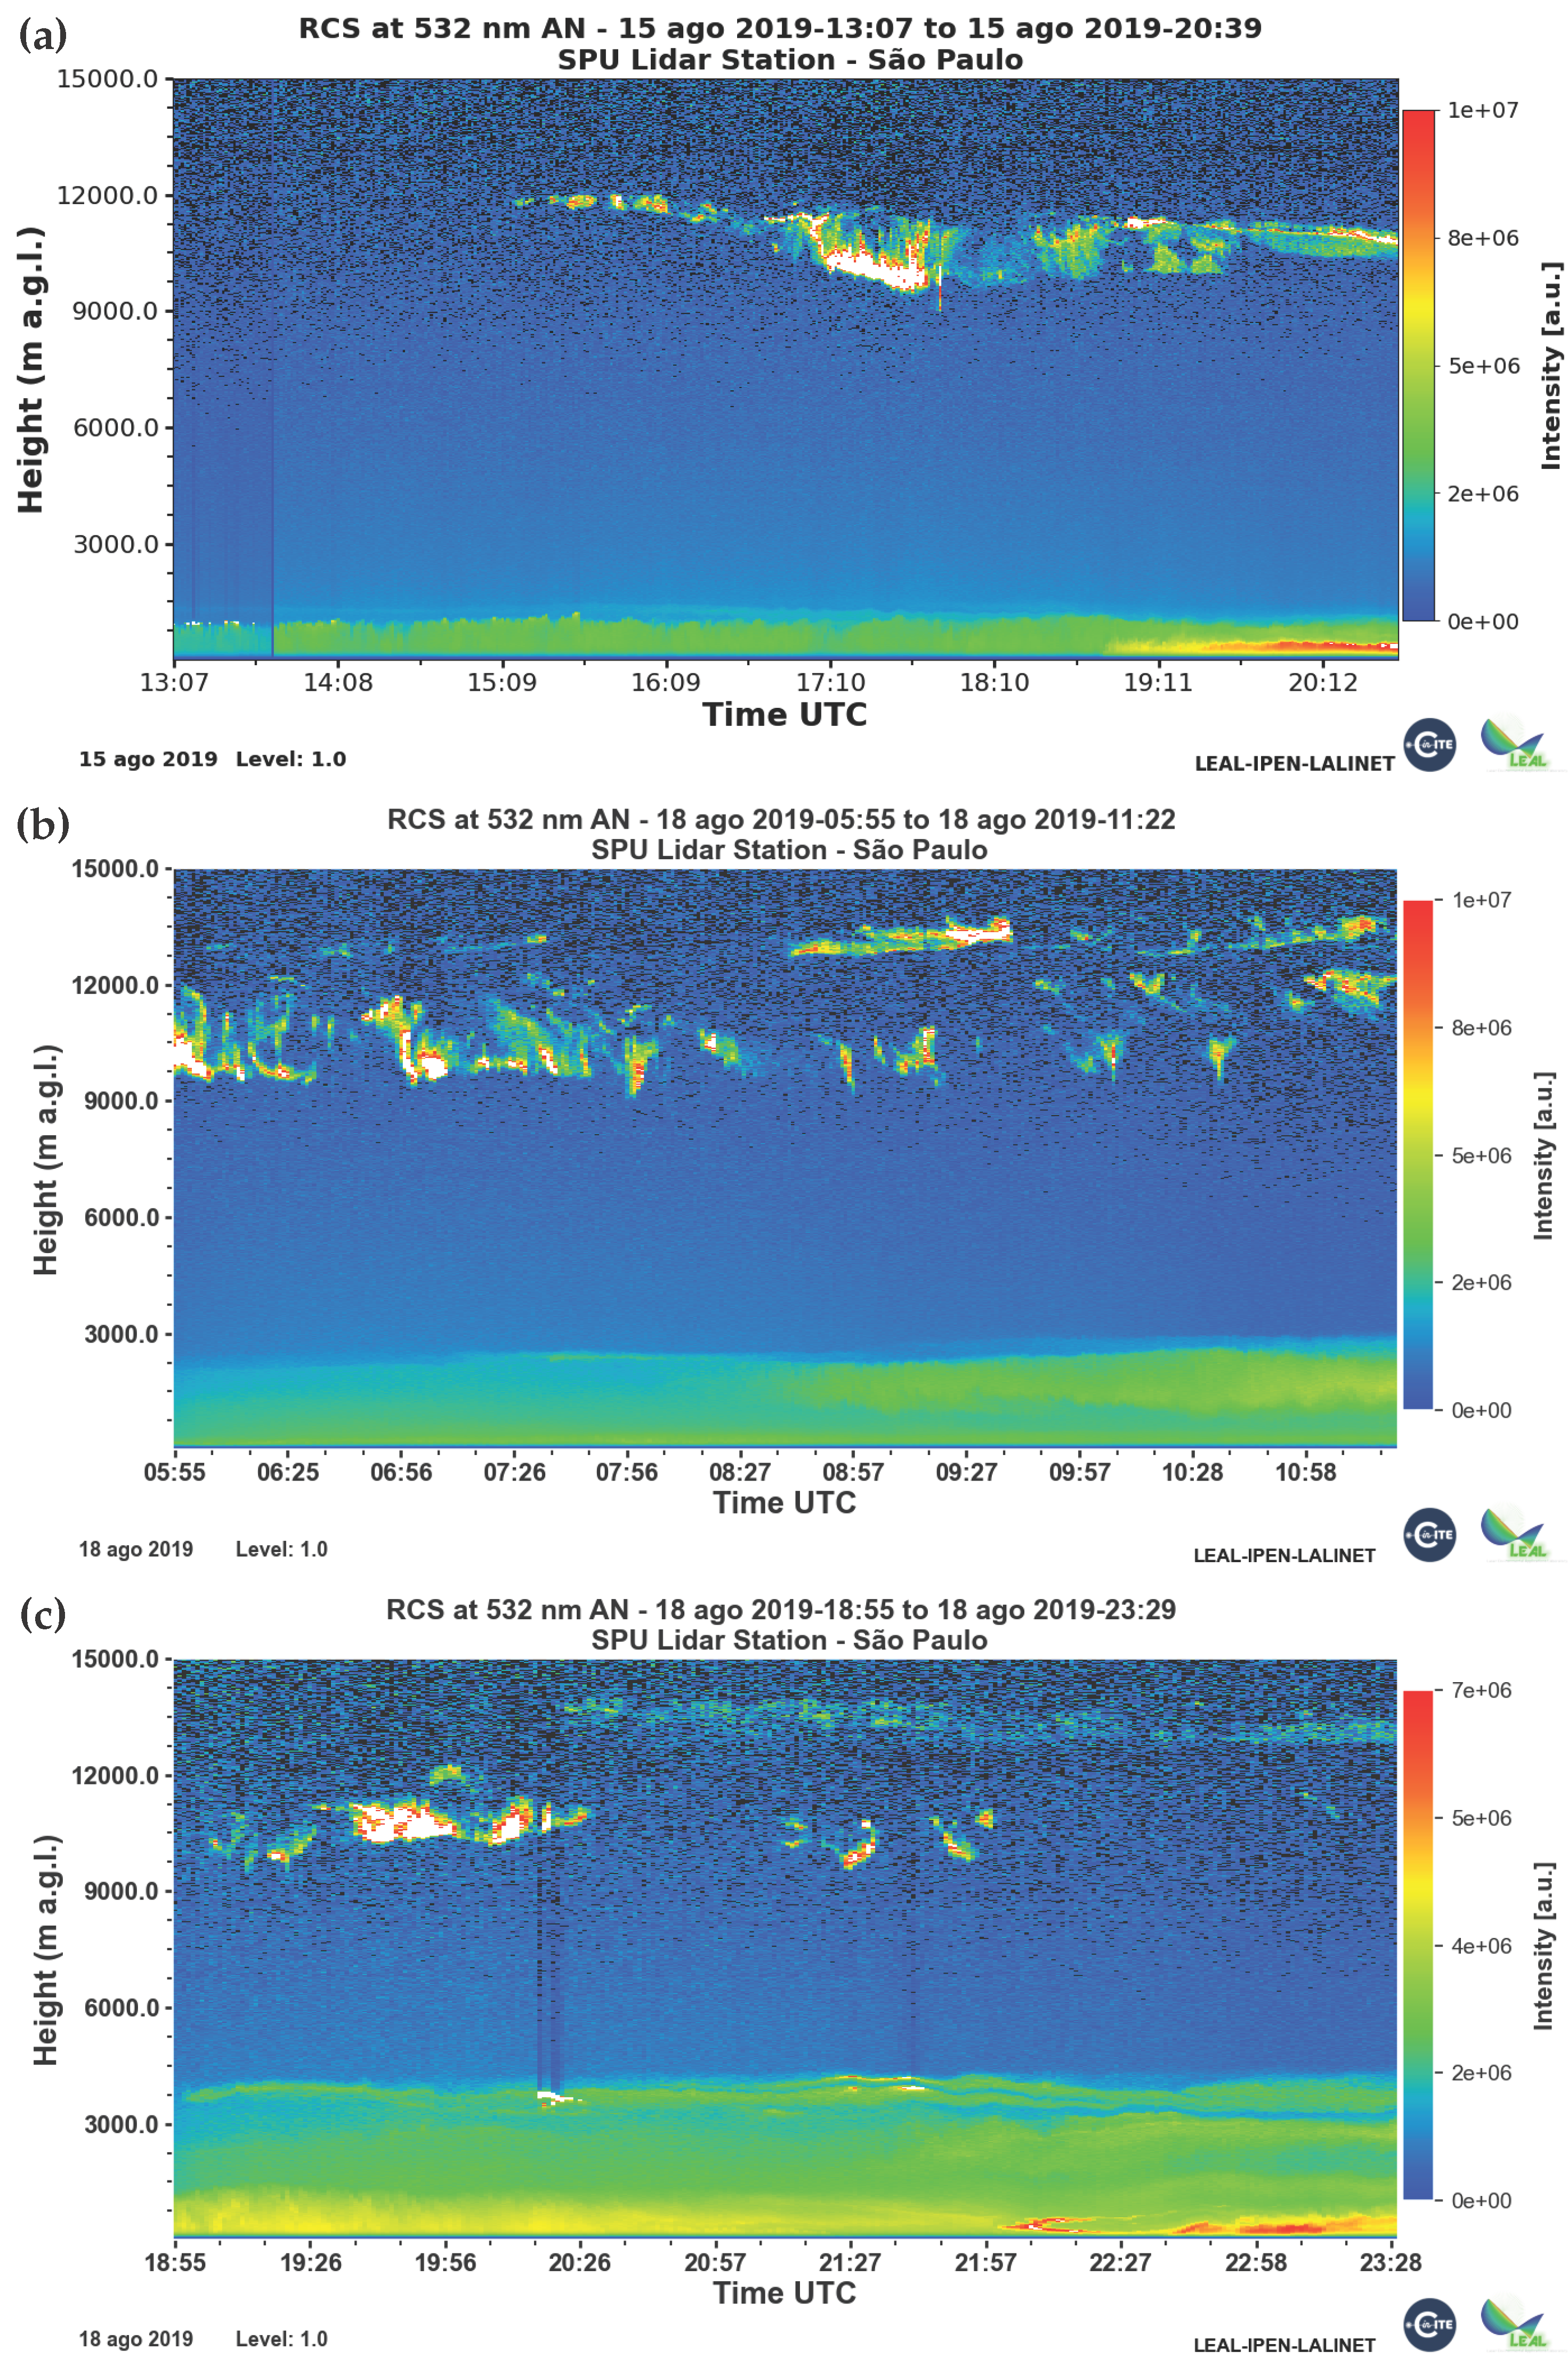
To observe, in a localized manner, the conditions over the MASP, the Light Detection and Ranging (LiDAR) system operated by the Nuclear and Energy Research Institute (IPEN) provides a clear depiction of the arrival of particulate matter. This setup is a single-wavelength backscatter system in coaxial mode, oriented vertically toward the zenith [25]. Studies such as [25,26] present all the technical characteristics of this fundamental instrument for the observation and analysis of particulates throughout the atmosphere. For meteorological reasons, LiDAR observations recorded on 18 August are isolated, with no measurements available during the event. The data reveal a substantial atmospheric transition between 15 and 18 August 2019, as seen in Figure 3, which can be associated with the influx of particulate matter originating from Amazonian wildfires. On 15 August, the backscatter signal in the lower troposphere remained weak and homogeneous, with the mixed-layer height reaching afternoon values below 2 km (1.5–1.8 km), characterizing a relatively clean atmosphere. In contrast, on 18 August, there was a marked intensification of backscatter below 3 km. In the morning, PBLH (0.6–0.9 km) rose to 2.0 km and was overlaid by a persistent residual layer that at times exceeded 3 km. The persistence of this residual layer and the generalized increase in signal in the lower troposphere are consistent with the arrival, dispersion, and subsequent confinement of long-range transported aerosol plumes. This interpretation is supported by the AOD fields shown in Figure 2. The spatiotemporal agreement between the AOD evolution and the vertical structure observed by the LiDAR supports the interpretation that the event represented a case of Amazonian smoke transport reaching MASP.

2.2. Model Setup

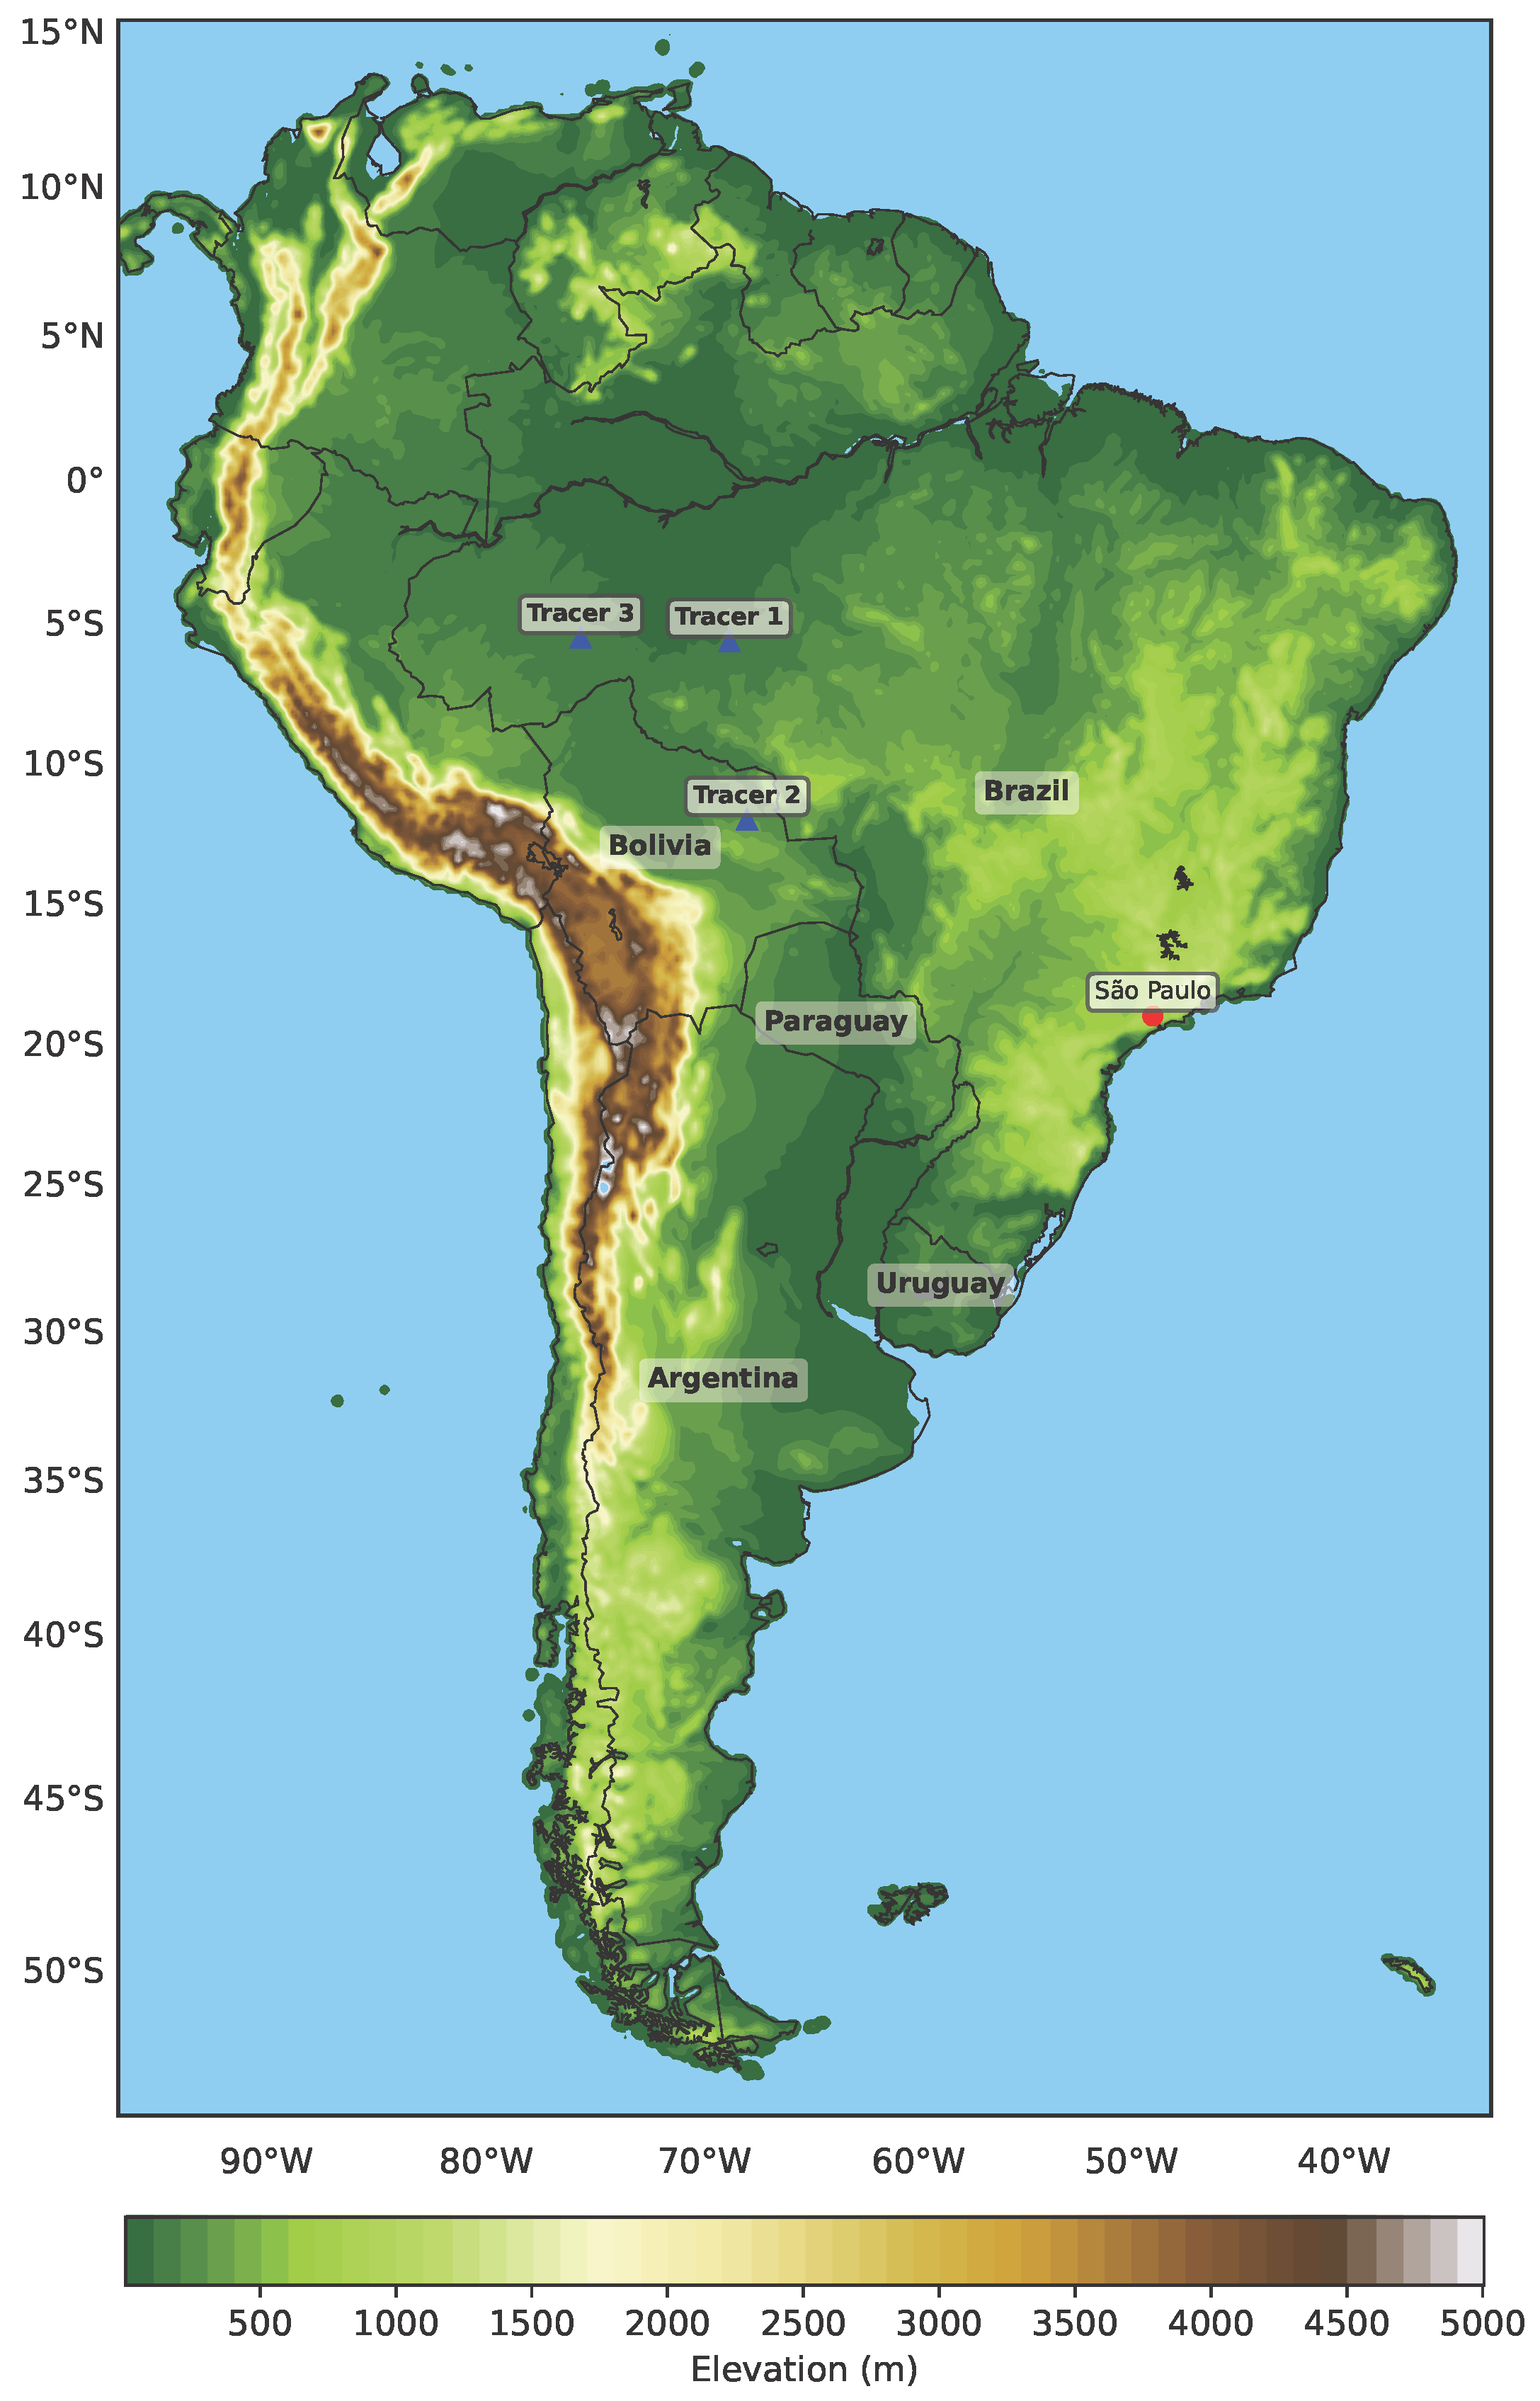
For this study, the numerical model Weather Research and Forecasting (WRF) version 4.3.3 was employed [27]. It can be described as an atmospheric numerical model developed for both research purposes (ARW—Advanced Research WRF) and operational applications (NMM—Non-hydrostatic Mesoscale Model) [28]. The model was developed through a collaborative partnership primarily among the National Center for Atmospheric Research (NCAR), the National Oceanic and Atmospheric Administration (NOAA), and various academic institutions. In this case, the ARW model is being utilized. The WRF-ARW model offers a versatile simulation framework across multiple scales, facilitating effective parallel computing. It encompasses a broad spectrum of physical parametrizations that can be adjusted to accommodate various scales and dynamic processes, where these variables interact both with the resolved scale and with each other. For this work, a simulation of a single-grid event with a resolution of 15 km as depicted in Figure 4 was used, implementing 51 vertical levels. Initial and boundary data were obtained from ERA5 reanalysis fields [29,30] with a horizontal resolution of 0.25° × 0.25°, hourly intervals, and 37 isobaric levels.
The simulation started at 00 UTC on August 15, preceding the event, and ended at 00 UTC on 20 August. This preliminary period was chosen due to the occurrence of fire outbreaks between 15 and 17 August. Due to our 15 km grid spacing being non-convection-permitting, we retain a cumulus parameterization and adopt scale-appropriate, widely used physics options, robustly documented in prior studies [31,32,33,34], as detailed in Table 1. A detailed intercomparison of these schemes is outside the scope here in which only the PBL scheme is varied, with all other physics kept fixed.

Trajectory Analysis with HYSPLIT

As an independent verification, NOAA’s HYSPLIT Lagrangian model (Hybrid Single-Particle Lagrangian Integrated Trajectory [35]) was used, widely applied to compute particle trajectories and dispersion from analyzed meteorological fields [36,37]. Forward trajectories were driven by NCEP GFS 0.25° global meteorology (3-hourly analyses) and computed with the model-vertical motion option. For each tracer source, we released an eight-member, hourly-staggered ensemble with departures at 1000 m and 4000 m AGL, integrating each set for 72 h. Because HYSPLIT is kinematic, trajectory placement is sensitive to uncertainties in the driving winds and the vertical-motion specification. To target the outflow phase diagnosed in our WRF fields, releases were scheduled between 16 and 19 August 2019 (00:00 UTC), which fully spanned the NW–SE transport corridor culminating on 18–19 August. This timing avoids trajectories dominated by the locally confined flow on 15 August while remaining within the WRF simulation window.

2.3. PBL Schemes

As previously reported, this study utilizes three distinct planetary boundary layer (PBL) schemes. The Mellor–Yamada Nakanishi Niino (MYNN) Level 2.5 scheme [38] is classified as a local scheme of order 1.5, employing a prognostic equation of order 2.5 to resolve Turbulent Kinetic Energy (TKE). It represents an evolution of traditional Mellor–Yamada schemes [39,40], particularly under strongly stable or nocturnal conditions. Due to its local nature, it struggles to represent large-scale transport at the top of the PBL accurately. This can be observed in cases where the use of this scheme leads to an underestimation of diffusivity representation under highly convective conditions. Similar to MYNN, the local Bougeault–Lacarrere (BouLac) scheme, developed to parameterize turbulence induced by topography in meso-beta scale models [41], employs a prognostic equation for TKE. However, it features different formulations for the production, dissipation, and diffusion terms. This scheme provides a good representation of the turbulent profile over complex surfaces while maintaining local control of diffusion, making it suitable for use under stable PBL conditions. Due to its local closure, an underestimation of mixing throughout the layer can be observed in cases of strongly convective conditions. On the other hand, the Yonsei University Scheme (YSU) [34] is a non-local closure scheme based on the Medium-Range Forecast (MRF) scheme [42], with improvements in entrainment at the top of the PBL. This scheme includes a counter-gradient term that enhances the representation of convective mixing more robustly. It performs well under convective daytime conditions as its non-local characteristic favors the representation of large eddies that transport heat, moisture, and momentum throughout the boundary layer. Consequently, it is widely used in operational forecasting and research studies. Due to its non-local representation, a tendency to overestimate the boundary layer height can be observed in some situations due to excessive vertical mixing.
Since this study aims to analyze the behavior of passive tracer transport, i.e, particles that do not interact with radiation and microphysics processes, it is essential to understand how each PBL scheme represents the turbulent diffusion coefficient (K) [43]. This term controls the intensity of turbulent transport of momentum, heat, and moisture throughout the boundary layer. In local schemes (MYNN and BouLac), the diffusivity term is represented by
K = l T K E
This formulation arises from the fact that the turbulent diffusion coefficient K directly depends on the TKE and a diagnostic mixing length, l. In these cases, diffusivity tends to be more “restricted” vertically as each vertical level “resolves” turbulent transport based on the local TKE and stability conditions. The diffusivity at each level is calculated solely from the variables at that level. Conversely, in the YSU scheme, diffusivity follows a non-local profile that varies with height. In a convective boundary layer, the value of K can be significantly enhanced across the entire PBL depth to represent large eddies.
These schemes are widely recognized in the academic community, with numerous sensitivity studies using the WRF model to evaluate each scheme under different conditions and events. Ref. [44] observed the efficiency of the YSU scheme in representing surface variables, with a focus on temperature and relative humidity at 2 m. Meanwhile, Ref. [45] conducted a study to assess the impact of various PBL schemes on PM2.5 transport in the Indo-Gangetic Plain region, indicating that, in this case, the MYNN scheme produced better results.

2.3.1. Model Modifications

In the present study, the introduction of three plumes originating from previously identified fire sources was conducted prior to the event day. These plumes are implemented as passive tracers, which, in the case of WRF, lack physical properties to interact with atmospheric compounds and do not influence environmental parameters. The transport of these tracers will be carried out using wind representation models in conjunction with turbulent transport occurring within the planetary boundary layer (PBL). Furthermore, passive tracers in WRF are subjected to the same forcing as scalar variables present in the model, such as water vapor mixing ratio, cloud vapor mixing ratio, among others. These tracers are initially implemented as a single source in module_initialize_real.F, which contains information for initializing the tracers at the beginning of the simulation in real.exe. For continuity during the simulation, their location needs to be implemented in solve_em.F. They must be input in Registry.EM for the creation of output variables. The implementation was carried out based on the approach presented in [46]. However, numerous studies utilize tracers to assess the propagation of particles throughout the atmosphere. For instance, Ref. [47] employs passive tracers to understand atmospheric behavior during stable periods, while Ref. [48] implements tracers to investigate pollutant propagation and dispersion in the atmosphere using high-resolution simulations. Additionally, studies such as [49,50,51] offer relevant insights employing the same technique. This design intentionally omits chemistry and aerosol–radiation/cloud-microphysics coupling so that tracer evolution responds only to resolved winds and parameterized turbulent mixing.

2.3.2. Passive Tracer’s Position Using FIRMS Data

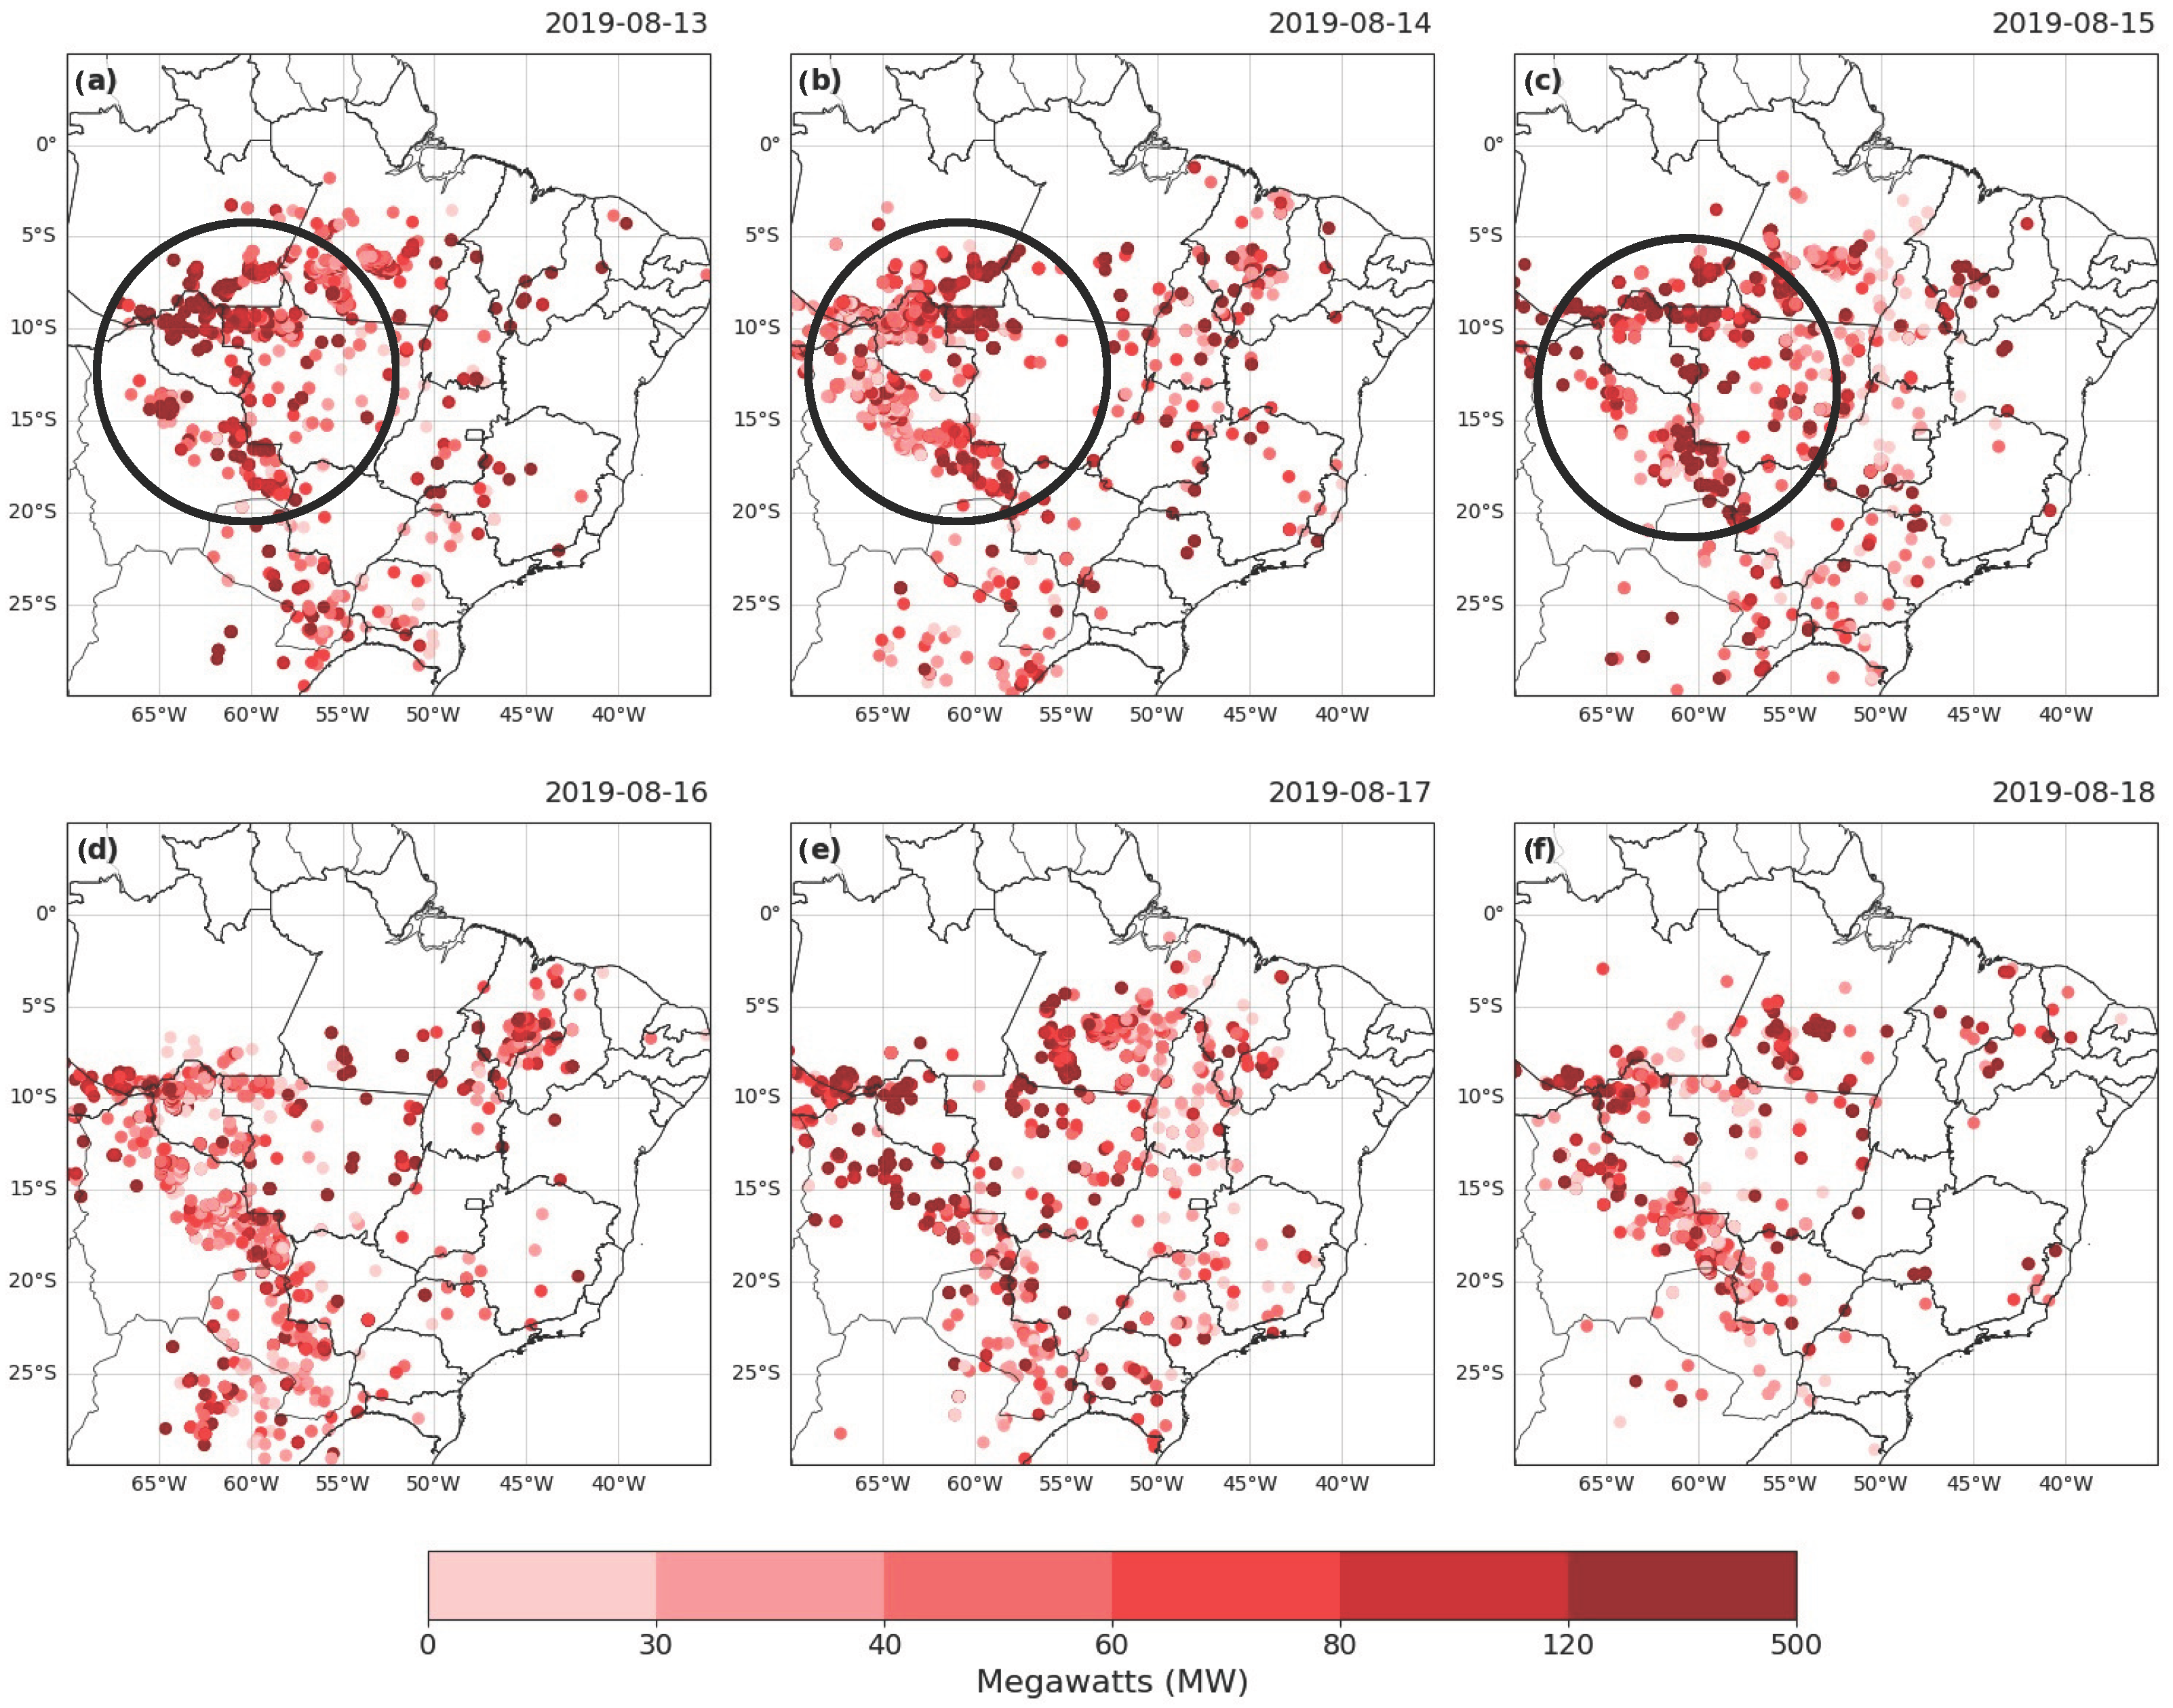
For the selection of the locations where the tracers would be positioned, the NASA’s Fire Information for Resource Management System (FIRMS) was used, which distributes Near Real-Time (NRT) active fire data within 3 h of satellite observation from both the Moderate Resolution Imaging Spectroradiometer (MODIS) and the Visible Infrared Imaging Radiometer Suite (VIIRS) [52]. The NRT consists of thermal anomalies, or hot-spots, identified as a satellite passes overhead. The data are available on the FIRMS Global platform [53], developed by the University of Maryland with funding from the NASA Applied Sciences section to provide wildfire data to firefighters and support staff worldwide. This platform is part of NASA’s Land, Atmosphere Near real-time Capability for EOS [54]. For this work, only data from the MODIS satellite were used to identify fire hotspots for the days prior to the event in question. These data are presented in Figure 5.
It can be observed that, during the first three days presented in Figure 5a–c, there was a high Fire Radiative Power (FRP) reaching values close to 500 MW, especially within the circled area. Additionally, southern Bolivia exhibited FRP values of 400–500 MW, indicating intense fire activity. During 16–18 August, the persistence of FRP above 400 MW suggests the maintenance of these large-scale fires. Studies such as [5] reported enhanced biomass burning in August, during the dry season over the central-western continent. As previously observed, these fire hotspots led to high particulate loads, corroborating the AOD values on previous days (Figure 2). To objectively identify the most active hotspots, we aggregated FIRMS detections with a confidence > 80 % on a 0 . 5 grid over a 5-day window W. For each grid cell g, we computed the FRP sum
F R P sum ( g ) = k D ( g , W ) F R P k ,
and defined a joint activity score that combines FRP and detection count via standardized terms:
S ( g ) = z log ( 1 + F R P sum ( g ) ) + z count ( g ) .
Cells in the upper decile of S ( g ) were labeled as hotspots. The hotspot centroids are shown in Supplementary Figure S1. Based on this procedure, three hotspots from the days preceding the event were selected that are shown in Table 2 list their latitudes and longitudes, and they are represented in Figure 4.

3. Results

3.1. Synoptic Conditions During the Event

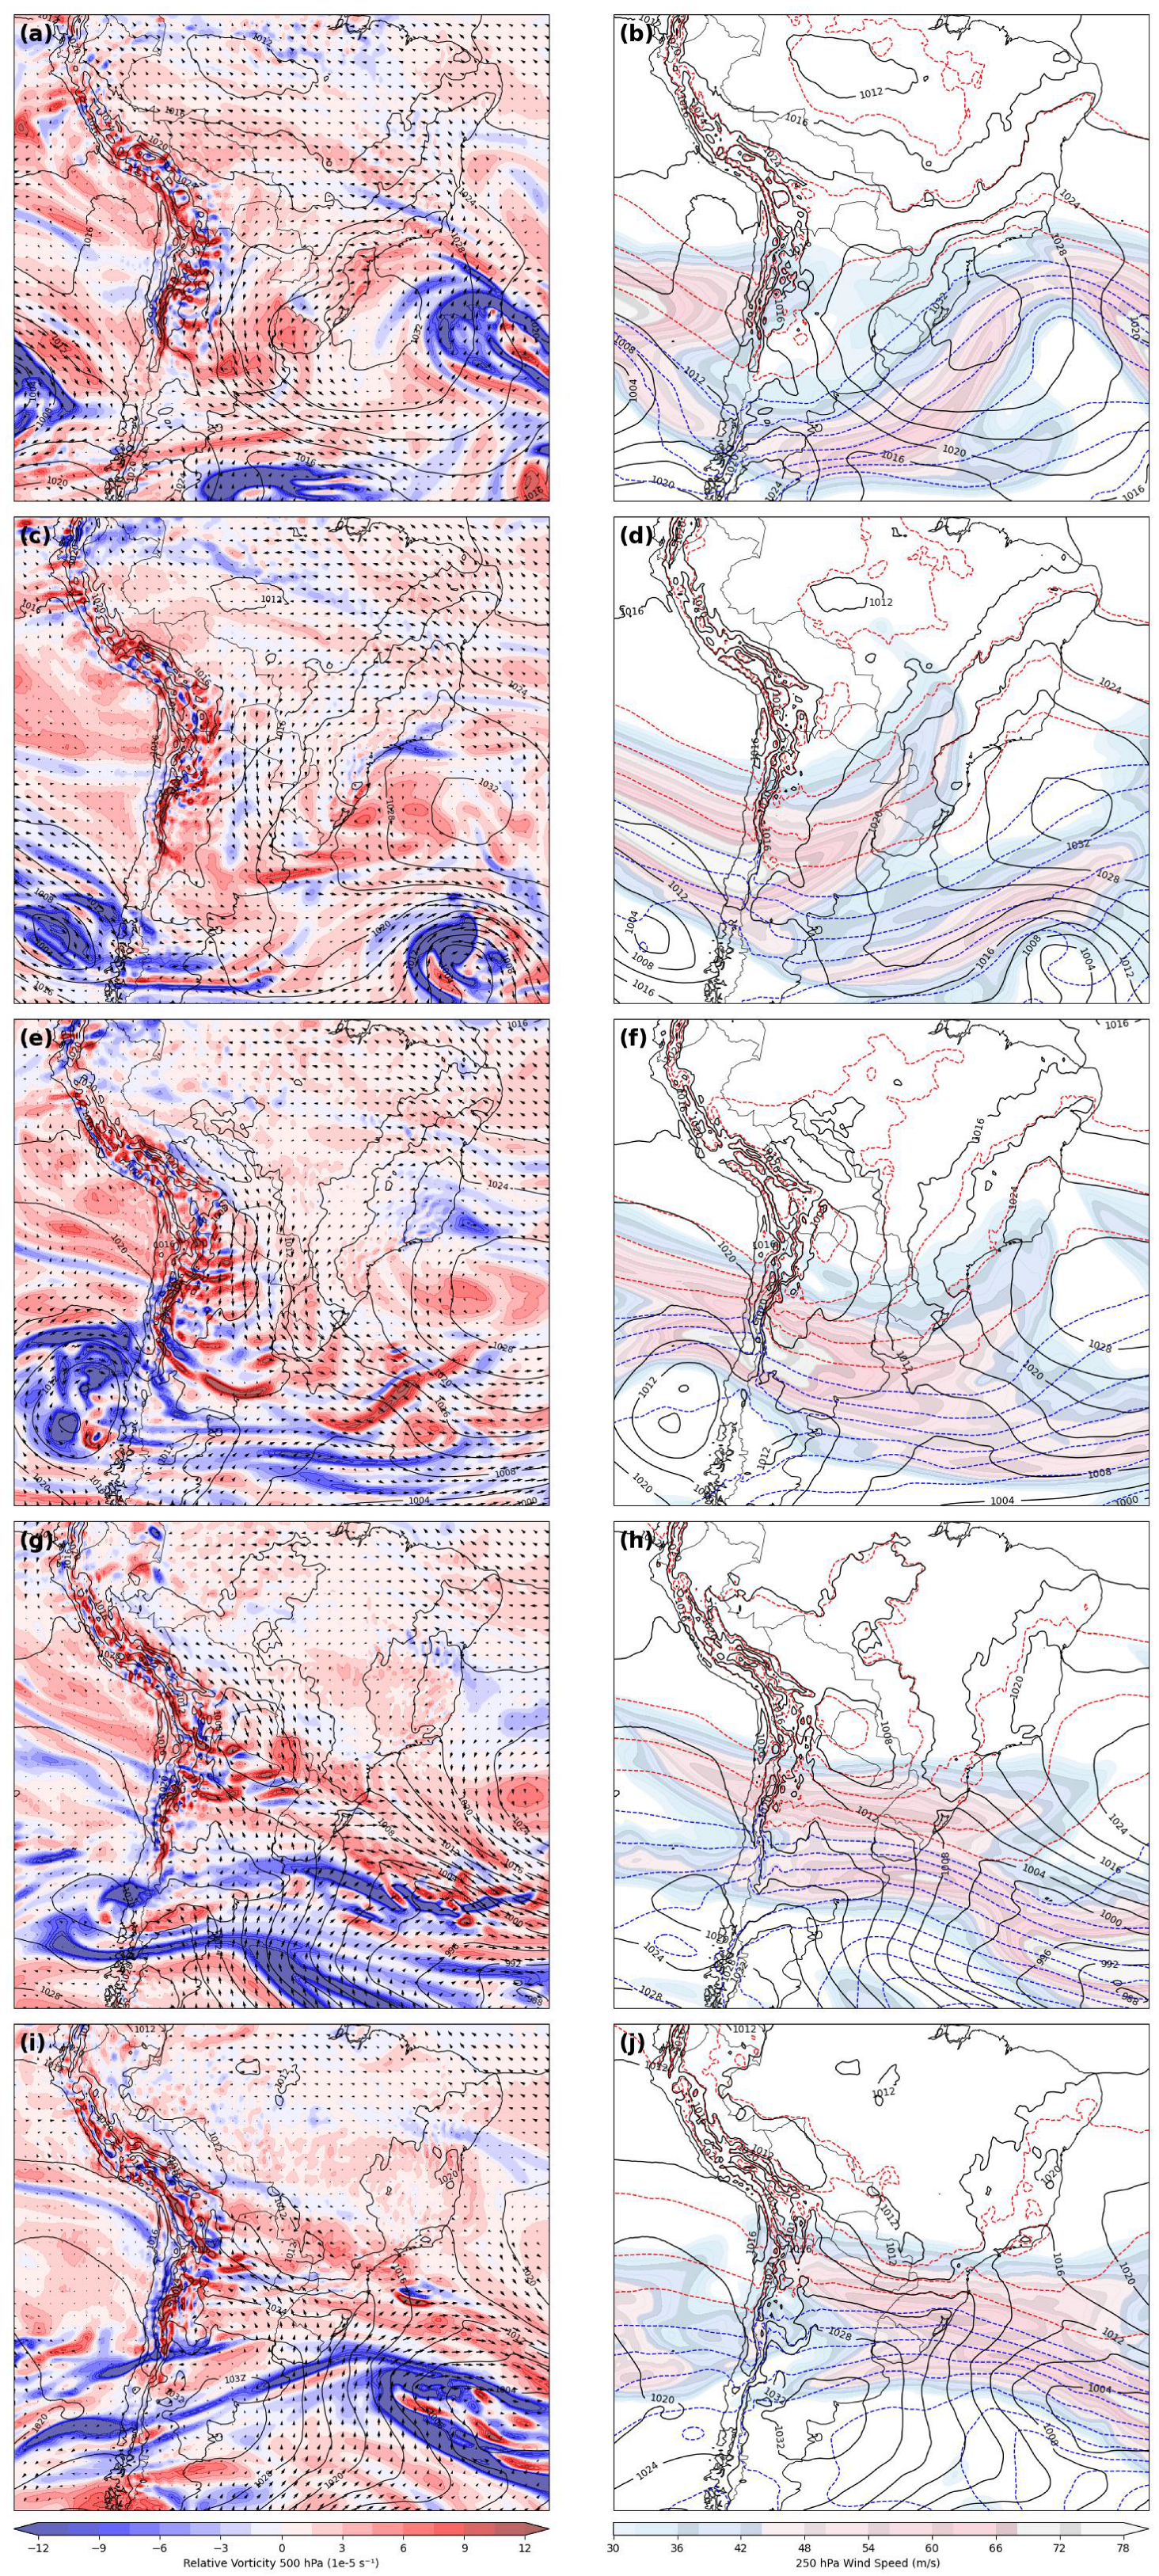
Synoptic systems typically develop over a few days, making time intervals of 12 to 24 h adequate to capture the progression of atmospheric processes on this timescale in the sequence (Figure 6a–j).
During the initial stage analyzed, a trough advances over the Pacific, redirecting the zonal flow and uplifting the column of cyclonic vorticity over the Central Andes (Figure 6a, shading). To the northeast, the subtropical ridge over the South Atlantic narrows the pressure gradient and organizes the Low-Level Jet (LLJ) at the Amazon exit: meridional winds at 850 hPa channel heat and moisture southward (Figure 6a, arrows), leading to a high precipitable water content in the warm sector [55]. Thickness values over southern and southeastern Brazil reveal warm and relatively dry air, while a weak cold front marks only slight thermal shear over the southern portion of the domain (Figure 6b, red dashed isolines). The overall circulation hints at latent baroclinicity to be tapped by the approaching trough in the following hours.
As the trough crosses the Andes on August 16, a lee cyclogenesis process begins: the surface low starts to deepen over regions of Argentina (Figure 6c, SLP). Aloft, the left exit region of the polar jet (250 hPa) aligns over Central Chile, enhancing upper-level divergence (Figure 6d, jet speed shading), which, combined with LLJ convergence over the La Plata basin, completes the classical dynamic coupling known as “baroclinic efficiency,” as discussed by [56]. Warm air advection in the 700–850 hPa layer intensifies in the pre-frontal zone, evidenced by strengthening 850 hPa flow ahead of the front (Figure 6c, arrows) and by thicker 1000–500 hPa bands encroaching the subtropics (Figure 6d, red dashed), while cold air driven by a Pacific anticyclone begins to intrude southwest of the trough (Figure 6c,d). The frontal boundary becomes more defined baroclinically, though it has not yet progressed into subtropical latitudes.
On 17 August, the trough acquires a NW–SE negative tilt, a configuration that accelerates baroclinic conversion and injects cyclonic vorticity over Uruguay (Figure 6e, shading). The coastal cyclone deepens as thickness isolines tighten between northern Argentina and western Brazil (Figure 6f). Southwesterly winds at 850 hPa advance through the La Plata basin (Figure 6e, arrow). The cold front sweeps across southeastern Brazil a few hours later, triggering pre-frontal convection, stronger wind gusts, and a temperature drop. In the warm sector, the LLJ continues to supply moisture, sustaining the potential for thunderstorms over Paraguay and western Brazil, which is frequent in cases involving deep troughs.
The following day, the system reaches its peak intensity, embedded in a strongly occluded structure, with the 500 hPa vorticity maximum “wrapped” around the center (Figure 6g). A branch of the upper-level jet displays cyclonic curvature (Figure 6h), providing persistent divergence and maintaining low pressure despite thermodynamic filling. At low levels, southwesterly winds cross the Argentine interior (Figure 6g), while decreasing thickness marks the intrusion of continental polar air. The anticyclone over the South Pacific sets up a zonal blocking pattern that helps funnel cold air into the continent’s interior (Figure 6h).
Finally, on 19 August, as the cyclone shifts southeastward and gradually fills, high pressure settles over northwestern Argentina, establishing a maritime southeasterly wind in its wake (Figure 6i, SLP + arrows). The cold front becomes quasi-stationary along the southeastern Brazilian coast and southern Amazonia (Figure 6i,j). North of the boundary, a residual LLJ persists at 850 hPa, setting an “S-shaped corridor” with cold/moist air surges from the SE below, while warm/moist air continues NW–SE aloft (Figure 6j, jet/thickness). Overall, this sequence characterizes a typical austral-winter baroclinic cycle, with coherent coupling between upper-level dynamics, the low-level jet (LLJ), and the evolution of the surface low.

3.2. Daily Transport of Tracers

As an initial analysis of the tracers, the total column of each tracer was calculated for each simulation in order to observe the dispersion of these particulates throughout the domain. During the first two days, 15 and 16 August, as observed in Figures S1 and S2, respectively, the tracers remained confined near the source region, initially exhibiting relatively weak northward transport across all three tracers, with a similar configuration among the different simulations, indicating no significantly visible impacts.
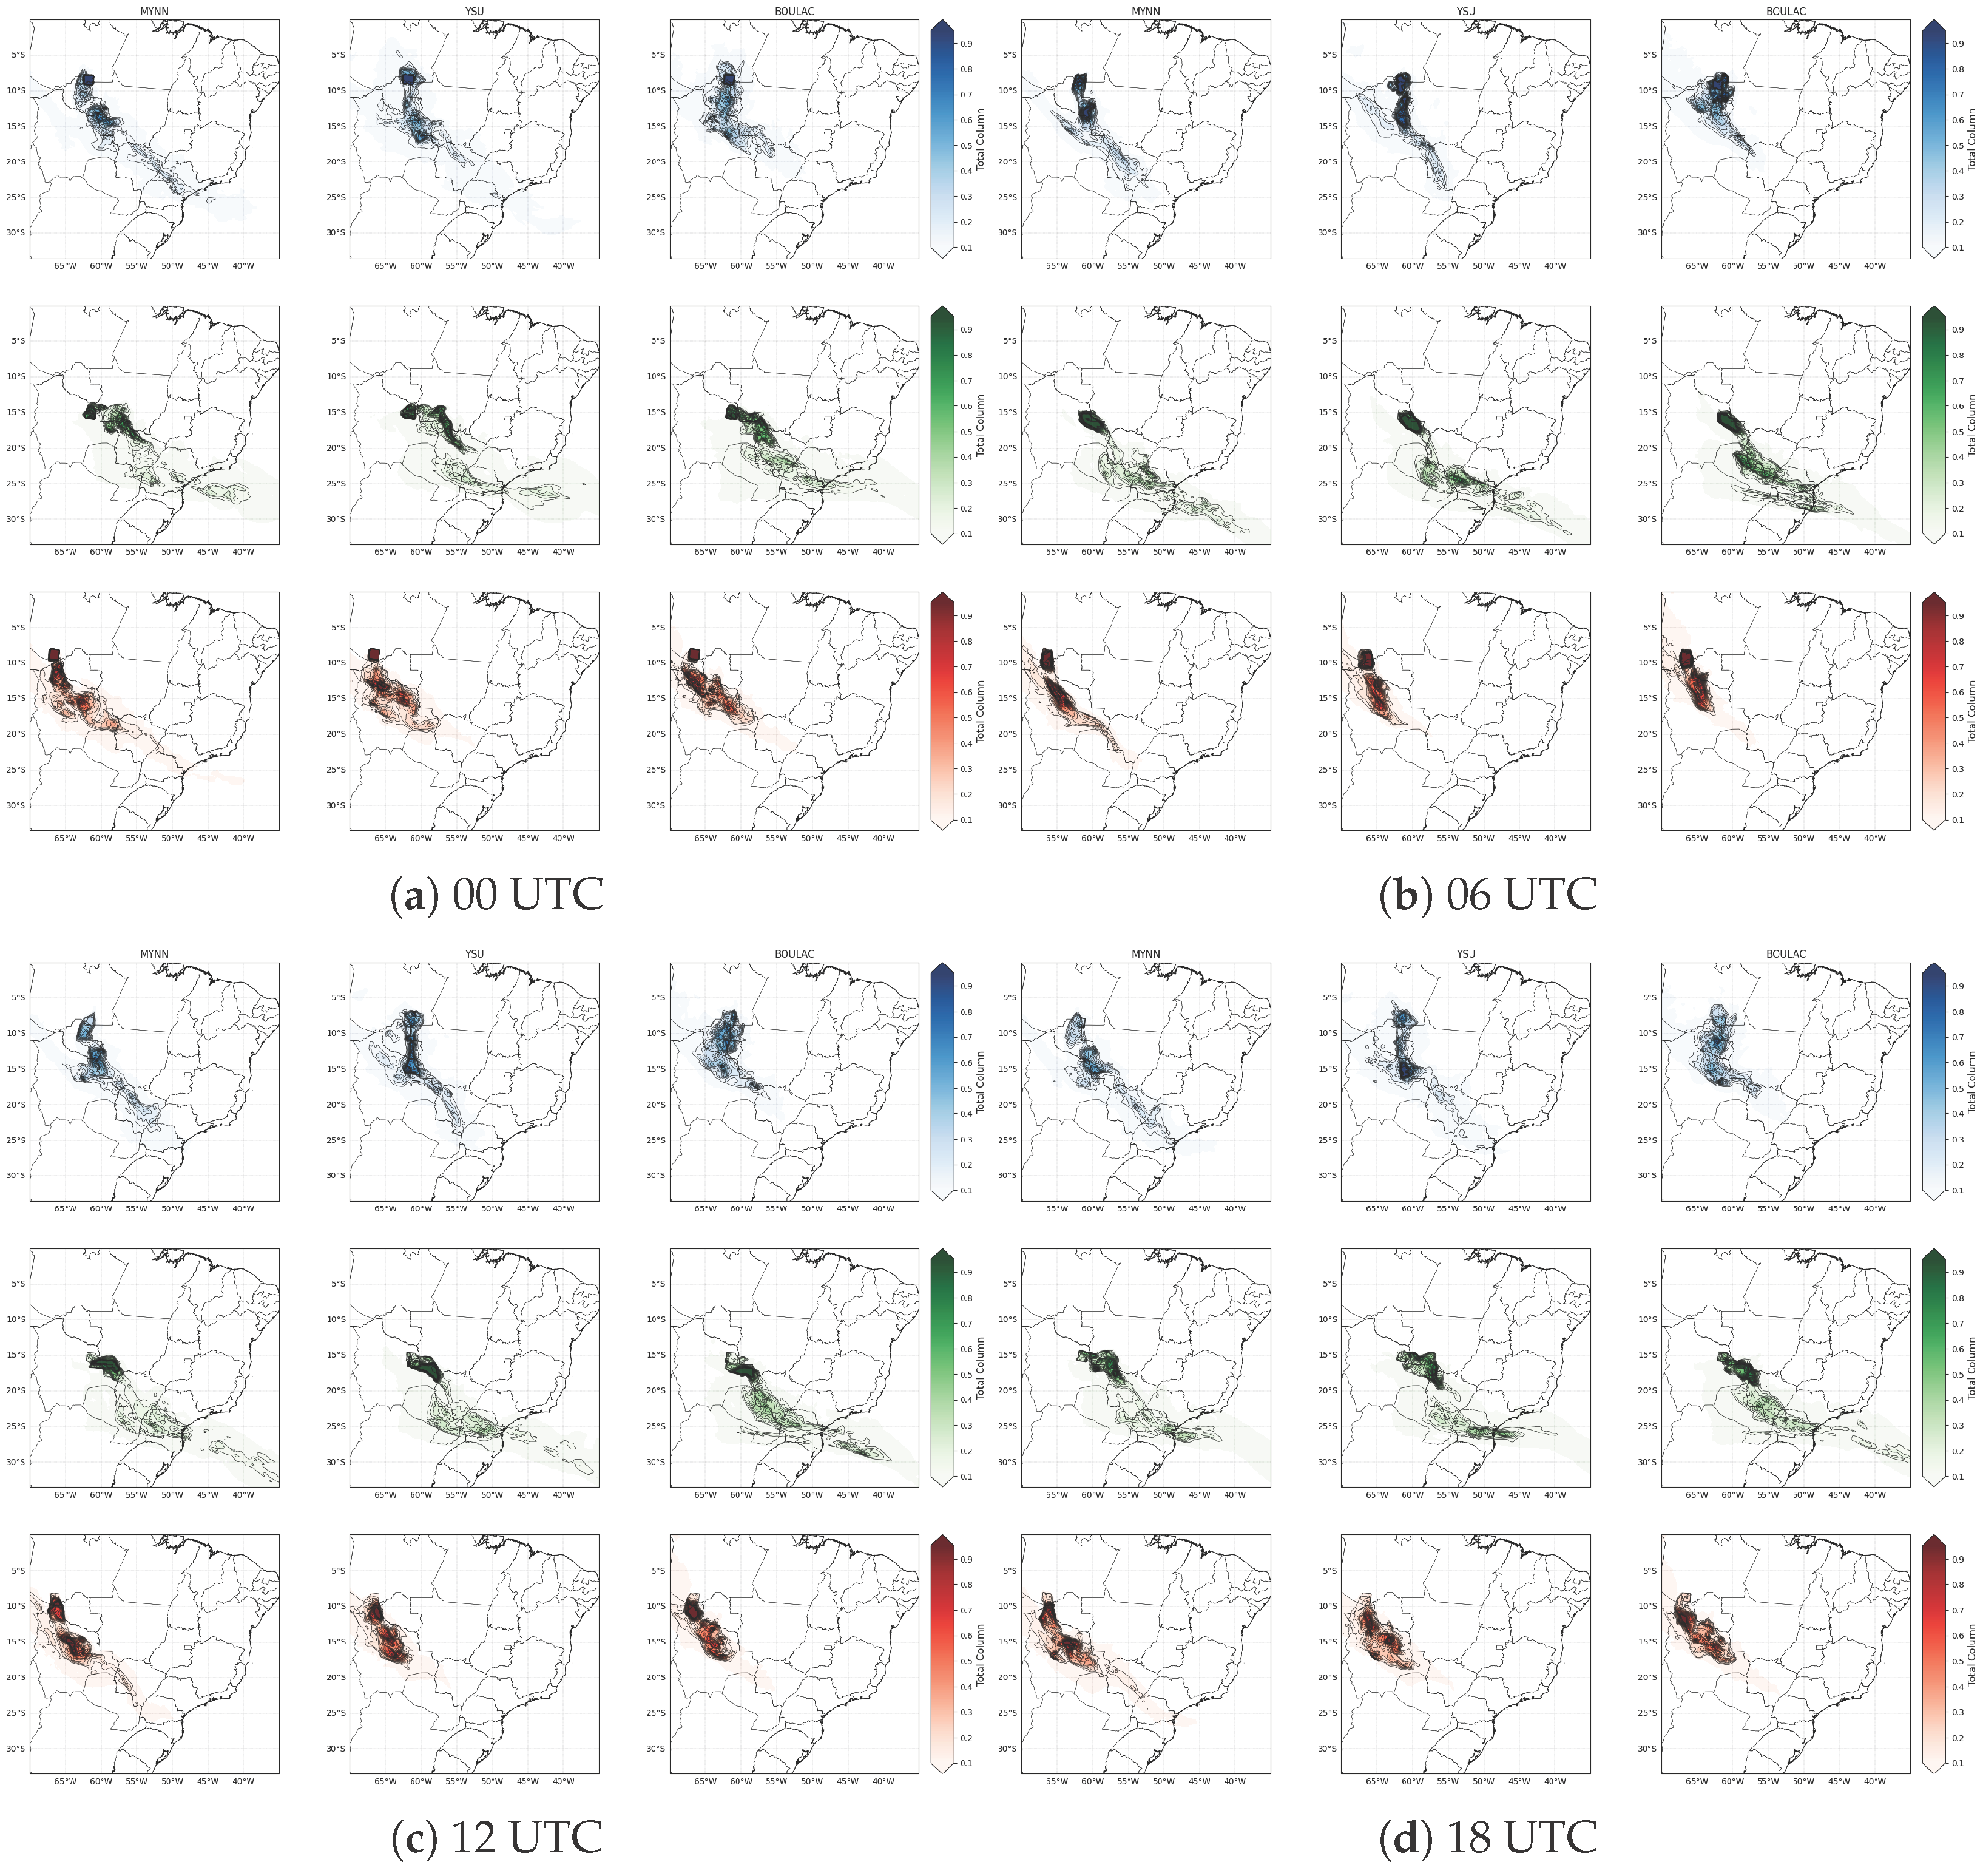
On 17 August, in the early hours, as observed in Figure S3, the columns of the three tracers remain concentrated over the southwestern Amazon, a situation consistent with the weak nighttime circulation. From the morning onward, the tracer tr17_t2 observed in the Figure S3c,d, stretches southward as a baroclinic trough deepens the 850 hPa flow, as shown in Figure 6e, forming a corridor that, by late afternoon, extends from the Amazon region toward Paraguay and northern Argentina, coinciding with the MODIS AOD concentration shown in Figure 2a. Among the PBL schemes, YSU maintains the highest integrated load, MYNN follows the same path with a delay and lower optical depth, while BouLac generates only discontinuous pulses that dissipate before advancing much farther south. Tracers tr17_t1 and tr17_t3 remain mostly confined to the source region, with only MYNN showing a shallow filament by the end of the day, while in YSU, it is incipient and in BouLac nonexistent.
On 18 August, still in the early period, Figure S4 show that tr17_t2 splits into two pulses: one maritime lobe already over the Atlantic at mid-latitudes and another continental core that remains over central South America. During the mid-period, the displacement of the cold front accelerates this continental core toward the east-southeast, crossing the central-west and advancing toward the southeast, while the oceanic branch continues to move eastward, being observed in Figure S4c,d. In this dual movement, YSU and BouLac maintain the highest integrated loads, efficiently reproducing the band of elevated AOD observed in the MODIS data on 18 August (Figure 2b). MYNN follows the same trajectory, but its branch is more fragmented. The vigorous circulation mobilizes tr17_t1, forming a corridor toward the southeast, more clearly in YSU and MYNN, and only outlined in BouLac. Additionally, tr17_t3 only gains structure in MYNN, showing very subtle signals in the other schemes.
On 19 August, the southwesterly flow continues to direct transport toward the southeast, although the frontal gradient is already weakened. At the beginning of the period, tr17_t2 exhibits a compact plume in YSU, more diffuse in MYNN, and narrow with gaps in BouLac, while tr17_t1 reaches the southern half of Brazil’s central-west region in YSU and MYNN and remains near the source in BouLac, observed in Figure 7a–d. Dilution dominates the field. The tr17_t2 stalls over the interior of the southeast, maintaining a dense core in YSU and a weaker band in MYNN, whereas BouLac almost entirely loses coherence. tr17_t1 consolidates as a secondary corridor only in YSU and MYNN. Finally, for tr17_t3, only MYNN can show some concentration pulses in the Southeast region of Brazil, while YSU and BouLac remain centered over the Bolivia region throughout the day.
Throughout the episode, tracer tr17_t2 dominates the aerosol transport, departing from the western Amazon and forming a corridor that extends toward the south-central part of the continent, coinciding with the AOD tongue observed by MODIS in Figure 2a,b. For this episode, the YSU scheme maintains the densest and most continuous column from the source to the southeast, and MYNN reproduces the same axis but with a delay and lower loads, while BouLac exhibits discontinuous pulses that dissipate before reaching the more southern latitudes. Under the same circulation pattern, tracer tr17_t1 becomes a secondary transport pathway only when more efficient mixing occurs, clearly emerging in YSU and MYNN while remaining confined to the emission area in BouLac. In contrast, tr17_t3 barely escapes the Amazon, gaining tangible expression only in MYNN.

3.3. HYSPLIT Analysis

The trajectories indicate a preferential east–southeast flow from the source, forming a transport corridor consistent with what was observed in the AOD data in Figure 2 and with the simulated tracer axis, especially tr17_t2, shown in Figure 8c,d. At the initial 1000 m level, several members display frontal and convective ascent around 18 August, connecting surface emissions to the synoptic transport layer and explaining the denser, more continuous columns in the YSU scheme, whereas MYNN reproduces the same path with delay and lower load, and BouLac tends to show only disconnected pulses. At 4000 m, the trajectories drift east–southeast with gradual subsidence and progressive dilution, consistent with plume weakening in the WRF simulations. A branching into continental and oceanic flows is also observed midway through the event, matching the behavior of tr17_t2. In Figure 8a,b, tr17_t1 appears as a secondary, discontinuous path, while tr17_t3 remains with a restricted reach outside the Amazon, a pattern also suggested by the trajectories in Figure 8e,f.
In terms of coherence, WRF is consistent with HYSPLIT regarding the preferred route, the period of maximum outflow efficiency, and the vertical evolution of the plume, with differences in intensity and continuity expected from the kinematic nature of HYSPLIT compared to the explicit representation of turbulent and convective mixing in WRF PBL schemes. In summary, the trajectories confirm that the plume observed by MODIS and simulated by WRF, especially with YSU, followed a dynamically plausible path toward the southeast.
The spatial evolution of the tracers across the different experiments reveals transport patterns that are sensitive to the choice of planetary boundary layer (PBL) scheme. Although this approach allows for the identification of the predominant trajectory and the horizontal extent of the plumes, it does not, by itself, provide a detailed view of the vertical structure and the interaction of flows at different atmospheric levels. To gain a more comprehensive understanding of the dynamic mechanisms that modulate this transport, it is necessary to complement the analysis with vertical cross-sections along the main dispersion axes.

3.4. Cross-Section Analysis

To assess the impact of boundary layer parameterizations on particulate transport, we compared the three WRF integrations (MYNN, YSU, and BouLac) using latitude–longitude cross-sections evaluated every 6 h.
On 15 August, tr17_t1 remained confined near the emission region under a shallow boundary layer and weak low-level flow oriented opposite to the source–MASP axis so that the parameterizations only conditioned the nocturnal residual depth without producing effective dispersion (Figure S5). On 16 August, a morning convective pulse deepened the mixed layer and provided the first effective window for uplift, during which all simulations consistently released mass between 1 and 2 km. In the afternoon, MYNN and YSU developed more vigorous growth, allowing the tracer to reach 3 km, while BouLac kept the material more restricted (Figure S6). Wind conditions were still not favorable for horizontal advection, and none of the runs indicated detachment to the free troposphere. On 17 August, morning pulses reappeared, particularly in YSU and BouLac, although daytime mixing was shallower. By evening (Figures S7 and S8), BouLac maintained fractions above 2 km for longer, MYNN produced more intermittent elevated signatures, and YSU preserved a shallower core, leaving the system essentially pre-conditioned for the upcoming synoptic transition.
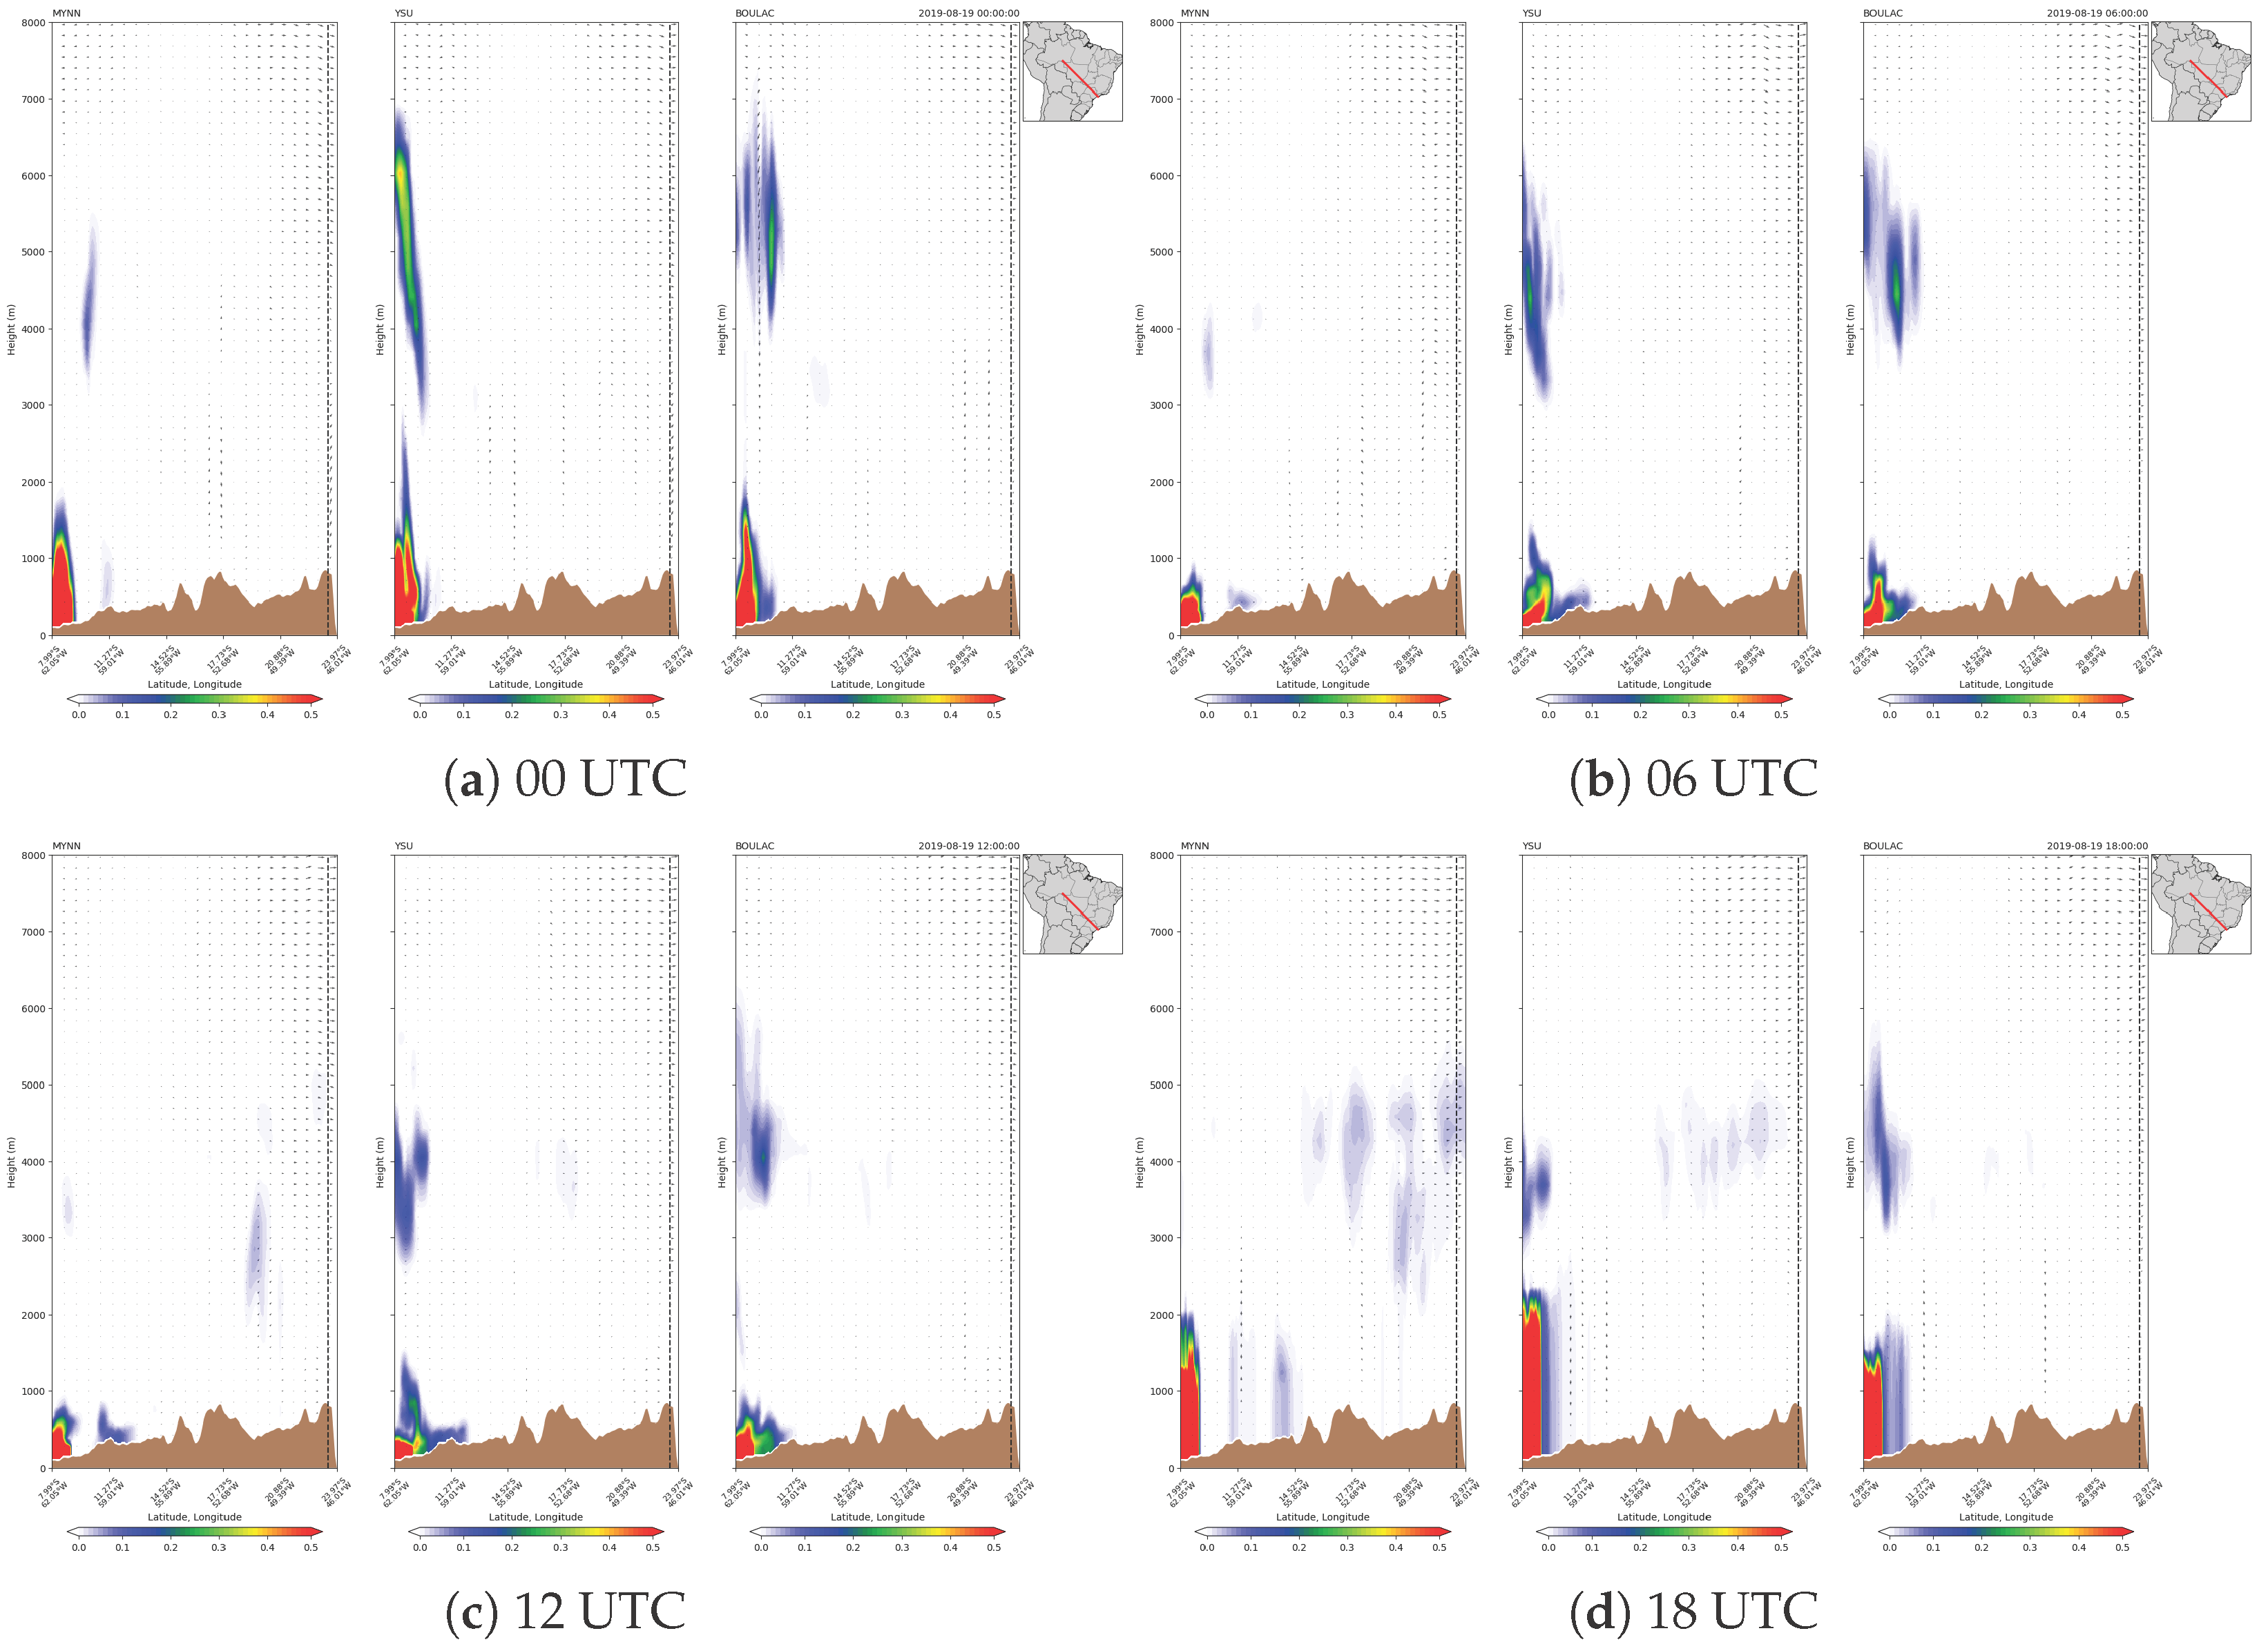
On 18 August, the overall structure persisted from previous days, but stronger convection during the morning and afternoon favored vertical redistribution in all experiments, with YSU and BouLac projecting material above 6 km. A decisive shift occurred when winds at 700–600 hPa organized into a northwest–southeast band. In this setting, MYNN concentrated the tracer between 2 and 5 km, exactly within the layer of accelerated flow, effectively converting the cumulative uplift from earlier days into efficient transport toward the MASP Metropolitan Region. YSU lofted higher portions but retained a distribution comparable to MYNN, though with weaker zonal displacement. BouLac, in contrast, injected the smoke too early and coupled it to an eastward branch, directing material in outflow before it crossed the section over the city (Figure S8).
Finally, on 19 August, Figure 9 clearly shows the arrival over MASP in the MYNN experiment, with maximum concentrations between 3 and 5 km, while BouLac displayed no substantial presence and YSU produced a more diluted and delayed signal. This outcome is consistent with reports of the episode when the city darkened due to the combined effect of transported aerosols and synoptic-scale cloud cover. Comparison with LiDAR observations (Figure 3) supports the MYNN simulation, which preserved the tracer core predominantly between 2 and 5 km when the 700–600 hPa circulation aligned northwest–southeast, reinforcing the Amazon–Southeast transport corridor and explaining the surface increase already observed on 18 August. YSU failed to reproduce the persistent elevated layer captured by the LiDAR, while BouLac also lacked observational support as no evidence was found of significant smoke loads above 5 km over MASP during this period.
For tr17_t2, its initial position closer to the target region favored transport. As with tr17_t1, the tracer remained confined near the source under shallow boundary layer conditions and weak low-level winds (Figure S9). Differences among PBL schemes were evident mainly during nocturnal pre-conditioning: BouLac enhanced concentrations near the top through vigorous depth-dependent mixing; MYNN sustained moderate residuals via shear-generated TKE; and YSU retained more mass below two kilometers due to conservative non-local diffusivity.
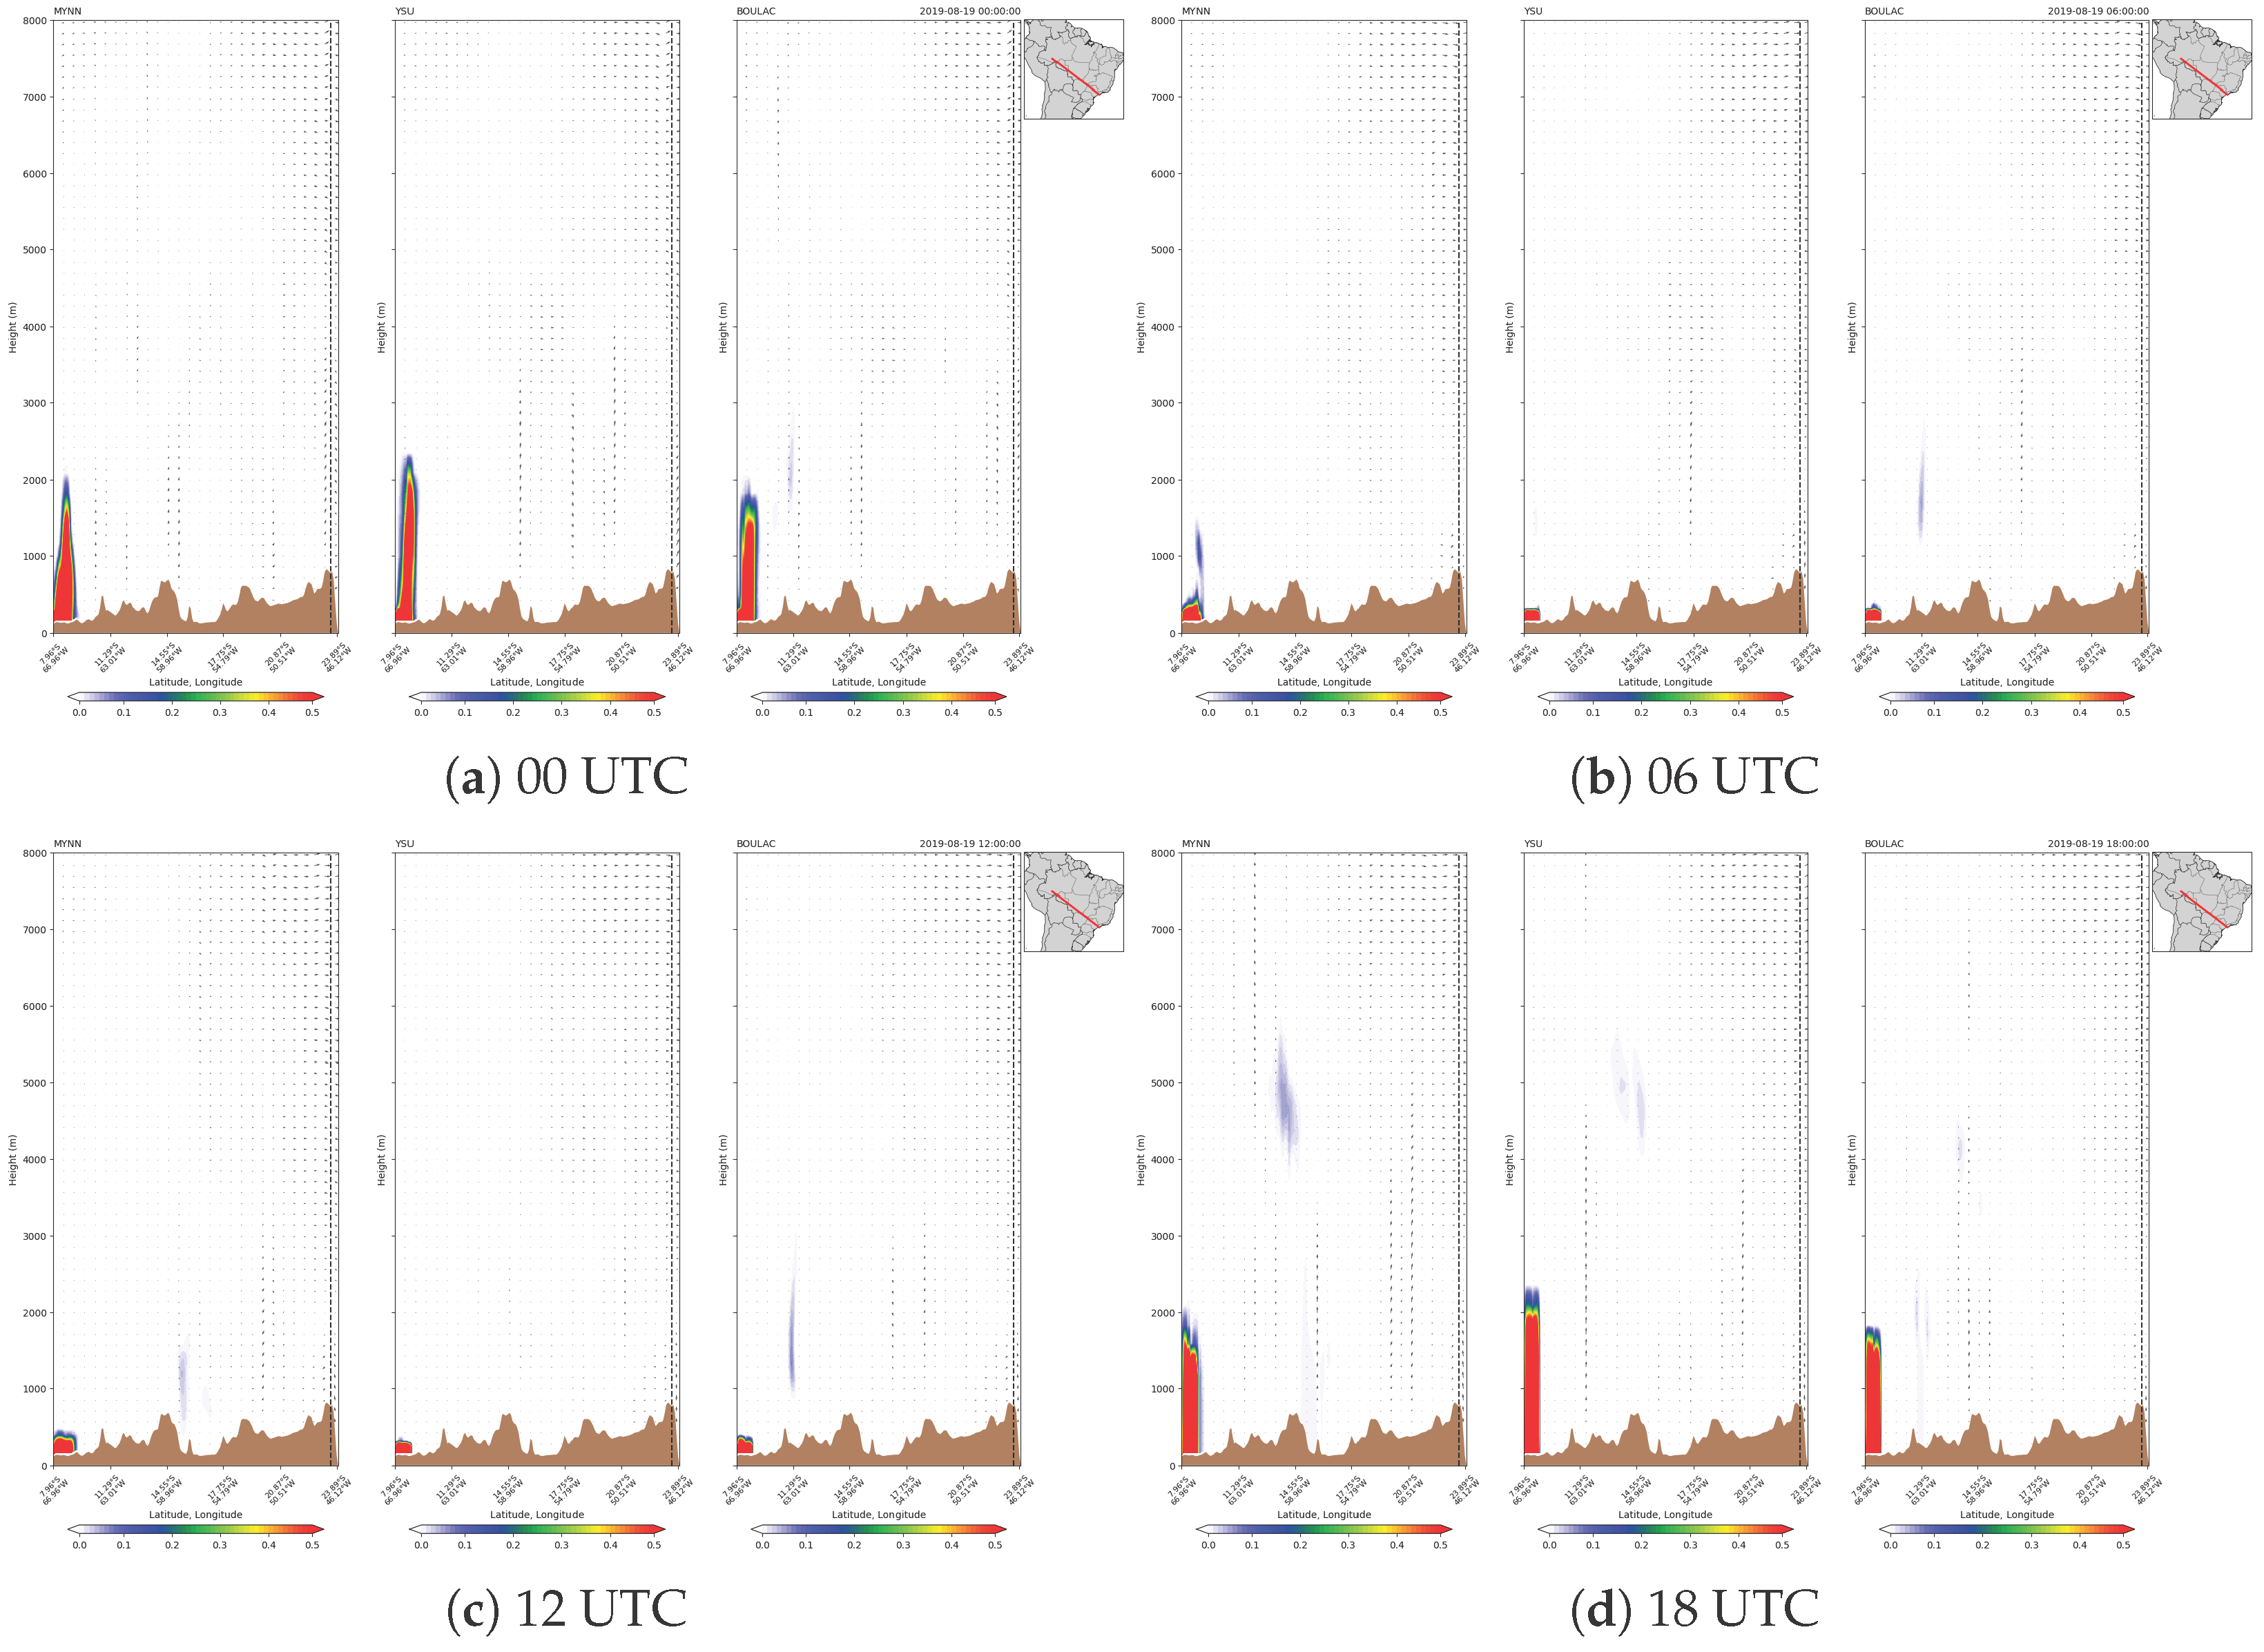
On 16 August (Figure S10), convection deepened the boundary layer, and the tracer fraction appeared early between 2 and 3 km. MYNN effectively converted PBLH growth into entrainment, maintaining sustained release into the lower free troposphere without overshoot. In contrast, YSU diluted efficiently within the PBL but penetrated the inversion less, retaining a shallow core. BouLac produced high concentrations near the top, with pockets extending above 3 km. On 17 August (Figure S11), the transect flow gained southeastward coherence, allowing measurable tracer advancement. MYNN established a continuous band between 2 and 4 km, aligned with intensifying mid-level shear. BouLac projected to higher levels due to stronger entrainment, diverting part of the plume eastward with the zonal branch. YSU showed delayed and intermittent release as non-local mixing retained mass within the PBL.
On 18 August, a synoptic transition organized the mid-level transport corridor. The MYNN scheme concentrated the tracer core between 2 and 5 km, coinciding with maximum flux toward the MASP. BouLac contributed to transport but also developed a higher branch curving east or south of the transect due to overshooting. YSU produced only weak, delayed signals. LIDAR observations in MASP revealed an aerosol layer at 2–3 km with nocturnal surface reinforcement, indicating that simulated schemes lagged the observed arrival since the layer was already detected locally on 18 August (Figure S12). On 19 August, BouLac suggested an earlier arrival (Figure 10), though at low concentrations, followed by MYNN in the morning. During the afternoon and evening, MYNN dominated between 2 and 5 km with temporal continuity consistent with surface observations from the previous day. YSU showed a mid-day peak but concentrations declined thereafter.
Finally, examining tr17_t3, the plume remains anchored to the source under a shallow boundary layer and weak low-level flow that is unfavorable to the source–MASP axis. The three integrations depict the same picture, with no consistent release into the free troposphere. The effect of the PBL schemes is limited to local preconditioning at the top of the layer, with no implication for transport along the cross-section (Figure S13). On 16 August, daytime growth brings the core up to about two kilometers, but the three simulations remain very similar. Differences among the PBL schemes have not yet materialized into a vertical structure capable of altering transport (Figure S14).
On 17 August, new signs of lifting emerge just above the layer top, shallow and intermittent, always below three kilometers. Advance along the transect becomes perceptible but remains confined to that shallow band. Distinctions among the PBL schemes are subtle and do not amount to a robust separation of behavior (Figure S15). Unlike the tracers already discussed, on 18 August—despite better organization of the regional flow—the tracer remains predominantly below three kilometers and is distributed discontinuously along the section. A persistent 2–4 km band does not establish, which would be required to sustain coupling with the 700–600 hPa flow and convert lofting into efficient transport toward MASP. Differences among the PBL schemes remain minor and do not determine a regime change.
On 19 August, a contrast with the other tracers becomes evident. Only MYNN shows a concentration over the region by the end of the day, between 5 and 6 km, which is not consistent with the LiDAR observations. Where there is an approach to the city, it occurs in the same shallow band seen the previous day and remains spatially fragmented. Meanwhile, the other two schemes, YSU and BouLac, indicate that any scheme-related advantage is at most marginal and not decisive to characterize a consistent arrival of tr17_t3 (Figure 11).
The cross-section and plan-view analyses showed that the transition from locally confined plumes on 15–17 August to efficient outflow toward MASP on 18–19 August depended on how each PBL scheme preconditioned the residual layer and coupled the smoke to the mid-level corridor.

3.5. PBL Characteristics

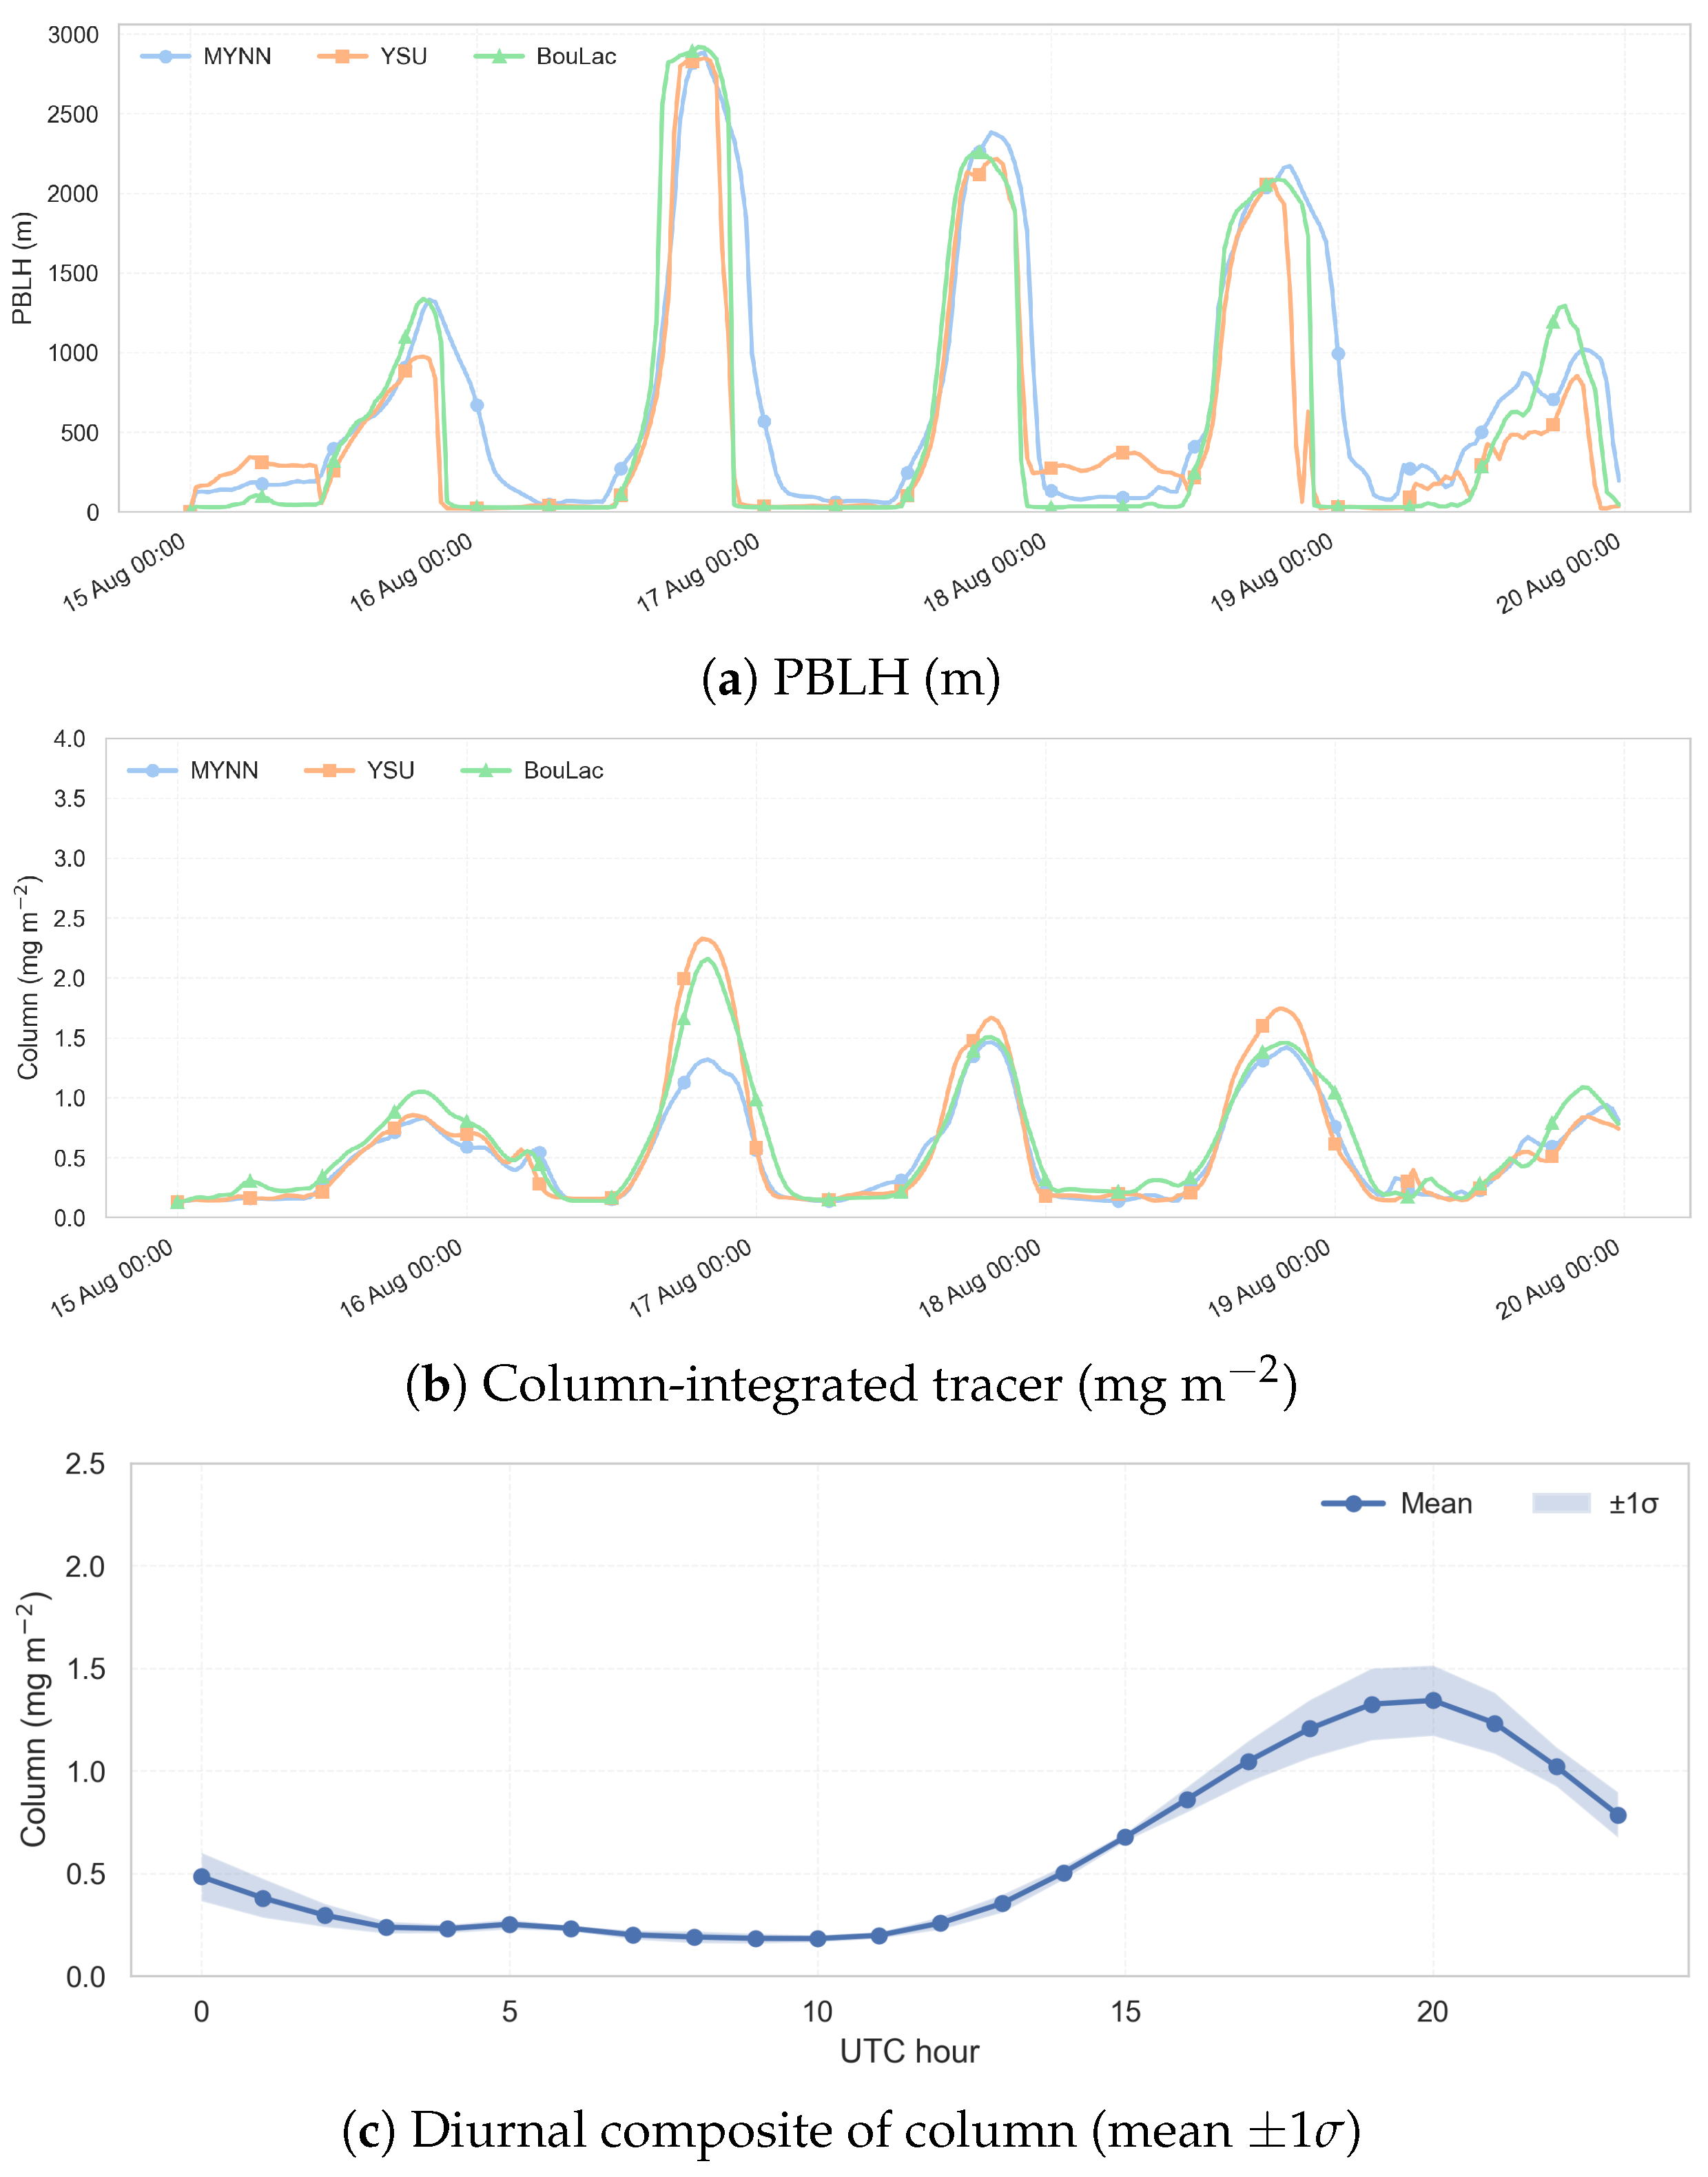
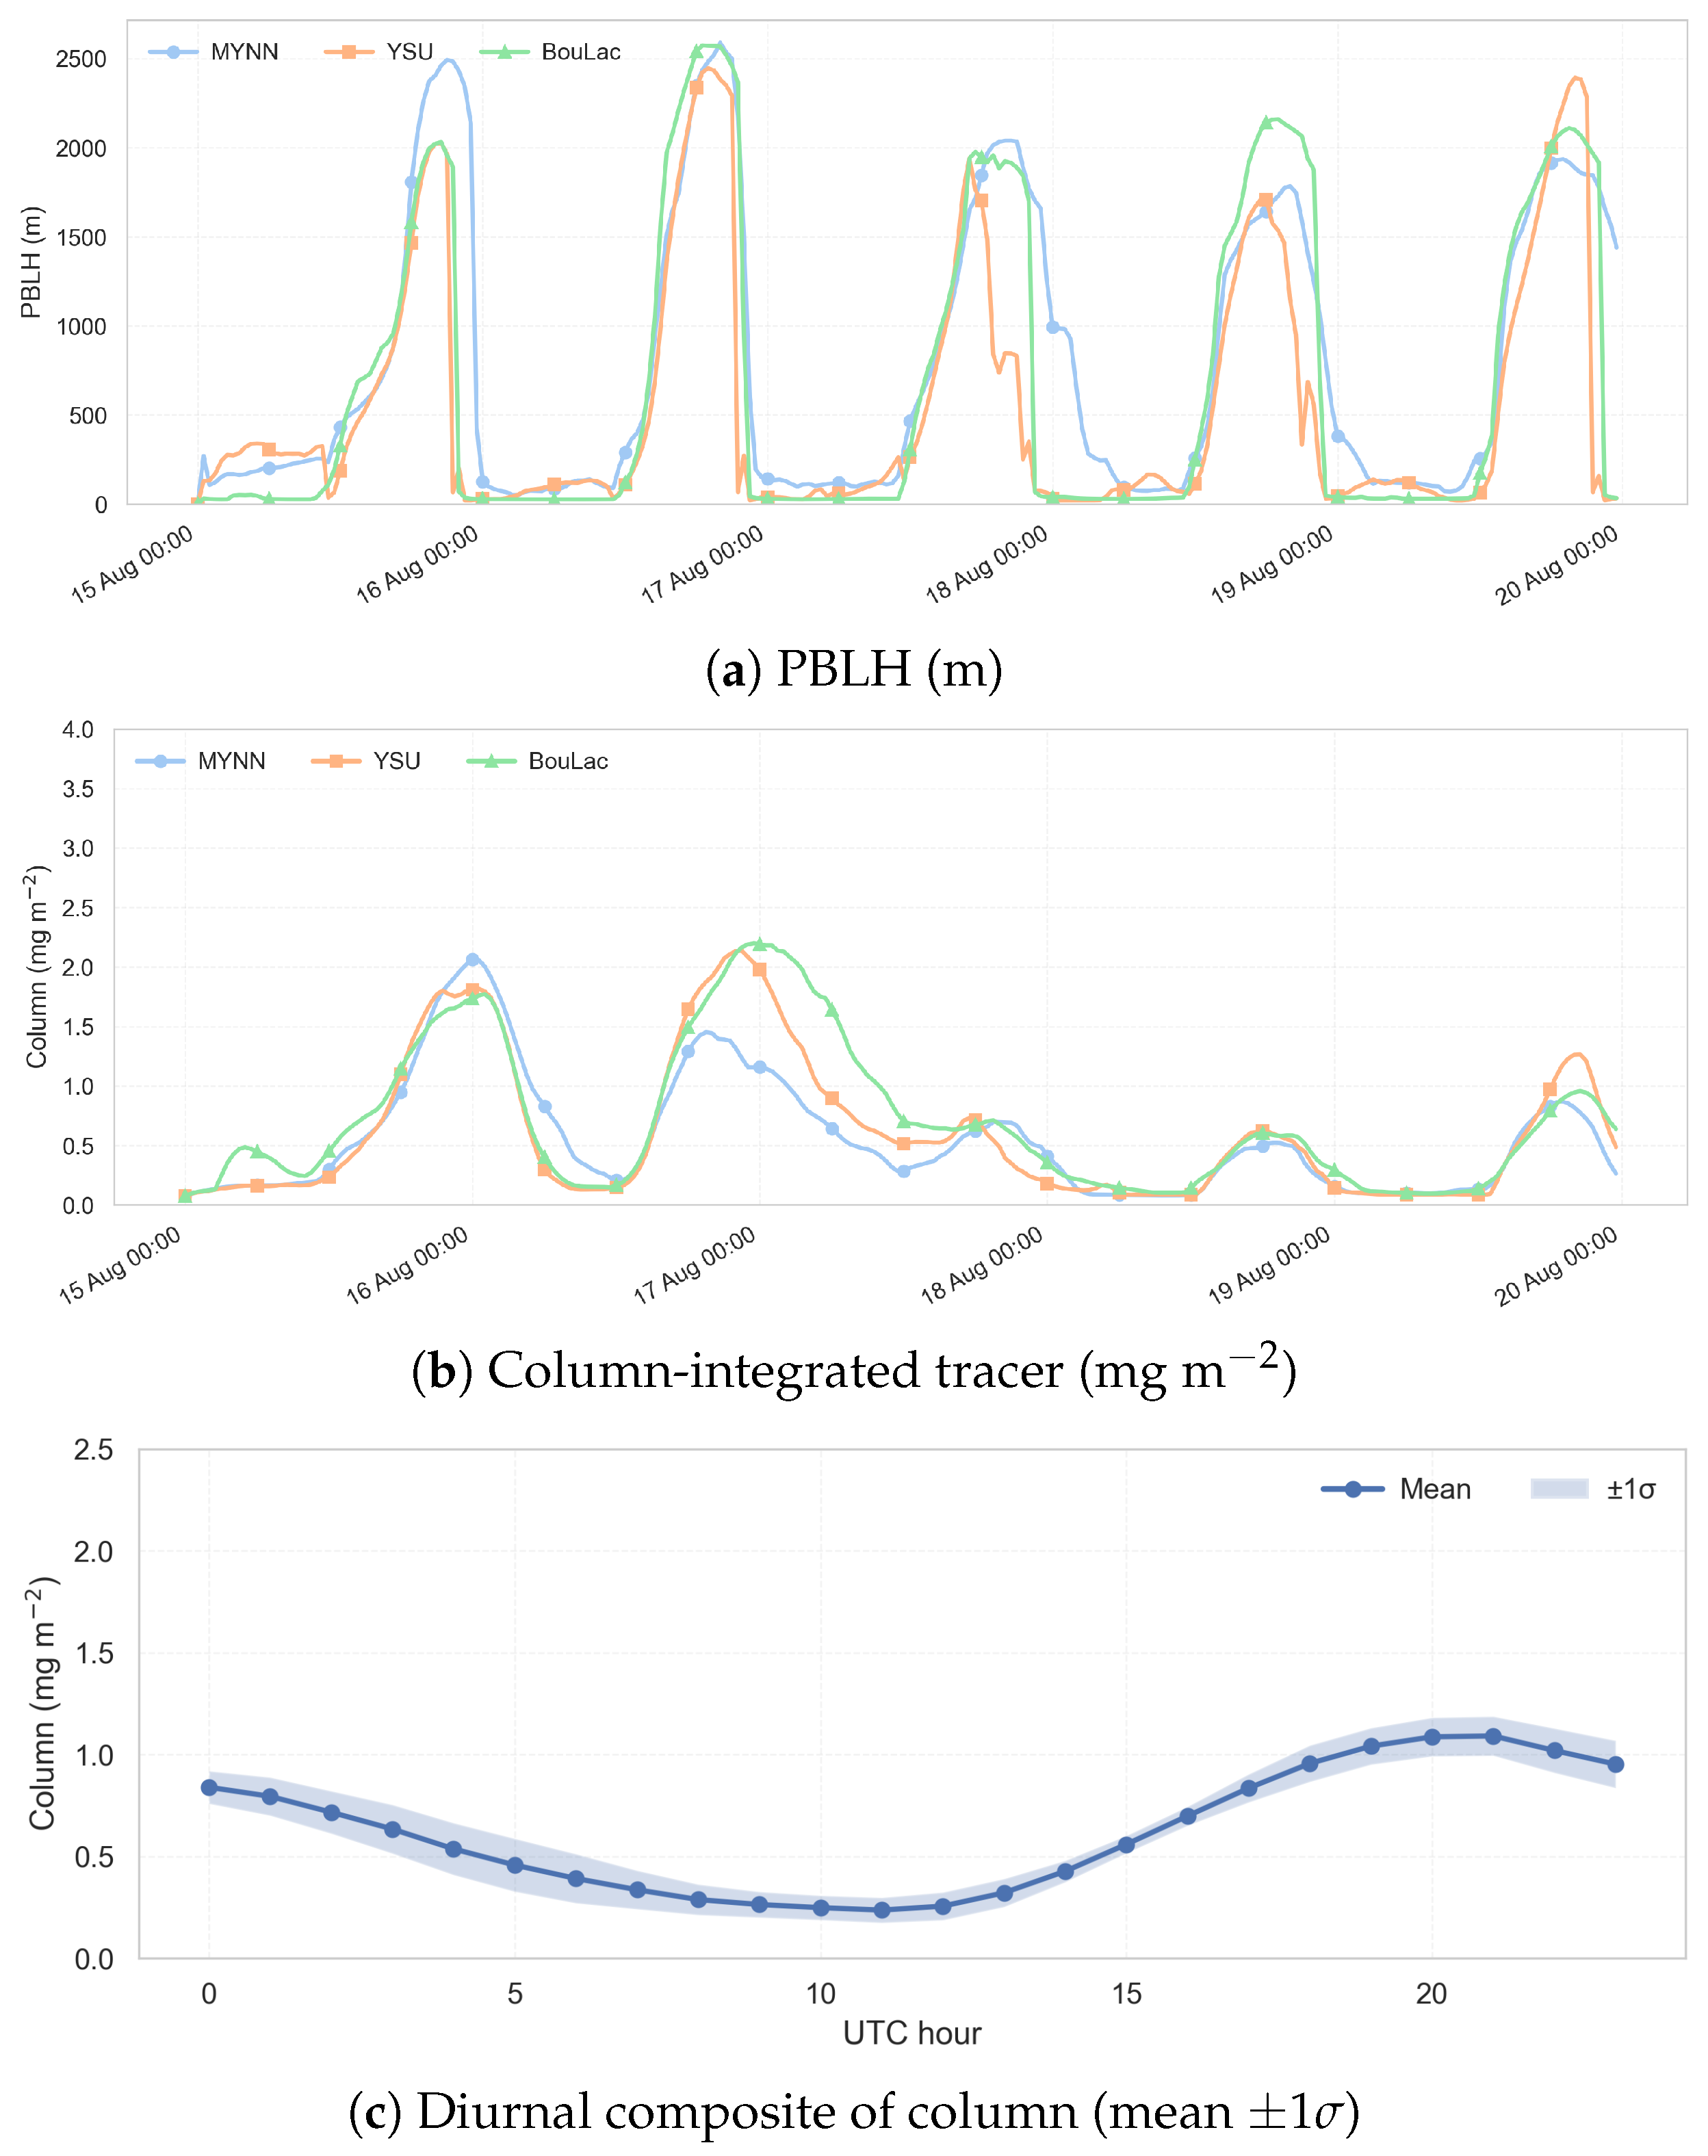
Based on the source–MASP transects and the time series over the city, the transition from locally confined plumes (15–17 August) to efficient transport (18–19 August) depended less on the instantaneous PBL height and more on the phase and persistence of entrainment at the PBL top. When entrainment kept the smoke’s center of mass within a 2–4 km layer during periods of favorable 700–600 hPa flow, downwind transport occurred. As a first step, the near-source environment was examined using PBLH, column-integrated tracer, and the diurnal composite within R = 20 km of the source to characterize the local PBL control.
On tr17_t1, daytime PBLH exceeded 2 km in all schemes (Figure 12a), while MYNN advanced the morning growth and sustained a longer afternoon plateau. This phasing not only dilutes but ventilates the active layer: the column decreases consistently during the afternoon (Figure 12b), indicating persistent entrainment at the PBL top and effective transfer of mass into the 2–4 km layer where the 700–600 hPa flow can act during synoptic windows. Even a PBLH smaller than MYNN, during the overnight of 19 August, the concentration of YSU is 2 times more than BouLac and three times more than MYNN. The diurnal composite displays a late-morning minimum and a pronounced afternoon maximum in all schemes, with larger amplitude under MYNN (Figure 12c), implying more efficient afternoon ventilation when the PBL is deepest. Mechanistically, the tr17_t1 environment under MYNN combines three ingredients: earlier morning growth (earlier release), sustained entrainment at the top (maintaining mass above the inversion), and a delayed evening collapse (prolonging the lofting window). YSU tends to retain overnight and release later in pulses, predisposing to phase mismatch with downstream dynamics, while BouLac alternates mixing episodes and lulls, introducing intermittency in the supply to the PBL top. This explains why, for tr17_t1, MYNN most clearly preconditions a 2–4 km reservoir that is useful for subsequent transport.
On tr17_t2, PBLH remained <1.5 km on 15 August but from 16 August increased sharply to  3 km in MYNN and BouLac (Figure 13a), exceeding tr17_t1. Despite the higher ceiling, the column was systematically lower than in tr17_t1 and did not remain elevated into the early afternoon (Figure 13b): peaks  2–2.5 mg m−2 in YSU/BouLac and <2 mg m−2 in MYNN were eroded quickly. The diurnal composite shows a weaker afternoon maximum and very low morning column (Figure 13c). Physically, convective mixing removed mass faster than it was replenished by the source: local ventilation emptied the active layer before a persistent 2–4 km fraction could be sustained during the dynamic window. Differences among PBL schemes appear primarily in timing: MYNN starts earlier and ventilates more (smaller columns but a “cleaner” setup for lofting if mass exists), YSU grows later (larger but short-lived peaks), and BouLac alternates convective pulses. In all cases, the dominant limitation in tr17_t2 is not the absolute PBLH but the lack of persistent lofted mass at the critical time.
On tr17_t3, in 15 August, MYNN already reached PBLH > 2 km, and all three simulations maintained a deep, in-phase PBL thereafter (Figure 14a). Even so, the column decreased after 16–17 August and remained low on 18–19 August, with MYNN  20% below the others on 17 August (Figure 14b). The diurnal composite has reduced amplitude and a subtle afternoon maximum (Figure 14c). Here, the primary limitation is not how deep the PBL is, but the available source mass in the relevant synoptic window and the spatial misalignment with the source–MASP axis. Without persistent feeding of the 2–4 km layer in any scheme, differences among PBL schemes become secondary: even with vigorous mixing, there is insufficient mass in the right place and time for scheme-to-scheme entrainment differences to translate into regional transport.
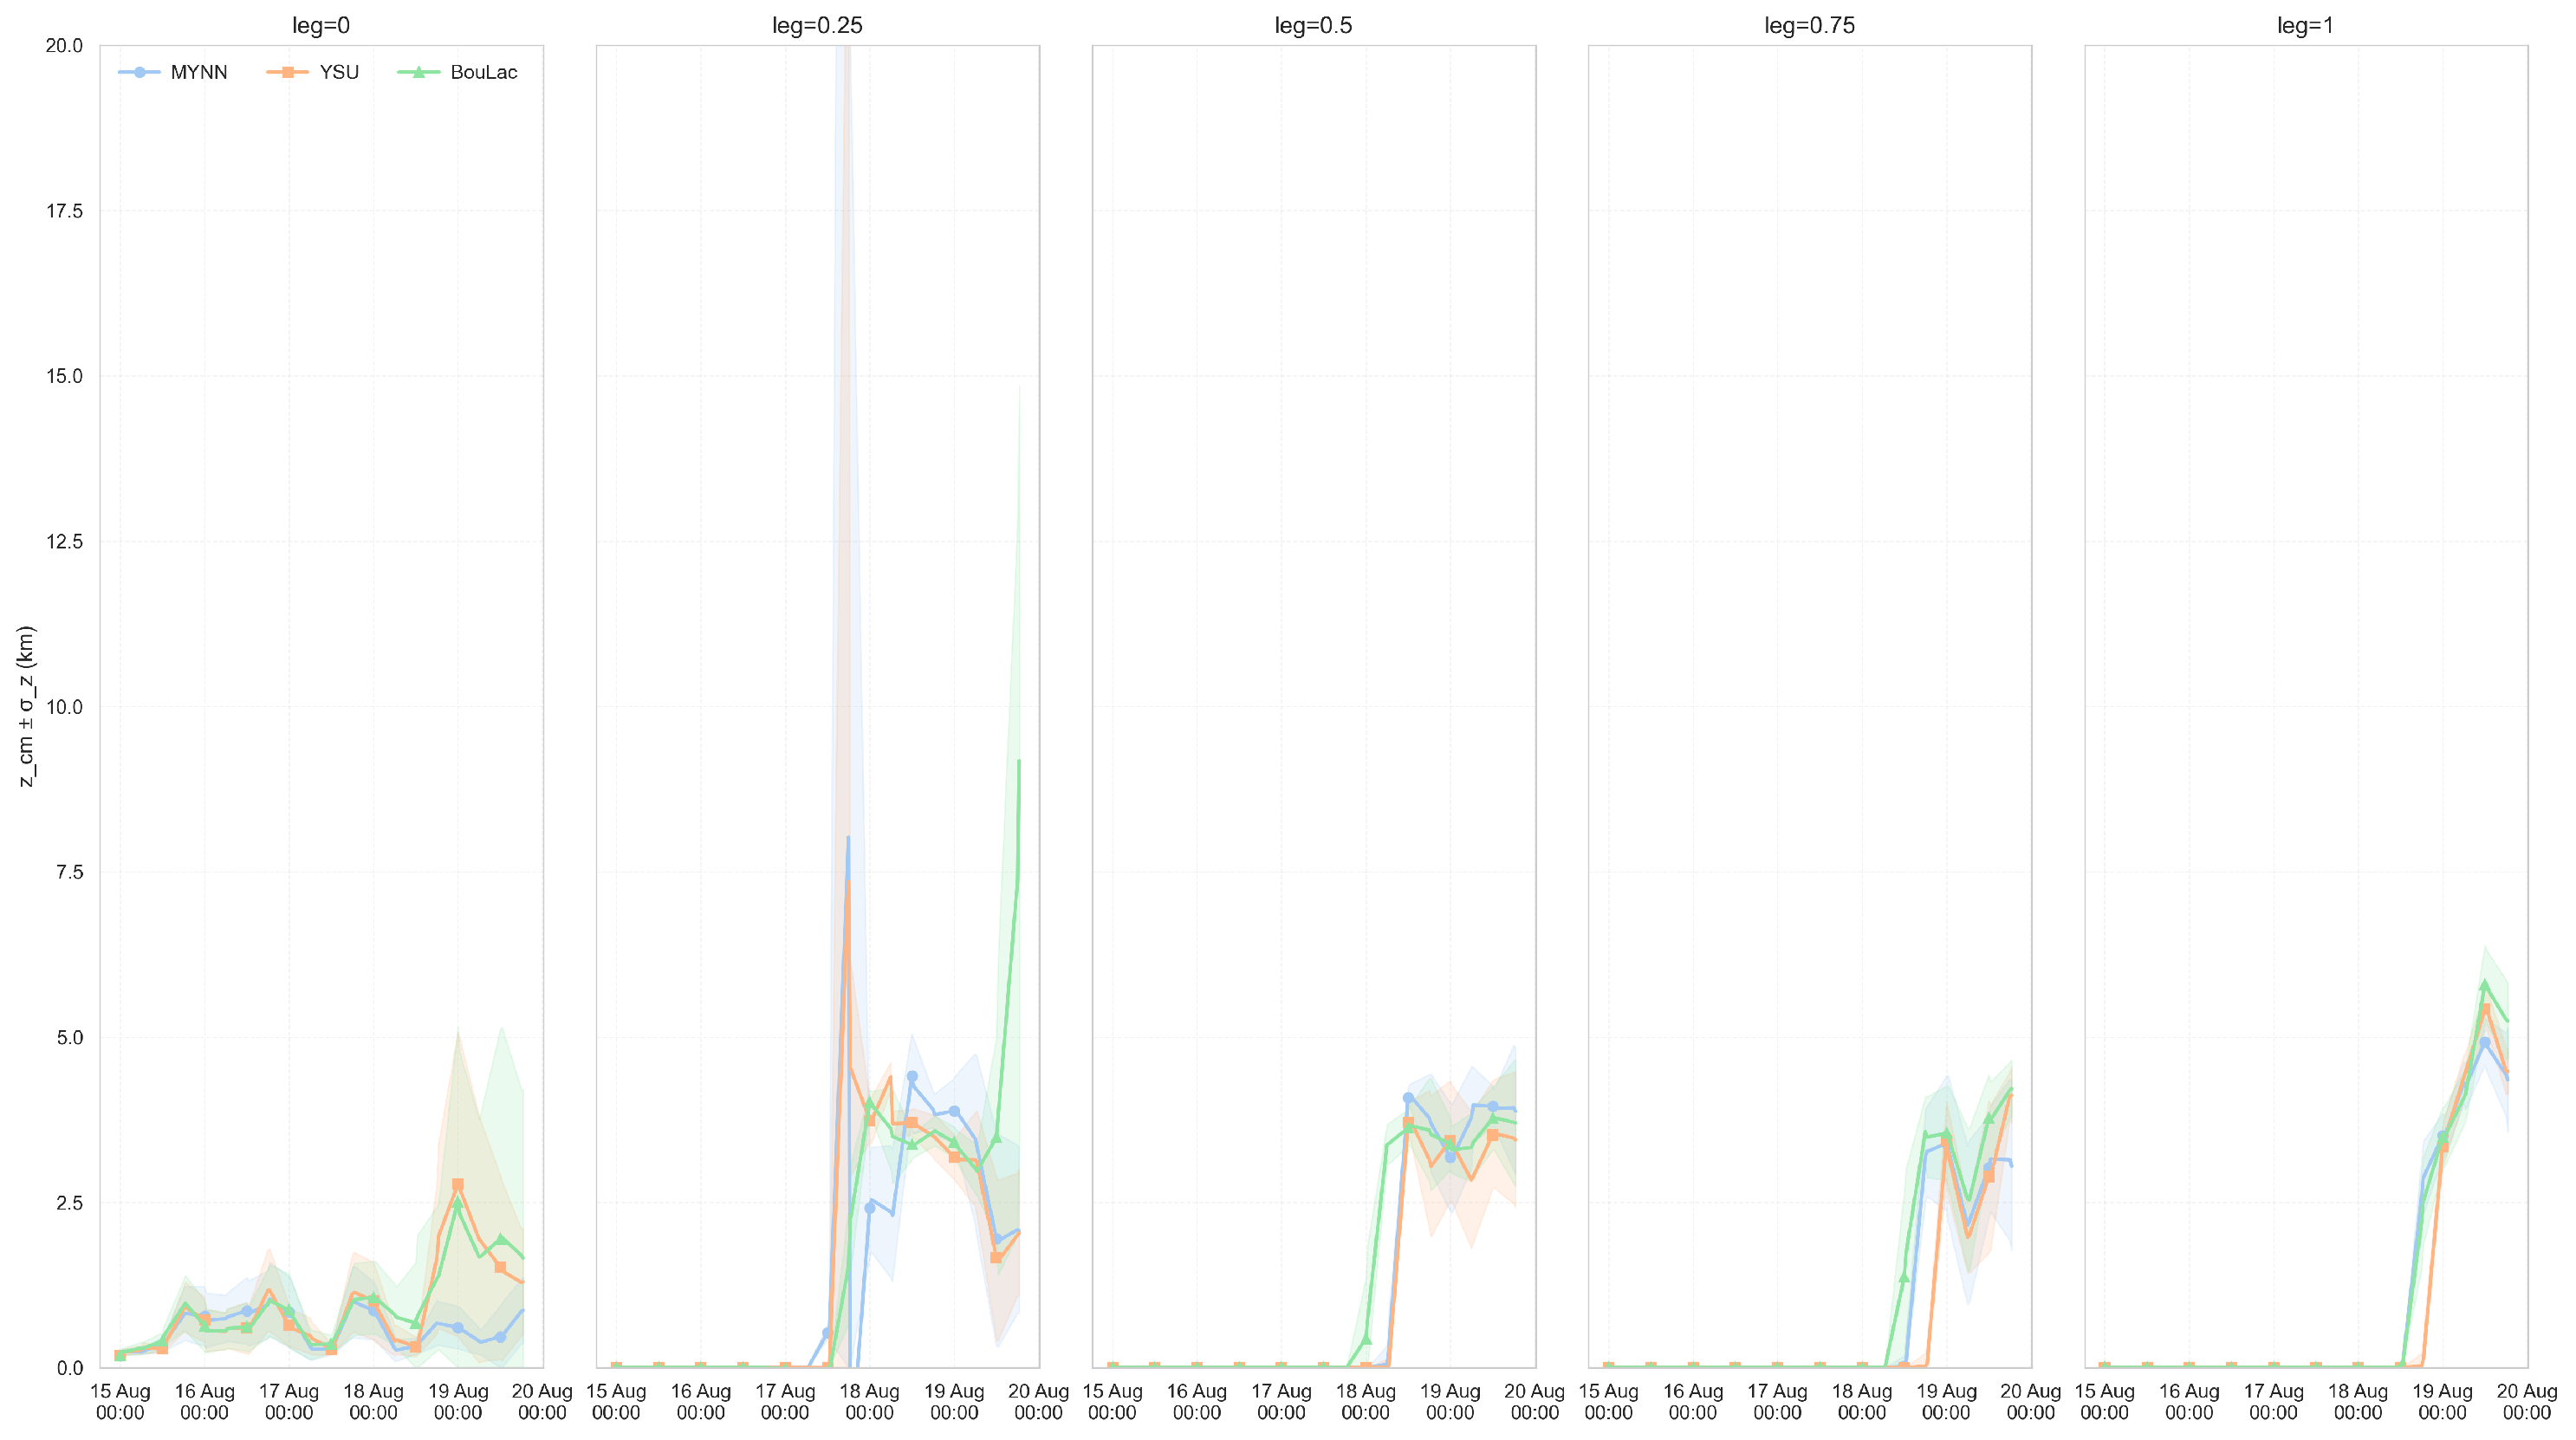
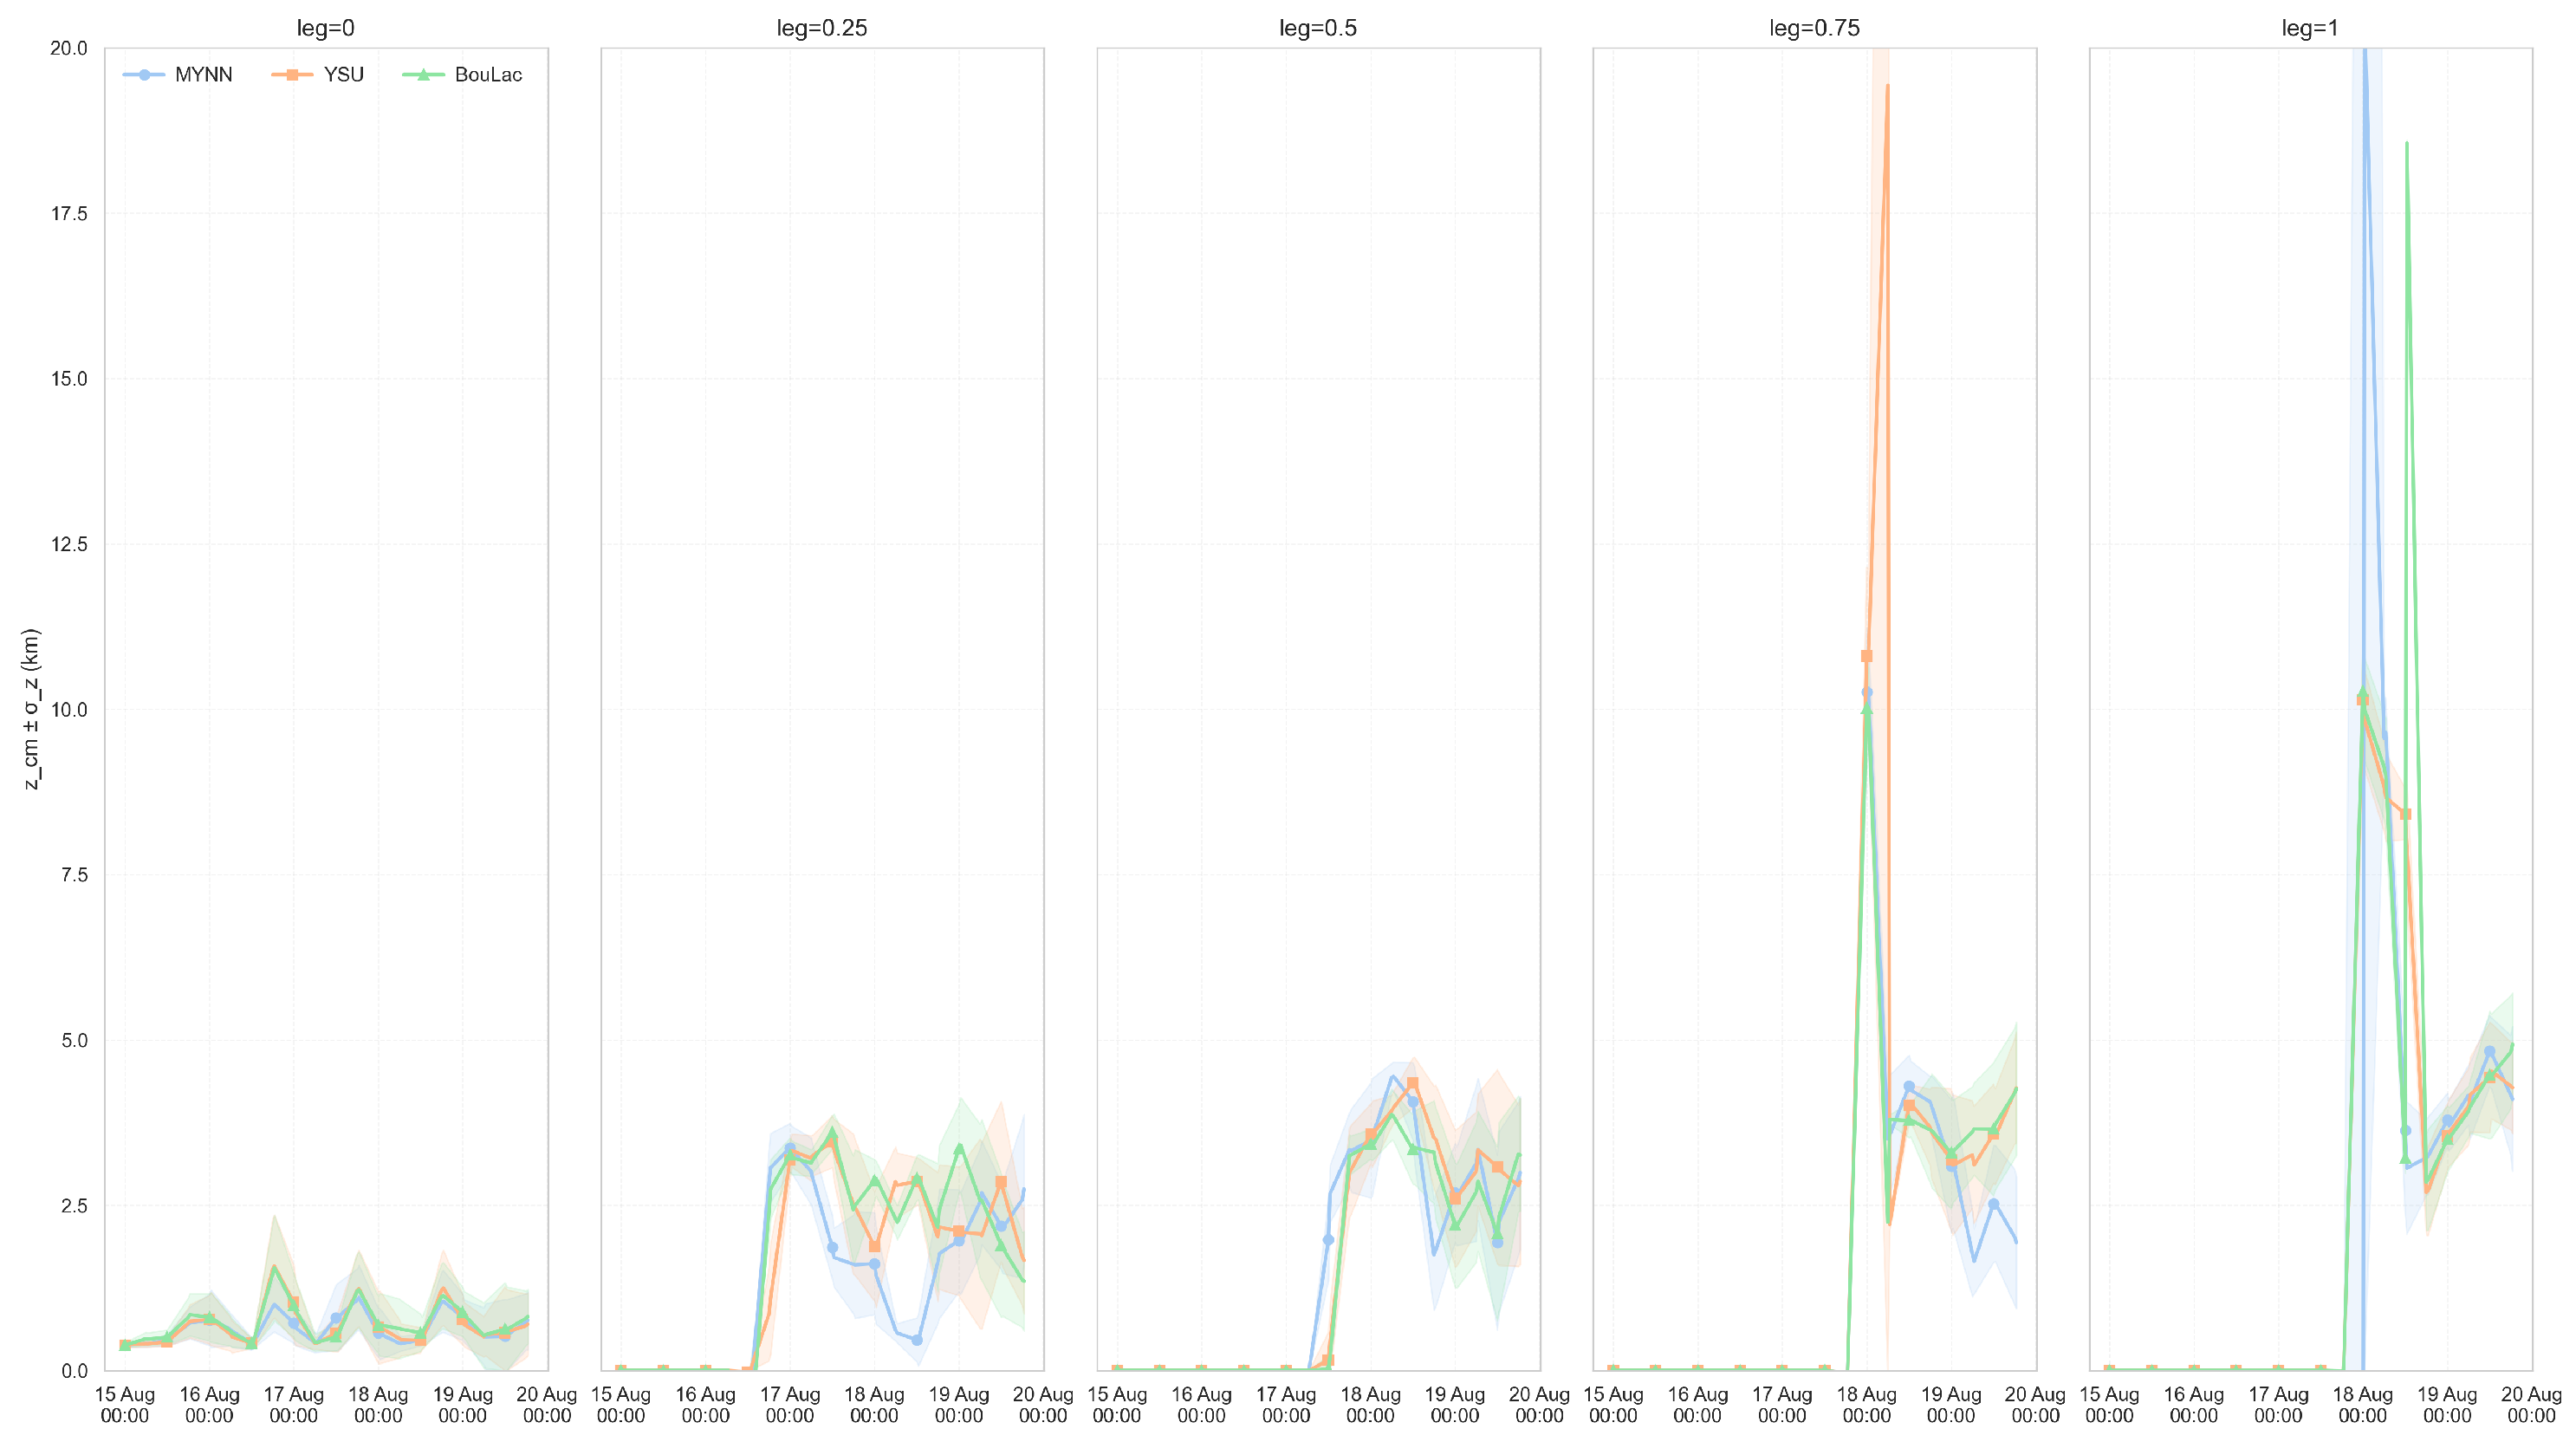
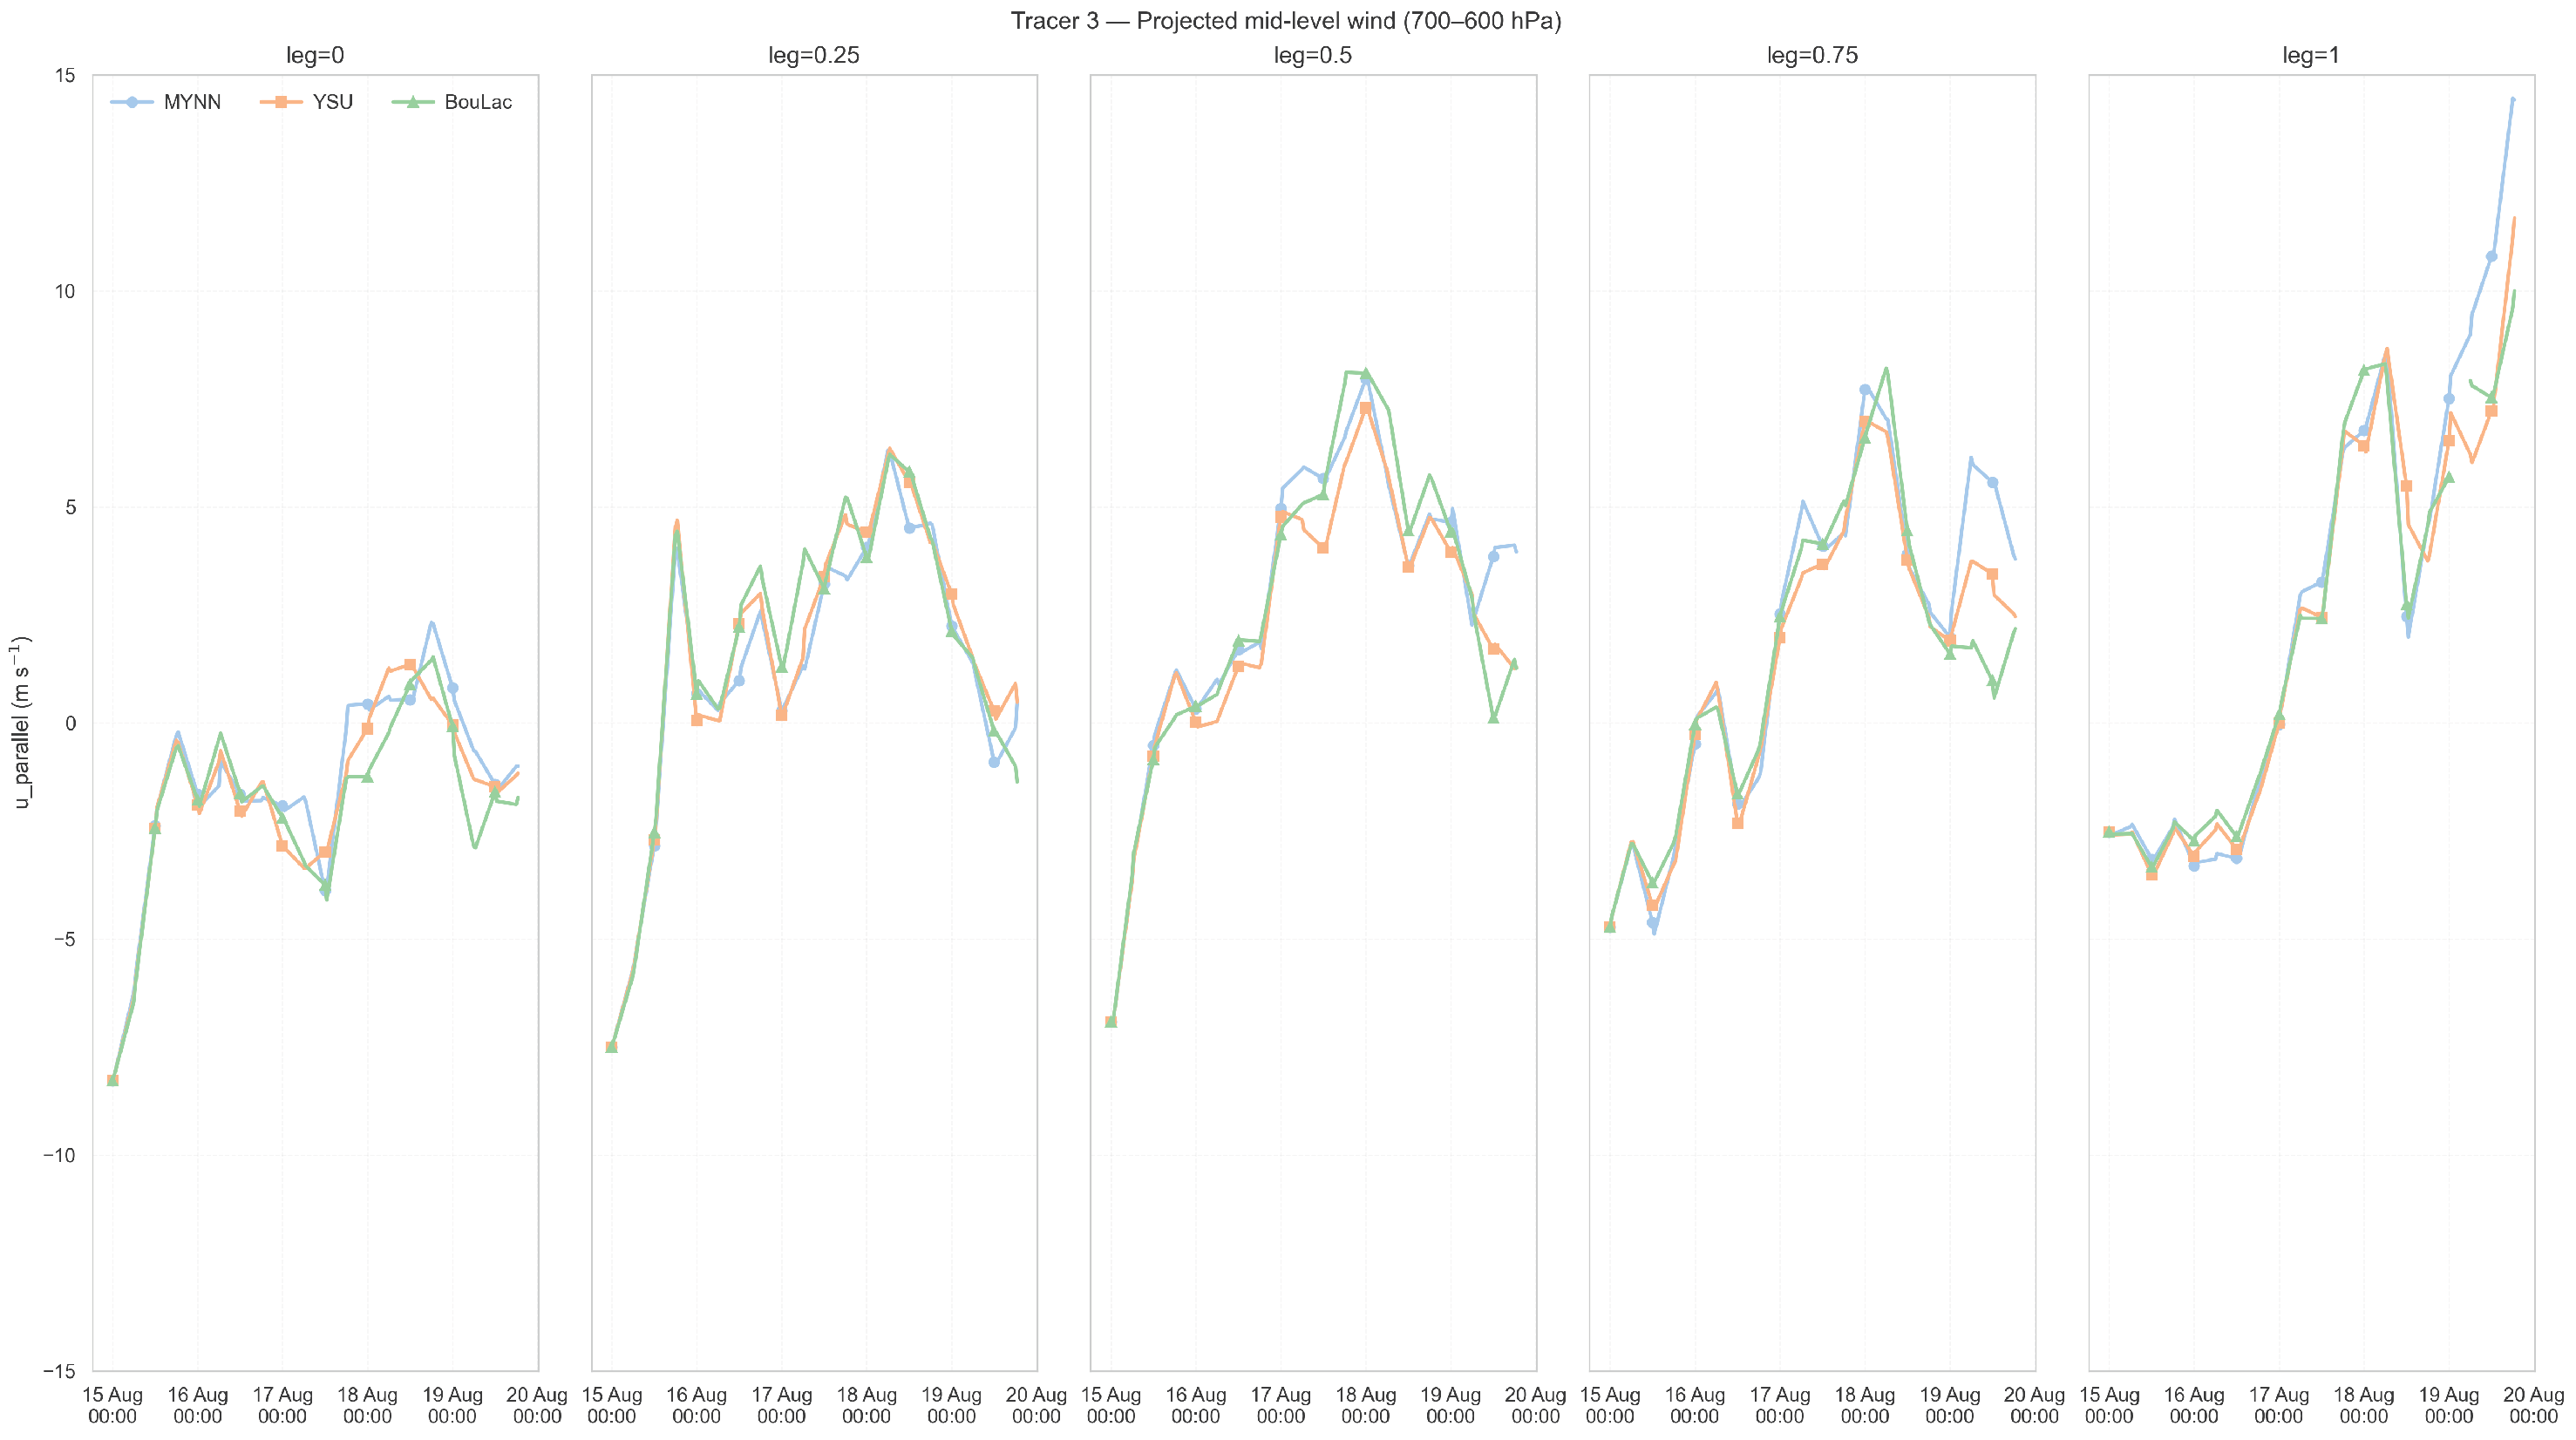
The results near the source (Figure 12, Figure 13 and Figure 14) indicated that the differences among PBL schemes are manifested mainly in the phasing of the morning growth and afternoon entrainment, rather than in the instantaneous value of the PBLH. It was observed that the tracer environment plays a key role, modulating its concentration and transport. In this context, the following analysis assesses whether and when the PBL is able to sustain a reservoir at 2–4 km toward MASP, a necessary condition for regional transport. To this end, five distance fractions were sampled along the previously used cross-section (legs = 0, 0.25, 0.5, 0.75, and 1.0), calculating the following:
  • The mean wind at 700–600 hPa projected onto the axis ( u ).
  • The vertical moments of the lofted fraction above the PBL (zcm± 1 σ ).
An efficient outflow gateway was defined as the period in which z c m remains between 2 and 4 km and u > 0 for consecutive hours. The axes were shared across tracers and schemes to enable direct comparison. In the fractions observed for tr17_t1 (Figure 15 and Figure 16), the wind projected along the axis ( u )) evolves from weak/negative values upstream (leg 0) to positive and increasing values toward the city, reaching peaks > 8–10 m s−1 at leg 1 on 19 August. This “corridor” already suggests favorable east/northeastward advection. The key factor, however, is whether lofted material is available along the transect: z c m + σ z remains below  1 km at leg 0 until 17 August but then jumps to  3–4 km and stays elevated at legs 0.5–1 from 18 August onward. The MYNN scheme tends to trigger this reservoir slightly earlier (early 18 August at leg 0.5), whereas the YSU scheme responds somewhat later, and the BouLac scheme follows with a similar amplitude. The coupling of a “persistent lofted reservoir (2–4 km) + favorable u p a r a l l e l ” becomes simultaneous between 18 and 19 August at legs 0.5–1, precisely when, in the near-source time series, longer afternoon ventilation is observed in MYNN and a reduction in the tracer column during the late afternoon.
In tr17_t2 (Figure 17 and Figure 18), u p a r a l l e l becomes positive earlier across all legs, with legs 0–0.5 increasing to 5–10 m s−1 between 16 and 17 August and leg 1 exceeding 10 m s−1 by the end of the period. The vertical moment differs from what was observed for the first tracer: at leg 0.25, z c m + σ z rises to  2–3.5 km as early as 16–17 August, with the BouLac scheme slightly higher, whereas legs 0.5–1 only enter a persistent regime from 18 August onward (3–5 km). Differences among the PBL schemes are evident in the vertical moment: the MYNN scheme tends to initiate the 2–4 km layer slightly earlier (particularly at leg 0.5), YSU shows intermittent peaks (some spurious and unrealistically high), and BouLac sustains intermediate levels. Together with the near-source time series, this explains why tr17_t2 exhibited lower concentrations and a weaker afternoon maximum: while the wind system provides efficient advection, convective ventilation leads to early dilution, and the feeding into the 2–4 km layer does not persist throughout the critical early-afternoon window.
Finally, in tr17_t3 (Figure 19 and Figure 20), u p a r a l l e l again shows a strengthening pattern toward MASP, with peaks > 8–10 m s−1 at leg 1 on 19 August. The contrast lies in the vertical moment: until the end of 18 August, there is virtually no sustained signal of z c m + σ z at legs 0–0.25. However, from late 18 August into early 19 August, legs 0.5–1 rapidly rise to  3–5 km but with a later onset compared to the other tracers. All three PBL schemes agree on this lag, with MYNN once again slightly anticipating the initiation of the lofted layer, though the average amplitude among schemes remains similar. This provides insight into why this tracer exhibited a lower column and reduced diurnal amplitude: despite the high PBL, the mass supply and alignment with the source–MASP axis were insufficient during the earlier windows so that when the mid-level dynamics became optimal, the 2–4 km reservoir was not yet fully established along the cross-section.
The process picture that emerges here is a persistent lofted reservoir (2–4 km) coexisting for several hours with a positive 700–600 hPa projected flow, which is consistent with established smoke-transport mechanisms over South America. A full multi-model intercomparison (e.g., FLEXPART/WRF-Chem/CTMs) would be the appropriate framework to quantify model spread, aerosol burdens, and radiative–microphysical feedback. Otherwise, such an exercise requires harmonized emissions and a multi-event sample and is, therefore, outside the scope of this case study.

4. Discussion

This is a single-event, focusing on 15–20 August 2019. Here, we assess how three WRF PBL schemes (MYNN 2.5, YSU, and BouLac) modulate smoke transport across South America and under which synoptic settings the plume may reach the MASP. The evaluation was anchored in MODIS AOD retrievals and LiDAR profiles over MASP. The synoptic background shows a wintertime sequence that organized a northwest to southeast corridor in the mid-troposphere. This setting is consistent with prior accounts of the 2019 episode in São Paulo that described an elevated plume and a rapid deterioration of air quality during the afternoon of 19 August. Regional syntheses on biomass burning transport toward the southeast have also reported that such corridors arise during winter baroclinic periods and that arriving plumes are often lofted rather than confined to the surface.
In the total column analysis, the first two simulation days indicated tracers were largely confined near the source region. As the days progressed, tracer tr17_t2 extended southward as the trough intensified the 850 hPa flow, establishing a corridor that, by late afternoon, coincided with the AOD concentration observed. On the day of the event itself, the tracer was directed southeastward with progressive dilution. In this daily reading, for this episode, YSU produced the densest and most continuous columns along the axis. MYNN followed a similar pattern but with a delay and a lower column burden, while the BouLac scheme showed intermittent pulses instead. For the other tracers, tr17_t1 and tr17_t3, only the MYNN scheme projected pulses and concentration into the MASP.
This impression, however, is reshaped when examining the vertical structure in cross-sections along the source–MASP axis. Between 18 and 19 August, when the 700–600 hPa flow organized into a NW–SE axis, MYNN concentrated the plume between 2 and 5 km, converting the accumulated entrainment from previous days into efficient transport toward the MASP. On the event day, the arrival over MASP is clear in MYNN (3–5 km), while YSU displayed a more diluted/lagged signal, and BouLac lacked substantial presence, showing a delayed arrival compared with LiDAR profiles. In parallel, BouLac prematurely projected part of the plume eastward, while YSU, although effective in sustaining a dense column, retained mass longer within the PBL.
The synoptic forcing explains the outflow window, where the typical winter baroclinic sequence is involved:
  • Coupling between the left exit of the polar jet (250 hPa) and low-level jet convergence over the La Plata Basin (“baroclinic efficiency”);
  • A negatively tilted trough (NW–SE) with frontal advancement;
  • Occlusion phase with zonal blocking in the South Pacific;
  • A quasi-stationary front along the southeastern coast with a residual LLJ at 850 hPa to the north, composing an “S-shaped corridor.”
This cold and moist air near the surface, together with the northwesterly flow aloft, maintained u > 0 in 700–600 hPa for several hours, coupling the lofted fraction (2–4 km) to the transport toward the MASP. Finally, the analysis of PBL characteristics integrates and clarifies the dominant mechanism. The transition from locally confined plumes in the early days to efficient transport during the event depended less on the instantaneous PBLH and more on the phase and persistence of entrainment at the PBL top. Near the source, MYNN anticipated morning growth, sustained an afternoon plateau, and promoted persistent ventilation (column decline by late afternoon), continuously transferring mass into the 2–4 km layer precisely when the 700–600 hPa flow became favorable. YSU presented stronger nocturnal accumulation (weak mixing under stability and later inversion breakup), with higher release but less coupled to the corridor; BouLac maintained intermediate profiles with overshoot episodes. In summary, the skill of MYNN arises from phased and persistent entrainment that sustains the free-transport layer at the height of maximum flow efficiency, explaining why it consistently materializes effective arrival over MASP, even if not producing the largest daily column load, a mechanism consistent with the regional literature and directly applicable to smoke guidance toward the MASP.
The authors recognize certain limitations, such as the fact that passive tracers exclude chemistry and removal processes. Furthermore, emission and injection height uncertainties were not systematically explored, and ground validation was conducted at a single site. For future work, the following steps are envisioned:
  • Repeating the analysis across a multi-event sample (ASON) to quantify seasonal robustness and synoptic conditions;
  • Coupling WRF-Chem, testing emissions (GFAS, QFED, and FINN/GFED) and injection heights consistent with MISR/CALIOP climatology;
  • Employing a PBL ensemble (including MYJ/ACM2) and entrainment parameterizations to map uncertainties;
  • Incorporating dynamical metrics linking wave and jet variability to outflow efficiency.
Although this is a case study, the synoptic conditions and transport pathways documented here are consistent with the literature for southeastern Brazil. Observational and chemical analyses of the 2019 event itself characterized the “black rain” and degradation of air quality in the MASP, associated with Amazonian smoke and frontal passage [36,37]. At the South American scale, monitoring and forecasting of biomass-burning transport has been operational since the 2000s [57], and predictive frameworks with WRF-Chem were proposed for 2018–2019, including explicit emphasis on the episode that darkened MASP [12]. In addition, integrated evaluations of observations point to a systematic underestimation of AOD by models during the fire season, reinforcing the need for strong observational anchoring [15]. Finally, the climatology of the LLJ contextualizes the role of jets and synoptic preconditioning in the NW–SE outflow [55].

5. Conclusions

This unique event case study shows that Amazon smoke reached the MASP when a lofted layer near two-to-four kilometers coexisted for several hours with favorable projected flow around 700 to 600 hPa. Among the tested PBL schemes, MYNN 2.5 matched the arrival altitude and timing more closely, while YSU produced thicker yet delayed columns, and BouLac showed intermittent pulses.
These findings are specific to August 2019 and were obtained with passive tracers anchored by satellite column retrievals and ground profiling over a single site. They nonetheless provide a clear target for the next evaluations. Multi-event and multi-season analyses with expanded observations and chemistry-enabled simulations will test how often this two-ingredient pathway governs outflow toward SE Brazil and will quantify the robustness of scheme-dependent behavior. If confirmed, the diagnostic can be integrated into routine guidance to anticipate windows of elevated outflow risk over the MASP and surrounding regions. Taken together, these findings crystallize a practical diagnostic for similar episodes. We highlight the essential points below:
  • Winter synoptic window: A typical baroclinic sequence (polar-jet left exit at 250 hPa + LLJ over the La Plata Basin + NW–SE negatively tilted trough + quasi-stationary front) established an S-shaped NW–SE transport corridor.
  • Transport mechanism: Effectiveness arose when a lofted layer at 2–4  km coexisted for hours with along-corridor winds at 700–600 hPa ( u > 0 ), coupling the lofted fraction to MASP-bound flow.
  • PBL-scheme dependence:
    -
    MYNN presented the best representation of transport in relation to the other schemes for this case;
    -
    YSU produced thicker but delayed columns with greater PBL retention;
    -
    BouLac was more intermittent and showed trajectory offsets.
  • Tracer placement: By virtue of its source/injection position relative to the NW–SE corridor, tr17_t2 was exported to the MASP by all three PBL schemes.

Supplementary Materials

The following supporting information can be downloaded at https://www.mdpi.com/article/10.3390/rs17203483/s1, S1: Passive tracer transport — August 15–18, 2019; S2: Cross-Section of tr17_t1; S3: Cross-Section of tr17_t2; S4: Cross-Section of tr17_t3; S5: Objective hotspot selection map.

Author Contributions

Conceptualization, D.L.d.B., U.R. and V.A.; Investigation, U.R., D.L.d.B. and V.A.; Methodology, D.L.d.B., U.R. and V.A.; Software, D.L.d.B. and U.R.; Validation, D.L.d.B., U.R. and V.A.; Formal Analysis, D.L.d.B., U.R., V.A., D.K.P., L.A.S., H.B., G.D.B. and E.L.; Visualization D.L.d.B. and U.R.; Writing—Original Draft, D.L.d.B., U.R. and V.A.; Writing—Review and Editing, L.A.S. All authors have read and agreed to the published version of the manuscript.

Funding

This research has been supported by the B2IST (Biomass Burning and Impacts in the Southern Tropics) project, registered under no. 88881.694487/2022-01, and the AEROBI (AERosol Observations over Brazil and Impacts) project, registered under no. 88887.711959/2022-00.

Data Availability Statement

All codes in this study to initiate and run the model are publicly accessible on GitHub (WRF-TRACER 4.3.1: https://github.com/douglima8/WRF_TRACER, accessed on 5 February 2024).

Acknowledgments

We thank the CAPES (Coordination of Improvement of Higher Education Personnel) who has been a supporter of the research activity (B2IST “Biomass Burning and Impacts in the Southern Tropics”, AEROBI “AERosol Observations over Brazil and Impacts”, and the National Research Council—Institute of Atmospheric Sciences and Climate of Italy. We especially thank the collaborators Eduardo Landulfo and Giovanni Souza, who are part of the Lasers and Applications Center (IPEN/CNEN-SP), for providing the images from 15 and 18 August obtained from LiDAR data.

Conflicts of Interest

The authors declare that they have no known competing financial interests or personal relationships that could have appeared to influence the work reported in this paper.

References

  1. Vitousek, P.M.; Mooney, H.A.; Lubchenco, J.; Melillo, J.M. Human domination of Earth’s ecosystems. Science 1997, 277, 494–499. [Google Scholar] [CrossRef]
  2. Forest, C.E.; Stone, P.H.; Sokolov, A.P.; Allen, M.R.; Webster, M.D. Quantifying uncertainties in climate system properties with the use of recent climate observations. Science 2002, 295, 113–117. [Google Scholar] [CrossRef] [PubMed]
  3. Ramanathan, V.C.P.J.; Crutzen, P.J.; Kiehl, J.T.; Rosenfeld, D. Atmosphere aerosols, climate, andthehydrologicalcycle. Science 2001, 294, 2119–2124. [Google Scholar] [CrossRef] [PubMed]
  4. Trickl, T.; Giehl, H.; Jäger, H.; Vogelmann, H. 35 yr of stratospheric aerosol measurements at Garmisch-Partenkirchen: From Fuego to Eyjafjallajökull, and beyond. Atmos. Chem. Phys. 2013, 13, 5205–5225. [Google Scholar] [CrossRef]
  5. Bencherif, H.; Bègue, N.; Kirsch Pinheiro, D.; Du Preez, D.J.; Cadet, J.M.; da Silva Lopes, F.J.; Shikwambana, L.; Landulfo, E.; Vescovini, T.; Labuschagne, C.; et al. Investigating the Long-Range Transport of Aerosol Plumes Following the Amazon Fires (August 2019): A Multi-Instrumental Approach from Ground-Based and Satellite Observations. Remote Sens. 2020, 12, 3846. [Google Scholar] [CrossRef]
  6. Gonzalez-Alonso, L.; Val Martin, M.; Kahn, R.A. Biomass-burning smoke heights over the Amazon observed from space. Atmos. Chem. Phys. 2019, 19, 1685–1702. [Google Scholar] [CrossRef]
  7. Pereira, G.; Siqueira, R.; Rosário, N.E.; Longo, K.L.; Freitas, S.R.; Cardozo, F.S.; Kaiser, J.W.; Wooster, M.J. Assessment of fire emission inventories during the South American Biomass Burning Analysis (SAMBBA) experiment. Atmos. Chem. Phys. 2016, 16, 6961–6975. [Google Scholar] [CrossRef]
  8. Brito, J.; Rizzo, L.; Morgan, W.; Coe, H.; Johnson, B.; Haywood, J.; Longo, K.; Freitas, S.; Andreae, M.; Artaxo, P. Ground-based aerosol characterization during the South American Biomass Burning Analysis (SAMBBA) field experiment. Atmos. Chem. Phys. 2014, 14, 12069–12083. [Google Scholar] [CrossRef]
  9. Hu, X.M.; Nielsen-Gammon, J.W.; Zhang, F. Evaluation of three planetary boundary layer schemes in the WRF model. J. Appl. Meteorol. Climatol. 2010, 49, 1831–1844. [Google Scholar] [CrossRef]
  10. Banks, R.F.; Baldasano, J.M. Impact of WRF model PBL schemes on air quality simulations over Catalonia, Spain. Sci. Total Environ. 2016, 572, 98–113. [Google Scholar] [CrossRef]
  11. Mantovani Júnior, J.A.; Aravéquia, J.A.; Carneiro, R.G.; Fisch, G. Evaluation of PBL parameterization schemes in WRF model predictions during the dry season of the central Amazon Basin. Atmosphere 2023, 14, 850. [Google Scholar] [CrossRef]
  12. Vara-Vela, A.L.; Herdies, D.L.; Alvim, D.S.; Vendrasco, É.P.; Figueroa, S.N.; Pendharkar, J.; Reyes Fernandez, J.P. A new predictive framework for Amazon forest fire smoke dispersion over South America. Bull. Am. Meteorol. Soc. 2021, 102, E1700–E1713. [Google Scholar] [CrossRef]
  13. Grell, G.A.; Peckham, S.E.; Schmitz, R.; McKeen, S.A.; Frost, G.; Skamarock, W.C.; Eder, B. Fully coupled “online” chemistry within the WRF model. Atmos. Environ. 2005, 39, 6957–6975. [Google Scholar] [CrossRef]
  14. Yuan, S.; Bao, F.; Zhang, X.; Li, Y. Severe biomass-burning aerosol pollution during the 2019 Amazon wildfire and its direct radiative-forcing impact: A space perspective from MODIS retrievals. Remote Sens. 2022, 14, 2080. [Google Scholar] [CrossRef]
  15. Reddington, C.L.; Morgan, W.T.; Darbyshire, E.; Brito, J.; Coe, H.; Artaxo, P.; Scott, C.E.; Marsham, J.; Spracklen, D.V. Biomass burning aerosol over the Amazon: Analysis of aircraft, surface and satellite observations using a global aerosol model. Atmos. Chem. Phys. 2019, 19, 9125–9152. [Google Scholar] [CrossRef]
  16. Landulfo, E.; Lopes, F.J.S.; Mariano, G.L.; Sawamura, P.; Nakaema, W. Lidar Measurements and Applications in Brazil. Atmosphere 2018, 9, 405. [Google Scholar] [CrossRef]
  17. Baars, H.; Ansmann, A.; Althausen, D.; Engelmann, R.; Heese, B.; Wandinger, U.; Komppula, M. Aerosol profiling with lidar in the Amazon Basin during the wet and dry seasons. J. Geophys. Res. Atmos. 2012, 19, 14609–14628. [Google Scholar] [CrossRef]
  18. Reid, J.; Koppmann, R.; Eck, T.; Eleuterio, D. A review of biomass burning emissions part II: Intensive physical properties of biomass burning particles. Atmos. Chem. Phys. 2005, 5, 799–825. [Google Scholar] [CrossRef]
  19. Rogers, C.F.; Hudson, J.G.; Zielinska, B.; Tanner, R.L.; Hallett, J.; Watson, J.G. Cloud condensation nuclei from biomass burning. In Global Biomass Burning; MIT Press: Cambridge, MA, USA, 1991. [Google Scholar]
  20. Malavelle, F.F.; Haywood, J.M.; Mercado, L.M.; Folberth, G.A.; Bellouin, N.; Sitch, S.; Artaxo, P. Studying the impact of biomass burning aerosol radiative and climate effects on the Amazon rainforest productivity with an Earth system model. Atmos. Chem. Phys. 2019, 19, 1301–1326. [Google Scholar] [CrossRef]
  21. Li, Z.; Niu, F.; Fan, J.; Liu, Y.; Rosenfeld, D.; Ding, Y. Long-term impacts of aerosols on the vertical development of clouds and precipitation. Nat. Geosci. 2011, 4, 888–894. [Google Scholar] [CrossRef]
  22. Tao, W.K.; Chen, J.P.; Li, Z.; Wang, C.; Zhang, C. Impact of aerosols on convective clouds and precipitation. Rev. Geophys. 2012, 50. [Google Scholar] [CrossRef]
  23. NASA GES DISC. Giovanni: Gateway to NASA Earth Science Data. Version 4.40. 2025. Available online: https://giovanni.gsfc.nasa.gov/giovanni/ (accessed on 15 August 2025).
  24. Remer, L.A.; Kaufman, Y.; Tanré, D.; Mattoo, S.; Chu, D.; Martins, J.V.; Li, R.R.; Ichoku, C.; Levy, R.; Kleidman, R.; et al. The MODIS aerosol algorithm, products, and validation. J. Atmos. Sci. 2005, 62, 947–973. [Google Scholar]
  25. Landulfo, E.; Papayannis, A.; Artaxo, P.; Castanho, A.; De Freitas, A.; Souza, R.; Vieira, N.; Jorge, M.; Sánchez-Ccoyllo, O.; Moreira, D. Synergetic measurements of aerosols over São Paulo, Brazil using LIDAR, sunphotometer and satellite data during the dry season. Atmos. Chem. Phys. 2003, 3, 1523–1539. [Google Scholar] [CrossRef]
  26. Lopes, F.; Silva, J.; Antuña Marrero, J.; Taha, G.; Landulfo, E. Synergetic Aerosol Layer Observation After the 2015 Calbuco Volcanic Eruption Event. Remote Sens. 2019, 11, 195. [Google Scholar] [CrossRef]
  27. NCAR UCAR WRF Modeling System: Source Code Download. 2024. Available online: https://www.mmm.ucar.edu/models/wrf (accessed on 5 February 2024).
  28. Skamarock, W.C.; Klemp, J.B.; Dudhia, J.; Gill, D.O.; Liu, Z.; Berner, J.; Wang, W.; Powers, J.G.; Dude, M.G.; Barker, D.M.; et al. Weather Forecast and Research Model; NCAR UCAR: Boulder, CO, USA, 2021. [Google Scholar] [CrossRef]
  29. Hersbach, H.; Bell, B.; Berrisford, P.; Biavati, G.; Horányi, A.; Muñoz Sabater, J.; Nicolas, J.; Peubey, C.; Radu, R.; Rozum, I.; et al. ERA5 Hourly Data on Single Levels from 1940 to Present; Copernicus Climate Change Service (C3S), ECMWF: Reading, UK, 2023; Available online: https://cds.climate.copernicus.eu/datasets/reanalysis-era5-singlelevels?tab=overview (accessed on 5 February 2024).
  30. Hersbach, H.; Bell, B.; Berrisford, P.; Biavati, G.; Horányi, A.; Muñoz Sabater, J.; Nicolas, J.; Peubey, C.; Radu, R.; Rozum, I.; et al. ERA5 Hourly Data on Pressure Levels from 1940 to Present; Copernicus Climate Change Service (C3S), ECMWF: Reading, UK, 2023; Available online: https://cds.climate.copernicus.eu/datasets/reanalysis-era5-pressure-levels?tab=overview (accessed on 5 February 2024).
  31. Iacono, M.J.; Delamere, J.S.; Mlawer, E.J.; Shephard, M.W.; Clough, S.A.; Collins, W.D. Radiative forcing by long-lived greenhouse gases. J. Geophys. Res. Atmos. 2008, 113, 1–8. [Google Scholar] [CrossRef]
  32. Jiménez, P.A.; Dudhia, J.; González-Rouco, J.F.; Navarro, J.; Montávez, J.P.; García-Bustamante, E. A Revised Scheme for the WRF Surface Layer Formulation. Mon. Weather Rev. 2012, 140, 898–918. [Google Scholar] [CrossRef]
  33. Grell, G.A.; Freitas, S.R. A scale and aerosol aware stochastic convective parameterization for weather and air quality modeling. Atmos. Chem. Phys. 2014, 14, 5233–5250. [Google Scholar] [CrossRef]
  34. Hong, S.Y.; Lim, J.O.J. The WRF single-moment 6-class microphysics scheme (WSM6). Asia-Pac. J. Atmos. Sci. 2006, 42, 129–151. [Google Scholar]
  35. Stein, A.F.; Draxler, R.R.; Rolph, G.D.; Stunder, B.J.B.; Cohen, M.D.; Ngan, F. NOAA’s HYSPLIT Atmospheric Transport and Dispersion Modeling System. Bull. Am. Meteorol. Soc. 2015, 96, 2059–2077. [Google Scholar] [CrossRef]
  36. Pereira, G.M.; da Silva Caumo, S.E.; Grandis, A.; do Nascimento, E.Q.M.; Correia, A.L.; Barbosa, H.d.M.J.; Marcondes, M.A.; Buckeridge, M.S.; de Castro Vasconcellos, P. Physical and chemical characterization of the 2019 “black rain” event in the Metropolitan Area of São Paulo, Brazil. Atmos. Environ. 2021, 248, 118229. [Google Scholar] [CrossRef]
  37. Souto-Oliveira, C.E.; Marques, M.T.A.; Nogueira, T.; Lopes, F.J.S.; Medeiros, J.A.G.; Medeiros, I.M.M.A.; Moreira, G.A.; Dias, P.L.S.; Landulfo, E.; Andrade, M.d.F. Impact of extreme wildfires from the Brazilian Forests and sugarcane burning on the air quality of the biggest megacity on South America. Sci. Total Environ. 2023, 888, 163439. [Google Scholar] [CrossRef] [PubMed]
  38. Nakanishi, M.; Niino, H. Development of an improved turbulence closure model for the atmospheric boundary layer. J. Meteorol. Soc. Japan. Ser. II 2009, 87, 895–912. [Google Scholar] [CrossRef]
  39. Janjić, Z.I. The step-mountain eta coordinate model: Further developments of the convection, viscous sublayer, and turbulence closure schemes. Mon. Weather Rev. 1994, 122, 927–945. [Google Scholar] [CrossRef]
  40. Mesinger, F. Forecasting Upper Tropospheric Turbulence Within the Framework of the Mellor-Yamada 2.5 Closure. Research Activities in Aatmospheric and Oceanic Modeling; Technical report, WMO/CAS/JSC WGNE; U.S. National Meteorological Center: Silver Spring, MD, USA, 1993; Volume 18.
  41. Bougeault, P.; Lacarrere, P. Parameterization of orography-induced turbulence in a mesobeta–scale model. Mon. Weather Rev. 1989, 117, 1872–1890. [Google Scholar] [CrossRef]
  42. Hong, S.Y.; Pan, H.L. Nonlocal boundary layer vertical diffusion in a medium-range forecast model. Mon. Weather Rev. 1996, 124, 2322. [Google Scholar] [CrossRef]
  43. Saffman, P. On the effect of the molecular diffusivity in turbulent diffusion. J. Fluid Mech. 1960, 8, 273–283. [Google Scholar] [CrossRef]
  44. Njuki, S.M.; Mannaerts, C.M.; Su, Z. Influence of Planetary Boundary Layer (PBL) Parameterizations in the Weather Research and Forecasting (WRF) model on the retrieval of surface meteorological variables over the Kenyan Highlands. Atmosphere 2022, 13, 169. [Google Scholar] [CrossRef]
  45. Gunwani, P.; Govardhan, G.; Jena, C.; Yadav, P.; Kulkarni, S.; Debnath, S.; Pawar, P.V.; Khare, M.; Kaginalkar, A.; Kumar, R.; et al. Sensitivity of WRF/Chem simulated PM2. 5 to initial/boundary conditions and planetary boundary layer parameterization schemes over the Indo-Gangetic Plain. Environ. Monit. Assess. 2023, 195, 560. [Google Scholar] [CrossRef]
  46. Blaylock, B.K.; Horel, J.D.; Crosman, E.T. Impact of lake breezes on summer ozone concentrations in the Salt Lake valley. J. Appl. Meteorol. Climatol. 2017, 56, 353–370. [Google Scholar] [CrossRef]
  47. Bhimireddy, S.R.; Bhaganagar, K. Short-term passive tracer plume dispersion in convective boundary layer using a high-resolution WRF-ARW model. Atmos. Pollut. Res. 2018, 9, 901–911. [Google Scholar] [CrossRef]
  48. Fathi, S.; Gordon, M.; Chen, Y. Passive-tracer modelling at super-resolution with Weather Research and Forecasting–Advanced Research WRF (WRF-ARW) to assess mass-balance schemes. Geosci. Model Dev. 2023, 16, 5069–5091. [Google Scholar] [CrossRef]
  49. Yang, Q.; Easter, R.C.; Campuzano-Jost, P.; Jimenez, J.L.; Fast, J.D.; Ghan, S.J.; Wang, H.; Berg, L.K.; Barth, M.C.; Liu, Y.; et al. Aerosol transport and wet scavenging in deep convective clouds: A case study and model evaluation using a multiple passive tracer analysis approach. J. Geophys. Res. Atmos. 2015, 120, 8448–8468. [Google Scholar] [CrossRef]
  50. Bhimireddy, S.R.; Bhaganagar, K. Performance assessment of dynamic downscaling of WRF to simulate convective conditions during sagebrush phase 1 tracer experiments. Atmosphere 2018, 9, 505. [Google Scholar] [CrossRef]
  51. Saide, P.E.; Carmichael, G.R.; Spak, S.N.; Gallardo, L.; Osses, A.E.; Mena-Carrasco, M.A.; Pagowski, M. Forecasting urban PM10 and PM2. 5 pollution episodes in very stable nocturnal conditions and complex terrain using WRF–Chem CO tracer model. Atmos. Environ. 2011, 45, 2769–2780. [Google Scholar] [CrossRef]
  52. Davies, D.; Ederer, G.; Olsina, O.; Wong, M.; Cechini, M.; Boller, R. NASA’s fire information for resource management system (FIRMS): Near real-time global fire monitoring using data from MODIS and VIIRS. In Proceedings of the EARSel Forest Fires SIG Workshop, Rome, Italy, 3–5 October 2019. number GSFC-E-DAA-TN73770. [Google Scholar]
  53. FIRMS, N.L.; Fire Information for Resource Management System (FIRMS). Near-Real-Time Active Fire/Hotspot Data from MODIS & VIIRS. 2024. Available online: https://firms.modaps.eosdis.nasa.gov/ (accessed on 5 February 2024).
  54. Olsina, O.; Hewson, J.; Davies, D.; Radov, A.; Quayle, B.; Giglio, L.; Hall, J. NASA’s FIRMS: Enabling the Use of Earth System Science Data for Wildfire Management; Technical report, Copernicus Meetings; In Proceedings of the EGU General Assembly 2024, Vienna, Austria, 14–19 April 2024. [CrossRef]
  55. Montini, T.L.; Jones, C.; Carvalho, L.M. The South American low-level jet: A new climatology, variability, and changes. J. Geophys. Res. Atmos. 2019, 124, 1200–1218. [Google Scholar] [CrossRef]
  56. Uccellini, L.W.; Johnson, D.R. The coupling of upper and lower tropospheric jet streaks and implications for the development of severe convective storms. Mon. Weather Rev. 1979, 107, 682–703. [Google Scholar] [CrossRef]
  57. Freitas, S.R.; Longo, K.M.; Silva Dias, M.A.; Silva Dias, P.L.; Chatfield, R.; Prins, E.; Artaxo, P.; Grell, G.A.; Recuero, F.S. Monitoring the transport of biomass burning emissions in South America. Environ. Fluid Mech. 2005, 5, 135–167. [Google Scholar] [CrossRef]
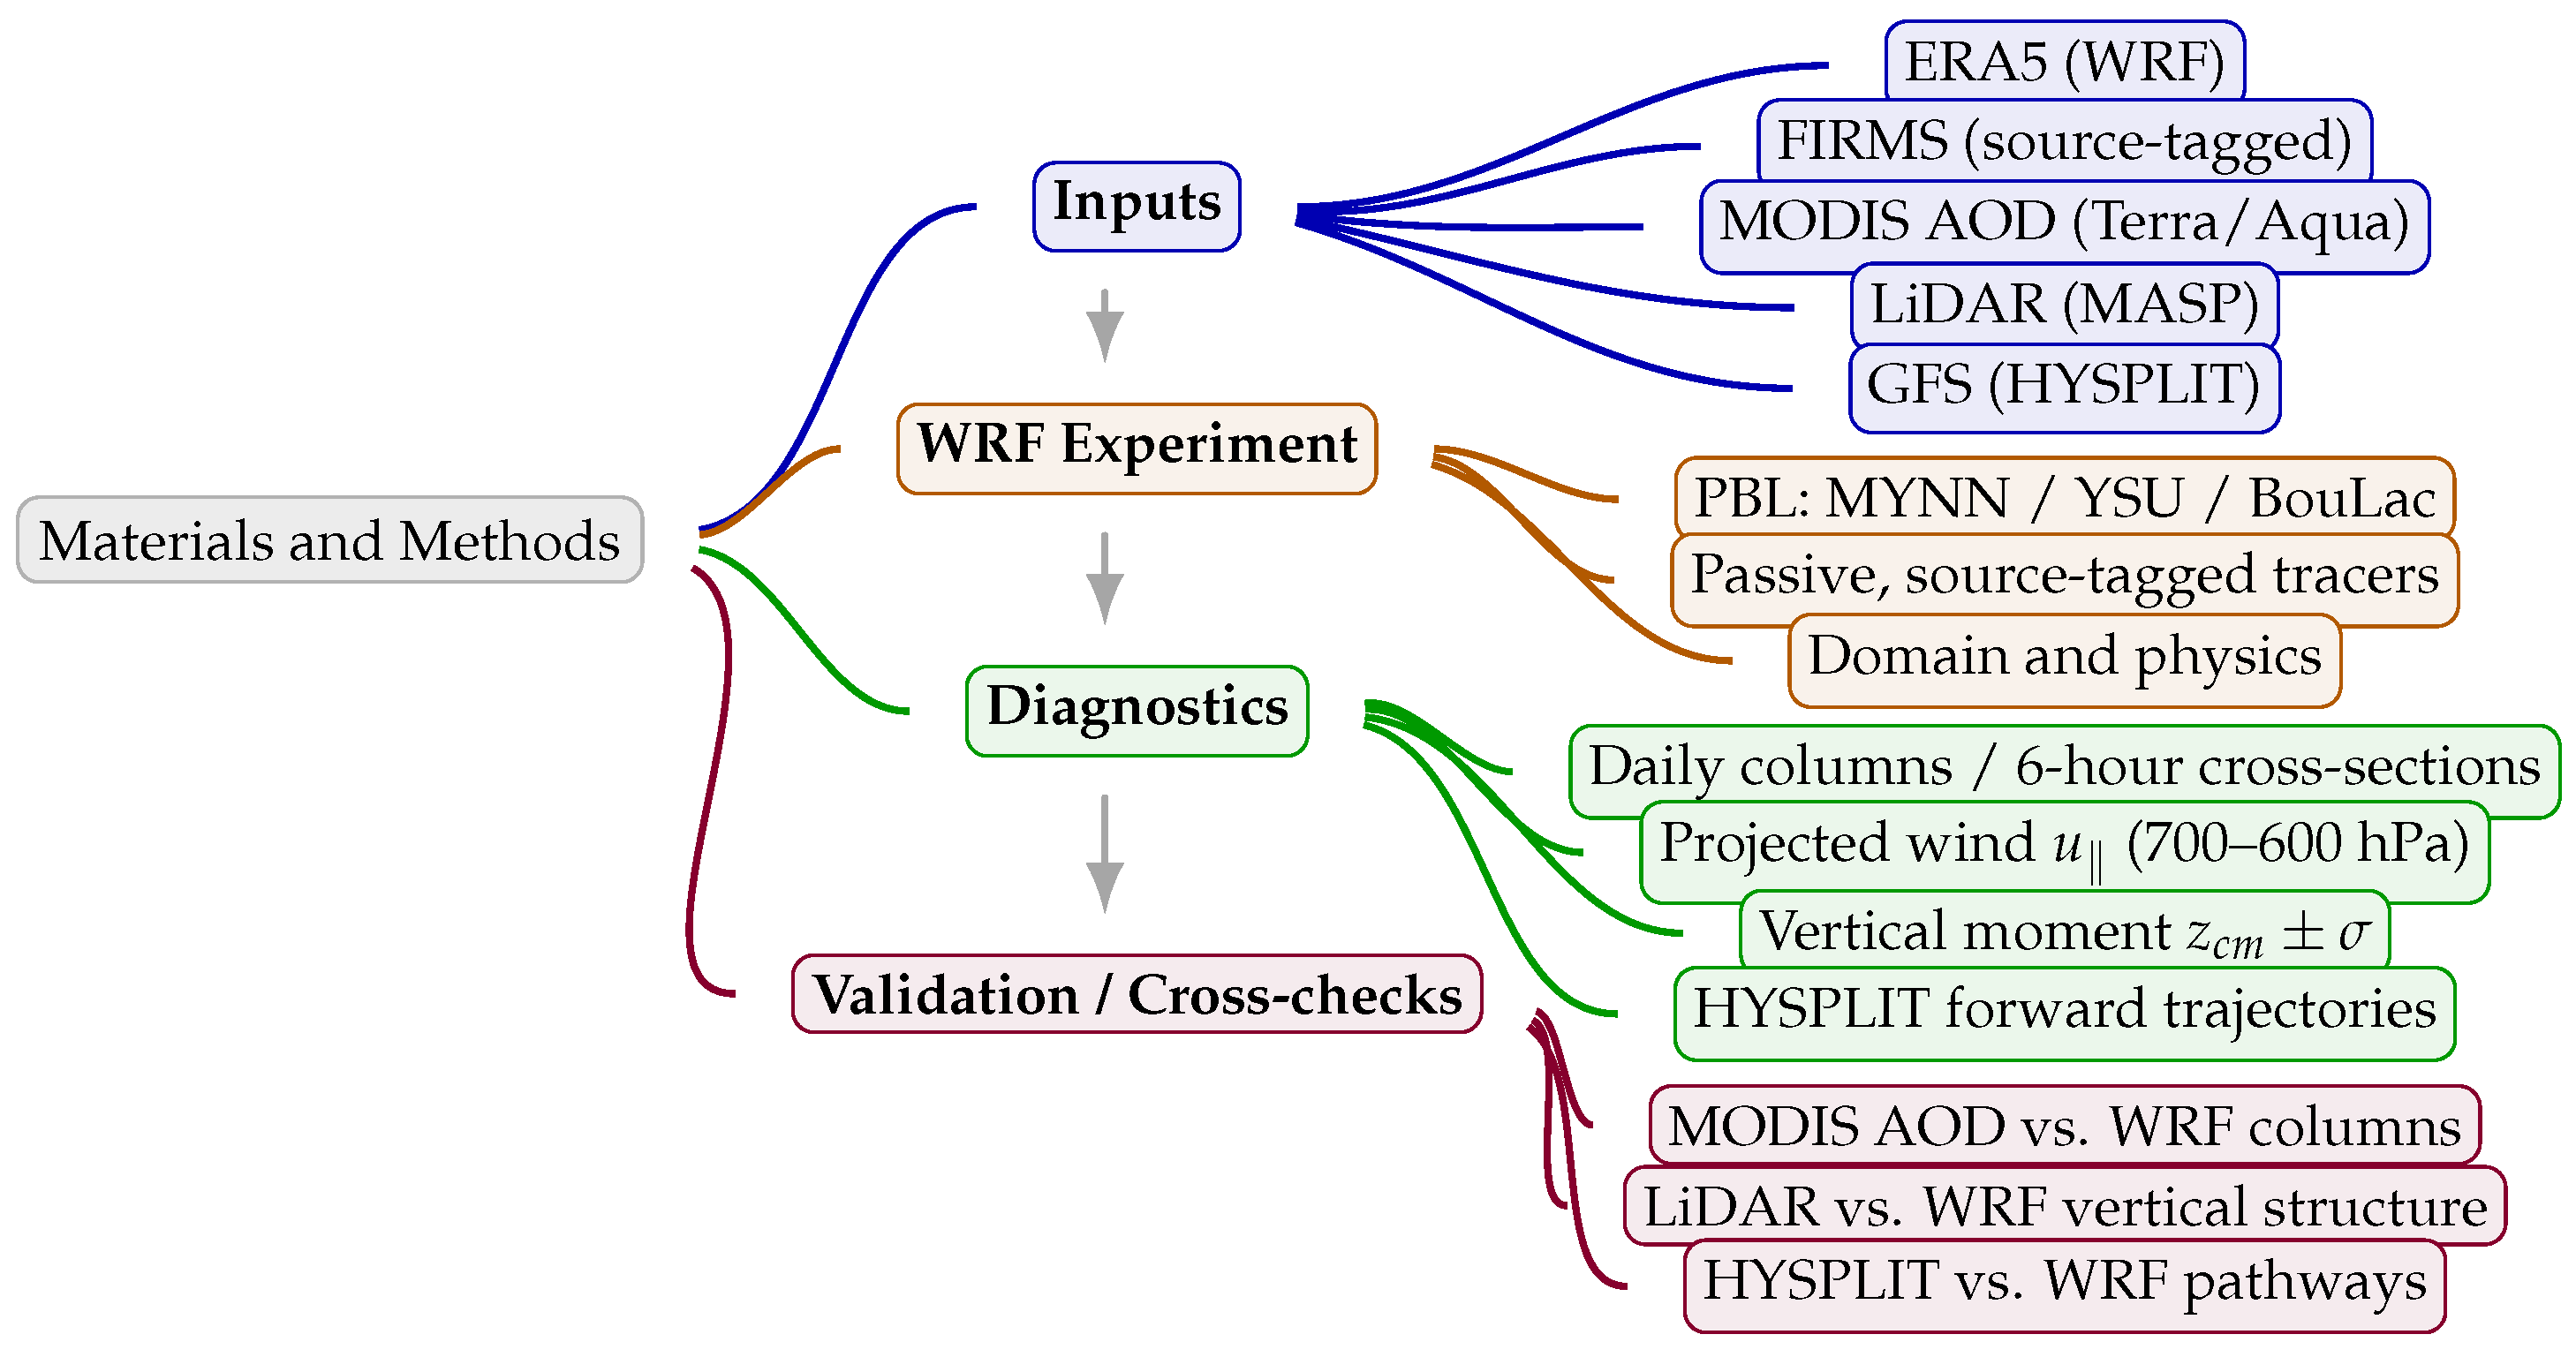
Figure 1. Overview of the methodological workflow used in this study: inputs → WRF experiment → diagnostics → validation.
Remotesensing 17 03483 g001
Figure 2. Daily MODIS AOD (550 nm) from Terra (MOD08_D3) and Aqua (MYD08_D3) of 17 August (a), 18 August (b), 19 August (c), and 20 August (d).
Remotesensing 17 03483 g002
Figure 3. LiDAR signal time–height cross-sections at 532 nm as recorded in MASP of 15 August 2019 (a), 18 August 2019 (morning) (b), and 18 August 2019 (afternoon/evening) (c). Images retrieved from the IPEN system (https://www.spulidarstation.org/, accessed on 5 February 2024).
Remotesensing 17 03483 g003
Figure 4. Numerical grid showing the model representation of elevation, and the location of Tracer’s starting points (blue), with the location of MASP (red).
Remotesensing 17 03483 g004
Figure 5. FIRMS Fire Radiate Power Pixel to study the area of 13 August 2019 (a), 14 August 2019 (b), 15 August 2019 (c), 16 August 2019 (d), 17 August 2019 (e), and 18 August 2019 (f). The black circle represents the area with the highest concentration of fire pixels.
Remotesensing 17 03483 g005
Figure 6. Synoptic evolution at 00 UTC from 15 August to 19 August 2019. Left column (a,c,e,g,i): A composition between 500 hPa relative vorticity (shaded), 850 hPa wind vectors, and mean-sea-level pressure (solid lines). Right column (b,d,f,h,j): A composition between 1000–500 hPa thickness (dashed red lines), 250 hPa jet speed (shaded), and sea-level pressure (solid lines).
Remotesensing 17 03483 g006
Figure 7. Total column of passive tracers for August 19, 2019. The red color represents tr17_t1, the green color represents tr17_t2, and the blue color represents tr17_t3. Each column represents the PBL scheme used.
Remotesensing 17 03483 g007
Figure 8. NOAA HYSPLIT trajectory model output for forward trajectories starting at 00:00 UTC on 16 August 2019. The duration of each trajectory is 72 h, indicating the position of tracers in different levels. The star marks the location of the city of MASP. The lower panels show the time and altitude of each particle.
Remotesensing 17 03483 g008
Figure 9. Latitudinal–longitudinal cross-section for tr17 t1 for 19 August 2019, over the three simulations. The black dashed line indicates the location of MASP. The map on the right indicates the region in which the cross-section was made. The black vectors indicate wind intensity and direction.
Remotesensing 17 03483 g009
Figure 10. Latitudinal–longitudinal cross-section for tr17 t2 for 19 August 2019, over the three simulations. The black dashed line indicates the location of MASP. The map on the right indicates the region in which the cross-section was made. The black vectors indicate wind intensity and direction.
Remotesensing 17 03483 g010
Figure 11. Latitudinal–longitudinal cross-section for tr17 t3 for 19 August 2019, over the three simulations. The black dashed line indicates the location of MASP. The map on the right indicates the region in which the cross-section was made. The black vectors indicate wind intensity and direction.
Remotesensing 17 03483 g011
Figure 12. Near-source diagnostics for tr17_t1 (radius = 20 km), 15 August 00 UTC–20 August 00 UTC. (a) PBL height (PBLH, m), (b) column-integrated tracer (mg m−2), and (c) diurnal composite of column (mean ± 1 σ ). Curves for MYNN, YSU, and BouLac with shared axes across schemes.
Remotesensing 17 03483 g012
Figure 13. Near-source diagnostics for tr17_t2 (radius = 20 km), 15 August 00 UTC–20 August 00 UTC. (a) PBL height (PBLH, m), (b) column-integrated tracer (mg m−2), and (c) diurnal composite of column (mean ± 1 σ ). Curves for MYNN, YSU, and BouLac with shared axes across schemes.
Remotesensing 17 03483 g013
Figure 14. Near-source diagnostics for tr17_t3 (radius = 20 km), 15 August 00 UTC–20 August 00 UTC. (a) PBL height (PBLH, m), (b) column-integrated tracer (mg m−2), and (c) diurnal composite of column (mean ± 1 σ ). Curves for MYNN, YSU, and BouLac with shared axes across schemes.
Remotesensing 17 03483 g014
Figure 15. Projected mid-level wind u (700–600 hPa) along the cross-section for tr17_t1 (legs 0, 0.25, 0.5, 0.75, and 1). The curves indicating MYNN, YSU, and BouLac.
Remotesensing 17 03483 g015
Figure 16. Vertical moment ( z c m + σ z ) of the tracer column along the transect for tr17_t1 (legs 0, 0.25, 0.5, 0.75, and 1). The curves indicating MYNN, YSU, and BouLac.
Remotesensing 17 03483 g016
Figure 17. Projected mid-level wind u (700–600 hPa) along the cross-section for tr17_t2 (legs 0, 0.25, 0.5, 0.75, and 1). The curves indicating MYNN, YSU, and BouLac.
Remotesensing 17 03483 g017
Figure 18. Vertical moment ( z c m + σ z ) of the tracer column along the transect for tr17_t2 (legs 0, 0.25, 0.5, 0.75, and 1). The curves indicating MYNN, YSU, and BouLac.
Remotesensing 17 03483 g018
Figure 19. Projected mid-level wind u (700–600 hPa) along the cross-section for tr17_t2 (legs 0, 0.25, 0.5, 0.75, and 1). The curves indicating MYNN, YSU, and BouLac.
Remotesensing 17 03483 g019
Figure 20. Vertical moment ( z c m + σ z ) of the tracer column along the transect for tr17_t3 (legs 0, 0.25, 0.5, 0.75, and 1). The curves indicating MYNN, YSU, and BouLac.
Remotesensing 17 03483 g020
Table 1. Schemes of parameterization employed in the simulation.
OptionsNameReference
RadiationRRTMG[31]
SurfaceWRF Revised[32]
CumulusGrell-Freitas[33]
MicrophysicsWSM6[34]
Table 2. Set of passive tracers based on latitudes and longitudes.
TracerLatitude (°)Longitude (°)
tr17_t1−8.851−61.580
tr17_t2−15.372−61.617
tr17_t3−8.096−66.981
Disclaimer/Publisher’s Note: The statements, opinions and data contained in all publications are solely those of the individual author(s) and contributor(s) and not of MDPI and/or the editor(s). MDPI and/or the editor(s) disclaim responsibility for any injury to people or property resulting from any ideas, methods, instructions or products referred to in the content.