Author Contributions
Conceptualization, F.T. and K.D.P.; methodology, software, validation, formal analysis, investigation, K.D.P.; resources, data curation, F.T. and K.D.P.; writing—original draft preparation, K.D.P.; writing—review and editing, F.T.; visualization, K.D.P.; supervision, project administration F.T. All authors have read and agreed to the published version of the manuscript.
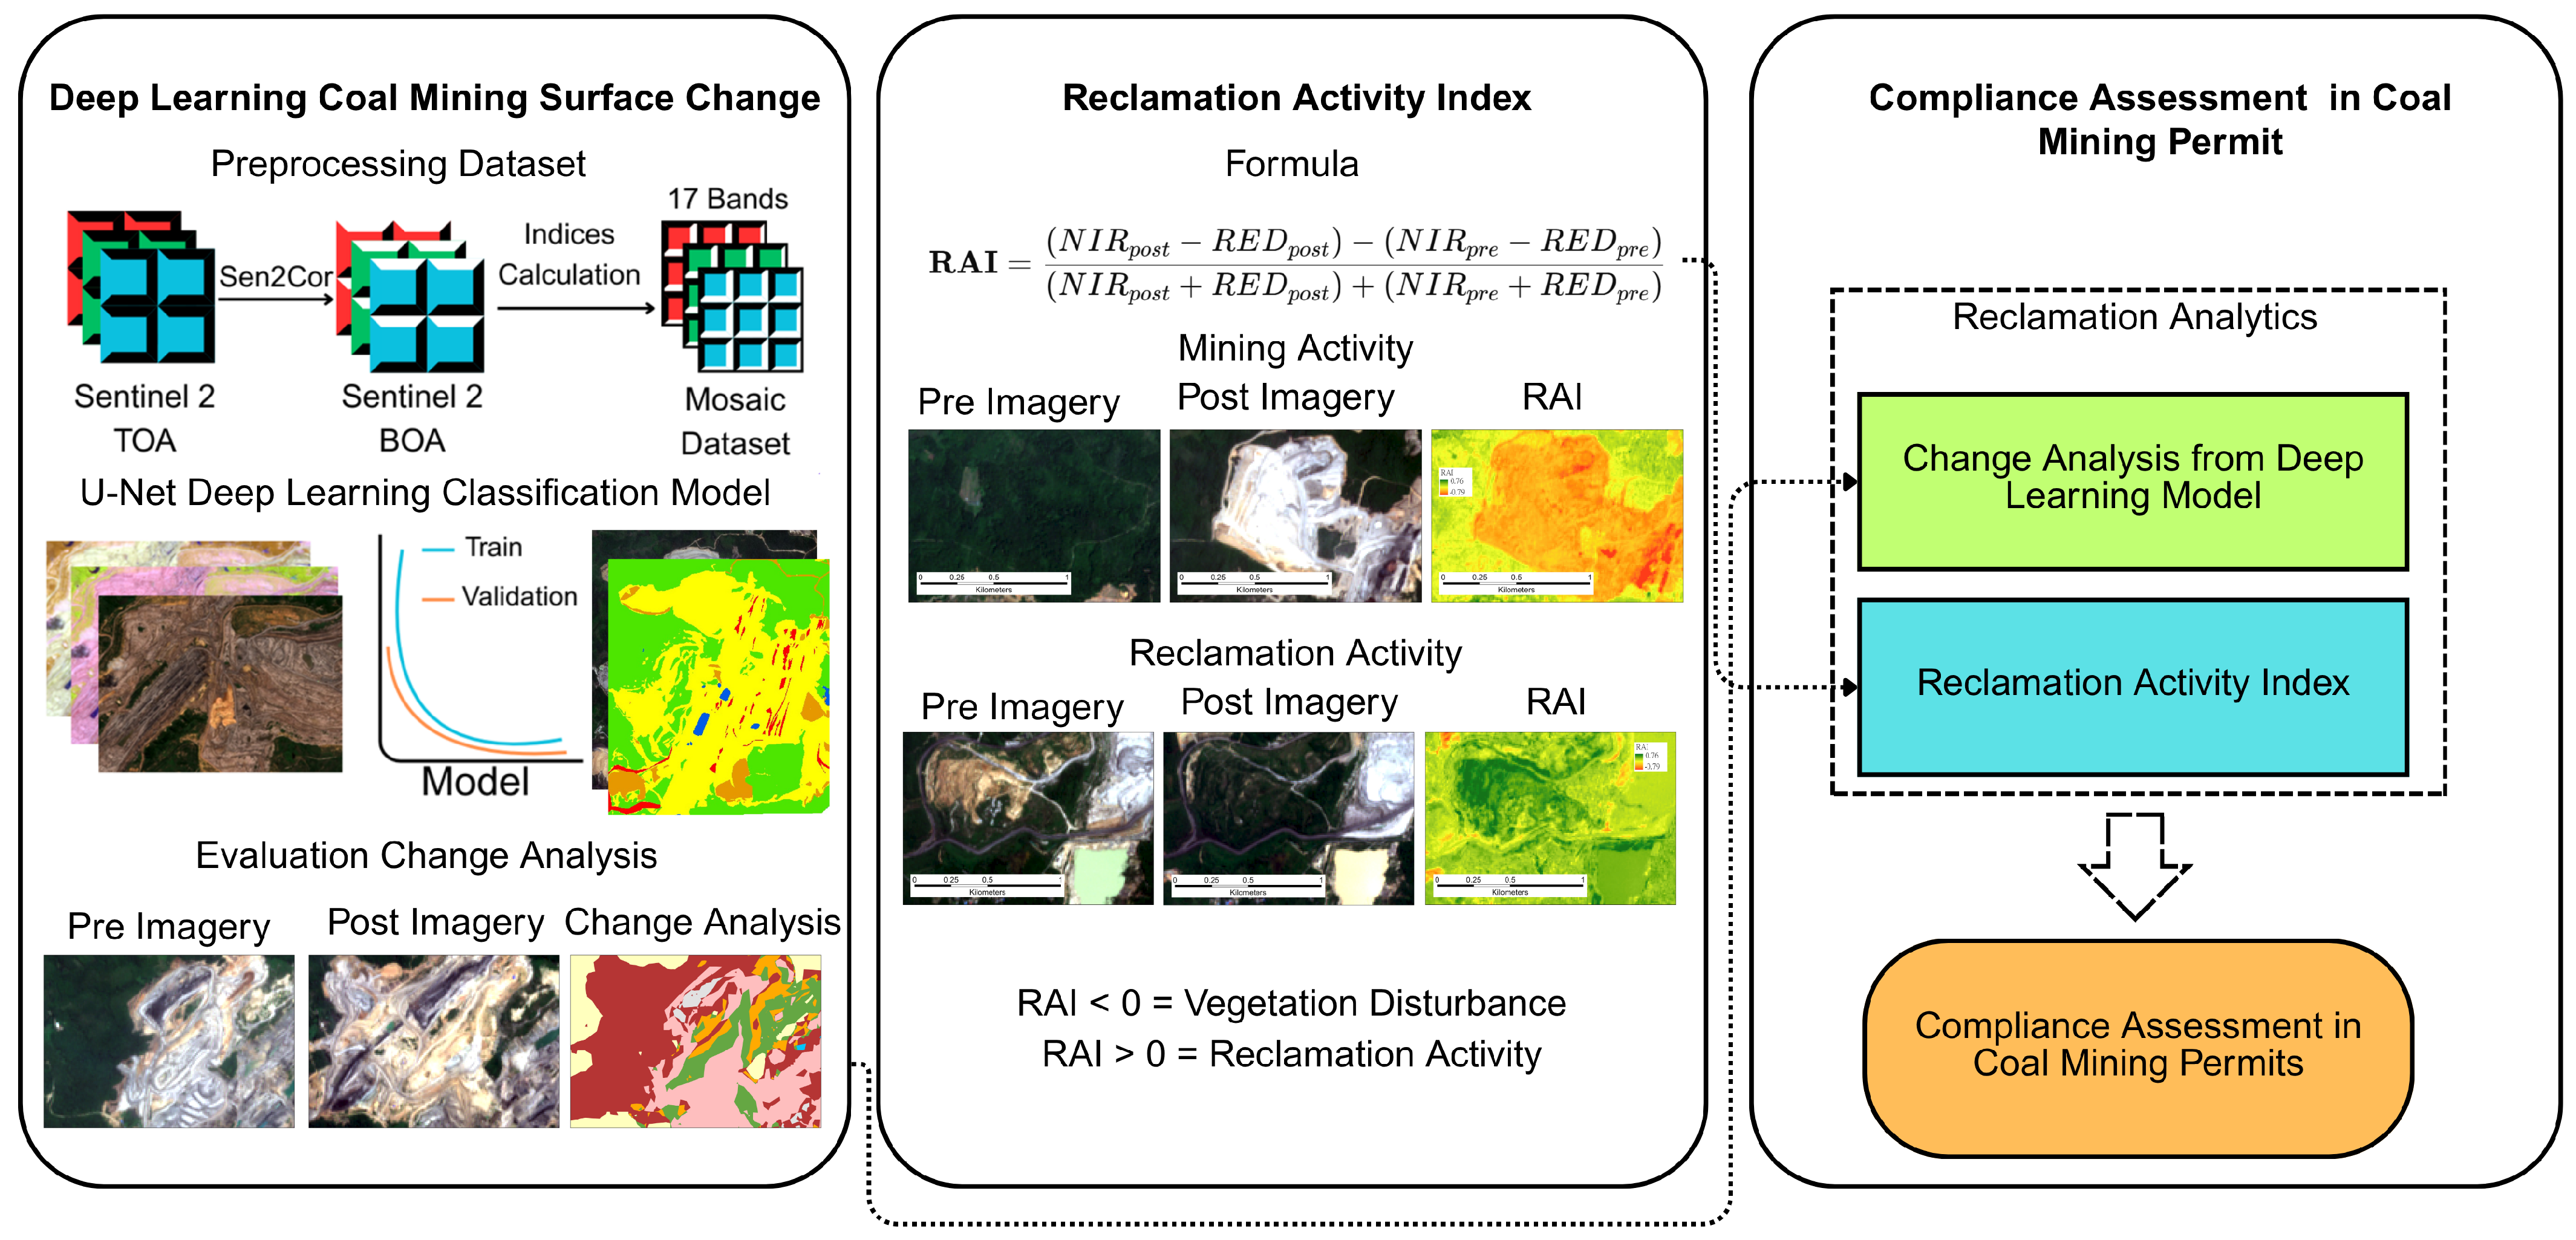
Figure 1.
Workflow of deep learning and RAI integration for assessing reclamation compliance in coal mining permits.
Figure 1.
Workflow of deep learning and RAI integration for assessing reclamation compliance in coal mining permits.
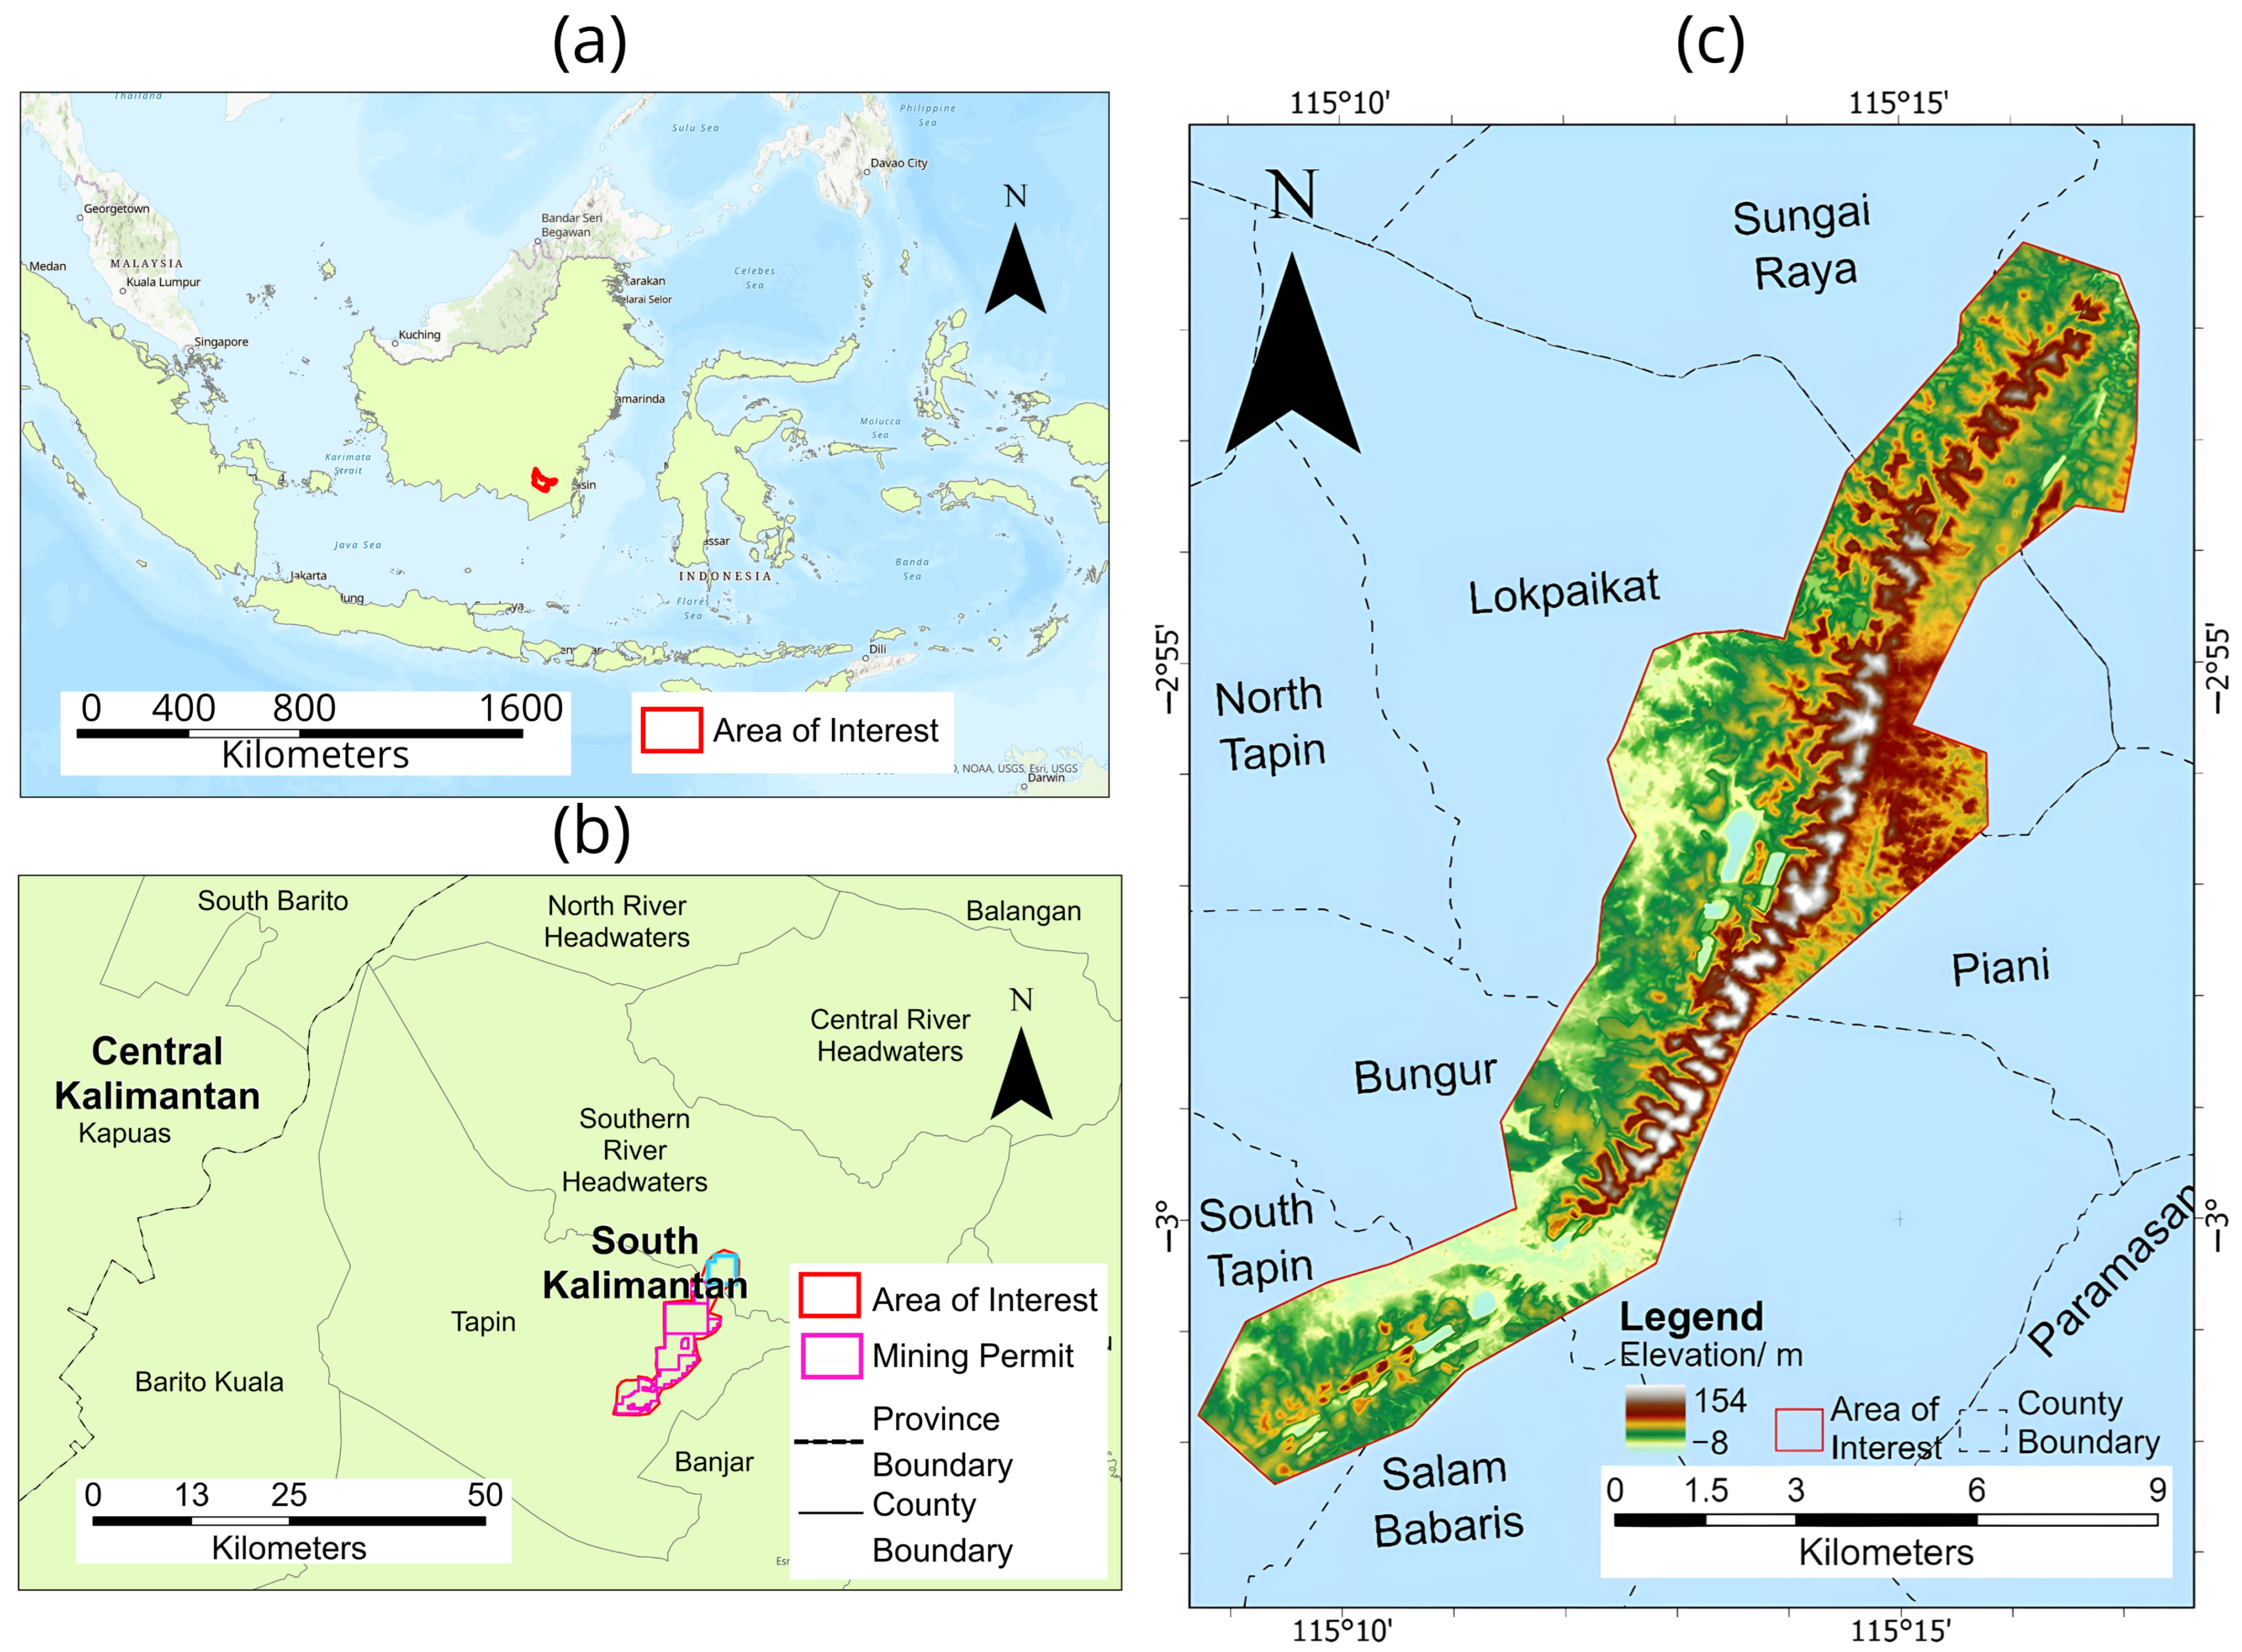
Figure 2.
Study area location: (a) Indonesia, (b) South Kalimantan province showing the area surrounding the Area of Interest (AOI) and (c) Digital Elevation Model (DEM) in the Hulu Tapin coal mining region.
Figure 2.
Study area location: (a) Indonesia, (b) South Kalimantan province showing the area surrounding the Area of Interest (AOI) and (c) Digital Elevation Model (DEM) in the Hulu Tapin coal mining region.
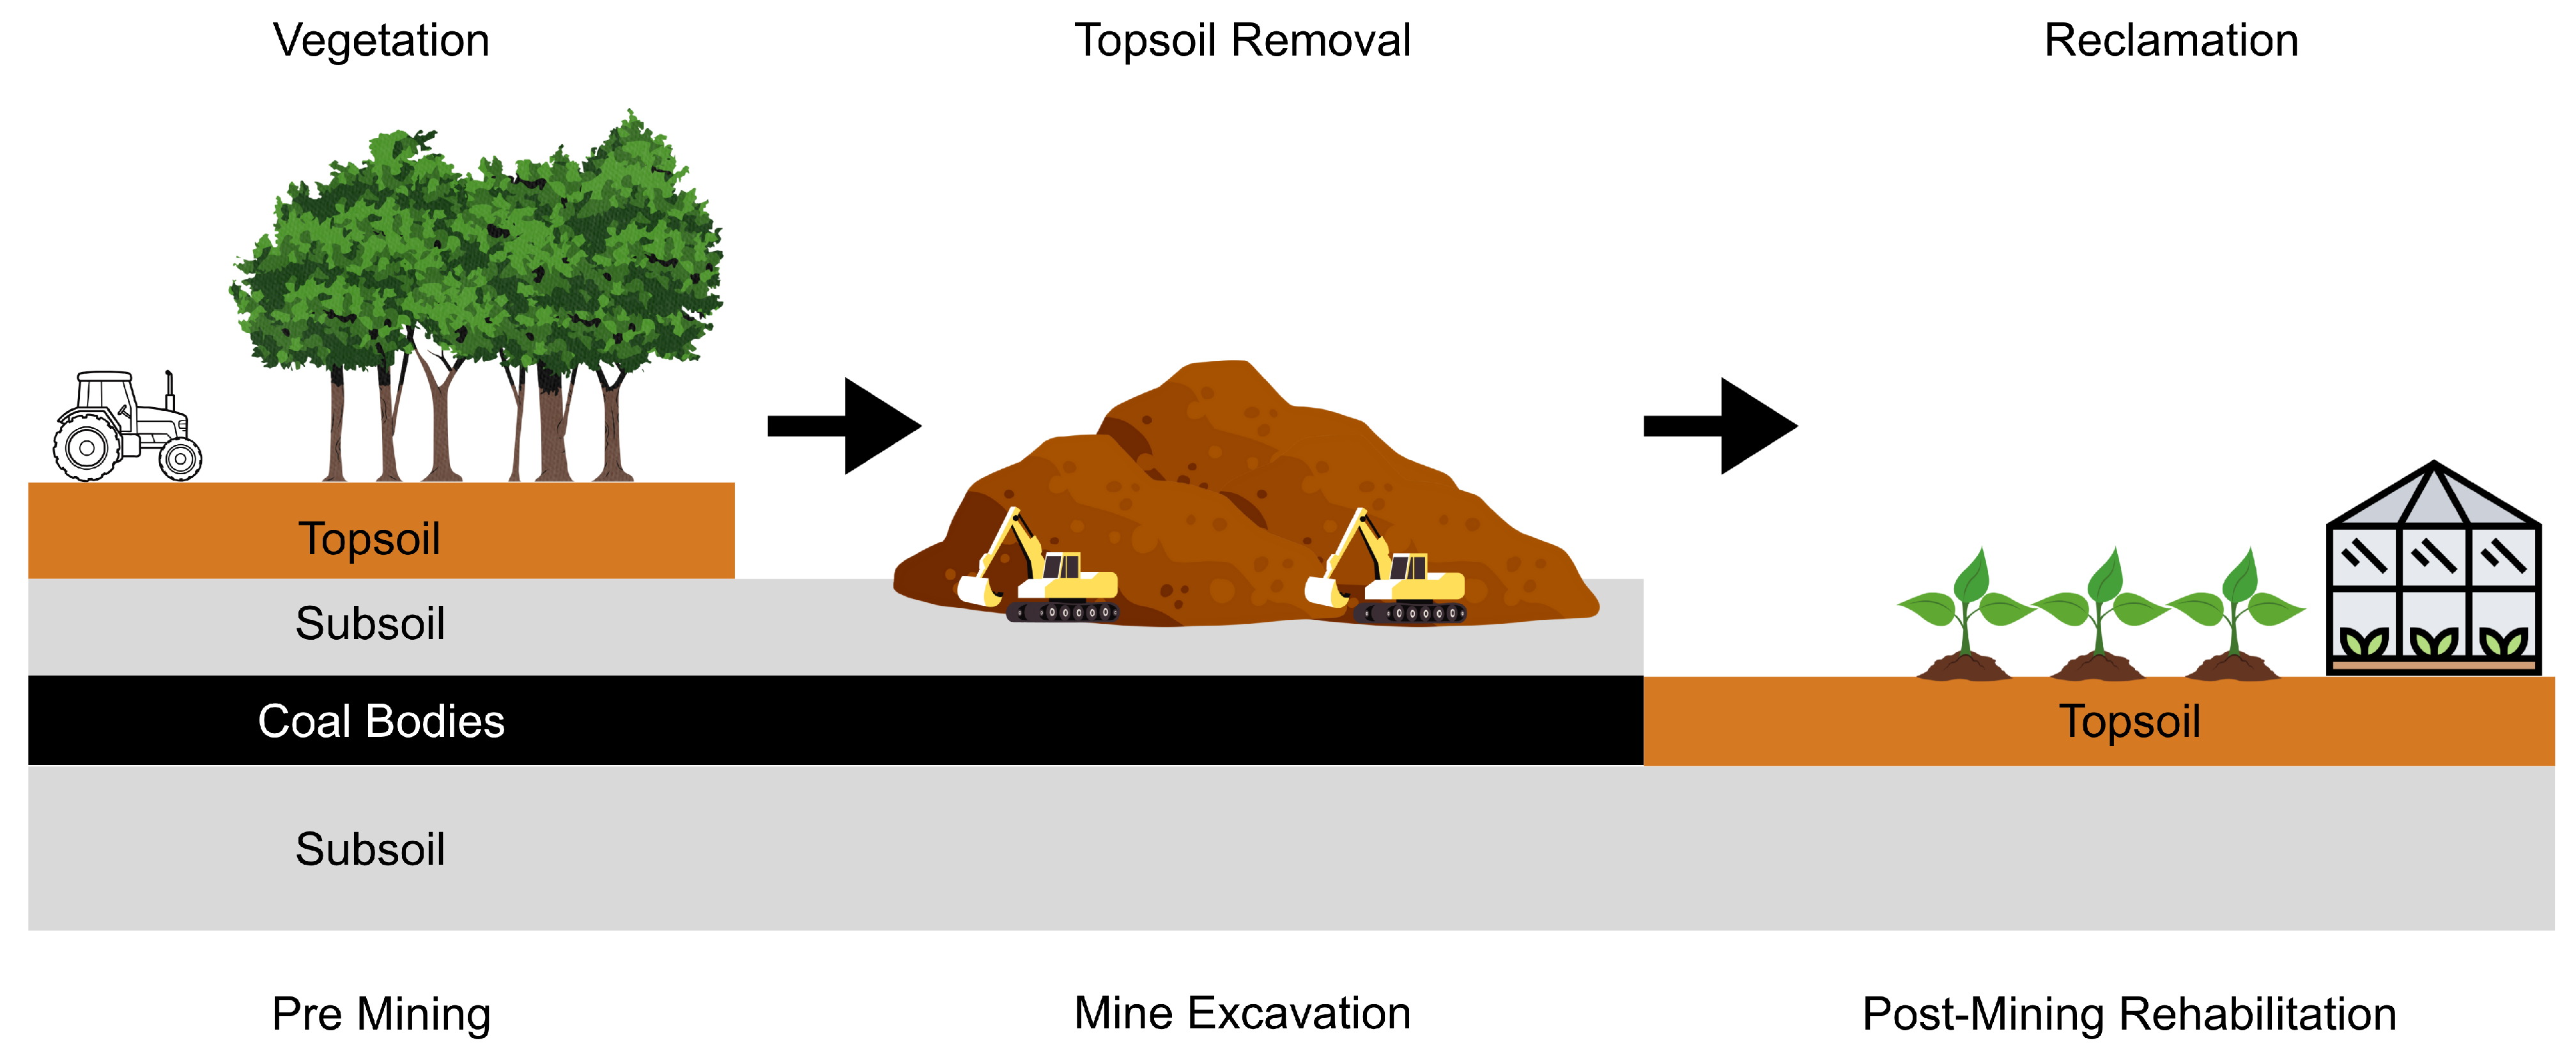
Figure 3.
Stages of coal mining and reclamation process.
Figure 3.
Stages of coal mining and reclamation process.
Figure 4.
Sentinel 2 imagery illustrates coal mining areas with different surface components, including topsoil, subsoil, coal bodies, vegetation, and water bodies, which are highlighted for visual interpretation. The true color (RGB) composite displays natural surface features, while the false color composites (SWIR1, SWIR2, Red) and (SWIR1, NIR, Red) enhance soil and vegetation contrasts to facilitate visual discrimination.
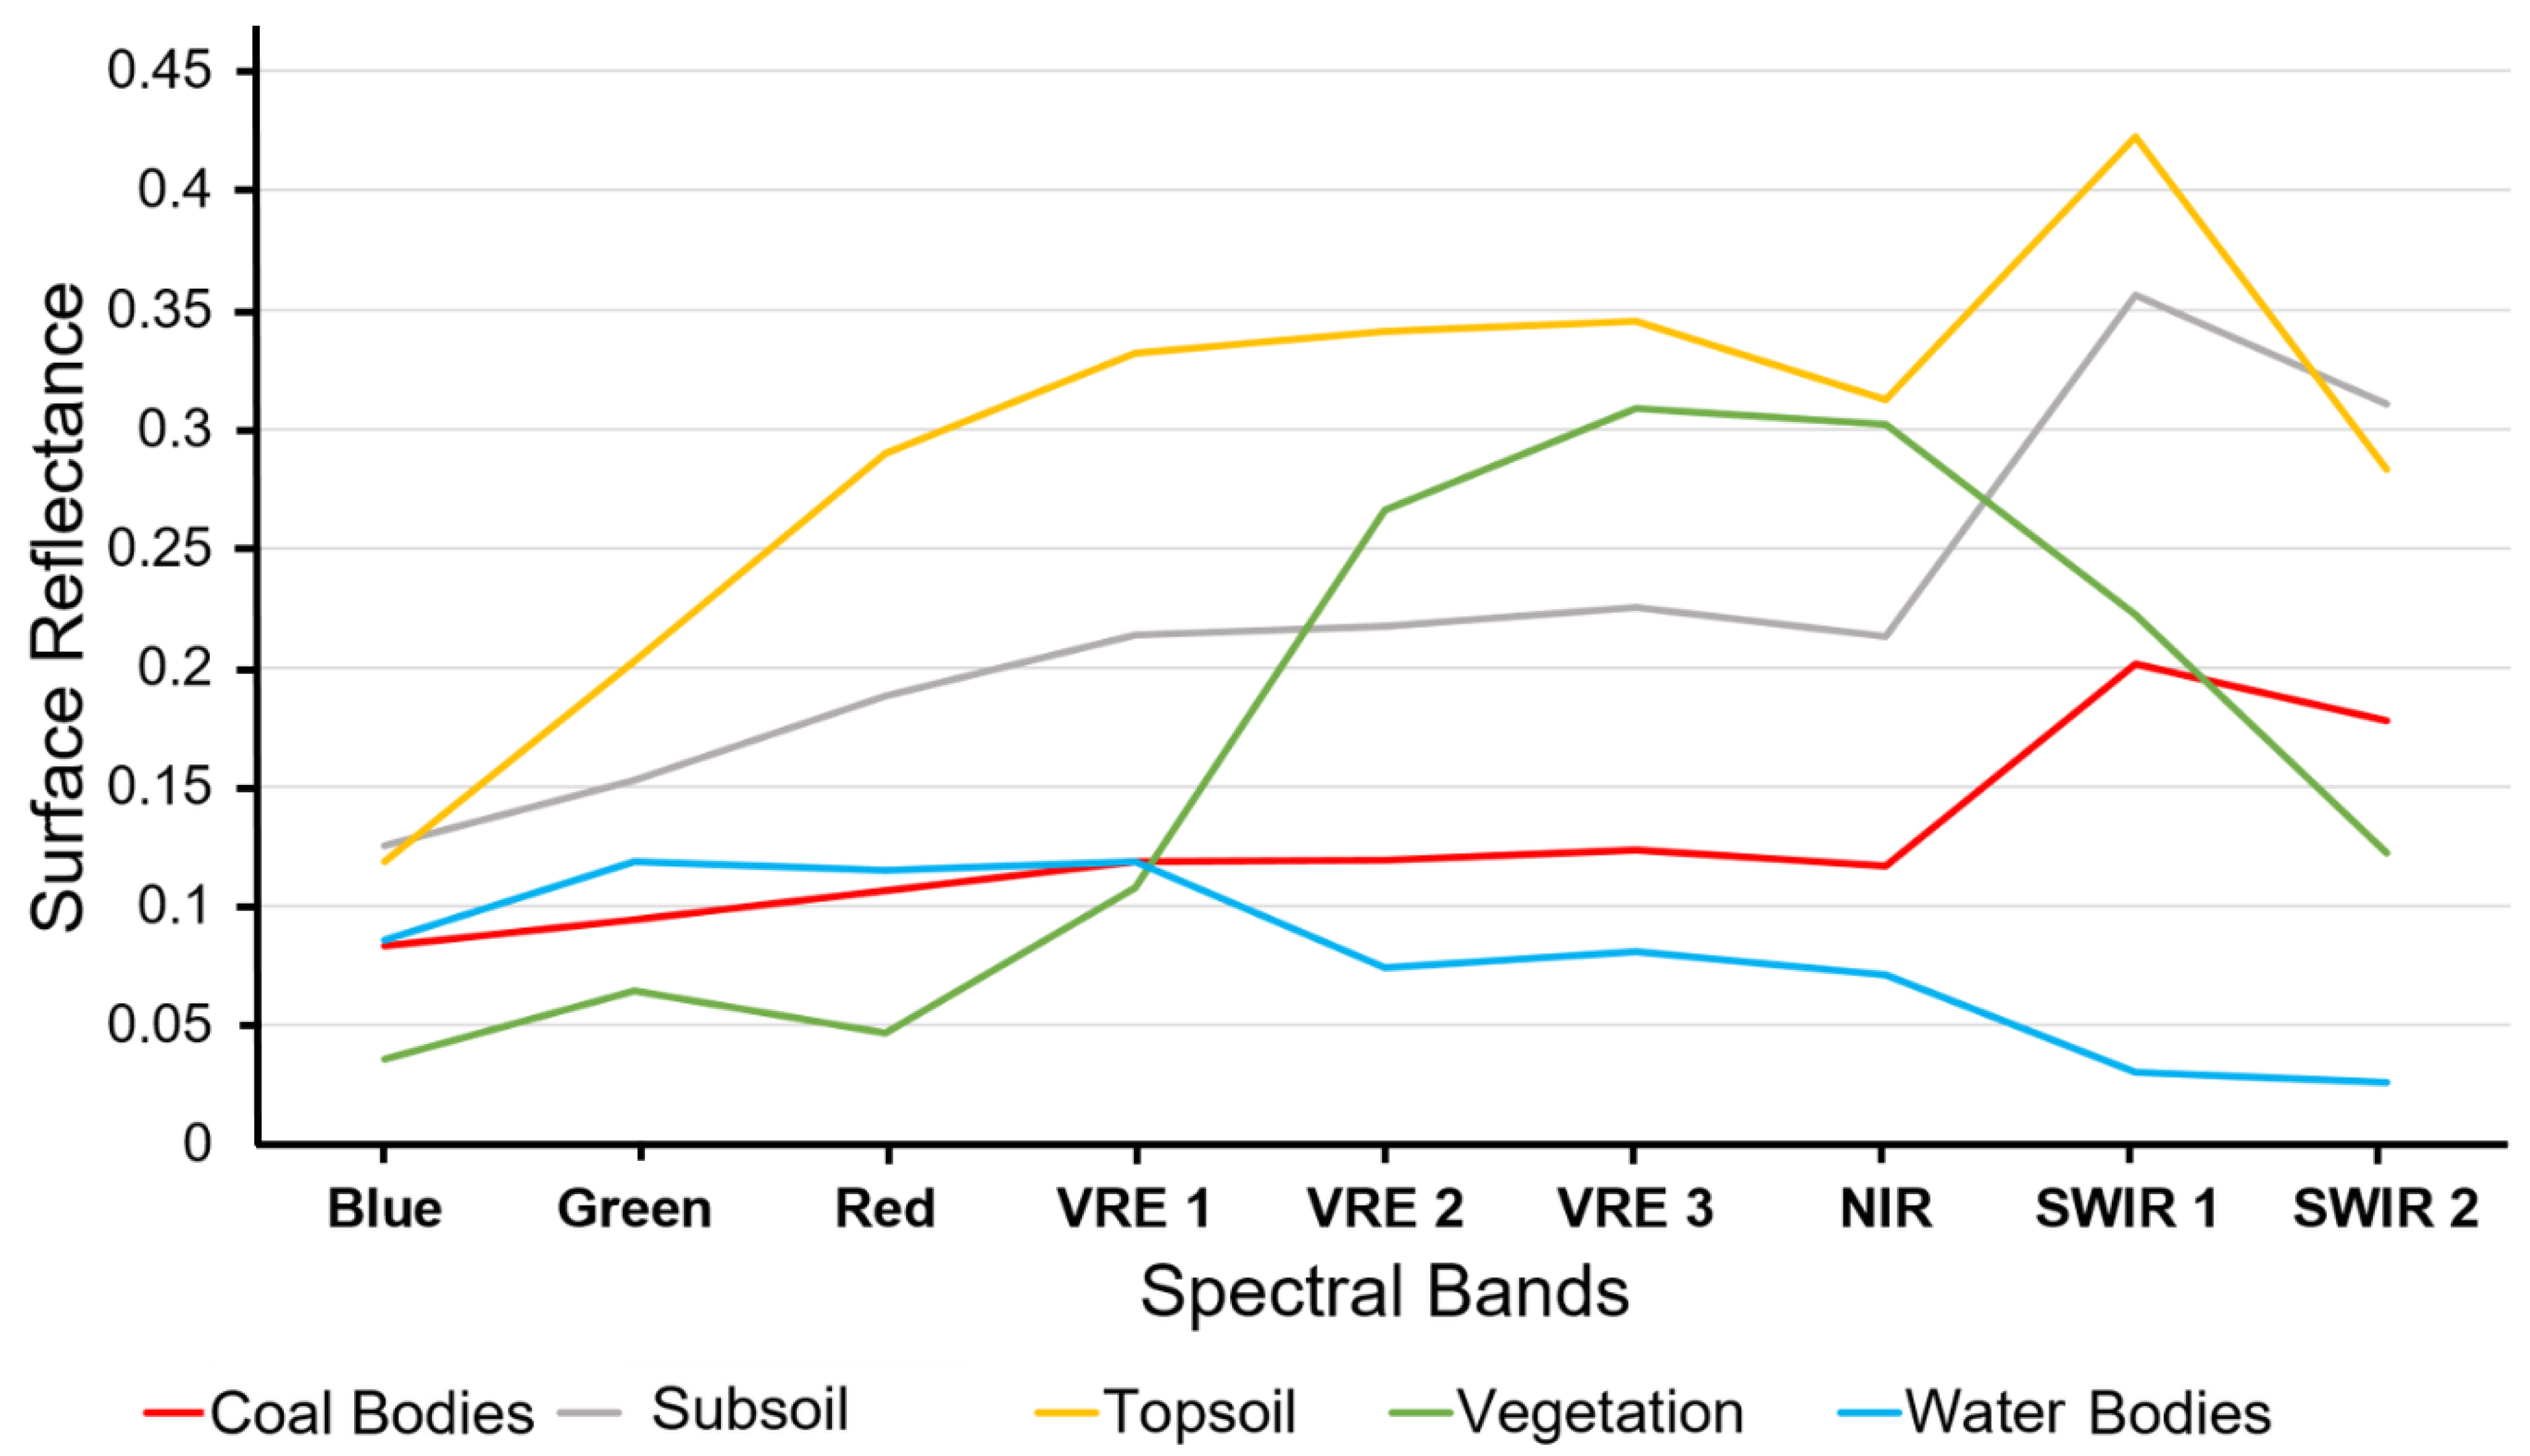
Figure 5.
Spectral reflectance comparison of coal mining surface change and reclamation process.
Figure 5.
Spectral reflectance comparison of coal mining surface change and reclamation process.
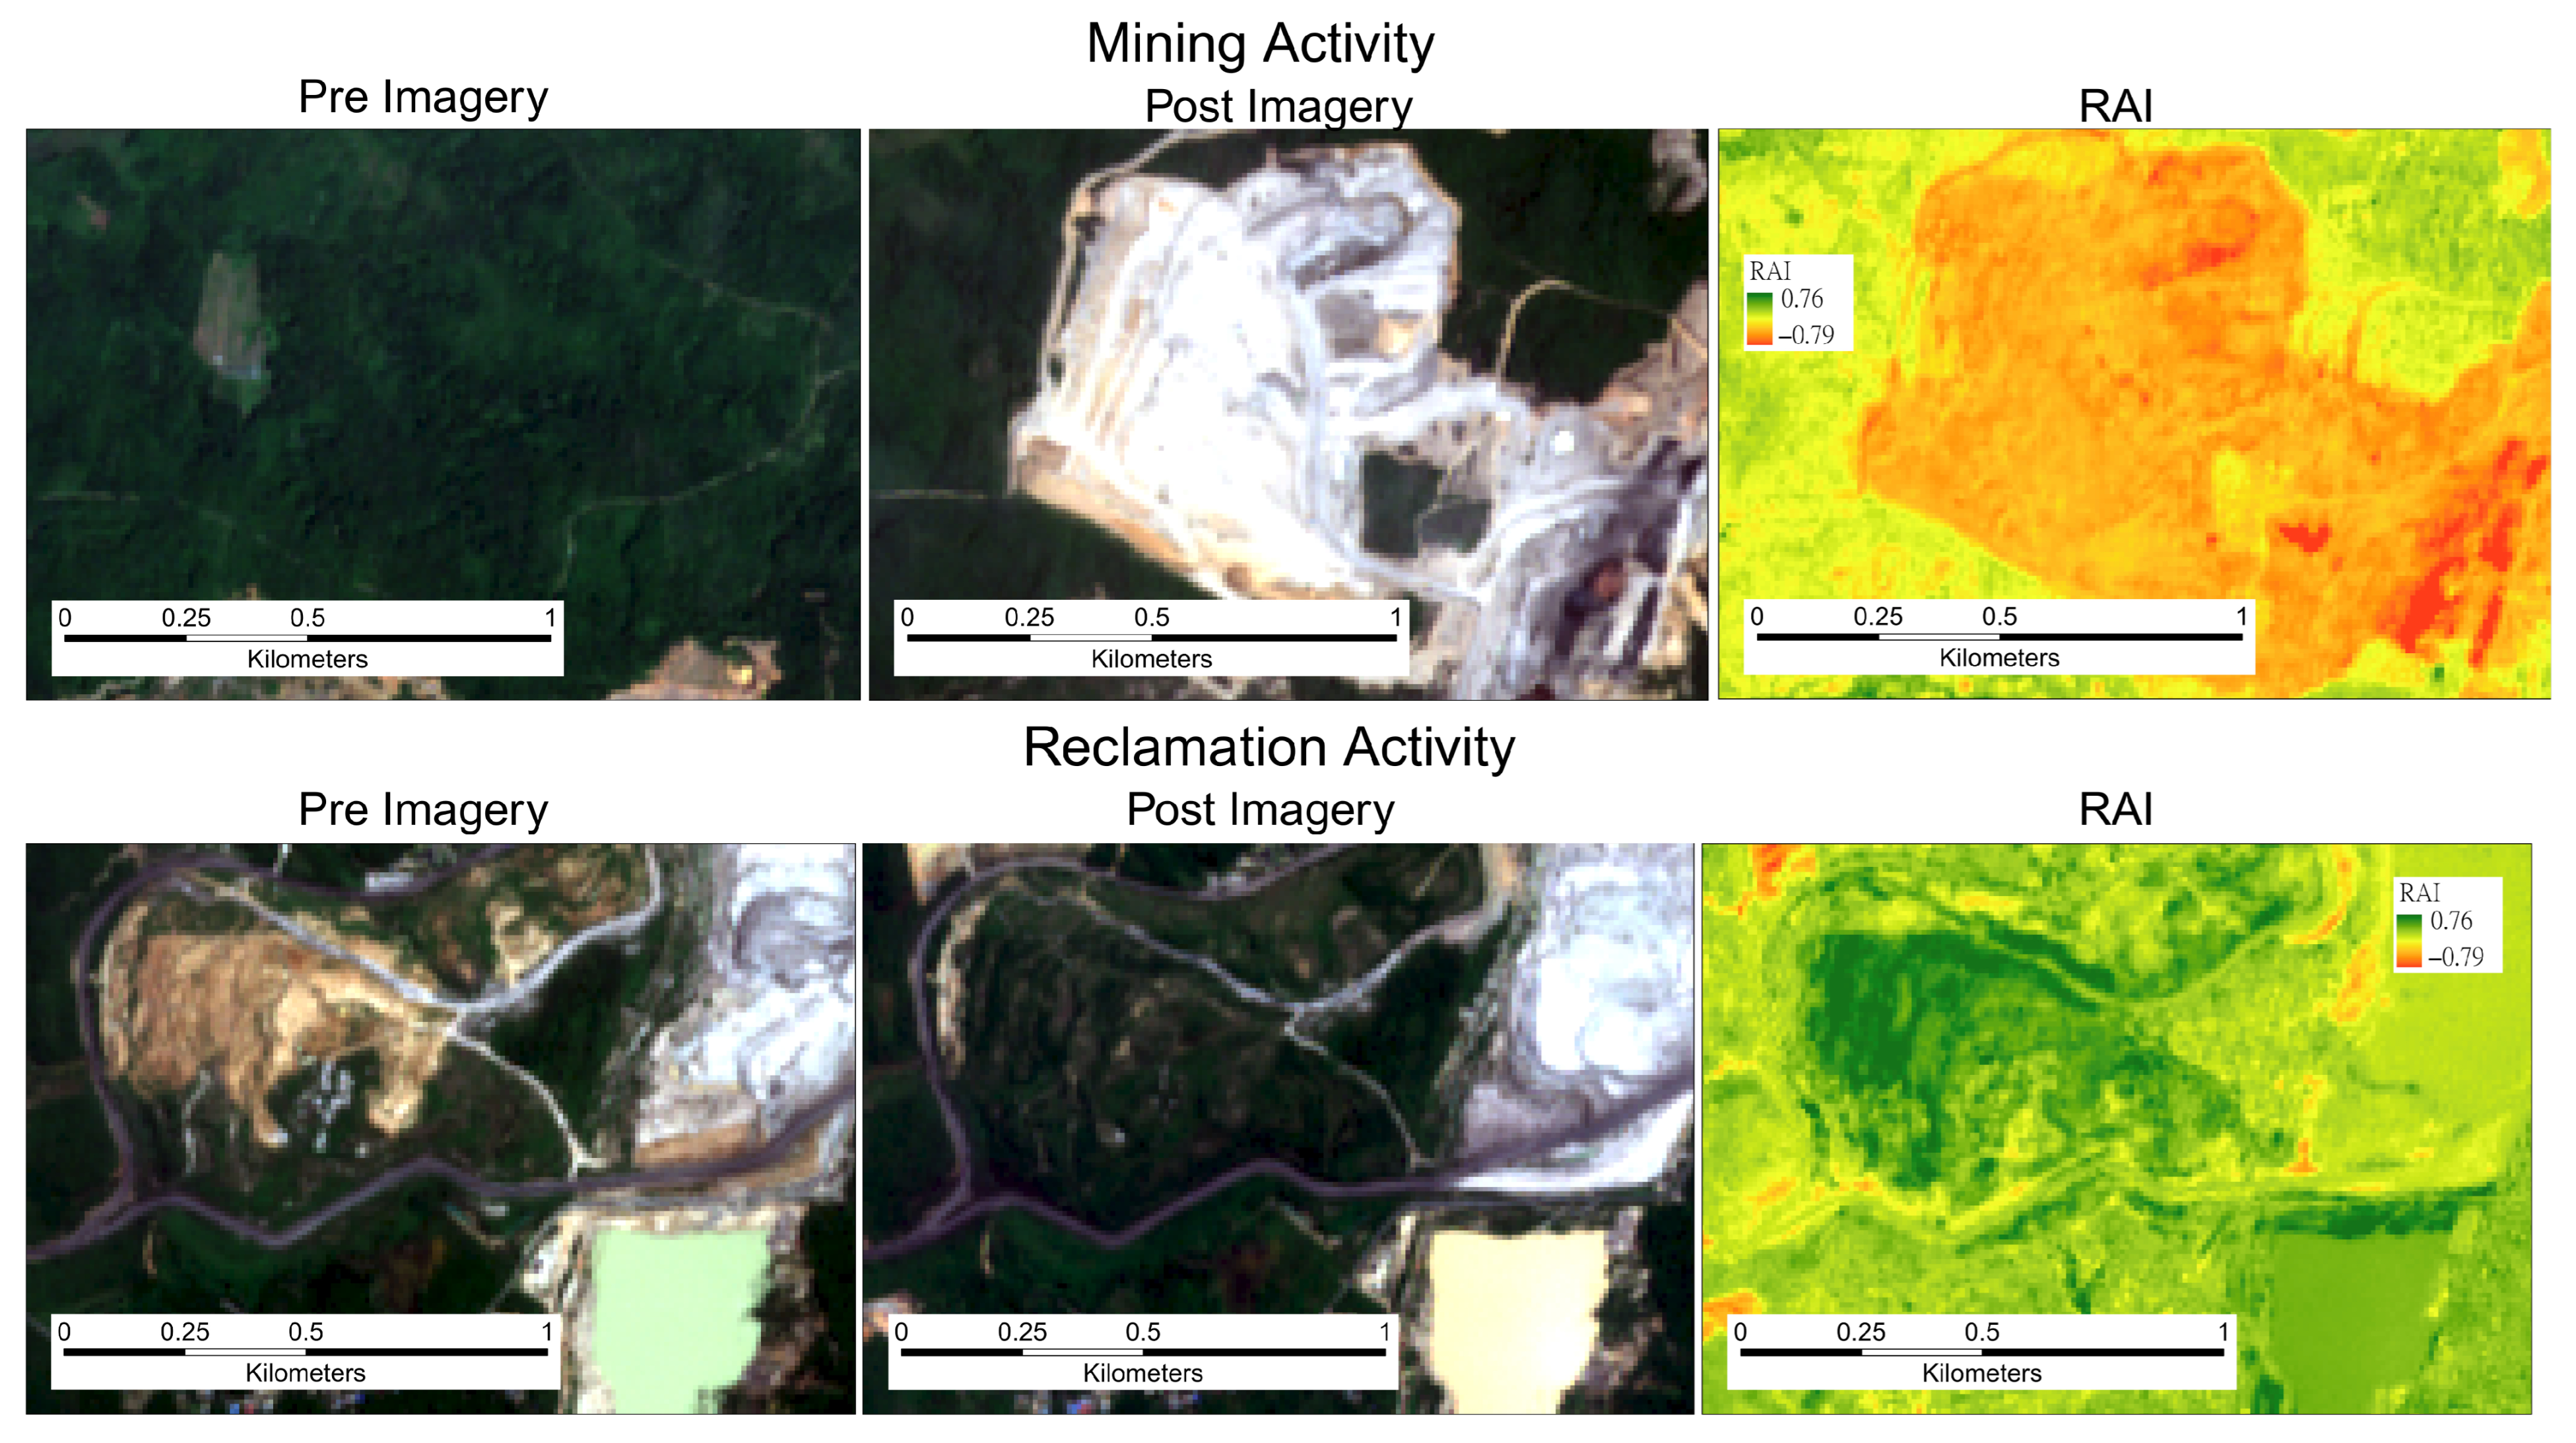
Figure 6.
RAI for monitoring mining and reclamation activity.
Figure 6.
RAI for monitoring mining and reclamation activity.
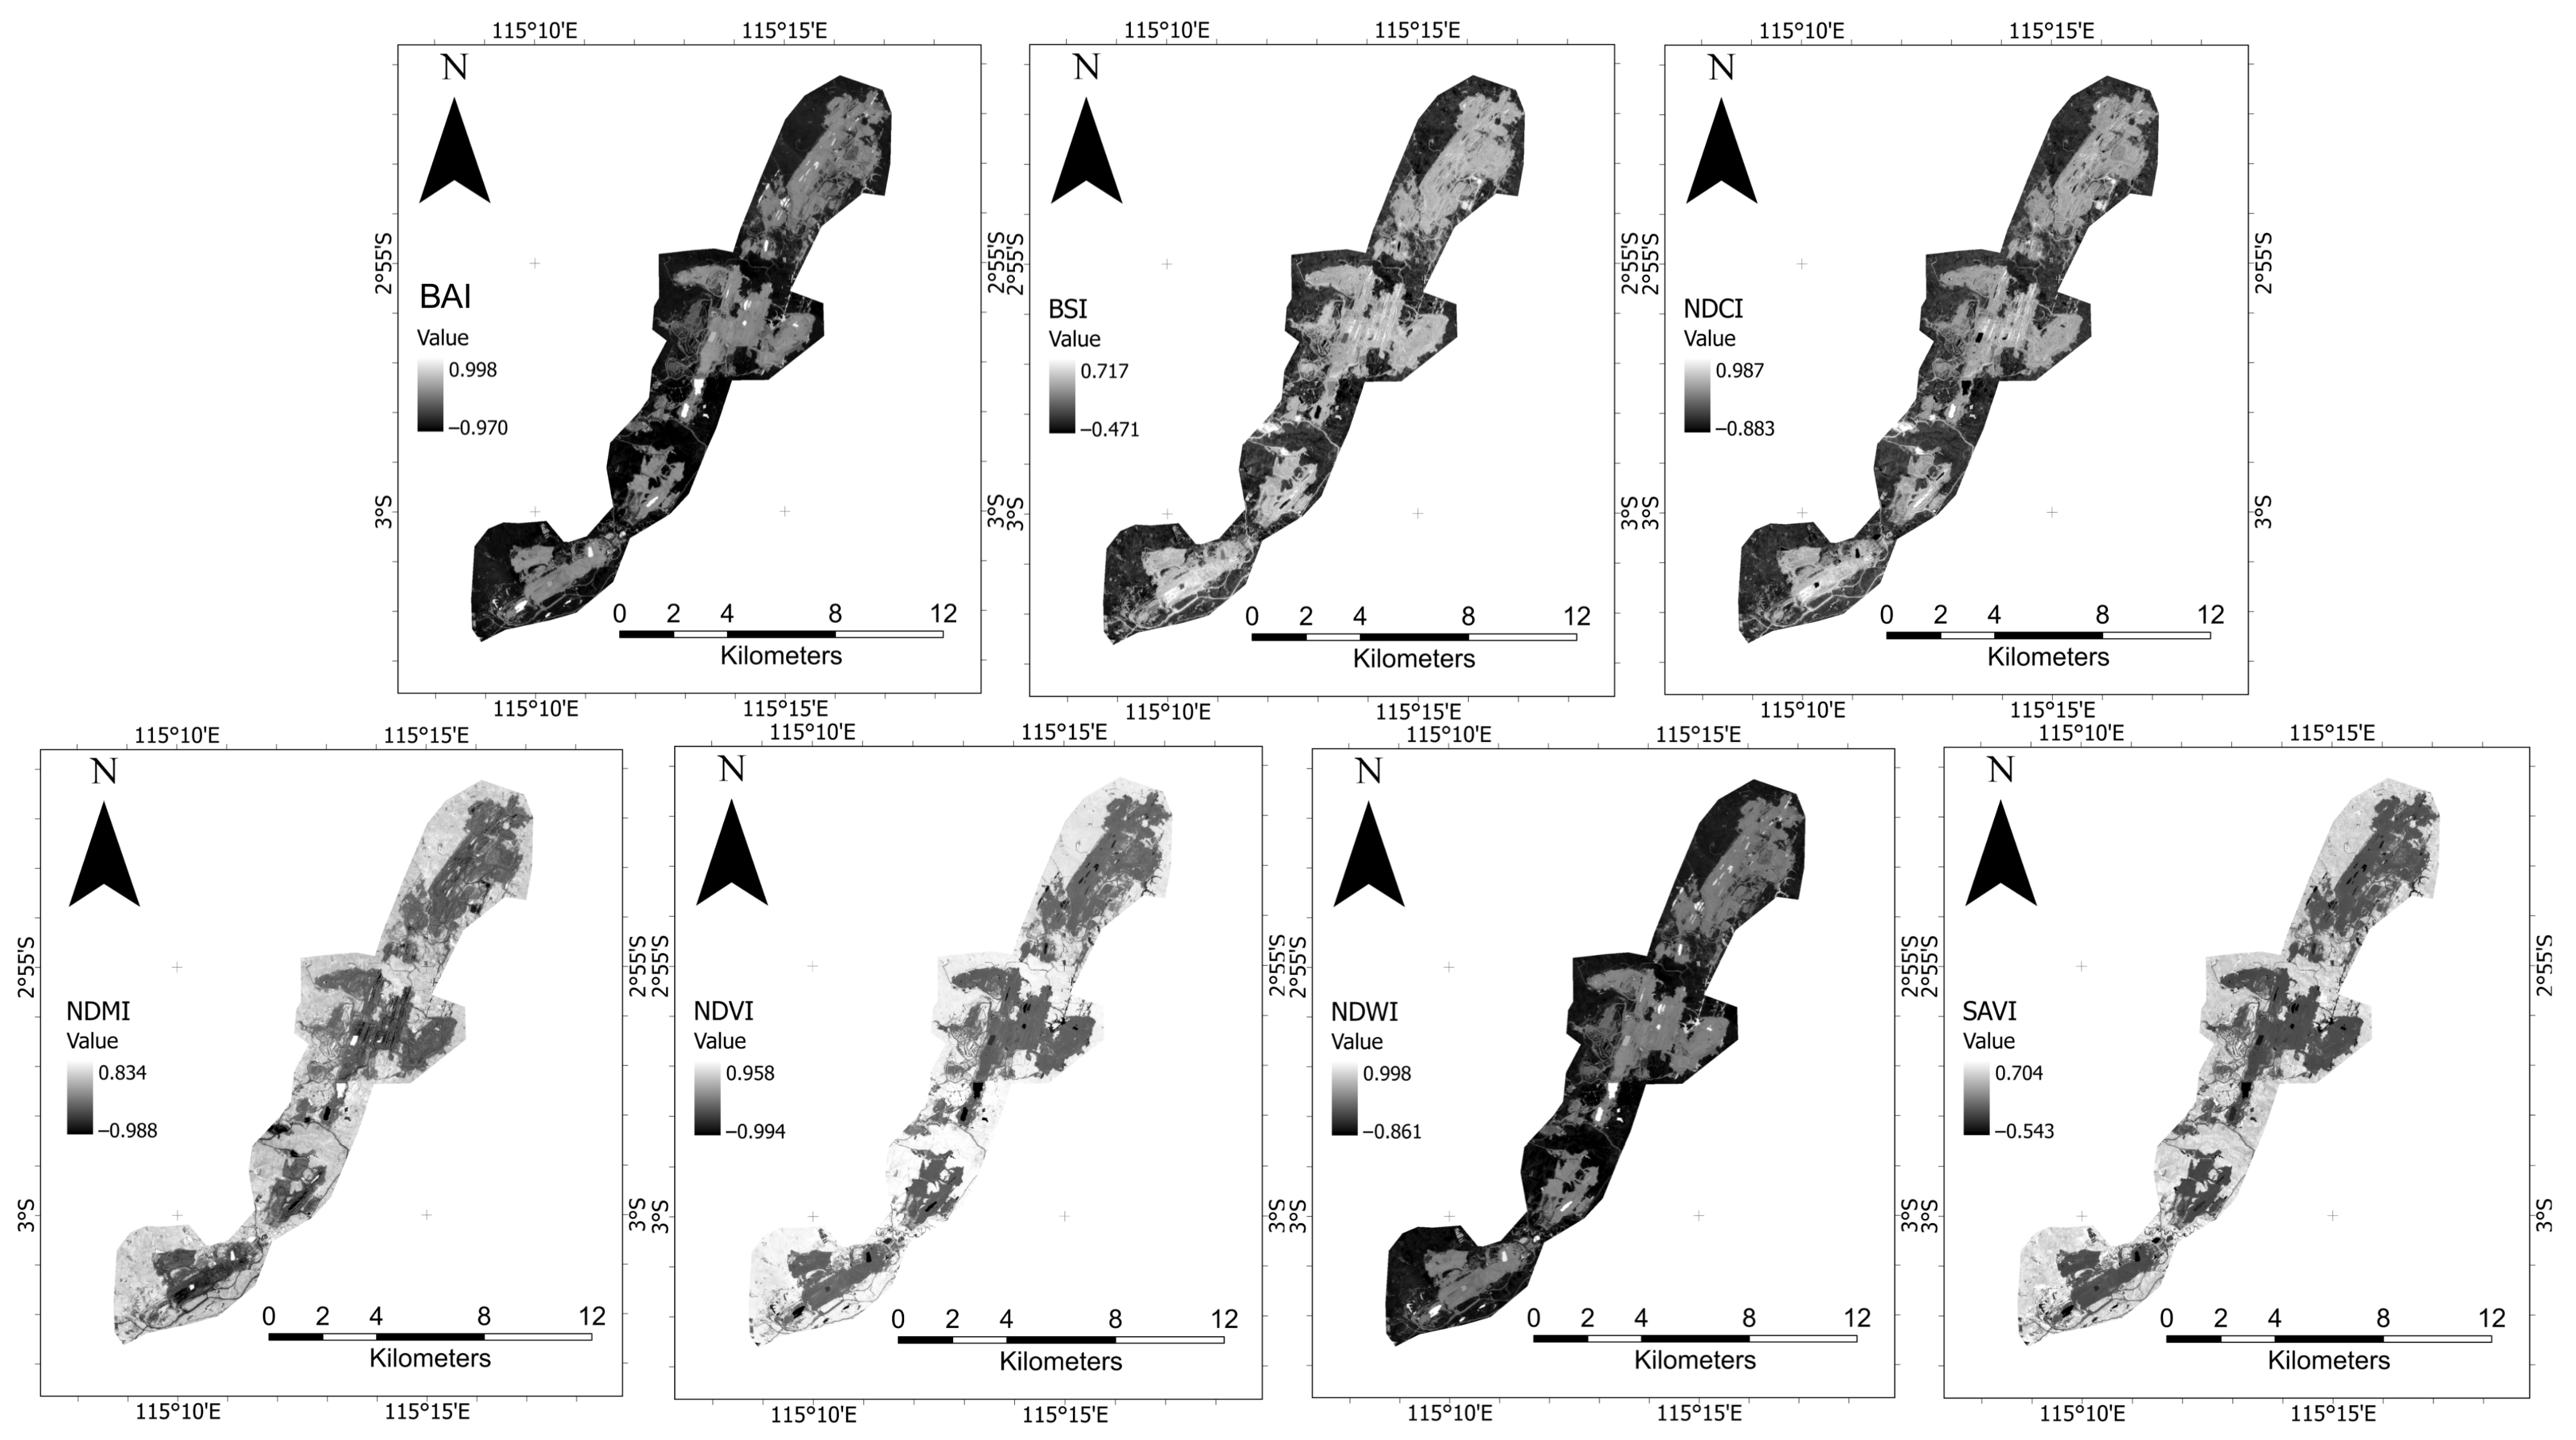
Figure 7.
Spatial distribution of various spectral indices for coal mining surface analysis.
Figure 7.
Spatial distribution of various spectral indices for coal mining surface analysis.
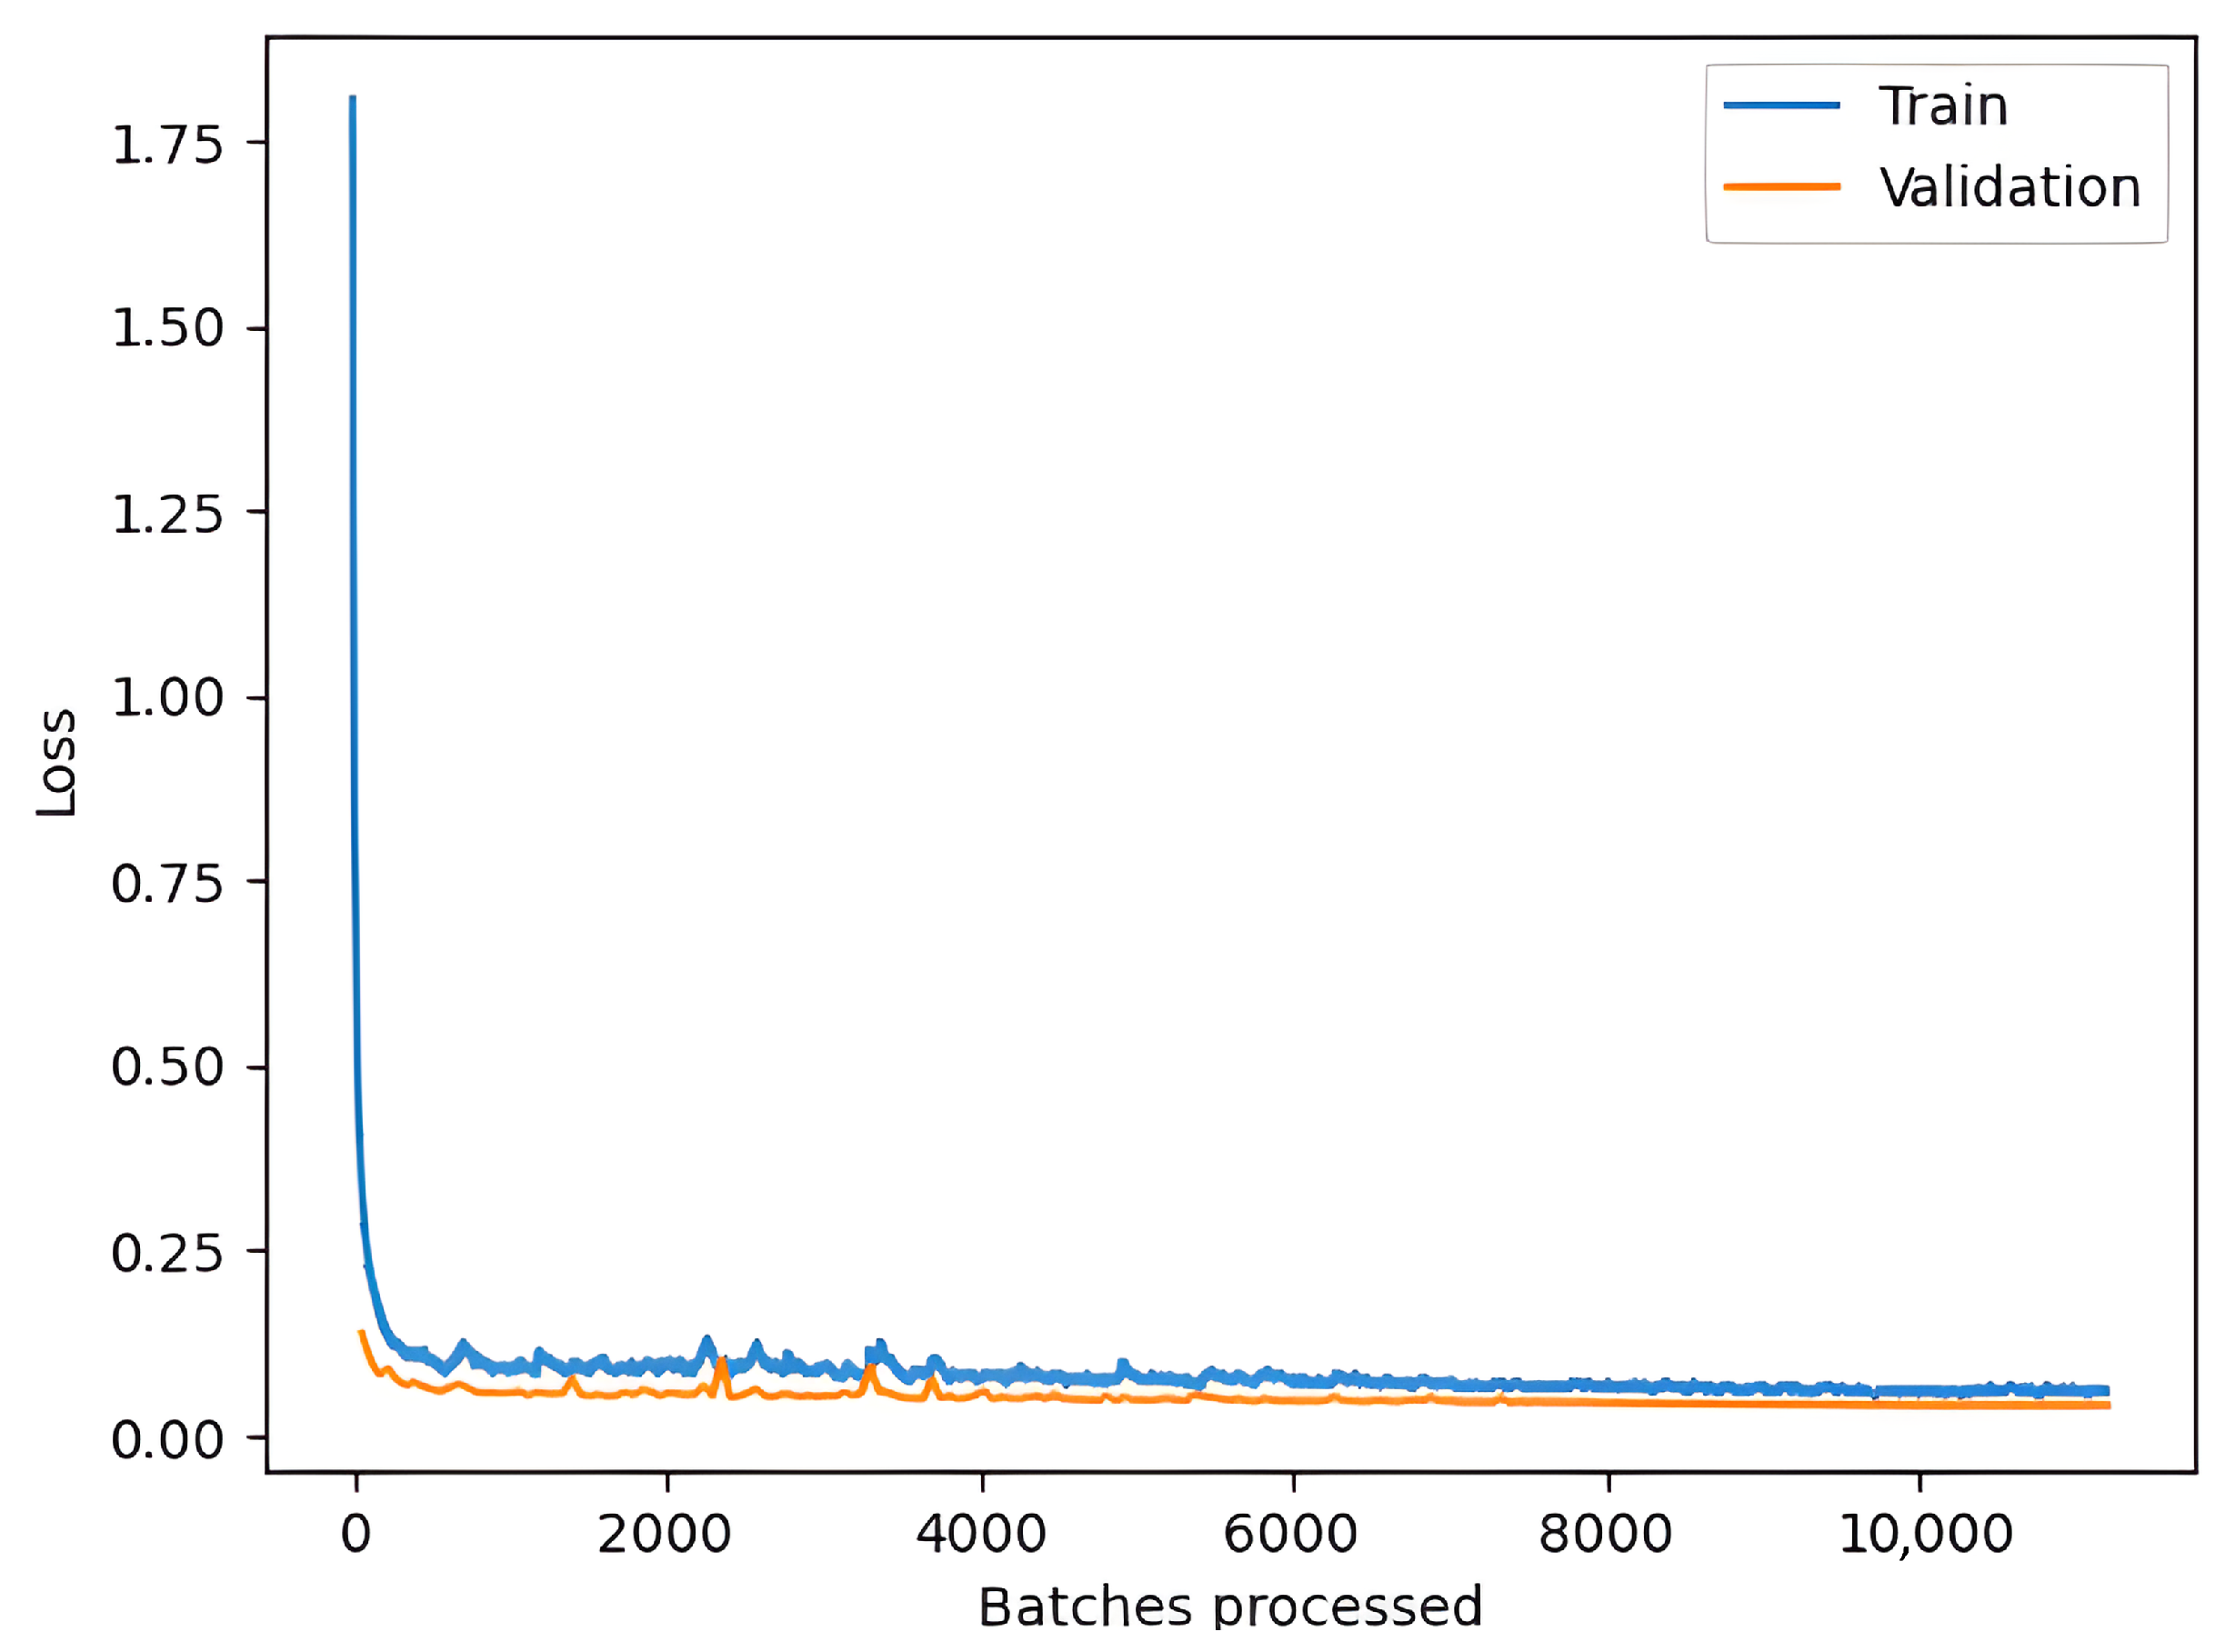
Figure 8.
Training and validation loss.
Figure 8.
Training and validation loss.
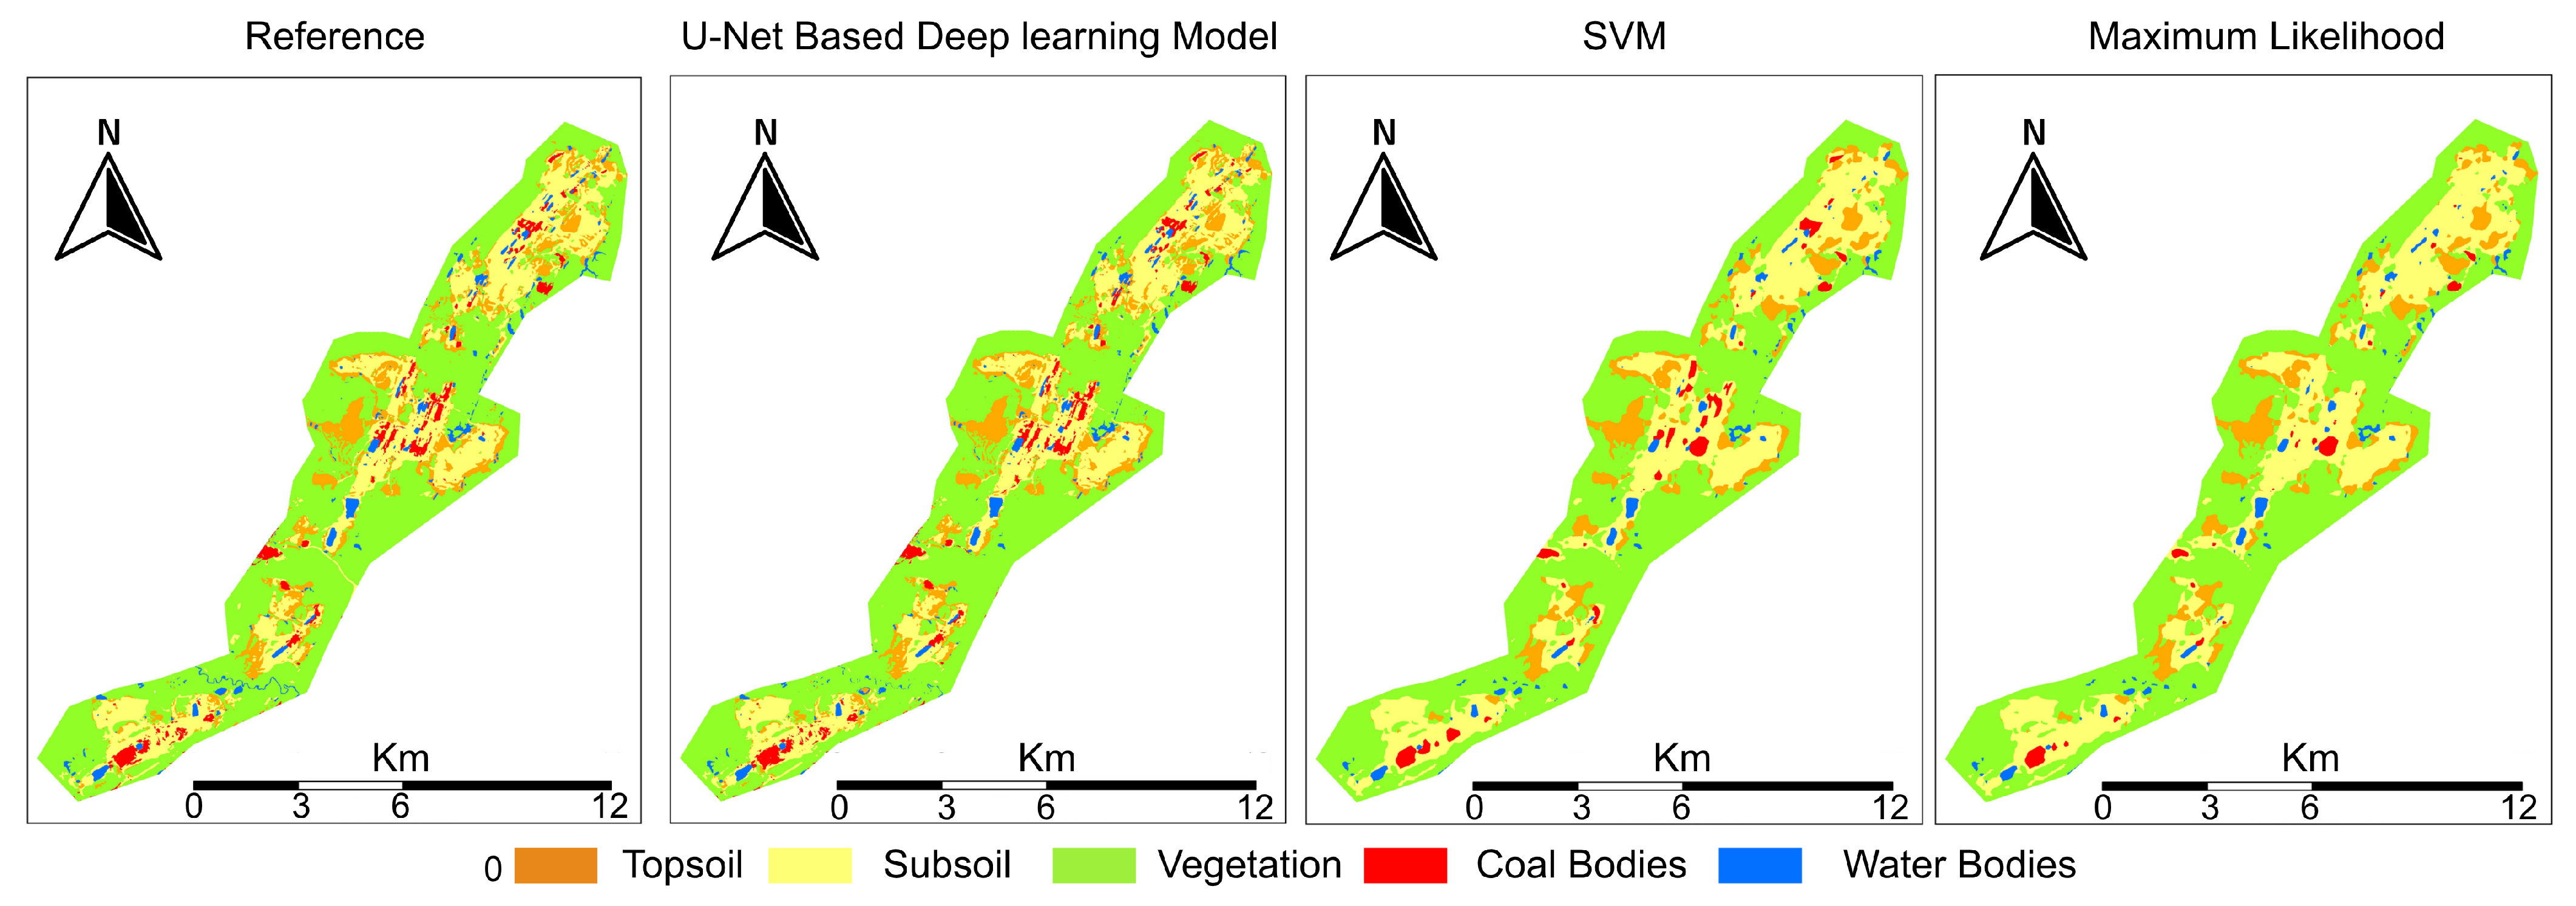
Figure 9.
Coal-mining area classification: reference from adjusted topographic map by ministry of environment and forestry (reference), U-Net, SVM and Maximum Likelihood.
Figure 9.
Coal-mining area classification: reference from adjusted topographic map by ministry of environment and forestry (reference), U-Net, SVM and Maximum Likelihood.
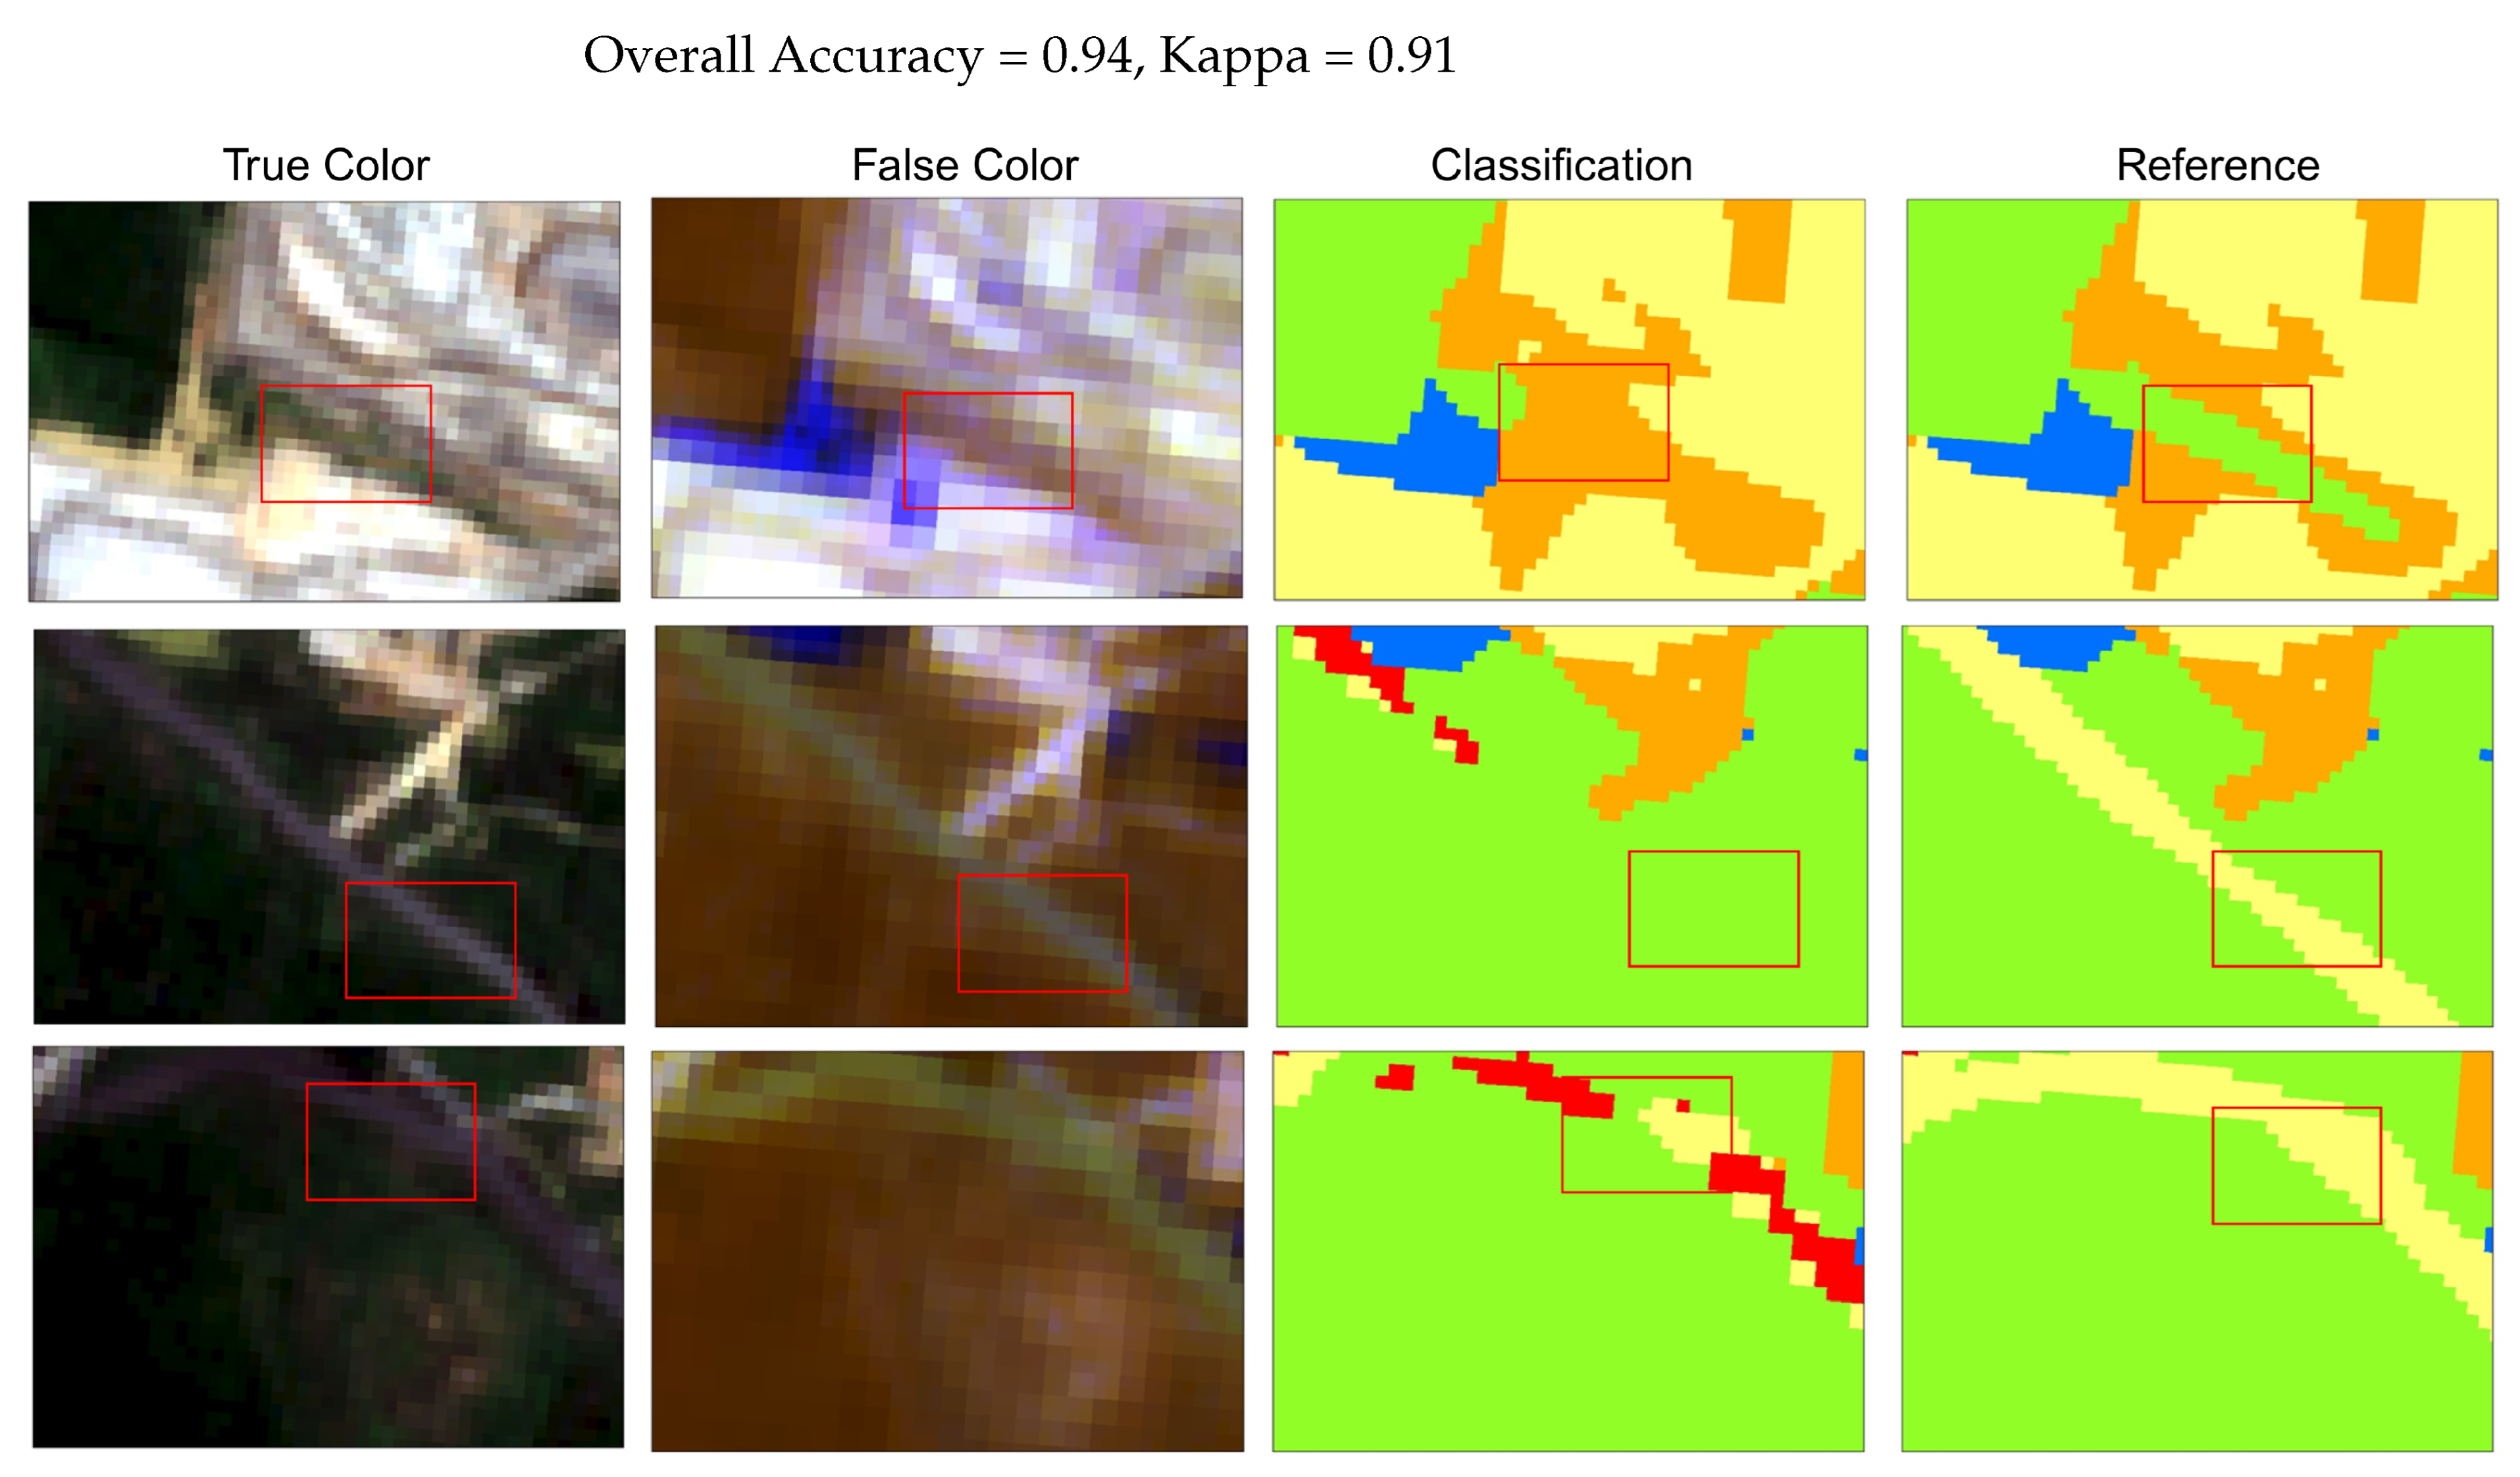
Figure 10.
Example of classification errors showing discrepancies between predicted and reference images. Red boxes indicate regions with misclassified areas. Color codes follow the legend in
Figure 9.
Figure 10.
Example of classification errors showing discrepancies between predicted and reference images. Red boxes indicate regions with misclassified areas. Color codes follow the legend in
Figure 9.
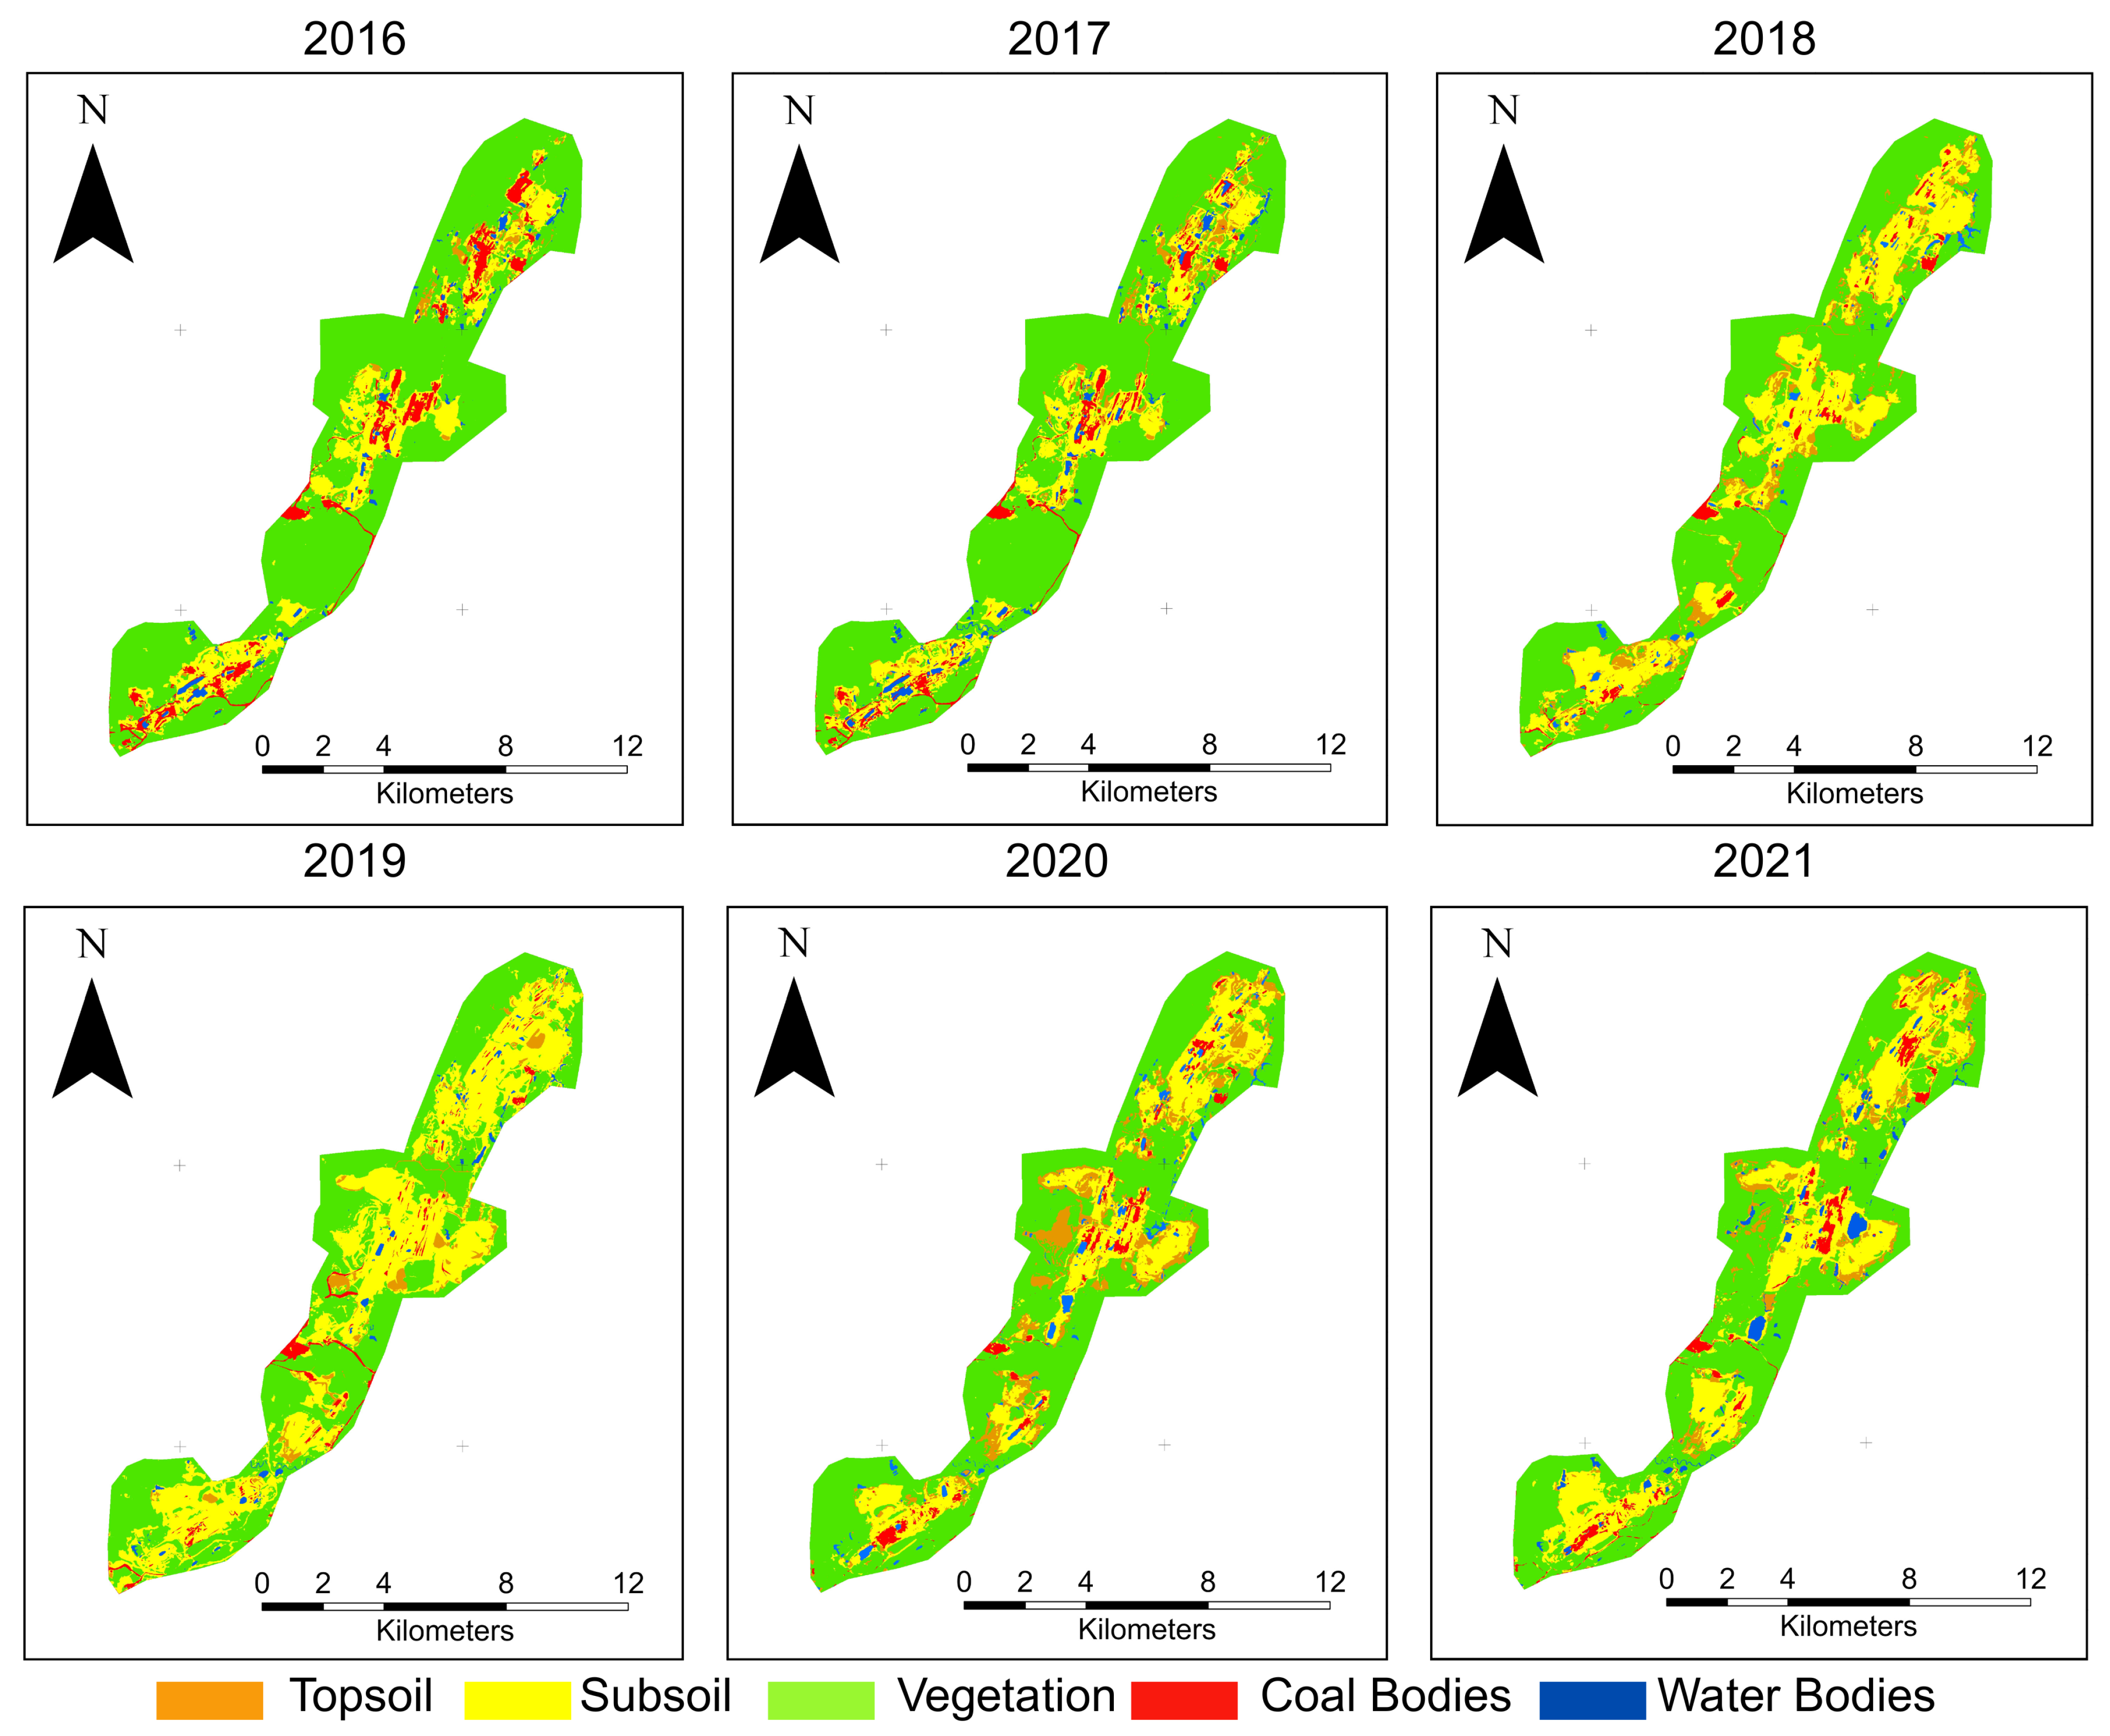
Figure 11.
Multitemporal Deep learning classification illustrating coal mining surface change.
Figure 11.
Multitemporal Deep learning classification illustrating coal mining surface change.
Figure 12.
Multitemporal land cover change from 2016 to 2021.
Figure 12.
Multitemporal land cover change from 2016 to 2021.
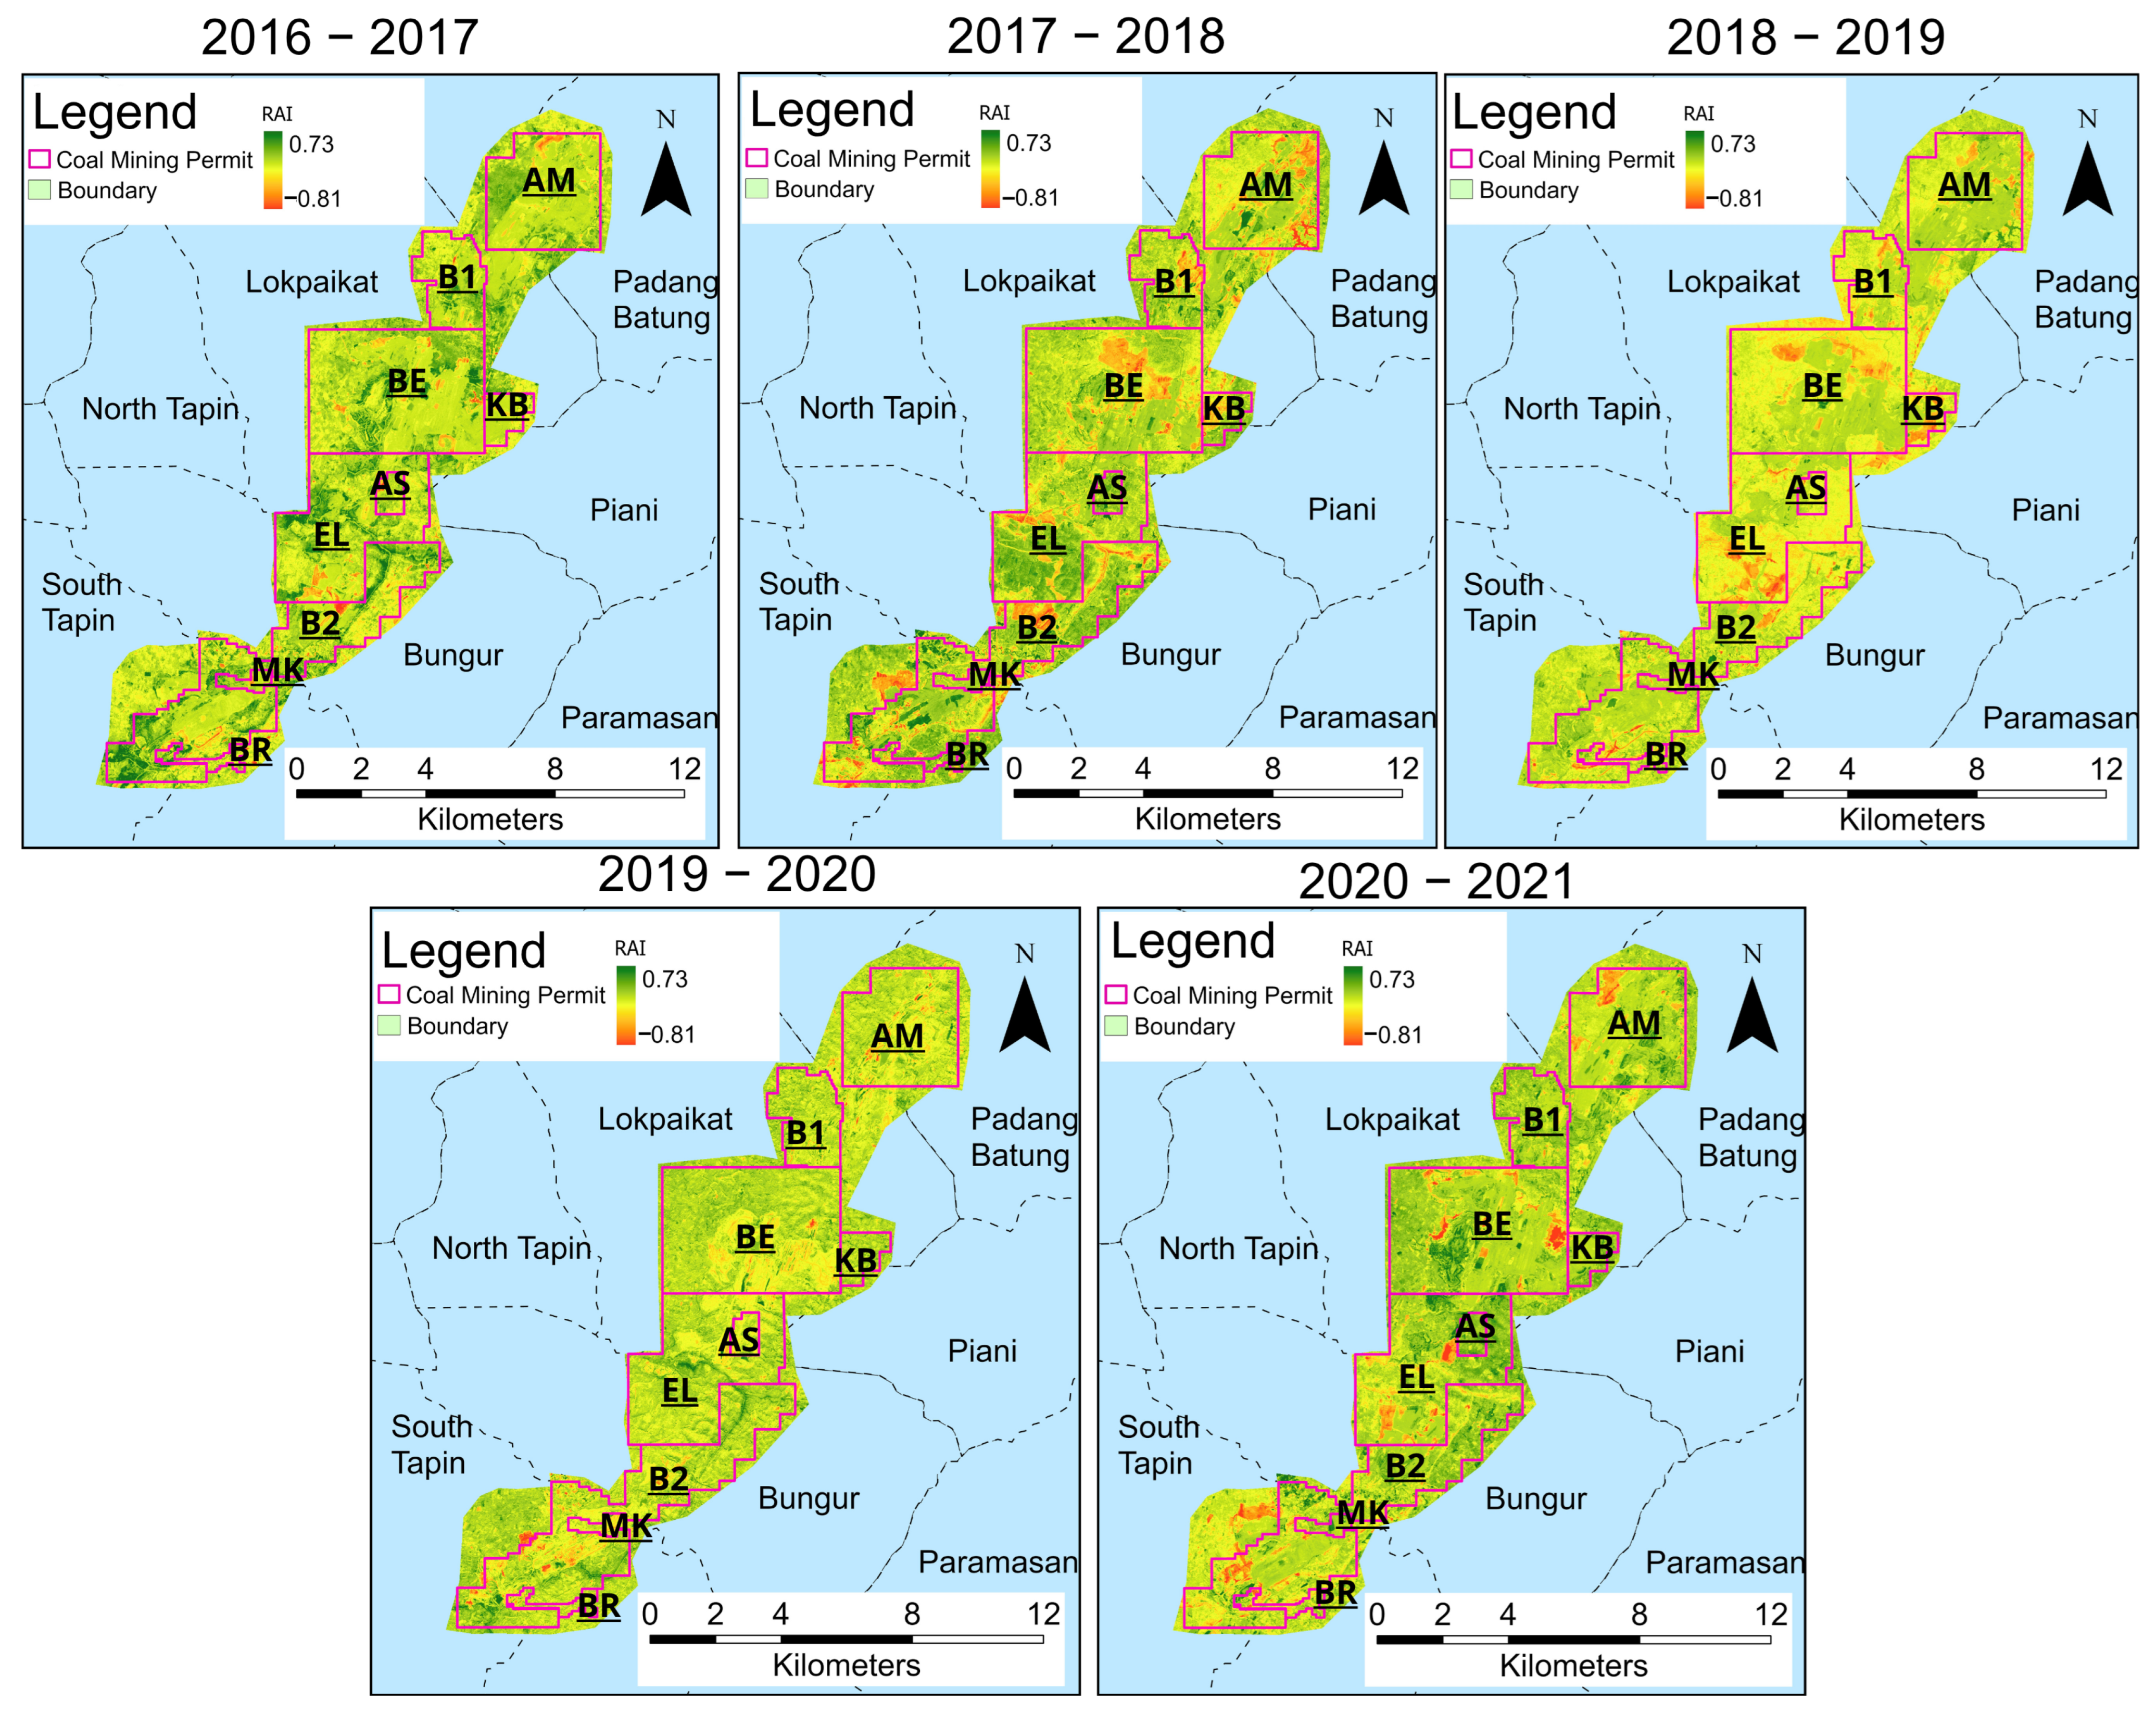
Figure 13.
Multitemporal RAI with coal mining permit boundaries from the Minister of Energy and Mineral Resources. The labels (e.g., EL, B2, AM, KB) denote the mining permit holders, shown in abbreviated form consistent with the boundary dataset.
Figure 13.
Multitemporal RAI with coal mining permit boundaries from the Minister of Energy and Mineral Resources. The labels (e.g., EL, B2, AM, KB) denote the mining permit holders, shown in abbreviated form consistent with the boundary dataset.
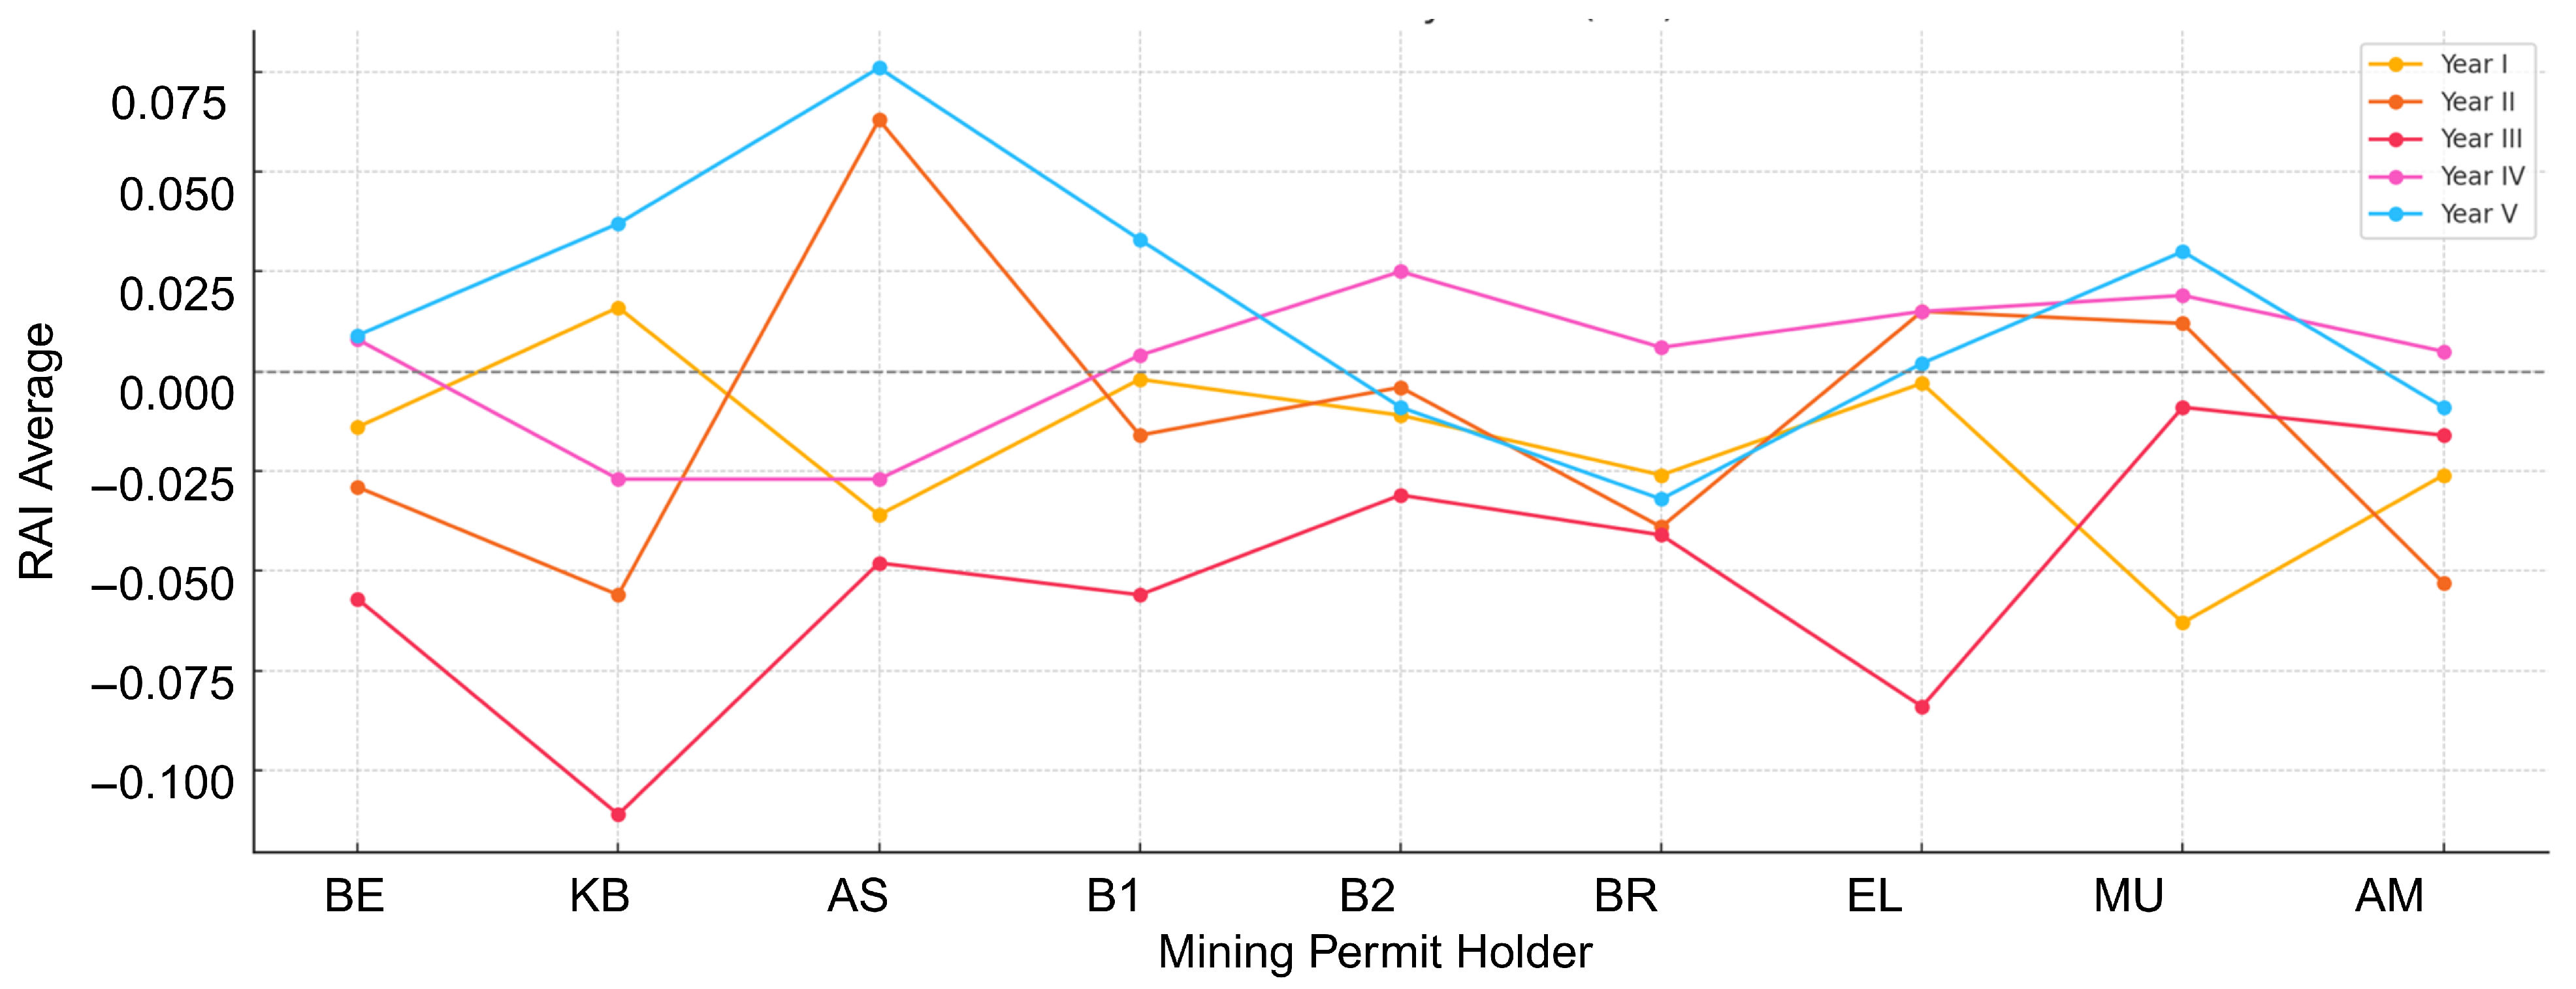
Figure 14.
Average multitemporal RAI, Year I (2016–2017), Year II (2017–2018), Year III (2018–2019), Year IV (2019–2020), Year V (2020–2021).
Figure 14.
Average multitemporal RAI, Year I (2016–2017), Year II (2017–2018), Year III (2018–2019), Year IV (2019–2020), Year V (2020–2021).
Figure 15.
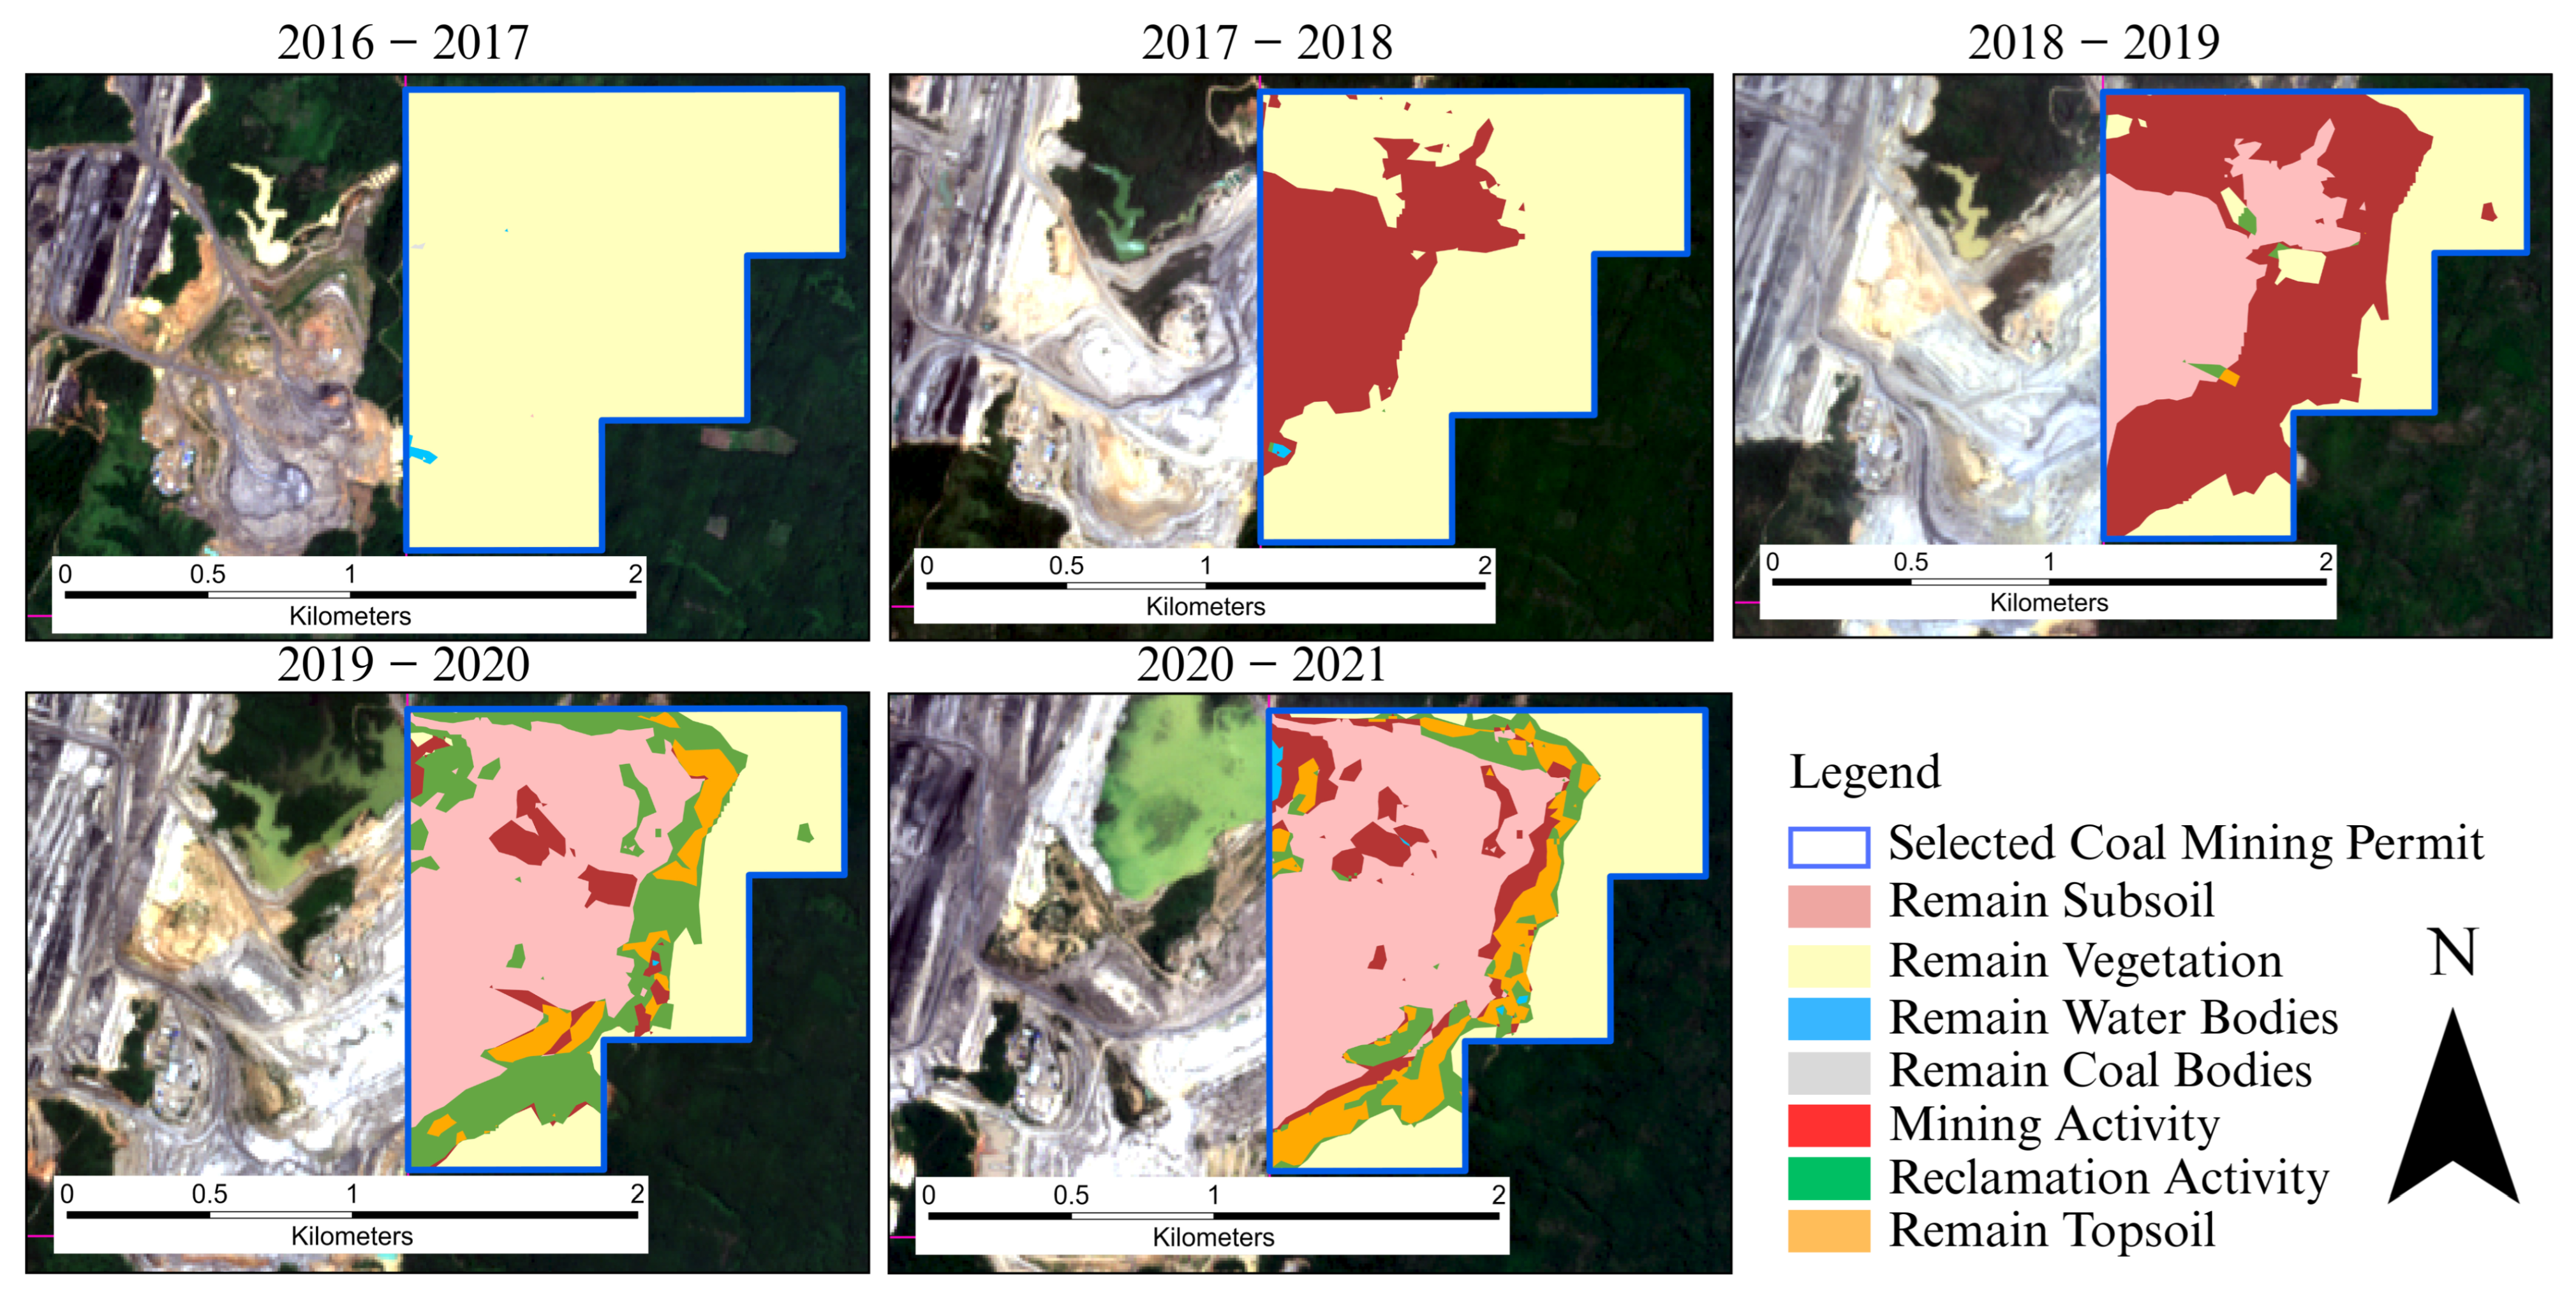
KB coal mining permit multitemporal mining and reclamation activity.
Figure 15.
KB coal mining permit multitemporal mining and reclamation activity.
Figure 16.
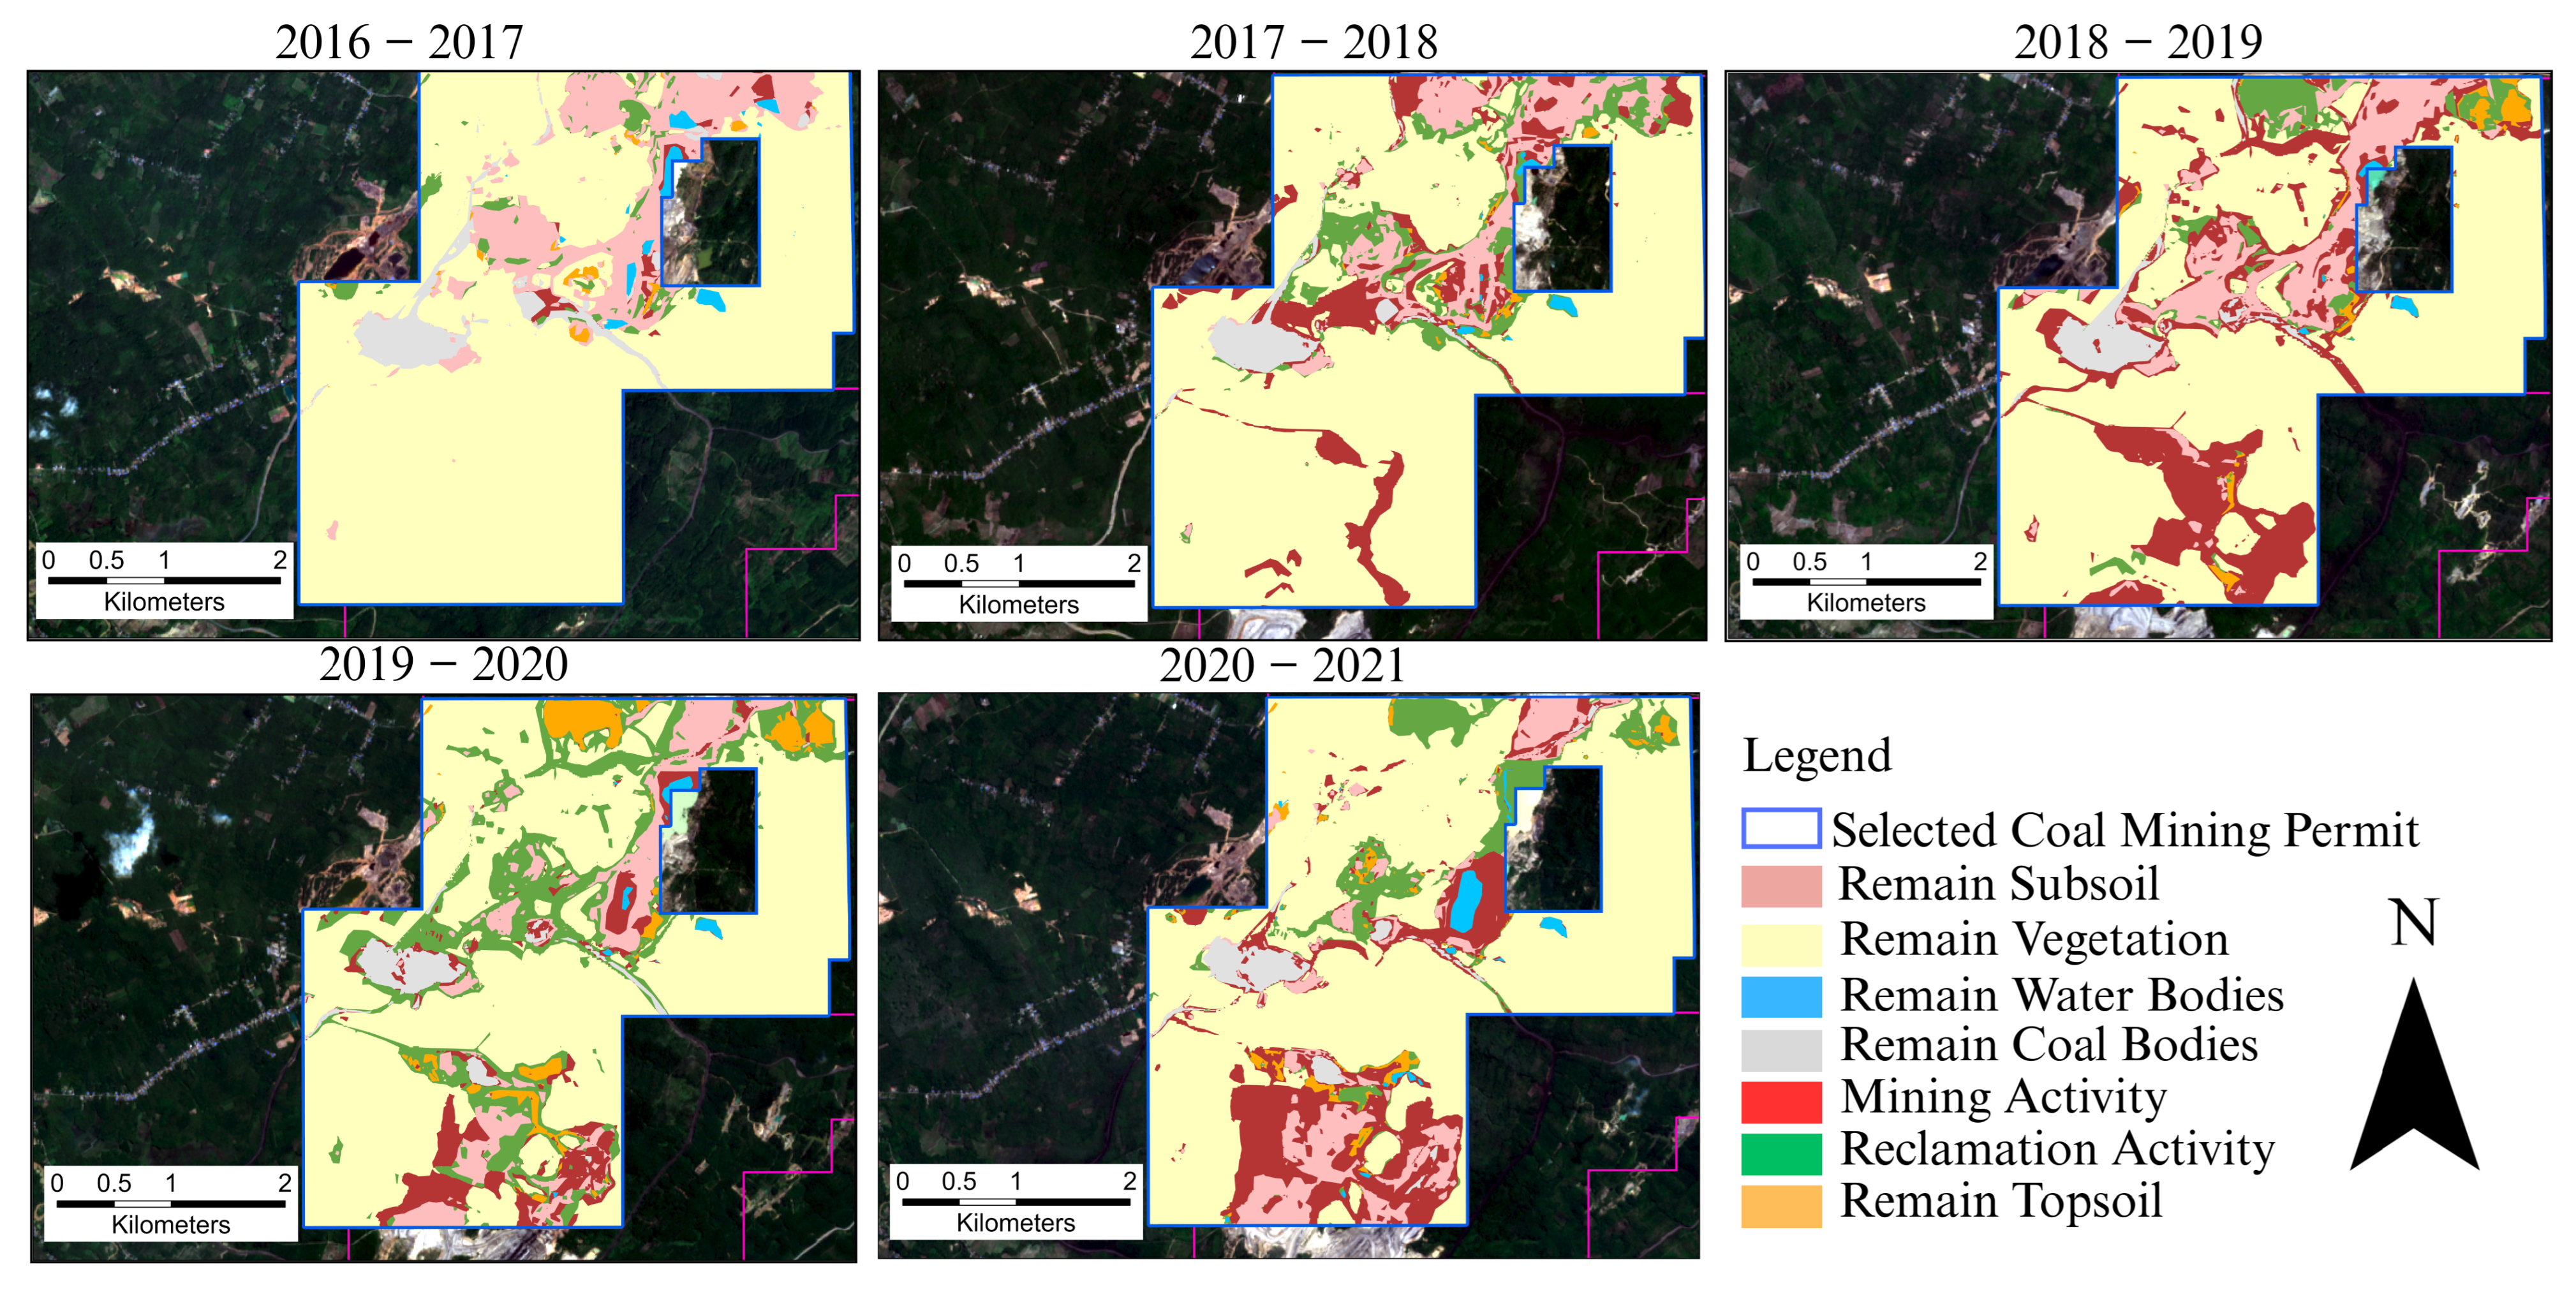
B2 coal mining permit multitemporal mining and reclamation activity.
Figure 16.
B2 coal mining permit multitemporal mining and reclamation activity.
Figure 17.
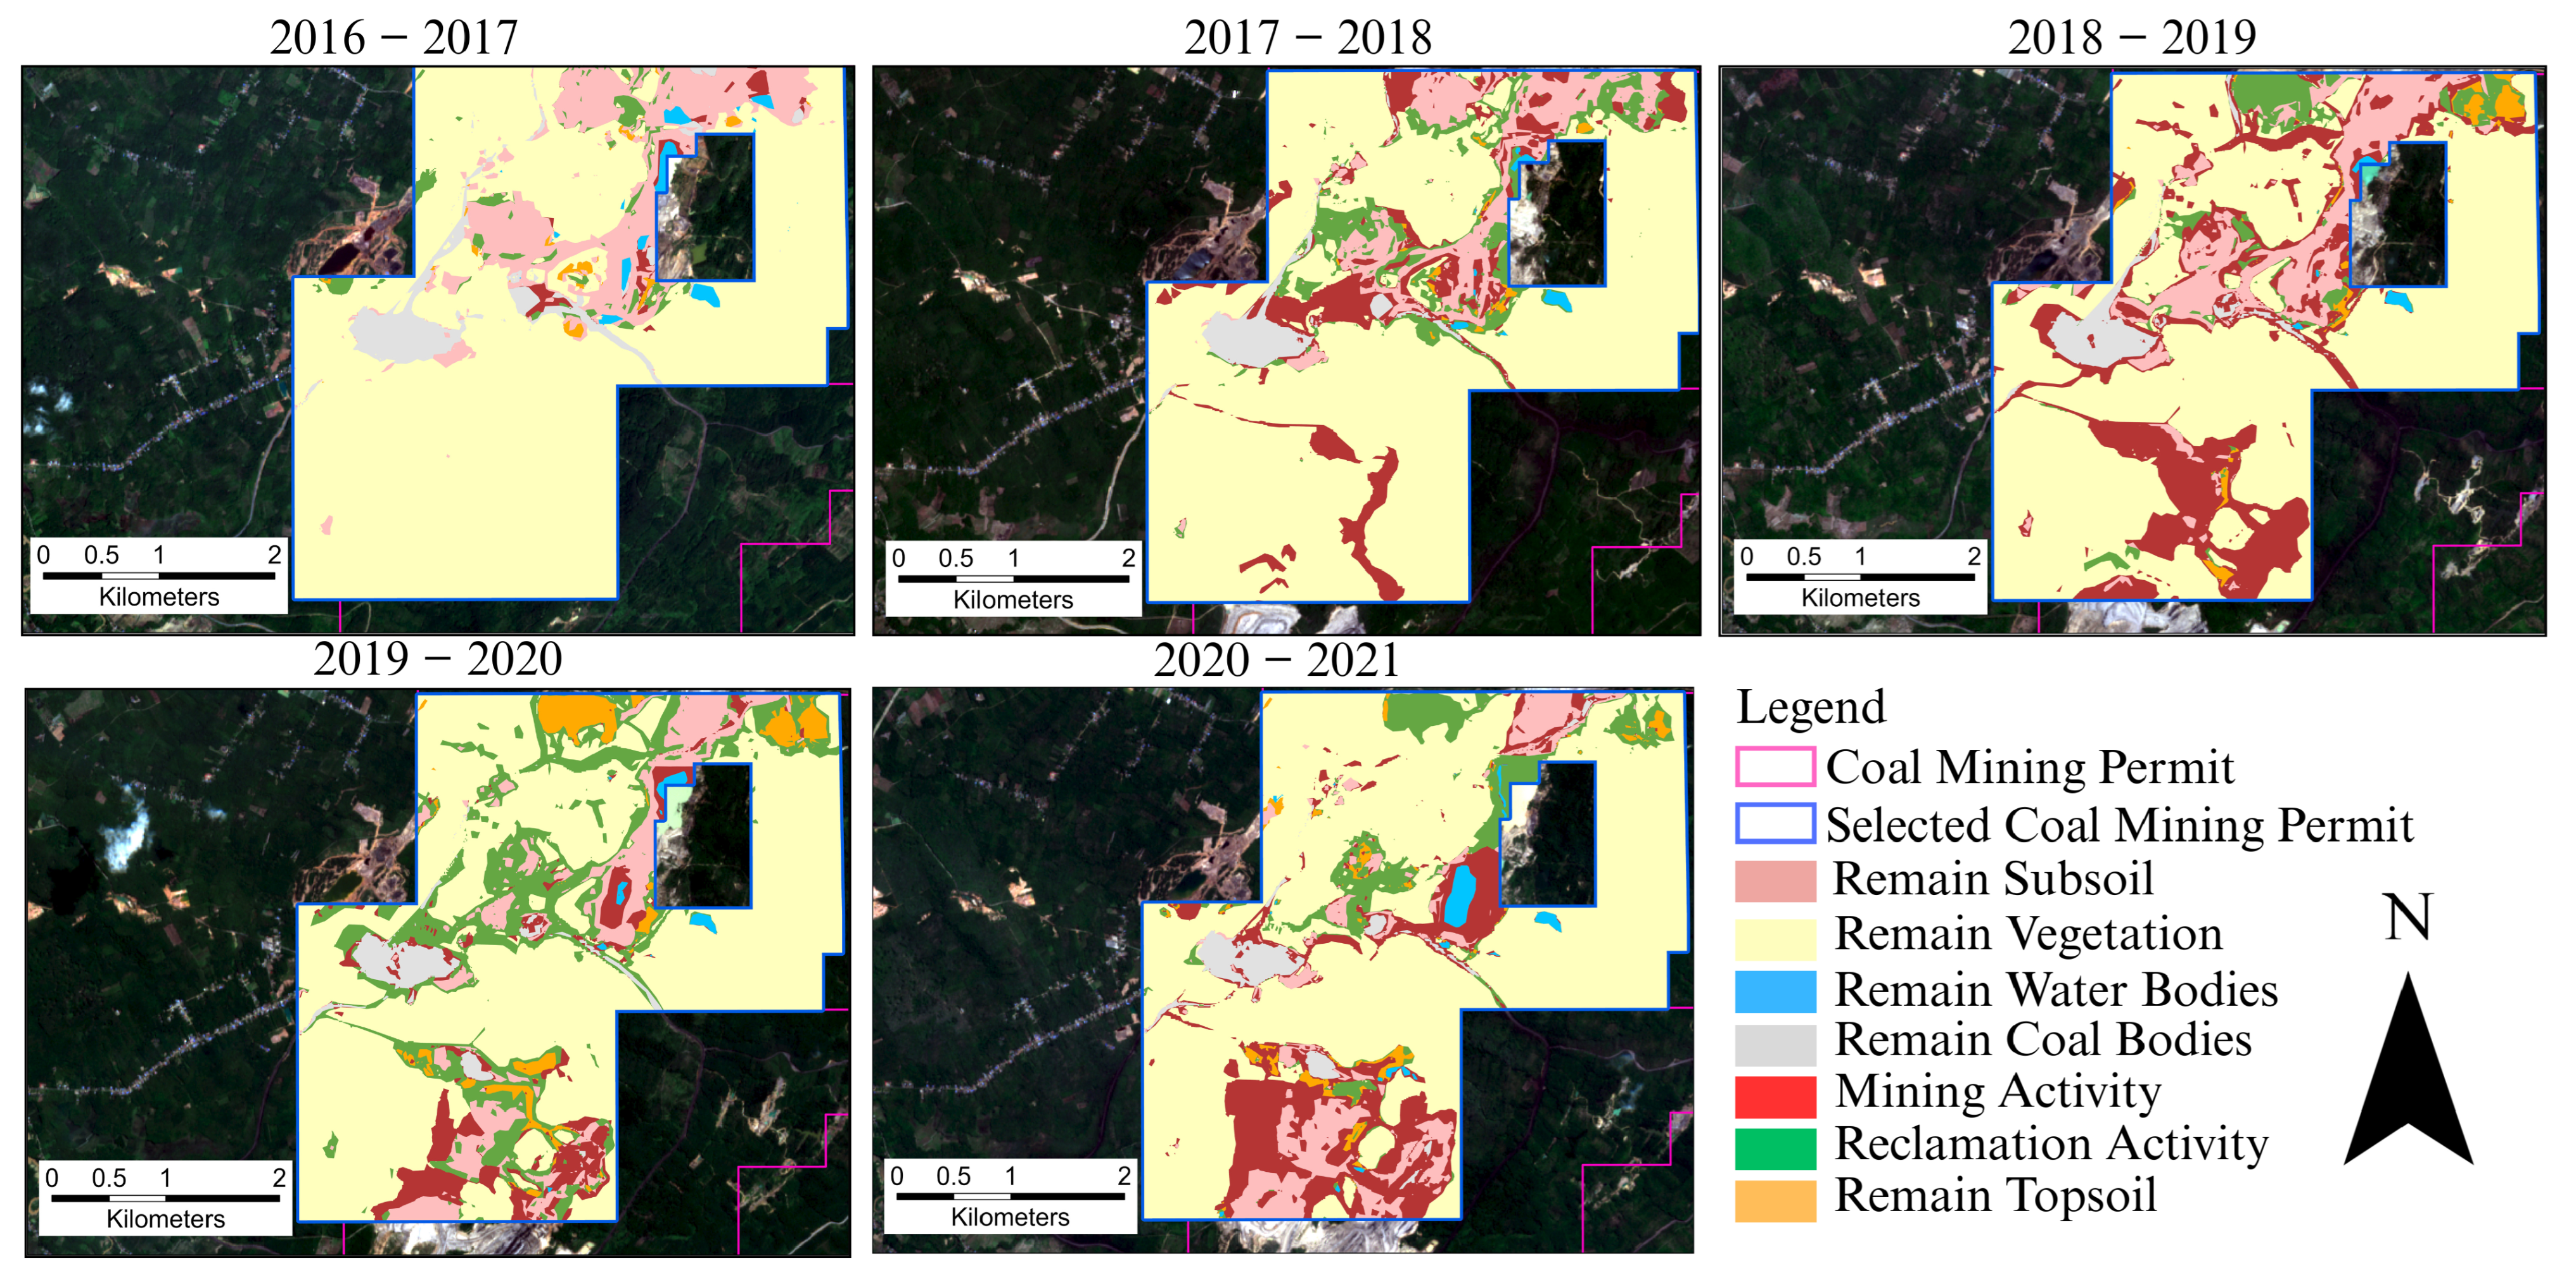
EL coal mining permit multitemporal mining and reclamation activity.
Figure 17.
EL coal mining permit multitemporal mining and reclamation activity.
Figure 18.
Multitemporal mining and reclamation activity each coal mining permit holder.
Figure 18.
Multitemporal mining and reclamation activity each coal mining permit holder.
Figure 19.
Compliance rate of each coal mining permit holder.
Figure 19.
Compliance rate of each coal mining permit holder.
Figure 20.
Reclamation activity on Pt Kaltim Prima Coal.
Figure 20.
Reclamation activity on Pt Kaltim Prima Coal.
Table 1.
Economic sector contributions to GRDP of South Kalimantan (2019–2023) in percentages (%). * Preliminary data. ** Provisional data.
Table 1.
Economic sector contributions to GRDP of South Kalimantan (2019–2023) in percentages (%). * Preliminary data. ** Provisional data.
| Sector | Industry | 2019 | 2020 | 2021 | 2022 * | 2023 ** |
|---|
| Primary | Agriculture, Forestry and Fishing | 14.31 | 14.40 | 13.58 | 11.42 | 11.37 |
| | Mining and Quarrying | 19.06 | 18.28 | 21.46 | 32.05 | 30.82 |
| Secondary | Manufacturing | 13.67 | 13.52 | 13.55 | 11.37 | 10.75 |
| | Electricity and Gas | 0.14 | 0.15 | 0.15 | 0.13 | 0.13 |
| | Water supply and Waste Management | 0.42 | 0.45 | 0.43 | 0.36 | 0.37 |
| | Construction | 8.26 | 8.45 | 7.96 | 7.60 | 7.00 |
| Tertiary | Wholesale and Retail Trade | 10.54 | 10.45 | 10.07 | 9.06 | 8.61 |
| | Transportation and Storage | 6.91 | 6.58 | 6.13 | 6.28 | 7.15 |
| | Accommodation and Food Services | 2.12 | 2.15 | 2.04 | 1.79 | 1.86 |
| | Information and Communication | 3.64 | 3.93 | 3.83 | 3.30 | 3.32 |
| | Financial and Insurance Activities | 3.57 | 3.67 | 3.50 | 3.00 | 3.07 |
| | Real Estate Activities | 2.28 | 2.43 | 2.37 | 1.96 | 1.95 |
| | Business Activities | 0.72 | 0.73 | 0.70 | 0.61 | 0.65 |
| Public | Public Administration and Defence | 6.14 | 6.36 | 5.93 | 4.79 | 4.66 |
| | Education | 4.88 | 5.08 | 4.78 | 3.95 | 3.91 |
| | Health and Social Work | 2.01 | 2.22 | 2.28 | 1.94 | 1.91 |
| Other | Other Services Activities | 1.32 | 1.34 | 1.25 | 1.10 | 1.15 |
| | Total GRDP | 100.00 | 100.00 | 100.00 | 100.00 | 100.00 |
Table 2.
Land cover classes distribution of training dataset.
Table 2.
Land cover classes distribution of training dataset.
| Land Cover Classes | Distribution (%) |
|---|
| Topsoil | 17 |
| Subsoil | 16 |
| Vegetation | 40 |
| Coal Body | 10 |
| Water Body | 17 |
Table 3.
Classification of RAI values.
Table 3.
Classification of RAI values.
| RAI Range | Class | Interpretation |
|---|
| >0.3 | High Reclamation | Strong NDVI increase; large-scale restoration. |
| 0 to 0.3 | Moderate Reclamation | Partial recovery or early vegetation regrowth. |
| 0 | Stable/Neutral | Minimal change; stable cover or minor transitions. |
| −0.3 to 0 | Moderate Disturbance | Vegetation loss; early mining or land clearance. |
| <−0.3 | High Disturbance | Severe degradation; active or expanding mining. |
Table 4.
Transition categories representing mining and reclamation activities based on land cover changes for calculation CR.
Table 4.
Transition categories representing mining and reclamation activities based on land cover changes for calculation CR.
| Mining Activity | Reclamation Activity |
|---|
| Topsoil → Subsoil | Topsoil → Vegetation |
| Topsoil → Coal Bodies | Subsoil → Topsoil |
| Topsoil → Water Bodies | Subsoil → Vegetation |
| Subsoil → Coal Bodies | Coal Bodies → Topsoil |
| Subsoil → Water Bodies | Coal Bodies → Vegetation |
| Vegetation → Topsoil | Water Bodies → Topsoil |
| Vegetation → Subsoil | Water Bodies → Vegetation |
| Vegetation → Coal Bodies | |
| Vegetation → Water Bodies | |
| Coal Bodies → Subsoil | |
| Coal Bodies → Water Bodies | |
| Water Bodies → Subsoil | |
| Water Bodies → Coal Bodies | |
Table 5.
CR classification for post-mining reclamation performance.
Table 5.
CR classification for post-mining reclamation performance.
| CR | Classification | Description |
|---|
| CR ≥ 0.70 | Excellent | Most of the disturbed area has been reclaimed |
| 0.40 ≤ CR < 0.70 | Moderate | Reclamation effort is present but insufficient |
| CR < 0.40 | Poor | Reclamation lags far behind mining |
Table 6.
Comparison of overall accuracy and kappa coefficient between classification methods.
Table 6.
Comparison of overall accuracy and kappa coefficient between classification methods.
| Method | Overall Accuracy | Kappa |
|---|
| U-Net (Deep Learning) | 0.94 | 0.91 |
| SVM | 0.89 | 0.84 |
| Maximum Likelihood (MaxL) | 0.87 | 0.81 |
Table 7.
Confusion matrix (pixel counts) with User’s Accuracy (UA) and Producer’s Accuracy (PA).
Table 7.
Confusion matrix (pixel counts) with User’s Accuracy (UA) and Producer’s Accuracy (PA).
| Confusion | Topsoil | Subsoil | Vegetation | Coal Body | Water Body | Total | UA |
|---|
| Topsoil | 93,551 | 1328 | 1376 | 13 | 380 | 96,648 | 0.97 |
| Subsoil | 656 | 192,363 | 1630 | 450 | 480 | 195,579 | 0.98 |
| Vegetation | 1300 | 19,380 | 421,826 | 610 | 610 | 455,426 | 0.93 |
| Coal Body | 31 | 1560 | 980 | 24,560 | 105 | 27,236 | 0.90 |
| Water Body | 220 | 47 | 710 | 50 | 21,204 | 22,231 | 0.95 |
| Total | 107,458 | 214,678 | 426,522 | 25,683 | 22,779 | 797,120 | |
| PA | 0.87 | 0.90 | 0.99 | 0.96 | 0.93 | | |
Table 8.
Land cover composition as percentages (%) of total area (8469.30 Ha) for 2016–2021.
Table 8.
Land cover composition as percentages (%) of total area (8469.30 Ha) for 2016–2021.
| Year | Topsoil | Subsoil | Vegetation | Coal Body | Water Body |
|---|
| 2016 | 1.8% | 18.0% | 71.2% | 7.0% | 2.0% |
| 2017 | 3.7% | 18.6% | 69.7% | 5.0% | 3.0% |
| 2018 | 7.1% | 26.9% | 61.8% | 2.5% | 1.6% |
| 2019 | 3.4% | 40.8% | 51.8% | 2.7% | 1.3% |
| 2020 | 11.5% | 23.1% | 59.4% | 3.3% | 2.7% |
| 2021 | 7.0% | 28.2% | 58.1% | 3.8% | 3.0% |
Table 9.
Cumulative reclamation performance of arutmin (bumi resources) from 2011 to 2017.
Table 9.
Cumulative reclamation performance of arutmin (bumi resources) from 2011 to 2017.
| Year | Land Opening | Land Arrangement | Planting | Number of Trees |
|---|
| | (ha) | (ha) | (ha) | (Thousand) |
|---|
| 2011 | 12,500 | 4700 | 4500 | 3600 |
| 2012 | 13,200 | 4900 | 4700 | 3700 |
| 2013 | 13,700 | 5100 | 4900 | 4000 |
| 2014 | 13,800 | 5200 | 5000 | 4100 |
| 2015 | 14,100 | 5400 | 5200 | 4200 |
| 2016 | 14,500 | 5700 | 5500 | 4400 |
| 2017 | 15,000 | 6100 | 5900 | 4700 |
