Highlights
What are the main findings?
- Island-wide individual tree delineation from airborne LiDAR collection from pre- and post-Hurricane Maria reveals 64% tree trunk breakage.
- Calculation of wind speeds from tree stem breakages shows wind speed reaching up to 250 km/h at landfall in the southeastern part of the island.
What is the implication of the main finding?
- Trees may serve as natural sensors to calculate hurricane wind speed intensity distributions when conventional weather stations fail.
- The approach developed in this study provides a scalable framework for post-disaster wind mapping and forest vulnerability using remote sensing data.
Abstract
Hurricane Maria crossed Puerto Rico with winds as high as 250 km/h, resulting in widespread damages and loss of weather station data, thus limiting direct weather measurements of wind variability. Here, we identified more than 155 million trees to estimate the distribution of wind speed over 9000 km2 of land from island-wide LiDAR point clouds collected before and after the hurricane. The point clouds were classified and rasterized into the canopy height model to perform individual tree identification and perform change detection analysis. Individual trees’ stem diameter at breast height were estimated using a function between delineated crown and extracted canopy height, validated using the records from Puerto Rico’s Forest Inventory 2003. The results indicate that approximately 35.7% of trees broke at the stem (below the canopy center) and 28.5% above the canopy center. Furthermore, we back-calculated the critical wind speed, or the minimum speed to cause breakage, at individual tree level this was performed by applying a mechanical model using the estimated diameter at breast height, the extrapolated breakage height, and pre-Hurricane Maria canopy height. Individual trees were then aggregated at 115 km2 cells to summarize the critical wind speed distribution of each cell, based on the percentage of stem breakage. A vertical wind profile analysis was then applied to derive the hurricane wind distribution using the mean hourly wind speed 10 m above the canopy center. The estimated wind speed ranges from 250 km/h in the southeast at the landfall to 100 km/h in the southwest parts of the islands. Comparison of the modeled wind speed with the wind gust readings at the few remaining NOAA stations support the use of tree breakages to model the distribution of hurricane wind speed when ground readings are sparse.
1. Introduction
In September 2017, Hurricane Maria (H-Maria, Maria) made landfall on the southeastern coast of Puerto Rico as a high-end category four storm and traveled diagonally northwestward toward Florida [1]. The aftermath of H-Maria was particularly substantial for Puerto Rico as compared to the damage caused by previous hurricanes in the region. Maria’s prolonged wind exposure heightened the severity of damage to the island’s electric infrastructure, which resulted in an extended duration of power loss [2]. By the end of the storm, 80% of the utility towers in Puerto Rico had been grounded, leaving over 3 million people without power for over 9 months [3]. Furthermore, nearly all the weather stations were destroyed during the storm [1].
Situated in the North Atlantic Caribbean, Puerto Rico experiences frequent occurrences of extreme weather and therefore is exposed to a constant threat [4]. As such, risk and vulnerability assessment of tropical cyclones on the island has been a focus of extensive research in conservation studies. Historical wind risk analysis and forest damage analysis by Boose et al. [5] showed gradients where more extensive damage and shorter return intervals are expected to occur in the east as compared to the west of the island. During H-Maria, the wind intensification has been attributed to the highly abnormal sea surface temperature, highlighted by low gale wind kinetic energy distributed in the west that ramped higher towards the east [6]. Similar spatial gradient is also observed in the kinetic wind energy of H-Maria distribution modeled by Van Beusekom et al. [7] using the HURRECON that interpolates National Weather Service (NWS) forecasts into continuous 10 min wind fields. Furthermore, Pokhrel et al. [8] parameterized sea temperature anomalies during H-Maria by performing Weather Research and Forecast (WRF) simulation and analyzing the results in conjunction with the atmospheric condition at the time around the landfall. The WRF model showed wind speed above land with gradient from 230 km/h in the east of the island towards the landfall, to approximately 110 s km/h in the west. Additionally, the model was checked versus the wind speed readings from the CARICOOS buoys in the sea surrounding the island, shown roughly 137 km/h in the sea off the northeastern coast and 100 km/h in the sea off the southwest coast of the island.
Forest damage from the hurricane in Puerto Rico has also been studied extensively, as the major vegetation growth of the island since 1980 has been deeply rooted its greenness resulting in more than 50% forest cover [9,10]. From 1900 to 2019, a total of 11 hurricanes made landfall in Puerto Rico, where the impact on the island’s vegetative cover is unique to the characteristics of the storm [11], and it is often difficult to isolate damages from specific hurricanes as multiple exposures cause cumulative changes to forest structure and composition for decades after the hurricane [11,12]. Following Hurricane Maria, the island witnessed an abrupt drop in green vegetative cover, which was followed by a recovery that stalled at a lower greenness level compared to previous years [13,14,15].
The extent of the hurricane damage the forest also depends also on forest tree species, nature of exposure to the hurricane including the distance of the storm’s path and the degree of topographic sheltering [12,16,17]. Unlike valleys and hills where the topography provides natural protection to the wind, unsheltered areas with little barriers and higher elevation regions experienced greater vegetative disturbance from H-Maria [7]. Moreover, areas with a variable canopy height distribution created a more rigid surface and increased the vulnerability to wind damage [18]. This vulnerability due to lack of natural barriers is demonstrated by the larger absolute height loss in taller forest situated at lower elevation as compared to shorter forest in higher regions [19]. A correlative study by Hall et al. [15] analyzed the effect of the unprecedented heavy rainfall and soil condition caused by H-Maria (to be more correlated to above ground biomass as compared to the effect of wind intensity. Furthermore, Uriarte et al. [20] collected in-situ post H-Maria tree damages from the Luquillo Forest Dynamics Plot (LFPD), a research forest plot near El Yunque rainforest in Luquillo mountains. The in situ data from the site indicated that the severity of windstorm damage was significantly multiplied when compared to damage documented from previous hurricanes, and could not be explained by the difference in the tree stem diameter in the case of an intense storm, such as Maria [20]. However, findings using LiDAR data from Guánica dry forest in the south of the island by Gao & Yu [18] suggest otherwise, as areas with larger mean stem diameter and stem density experienced less height reduction.
Such site-level observations highlight the potential for trees to act as distributed sensors of windstorm intensity, as their mechanical repones, including stem breakages, uprooting, and crown loss, carry damage signatures that encode both magnitude and spatial heterogeneity of extreme winds. Moreover, when conventional meteorological records are sparse due to instrument failure, tree damage analysis could provide complementary ecological evidence of storm severity and flow dynamics [21,22]. This relationship between tree mechanics and wind forces has been formalized through mechanistic models that link critical wind speed to tree geometry, wood properties and aerodynamic drags that allow back-calculation of wind-speed from observed breakage [23,24,25,26]. Beyond deterministic models, probabilistic frameworks that account for gust intermittency and cascading failure process has been shown to capture damage propagation within stands during high-wind events [27]. When combine with pre- and post-even LiDAR dataset, these approaches allow for high-fidelity mapping of windthrow and canopy loss that support regional-scale reconstruction of storm wind fields [28,29]. Together, these approaches transform forests into distributed indicators where damage patterns enable spatially continuous reconstruction of wind intensity during a hurricane across complex terrain.
Recent studies on the application of LiDAR remote sensing to assess hurricane damage have further demonstrate the capability to map canopy height changes at greater spatial details. Multi-temporal analyses of Puerto Rico’s coastal and mangrove forest using pre and post hurricane LiDAR collections the indicate effect of elevation, hydrological connectivity, and canopy structure on the spatial variation in damage severity, where mangroves at lower elevations and closer to freshwater sources experienced up to 53% canopy loss, while areas with taller and more heterogeneous canopies with lower stem density proved to be particularly vulnerable [30,31]. Moreover, integration of spaceborne LiDAR with multispectral and Synthetic Aperture Radar (SAR) data through machine learning fusion allows for continuous 10–30 m resolution canopy height mapping across Puerto Rico’s heterogeneous forest, with bias-correction using airborne LiDAR measurement improved the systematic height underestimation particularly in dense canopies with multi-layered structures [32,33]. Such methodological improvements in LiDAR-based forest structural characterizations establish the foundation for using pre and post hurricane canopy height measurements to reconstruct spatial distribution of hurricane wind speed through tree breakages analysis.
This study aims to model the island-wide wind distribution of Hurricane Maria through back-calculation from LiDAR-derived tree damage information. We integrated individual-tree segmentation, diameter at breast height (DBH) estimation from canopy metrics, and a mechanical breakage model to back-calculate the critical wind speed (CWS) at the tree level. These CWS values are aggregated within 115 km2 tiles and converted to a canopy-referenced wind speed metric (U10canopy), enabling reconstruction of Hurricane Maria’s spatial wind field across the island of Puerto Rico. This approach not only highlights where damage occurred, but also quantifies the intensity gradient of the hurricane wind. Our analyses of the pre- and post-Maria hurricane LiDAR collection have shown significant height reduction in the eastern part of the island and around the track of the hurricane, where there was an average 2.5 m height difference before versus after the hurricane. Our findings indicate that areas with higher elevation have greater absolute height loss, whereas areas near the storm’s path experienced more than 40% tree breakages at stem. The individual tree delineation and analysis of breakage by stem diameter versus forest wetness level performed in this study shows taller vegetation is more prone to absolute height loss and that variation and median percent height loss decreases as stem diameter increases in all forest type. The resulting U10canopy map reveals a clear southeast-to-southwest wind intensity gradient, with the highest estimated winds concentrated near landfall and progressively weaker winds toward the island’s interior and west. We compare this spatial pattern and wind magnitude distribution with surviving NOAA stations and Weather Research and Forecast (WRF) model outputs, showing broadly consistent gradients and comparable magnitudes.
2. Materials and Methods
A full island-scale LiDAR workflow was applied to link forest structural damage with modeled hurricane winds. Pre- and post-Maria airborne LiDAR point clouds were processed to generate a canopy height model (Figure 1), from which individual tree crowns were segmented and structural attributes such as maximum pre-hurricane’s height and crown width were derived. These attributes were used to estimate stem diameter and breakage height, allowing calculation of each tree’s critical wind speed (CWS) using a mechanical model of stem failure. The resulting tree-level CWS values were then summarized within aggregation tiles and converted to the wind speeds referenced 10 m above the canopy, producing a spatially continuous map of Hurricane Maria’s wind intensity across Puerto Rico.
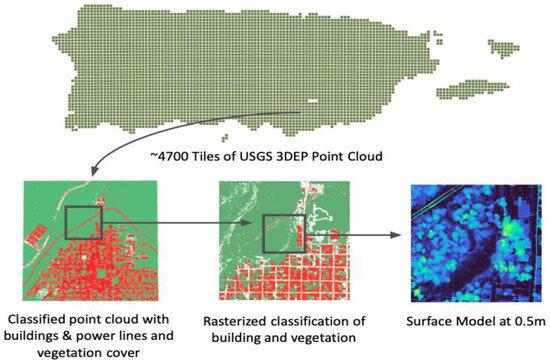
Figure 1.
Overview of process for LiDAR point cloud classification using 4700 USGS 3DEP LiDAR tiles, where the planarity segmentation algorithm was used to separate vegetation at 0.5 m resolution.
To assess the reliability of the tree parameter estimates, we performed validation by comparing them to the ground collection records from the 2003 Puerto Rico Forest Inventory and Analysis (FIA) aggregated by Holdridge forest life zones [34] (Figure 2). Moreover, the calculation of the critical wind speed was performed using stem breakage at the maximum post hurricane height for each individual tree. In order to account for the local neighboring canopy structures, statistics of individual trees and their critical wind speed were aggregated within tiles of 115 km2. This tile size was chosen empirically to ensure a consistent sample size that achieve full island coverage and aligned with the spatial resolution of mesoscale reanalysis products such as ERA5 and WRF grids, enabling direct comparison with modeled wind fields.
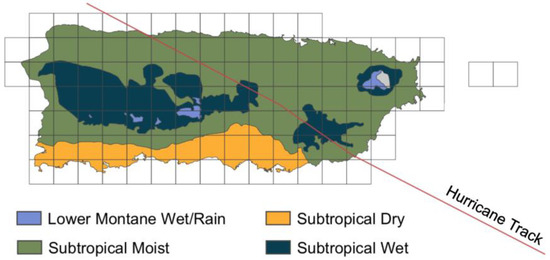
Figure 2.
Puerto Rico’s forest-type distribution overlaid with the 115 km2 wind speed aggregation tiles. The forest types are used to validate tree stem diameters derived from LiDAR to the ground collection records from FIA 2003.
The representative CWS for each tile was obtained by selecting the quantile of the tree-level CWS distribution that aligns with the observed fraction of stem breakages within that tile. While this approach is an explicit modeling assumption, it is anchored to the measured stem breakage fraction of the tile, where tree heights were normalized to remove topographic effects prior to breakage analysis. This ensures that the summarized CWS reflects the observed damage pattern rather than local elevation differences and provides a consistent, reproducible way to translate the observed stem breakages into comparable wind speed estimates across the island.
The CWS is transformed into mean hourly wind speed at 10 m above canopy center (U10canopy) by applying vertical wind profile analysis that accounts for local and neighboring canopy structure at the mentioned spatial aggregation. This spatial aggregation smooths individual-tree variability while preserving large-scale wind gradients, providing a basis for systematic comparison with independent meteorological observations and model outputs. We have included the derived pre- and post-Maria surface model for trees on the island as shared data for this publication.
2.1. USGS 3DEP LiDAR Data and Processing Environment
Airborne pre- and post-H-Maria Puerto Rico LiDAR data are part of the USGS 3D Elevation Program [35]. The pre-Maria LiDAR point cloud was collected from January to May 2016 and December 2016 to March 2017, while post Maria collection was in the Summer and Fall of 2018. The LiDAR tiles count totals 4714 for pre-Maria and 4675 for post Maria, with each tile having a dimension of 2.25 km2. The pre-Maria point cloud has a >2 points per square meter density while the post Maria point cloud has a >8 points per square meter density. Both LiDAR point clouds have ground and high/low noise points classified. Point cloud processing took advantage of multicore and catalog processing in the lidR package [36], which was performed iteratively on High-Performance Computing at New York University Greene facility.
2.2. Point Cloud Processing and Classification
Raw LiDAR point cloud is filtered to contain only ground and unclassified points, which is followed by further removal of duplicate points and points with GPS incoherence to remove noise in the data. An additional noise removal is also performed on the unclassified points using an isolated voxel filter to further remove noise points that were not classified in the data.
A digital terrain model (DTM) with a 0.5 m resolution is generated by the K-nearest neighbor interpolation method on the pre-classified ground points. The DTM is then used to normalize the point cloud and rasterized to create a normalized digital surface model (NDSM), which is generated by applying the pitfree algorithm on the highest points of clouds. This algorithm employs a combination of multiple surface models at different heights to avoid irregularities to which is deemed fitting for tree segmentation [37].
Aside from rasterization, the normalized point cloud is classified into vegetation and built infrastructure points based on the shapes of local neighboring points. The main assumption for this classification method works on the premise that man-made structures such as roofs and walls exhibit regular shapes with a certain degree of planarity while shapes of vegetation are naturally irregular. Planarity and linearity detection was performed using the shape detection function from the lidR package that employs the algorithm provided by Limberger et al. [38]. This planarity algorithm calculates the eigenvalue decomposition of the XYZ in local neighboring points and classifies it based on the user-defined threshold into a binary true/false group. The algorithm is then applied to points above 4 m (removing larges bushes) and classified into a single group.
The voxel metric calculation was performed on the planar and linear classified point cloud to further smooth the segmentation of the two features. The classified point cloud was voxelized into a voxel cloud with uniform 0.25 m spacing with planarity/linearity median calculation performed on all the points within the voxel. The resulting point cloud has a uniform spacing with planarity/linearity percentage attributed to each point. Value thresholding was then performed to complete the segmentation between vegetation and non-vegetation points. The classified voxel is then rasterized based on the median value of 1 m resolution and resampled to 0.5 m to adhere to the DTM and NDSM resolution. An additional raster morphological filter is also applied to the classification raster as a post-processing step to solidify segments and remove misclassified pixels.
The canopy height model (CHM) is then created by masking the planar/linear pixels within the NDSM using the classification raster. For the purpose of the tree damage mechanic calculation, the vegetation segments generated from the pre-Maria LiDAR dataset are further considered, as these segments reflect the pre-H-Maria baseline. The CHM raster for all the LiDAR tiles is then mosaicked together to reduce the edge effect when delineating individual trees.
2.3. Individual Tree Detection
The derived pre-H-Maria CHM serves as the base of the individual tree segmentation. A focal median filter is applied to smooth the CHM, then followed by a local maximum filter with a gated inverse-exponential window size function to detect treetops. Tree segmentation is performed using the 2016 Dalponte algorithm which specifies the delineation on the detected treetop locations. The Dalponte method is a region-growing algorithm that starts at the pixel where treetops are identified and continue to pixels to regions based on whether the vertical distance of the four neighboring pixels is less than a defined percentage of the maximum height [39]. Using the delineated crowns, pre- and post-Maria maximum height, as well as the 0% and 25% height distribution quantiles were extracted from the CHM, and crown dimensions were calculated for each segmented tree.
2.4. Tree Atem Diameter Estimation Based on Allometry
Tree stem diameter estimation at different height points is a crux of the tree-wind loading and damage mechanic’s model. The diameter at breast height (DBH) located at 1.35 m is estimated using the global linear model from the Jucker et al. [40] tree allometry study, which is a function of the tree height and the crown diameter (Table 1). This DBH model is already implemented in the R package ItcSegment (version 1.0) [41]. Diameter at breakage (DBR) height points is then calculated from the distance to the height of wind action set at mid-height of the tree canopy [42].
A study performed by Luo et al. [43] shows the use of height density distribution of a single tree point cloud, where a height profile and its derivative curves are generated using spline interpolation, with the crown base identified as the inflection point between the first and second derivatives with the maximum height. In a similar but simpler approach, the crown base estimation in this study is defined as the mean of 0 and 25th height percentile of the pixel height distribution of a single tree (Table 1). This approximation is performed to compensate for the two-dimensional representation of a tree canopy in the CHM where trees within a forest stand are in proximity, therefore may not fully capture the actual bottom-end of the canopy within the pixel resolution.
2.5. Stem Parameterization and Height of Breakage
The tree stem is defined to start from the center of the canopy (which can also be defined as the height of wind action ( in Figure 3) to the bottom of the tree. A broken tree is considered when the breaking point falls on the stem of the tree, located below the height of wind action, or below the midpoint of a canopy. The breakage point is set by taking the maximum pixel height from the post H-Maria CHM within a delineated tree crown ( in Figure 3). Height loss above the canopy center represents branch breakage, which does not qualify in the current formulation of tree breakage mechanics.
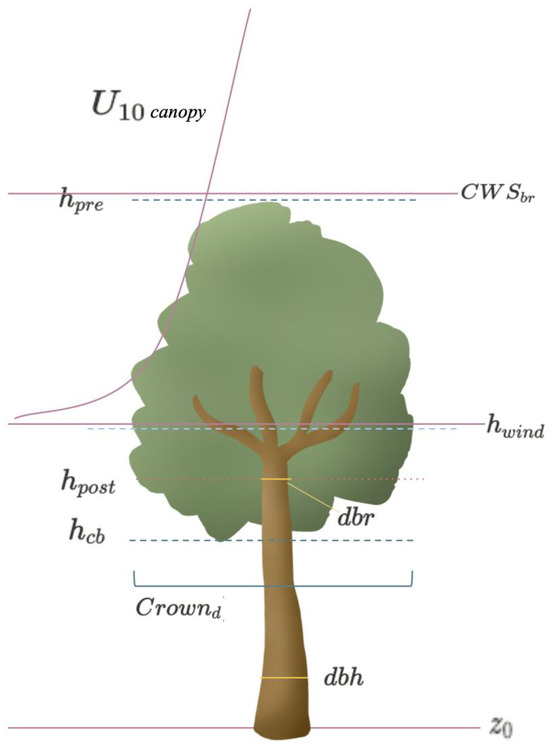
Figure 3.
Diagram of tree parameterization.
2.6. Wind Speed Calculation
The resistance of trees to wind forces depends on the tree stem diameter and the material strength of the trunk as breakage would occur due to excessive stress on the fibers beyond the material’s Modulus of Rupture (MOR) [44]. MOR of trees across the island was calculated based on tree density in accordance with Baar et al. [44], where for the most prevalent, the wood density in Puerto Rico is set at 0.7 g/cm−1. Such an approach is a generalized estimation applied to all the trees in this study to fill the gaps (Table 1).
The critical wind speed (CWS) at the top of the canopy is defined as the minimum speed required to cause structural failure (breakage) at a given height. It represents the ratio of a critical bending moment (bending moment that caused the tree stem to break) to a given tree turning moment coefficient [25]. This coefficient is defined by Hale et al. [45] as a dimensionless value that represents a ratio between the maximum hourly bending moment and the square of average of the hourly wind speed at the top of the canopy. The critical bending moment is expressed in relation to the MOR and stem diameter of breakage [46] while the individual tree turning moment coefficient is a linear function of diameter at breast height (corresponding to a human breast height) and maximum tree canopy height [42,47].

Table 1.
Listed equations to estimate tree parameters from the LiDAR-derived delineated crowns with cited sources.
After the above calculations are completed for each tree, an aggregation cell of 115 km2 is employed to calculate the extent of breakages within that tile. It is then used to create at threshold point by determining the quantile of CWS distribution across the tile that corresponds to the value of the percentage of broken trees in the tile. This aggregation is also used to facilitate comparison with wind speed reported from weather models. Resulting representative CWS for each tile thus reflects the minimum wind speed to cause the observed degree of stem breakages. This representative CWS is then transformed into predicted hurricane mean hourly wind speed (U10canopy) at 10 m above the height at which wind forces act on a forest (average height of canopy centers in a tile) by applying the vertical wind profile of neighboring trees using the Raupach [48] method to account for the local neighboring canopy structures. U10canopy is a function of forest height, aerodynamic roughness (height above ground which wind speed is negligible) and zero plane displacement (a height at wind force acts upon forest) [47]. The mean frontal area index (λ) is used to calculate the aerodynamic roughness () and drag coefficient (γ) and averaged for by 115 km2 cell. All equations for tree parameters and wind speed estimates are listed with cited sources in Table 1.
3. Results
A total of 4332 pre- and 4310 post-Maria LiDAR point cloud tiles were classified and rasterized at a 0.5 m resolution, resulting in island-wide elevation and classification raster. Some areas in the El Yunque and Bosque Estatal de Carite National Forests are missing from the 2018 3DEP Point Cloud tiles.
3.1. Rasterization Results and Elevation Distribution
In Figure 4, built features in red are delineated from the vegetation in green. The partition of the classification closely resembles the outline of the built-up area in the aerial image of the select cities. Overall, vegetation cover occupies 86.5% of the classification pixels amounting to 7420 km2 while built infrastructure occupies 13.5% of pixels amounting to 1162 km2. To further validate the classification, we applied the Enhanced Vegetation Index (EVI) from the Sentinel 2 multispectral imagery [49] and applied a manual threshold in order to differentiate between vegetation and non-vegetation pixels. The LiDAR classification (Figure 4A) effectively distinguishes between built-up areas and vegetation, closely matching the boundaries observed in the optical Sentinel 2 imagery (Figure 4C). The Enhanced Vegetation Index (EVI) classification (Figure 4B) further supports these results, highlighting dense vegetative cover in green and urbanized regions in red, which aligns with the LiDAR-derived classification. The comparison between LiDAR and EVI classifications demonstrates the robustness of the LiDAR classification method which segmented built and natural features based on the planarity of neighboring points.
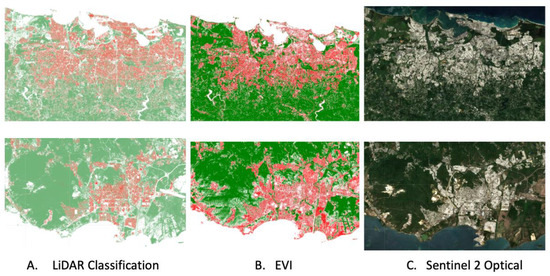
Figure 4.
Rasterized classification from LiDAR Point cloud for San Juan (top) and Ponce (bottom) compared to EVI derived from Sentinel 2 imagery; areas in red indicate the built environment while the vegetative cover is represented in green.
The ground elevation model shows the mountainous range within the center of the island and the surrounding lower coastal regions with a near sea surface elevation (Figure 5). The elevation data highlights the variation in topography across the island, which results in different sheltering mechanisms in different parts of the island.
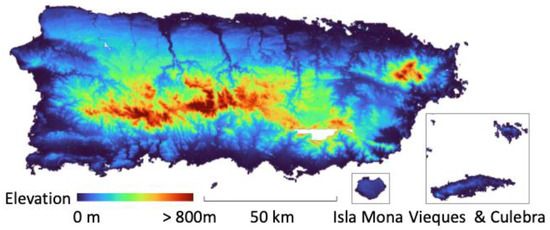
Figure 5.
Ground elevation model of Puerto Rico derived from rasterizing LiDAR point cloud. The mountainous region is shown within the center of the island.
3.2. Individual Tree Detection and Diameter Validation
Approximately 155 million crowns were delineated from the 2016 pre-Maria canopy height model with more trees distributed toward the central west and southern part of the island (Figure 6 and Figure 7). Stem diameter at breast height was estimated using the delineated crown area and individual tree height for all the 150 million trees. The tree canopy height is shown in Figure 6. Taller trees over 20 m are distributed within the mountainous region in the west of the island and toward the southeastern tip of the island. Part of the outer El Yunque forest in the northeast also exhibits taller trees compared to its inner area.
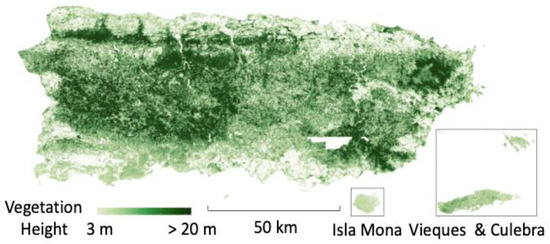
Figure 6.
The canopy height model generated from the Pre-Maria LIDAR Dataset.
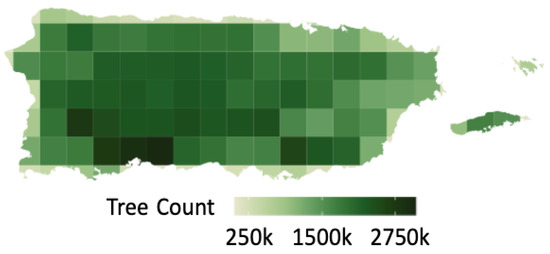
Figure 7.
Tree count distribution per 115 km2 tile. Only trees from areas that are available in both pre- and post-LIDAR data are considered.
Taller trees are located within the wet zones (see Figure 2) as compared to the surrounding moist and dry zone on the south coast of the island. Variation in the spatial distribution of stem diameter at breast height over the island can be observed in Figure 8. Trees located in the central western region and on the southeastern coast where Hurricane Maria made its landfall have a larger mean DBH of greater than 20 cm as compared to the thinner trees found on the central southern coast of the island. It can be inferred that the resulting trees with identical stem diameter and height derived from the rasterized LiDAR point cloud are within proximity to one another and found in the same forest type mapped by the FIA 2003.
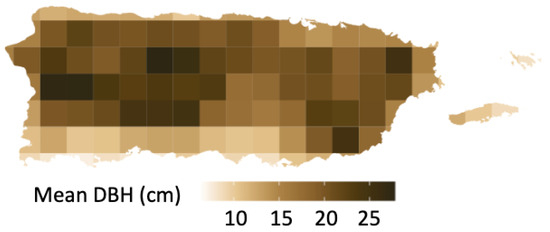
Figure 8.
Spatial Distribution of stem diameter at breast height calculated from individual tree’s height and crown size.
It must be noted that in this study, the total delineation of individual trees is 155,595,162, whereas the FIA 2003 estimated a total of 1,602,840,432 trees [34] on the island. The discrepancy in the total number of trees highlights a key limitation of individual trees delineation from the LiDAR-derived canopy height model. Airborne LiDAR is designed to primarily capture the upper most surface points, and therefore, in the case of thick canopies, misses smaller trees under the dense foliage. The canopy height model itself is rasterized by taking the highest points per pixel area, which then used detect treetops and delineate crown area, resulting in potential under-segmentation as dense canopies overlap to one another. While this under-segmentation contributes to the underestimation of the total tree counts, it rather accentuates larger trees with more dominant canopy sizes. The use of allometric relationship from Juncker et al. [40], which were designed for the LiDAR-derived canopy model, remains useful for estimating DBH from the delineated crowns. Therefore, the validation of DBH values derived from crown diameter and height information in this study is performed by comparing their proportional distribution over tree density per forest types to the distribution collected from Puerto Rico FIA 2003 (Figure 9).
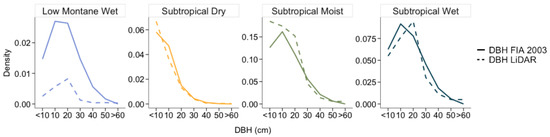
Figure 9.
Forest density versus stem diameter, comparison of LiDAR generated tree model with FIA 2003 for different forest types.
Nevertheless, the overall trend of LiDAR-derived DBH closely follows the DBH distribution from the FIA 2003 (Figure 9). Trees in dry forests have smaller stems as these regions are dominated by DBH less than 20 cm with only a small portion of trees with stems greater than 30 cm. In contrast, wetter forests have a much larger population of trees with stems larger than 20 cm. These wetter forests cover almost the entirety of the island as opposed to the dryer forest that is concentrated on the southern coast. As DBH plays an important role in withholding stems from breakages [20], the aligned distribution from the validation of the LiDAR-derived canopy to the FIA 2003 demonstrate the reliability of the DBH estimation and offer a robust tree canopy dataset for further wind speed estimation and analysis.
There is a difference in tree density of low montane wet forest between LiDAR derived estimates and the FIA 2003 data. Part of this discrepancy can be attributed to the missing LiDAR regions from El Yunque, which is a large region of such forest type. Furthermore, the dense structure of low montane wet forest hinders the individual tree delineation from this region as overlapping and layers of canopies lead to under-segmentation. Despite the difference in density, the peak of the DBH value is similar, thus indicating that the LiDAR derived model reflects the overall structure of the forest.
3.3. Change Analysis
3.3.1. Height Loss by Elevation
Puerto Rico’s forest surface height in fall 2018 (a year after Maria) is on average 2.5 m lower than Fall 2016 (a year before Maria) (Figure 10). Areas with substantial reduction in height, exceeding 7.5 m loss, are predominantly observed in the central and southeastern part of the island, where H-Maria made its landfall (Figure 10). On the contrary, the southern coast of the islands is sheltered by the mountainous range in the center and further away from the hurricane’s track (Figure 4); thus, it experienced little to no height loss. Such spatial patterns underscore the relationship between topography and wind exposure, the regions with significant height reduction are either in the island’s mountainous core with high elevation or concentrated along and near the storm’s path.
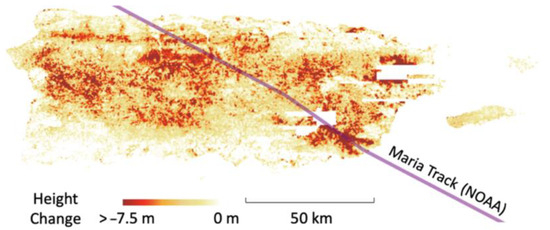
Figure 10.
Surface height change map was created by taking the height difference from pre- (2016) and post- Hurricane Maria (2018).
The island-wide height loss distribution observed by the analysis of pre- vs. post-H-Maria LiDAR scans resembles similar greenness loss observed in earlier H-Maria damage studies by Hu & Smith [13] and Feng et al. [14]. However, while these studies reported forest greenness recovery, the prevalent height loss observed within the LiDAR difference shows that the forest remained in a damaged state even a year after the landfall. Moreover, it is observed that trees at higher altitudes generally experienced greater height loss. Taller features are also observed to experience greater height loss (Figure 11) from the orographic effect of the larger wind at windward mountain sides due to the ground slope, and from larger exposure to the hurricane’s wind due to lack of topographic sheltering as described in Van Beusekom et al. [7].
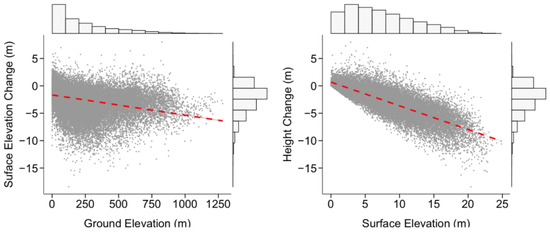
Figure 11.
Scatter plots and histograms of the height change in relation to ground and surface elevation where higher elevation and taller surface suffer more height loss as compared even when height loss is suffered in all altitudes.
3.3.2. Height Loss per Forest Type and Diameter
Tree stem diameter is an important factor in determining the extent of wind damage, as it is one of the primary determinants of a tree’s structural strength in withstanding mechanical stress [42]. In the case of damage from Hurricane Maria, trees with DBH smaller than 10 cm, regardless of the forest type, have a larger height loss, shown by the larger size of boxplots when compared to the larger DBH category in (Figure 12). Furthermore, the size of the boxplot in Figure 12 tends to narrow as DBH increases, suggesting less variability in height loss in trees with larger stem diameter. Subsequently, the median height loss tends to decrease as DBH increases, indicating the susceptibility of trees with smaller stems.
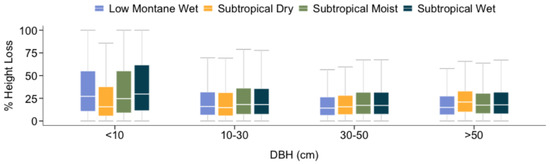
Figure 12.
Boxplot of percent height loss per DBH classes.
Across all DBH classes, the subtropical wet zone shows a slightly higher median height loss, particularly for trees with smaller stems in this region. When referring to Figure 2 and Figure 5, this zone is situated at a higher elevation, thus lacking shelters from wind exposure. An exception is observed within larger-stem trees in subtropical dry forest as the median height loss is higher when compared to other classes. Located on the southern coast of the island, the increased height loss observed in thicker trees in this dry region could suggest that these trees were more exposed due to their height and lack of surrounding shelter.
The ground findings by Uriarte et al. [20] had shown the lesser effect of stem diameter in resisting damages and highlighted the vulnerability of larger trees to hurricanes at Maria’s severity. The finding in this study agrees with the scale of damage as larger trees within the LiDAR-derived dataset experience height loss. However, there is still a prevalent influence of stem diameter and tree size as drivers in trees height loss from wind damage as shown by the distribution in Figure 12. Similarly, the regression analysis by Gao & Yu [18] using LiDAR-derived dataset from the dry forest in Guánica shows the role of mean stem diameter as an important parameter that is correlated to resisting height loss.
The height change profile in Figure 13 shows the loss of taller trees in and subsequent increase in the density of trees less than 20 m. However, the dry forests on the southern coast did not experience this pattern as much as the other forest types did, maintaining similar height distribution before and after Maria. Furthermore, Figure 14 shows the proportion of breakage location per forest type. Overall, about 28.5% of all trees experienced breakages happens at above canopy center and 35.7% happens on stem below the canopy center, with the rest experiencing no breakages. The exact proportion however varies by forest type, but overall breakages at stem dominates the proportion aside for subtropical dry forest. As shown and described previously, the subtropical dry forest in the south of the island is located further from the hurricane’s track and sheltered by the mountain in the central region (refer to Figure 2 and Figure 5). Thus, it is important to further analyze the spatial variability of damage as a function of distance and exposure to the hurricane path.
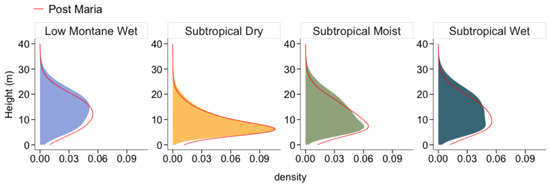
Figure 13.
Pre- and post-Maria height profile of the four forest types of Puerto Rico.
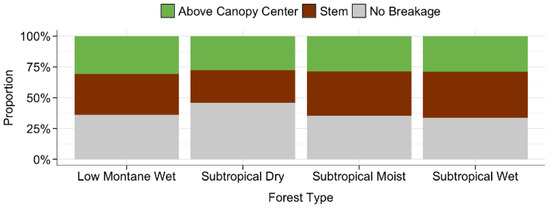
Figure 14.
The proportion of breakage location per forest types with breakages at the stem dominates in most types, aside from the forest in the south of the island.
3.3.3. Changes in Tree Height Proportion
The influence of hurricane wind exposure is further demonstrated by analyzing changes in the spatial distribution of tree height proportion. Changes in tree height proportion were determined by comparing the percentage increase in the proportion of trees shorter than 10 m within the 115 km2 tiles before and after the hurricane. After the hurricane there were more shorter trees, and fewer than in tiles near the path and to the east of the hurricane’s track (Figure 15). A similar finding was reported by Leitold et al. [19] which founds a prevalence of shorter trees in the Luquillo Experimental Forest (LEF), located on the eastern side of the island, even two years after Maria.
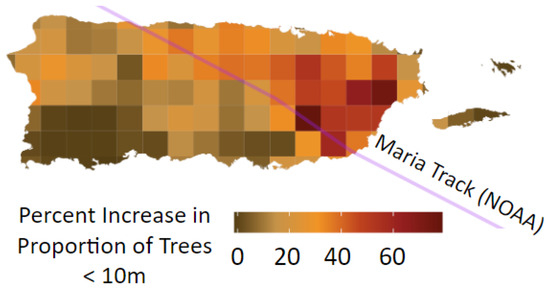
Figure 15.
Percent increase in proportion of short trees (<10 m) spatial distribution with more shorter trees are observed post Maria in areas to the east of the hurricane’s path.
3.3.4. Mapping Breakages at Tree Stem
Furthermore, the spatial pattern of tree damage can be quantified by analyzing the distribution of the percentage of trees broken at the stem within the 115 km2 tiles. Tiles with a higher percentage of over 50% trees broken at the stem are observed towards the landfall in the southeast and dispersed diagonally, following the hurricane track (Figure 16). A similar higher percentage of broken trees is also distributed in the western part of Vieques Island, as it is also in proximity to the path of Maria. Subsequently, tiles towards the west of the track have a lower percentage of broken trees.
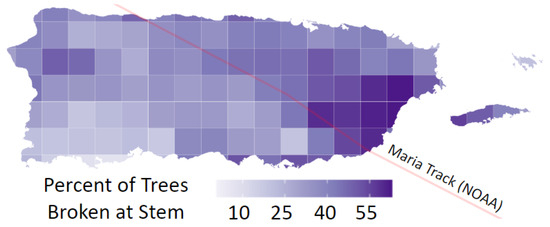
Figure 16.
Spatial distribution of percentage of trees broken at the stem, with more broken trees observed on the eastern side of the island and concentrated towards the landfall.
The spatial distribution revealed by the percentage of trees broken at the stem reflects the pattern of wind intensity across the island. Damage marks in the form of stem breakages are highly concentrated in the landfall region along the hurricane’s path and diminishing further west. This gradient of damage provides a clear indication of the land–wind relationship by illustrating the interaction of varying intensities with the landscape. By leveraging the relationship between wind exposure, proximity to the hurricane’s path, and the observed gradient of tree damage, a threshold point can be established to capture localized wind impacts across different regions.
3.4. Wind Speed Distribution
3.4.1. Critical Wind Speed
Critical wind speed (CWS) calculations were performed at individual tree level then aggregated at 115 km2 tiles to quantify localized interaction among trees across regions. For each tile, the individual CWS distribution was used to establish a threshold that corresponds to the percentage of stem breakages in that tile. This threshold value provides a representative minimum wind speed that reflects the degree of damage based on stem breakage observation. The tile size is also set to enable comparison with wind speed data derived from weather models.
The spatial distribution of the CWS at 115 km2 shows wind speeds nearing 140 km/h within the landfall area and more than 100 km/h in the tiles directly on the path of the hurricane (Figure 17). Toward the Southwestern coast of the island, the CWS is significantly lower as these areas are further away from the hurricane’s track and experienced fewer stem breakages compared to the eastern part of the island. This variation in CWS represents the localized minimum wind speed required to cause the observed percentage of breakages and provides a foundation to calculate wind speed 10 m above the forest representing the wind intensity during Hurricane Maria.
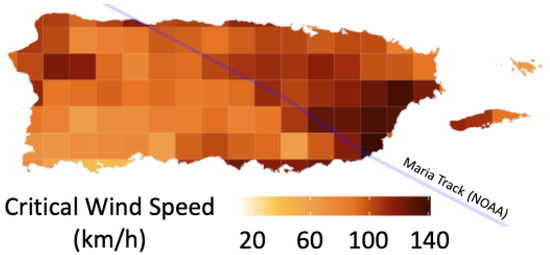
Figure 17.
Critical wind speed spatial distribution at the canopy height shows higher wind speed at the landfall region on the southeastern coast of the island.
To assess the sensitivity of the CWS wind distribution to the wood mechanical properties, we applied different MOR values to specific forest type using their typical wood densities (Sub-Dry = 0.65 g cm−3, Sub-Wet = 0.75 g cm−3, Sub-Moist = 0.7 g cm−3) and compared the CWS to one using the baseline global MOR assumption (0.7 g cm−3). Overall, a mean shift of ~5% is observed, mean CWS forests shifted by −5.5% in subtropical dry and +5.2% in subtropical wet forests relative to the baseline global MOR assumption. For a study of this scale, a shift in this magnitude is modest and indicates that using a single, representative MOR is a reasonable approximation for island-wide aggregation. More importantly, the spatial pattern of wind intensity, including the southeast–northwest gradient, was preserved and tile-level rank ordering remained unchanged. These results confirm that the modeled wind field is robust when considering plausible variation in wood mechanical properties and that the 0.7 g cm−3 baseline provides a defensible central estimate for large-scale wind mapping.
3.4.2. Hurricane Wind Speed and Validation
To derive an estimate of Maria’s wind speed, the CWS is transformed into a U10canopy mean hourly wind speed 10 m above the surface by applying vertical wind profile calculations to each aggregation tile. The vertical wind profile captures the effect of local vegetation height distribution and neighboring canopy structure on wind attenuation and acceleration at 115 km2 tiles across the island. The final U10canopy ranges from approximately 110 s km/h on the southwestern coast to nearly 260 km/h on the southeastern coast at landfall. In the central part of the island, U10canopy wind speeds are moderate, ranging from 120 to 180 km/h. Areas to the east of the track have significantly higher wind speeds above 200 km/h (Figure 18). This spatial distribution of U10canopy highlights the localized effects of wind intensity across the island by incorporating the overall wind profiles of each region to account for its forest structures. The resulting hurricane wind speed reflects the observed damage and offers a clear representation of Maria’s intensity across the island.
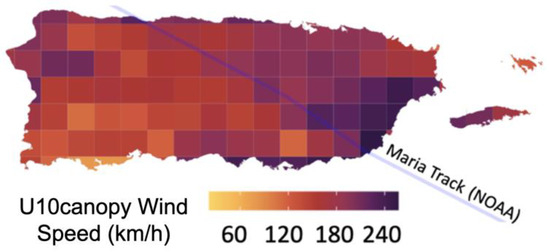
Figure 18.
Final U10canopy wind speed 10 m above surface derived by applying vertical height profile calculation to the critical wind speed.
We compared the U10canopy wind speed to the WRF model by Pokhrel et al. [8], which was performed by taking the maximum wind speed of the 115 km2 tiles (Figure 19). Overall, both models show similar spatial distribution of wind speed where a gradient with a faster wind speed is distributed toward the east of the island. However, the WRF model has a much narrower wind speed range as compared to the range in the U10canopy model. When calculating the difference between the two, a difference of over 100 km/h can be seen in the landfall region on the southeast and the western part of the island, with both models having similar wind speed within the center of the region. The result of the comparison highlights the core difference in the modeling approach: whereas WRF is a numerical model based on land–atmospheric interaction, the U10canopy wind model is derived from tree damage caused by Maria’s wind as a deterministic estimate based on the physical changes.
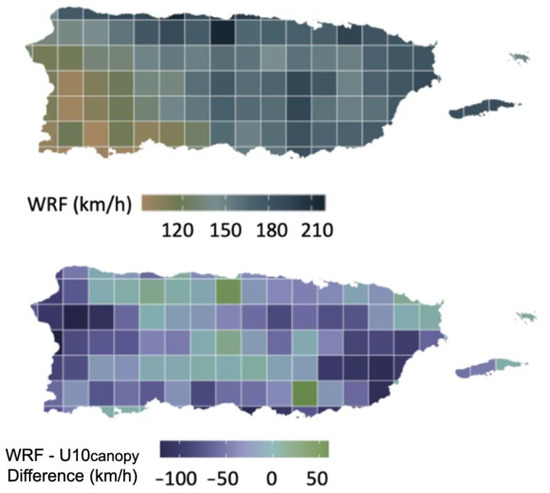
Figure 19.
Comparison of the WRF model in Pokhrel et al. [8] to the U10canopy wind speed distribution calculated from broken trees.
NOAA has published several maximum gust observations which mainly cover the outer part of the island [50]. Overall, the modeled U10canopy wind speeds are within a considerable range of the observed maximum gust at the rest of the weather points within the main island (Figure 20). In the official publication on Hurricane Maria by NOAA and National Weather Service, weather aircraft measurements were also used reporting wind speed at landfall at 1500 ft elevation to be approximately 250 km/h [1]. As one would expect, the wind speed at the aircraft elevation is higher than the speed measured using the ground sensor on land at landfall. When it comes to modeling, Culebra’s size provides insufficient data points within the 115 km2 aggregation. it is also more exposed to the hurricane and therefore has different aerodynamics and wind profile that may be out of the model assumptions. Taking all measurements vs. the model output at the measurement points (except Culebra) the R-Square is 0.68 with RMSE of 35.8 Km/h and MAE of 23.3 Km/h. Considering the above, the results seem promising.
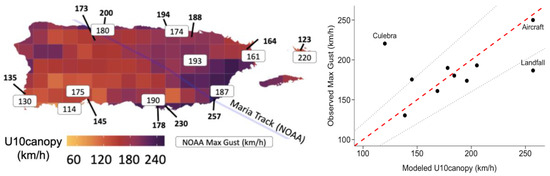
Figure 20.
Comparison of U10canopy Wind Speed to the maximum observed gusts from several NOAA weather stations. Dashed line shows 1:1 correspondence; dotted lines show ±20% range.
4. Discussion
Our approach in this study necessarily relies on several assumptions and data-driven simplifications due to the scale of the analysis and the available datasets. As such, individual tree detection from airborne LiDAR underestimates total tree counts compared to FIA data. This is caused by inherent limitations of airborne LiDAR where it primarily captures the upper canopy surface and cannot penetrate dense foliage to fully resolve the understory. As a result, the total number of delineated trees (~155 million) is substantially lower than the FIA estimates (~1.6 billion), reflecting under-segmentation in multilayered stands. This limitation not only affects tree counts but also underrepresents the true representation of vertical structure, as overlapping crowns are merged and suppressed individuals are omitted. Nevertheless, the LiDAR-derived DBH distribution closely matches FIA records across Holdridge life zones (Figure 2), which indicates that the detected dominant and co-dominant crowns still capture the structural properties of the canopy layer that govern wind loading. While this omission of understory may likely to cause an underestimation of aerodynamic roughness () and zero-plane displacement (d) in areas with dense understory, the resulting wind distribution reproduces the expected southeast-to-northwest intensity gradient that aligns well with NOAA station records and WRF simulations. This suggests that, despite the missing understory, the modeled canopy layer remains a reliable proxy for wind exposure at the landscape scale.
A second source of uncertainty is the use of a global allometric model [40] to estimate DBH from LiDAR-derived tree height and crown diameter. Puerto Rico’s forests are highly diverse with many species that overlap in distribution and attributes. While local calibration data for Puerto Rico would reduce per-tree error, no island-wide mapping of tree species or species-specific allometries currently exist that could support stratified DBH modeling. Therefore, for large-scale aggregation studies, a global model that integrates information from thousands of trees across biomes provides a robust and generalizable relationship between height, crown diameter, and DBH. Comparing the LiDAR-derived stem to the FIA records shows that, at the population level, DBH distributions closely track field-measured distributions across Holdridge life zones and therefore indicate that systematic bias from this simplification is limited. Such alignment suggests that the global model captures the central tendency of stem size even in Caribbean forests, which reiterate its usefulness as a proxy in the absence of spatial, species-specific data.
5. Summary and Conclusions
Puerto Rico Island-wide LiDAR point clouds were classified and rasterized at 0.5 m and used to delineate individual trees in Puerto Rico before and after Hurricane Maria. More than 150 million trees were identified, and height loss throughout different forest types were mapped. Wind speeds at treetops were calculated using a structural mechanics model that incorporated tree size and tree species. This wind speed is subsequently used to derive the wind speed distribution 10 m above the canopy (U10canopy), ranging from around 110 s km/h on the southwestern coast to nearly 260 km/h on the southeastern coast at landfall. The U10canopy wind speed distribution across the island was compared with the wind speed estimated by weather models, showing similar ranges, for example, to those reported in the US National Oceanic and Atmospheric Administration and the US National Weather Service [1]. The calculated U10canopy wind speed is also in good agreement with the recordings of the few weather stations that survived the hurricane. The availability of surface model data used in this study demonstrates good utility in the reported use case. It also shows promise in other applications, including the ability to carry out change detection during extreme events with multiple useful applications, including infrastructure damage and vulnerability assessment.
Author Contributions
Conceptualization, V.R. and G.M.; methodology, V.R. and G.M.; software, V.R. and G.M.; formal analysis, V.R. and G.M.; investigation V.R. and G.M.; data curation, V.R.; writing—original draft preparation, V.R.; writing—review and editing, V.R. and M.G.; supervision, M.G. All authors have read and agreed to the published version of the manuscript.
Funding
This research received no external funding.
Data Availability Statement
The data presented in this study are available on request from the corresponding author.
Conflicts of Interest
The authors declare no conflicts of interest.
References
- Pasch, R.J.; Penny, A.B.; Berg, R. National Hurricane Center Tropical Cyclone Report: Hurricane Maria. In Tropical Cyclone Report AL152017, National Oceanic And Atmospheric Administration and the National Weather Service; National Hurricane Center: Miami, FL, USA, 2018; pp. 1–48. [Google Scholar]
- Montoya-Rincon, J.P.; Azad, S.; Pokhrel, R.; Ghandehari, M.; Jensen, M.P.; Gonzalez, J.E. On the Use of Satellite Nightlights for Power Outages Prediction. IEEE Access 2022, 10, 16729–16739. [Google Scholar] [CrossRef]
- Azad, S.; Ghandehari, M. A Study on the Association of Socioeconomic and Physical Cofactors Contributing to Power Restoration After Hurricane Maria. IEEE Access 2021, 9, 98654–98664. [Google Scholar] [CrossRef]
- Boose, E.R.; Foster, D.R.; Fluet, M. Hurricane Impacts to Tropical and Temperate Forest Landscapes. Ecol. Monogr. 1994, 64, 369–400. [Google Scholar] [CrossRef]
- Boose, E.R.; Serrano, M.I.; Foster, D.R. Landscape and regional impacts of hurricanes in Puerto Rico. Ecol. Monogr. 2004, 74, 335–352. [Google Scholar] [CrossRef]
- Patricola, C.M.; Wehner, M.F. Anthropogenic Influences on Major Tropical Cyclone Events. Nature 2018, 563, 339–346. [Google Scholar] [CrossRef] [PubMed]
- Van Beusekom, A.; Álvarez-Berríos, N.; Gould, W.; Quiñones, M.; González, G. Hurricane Maria in the U.S. Caribbean: Disturbance Forces, Variation of Effects, and Implications for Future Storms. Remote Sens. 2018, 10, 1386. [Google Scholar] [CrossRef]
- Pokhrel, R.; Cos, S.D.; Montoya Rincon, J.P.; Glenn, E.; González, J.E. Observation and Modeling of Hurricane Maria for Damage Assessment. Weather. Clim. Extrem. 2021, 33, 100331. [Google Scholar] [CrossRef]
- Marcano-Vega, H. Forests of Puerto Rico, 2014. Resource Update FS–121; US Department of Agriculture Forest Service, Southern Research Station: Asheville, NC, USA, 2017; Volume 121, pp. 1–4. [Google Scholar]
- Heartsill Scalley, T.; Scatena, F.N.; Lugo, A.E.; Moya, S.; Estrada Ruiz, C.R. Changes in Structure, Composition, and Nutrients During 15 Yr of Hurricane-Induced Succession in a Subtropical Wet Forest in Puerto Rico. Biotropica 2010, 42, 455–463. [Google Scholar] [CrossRef]
- López-Marrero, T.; Heartsill-Scalley, T.; Rivera-López, C.F.; Escalera-García, I.A.; Echevarría-Ramos, M. Broadening Our Understanding of Hurricanes and Forests on the Caribbean Island of Puerto Rico: Where and What Should We Study Now? Forests 2019, 10, 710. [Google Scholar] [CrossRef]
- Lugo, A.E.; Scatena, F.N. Background and Catastrophic Tree Mortality in Tropical Moist, Wet, and Rain Forests. Biotropica 1996, 28, 585. [Google Scholar] [CrossRef]
- Hu, T.; Smith, R. The Impact of Hurricane Maria on the Vegetation of Dominica and Puerto Rico Using Multispectral Remote Sensing. Remote Sens. 2018, 10, 827. [Google Scholar] [CrossRef]
- Feng, Y.; Negrón-Juárez, R.I.; Chambers, J.Q. Remote Sensing and Statistical Analysis of the Effects of Hurricane María on the Forests of Puerto Rico. Remote Sens. Environ. 2020, 247, 111940. [Google Scholar] [CrossRef]
- Hall, J.; Muscarella, R.; Quebbeman, A.; Arellano, G.; Thompson, J.; Zimmerman, J.K.; Uriarte, M. Hurricane-Induced Rainfall Is a Stronger Predictor of Tropical Forest Damage in Puerto Rico Than Maximum Wind Speeds. Sci. Rep. 2020, 10, 4318. [Google Scholar] [CrossRef]
- Negrón-Juárez, R.; Baker, D.B.; Zeng, H.; Henkel, T.K.; Chambers, J.Q. Assessing Hurricane-induced Tree Mortality in U.S. Gulf Coast Forest Ecosystems. J. Geophys. Res. 2010, 115, 2009JG001221. [Google Scholar] [CrossRef]
- Negrón-Juárez, R.; Baker, D.B.; Chambers, J.Q.; Hurtt, G.C.; Goosem, S. Multi-Scale Sensitivity of Landsat and MODIS to Forest Disturbance Associated with Tropical Cyclones. Remote Sens. Environ. 2014, 140, 679–689. [Google Scholar] [CrossRef]
- Gao, Q.; Yu, M. Canopy Density and Roughness Differentiate Resistance of a Tropical Dry Forest to Major Hurricane Damage. Remote Sens. 2021, 13, 2262. [Google Scholar] [CrossRef]
- Leitold, V.; Morton, D.C.; Martinuzzi, S.; Paynter, I.; Uriarte, M.; Keller, M.; Ferraz, A.; Cook, B.D.; Corp, L.A.; González, G. Tracking the Rates and Mechanisms of Canopy Damage and Recovery Following Hurricane Maria Using Multitemporal Lidar Data. Ecosystems 2022, 25, 892–910. [Google Scholar] [CrossRef]
- Uriarte, M.; Thompson, J.; Zimmerman, J.K. Hurricane María Tripled Stem Breaks and Doubled Tree Mortality Relative to Other Major Storms. Nat. Commun. 2019, 10, 1362. [Google Scholar] [CrossRef]
- Frelich, L.E.; Ostuno, E.J. Estimating Wind Speeds of Convective Storms from Tree Damage. E-J. Sev. Storms Meteorol. 2021, 7, 1–19. [Google Scholar] [CrossRef]
- Ilies, G.; Ilies, M.; Hotea, M.; Bumbak, S.-V.; Hodor, N.; Ilies, D.-C.; Caciora, T.; Safarov, B.; Morar, C.; Valjarević, A.; et al. Integrating Forest Windthrow Assessment Data in the Process of Windscape Reconstruction: Case of the Extratropical Storms Downscaled for the Gutai Mountains (Romania). Front. Environ. Sci. 2022, 10, 926430. [Google Scholar] [CrossRef]
- Gardiner, B.; Peltola, H.; Kellomäki, S. Comparison of Two Models for Predicting the Critical Wind Speeds Required to Damage Coniferous Trees. Ecol. Model. 2000, 129, 1–23. [Google Scholar] [CrossRef]
- Ancelin, P.; Courbaud, B.; Fourcaud, T. Development of an Individual Tree-Based Mechanical Model to Predict Wind Damage within Forest Stands. For. Ecol. Manag. 2004, 203, 101–121. [Google Scholar] [CrossRef]
- Gardiner, B.; Byrne, K.; Hale, S.; Kamimura, K.; Mitchell, S.J.; Peltola, H.; Ruel, J.-C. A Review of Mechanistic Modelling of Wind Damage Risk to Forests. Forestry 2008, 81, 447–463. [Google Scholar] [CrossRef]
- Peterson, C.J.; Cannon, J.B. Modelling Wind Damage to Southeastern U.S. Trees: Effects of Wind Profile, Gaps, Neighborhood Interactions, and Wind Direction. Front. For. Glob. Change 2021, 4, 719813. [Google Scholar] [CrossRef]
- Dupont, S. A Simple Wind–Tree Interaction Model Predicting the Probability of Wind Damage at Stand Level. Agric. For. Meteorol. 2016, 224, 49–63. [Google Scholar] [CrossRef]
- Dalponte, M.; Marzini, S.; Solano-Correa, Y.T.; Tonon, G.; Vescovo, L.; Gianelle, D. Mapping Forest Windthrows Using High Spatial Resolution Multispectral Satellite Images. Int. J. Appl. Earth Obs. Geoinf. 2020, 93, 102206. [Google Scholar] [CrossRef]
- Torresani, M.; Montagnani, L.; Rocchini, D.; Moudrý, V.; Andreoli, A.; Wellstein, C.; Koyanagi, K.; Ros, L.D.; Bacaro, G.; Perrone, M.; et al. LiDAR Insights on Stand Structure and Topography in Mountain Forest Wind Extreme Events: The Vaia Case Study. Agric. For. Meteorol. 2024, 359, 110267. [Google Scholar] [CrossRef]
- Gao, Q.; Yu, M. Elevation and Distribution of Freshwater and Sewage Canals Regulate Canopy Structure and Differentiate Hurricane Damages to a Basin Mangrove Forest. Remote Sens. 2021, 13, 3387. [Google Scholar] [CrossRef]
- Gao, Q.; Yu, M. Elevation Regimes Modulated the Responses of Canopy Structure of Coastal Mangrove Forests to Hurricane Damage. Remote Sens. 2022, 14, 1497. [Google Scholar] [CrossRef]
- Liu, A.; Chen, Y.; Cheng, X. Evaluating ICESat-2 and GEDI with Integrated Landsat-8 and PALSAR-2 for Mapping Tropical Forest Canopy Height. Remote Sens. 2024, 16, 3798. [Google Scholar] [CrossRef]
- Liu, A.; Chen, Y.; Cheng, X. Improving Tropical Forest Canopy Height Mapping by Fusion of Sentinel-1/2 and Bias-Corrected ICESat-2–GEDI Data. Remote Sens. 2025, 17, 1968. [Google Scholar] [CrossRef]
- Brandeis, T.J.; Helmer, E.H.; Oswalt, S.N. The Status of Puerto Rico’s Forests, 2003. Resour. Bull. SRS-119; US Department of Agriculture Forest Service, Southern Research Station: Asheville, NC, USA, 2007; Volume 119, 72p. [Google Scholar]
- U.S. Geological Survey. USGS 3D Elevation Program Digital Elevation Model. Available online: https://www.usgs.gov/3d-elevation-program (accessed on 3 August 2025).
- Roussel, J.-R.; Auty, D.; Coops, N.C.; Tompalski, P.; Goodbody, T.R.; Meador, A.S.; Bourdon, J.-F.; De Boissieu, F.; Achim, A. lidR: An R Package for Analysis of Airborne Laser Scanning (ALS) Data. Remote Sens. Environ. 2020, 251, 112061. [Google Scholar] [CrossRef]
- Khosravipour, A.; Skidmore, A.K.; Isenburg, M.; Wang, T.; Hussin, Y.A. Generating Pit-Free Canopy Height Models from Airborne Lidar. Photogramm. Eng. Remote Sens. 2014, 80, 863–872. [Google Scholar] [CrossRef]
- Limberger, F.A.; Oliveira, M.M. Real-Time Detection of Planar Regions in Unorganized Point Clouds. Pattern Recognit. 2015, 48, 2043–2053. [Google Scholar] [CrossRef]
- Dalponte, M.; Coomes, D.A. Tree-centric Mapping of Forest Carbon Density from Airborne Laser Scanning and Hyperspectral Data. Methods Ecol. Evol. 2016, 7, 1236–1245. [Google Scholar] [CrossRef] [PubMed]
- Jucker, T.; Caspersen, J.; Chave, J.; Antin, C.; Barbier, N.; Bongers, F.; Dalponte, M.; Van Ewijk, K.Y.; Forrester, D.I.; Haeni, M.; et al. Allometric Equations for Integrating Remote Sensing Imagery into Forest Monitoring Programmes. Glob. Change Biol. 2017, 23, 177–190. [Google Scholar] [CrossRef] [PubMed]
- Dalponte, M. itcSegment: Individual Tree Crowns Segmentation. R Package Version 1.0, 2023. Available online: https://CRAN.R-project.org/package=itcSegment (accessed on 3 August 2025).
- Quine, C.P.; Gardiner, B.A.; Moore, J. Wind Disturbance in Forests: The Process of Wind Created Gaps, Tree Overturning, and Stem Breakage. In Plant Disturbance Ecology; Elsevier: Amsterdam, The Netherlands, 2021; pp. 117–184. ISBN 978-0-12-818813-2. [Google Scholar]
- Luo, L.; Zhai, Q.; Su, Y.; Ma, Q.; Kelly, M.; Guo, Q. Simple Method for Direct Crown Base Height Estimation of Individual Conifer Trees Using Airborne LiDAR Data. Opt. Express 2018, 26, A562. [Google Scholar] [CrossRef]
- Baar, J.; Tippner, J.; Rademacher, P. Prediction of Mechanical Properties—Modulus of Rupture and Modulus of Elasticity—of Five Tropical Species by Nondestructive Methods. Maderas Cienc. Tecnol. 2015, 17, 239–252. [Google Scholar] [CrossRef]
- Hale, S.E.; Gardiner, B.A.; Wellpott, A.; Nicoll, B.C.; Achim, A. Wind Loading of Trees: Influence of Tree Size and Competition. Eur. J. For. Res. 2012, 131, 203–217. [Google Scholar] [CrossRef]
- Jones, H.G. Plants and Microclimate: A Quantitative Approach to Environmental Plant Physiology, 3rd ed.; Cambridge University Press: Cambridge, UK, 2014. [Google Scholar]
- Hale, S.E.; Gardiner, B.; Peace, A.; Nicoll, B.; Taylor, P.; Pizzirani, S. Comparison and Validation of Three Versions of a Forest Wind Risk Model. Environ. Model. Softw. 2015, 68, 27–41. [Google Scholar] [CrossRef]
- Raupach, M.R. Simplified Expressions for Vegetation Roughness Length and Zero-Plane Displacement as Functions of Canopy Height and Area Index. Bound.-Layer Meteorol. 1994, 71, 211–216. [Google Scholar] [CrossRef]
- Drusch, M.; Del Bello, U.; Carlier, S.; Colin, O.; Fernandez, V.; Gascon, F.; Hoersch, B.; Isola, C.; Laberinti, P.; Martimort, P.; et al. Sentinel-2: ESA’s Optical High-Resolution Mission for GMES Operational Services. Remote Sens. Environ. 2012, 120, 25–36. [Google Scholar] [CrossRef]
- National Oceanic and Atmospheric Administration, National Weather Service. Hurricane Maria—September 20, 2017. Available online: https://www.weather.gov/sju/maria2017 (accessed on 3 August 2025).


Disclaimer/Publisher’s Note: The statements, opinions and data contained in all publications are solely those of the individual author(s) and contributor(s) and not of MDPI and/or the editor(s). MDPI and/or the editor(s) disclaim responsibility for any injury to people or property resulting from any ideas, methods, instructions or products referred to in the content. |
© 2025 by the authors. Licensee MDPI, Basel, Switzerland. This article is an open access article distributed under the terms and conditions of the Creative Commons Attribution (CC BY) license (https://creativecommons.org/licenses/by/4.0/).