Article

Monitoring River–Lake Dynamics in the Mid-Lower Reaches of the Yangtze River Using Sentinel-2 Imagery and X-Means Clustering

1
Changjiang Water Resources Committee, Changjiang River Scientific Research Institute, Wuhan 430010, China
2
Key Laboratory of River and Lake Regulation and Flood Control in the Middle and Lower Reaches of the Changjiang River, Ministry of Water Resources, Wuhan 430010, China
3
River Research Department, Changjiang River Scientific Research Institute, Wuhan 430010, China
4
Spatial Information Technology Application Department, Changjiang River Scientific Research Institute, Wuhan 430010, China
*
Author to whom correspondence should be addressed.
Remote Sens. 2025, 17(20), 3421; https://doi.org/10.3390/rs17203421
Submission received: 11 August 2025 / Revised: 23 September 2025 / Accepted: 29 September 2025 / Published: 13 October 2025
(This article belongs to the Section Remote Sensing in Geology, Geomorphology and Hydrology)

Abstract

Highlights

What are the main findings?
  • A seasonal surface water area (SWA) product for the mid-lower Yangtze River (MLRYR) was developed using a multidimensional X-means clustering algorithm with Sentinel-2 imagery.
  • Over the past six years, MLRYR’s SWA remained stable overall, but significant declines were observed in Poyang Lake, Dongting Lake, and Shijiu Lake, while Danjiangkou Reservoir showed the largest area increase.
What is the implication of the main finding?
  • The study provides a robust framework for monitoring surface water dynamics, applicable to other regions, enhancing water resource management and conservation strategies.
  • The findings reveal the complex interplay of climatic factors with hydrological buffering by river networks, informing targeted drought impact mitigation.

Abstract

River–lake systems are essential for sustaining ecosystems and human livelihoods. However, the complexity and variability of large river–lake systems, coupled with characteristic differences in water bodies across regions, have made quantifying their extent and changes inherently challenging. This study implements a robust water extraction method based on the multidimensional X-means clustering algorithm. This method leverages the advantages of Sentinel-2 imagery for water detection. Utilizing the X-means algorithm, it generates a new seasonal surface water area (SWA) product for the mid-lower reaches of the Yangtze River (MLRYR). The implemented method achieved an overall accuracy of 97.98%, a producer’s accuracy of 98.02%, a user’s accuracy of 96.01%, a Matthews correlation coefficient of 0.954, and a Kappa coefficient of 0.954. Analysis of water body dynamics reveals that over the past six years, the overall trend of SWA in the MLRYR has remained stable. However, within a broad range including multiple sub-basins, a decline in SWA has been observed on an inter-annual scale. Among the large lakes and reservoirs in the MLRYR, the water areas of Poyang Lake, Dongting Lake and Shijiu Lake all showed a marked decline. Among all water bodies with a significant increase in area, the Danjiangkou Reservoir is the largest. Further correlation analysis indicates that SWA exhibited the strongest correlations with precipitation and drought index in most sub-basins. In sub-basins where large lakes and reservoirs exist, the presence of river networks played a buffering role by regulating and storing water, thereby reducing the direct influence of climatic factors on lake and reservoir water extent. These findings highlight the complex interplay of climatic and hydrological factors. By integrating satellite imagery and Earth observation, this study advances understanding of MLRYR surface water dynamics, providing a robust framework for monitoring in other regions. It offers critical insights into drought impacts and informs effective water resource management and conservation strategies.

1. Introduction

River–lake systems represent essential components of terrestrial surface water, playing a critical role in sustaining all forms of life. In addition to serving as conduits for inland surface water resources that support human activities and livelihoods, these systems act as vital interfaces for interactions among Earth’s surface systems [1]. In the context of climate change, river–lake systems around the world have experienced substantial alterations in quantity, morphology, and other characteristics [2,3]. In China, the surface water area (SWA) within the Yellow River Basin has expanded in recent years, primarily due to the proliferation of reservoirs and artificial lakes. Conversely, natural wetlands and lakes have seen a decline [4]. The Yangtze River Basin faced severe flooding in 2020, yet precipitation levels fell below the multi-year average in 2022 and 2023, with the extreme drought of 2022 capturing significant attention [5,6].
The mid-lower reaches of the Yangtze River (MLRYR) feature typical fluvial landforms and extensive lacustrine hydrological ecosystems, embodying a complex zone characterized by sensitive ecosystems and active urbanization [7,8]. Within the MLRYR, major lake basins such as the Poyang Lake Basin, Dongting Lake Basin, and Taihu Lake Basin not only support unique species and natural landscapes but also fulfill important economic functions [9,10]. However, over the past century, rapid population growth and accelerated economic development have led to the progressive shrinkage and fragmentation of river–lake water systems in this region [11,12]. This phenomenon is primarily driven by human activities, including dam construction, sluice gate installation, and lake reclamation [13,14]. The evolution of river–lake systems poses further threats to their ecosystem services, leading to a series of severe ecological and environmental challenges, including heightened water pollution, the invasion of non-native species, and declines in biodiversity, which significantly jeopardize the ecological security of the mid-lower reaches of the Yangtze River [15]. The rivers and lakes in the MLRYR typically exhibit either natural connectivity or artificially regulated connectivity. Thus, changes within the entire water system are shaped not only by external natural factors but also by considerable anthropogenic regulation, leading to complex internal interactions [16]. The study of large-scale river–lake systems necessitates attention to both the complex local hydraulic interactions and the broader issues of river–lake regulation and management. Within the framework of ecological civilization governance, there exists a complex, intertwined relationship between the evolution of the water network and socio-economic development. Effective monitoring of river–lake systems is a prerequisite for achieving sustainable and high-quality development.
Traditional methods for monitoring water systems are insufficient to meet the demands of long-term, large-scale assessments. Remote sensing technology, with its advantages of extensive coverage, high precision, and real-time imaging, has been widely applied in studies of surface water bodies. Researchers globally have developed numerous efficient and high-precision water indices based on the spectral characteristics of water bodies [17,18,19]. Since 2016, the Sentinel satellite series has provided long-term Earth observations, offering finer spectral band divisions and higher spatial resolution than previous monitoring satellites [20,21,22]. Numerous studies have explored water body extraction algorithms based on Sentinel-2 imagery [23,24]. One study proposed a novel Vegetation Red Edge-based Water Index (VREWI) utilizing the B5 (705 nm) and B8A (865 nm) bands of Sentinel-2, which can partially mitigate the effects of mountain and building shadows, cloud shadows, and mixed pixels [25]. The spectral response of water varies with changes in sediment load, algal content, depth, and bottom reflection signals, leading to uncertainties in threshold selection across different times and regions. Some studies have employed various supervised machine learning methods for surface water extent extraction [26,27,28]. However, these supervised machine learning algorithms require large volumes of high-accuracy samples and face challenges due to the variability of water body characteristics across regions, making samples from one region potentially inapplicable to others. Therefore, applying these algorithms to extensive study areas and long-term, high-resolution time-series data can be cumbersome [29]. Unsupervised machine learning algorithms, in contrast, incur no training costs, do not depend on the quality of training datasets, and offer advantages in speed and convenience compared to supervised methods. Clustering emerges as the most suitable unsupervised machine learning method for extracting inland water bodies, as it represents a set of techniques for identifying subgroups or clusters within datasets. Existing studies demonstrate that unsupervised machine learning classifiers dependent on a single feature (e.g., one water index) produced relatively poor and unstable results compared to thresholding methods [30,31]. In contrast, multidimensional clustering could serve as a solution for integrating multiple features (such as reflectance bands and water indices) within a single automated procedure. While prior studies have investigated the effectiveness of combining different water indices and spectral bands in unsupervised multidimensional clustering, further enhancements to its performance warrant additional exploration [32].
The complex river–lake system provides essential support for the economic development of the MLRYR while presenting challenges for the harmonious coexistence of humans and water. Numerous studies have examined the dynamics of surface water in this region, as well as changes in the water surface area of large lakes and reservoirs [33,34]. Previous research has often overlooked the differences in changes among rivers, lakes, and reservoirs or focused exclusively on one type of water body. Few studies have distinguished the connections between the river network system and the dynamics of lakes and reservoirs in this region while addressing variability within sub-basins during large-scale river–lake system dynamic analyses. Aggregating changes across different types of water bodies may obscure unique change patterns [35,36]. Therefore, clarifying the changes in rivers, lakes, and reservoirs is essential for understanding the mechanisms driving surface water changes in the MLRYRB. The primary objective of this study is to implement a robust water extraction method based on the multidimensional X-means clustering algorithm [37] to extract large-scale water bodies, monitor the dynamics of the river–lake system in the MLRYR, and analyze the driving factors behind these dynamic changes. The specific objectives of this study are as follows:
(1)
Employ VREWI [25], which offers improved performance over traditional water indices, together with a modified clustering algorithm to effectively discriminate water bodies. Based on Sentinel-2 imagery, it implements a precise and efficient method for hydrological network extraction. Furthermore, it constructs a new dataset tailored for large-scale river–lake system research, rigorously validating its accuracy.
(2)
Analyze the river–lake system dynamics in the sub-basins of the MLRYR over the past six years, identify the spatiotemporal change characteristics of rivers, lakes, and reservoirs, and reveal the spatiotemporal distribution characteristics of surface water in each sub-basin.
(3)
Analyze how large lakes and reservoirs in the sub-basins of the MLRYR respond to climatic events. Many basins worldwide encounter similar environmental challenges, such as climate change, reservoir construction, and rapid urbanization. Understanding the SWA in the MLRYR can provide valuable insights for the development and management of other basins.

2. Study Area and Dataset

2.1. Study Area

This study is based on the delineation method for second- and third-level sub-basins in China, focusing on the MLRYR, which includes six major second-level basins under the Yangtze River Basin [38]: Hanjiang River Basin, Middle Main Stream Basin, Lower Main Stream Basin, Taihu Lake Basin, Dongting Lake Basin, and Poyang Lake Basin (106°7′E–121°47′E, 24°30′N–33°54′N), covering an area of 7.95 × 10⁵ km2, as depicted in Figure 1. Four of China’s five largest freshwater lakes (Poyang Lake, Dongting Lake, Taihu Lake, and Chaohu Lake) are situated in this region. The MLRYR is endowed with abundant water resources, land resources, and favorable climatic conditions, which provide a foundation for the development of industries such as agriculture, fisheries, and tourism. Additionally, the region receives substantial precipitation, primarily during the summer months (June to August), and is characterized by numerous lake and wetland systems, a complex and diverse topography, and an exceptionally rich wildlife population, offering habitats for rare migratory waterfowl and fish species. In this study, the six major second-level basins are designated as Basins A, B, C, D, E, and F. For clarity, all subsequent references to “sub-basins” in this paper specifically denote third-level sub-basins. The focus of this study is the dynamics in the river–lake systems within this region from 2018 to 2023, including the dynamic changes in lakes/reservoirs with an area greater than 10 km2 and alterations in the river network system.

2.2. Data and Method

2.2.1. Remote Sensing Dataset

Sentinel-2 is a sophisticated high-resolution multispectral imaging satellite featuring a 13-band multispectral imager. These spectral bands include the visible (VIS), near-infrared (NIR), and shortwave infrared (SWIR) regions, allowing for remote sensing imagery with a spatial resolution of up to 10 m [31]. Sentinel-2 is extensively employed for monitoring vegetation, mapping soil and water cover, and observing inland waterways and coastal zones, and it has been widely utilized in water extraction research [39]. This study utilized Sentinel-2 imagery products from 2018 to 2023, specifically covering the mid-lower reaches of the Yangtze River with cloud coverage below 30%. The imagery was processed through atmospheric correction, cloud masking and seasonal mean compositing on the Google Earth Engine (GEE) platform. Adopt the latest Cloud Score+ S2_HARMONIZED V1 dataset for cloud contamination removal [40]. Cloud Score+ serves as a quality assessment processor designed for medium-to-high resolution optical satellite imagery. The Cloud Score+ S2_HARMONIZED dataset is derived from harmonized Sentinel-2 L1C data products and can be utilized to identify relatively clear pixels while effectively eliminating cloud and cloud shadow contamination in both L1C and L2A images.

2.2.2. Auxiliary Data

Additional datasets utilized in this study are summarized in Table 1. The Joint Research Centre (JRC) Global Surface Water (GSW) dataset is a widely used dataset in surface water research [41,42]. The JRC Monthly Water History dataset is utilized for comparison and analysis with the results of this study. Two publicly available datasets: the HydroLAKES lake polygons dataset, and National Major Lakes Distribution dataset were employed to outline lake/reservoir boundaries [43,44]. The National Major Lakes Distribution dataset, provided by the Nanjing Institute of Geography and Limnology of the Chinese Academy of Sciences, establishes the maximum boundary extents of major lakes in the MLRYR based on historical remote sensing data. However, it excludes certain reservoirs and smaller lakes. In contrast, the HydroLAKES dataset is a global collection that accurately delineates the positions of lakes and reservoirs. While this dataset captures the general outlines of lakes and reservoirs, its boundaries often do not reflect their maximum extent observed in the MLRYR between 2018 and 2023. To leverage the strengths of both datasets, this study integrated them and employed multi-temporal high-resolution satellite images to validate and refine the lake boundary delineations. Global River Widths from Landsat (GRWL) data were applied to determine the spatial distribution of river channels across the study area. GRWL is a global river network database mapped based on Landsat data [45]. All the boundary datasets were subjected to manual inspection and then adjusted against high-resolution satellite images to ensure their accuracy. Climate change data were obtained from the ERA5-Land monthly dataset [46]. This reanalysis dataset provides comprehensive monthly climate information at a spatial resolution of 0.1° × 0.1° and serves as a reliable resource for studying the relationship between changes in river–lake systems and various climatic factors [47,48].

2.3. Method

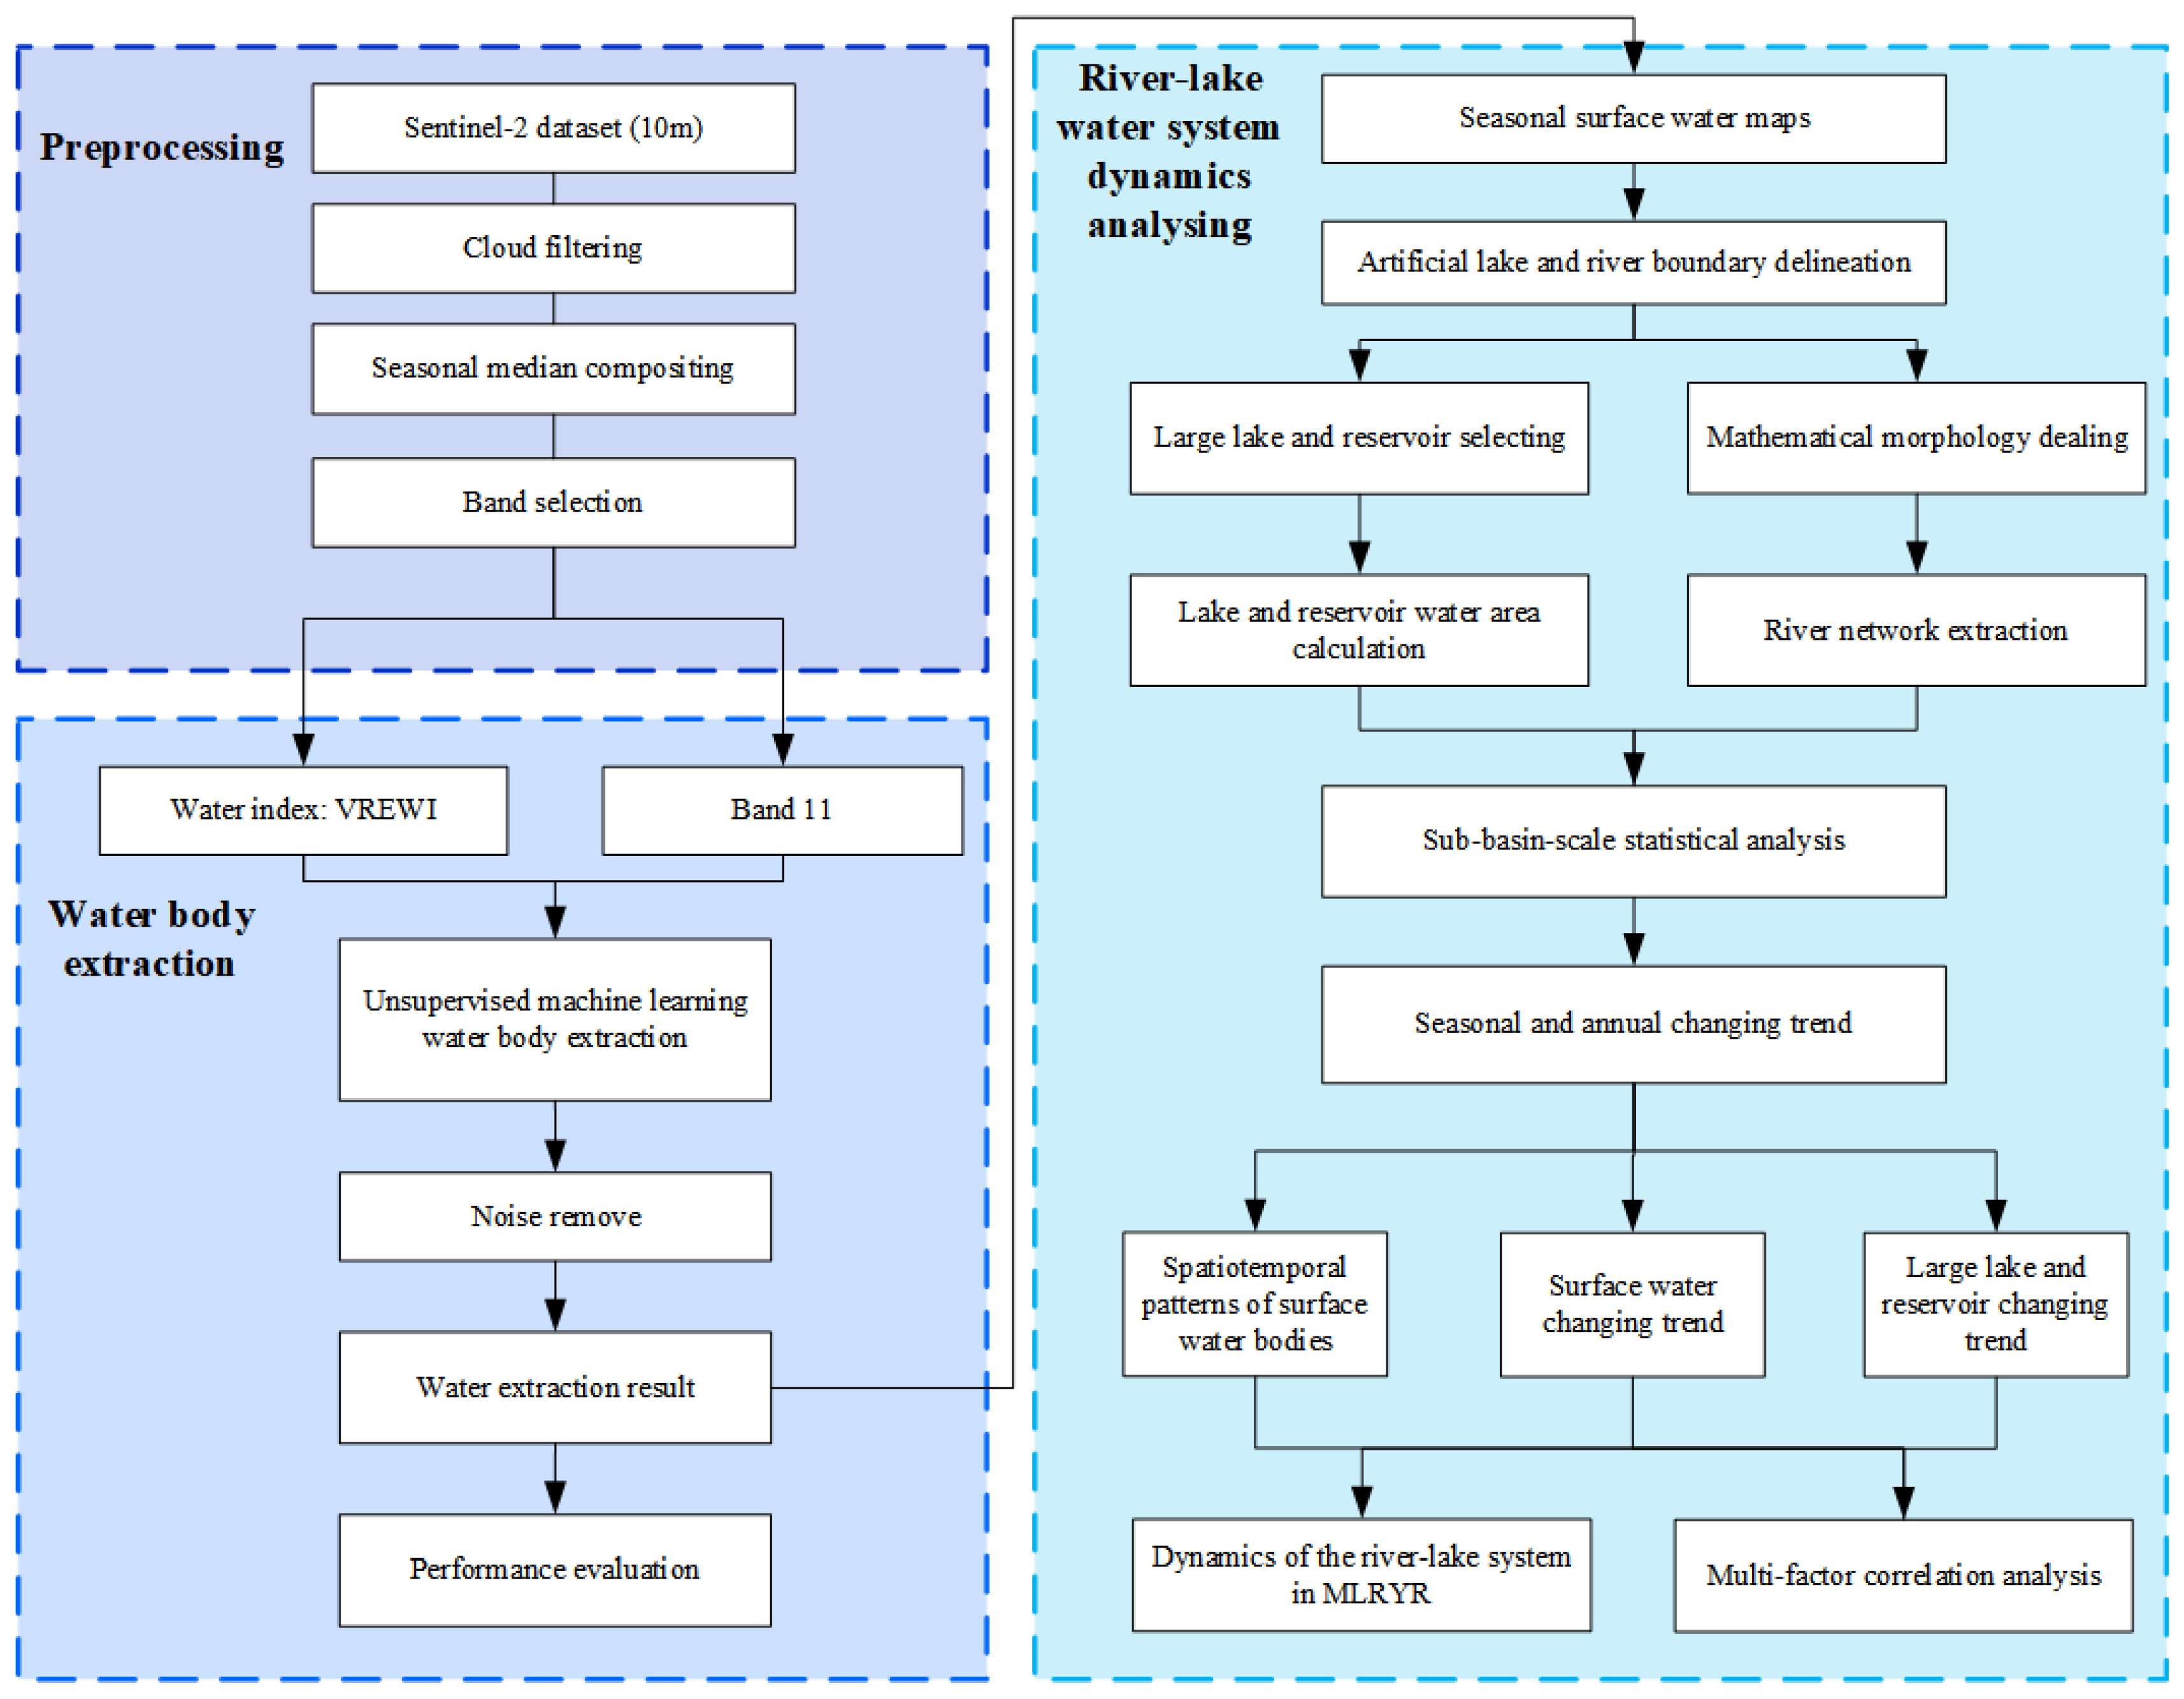
The methodological flowchart comprises three primary steps for deriving and analyzing the time series of river–lake system maps in the MLRYR region (Figure 2). First, Sentinel-2 data were preprocessed by masking cloud pixels and removing potential shadows in the raw imagery on the GEE platform, followed by seasonal mean compositing of multi-band images. This study defines March to May as spring, June to August as summer, September to November as autumn, and December to February of the following year as winter. Therefore, the processed preliminary image dataset contains seasonal composite imagery spanning from March 2018 to February 2024.
Next, the VREWI and the B11 band served as inputs to an unsupervised clustering algorithm for water-body segmentation. Concurrently, several conventional water indices were computed as benchmarks for extraction performance. The raw segmentation outputs underwent a series of post-processing operations—including morphological filtering, small-object removal, and vector smoothing—to produce a refined river–lake network map. Lakes in the MLRYR region exceeding 10 km2 and the principal river channels were subsequently extracted as separate features.
Finally, the spatiotemporal patterns of river–lake system dynamics were explored, quantitative validation was conducted, and the driving mechanisms of these dynamics were analyzed.

2.3.1. The Water Body Extraction Method

This study employs a multidimensional clustering approach integrated with a specific water index for water body extraction, comparing the results with three conventional methods utilized in prior research. The multidimensional clustering method automatically identifies water pixels during the clustering process without necessitating labeled training data. Previous studies have shown that employing a combination of normalized difference water index (NDWI) and Band 12 (B12) for multidimensional clustering with Sentinel-2 data yields optimal results [31,49]. To enhance the extraction results further, this study adopts the Vegetation Red Edge-based Water Index (VREWI) [25] integrated with the X-means clustering method. The X-means clustering method is designed to automatically determine the number of clusters using the Bayesian information criterion. It has been widely applied in remote sensing image classification and data clustering analyses [50,51].
The VREWI [25], specifically designed for extracting small water bodies, is formulated as shown in Equation (1). This index optimizes the differentiation of water bodies from built-up areas, vegetation, mixed pixels, shadows, and bare ground by leveraging the spectral reflectance differences across bands, fully utilizing Sentinel-2’s unique B5 (705 nm) and B8A (865 nm) bands, demonstrating significant advantages in band utilization compared to other indices.
V R E W I = B 3 + B 5 ( B 8 + B 8 A + B 12 ) ( B 3 + B 5 + B 8 + B 8 A + B 12 )
where B3, B5, B8, B8A and B12 are the bands of the Sentinel-2 imagery.
To demonstrate the spectral differences between water bodies and various typical land-cover types in Sentinel-2 images, representative pixels were first selected for water, buildings, vegetation, mixed pixels, shadows, and bare ground. The Minimum Noise Fraction Transform (MNF) and the Pixel Purity Index (PPI) method [52,53] were applied, resulting in the collection of 2164 pure pixels of land features. Subsequently, high-resolution satellite images were used as a reference to confirm the land cover types of pure pixels. The mean remote-sensing reflectance of each class was then calculated, and each mean was divided by the sum of the reflectance across all bands to produce a set of normalized reflectance values. The results are shown in Figure 3. When B5 is used as the band being subtracted from, the reflectance of water bodies is about 30% higher than that of the other five land-cover classes. When B8A is used as the subtrahend, the reflectance of water is lower than that of the other classes. Likewise, the reflectance of water is markedly higher than that of the other five classes in band B3, which is therefore also chosen as a band to be subtracted from; in contrast, the reflectance of water is distinctly lower than that of the five classes in band B12, which is selected as the subtrahend, and the very high reflectance of buildings and bare soil in B12 further amplifies the difference. Although the reflectance gap in band B8 is not as large as in the four bands above, the reflectance of water is still lower than that of the other classes, so B8 is also used as a subtrahend. Taken together, the reflectance-based water index (VREWI) for water bodies is significantly higher than it for the other land-cover types.
Otsu-based thresholding on Band 8 (NIR) and Band 11 (SWIR) achieves superior per-formance for single-band applications [30,31]. Given that VREWI already incorporates B8 and B12 bands but excludes B11, the combination of B11 and VREWI was selected for X-means clustering-based water extraction.
No studies have yet applied the VREWI for large-scale water body extraction. While the threshold range of VREWI for distinguishing water bodies from other features is approximately −0.2 to 0, determining the optimal threshold necessitates manual iterative adjustments to ensure optimal segmentation. The application of the unsupervised machine learning method, clustering, can enhance water extraction efficiency. The K-means clustering method partitions data into K given clusters, in which each observation belongs to the cluster with the nearest centroid (the mean value in each dimension). This process partitions the data space into Voronoi polygons and results in clusters of similar size. This characteristic has strong implications when attempting to separate water from land pixels, because depending on the scene, the bands included in the analysis and the number of water pixels compared to land pixels can imply very different cluster sizes. The traditional K-means algorithm requires predefining the number of clusters (K). However, accurately determining this parameter in practical scenarios poses challenges due to the variability in clustering results under different K values. X-means addresses this limitation by automatically determining the optimal number of clusters, thereby improving clustering accuracy. Detailed explanations of this method can be found in prior studies [37]. Since the VREWI and Band 11 (SWIR) inherently discriminates water bodies, employing X-means for water body differentiation is both feasible and efficient.
In this study, the implemented method is compared with three previously proposed representative methods. These methods are: supervised classification, multi-dimensional clustering using other combinations, and multiple water index method. The Support Vector Machine (SVM) is selected as the supervised machine learning comparison method [54]. Bands 3, 5, 8, 8A, 11, and 12 of the Sentinel-2 imagery were used as input features, consistent with the spectral information employed in the method implemented in this study. The method of multidimensional clustering based on NDWI and band B12 is designated as the second comparison method, as the previous study has shown that this combination performs better than various other combinations [31]. Widely used automated water extraction indices (AWEI) [55], modified normalized difference water index (MNDWI) [56], normalized difference vegetation index (NDVI) [57], and enhanced vegetation index (EVI) [58] have established mature methodologies in the Yangtze River Basin [59]. Since prior studies have demonstrated the superiority of multiple water index methods over single-index methods, a multi-index water extraction method is employed as the third comparison method. The relationships and discrimination thresholds of these water indices between non-water and water samples were analyzed [41]. The formulas for these indices are provided in Equations (3)–(7), using Equation (8) to classify water pixels.
  N D W I = B 3 B 8 B 3 + B 8
N D V I = B 8 B 4 B 8 + B 4
M N D W I = B 3 B 11 B 3 + B 11                          
E V I = 2.5 × B 8 B 4 B 8 + 6 × B 4 7.5 × B 2 + 1
A W E I s h = B 2 + 2.5 × B 3 1.5 × ( B 8 + B 11 ) 0.25 × B 12
A W E I n s h = 4 × ( B 3 B 11 ) ( 0.25 × B 8 + 2.75 × B 12 )
W a t e r = 1 ( A W E I n s h > 0.88   o r   A W E I s h > 0.27 )   a n d   ( A W E I n s h A W E I s h ) > 0.2 a n d   ( M N D W I > E V I   o r   M N D W I > N D V I ) 0 O t h e r v a l u e s
where B2, B3, B4, B8, B11 and B12 are the bands of the Sentinel-2 imagery.
Subsequently, a confusion matrix was employed to validate the extraction results. The confusion matrix is a common method for evaluating classification accuracy [60]. The performance of the method was assessed using five normalized metrics derived from the confusion matrix: overall accuracy (OA), producer’s accuracy (PA), user’s accuracy (UA), Matthews correlation coefficient (MCC), and Kappa coefficient (Kappa).

2.3.2. Lake Water Area Extraction

For the extracted raw water body imagery, ArcGIS Pro’s Feature Statistics and Feature Editing Tools were utilized to filter and remove water bodies with areas smaller than 0.005 km2, as these patches are likely noise rather than genuine water features [61]. The maximum extents of lakes from HydroLAKES and National Major Lakes Distribution datasets were overlaid, and lake boundaries were further corrected by referencing true-color imagery during high-water periods within the study timeframe. This process yielded the distribution and boundaries of 137 large water bodies in the MLRYR region, including 96 natural lakes and 41 reservoirs.

2.3.3. River Structure Extraction

Cloud cover, shadows, and bridge interference can result in discontinuous water body extraction, resulting in underestimated river lengths—a prevalent concern in urban river networks. This study employs mathematical morphology methods, specifically dilation and erosion algorithms [62,63], in conjunction with manual topology editing in ArcGIS Pro 3.1 to address this issue. The recursive processing method applied here adheres to the principles outlined by Chen and Haralick [64]. Dilation refers to the expansion of a target image, analogous to convolution operations, whereas erosion, as the inverse of dilation, describes the contraction of a target set; both processes are governed by structuring elements. These two foundational morphological operations are based on Minkowski operations. Following data preprocessing and spectral water index computation, mathematical morphology processing mitigates noise-induced distortions in remote sensing imagery. This approach has demonstrated effectiveness in previous water extraction studies [65].
Prior to quantifying river lengths, the aforementioned methods were employed to reconnect water bodies fragmented by obstructions such as bridges, clear small holes, and eliminate redundant river branches to ensure an accurate representation of fluvial structures. To minimize interference from small lakes, reservoirs, and paddies during river network extraction, this study referenced Global River Widths from Landsat (GRWL) dataset and field-surveyed river channel boundary data from the Changjiang Water Resources Commission. These datasets were manually corrected against Google Earth’s true-color imagery to outline potential river channels in the MLRYR region. Water bodies overlapping with the extent of large lakes or reservoirs were excluded to prevent channel extraction errors. Finally, total river lengths per season from 2018 to 2023 were extracted and statistically analyzed for each tertiary watershed within the MLRYR.

2.3.4. Correlation Analysis Method

This study integrates meteorological data to explore the correlations between multiple factors and the changes in the MLRYR river–lake water system. The Standardized Precipitation Evapotranspiration Index (SPEI) is utilized as the primary indicator for evaluating drought conditions in sub-basins [66]. The Pearson correlation coefficient serves as a conventional method for evaluating relationships between two variables [67,68]. The study examines the relationships among precipitation, temperature, evaporation, and drought index (SPEI) within the sub-basin at seasonal scales, as well as the area of surface water bodies, large lakes, and reservoirs. The structure of the river system and the relative contributions of various climatic variables to the dynamics of the MLRYR River water system were assessed. In each sub-region and the entire region, we calculated the monthly average climate variables using the ERA5-Land monthly dataset and matched them with the corresponding river width time series for correlation analysis.

3. Result

3.1. Accuracy Assessment

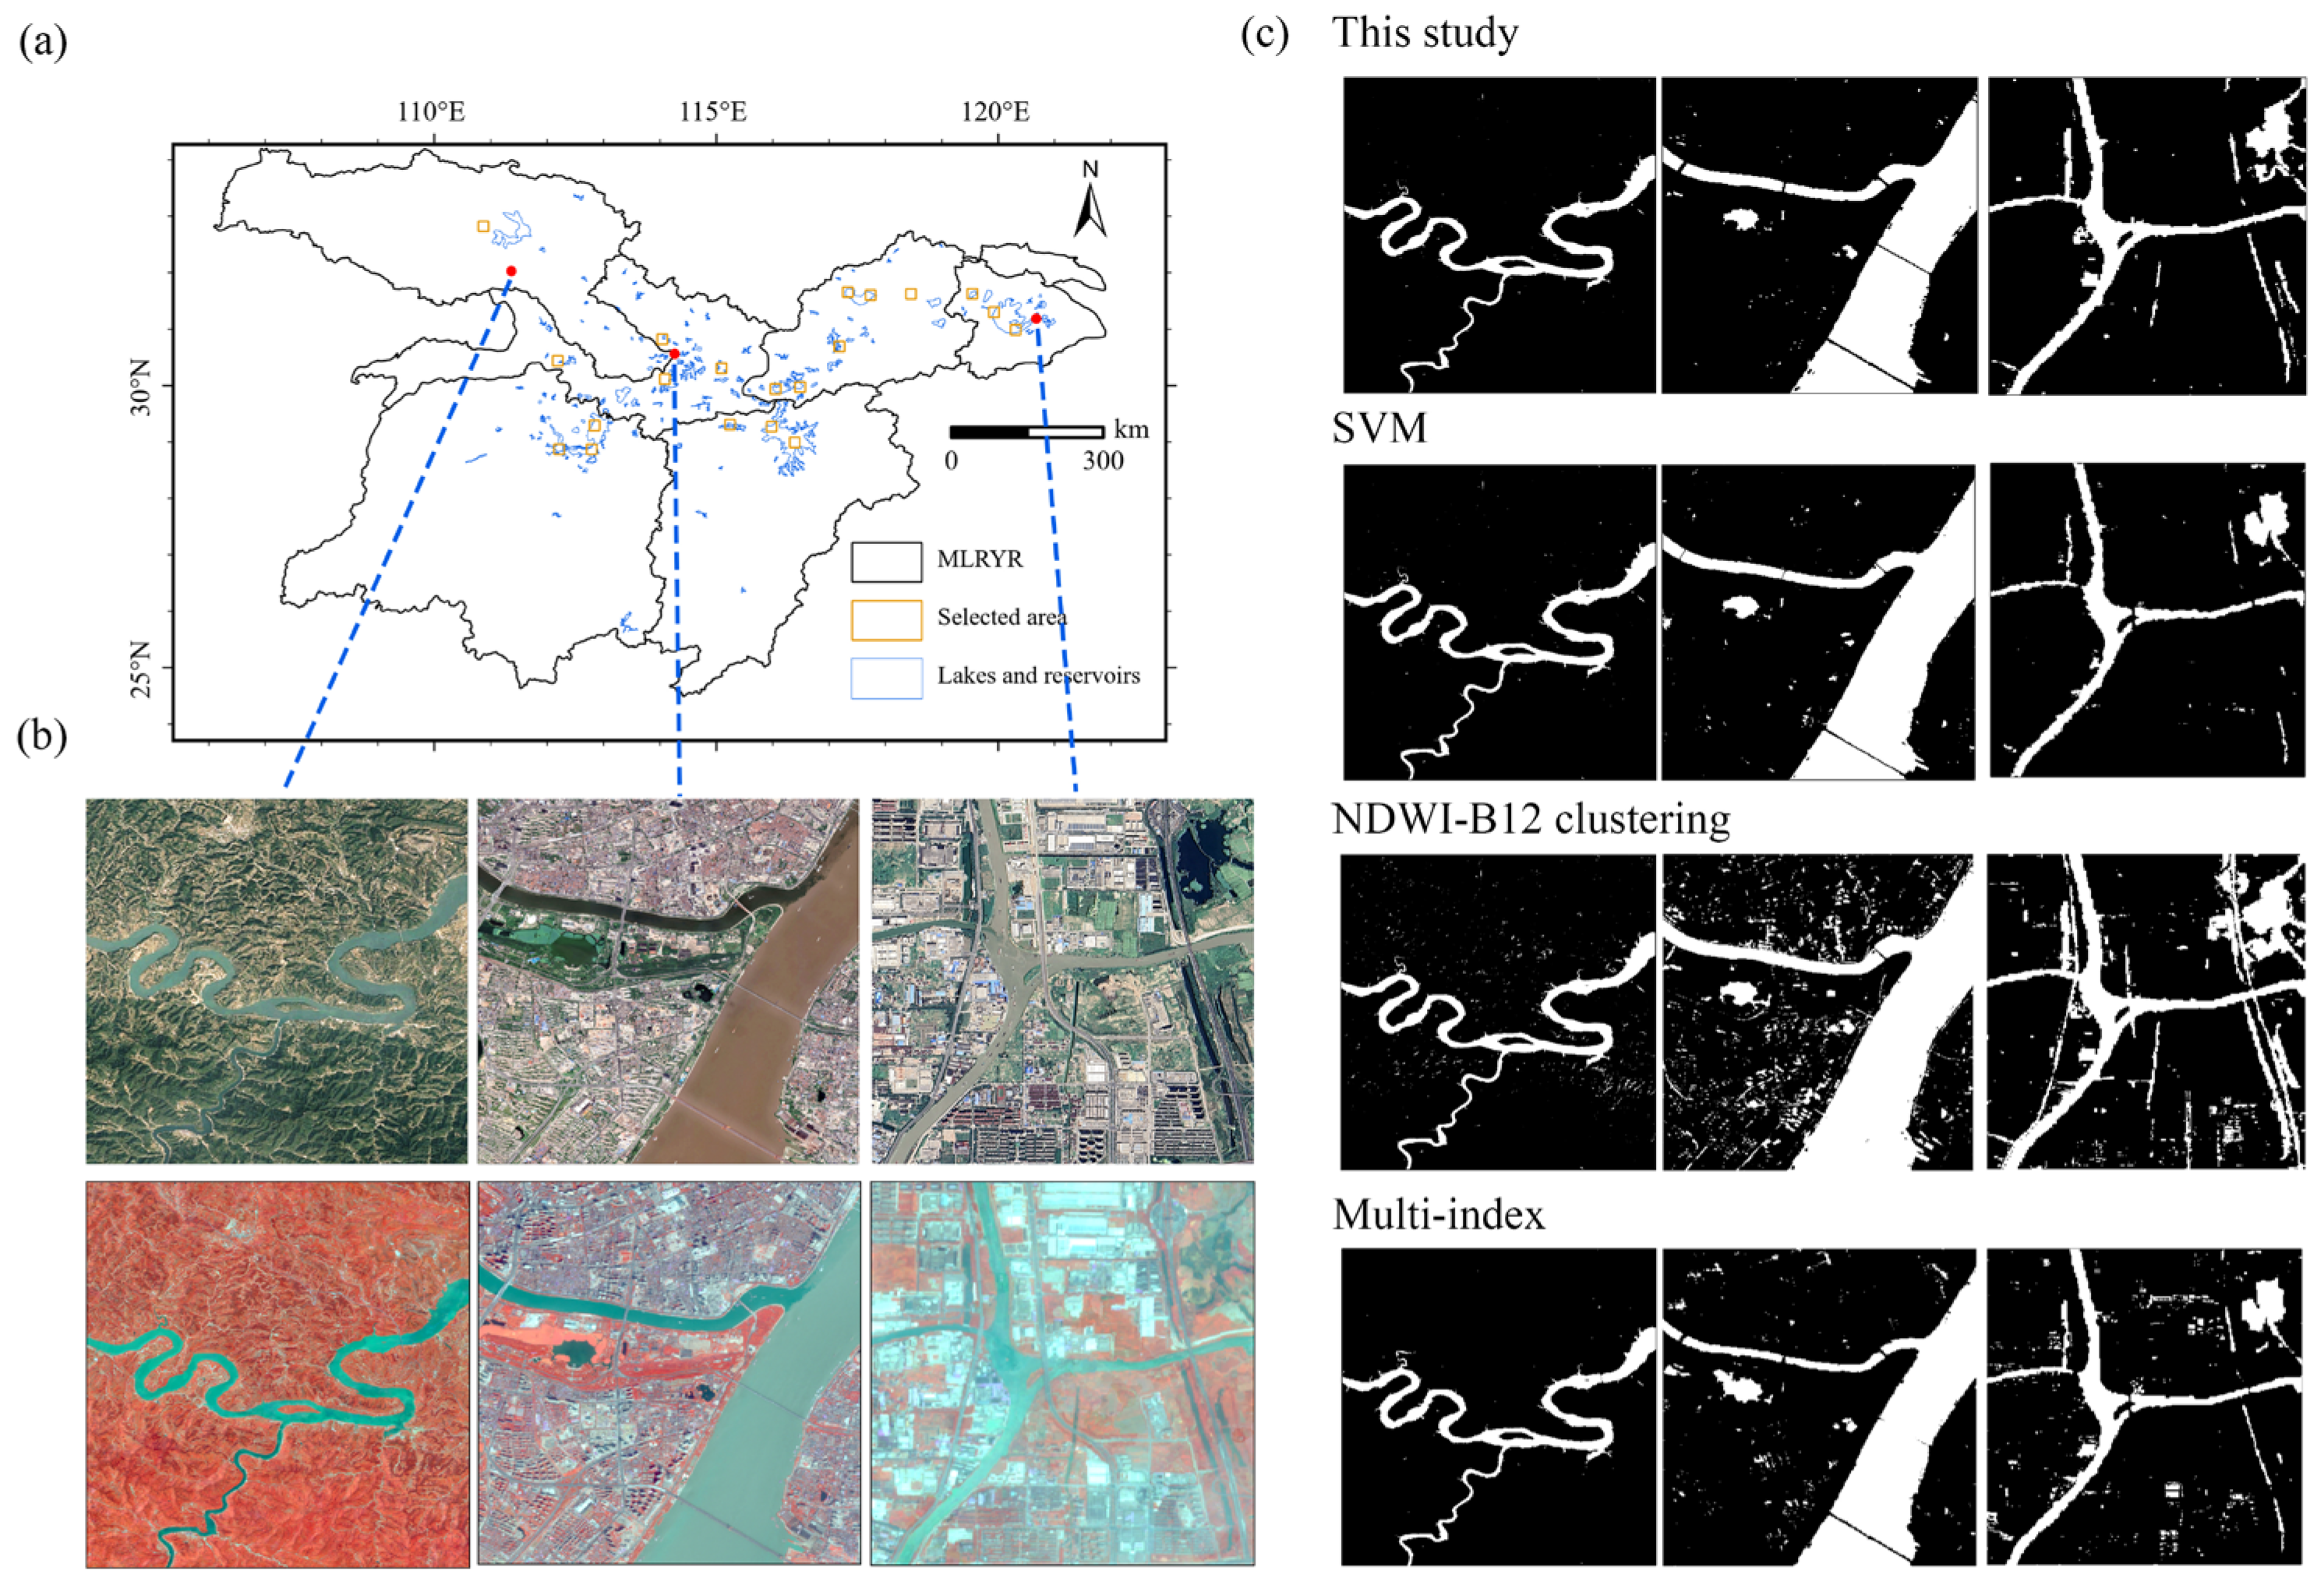
To validate the accuracy of the algorithm, we generated a total of 20,000 verification point dataset, consisting of 6568 water verification points and 13,432 non-water verification points. To ensure adequate coverage of water body samples while maintaining representative randomness, these points were generated within rectangular boundaries of 20 major water system areas, whose spatial distribution is illustrated in Figure 4a. Two sets of validation data were established using selected 10,000 validation points for two distinct periods: June through August 2020 and March through May 2023. These data were then used to compute the confusion matrix. Sentinel-2 images and high-resolution Google Earth historical imagery from June to August 2020 and March to May 2023 were collected for manual labeling of these points to ensure verification accuracy.
Figure 4 presents a comparison of the performance of the water extraction method implemented in this study with three other water extraction methods across three different scenarios. A comparison among Figure 4c indicates that compared to the conventional NDWI-B12 clustering approach for water extraction, the implemented method effectively mitigates interference from building shadows, which is crucial for extracting urban water features. It also demonstrates high accuracy in extracting mountainous rivers. While the SVM-based water extraction method also effectively differentiates shadows from water bodies, it struggles to accurately identify small rivers and lakes within urban environments. This limitation arises from the spectral variability among different types of water bodies across large geographical areas [69]. For instance, classification methods such as SVM exhibit poor generalization when the feature set is inadequate or when features fail to sufficiently separate the classification targets. Such methods are prone to overfitting and are highly sensitive to missing data. Consequently, both the SVM-based water extraction method and the multi-index water extraction method fall short in accurately identifying diverse water types.
Confusion matrices were calculated for all methods, yielding five evaluation metrics. The implemented method achieved an OA of 97.98%, a PA of 98.02%, a UA of 96.01%, a MCC of 0.954, and a Kappa coefficient of 0.954 for the surface water map (Table 2). In contrast, the evaluation metrics for the other methods are also presented in Table 2. These high accuracy metrics confirm the robustness and effectiveness of the implemented method.

3.2. Spatiotemporal Patterns and Changes of Surface Water in the MLRYR

3.2.1. Spatiotemporal Patterns of Surface Water in the MLRYR

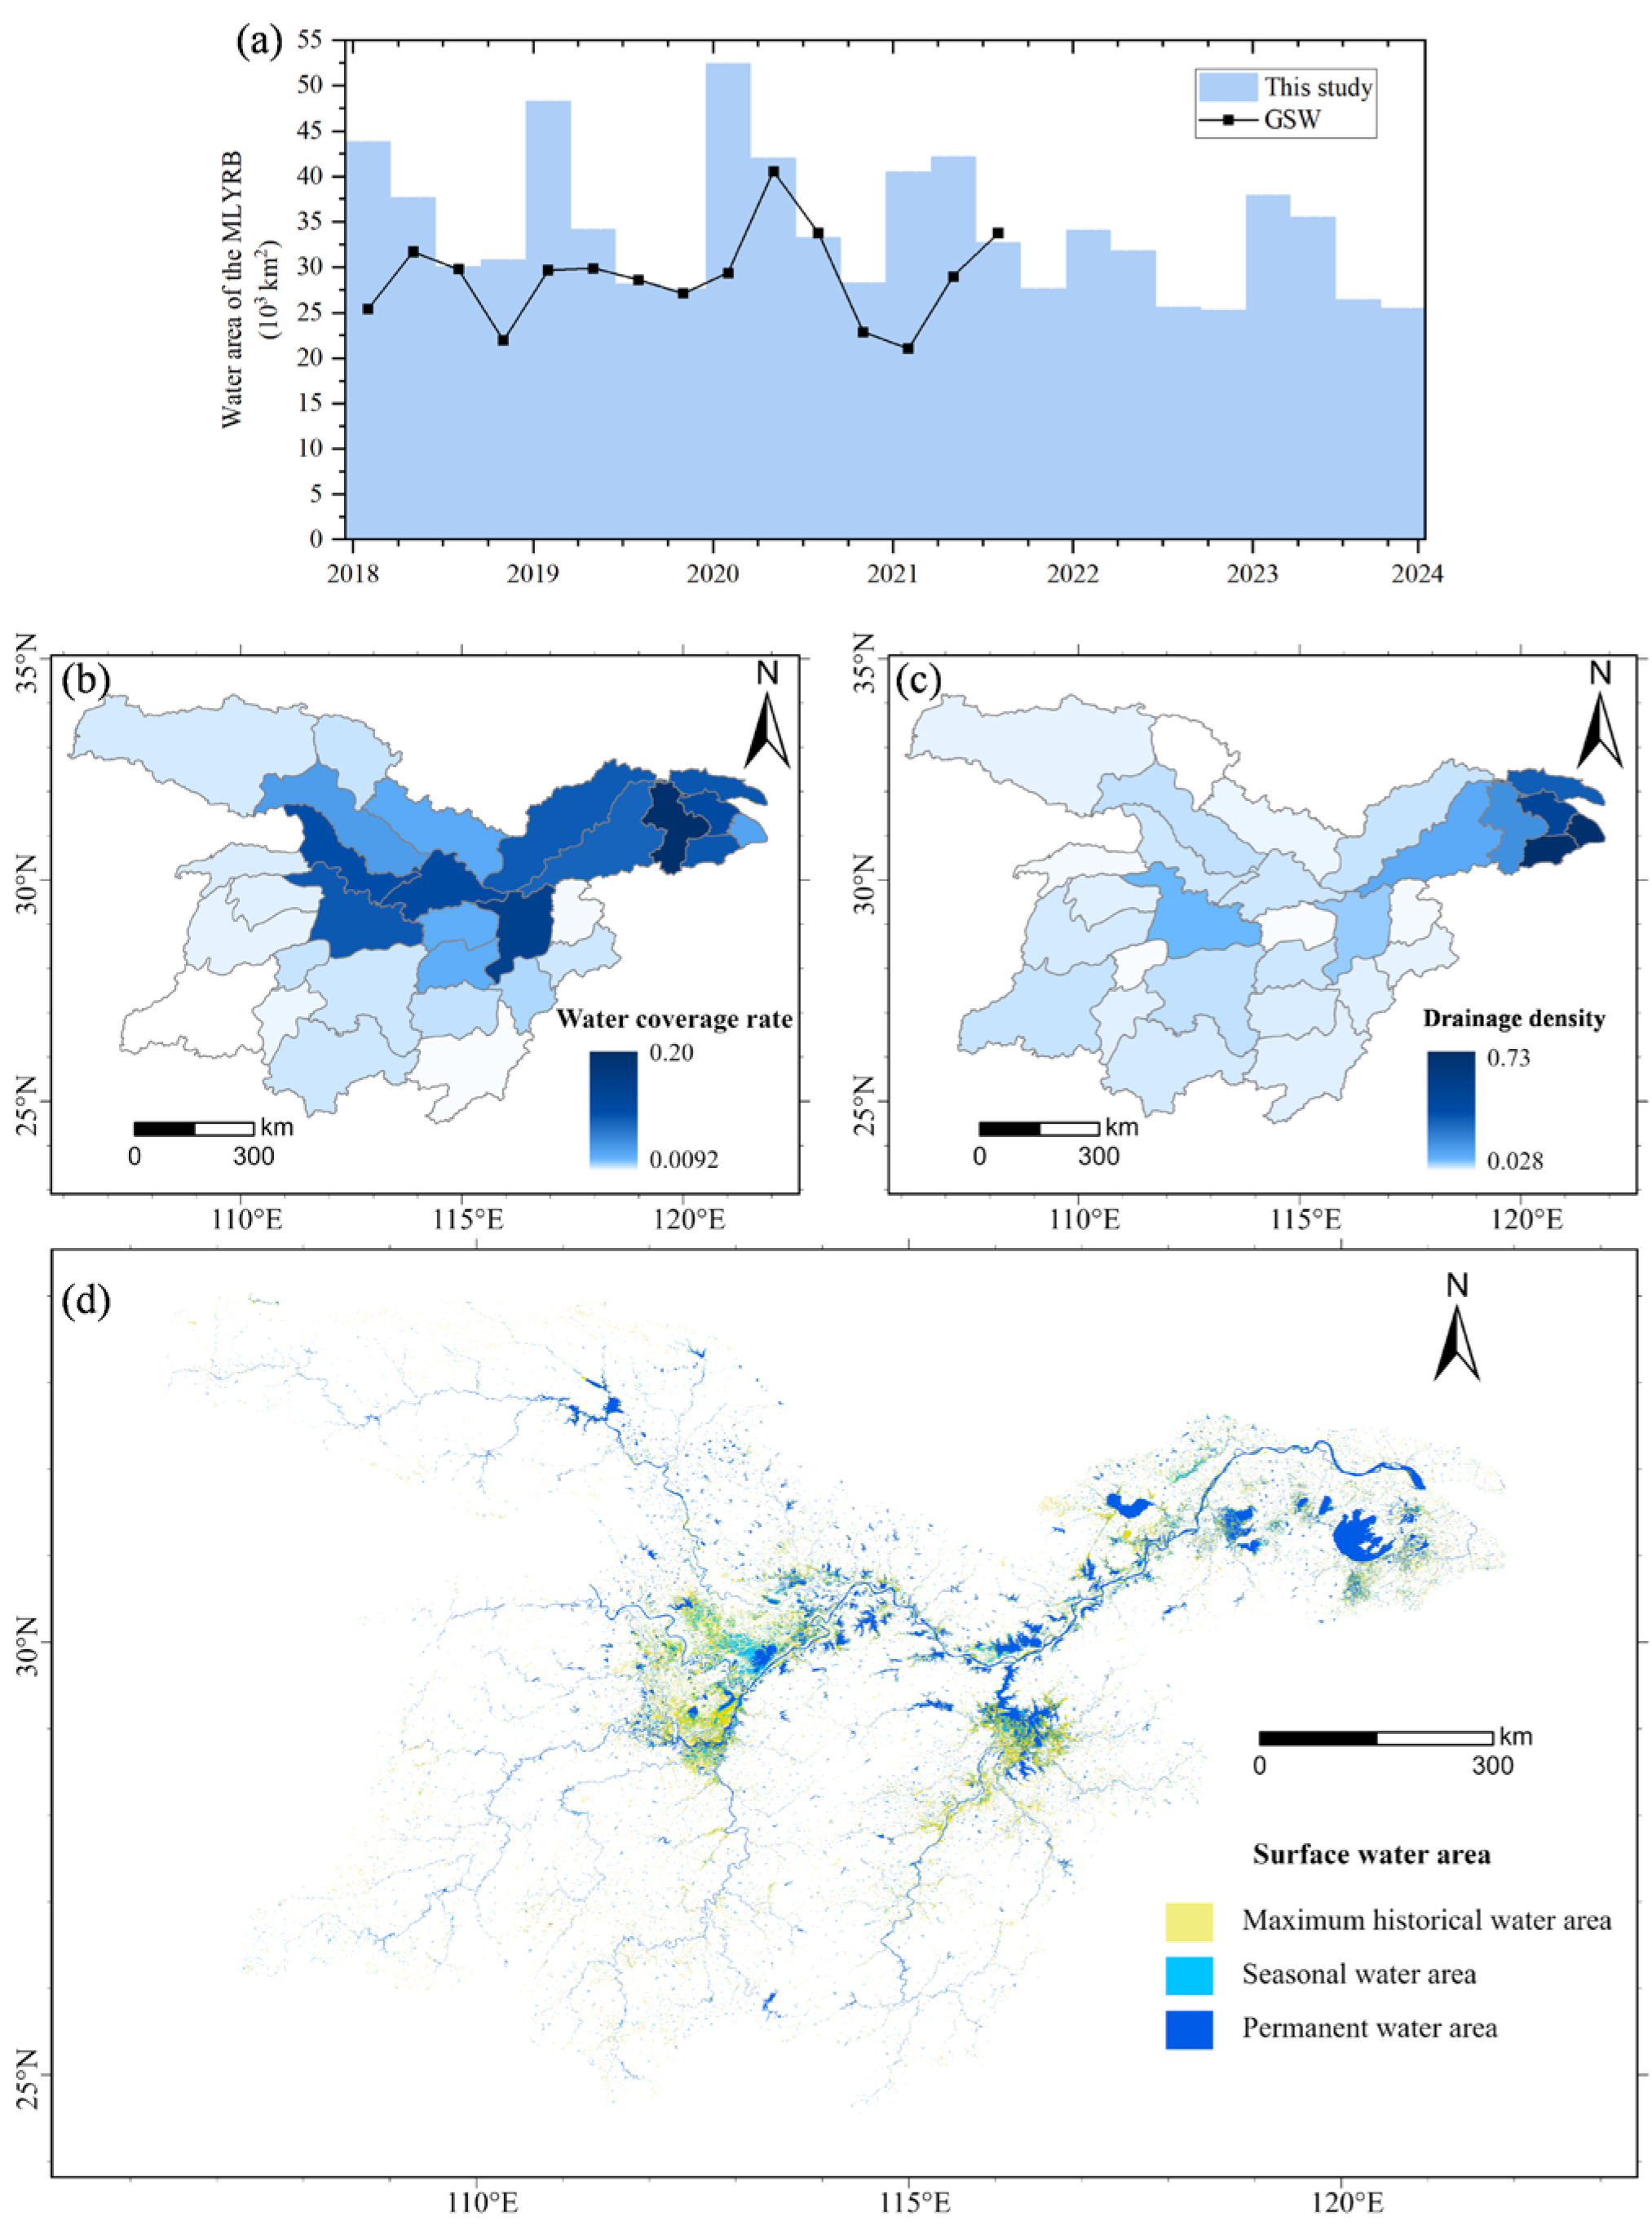
The spatial distribution of surface water bodies in the MLRYR exhibited pronounced heterogeneity, with fewer water bodies observed in the middle reaches compared to the lower reaches (Figure 5). Among all the sub-basins, the five with the largest SWA were C1 (3876.12 km2), D1 (3388.39 km2), F2 (3291.41 km2), E2 (3195.56 km2), and C2 (3007.41 km2). Regions with higher water surface ratios included parts of the middle reaches (B2 = 0.105; B4 = 0.113), sub-basins containing Poyang Lake and Dongting Lake (E2 = 0.096; F2 = 0.145), and most lower-reach areas (C1 = 0.095; C2 = 0.087; C3 = 0.096; D1 = 0.198; D2 = 0.112; D3 = 0.096). These regions are characterized by flat terrain and the presence of one or more large lakes or dense river networks, including Honghu Lake in sub-basin B1, Liangzi Lake in B3, Dongting Lake in E2, Poyang Lake in F2, Chaohu Lake in C1, Shijiu Lake in C2, and Taihu Lake in D1. Figure 5c shows that areas with high drainage density were primarily concentrated in the lower reaches (C2 = 0.124; D1 = 0.196; D2 = 0.472; D3 = 0.731; D4 = 0.718) and the two-lake sub-basins (E2 = 0.093; F2 = 0.075).
Seasonal variations in water area within the MLRYR displayed a clear cyclical trend. The maximum inundation extent during 2018–2023 predominantly occurred in spring, whereas the minimum extent was typically observed in winter. Over this six-year period, the peak inundation extent was recorded in spring 2020, covering 53,445.23 km2, whereas the minimum was observed in winter 2022, spanning 25,784.81 km2. The overall SWA in the MLRYR remained relatively stable, with an annual mean of 35,514.82 km2 in 2018, declining to 31,661.52 km2 by 2023. The maximum annual mean SWA during this period was 39,489.92 km2 in 2020, and the minimum was 29,992.64 km2 in 2022.
The six-year SWA map indicated that the decline in water coverage in 2023 primarily resulted from substantial reductions in paddy fields and ponds surrounding large lakes during spring. For example, there was a notable decrease in small water bodies near Honghu Lake in sub-basin B2. Additionally, there was marked shrinkage of major lake areas in the two-lake region during summer.
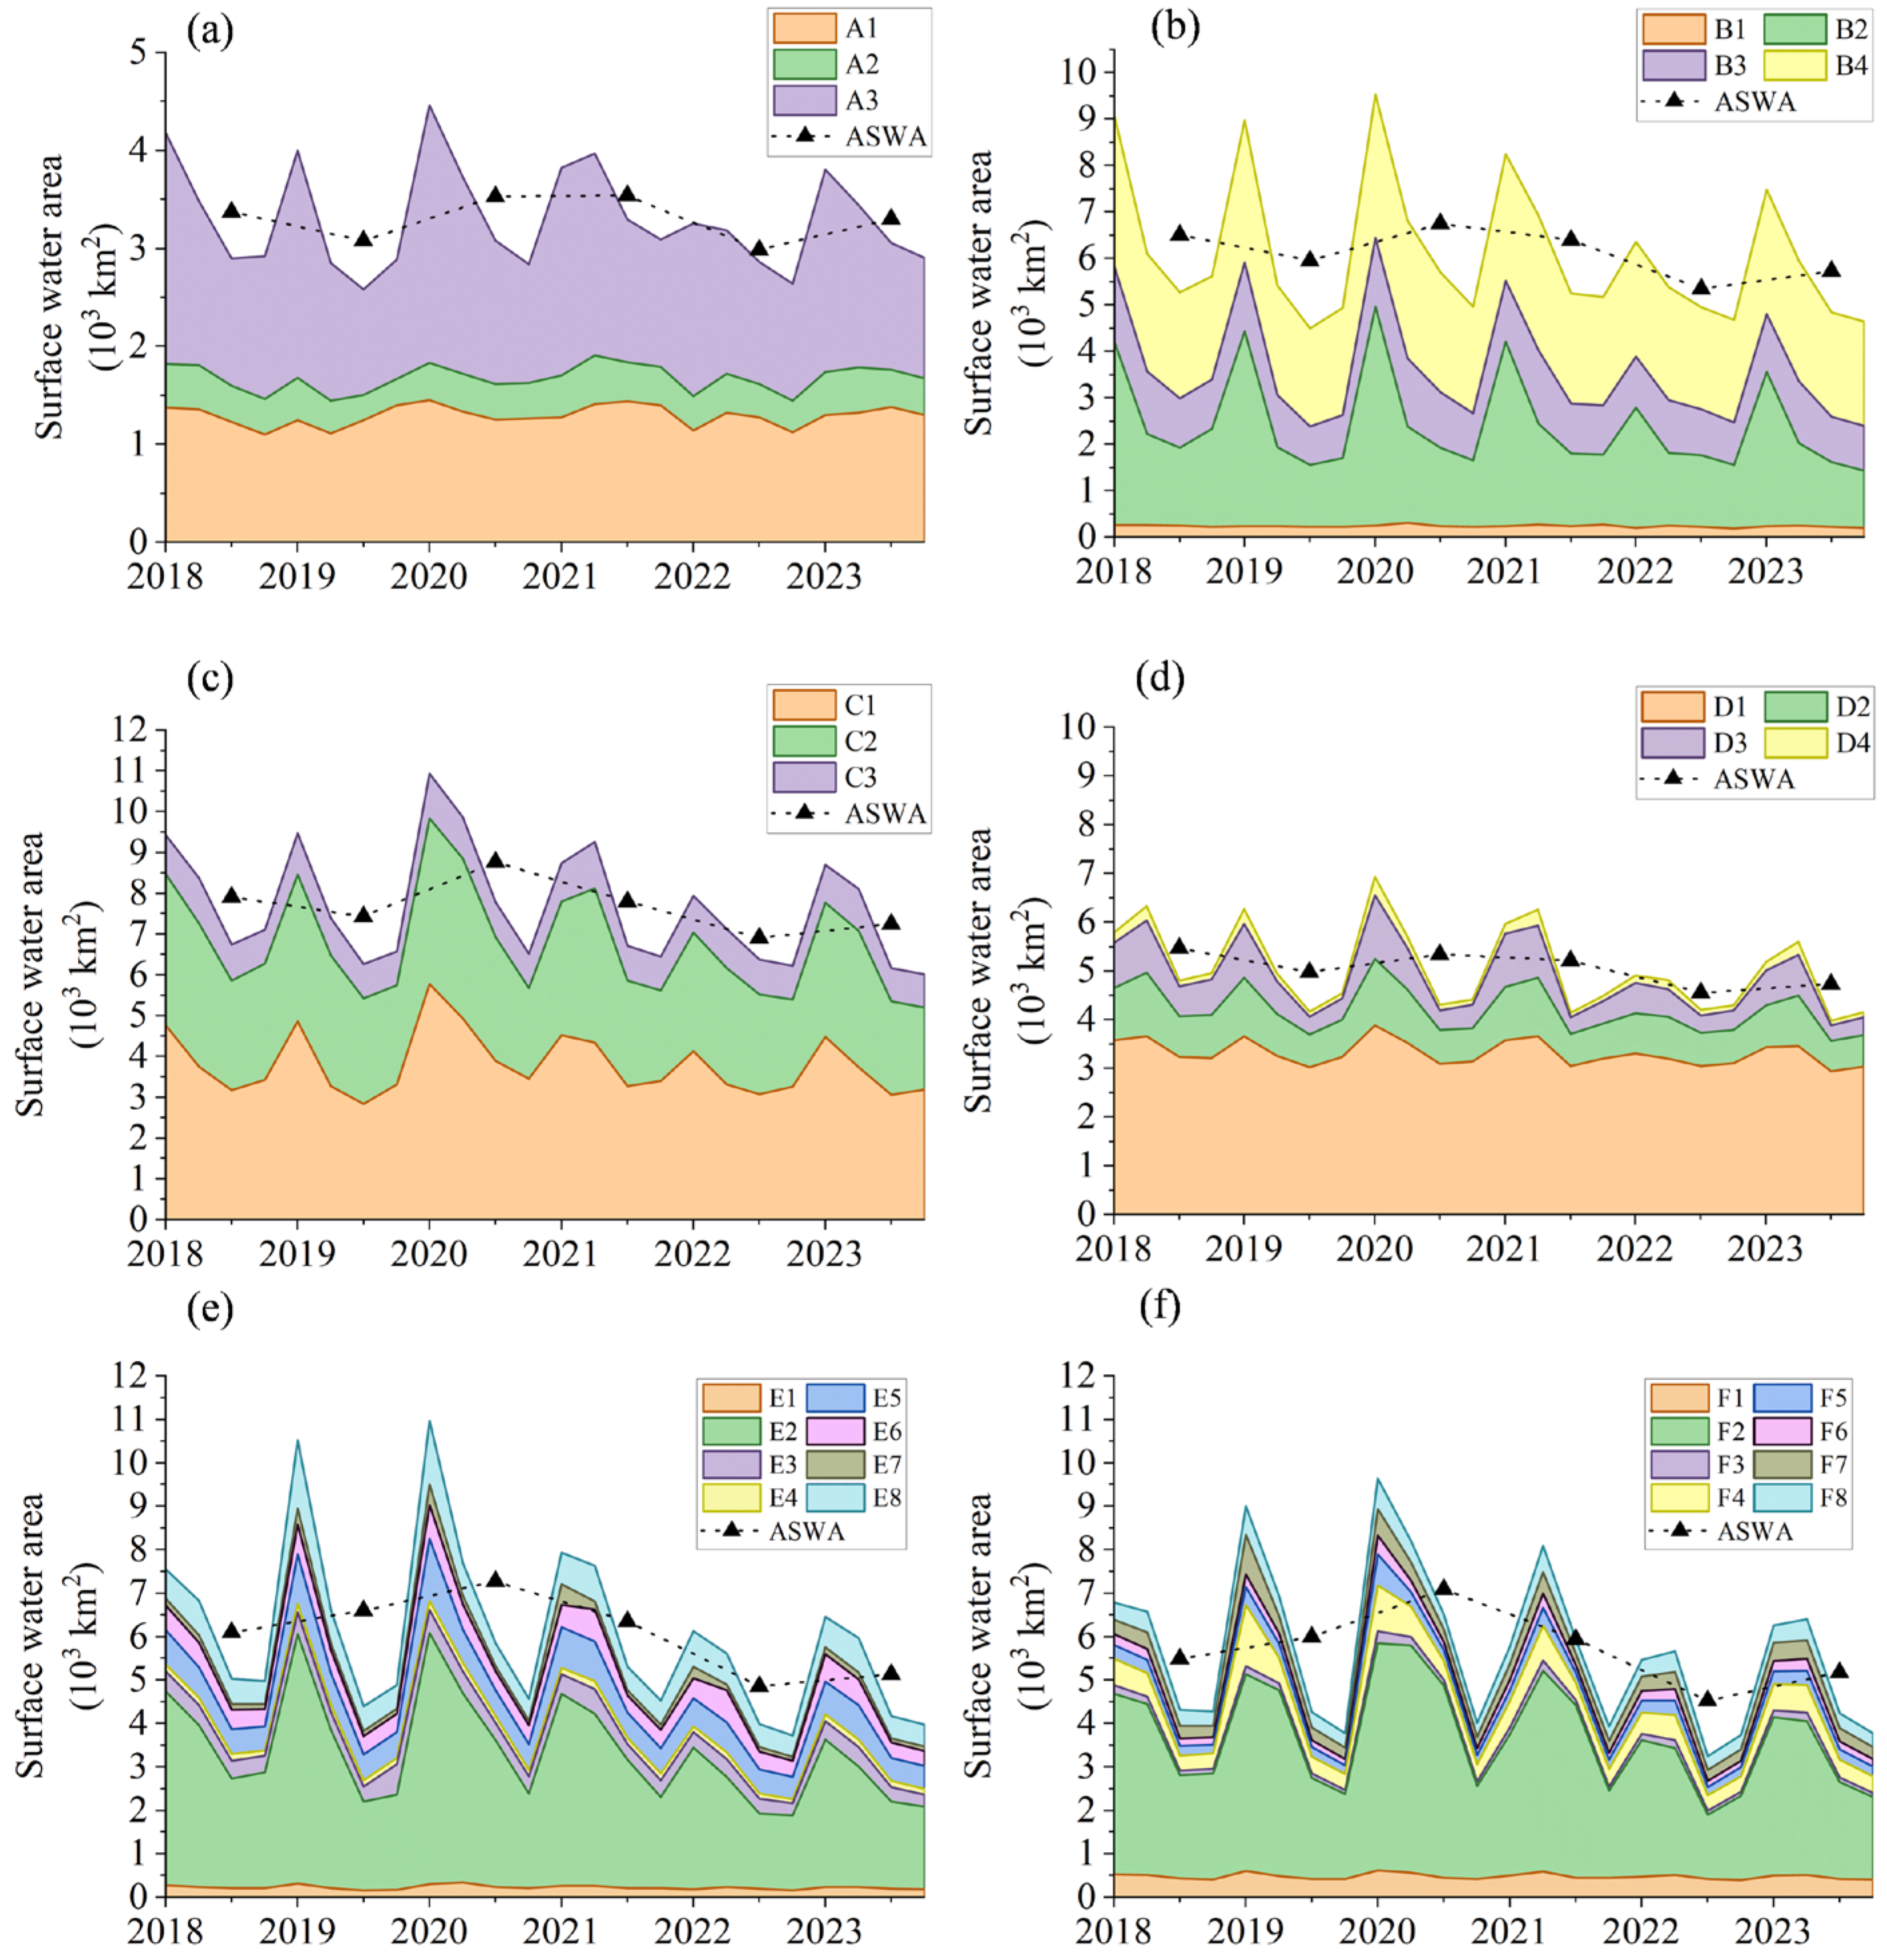
Analysis of SWA dynamics across sub-basins from 2018 to 2023 revealed seasonal characteristics in most areas (Figure 6), particularly in the Dongting Lake basin (E2) and the Poyang Lake basin (F2). From 2018 to 2020, the SWA across all sub-basins displayed an increasing trend, with maximum values recorded in 2020: Basin A (4463.66 km2), Basin B (9532.88 km2), Basin C (10,930.54 km2), Basin D (6934.00 km2), Basin E (10,966.85 km2), and Basin F (9635.03 km2). Post-2020, SWA exhibited a general decline across all basins, with the exception of the Han River Basin (A), which remained relatively stable.

3.2.2. Changes of Surface Water at the Sub-Basin Scale from 2018 to 2023

Normalized Sen’s slope calculations for annual mean SWA across sub-basins revealed significant spatial heterogeneity in changes (Figure 7). The Theil-Sen slope is classified into four categories: strong decrease for slopes < −0.2, slight decrease for −0.2 ≤ slope < 0, slight increase for 0 ≤ slope ≤ 0.2, and strong increase for slope > 0.2. Except for sub-basins A1 and A2, which exhibited increases, all other sub-basins demonstrated varying degrees of decline. Notable reductions occurred in the mainstem Yangtze sub-basin (B1), sub-basins feeding large lakes (E3, F4), and downstream sub-basins, including parts of the Taihu Lake basin (C2, D1, D2, D3). Seasonal comparisons of SWA changes across 30 MLRYR sub-basins from 2018 to 2023 demonstrated distinct patterns: During spring, all sub-basins exhibited declines, with stronger decreases concentrated in middle-reach sub-basins. In summer, 15 sub-basins showed slight increases, one sub-basin exhibited a strong increase, whereas declines were prominent in the Dongting Lake basin (E2, strong decrease), the Poyang Lake basin (F2, slight decrease), and the Shijiu Lake sub-basin (C2, strong decrease). In autumn and winter, sub-basins A1, A2, F4, and F7 maintained increases during both seasons; E4, F5, and F6 showed increases only in winter; whereas sub-basins E5, E6, E7, and C2, D1, D2, D3 exhibited strong increases across both autumn and winter.

3.2.3. Temporal Changes in the Water Area of Large Lakes and Reservoirs

To better explore surface water changes in the MLRYR, 137 large lakes and reservoirs with annual mean water areas exceeding 10 km2 from 2018 to 2023 (comprising 96 lakes and 41 reservoirs) were selected for analysis of water area dynamics over this six-year period (Figure 8). The results indicate that the two major water bodies in the middle Yangtze region—Poyang Lake and Dongting Lake—demonstrated decreasing water areas. Compared to 2018, Dongting Lake’s water area decreased by 326.46 km2 by 2023, while Poyang Lake’s decreased by 279.21 km2. Most smaller lakes within their sub-basins also exhibited declines in water area. Danjiangkou Reservoir, the largest reservoir in the MLRYR, recorded the most significant increase in water area during 2018–2023, expanding by 33.29 km2 to reach 716.49 km2. Honghu Lake in Hubei Province (sub-basin B2), the largest lake in the middle Yangtze region, was the only lake in its sub-basin to display an increase in water area. Its water area peaked at 361.20 km2 in 2021 but decreased to near 2018 levels by 2023, resulting in a net increase of 2.56 km2. Oxbow lakes formed by historical shifts in the Yangtze River channel within this sub-basin all exhibited decreases in water area.
Liangzi Lake in sub-basin B4, Hubei’s second-largest lake, showed an increase of 16.15 km2, accompanied by increases in other lakes within the sub-basin, although its five large reservoirs experienced declines. Conversely, all eight lakes in the adjacent sub-basin B3 decreased, whereas its four reservoirs increased. In the downstream Taihu Lake basin, Taihu Lake displayed a marginal increase (slope = 0.038), yet its water area decreased by 6.17 km2 from 2018 to 2023. All 11 nearby lakes also declined. Similarly, Chaohu Lake, the largest lake in Anhui Province, decreased by 2.61 km2 over the same period.

4. Discussion

4.1. Dynamics of River–Lake Systems and the Influence of Regional-Scale Factors on the Changes in River–Lake Systems

The use of 10 m spatial resolution seasonal water body distribution maps and long-term surface water datasets over the past six years facilitates a clearer understanding of regional aquatic ecosystem dynamics. The MLRYR features a typical subtropical monsoon climate, with mean annual temperatures ranging from 14 °C to 18 °C and annual precipitation between 1000 mm and 1400 mm. Historically, more than 100 lakes in the MLRYR maintained free connections to the Yangtze River. These fluvial–lacustrine linkages enabled lakes to absorb floodwaters during wet seasons and supply the river during dry seasons. At present, only Poyang Lake, Dongting Lake, and Shijiu Lake sustain intermittent connectivity with the Yangtze, with seasonal inundation shaping intra-annual lake dynamics. The region contains extensive plains and dense river networks, particularly in the Yangtze Delta, one of China’s most hydrologically interconnected areas.
The 2023 Yangtze River Basin Water Resources Bulletin reports a 3.7% increase in total water resources compared to 2022, yet levels remain 9.9% below the multi-year average. Per capita water availability in the MLRYR remains relatively low, with spatially uneven changes: the Han River Basin (A), Taihu Lake Basin (D), and Lower Mainstem (C) recorded increases of 90.1%, 44.3%, and 41.7%, respectively, while the Dongting Lake Basin (E) experienced a 28.2% decline—the largest recorded decrease. Covering five provinces and one municipality, the MLRYR contributed 24.13% of China’s GDP in 2023, with shares from Shanghai (3.75%), Jiangsu (10.17%), Hubei (4.43%), Hunan (3.97%), Anhui (3.73%), and Jiangxi (2.55%). The region accounted for 31.08% of China’s total water use, dominated by industrial demand (57.39%), followed by domestic use (27.94%), agriculture (26.09%), and artificial ecological replenishment (18.86%). Numerous small and micro water bodies in the MLRYR exhibited significant shrinkage or disappearance during the 2022–2023 consecutive drought events, threatening wetland ecosystems and species survival [70]. Therefore, water resource planning for supply, hydropower, and aquaculture must account for these changes in small water body dynamics.
Research findings show that the overall SWA in the MLRYR has remained relatively stable over the past six years, a result with important implications for human well-being and ecosystems in regions with spatiotemporally uneven water resources. First, the Yangtze River Basin hosts numerous reservoirs that are critical for maintaining water supplies for production and livelihoods. By storing water during high-precipitation periods and releasing it during droughts, reservoirs stabilize supply during seasonal fluctuations associated with the East Asian monsoon. Their flow regulation capacity ensures reliable availability for agricultural, industrial, and domestic needs [71]. However, large-scale reservoir operations alter natural water distribution patterns, posing threats to downstream aquatic ecosystems. For instance, the Three Gorges Dam—the largest reservoir on the Yangtze mainstem—has exerted substantial effects on the water regimes of Poyang Lake and Dongting Lake [72,73,74]. From 2018 and 2023, the most pronounced SWA decline occurred in the immediately downstream sub-basin B2, with limited correlation to local precipitation decreases.
Second, the MLRYR contains several large lakes, including China’s largest freshwater bodies. These lakes and their surrounding wetlands provide critical habitats for rare and endangered species, playing essential roles in biodiversity conservation and ecosystem functioning. However, under recent climate change and widespread drought, significant declines in surface water have been observed in Dongting Lake and adjacent sub-basins (B2, E2, E3), downstream Yangtze regions, and parts of the Taihu Lake basin (C2, D1, D2, D3). Seasonal surface water dynamics show general declines in spring, regional reductions in autumn and winter, and overall increases in summer. Intensified extreme weather events under global climate change are altering surface water distribution patterns, threatening local aquatic ecosystems and wetland health [70,75,76].
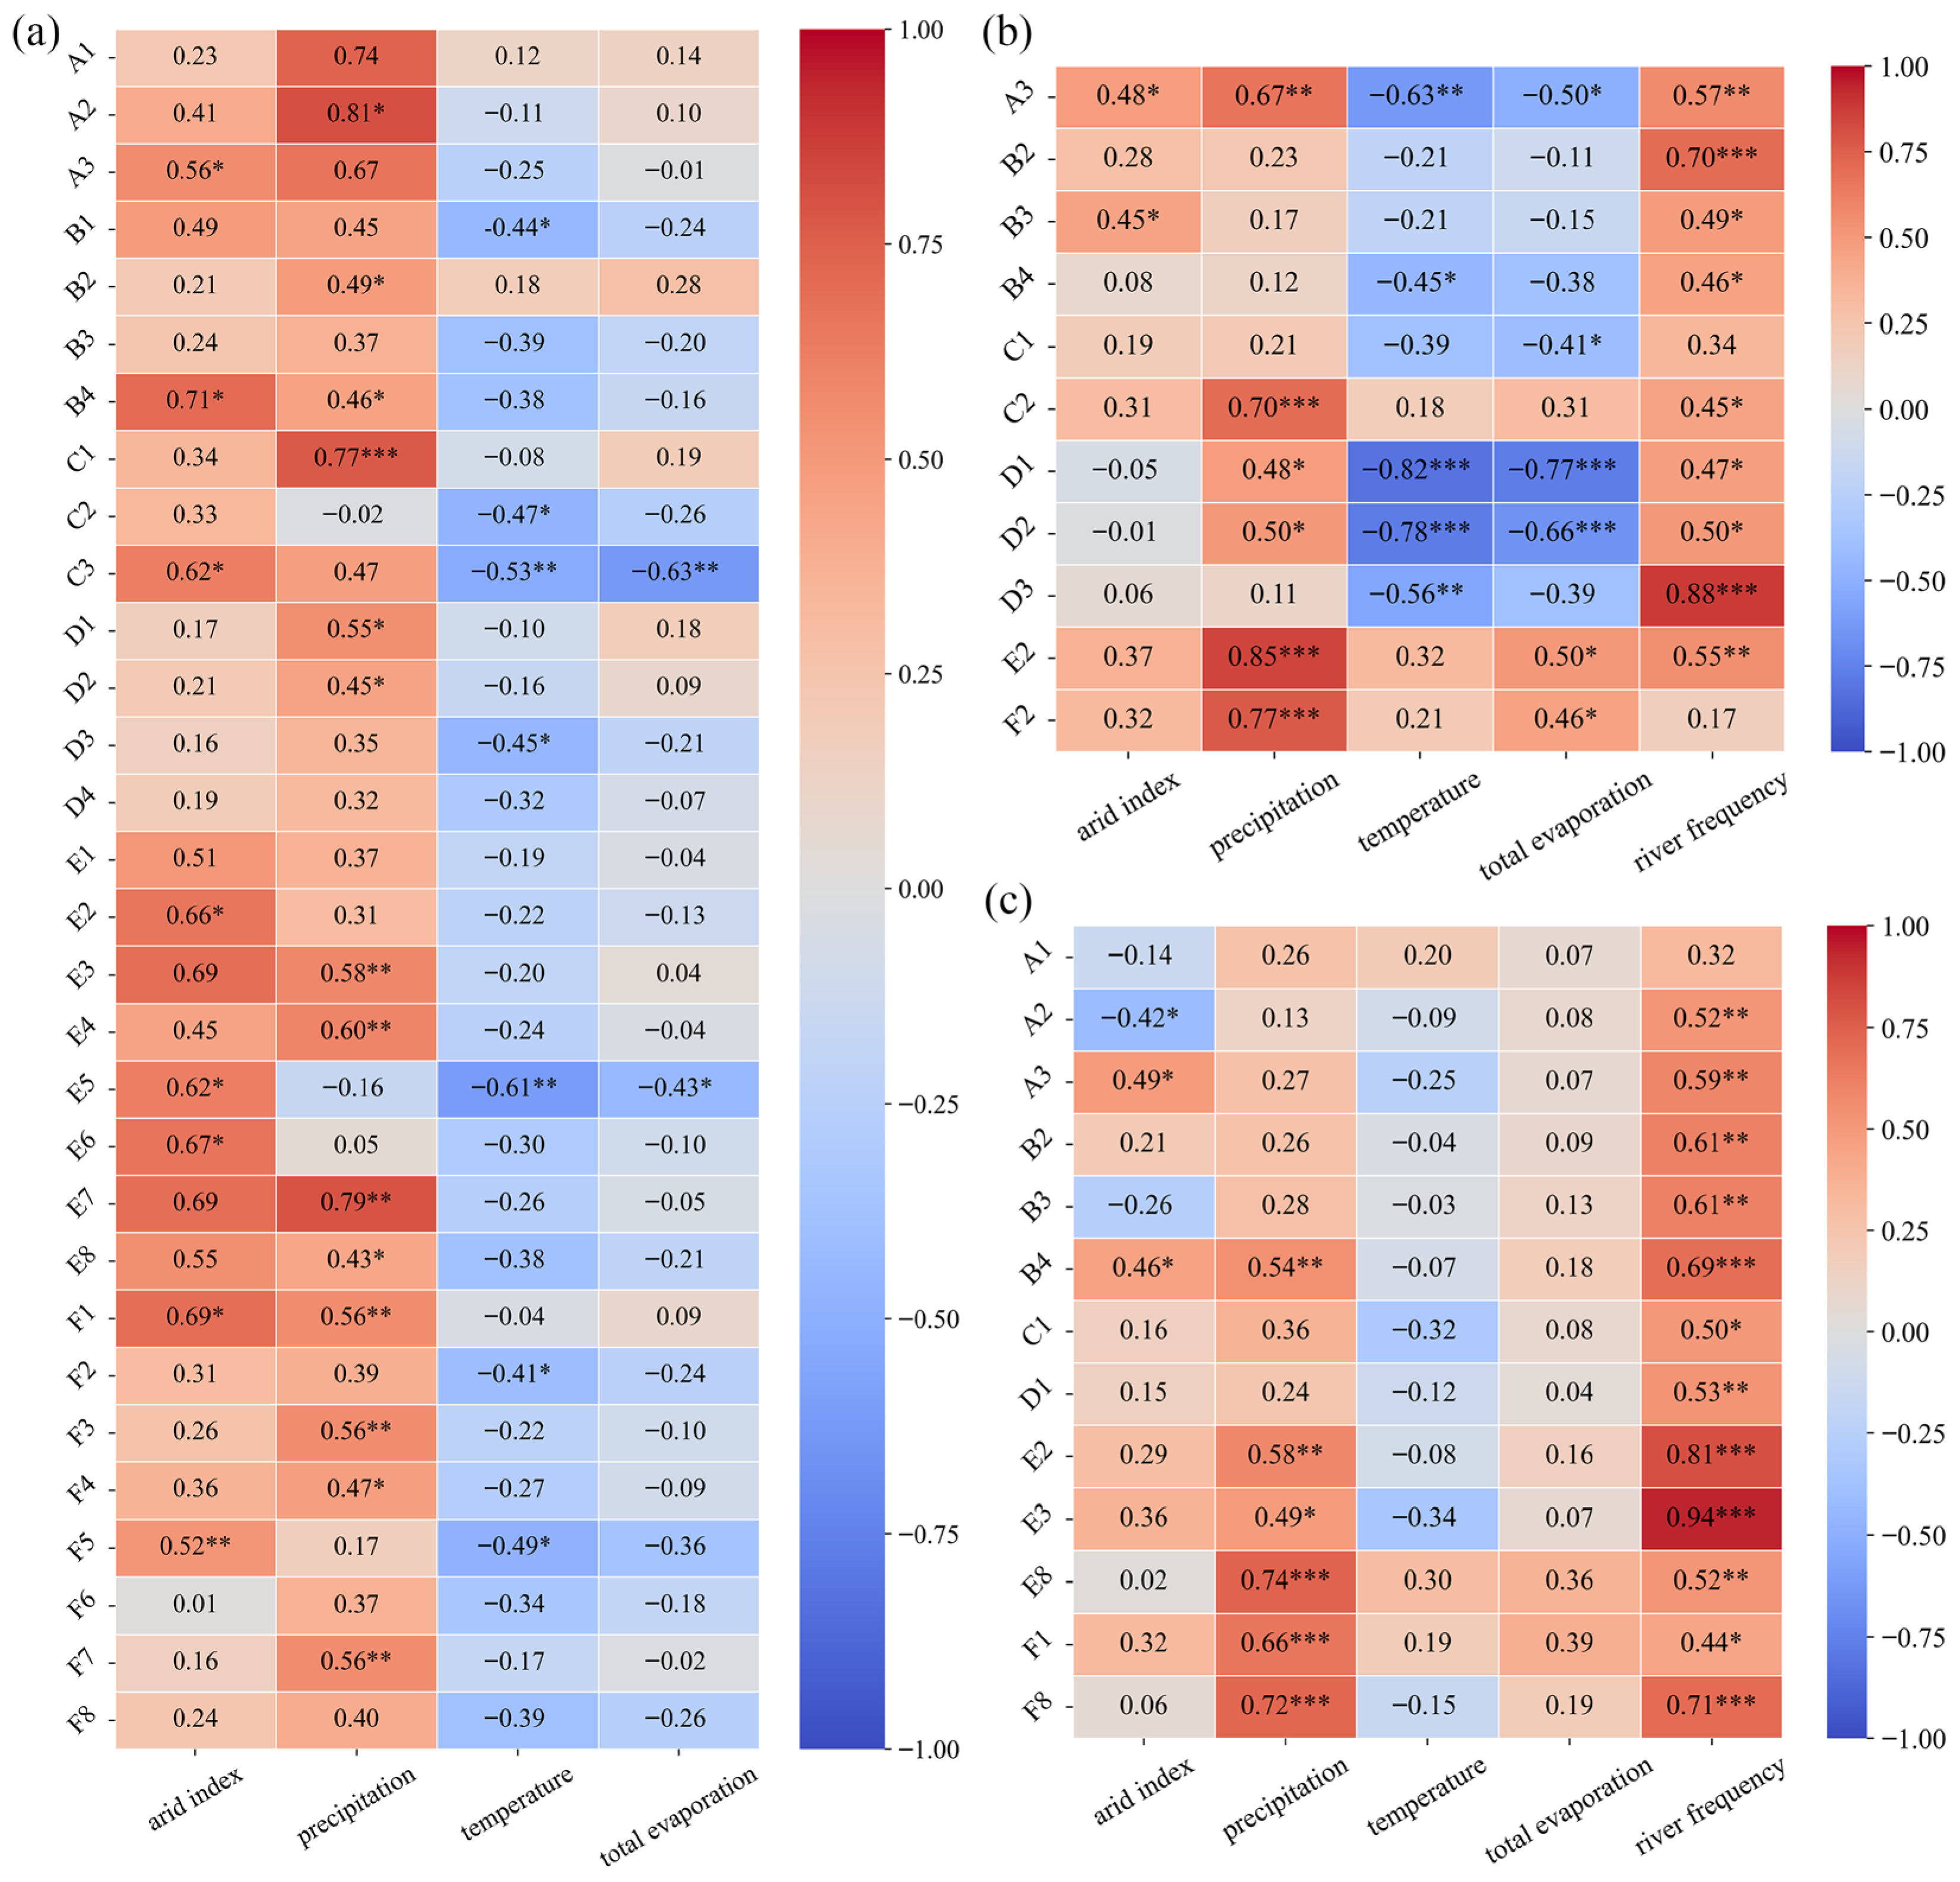
Third, river network distribution across sub-basins plays a key role in regulating watershed areas and stabilizing aquatic ecosystems. Analysis of surface water, lakes, and reservoirs across sub-basins indicates that the sub-basin SWA correlates most strongly with precipitation and drought index in most sub-basins (Figure 9). In sub-basins with large water bodies, significant relationships exist between lake/reservoir water area and precipitation, such as A3, C2, E2, E8, F1, F2 and F8. In densely networked sub-basins, including D1, D2, D3 and E2, strong correlations are observed between large lake areas and drainage density. This pattern is even more pronounced in heavily human-influenced large reservoirs. The capacity of reservoirs and their regulation rules can largely contribute to the changes in permanent and seasonal water bodies at the regional scale [77]. On a large spatial scale, existing research indicates that precipitation and the Three Gorges Dam were the main drivers of SWA changes in the MLRYR [78]. The Three Gorges Dam, during drought periods, can significantly raise the water levels in the Shashi-Hankou section (B2–B4) of the Yangtze River mainstem through downstream water replenishment. On a local regional scale, taking the Poyang Lake basin (F2) as an example, the water level of Poyang Lake has significantly increased due to the regulation of local reservoirs within the basin, shortening the duration of low water levels during the dry season [77]. With the release of water from large reservoirs during the dry season, the frequency of hydrological droughts decreases, and both the average duration and severity of droughts are reduced [79]. Most large reservoirs exhibit weak or insignificant correlations between water areas and precipitation/drought index. In sub-basins A2, B2, B4, and E3, reservoirs show strong, significant correlations with drainage density. These findings suggest that while surface water broadly correlates with climate factors, dense river networks in sub-basins with large lakes and reservoirs mediate water storage and regulation, weakening direct climatic effects on surface water dynamics. Dense river networks enhance efficient water allocation, reduce reliance on direct precipitation, and improve regional surface water and aquatic ecosystem stability [80]. Even large lakes with minimal human regulation demonstrate stronger resilience to climatic variability in sub-basins with dense river systems.
Prior studies on the MLRYR and other river–lake systems corroborate these findings by emphasizing the critical role of hydrological connectivity in shaping lake-wetland dynamics. Altered connectivity significantly modifies wetland morphology and ecological functions [81,82]. River–lake connectivity enables periodic flooding, sustains water-nutrient balances, supports expansive floodplains, and delivers key ecosystem services, including habitat provision and biodiversity maintenance [83,84]. However, disconnection from the Yangtze has led to drastic reductions in marsh coverage, compromising wetland integrity [73,85]. Robust river networks and hydrological connectivity strengthen the resilience of surface water systems. Regions with dense river systems benefit from improved flow regulation and reduced precipitation dependency. Conversely, connectivity disruptions caused by dams or sluices exacerbate wetland loss and threaten ecosystem sustainability, as observed globally in floodplain wetland declines [86,87]. This study highlights the importance of preserving natural river network density to enhance wetland systems’ adaptive capacity to environmental and anthropogenic stressors.

4.2. Our Findings Compared to Previous Research

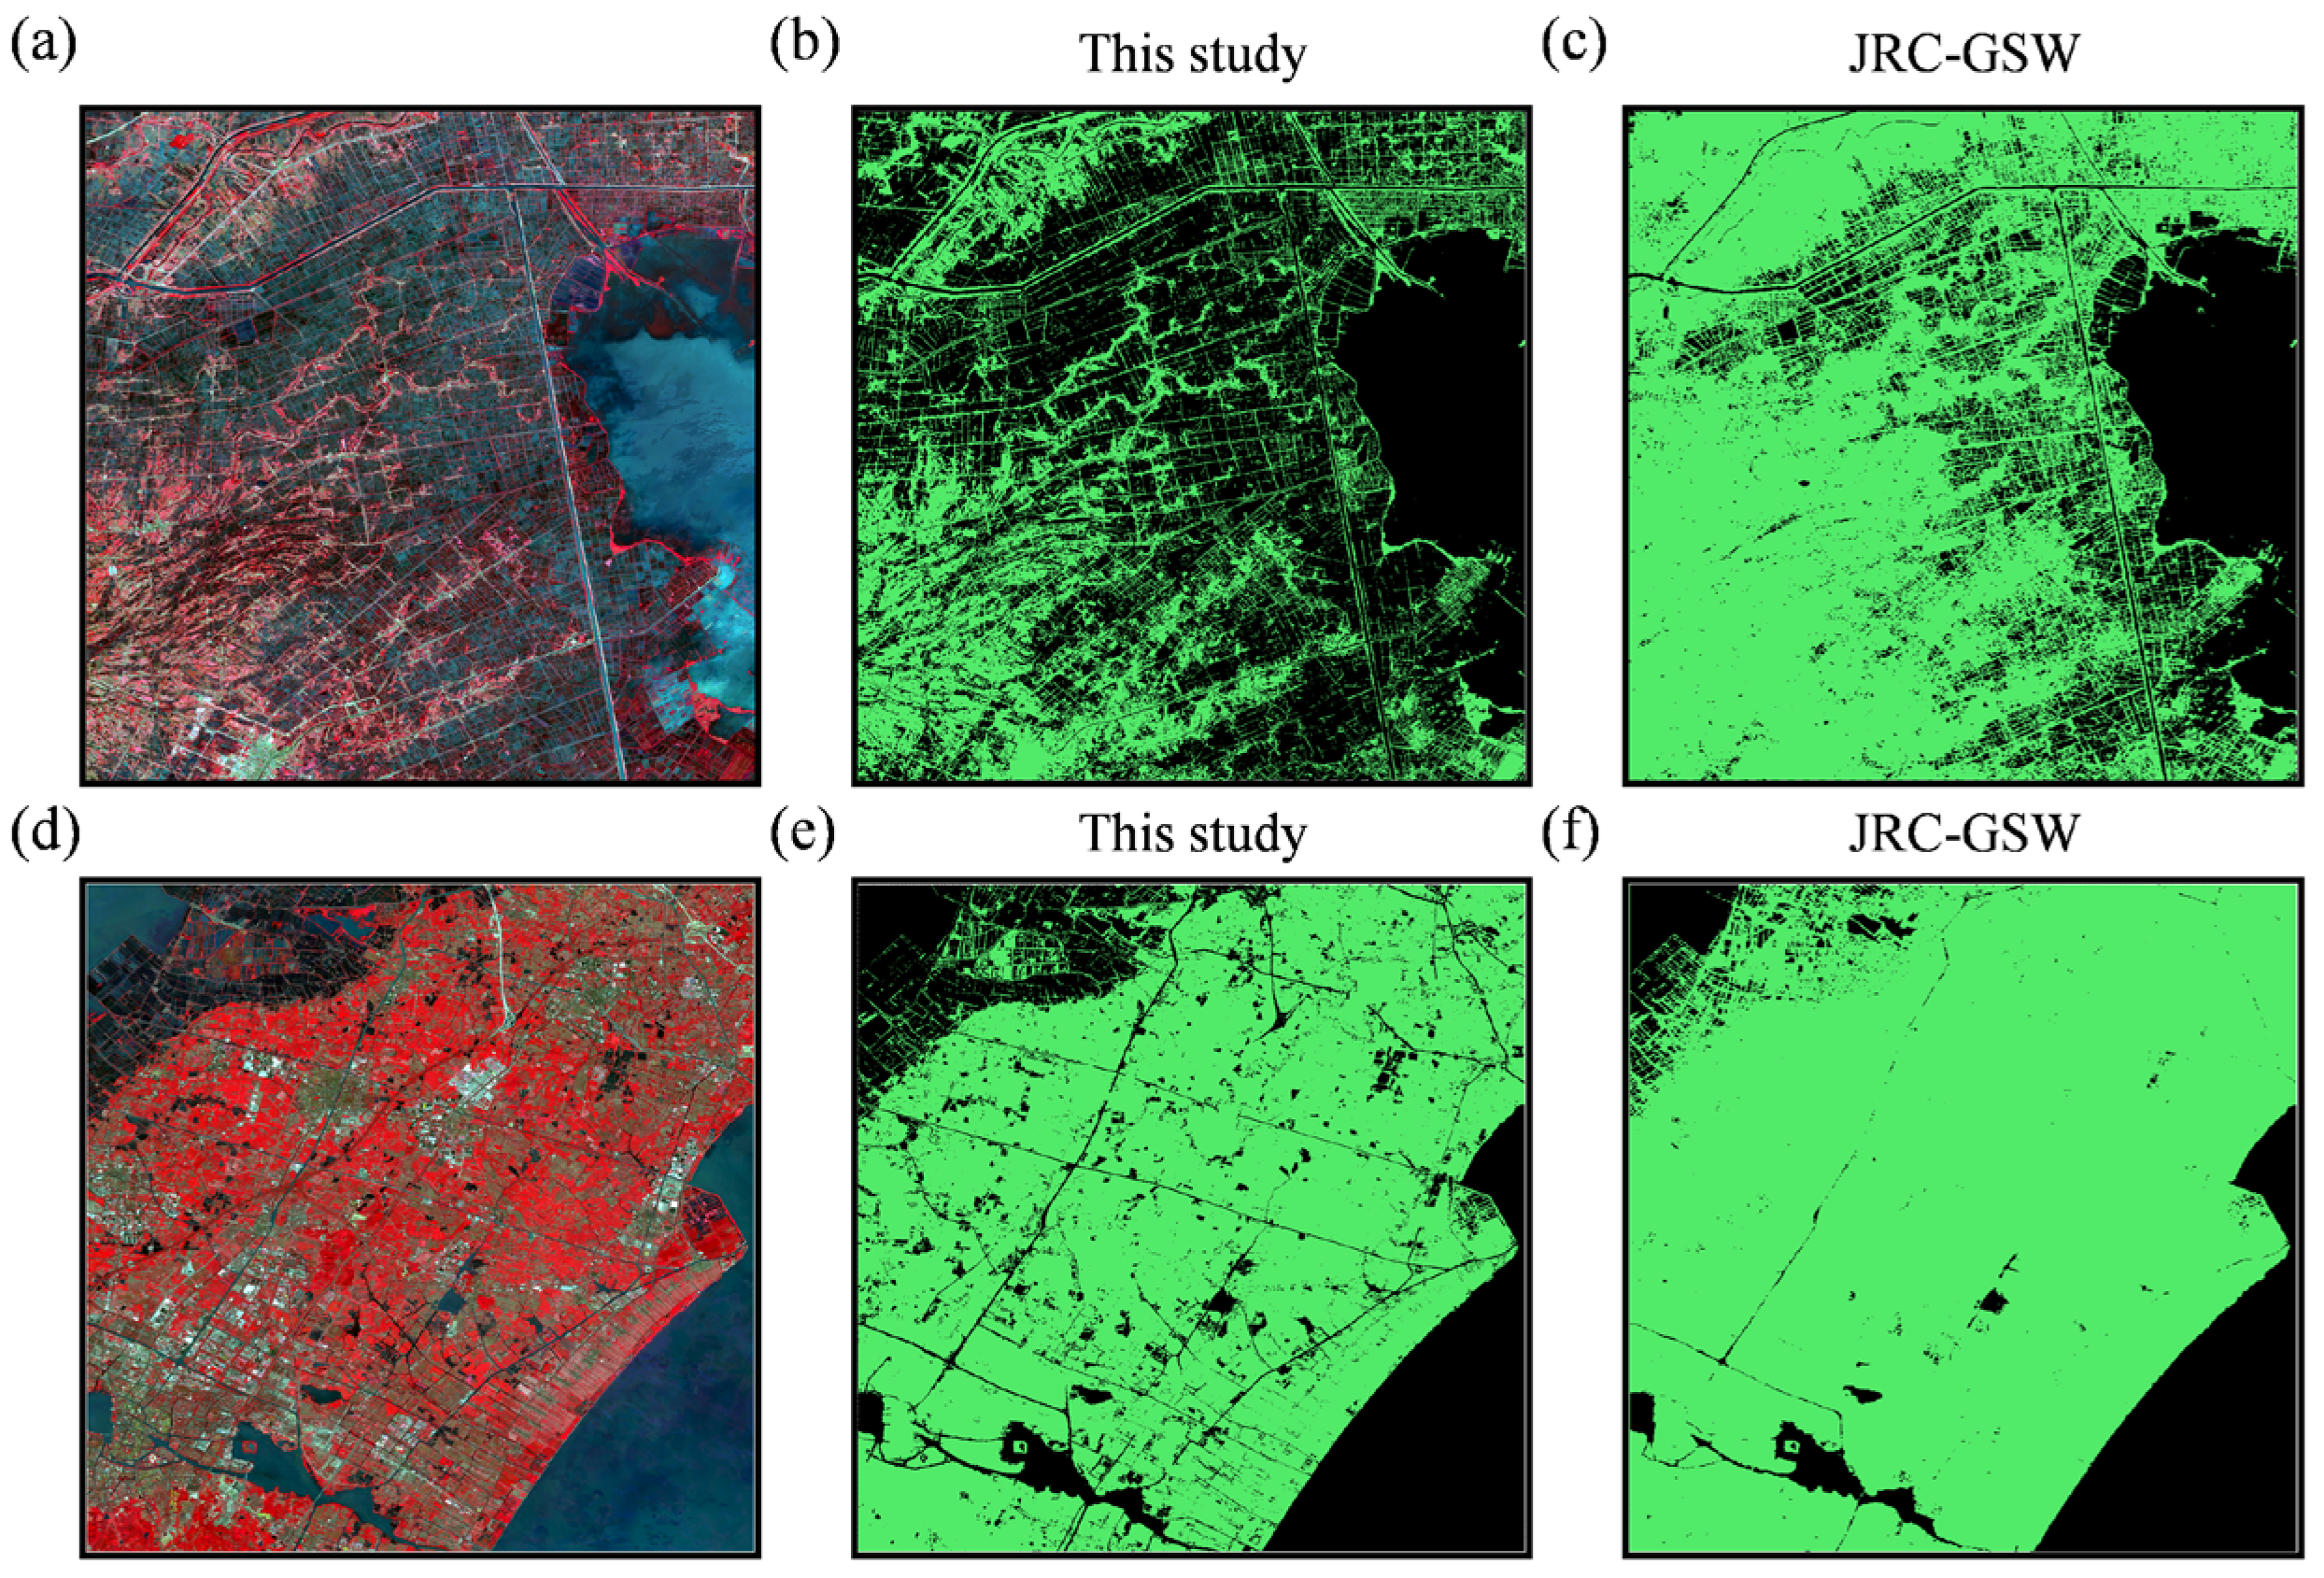
This study explored the dynamics of river and lake water systems in the MLRYR over the past six years utilizing Sentinel-2 image data. The Sentinel-2 images, with a spatial resolution of 10 m, provide enhanced detail in analyzing the dynamics of rivers and lakes compared to the commonly used 30 m resolution images. The findings indicate that the maximum inundation extent in the MLRYR typically occurs in spring across most years from 2018 to 2023, contrasting with results from several other studies. As illustrated in Figure 5a, a comparison of this study’s results from 2018 to 2021 with JRC-GSW data reveals that the spring SWA extracted here is substantially larger than that reported in the JRC-GSW data, although similar results were observed in other seasons. Further analysis of the discrepancies between this study and the JRC-GSW data indicates that the higher SWA mapped in this study during spring primarily corresponds to paddy fields, ponds, and wetland water bodies located near rivers and lakes (Figure 10). The higher spatial resolution of Sentinel-2 images has facilitated improved identification of smaller water bodies, such as paddy fields, compared to previous remote sensing images with lower resolution. As summer approaches, these smaller water bodies largely diminish, while the water area of lakes and reservoirs expands. Nonetheless, in most years, this process leads to a greater SWA in spring than in summer based on monitoring results.

4.3. Limitations and Future Research

Although the notable efficacy and potential of the clustering method employed for water body extraction in this study, certain uncertainties remain that may affect its accuracy. To address these uncertainties, we propose potential avenues for improvement in future research. In large-scale water body extraction, the varying spectral reflection characteristics of water bodies are influenced by regional water pollution and confusion with similar objects (such as dark buildings and shadows). Thus, incorporating features such as texture, morphological profiles, and homogeneity is advisable. Spatial characteristic indicators were developed for further differentiation to optimize water body extraction results [88,89,90]. Furthermore, the X-means clustering algorithm utilized in this study presents opportunities for further enhancement. Recent advancements in unsupervised deep learning methods leverage water body indices to identify potential water bodies and conduct deep learning training with pseudo-samples and labels. The VREWI employed in this study demonstrates exceptional reliability and superiority compared to traditional water body indices, suggesting its potential for further applications in unsupervised deep learning research. Owing to the temporal constraints of Sentinel-2 imagery, the study period in this research is limited, allowing only the reflection of short-term changes in SWA changes within the MLRYR. In this study, the effectiveness of the multi-dimensional clustering method for water body extraction was solely validated using Sentinel-2 imagery. As the temporal coverage of Sentinel-2 imagery expands and through the integration of remote sensing data from other sources to generate high-accuracy SWA datasets, this will facilitate a deeper understanding of the dynamics and underlying drivers of SWA variations in the MLRYR.

5. Conclusions

Establishing a comprehensive river and lake protection and governance system that integrates upstream and downstream river basin management is a crucial step in implementing China’s national “River Strategy”. However, the complexity of river–lake systems and our limited scientific understanding of their spatiotemporal dynamics significantly hinder the development of effective protection plans. This study implements and validates a water extraction method that integrates a specific water index (VREWI) and multi-dimensional clustering, enabling the monitoring and analysis of dynamic changes in river, lake, and reservoir areas within the MLRYR from 2018 to 2023.
Verification results indicate that enhancing the water index and optimizing the clustering method can improve the accuracy and efficiency of water extraction. Analysis of water body dynamics reveals that over the past six years, the overall trend of SWA in the MLRYR has remained stable. However, within a broad range including multiple sub-basins, a decline in SWA has been observed on an inter-annual scale. From 2018 to 2023, spring SWA across all sub-basins exhibited a decline, while summer SWA in 16 sub-basins indicated an increase. Nevertheless, in the Dongting Lake basin (E2), Poyang Lake basin (F2), and the Qingyi and Shuiyang River basin (C2), where Shijiu Lake (C2) is located, summer surface water area exhibited varying degrees of decline. Among the large lakes and reservoirs in the MLRYR, Poyang Lake, Dongting Lake, and Shijiu Lake all demonstrated a pronounced decrease in water area. Conversely, the large lakes situated downstream, such as Taihu Lake and Chaohu Lake, experienced only slight reductions. Specifically, the Danjiangkou Reservoir was the largest water body with a significant increase in water area from 2018 to 2023. In addition, the water areas of large lakes in the middle reaches of the Yangtze River, such as Honghu Lake and Liangzi Lake, are also displaying an increase. Further correlation analysis between SWA and multiple influencing factors was conducted at the sub-basin scale. In most sub-basins, SWA showed the strongest correlations with drought index and precipitation. In sub-basins containing large lakes and reservoirs, the presence of river networks played a buffering role by regulating and storing water, thereby reducing the direct influence of climatic factors on lake and reservoir water extent.
Integrating satellite imagery and Earth observation data enhances our understanding of surface water dynamics in the MLRYR, offering a valuable reference for surface water monitoring in other regions. Overall, the findings provide deeper insight into the drivers of surface water variability—particularly the effects of drought events—and support more informed decision-making for water resource management and conservation.

Author Contributions

Conceptualization, Z.Q. and S.Y.; methodology, Z.Q. and H.W.; validation, Z.Q. and X.L.; investigation, Z.Q. and Y.J.; data curation, Z.Q.; writing—original draft preparation, Z.Q. and X.L.; writing—review and editing, Z.Q. and S.Y.; visualization, Y.J. and J.H.; funding acquisition, S.Y. and B.D. All authors have read and agreed to the published version of the manuscript.

Funding

The study of this paper was supported by the National Natural Science Foundation of China, grant number No. U2240224; the National Key R&D Program of China, grant number 2022YFC3202601 and the Special Fund of the Chinese Central Government for Basic Scientific Research Operations in Commonwealth Research Institute, grant numbers CKSF2024326/HL, CKSF2023343/HL, CKSF2023328/HL.

Data Availability Statement

The data presented in this study are available on request from the corresponding author.

Acknowledgments

We thank Yang Danlei for providing support for this research. We are also grateful to all colleagues who assisted with data processing, and to the anonymous reviewers for their constructive comments that improved the manuscript.

Conflicts of Interest

The authors declare there are no conflicts of interest.

References

  1. Chen, T.; Song, C.; Ke, L.; Wang, J.; Liu, K.; Wu, Q. Estimating Seasonal Water Budgets in Global Lakes by Using Multi-Source Remote Sensing Measurements. J. Hydrol. 2021, 593, 125781. [Google Scholar] [CrossRef]
  2. Broner, N.; Laronne, J.B.; Storz-Peretz, Y. Influence of Flood Events on the Response of Steep and Coarse-Grained Channels to Base-Level Lowering in an Arid Setting. J. Hydrol. 2024, 645, 132075. [Google Scholar] [CrossRef]
  3. Mack, E.A.; Theuerkauf, E.J.; Pepper, J.; Norton, R.K.; Bunting, E.L. Citizen Perceptions of Great Lakes Coastline Change and Management Efforts. Ocean Coast. Manag. 2024, 255, 107243. [Google Scholar] [CrossRef]
  4. Zhang, Y.; Du, J.; Guo, L.; Fang, S.; Zhang, J.; Sun, B.; Mao, J.; Sheng, Z.; Li, L. Long-Term Detection and Spatiotemporal Variation Analysis of Open-Surface Water Bodies in the Yellow River Basin from 1986 to 2020. Sci. Total Environ. 2022, 845, 157152. [Google Scholar] [CrossRef]
  5. Liu, Y.; Yuan, S.; Zhu, Y.; Ren, L.; Chen, R.; Zhu, X.; Xia, R. The Patterns, Magnitude, and Drivers of Unprecedented 2022 Mega-Drought in the Yangtze River Basin, China. Environ. Res. Lett. 2023, 18, 114006. [Google Scholar] [CrossRef]
  6. Zhang, Y.; Liu, X.; Wang, K.; Bai, P. Response of Evapotranspiration to the 2022 Unprecedented Extreme Drought in the Yangtze River Basin. Int. J. Climatol. 2024, 44, 2779–2791. [Google Scholar] [CrossRef]
  7. Pan, Y.; Teng, T.; Wang, S.; Wang, T. Impact and Mechanism of Urbanization on Urban Green Development in the Yangtze River Economic Belt. Ecol. Indic. 2024, 158, 111612. [Google Scholar] [CrossRef]
  8. Zhang, Q.; Kong, Q.; Zhang, M.; Huang, H. New-Type Urbanization and Ecological Well-Being Performance: A Coupling Coordination Analysis in the Middle Reaches of the Yangtze River Urban Agglomerations, China. Ecol. Indic. 2024, 159, 111678. [Google Scholar] [CrossRef]
  9. Xie, C.; Huang, X.; Mu, H.; Yin, W. Impacts of Land-Use Changes on the Lakes across the Yangtze Floodplain in China. Environ. Sci. Technol. 2017, 51, 3669–3677. [Google Scholar] [CrossRef]
  10. Xiong, Y.; Wang, K. Eco-Compensation Effects of the Wetland Recovery in Dongting Lake Area. J. Geogr. Sci. 2010, 20, 389–405. [Google Scholar] [CrossRef]
  11. Liu, D.; Dai, Q.; Yuan, G. Evolutionary Trends and Coordinated Development Analysis of Water Resources Systems and High-Quality Economic Growth in the Yangtze River Delta. Water 2023, 15, 4030. [Google Scholar] [CrossRef]
  12. Zhao, Y.; Liu, H.; Du, J.; Guo, C.; Xiao, L.; Yi, Y. Divergent Trends of Open Surface Water Body Area of River and Lake Dominated Regions in the Yangtze River Basin from 1986 to 2022. Remote Sens. 2025, 17, 1008. [Google Scholar] [CrossRef]
  13. Liu, H.; Zheng, L.; Jiang, L.; Liao, M. Forty-Year Water Body Changes in Poyang Lake and the Ecological Impacts Based on Landsat and HJ-1 a/B Observations. J. Hydrol. 2020, 589, 125161. [Google Scholar] [CrossRef]
  14. Yang, L.; Zhao, G.; Tian, P.; Mu, X.; Tian, X.; Feng, J.; Bai, Y. Runoff Changes in the Major River Basins of China and Their Responses to Potential Driving Forces. J. Hydrol. 2022, 607, 127536. [Google Scholar] [CrossRef]
  15. Yuan, W.; Chen, L.; Chen, H.; Deng, S.; Ji, H.; Liang, F. Assessing Habitat Quality at Poyang Lake Based on InVEST and Geodetector Modeling. Ecol. Evol. 2023, 13, e10759. [Google Scholar] [CrossRef]
  16. Xin, Z.; Li, Y.; Zhang, L.; Ding, W.; Ye, L.; Wu, J.; Zhang, C. Quantifying the Relative Contribution of Climate and Human Impacts on Seasonal Streamflow. J. Hydrol. 2019, 574, 936–945. [Google Scholar] [CrossRef]
  17. Günen, M.; Atasever, U. Remote Sensing and Monitoring of Water Resources: A Comparative Study of Different Indices and Thresholding Methods. Sci. Total Environ. 2024, 926, 172117. [Google Scholar] [CrossRef] [PubMed]
  18. Su, Z.; Xiang, L.; Steffen, H.; Jia, L.; Deng, F.; Wang, W.; Hu, K.; Guo, J.; Nong, A.; Cui, H.; et al. A New and Robust Index for Water Body Extraction from Sentinel-2 Imagery. Remote Sens. 2024, 16, 2749. [Google Scholar] [CrossRef]
  19. Sun, Q.; Li, J. A Method for Extracting Small Water Bodies Based on DEM and Remote Sensing Images. Sci. Rep. 2024, 14, 760. [Google Scholar] [CrossRef]
  20. Abad, L.; Hölbling, D.; Spiekermann, R.; Prasicek, G.; Dabiri, Z.; Argentin, A. Detecting Landslide-Dammed Lakes on Sentinel-2 Imagery and Monitoring Their Spatio-Temporal Evolution Following the Kaikoura Earthquake in New Zealand. Sci. Total Environ. 2024, 907, 168302. [Google Scholar] [CrossRef]
  21. Coffer, M.; Nezlin, N.; Bartlett, N.; Pasakarnis, T.; Lewis, T.; Digiacomo, P. Satellite Imagery as a Management Tool for Monitoring Water Clarity across Freshwater Ponds on Cape Cod, Massachusetts. J. Environ. Manag. 2024, 355, 120334. [Google Scholar] [CrossRef]
  22. Qi, Z.S.; Yao, S.M.; Zhu, Y.; Liu, X.Q. Research Progress on Evolution of Rivers and Lakes in China Based on Remote Sensing Technology. J. Change River Sci. Res. Inst. 2025, 42, 8–17. [Google Scholar] [CrossRef]
  23. Li, H.; Zech, J.; Ludwig, C.; Fendrich, S.; Shapiro, A.; Schultz, M.; Zipf, A. Automatic Mapping of National Surface Water with OpenStreetMap and Sentinel-2 MSI Data Using Deep Learning. Int. J. Appl. Earth Obs. Geoinf. 2021, 104, 102571. [Google Scholar] [CrossRef]
  24. Yang, X.; Qin, Q.; Grussenmeyer, P.; Koehl, M. Urban Surface Water Body Detection with Suppressed Built-up Noise Based on Water Indices from Sentinel-2 MSI Imagery. Remote Sens. Environ. 2018, 219, 259–270. [Google Scholar] [CrossRef]
  25. Wu, Q.; Wang, M.; Shen, Q.; Yao, Y.; Li, J.; Zhang, F.; Zhou, Y. Small water body extraction method based on Sentinel-2 satellite multi-spectral remote sensing image. Natl. Remote Sens. Bull. 2022, 26, 781–794. [Google Scholar] [CrossRef]
  26. Jiang, Z.; Wen, Y.; Zhang, G.; Wu, X. Water Information Extraction Based on Multi-Model RF Algorithm and Sentinel-2 Image Data. Sustainability 2022, 14, 3797. [Google Scholar] [CrossRef]
  27. Nie, Y.; Chen, Y.; Guo, J.; Li, S.; Xiao, Y.; Gong, W.; Lan, R. An Improved CNN Model in Image Classification Application on Water Turbidity. Sci. Rep. 2025, 15, 11264. [Google Scholar] [CrossRef]
  28. Parajuli, J.; Fernandez-Beltran, R.; Kang, J.; Pla, F. Attentional Dense Convolutional Neural Network for Water Body Extraction from Sentinel-2 Images. IEEE J. Sel. Top. Appl. Earth Obs. Remote Sens. 2022, 15, 6804–6816. [Google Scholar] [CrossRef]
  29. Li, J.; Meng, Y.; Li, Y.; Cui, Q.; Yang, X.; Tao, C.; Wang, Z.; Li, L.; Zhang, W. Accurate Water Extraction Using Remote Sensing Imagery Based on Normalized Difference Water Index and Unsupervised Deep Learning. J. Hydrol. 2022, 612, 128202. [Google Scholar] [CrossRef]
  30. Bangira, T.; Alfieri, S.M.; Menenti, M.; Van Niekerk, A. Comparing Thresholding with Machine Learning Classifiers for Mapping Complex Water. Remote Sens. 2019, 11, 1351. [Google Scholar] [CrossRef]
  31. Cordeiro, M.C.R.; Martinez, J.-M.; Peña-Luque, S. Automatic Water Detection from Multidimensional Hierarchical Clustering for Sentinel-2 Images and a Comparison with Level 2A Processors. Remote Sens. Environ. 2021, 253, 112209. [Google Scholar] [CrossRef]
  32. Yang, X.; Zhao, S.; Qin, X.; Zhao, N.; Liang, L. Mapping of Urban Surface Water Bodies from Sentinel-2 MSI Imagery at 10 m Resolution via NDWI-Based Image Sharpening. Remote Sens. 2017, 9, 596. [Google Scholar] [CrossRef]
  33. Liu, Z.; Chao, N.; Chen, G.; Zhang, G.; Wang, Z.; Li, F.; Ouyang, G. Changes in Monthly Surface Area, Water Level, and Storage of 194 Lakes and Reservoirs in the Yangtze River Basin during 1990–2021 Using Multisource Remote Sensing Data. Sci. Total Environ. 2024, 944, 173840. [Google Scholar] [CrossRef]
  34. Ye, X.; Wu, J.; Li, X.; Li, Y.; Zhang, Q.; Xu, C.-Y. Multi-Source Remote Sensing Data and Image Fusion Technology Reveal Significant Spatiotemporal Heterogeneity of Inundation Dynamics in a Typical Large Floodplain Lake System. J. Hydrol. Reg. Stud. 2023, 50, 101541. [Google Scholar] [CrossRef]
  35. Chen, L.; Liu, Y.; Li, J.; Tian, P.; Zhang, H. Surface Water Changes in China’s Yangtze River Delta over the Past Forty Years. Sustain. Cities Soc. 2023, 91, 104458. [Google Scholar] [CrossRef]
  36. Yu, B.; Cui, B.; Zang, Y.; Wu, C.; Zhao, Z.; Wang, Y. Long-Term Dynamics of Different Surface Water Body Types and Their Possible Driving Factors in China. Remote Sens. 2021, 13, 1154. [Google Scholar] [CrossRef]
  37. Pelleg, D.; Moore, A.W. X-Means: Extending K-Means with Efficient Estimation of the Number of Clusters. In Proceedings of the Seventeenth International Conference on Machine Learning, San Francisco, CA, USA, 29 June–2 July 2000; pp. 727–734. [Google Scholar]
  38. Shen, Y. National 1:250000 Three-Level River Basin Data Set 2021. Available online: https://www.ncdc.ac.cn/portal/metadata/4f518dc4-4963-4ab4-b7e0-b5feb49d53e0 (accessed on 10 January 2021).
  39. Billson, J.; Islam, M.S.; Sun, X.; Cheng, I. Water Body Extraction from Sentinel-2 Imagery with Deep Convolutional Networks and Pixelwise Category Transplantation. Remote Sens. 2023, 15, 1253. [Google Scholar] [CrossRef]
  40. Pasquarella, V.J.; Brown, C.F.; Czerwinski, W.; Rucklidge, W.J. Comprehensive Quality Assessment of Optical Satellite Imagery Using Weakly Supervised Video Learning. In Proceedings of the 2023 IEEE/CVF Conference on Computer Vision and Pattern Recognition Workshops (CVPRW), Vancouver, BC, Canada, 17–24 June 2023; pp. 2125–2135. [Google Scholar]
  41. Liu, Y.; Lai, L.; Gao, Y. Mapping 10 m Monthly Surface Water Dynamics in the Yangtze River Basin from 2017 to 2020 Using a Robust ATMC Algorithm. J. Hydrol. 2023, 626, 130327. [Google Scholar] [CrossRef]
  42. Pekel, J.; Cottam, A.; Gorelick, N.; Belward, A. High-Resolution Mapping of Global Surface Water and Its Long-Term Changes. Nature 2016, 540, 418–422. [Google Scholar] [CrossRef]
  43. Messager, M.L.; Lehner, B.; Grill, G.; Nedeva, I.; Schmitt, O. Estimating the Volume and Age of Water Stored in Global Lakes Using a Geo-Statistical Approach. Nat. Commun. 2016, 7, 13603. [Google Scholar] [CrossRef]
  44. Ma, R. The Boundaries of Lakes over 1 Square Kilometer in the Mid-Lower Reaches of the Yangtze River in the Past 40 Years 2021. Available online: https://lake.geodata.cn/ (accessed on 15 January 2025).
  45. Lee, D.B.; Martin, H.K.; Edmonds, D.A. A Method to Detect Abrupt Shifts in River Channel Position Using a Landsat-Derived Water Occurrence Record. Earth Surf. Process. Landf. 2022, 47, 3546–3557. [Google Scholar] [CrossRef]
  46. Muñoz Sabater, J. ERA5-Land Monthly Averaged Data from 1950 to Present. 2019. Available online: https://cds.climate.copernicus.eu/datasets/reanalysis-era5-land-monthly-means?tab=download (accessed on 15 January 2025).
  47. Cerlini, P.B.; Saraceni, M.; Silvestri, L.; Meniconi, S.; Brunone, B. Monitoring the Water Mass Balance Variability of Small Shallow Lakes by an ERA5-Land Reanalysis and Water Level Measurement-Based Model. An Application to the Trasimeno Lake, Italy. Atmosphere 2022, 13, 949. [Google Scholar] [CrossRef]
  48. Irwandi, H.; Rosid, M.S.; Mart, T. Effects of Climate Change on Temperature and Precipitation in the Lake Toba Region, Indonesia, Based on ERA5-Land Data with Quantile Mapping Bias Correction. Sci. Rep. 2023, 13, 2542. [Google Scholar] [CrossRef] [PubMed]
  49. McFeeters, S. The Use of the Normalized Difference Water Index (NDWI) in the Delineation of Open Water Features. Int. J. Remote Sens. 1996, 17, 1425–1432. [Google Scholar] [CrossRef]
  50. Gafurov, A.; Prokhorov, V.; Kozhevnikova, M.; Usmanov, B. Forest Community Spatial Modeling Using Machine Learning and Remote Sensing Data. Remote Sens. 2024, 16, 1371. [Google Scholar] [CrossRef]
  51. Khan, M.F.A.; Muhammad, K.; Bashir, S.; Ud Din, S.; Hanif, M. Mapping Allochemical Limestone Formations in Hazara, Pakistan Using Google Cloud Architecture: Application of Machine-Learning Algorithms on Multispectral Data. ISPRS Int. J. Geo-Inf. 2021, 10, 58. [Google Scholar] [CrossRef]
  52. Luo, G.; Chen, G.; Tian, L.; Qin, K.; Qian, S.-E. Minimum Noise Fraction versus Principal Component Analysis as a Preprocessing Step for Hyperspectral Imagery Denoising. Can. J. Remote Sens. 2016, 42, 106–116. [Google Scholar] [CrossRef]
  53. Chang, C.-I.; Plaza, A. A Fast Iterative Algorithm for Implementation of Pixel Purity Index. IEEE Geosci. Remote Sens. Lett. 2006, 3, 63–67. [Google Scholar] [CrossRef]
  54. Sarp, G.; Ozcelik, M. Water Body Extraction and Change Detection Using Time Series: A Case Study of Lake Burdur, Turkey. J. Taibah Univ. Sci. 2017, 11, 381–391. [Google Scholar] [CrossRef]
  55. Feyisa, G.L.; Meilby, H.; Fensholt, R.; Proud, S.R. Automated Water Extraction Index: A New Technique for Surface Water Mapping Using Landsat Imagery. Remote Sens. Environ. 2014, 140, 23–35. [Google Scholar] [CrossRef]
  56. Xu, H. Modification of Normalised Difference Water Index (NDWI) to Enhance Open Water Features in Remotely Sensed Imagery. Int. J. Remote Sens. 2006, 27, 3025–3033. [Google Scholar] [CrossRef]
  57. Rouse, J.W., Jr.; Haas, R.H.; Schell, J.; Deering, D. Monitoring the Vernal Advancement and Retrogradation (Green Wave Effect) of Natural Vegetation; Texas A & M University, Remote Sensing Center: College Station, TX, USA, 1973; Available online: https://api.semanticscholar.org/CorpusID:129198382 (accessed on 1 January 2025).
  58. Huete, A.; Didan, K.; Miura, T.; Rodriguez, E.; Gao, X.; Ferreira, L. Overview of the Radiometric and Biophysical Performance of the MODIS Vegetation Indices. Remote Sens. Environ. 2002, 83, 195–213. [Google Scholar] [CrossRef]
  59. Liu, Y.; Gao, Y. Surface Water Extraction in Yangtze River Basin Based on Sentinel Time Series Image. Natl. Remote Sens. Bull. 2022, 26, 358–372. [Google Scholar] [CrossRef]
  60. Lewis, H.; Brown, M. A Generalized Confusion Matrix for Assessing Area Estimates from Remotely Sensed Data. Int. J. Remote Sens. 2001, 22, 3223–3235. [Google Scholar] [CrossRef]
  61. Kaushik, S.; Singh, T.; Joshi, P.K.; Dietz, A.J. Automated Mapping of Glacial Lakes Using Multisource Remote Sensing Data and Deep Convolutional Neural Network. Int. J. Appl. Earth Obs. Geoinf. 2022, 115, 103085. [Google Scholar] [CrossRef]
  62. Haralick, R.M.; Sternberg, S.R.; Zhuang, X. Image Analysis Using Mathematical Morphology. IEEE Trans. Pattern Anal. Mach. Intell. 1987, 9, 532–550. [Google Scholar] [CrossRef]
  63. Milan, S.; Vaclav, H.; Roger, B. Image Processing, Analysis, and Machine Vision (Third Edition); CL-Engineering; Springer: New York, NY, USA, 1993; ISBN 978-0-412-45570-4. [Google Scholar]
  64. Chen, S.; Haralick, R. Recursive Erosion, Dilation, Opening, and Closing Transforms. IEEE Trans. Image Process. 1995, 4, 335–345. [Google Scholar] [CrossRef]
  65. Ning, F.-S.; Lee, Y.-C. Combining Spectral Water Indices and Mathematical Morphology to Evaluate Surface Water Extraction in Taiwan. Water 2021, 13, 2774. [Google Scholar] [CrossRef]
  66. Vicente-Serrano, S.M.; Beguería, S.; López-Moreno, J.I. A Multiscalar Drought Index Sensitive to Global Warming: The Standardized Precipitation Evapotranspiration Index. J. Clim. 2010, 23, 1696–1718. [Google Scholar] [CrossRef]
  67. Puth, M.; Neuhäuser, M.; Ruxton, G. Effective Use of Pearson’s Product-Moment Correlation Coefficient Comment. Anim. Behav. 2014, 93, 183–189. [Google Scholar] [CrossRef]
  68. Yuan, Y.; Zeng, G.; Liang, J.; Huang, L.; Hua, S.; Li, F.; Zhu, Y.; Wu, H.; Liu, J.; He, X.; et al. Variation of Water Level in Dongting Lake over a 50-Year Period: Implications for the Impacts of Anthropogenic and Climatic Factors. J. Hydrol. 2015, 525, 450–456. [Google Scholar] [CrossRef]
  69. Li, L.; Yan, Z.; Shen, Q.; Cheng, G.; Gao, L.; Zhang, B. Water Body Extraction from Very High Spatial Resolution Remote Sensing Data Based on Fully Convolutional Networks. Remote Sens. 2019, 11, 1162. [Google Scholar] [CrossRef]
  70. Zhang, P.; Zou, Y.; Tao, K.; Zhang, S.; Li, F.; Deng, Z.; Zeng, J.; Xie, Y.; Liu, X.; Li, F. Extreme Drought Alters Waterfowl Distribution Patterns and Spatial Niches in Floodplain Wetlands. Glob. Ecol. Conserv. 2024, 51, e02901. [Google Scholar] [CrossRef]
  71. Duan, H.; Pan, Y.; Yu, X.; Xia, S. Effects of Habitat Change on the Wintering Waterbird Community in China’s Largest Freshwater Lake. Remote Sens. 2023, 15, 4582. [Google Scholar] [CrossRef]
  72. Lai, X.; Zou, H.; Jiang, J.; Jia, J.; Liu, Y.; Wei, W. Hydrological Dynamics of the Yangtze River-Dongting Lake System after the Construction of the Three Gorges Dam. Sci. Rep. 2025, 15, 50. [Google Scholar] [CrossRef]
  73. Mei, X.; Dai, Z.; Du, J.; Cheng, J. Three Gorges Dam Enhanced Organic Carbon Burial within the Sediments of Poyang Lake, China. Catena 2024, 238, 107859. [Google Scholar] [CrossRef]
  74. Yang, X.; Zhang, S.; Tang, C.; Wu, C.; Ge, Y. Impact of Three Gorges Dam Construction on Spatiotemporal Variations in the Hydrodynamic Regime of Poyang Lake (China). J. Hydrol. 2025, 646, 132302. [Google Scholar] [CrossRef]
  75. Lyu, J.; Shi, Y.; Liu, T.; Xu, X.; Liu, S.; Yang, G.; Peng, D.; Qu, Y.; Zhang, S.; Chen, C.; et al. Extreme Drought-Heatwave Events Threaten the Biodiversity and Stability of Aquatic Plankton Communities in the Yangtze River Ecosystems. Commun. Earth Environ. 2025, 6, 171. [Google Scholar] [CrossRef]
  76. Shao, Y.; Shen, Q.; Yao, Y.; Zhou, Y.; Xu, W.; Li, W.; Gao, H.; Shi, J.; Zhang, Y. Spatial and Temporal Variations of Total Suspended Matter Concentration during the Dry Season in Dongting Lake in the Past 35 Years. Remote Sens. 2024, 16, 3509. [Google Scholar] [CrossRef]
  77. Li, X.; Ye, X.; Yuan, C.; Xu, C. Can Water Release from Local Reservoirs Cope with the Droughts of Downstream Lake in a Large River-Lake System? J. Hydrol. 2023, 625, 130172. [Google Scholar] [CrossRef]
  78. Chang, L.; Cheng, L.; Li, S.; Guo, Z.; Liu, Y.; Zhang, L. Reservoir Dominated Spatio-Temporal Changes of the Surface Water Area in the Yangtze River Basin during Past Three Decades. J. Hydrol. Reg. Stud. 2024, 55, 101948. [Google Scholar] [CrossRef]
  79. Wu, J.; Yuan, X.; Yao, H.; Chen, X.; Wang, G. Reservoirs Regulate the Relationship between Hydrological Drought Recovery Water and Drought Characteristics. J. Hydrol. 2021, 603, 127127. [Google Scholar] [CrossRef]
  80. Jiang, X.; Jiang, Z.; Li, Z.; Su, J.; Tang, L.; Wu, M.; Wang, Y. A Framework for the Construction of Effective Landscape Ecological Network with Integrating Hydrological Connectivity: A Case Study in Dongjiang River Basin, China. J. Environ. Manag. 2025, 376, 124509. [Google Scholar] [CrossRef]
  81. Liu, Q.; Gan, L.; Wu, H.; Liang, L.; Yan, D.; Wang, X.; Li, C.; Sun, T. Water Level Fluctuations Control Wetland Hydrological Connectivity in Driving the Integrity of Wetlands. J. Hydrol. 2025, 657, 133095. [Google Scholar] [CrossRef]
  82. Tan, C.; Sheng, T.; Wang, L.; Mbao, E.; Gao, J.; Wang, B. Water-Level Fluctuations Affect the Alpha and Beta Diversity of Macroinvertebrates in Poyang Lake, China. Fundam. Appl. Limnol. 2021, 194, 321–334. [Google Scholar] [CrossRef]
  83. Qu, Y.; Zeng, X.; Luo, C.; Zhang, H.; Liu, Y.; Wang, J. Constructing Wetland Ecological Corridor System Based on Hydrological Connectivity with the Goal of Improving Regional Biodiversity. J. Environ. Manag. 2024, 368, 122074. [Google Scholar] [CrossRef] [PubMed]
  84. Sheldon, F.; Boulton, A.; Puckridge, J. Conservation Value of Variable Connectivity: Aquatic Invertebrate Assemblages of Channel and Floodplain Habitats of a Central Australian Arid-Zone River, Cooper Creek. Biol. Conserv. 2002, 103, 13–31. [Google Scholar] [CrossRef]
  85. Long, Y.; Cao, J.; Xiong, W.; He, H.; Ren, P. Spatiotemporal Pattern of Water Age in Dongting Lake before and after the Operation of the Three Gorges Project. J. Hydrol. Reg. Stud. 2024, 55, 101902. [Google Scholar] [CrossRef]
  86. Entwistle, N.; Heritage, G.; Schofield, L.; Williamson, R. Recent Changes to Floodplain Character and Functionality in England. Catena 2019, 174, 490–498. [Google Scholar] [CrossRef]
  87. Galib, S.; Lucas, M.; Chaki, N.; Fahad, F.; Mohsin, A. Is Current Floodplain Management a Cause for Concern for Fish and Bird Conservation in Bangladesh’s Largest Wetland? Aquat. Conserv. Mar. Freshw. Ecosyst. 2018, 28, 98–114. [Google Scholar] [CrossRef]
  88. Essa, A.; Sidike, P.; Asari, V. Volumetric Directional Pattern for Spatial Feature Extraction in Hyperspectral Imagery. IEEE Geosci. Remote Sens. Lett. 2017, 14, 1056–1060. [Google Scholar] [CrossRef]
  89. Imani, M.; Ghassemian, H. Discriminant Analysis in Morphological Feature Space for High-Dimensional Image Spatial-Spectral Classification. J. Appl. Remote Sens. 2018, 12, 016024. [Google Scholar] [CrossRef]
  90. Zhang, Y.; Liu, X.; Zhang, Y.; Ling, X.; Huang, X. Automatic and Unsupervised Water Body Extraction Based on Spectral-Spatial Features Using GF-1 Satellite Imagery. IEEE Geosci. Remote Sens. Lett. 2019, 16, 927–931. [Google Scholar] [CrossRef]
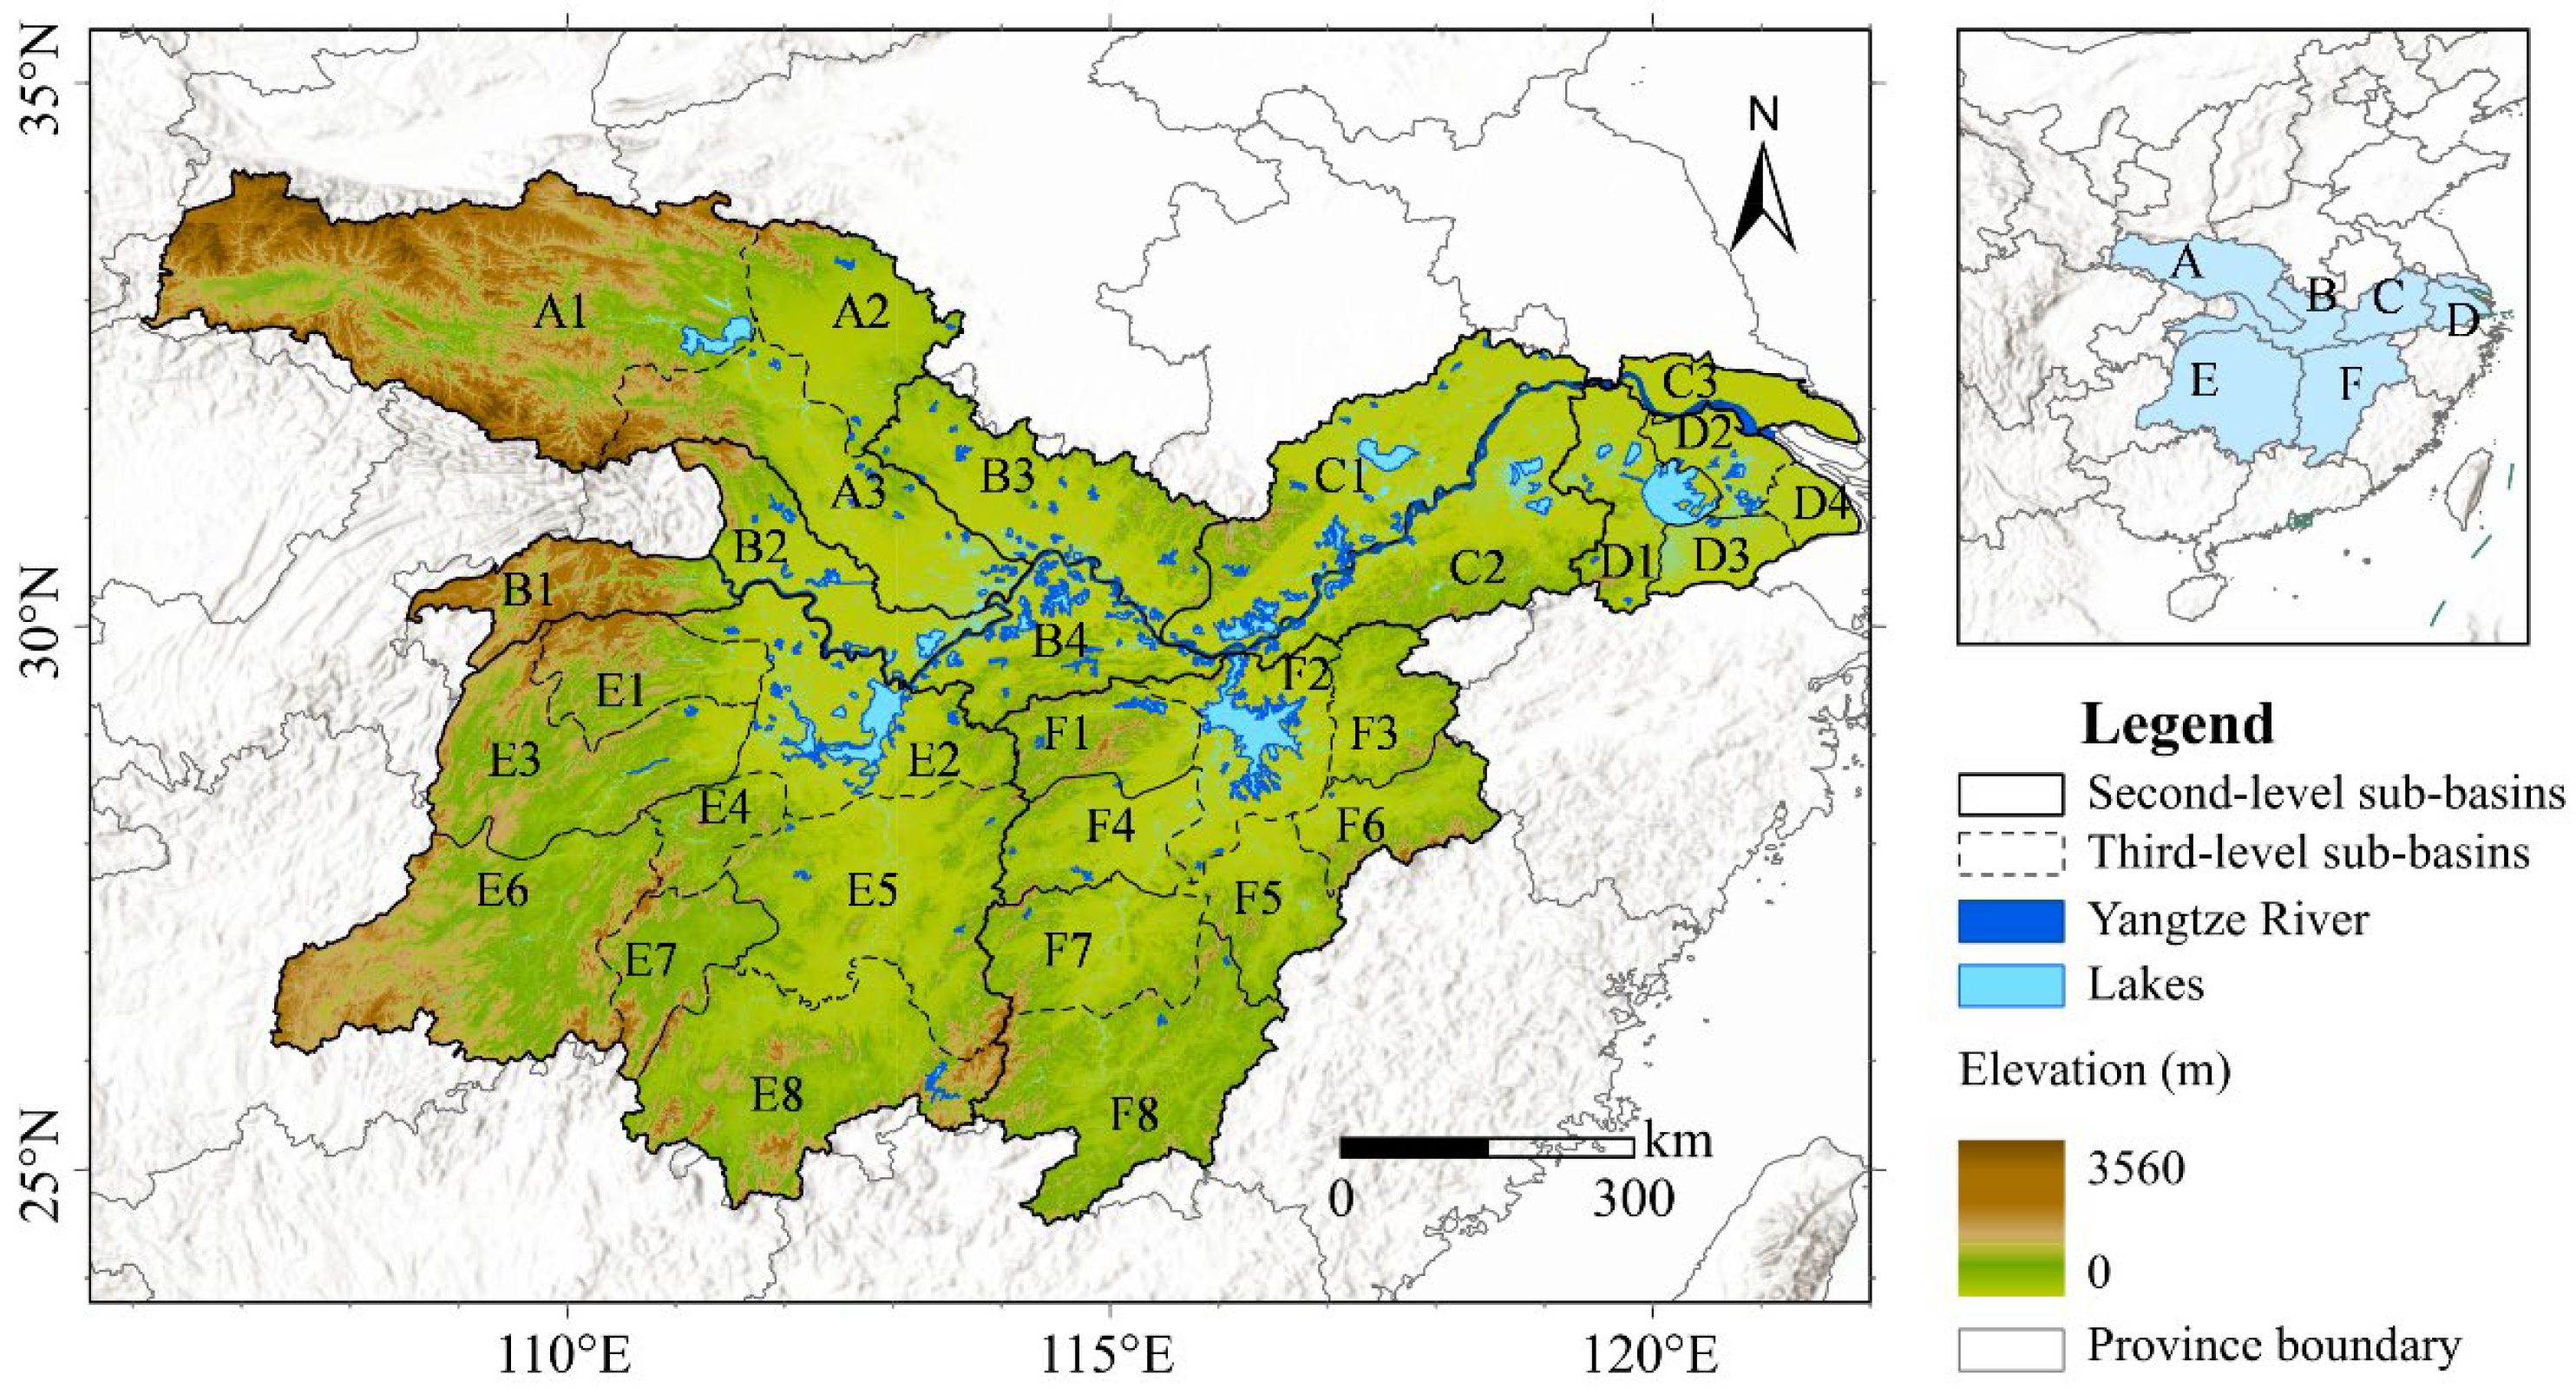
Figure 1. Distribution of the MLRYR sub-basins. The six major second-level basins (labelled A–F on the map) are: Basin A—Hanjiang River Basin; Basin B—Middle Main Stream Basin; Basin C—Lower Main Stream Basin; Basin D—Taihu Lake Basin; Basin E—Dongting Lake Basin; and Basin F—Poyang Lake Basin. Numbers indicate the third-level sub-basins within each corresponding second-level basin.
Remotesensing 17 03421 g001
Figure 2. The flowchart of the extraction of surface water and analysis.
Remotesensing 17 03421 g002
Figure 3. Normalized remote sensing reflectance of six kinds of features.
Remotesensing 17 03421 g003
Figure 4. Comparison of water extraction results of this study and three other methods: (a) Distribution of 20 rectangular boundaries used to generate random verification points. (b) True color and false color images of typical scenarios. (c) Water extraction results from the four methods: the method implemented in this study, Support Vector Machine (SVM), NDWI-B12 clustering, and multi-index water extraction method.
Remotesensing 17 03421 g004
Figure 5. Spatiotemporal distribution of surface water in the MLRYR from 2018 to 2023: (a) comparison of SWA between our research and JRC-GSW products, (b) water coverage rate of sub-basins, (c) drainage density of sub-basins, (d) the SWA in 2023 and maximum historical water area.
Remotesensing 17 03421 g005
Figure 6. SWA in different sub-basins. The black polyline represents changes in the annual average surface water area (ASWA). (a) Hanjiang River basin, (b) Middle main stream basin, (c) Lower main stream basin, (d) Taihu Lake basin, (e) Dongting Lake basin and (f) Poyang Lake basin.
Remotesensing 17 03421 g006
Figure 7. (a) The changes in annual SWA, and the changes in SWA in each season: (b) spring, (c) summer, (d) autumn and (e) winter.
Remotesensing 17 03421 g007
Figure 8. SWA changes in (a) lake areas and (b) reservoir areas.
Remotesensing 17 03421 g008
Figure 9. Heatmaps of multi-factor correlations for (a) the sub-basin SWA, (b) large lake water areas, and (c) reservoir water areas. Note: *** means significance at p < 0.01 level, ** means significance at p < 0.05 level, * means significance at p < 0.1 level.
Remotesensing 17 03421 g009
Figure 10. Comparison of water details extracted in this study and JRC-GSW data. (a,d) the false color images; (b,e) results in this study. (c,f) results in JRC-GSW.
Remotesensing 17 03421 g010
Table 1. Datasets used in this study.
NameUsageReference
Global Surface Water (GSW)Comparison[42]
HydroLAKESLake/Reservoir extraction[43]
National Major Lakes DistributionBoundary adjustment[44]
Global River Widths from Landsat (GRWL)River extraction[45]
ERA5-Land monthly datasetCorrelation analysis[46]
Table 2. Accuracy assessment of sample points.
This StudySVMNDWI-B12 ClusteringMulti-Index
OA97.98%95.54%93.56%96.45%
PA98.02%89.96%91.07%92.67%
UA96.01%96.30%89.61%96.43%
MCC0.9540.8990.8550.919
Kappa0.9540.8990.8550.919
Disclaimer/Publisher’s Note: The statements, opinions and data contained in all publications are solely those of the individual author(s) and contributor(s) and not of MDPI and/or the editor(s). MDPI and/or the editor(s) disclaim responsibility for any injury to people or property resulting from any ideas, methods, instructions or products referred to in the content.