Article

FANT-Det: Flow-Aligned Nested Transformer for SAR Small Ship Detection

1
Research Center for Space Optical Engineering, Harbin Institute of Technology, Harbin 150001, China
2
College of Astronautics, Nanjing University of Aeronautics and Astronautics, Nanjing 211106, China
3
China Academy of Space Technology, Beijing 100094, China
*
Author to whom correspondence should be addressed.
Remote Sens. 2025, 17(20), 3416; https://doi.org/10.3390/rs17203416
Submission received: 11 August 2025 / Revised: 9 October 2025 / Accepted: 10 October 2025 / Published: 12 October 2025

Abstract

Highlights

What are the main findings?
  • FANT-Det achieves state-of-the-art performance for small ship detection in SAR imagery, outperforming existing methods on SSDD, HRSID, and LS-SSDD-v1.0.
  • The architecture integrates a two-level nested transformer block, flow-aligned multiscale fusion, and adaptive contrastive denoising, yielding clear gains in detecting small ships under heavy noise and clutter.
What is the implication of the main finding?
  • It enables reliable detection in congested ports and low-visibility conditions, thereby improving situational awareness for civilian and military applications.
  • It provides a practical design recipe for SAR small ship detection, with potential for transfer to other remote sensing tasks.

Abstract

Ship detection in synthetic aperture radar (SAR) remote sensing imagery is of great significance in military and civilian applications. However, two factors limit detection performance: (1) a high prevalence of small-scale ship targets with limited information content and (2) interference affecting ship detection from speckle noise and land–sea clutter. To address these challenges, we propose a novel end-to-end (E2E) transformer-based SAR ship detection framework, called Flow-Aligned Nested Transformer for SAR Small Ship Detection (FANT-Det). Specifically, in the feature extraction stage, we introduce a Nested Swin Transformer Block (NSTB). The NSTB employs a two-level local self-attention mechanism to enhance fine-grained target representation, thereby enriching features of small ships. For multi-scale feature fusion, we design a Flow-Aligned Depthwise Efficient Channel Attention Network (FADEN). FADEN achieves precise alignment of features across different resolutions via semantic flow and filters background clutter through lightweight channel attention, further enhancing small-target feature quality. Moreover, we propose an Adaptive Multi-scale Contrastive Denoising (AM-CDN) training paradigm. AM-CDN constructs adaptive perturbation thresholds jointly determined by a target scale factor and a clutter factor, generating contrastive denoising samples that better match the physical characteristics of SAR ships. Finally, extensive experiments on three widely used open SAR ship datasets demonstrate that the proposed method achieves superior detection performance, outperforming current state-of-the-art (SOTA) benchmarks.

1. Introduction

Maritime ship detection in remote sensing images has a significant practical value [1,2,3]. In the civilian domain, it is the foundation for maritime search and rescue, oil spill response, ship traffic management, fishery management, and environmental monitoring [4]. In the military domain, it is crucial for surveillance, border control, and coastal defense [5]. Owing to its active microwave imaging mechanism, synthetic aperture radar (SAR) provides all-weather, day-and-night imaging capabilities [6]. This enables satellites to perform sustained high-resolution observation of sea areas with minimal restrictions, making SAR an indispensable sensing modality for real-world missions [7]. Consequently, SAR-based ship detection has become an active research area. However, due to the unique imaging mechanism and the inherent characteristics of detection scenarios, the research in this field still faces severe challenges.
For SAR-based ship detection, two factors have consistently hindered detection performance. First, there is the issue of ship target size. Different types of ships exhibit substantial variability in size, resulting in a vast span of feature scales [8]. In general, small ships predominate in most maritime scenes. For these diminutive ships, their weak features are often difficult to extract and can be easily obscured by background noise or coarse image resolution, thereby markedly increasing the likelihood of missed detections [9]. Second, SAR images of maritime scenes contain strong coherent speckle noise and complex cluttered backgrounds [10]. The ocean surface can produce sea clutter with irregular backscatter, while nearshore areas can produce land–sea interference. The brightness of both types of clutter can be comparable to or even greater than that of the ships [11]. This combination of speckle and clutter can obscure small or low-contrast ships. In summary, distinguishing small ships from a highly textured and noisy background is the greatest challenge for SAR-based detection. This highlights the need for advanced detection techniques that can not only resist clutter but also capture the fine-grained features of small targets.
Early SAR ship detection methods relied mainly on traditional computer vision techniques with handcrafted features and thresholding schemes [12,13]. Although conventional algorithms perform well under simple conditions, their effectiveness deteriorates significantly in the presence of complex background clutter or scarce target information [14,15,16]. Over the past decade, deep learning has reshaped the field of ship detection [17,18]. Convolutional neural network (CNN)-based detectors have since been applied to synthetic aperture radar data, substantially enhancing SAR ship detection performance [19,20]. Models based on frameworks such as Faster R-CNN [21] and YOLO [22] can automatically learn hierarchical feature representations, capturing ship shapes and textures more reliably than handcrafted descriptors. This data-driven approach has led to significant improvements in detection accuracy on public SAR ship datasets. Despite these successes, CNN-based detectors still encounter some limitations when applied to SAR imagery under extreme conditions [23]. Standard CNN detectors rely on manually designed components, such as anchor boxes and non-maximum suppression (NMS) post-processing, which pose additional challenges for SAR ship detection. Anchor-based methods must deploy a dense set of predefined scales to span the extensive size variability of maritime ships. However, few finite anchor configurations can accommodate both diminutive and large targets without compromise, often leading to missed detections of small ships or a proliferation of spurious proposals [24]. Likewise, NMS heuristics may inadvertently eliminate valid ship detections situated near larger ships or cluttered backgrounds, thereby diminishing sensitivity in congested or near-shore environments [25]. In summary, these manually engineered stages constrain the robustness and generalization capacity of CNN-based detectors in SAR ship detection.
Therefore, to overcome the drawbacks of anchor dependence and complex post-processing in SAR ship detection tasks, researchers have begun exploring end-to-end transformer-based detection architectures [26]. The detection transformer (DETR) [27] framework introduced a paradigm shift by formulating object detection as a direct set prediction problem using an encoder–decoder transformer. DETR and its variants require no predefined anchors or NMS. Instead, they use global self-attention to analyze object positions and employ a bipartite matching loss to produce a set of final predictions. DETR unifies a global receptive field with dynamic attention mechanisms, yielding inherent robustness to speckle and land–sea clutter. In addition, its end-to-end design avoids heuristic post-processing and is advantageous for densely packed ships. These factors suggest that DETR has considerable potential in SAR ship detection. However, their insufficient focus on local details leads to poor detection of small targets. Moreover, given the strong speckle and land–sea clutter in SAR imagery, the attention mechanisms inherent to the architecture alone do not suffice. Therefore, they fail to fully leverage their architectural advantages in SAR ship detection tasks.
In response to these issues, we propose an end-to-end transformer-based SAR ship detector called Flow-Aligned Nested Transformer for SAR Small Ship Detection (FANT-Det), specifically designed to tackle the dual challenges of small targets and background clutter. To address the poor performance of the DETR framework on small ships, we introduce the Nested Swin Transformer Block (NSTB) in the backbone network to enhance fine-grained feature extraction. NSTB introduces a dual-scale local self-attention mechanism in the early feature extraction stage. Its nested structure captures feature information at two scales. By applying local self-attention at both the base scale and a finer nested scale, and by subsequently fusing the feature maps, the module enriches the representation of ship targets. Meanwhile, the dual-branch attention structure helps distinguish true targets from noise. This emphasis on fine-grained details markedly improves the sensitivity of network to small ships. Furthermore, we design a Flow-Aligned Depthwise Efficient Channel Attention Network (FADEN) for multi-scale feature fusion with adaptive background filtering. FADEN applies flow-based alignment to ensure that semantically corresponding regions are correctly registered across scales before fusion. This flow-aligned fusion addresses the issue of semantic misalignment, which has a greater impact when handling ship targets that occupy a small fraction of the image compared to typical object detection tasks. In addition, FADEN incorporates a lightweight efficient channel attention (ECA) mechanism applied along the depth dimension during fusion, which recalibrates the weights of feature versus background clutter at the channel level. Finally, we propose an Adaptive Multi-scale Contrastive Denoising (AM-CDN) training strategy to jointly address the scale and clutter issues within the training paradigm. The novelty of AM-CDN lies in a dual-threshold noise injection strategy that adapts to target scale and local clutter intensity. By applying this multi-scale contrastive denoising technique, the detector learns more discriminative representations, separating ship features from surrounding confusing features. Essentially, AM-CDN serves as an additional feature-level denoising filter that complements the NSTB and FADEN modules by strengthening the ability of network to reject speckle and clutter interference during training.
Our main contributions are summarized as follows:
  • We propose FANT-Det, a novel SAR ship detection architecture tailored for small ships in complex scenes, achieving state-of-the-art (SOTA) performance on three public benchmark datasets.
  • We develop the NSTB, which adopts a nested local self-attention architecture to provide comprehensive feature capture and reinforcement for small ships, improving the extraction of small-target information.
  • We design FADEN to improve the quality of multi-scale feature fusion by employing semantic flow alignment and a lightweight attention mechanism, thereby achieving fine-grained feature matching and adaptive filtering of background clutter.
  • We introduce an AM-CDN training paradigm that enhances robustness of the detector for SAR ship targets by adaptively adjusting the positive and negative sample thresholds in contrastive denoising according to the target scale coefficient and local clutter intensity.
The remainder of this paper is organized as follows. Section 2 reviews related work. Section 3 describes our proposed method and modules in detail. In Section 4, we present experimental results on three public datasets. Finally, Section 5 concludes the paper and provides an outlook for future work.

2. Related Works

2.1. Traditional Methods and CNN-Based Methods for SAR Ship Detection

Traditional SAR ship detection methods rely chiefly on handcrafted feature discrimination and threshold statistics. Among these methods, the constant false alarm rate (CFAR) detector is a typical representative. Dai et al. incorporate target candidate boxes into CFAR to improve detection across multiple scales [28]. Gao et al. propose an approximate parameter-estimation scheme based on the generalized gamma distribution to mitigate sea-clutter interference [29]. Pappas et al. replace the rectangular sliding window with superpixels to define CFAR guard and background regions, thereby reducing false alarms [30]. However, traditional methods constrained by their underlying principles invariably suffer from the following drawbacks: limited generalization, low feature utilization, and unstable manual discrimination. Consequently, their performance degrades sharply when clutter interference is severe or when the target size is small.
These limitations motivate a shift toward data-driven learning approaches. CNN-based deep-learning methods can automatically learn discriminative features and improve robustness, and they now dominate the field [31]. Current research on deep-learning SAR ship detectors concentrates on optimizing network architectures or developing dedicated modules to solve specific problems. Sun et al. balance detection accuracy and computational complexity by constructing an embedded ship-sample data-augmentation network together with a sparse-activation network [32]. Bai et al. introduce a globally contextual feature-balanced pyramid and a unified attention module that suppress speckle noise [33]. Shen et al. propose an adaptive backbone built on large convolutional kernels, supplemented by a multi-scale attention module that enriches feature representations across scales and suppresses scattering noise [34]. Zhang et al. develop a frequency-domain attention module within the YOLO framework and design a joint-learning strategy, thereby improving detection performance under complex sea conditions [23]. These methods have achieved satisfactory performance in their respective scenarios. Nonetheless, because the convolutional architecture relies on local receptive fields and multi-level down-sampling, CNN-based detectors still face an intrinsic bottleneck in the detection of small ships. In addition, the handcrafted procedures integrated into CNN pipelines weaken detector robustness, while the remote-sensing perspective inevitably involves small, densely arranged targets. Consequently, threshold determination becomes challenging, as balancing false-alarm and missed-detection rates is inherently difficult.

2.2. Transformer-Based Methods for Ship Detection

Compared with the CNN paradigm, the vision transformer provides stronger global characterization and more natural multi-scale modeling, which gives it considerable potential for detecting small ships. Wang et al. propose a feature transformer module containing multi-head self-attention into the network, reinforcing global context and thereby reducing false alarms from near-shore clutter [35]. Li et al. embedded a feature-enhancement Swin transformer backbone within the Cascade R-CNN framework, which improved the extraction of features from small targets [36]. Hu et al. use dynamic sparse self-attention to focus explicitly on weak ship signals across the entire scene, alleviating information dilution and steadily increasing the detection rate of small ships [37]. Although many existing transformer-based ship detectors gain modest performance improvements simply by substituting the transformer backbone, their back-end stages still adopt the conventional CNN candidate-generation and suppression pipeline. As a result, the hybrid architecture offers limited robustness gains and fails to markedly improve detection of small targets.
End-to-end transformer detectors constitute a new paradigm for object detection. The DETR and its variants employ an encoder–decoder transformer to reformulate object detection as a direct set-prediction task, thereby eliminating handcrafted components [27]. The baseline DETR architecture exhibits limitations in convergence speed, cross-scale feature aggregation, and fine-grained representation, prompting subsequent research to focus primarily on these aspects [38]. Deformable DETR introduces deformable sampling within the self-attention module and focuses on a sparse set of key positions around reference points, which reduces the computational load of the network [39]. DeNoising DETR (DN-DETR) [40] integrates a query denoising mechanism into the training process, reducing the difficulty of matching and significantly accelerating convergence. Leveraging these advancements, DETR with Improved deNoising anchOr boxes (DINO) [41] integrates contrastive denoising, hybrid query initialization, and the look-forward-twice strategy, thereby surpassing CNN-based detectors in accuracy for the first time. The advent of high-performance DINO-style detectors establishes the practical relevance of end-to-end transformer architectures for SAR ship detection. Recent studies therefore concentrate on devising solutions that address the specific characteristics of SAR ship targets. Orientation Enhancement and Group Relations DETR (OEGR-DETR) [26] encodes rotation-aware features and employs an improved contrastive loss, thereby achieving better separation of ships from background clutter. Yu et al. embed speckle-constrained filtering, gradient-edge enhancement, and parallel atrous-context fusion into the network, thereby reinforcing noise suppression and multi-scale semantic fusion [42]. Multilevel Denoising DETR (MD-DETR) [43] employs a cascaded three-level denoising design at the pixel, feature, and query stages, effectively attenuating speckle interference while reducing the computational load. These methods uniformly exhibit detection performance superior to general-purpose approaches. However, detection rates for small ships remain suboptimal, particularly in complex scenarios. We attribute this to three factors: first, the granularity of feature extraction is coarse, which is unfavorable for small targets; second, the DETR framework lacks a feature fusion network, whereas feature fusion is crucial for ships with large scale variation; third, the SAR imaging mechanism imparts inherent characteristics to the imagery, yet existing methods lack training strategies tailored to these characteristics.
Motivated by the preceding methods, we propose FANT-Det, a DINO-style detector for detecting small maritime ships. FANT-Det strengthens shallow fine-grained features, aligns semantics across resolutions, and applies a adaptive contrastive denoising strategy, thereby ensuring robust detection of small ships under challenging oceanic conditions.

3. Proposed Method

3.1. Method Overview

To address the challenge of detecting small ships in complex SAR scenes, this paper proposes the FANT-Det framework. The overall architecture is illustrated in Figure 1. The framework builds on the DINO architecture by integrating the NSTB in the feature extraction stage, introducing FADEN as a feature fusion network, and implementing an AM-CDN training strategy within the decoder.
Specifically, the backbone network employs the Swin transformer structure. We select Swin Transformer as the baseline since its hierarchical representation and window-based local attention effectively capture localized ship features in SAR images, aiding small-target detection. In the shallow layers (i.e., the first and second stages), the Swin transformer block is replaced by NSTB, which significantly enriches fine-grained feature representation and suppresses background noise, as detailed in Section 3.2. Feature maps extracted from four hierarchical levels of the backbone are then input to FADEN for fusion. This process achieves precise alignment and complementarity among multi-resolution features while filtering marine clutter, as explained in Section 3.3. Finally, the AM-CDN training strategy adaptively perturbs positive and negative samples based on target scale and local clutter statistics, guiding the decoder to learn more discriminative ship representations, as discussed in Section 3.4.

3.2. Nested Swin Transformer Block

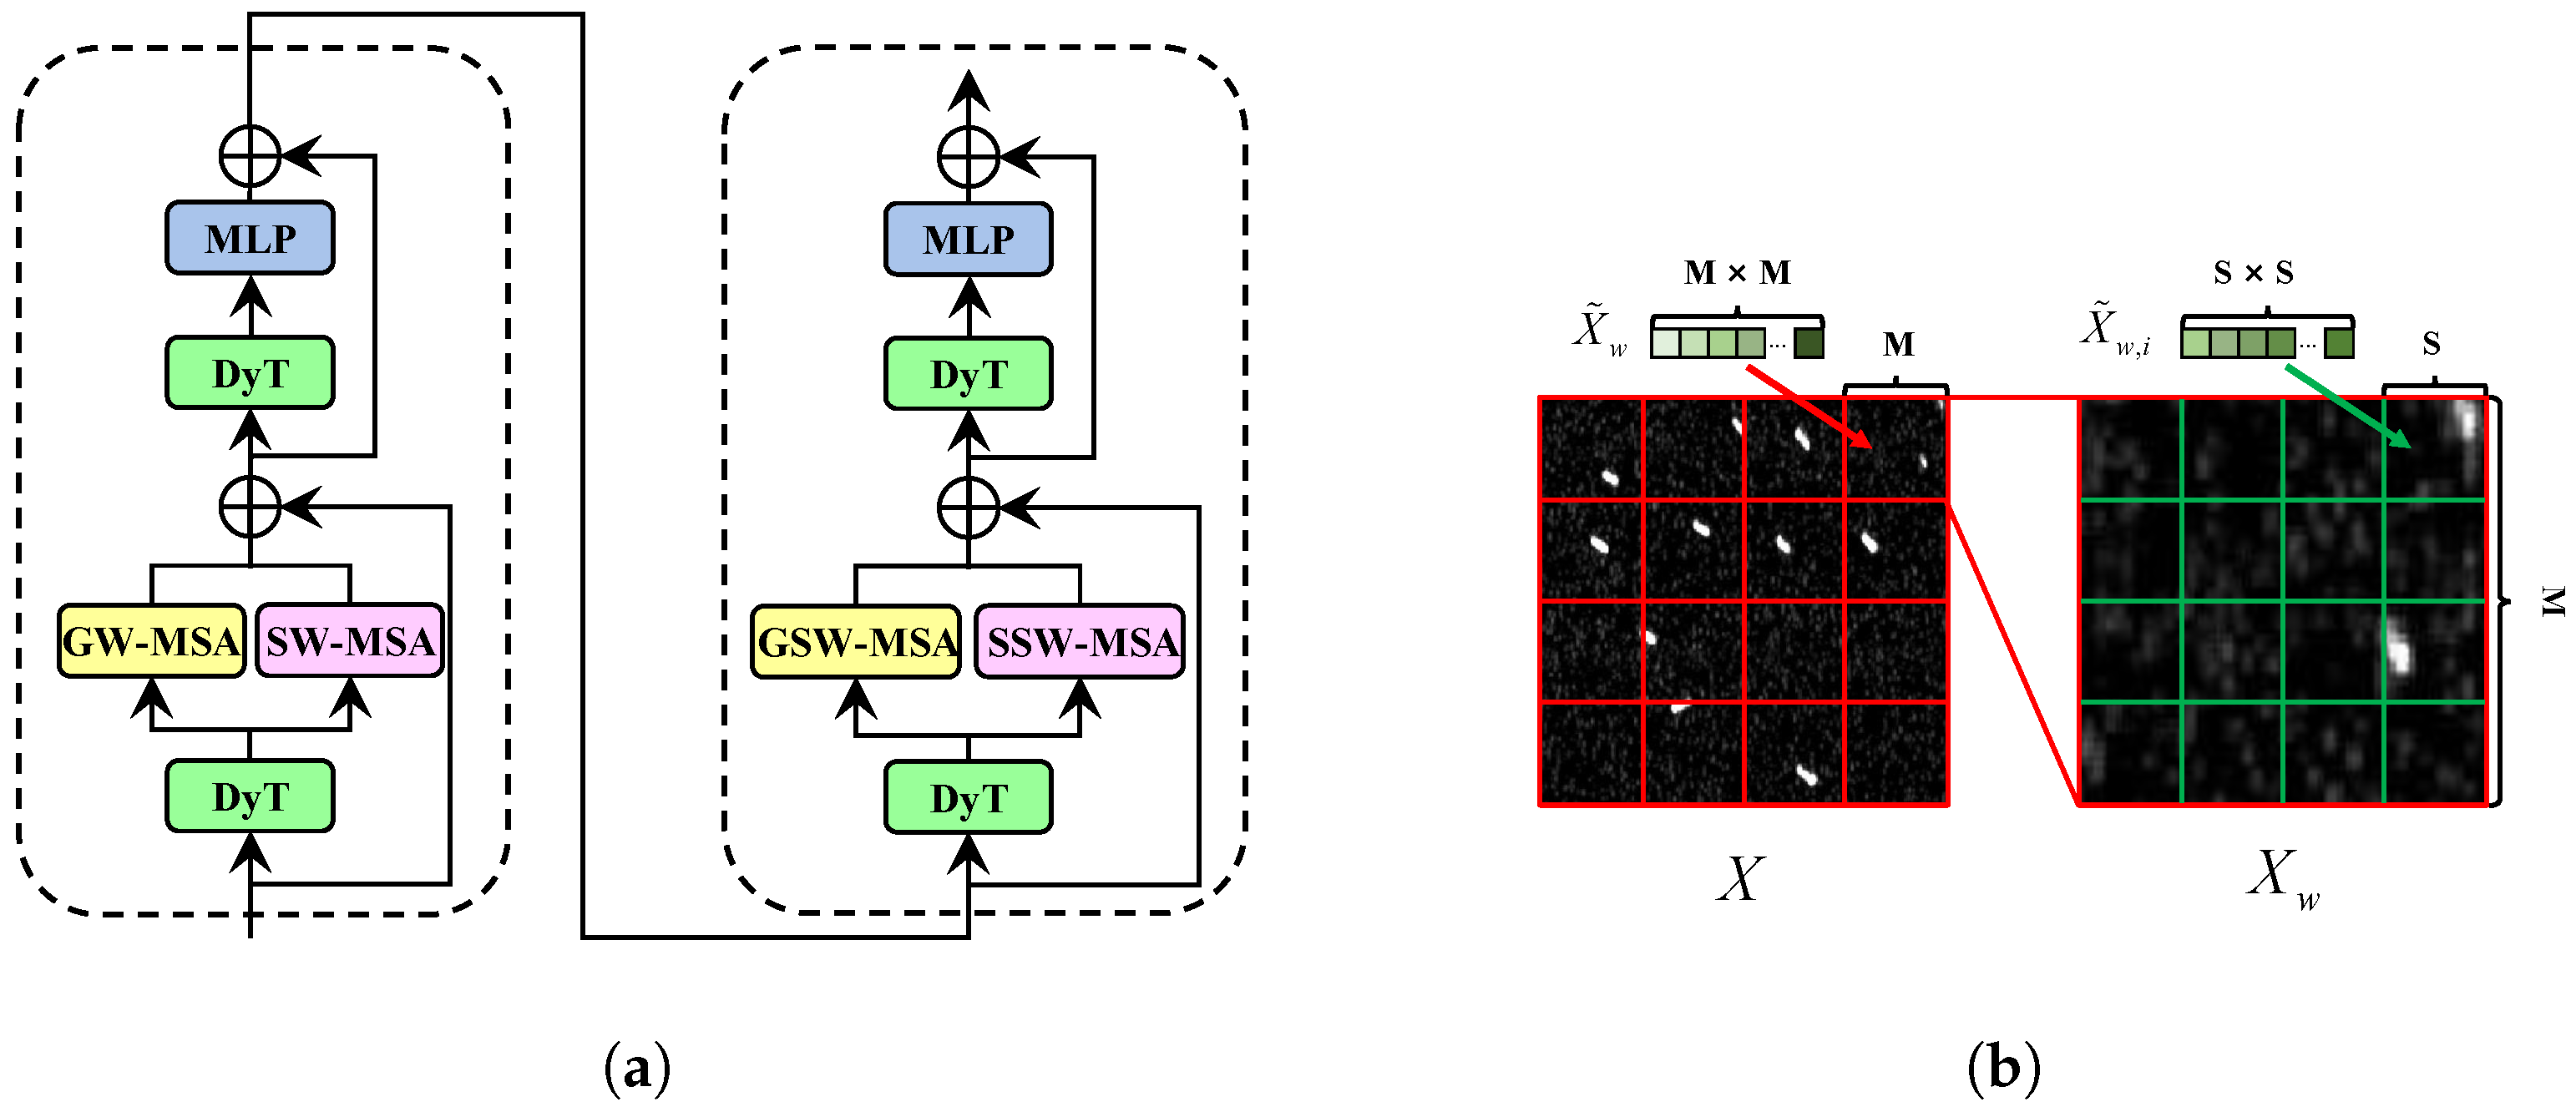
In the standard Swin transformer, each block includes the window-based multi-head self-attention, the layer normalization (LN), and the multi-layer perceptron (MLP). To enhance the fine-grained representation of small-scale ship targets, we propose the NSTB. This approach extends the multi-head self-attention modules of both window-based attention and shifted-window attention into a nested dual-scale self-attention structure. Furthermore, we replace the original normalization layer with Dynamic Tanh (DyT) activation. This choice avoids the per-token statistics of LN and, thereby, reduces overhead. It also uses a tanh-shaped nonlinearity to suppress speckle and clutter outliers, yielding more reliable attention weights. The core idea is to perform dual-scale local self-attention within the same window: First, outer attention over a larger window is used to capture the broader context. Then, inside that window, we partition it into smaller sub-windows for finer-grained feature modeling. Finally, the two granularities of attention are combined to produce feature representations of enhanced richness. Considering that deeper layers lose detailed spatial information, we apply the Nested Swin Transformer Block only in the shallow stages (i.e., Stage 1 and Stage 2), and retain the original Swin transformer block in the deeper stages (i.e., Stage 3 and Stage 4). Figure 2a presents an overview of the structure of the proposed NSTB.
Specifically, let the feature map obtained after patch partition and linear embedding (i.e., the input to the NSTB) be X R H × W × C , where H × W is the spatial size and C is the channel dimension. The feature map X is partitioned into a collection of non-overlapping square windows of size M × M (i.e., local sub-feature maps); this set is denoted by W , and w W indexes a specific window with tensor X w R M × M × C . We then flatten the M × M spatial grid of X w into a length- M 2 token sequence via flat ( · ) , yielding X w flat flat ( X w ) R M 2 × C . To replace the normalization layer, we apply a DyT activation to each window before splitting into the two attention branches. The DyT operation is defined as
f ( x ) = γ tanh ( α x ) + β ,
where α is a learnable scaling factor, and γ and β are learnable parameters analogous to those in LN. Let X ˜ w = f ( X w flat ) denote the pre-processed tokens for window w. This X ˜ w is then fed into the Global Window-based Multi-head Self-Attention (GW-MSA) and the Sub-Window-based Multi-head Self-Attention (SW-MSA) for attention.
For the input X ˜ w to GW-MSA, we compute self-attention over all M 2 tokens of the window. We first project the tokens to query, key, and value embeddings using learnable matrices W Q , W K , W V R C × d :
Q = X ˜ w W Q , K = X ˜ w W K , V = X ˜ w W V .
We then compute scaled dot-product attention:
A = Softmax Q K d V ,
where d denotes the dimensionality of each attention head. The computation is carried out independently for each head, and the resulting vectors are concatenated to form the GW-MSA output. We denote the output of attention as Y w ( outer ) R M 2 × C . Before fusion, we reshape Y w ( outer ) back to the M × M spatial window shape for consistency with the SW-MSA output.
SW-MSA operates directly in the flattened token space for the input X ˜ w . Let M = N × S and let { Ω i } i = 1 N 2 be disjoint index sets with | Ω i | = S 2 that partition { 1 , , M 2 } according to the canonical rasterization of the M × M window into N × N sub-windows of size S × S . For each i, the sub-window token sequence is obtained by gathering rows of X ˜ w indexed by Ω i :
X ˜ w , i P Ω i X ˜ w R S 2 × C ,
where P Ω i { 0 , 1 } S 2 × M 2 is the corresponding selection operator; thus, X ˜ w , i represents the pre-processed tokens belonging to sub-window i. Figure 2b schematically illustrates the correspondence between the M × M window and its S × S sub-windows, clarifying how the window-level token sequence X ˜ w is partitioned into the sub-window sequences X ˜ w , i . Queries, keys, and values for sub-window i are then computed with independent projection matrices W Q , W K , W V R C × d that are distinct from those used in the SW-MSA:
Q i = X ˜ w , i W Q , K i = X ˜ w , i W K , V i = X ˜ w , i W V .
We then compute the self-attention for sub-window i:
A i = Softmax Q i K i d V i ,
producing an output for each sub-window. By reconstructing all sub-window outputs back to their original positions within the M × M window, we obtain the SW-MSA output for window w, denoted as Y w ( inner ) R M 2 × C .
Finally, we fuse the GW-MSA and SW-MSA outputs by simple addition:
Y w ( fused ) = Y w ( outer ) + Y w ( inner ) ,
where Y w ( fused ) R M 2 × C represents the combined attention output for window w. Then, the fused output Y w ( fused ) is reshaped to M × M × C and added to the original input X w flat via a residual connection, yielding the enhanced window features
Z w = Y w ( fused ) + X w flat ,
and Z w undergoes a single DyT operation and is then passed to the MLP to produce
Z w = MLP ( Z w ) .
Z w and Z w are added to produce the output of the window-based multi-head self-attention. The outputs of all windows are then concatenated and reassembled into the complete feature map, which feeds subsequent network stages. Following each standard block, a block with shifted window-based multi-head self-attention is applied, mirroring the Swin transformer design. This block differs from the standard block only by shifting the feature map by M / 2 and applying masking at window boundaries. This modification does not affect the integration of nested attention, and the procedure remains identical to the standard module described above. For each block, all attention operations are restricted to local regions, which keeps the complexity increase modest. In addition, the substitution of layer normalization with DyT yields further reductions in the computational cost.

3.3. Flow-Aligned Depthwise Efficient Channel Attention Network

We design the FADEN as the feature-fusion backbone. It promotes cross-scale feature fusion and mitigates the detection difficulty arising from pronounced variations in ship scale and morphology.
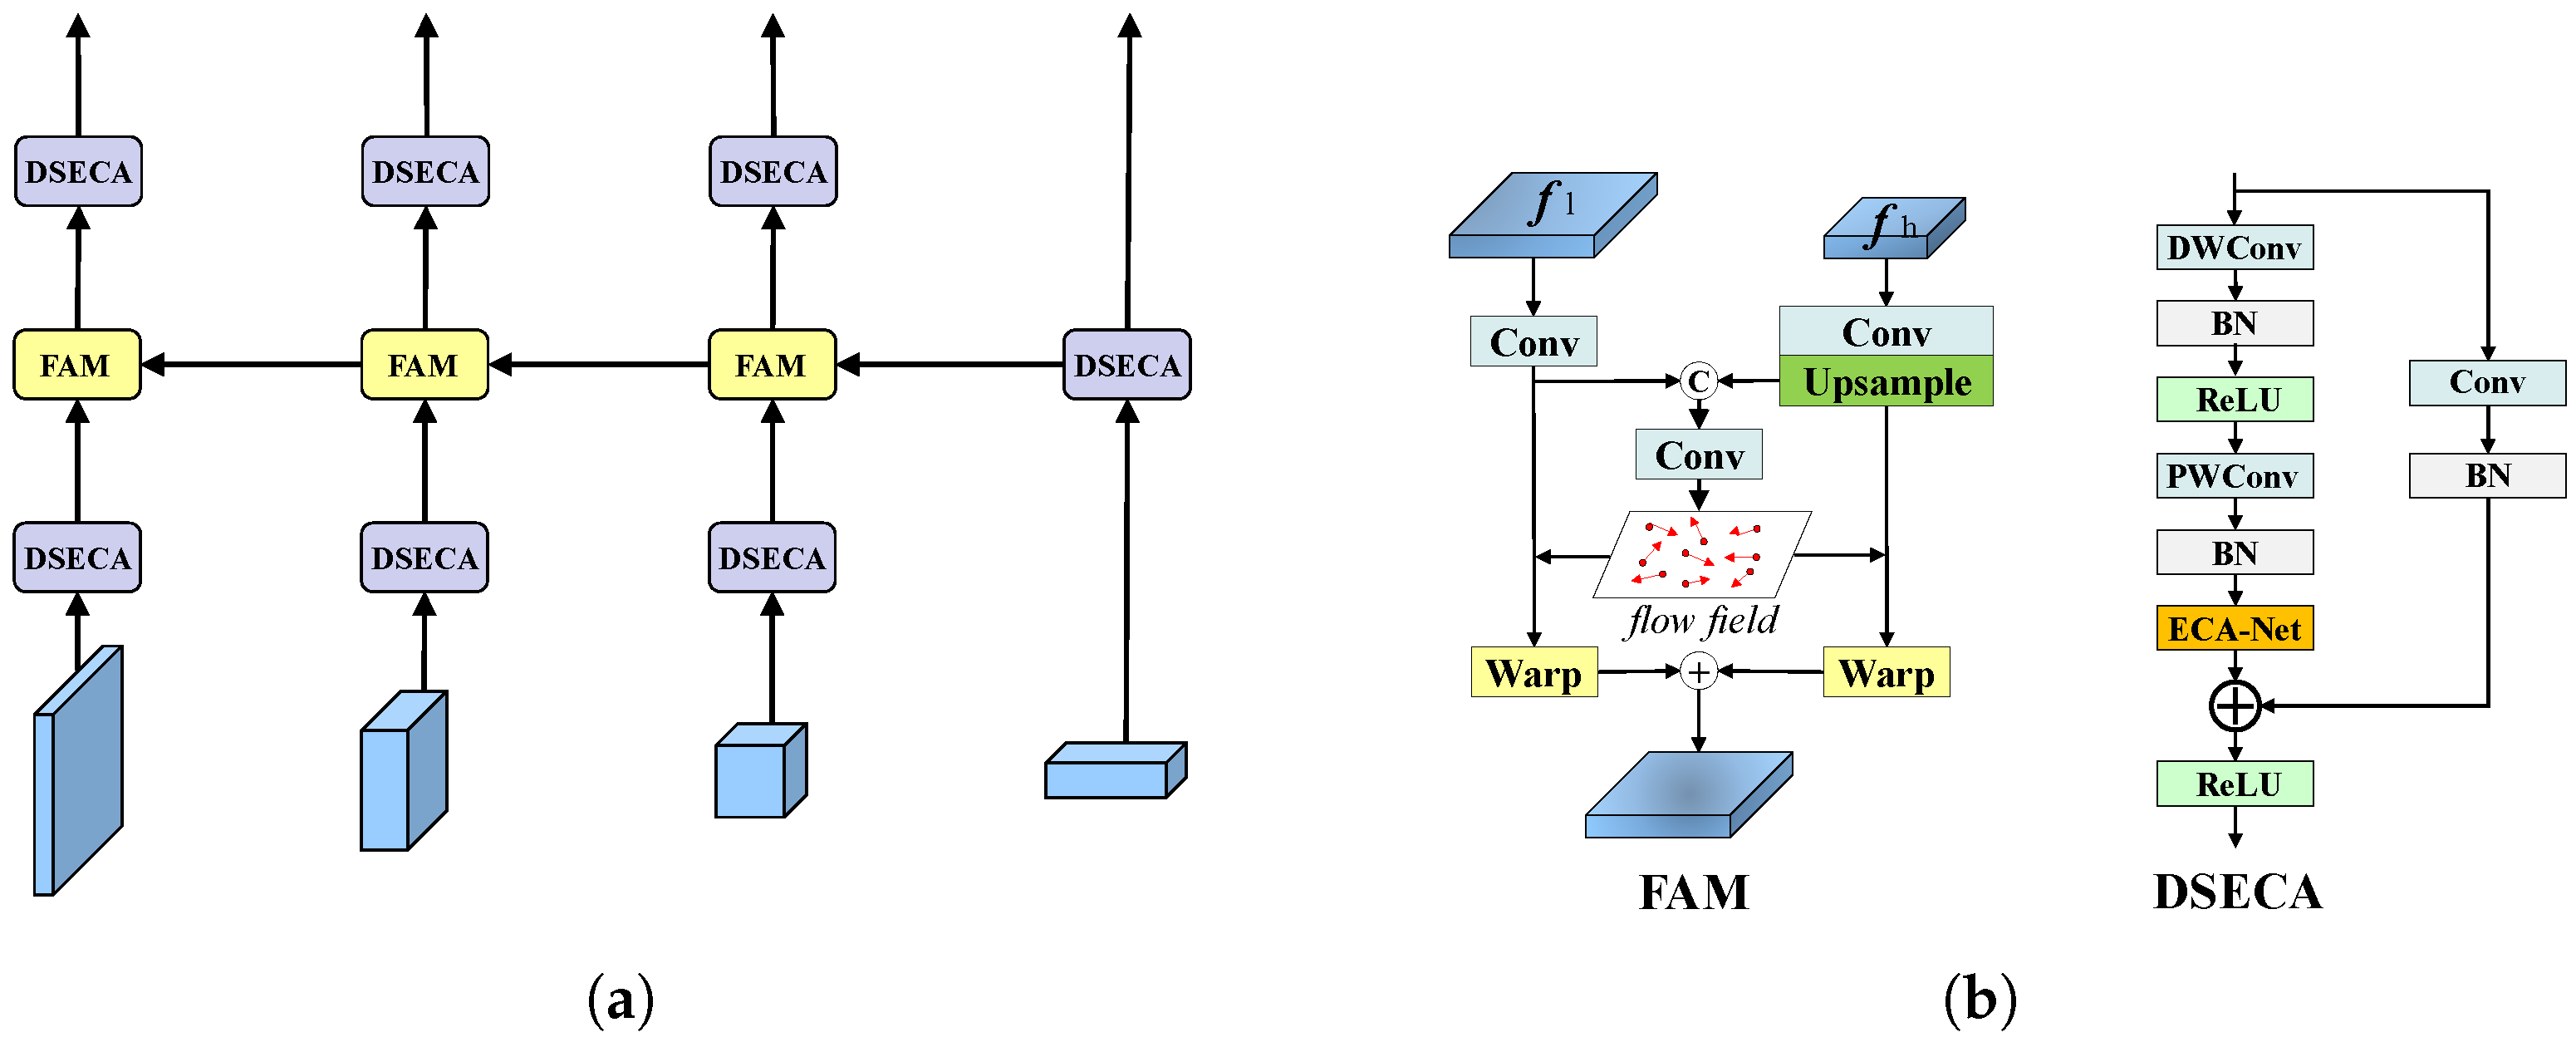
To obtain finer representations, we insert a Flow Alignment Module (FAM) between the feature maps of different resolutions. FAM produces precise semantic flow fields that guide alignment and remove spatial offsets among multi-scale feature maps. We also introduce a Depthwise Separable Efficient Channel Attention (DSECA) block for channel transformation and feature refinement. The combined use of FAM and DSECA forms a flow-aligned aggregation network that delivers high-quality multi-scale fusion.
Figure 3a depicts the overall structure of FADEN. FADEN first applies a DSECA block to the multi-scale features from four levels for channel adjustment and lightweight recalibration, effectively replacing the conventional 1 × 1 projection used for channel alignment. Using the semantic flow estimated by FAM, alignment across scales is performed and the features are fused in a progressive manner, replacing the summation operator in a standard feature pyramid network (FPN) with flow-based warping and aggregation. Following fusion, each scale branch passes through another DSECA for channel refinement, resulting in outputs at four native resolutions with a consistent channel dimension. The outputs are spatially flattened and provided as inputs to the Transformer Encoder.
Figure 3b illustrates the architectures of the FAM and the DSECA. FAM takes two feature maps at different resolutions, the high-level low-resolution f h and the low-level high-resolution f l . After upsampling to a common spatial size, the maps are concatenated and processed by a lightweight 3 × 3 convolutional head to predict bidirectional semantic flow fields (i.e., pixel-wise offset maps). These flows encode the spatial shifts needed to align the two maps across scales. Alignment of the feature maps is performed by a warp operation driven by the semantic flow. The two aligned maps are finally fused by element-wise summation to integrate contextual information across scales. The DSECA block is composed of four lightweight operators: the depthwise convolution (DWConv), the pointwise convolution (PWConv), the batch normalization (BN) layer, and the Efficient Channel Attention Network (ECA-Net). It adjusts the channel dimension of the input feature map and employs attention to emphasize salient channels. A residual connection generates the output feature map. The design sustains high accuracy while incurring a lower computational cost than a conventional residual block (RB).
After all semantic alignments, high-level semantics complement low-level details. This synergy compensates for the lack of precise semantics in shallow feature maps and yields finer-grained representations.

3.4. Adaptive Multi-Scale Contrastive DeNoising

Contrastive Denoising (CDN) injects perturbed positive and negative samples to solve the slow convergence and duplicate detection problems in DETR-based networks. However, in SAR ship imagery, targets exhibit much greater scale variations and are subject to more complex background noise. As a result, indiscriminate perturbation injection is highly limited, since different targets under different conditions have entirely different sensitivities to disturbances. To remedy this imbalance, we propose AM-CDN.
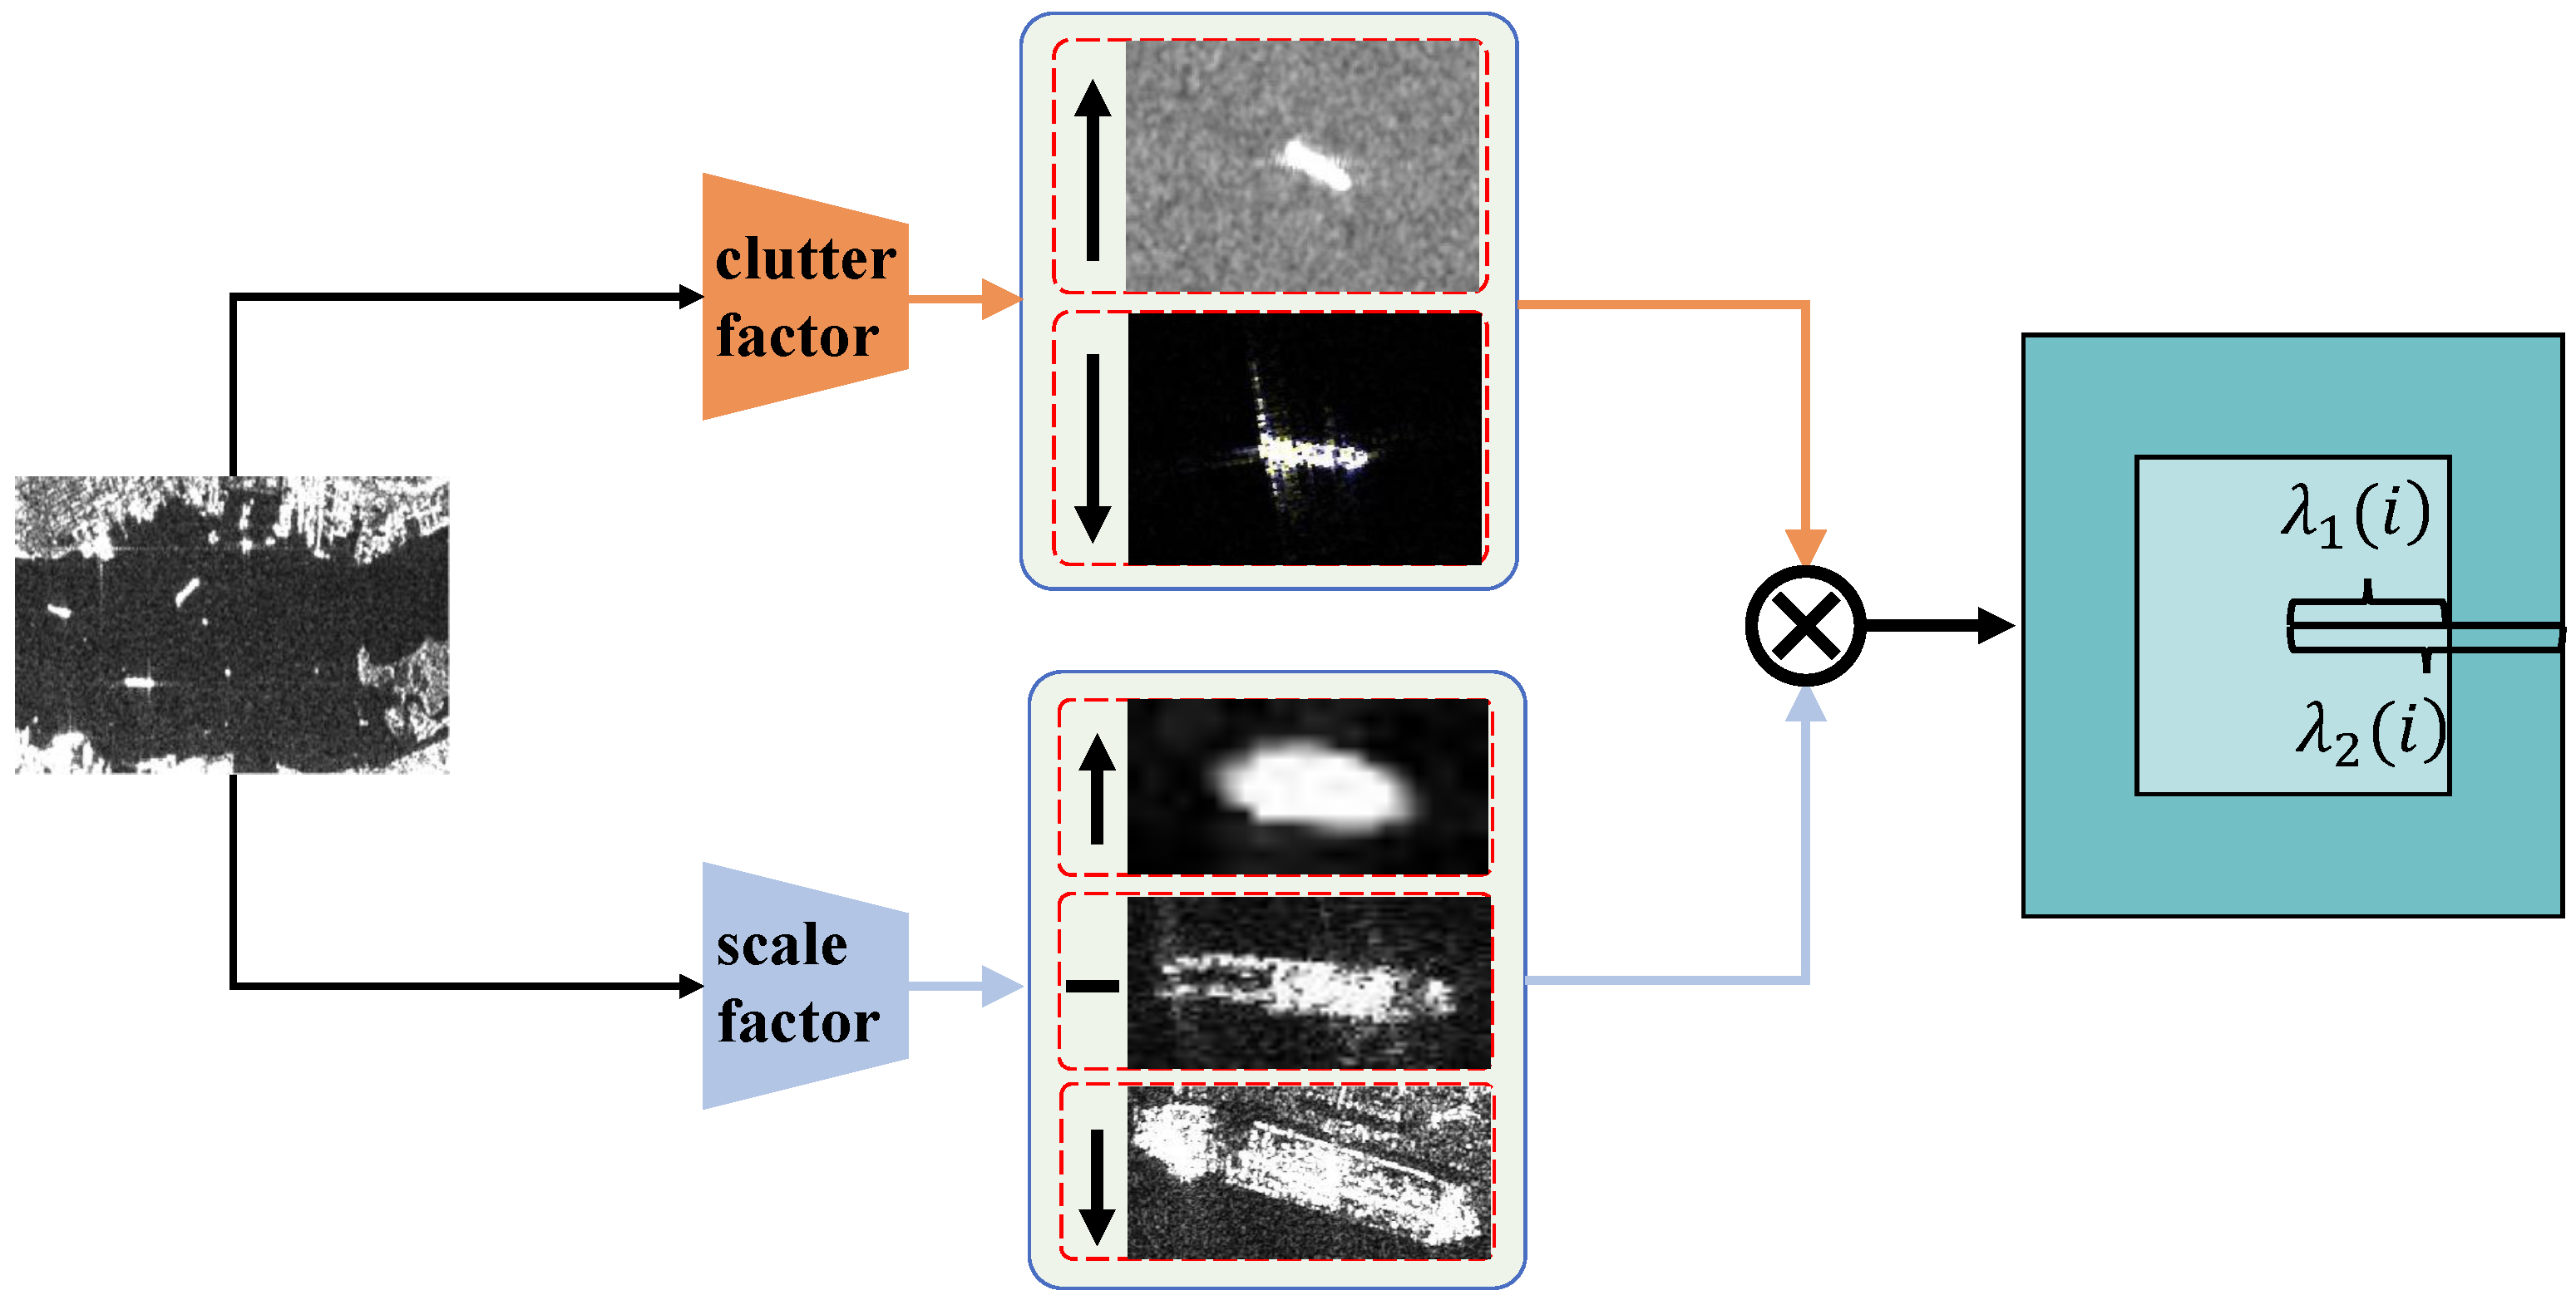
As shown in Figure 4, AM-CDN replaces the fixed CDN threshold with an adaptive threshold given by the product of a scale factor and a clutter factor. For each target-size level, the scale factor is computed from the target size normalized by the corresponding level stride. For each location, the clutter factor reflects local speckle and sea clutter intensity. Together, they modulate the denoising strength without additional supervision to account for scale variation and clutter.
First, denote the set of all ground-truth bounding boxes in the original SAR images by { b i } , where each box is parameterized by its center coordinates and its width and height ( x i , y i , w i , h i ) . We compute the diagonal length of each ground-truth box b i as follows:
S i = w i 2 + h i 2 ,
and we then divide targets into three categories according to their diagonal lengths. For each category, λ 1 s ( i ) and λ 2 s ( i ) denote the multi-scale noise-threshold parameters for positive and negative samples, respectively, which are set independently for targets of different scales. This distinction arises because ship targets of different scales in SAR images exhibit varying robustness against perturbations. Small targets occupy only a few key pixels on the feature map and are easily overwhelmed by speckle noise and clutter; hence, their bounding-box perturbations must be constrained to maintain a high IoU and avoid feature loss. Large targets may present blurred edges, yielding localization errors. Consequently, larger perturbations are used to create a richer set of misaligned negative samples. This encourages the model to classify even extreme deviations as background. The corresponding thresholds for the different scale intervals are as follows:
( λ 1 s ( i ) , λ 2 s ( i ) ) = ( θ 1 S , θ 2 S ) , s i < 45 , ( θ 1 M , θ 2 M ) , 45 s i < 90 , ( θ 1 L , θ 2 L ) , s i 90 .
Here, θ 1 S and θ 2 S are the parameter values for small-scale targets; θ 1 M and θ 2 M for medium-scale targets; and θ 1 L and θ 2 L for large-scale targets. The thresholds defining small-, medium-, and large-scale intervals are determined according to the COCO standard.
Then, we measure the intensity fluctuations of sea-surface clutter or speckle at the ground-truth box locations. Due to the SAR imaging mechanism, clutter features (e.g., sea waves, scatterers) exhibit local spatial correlation. Therefore, for each ground-truth box b i with center ( x i , y i ) , an annular region is extracted. The inner radius is m a x ( w i , h i ) to avoid contamination from the backscatter of the target, and the outer radius is 1.5 × max ( w i , h i ) to capture the relevant local clutter correlation. We compute the mean intensity μ i and standard deviation σ i of the pixels in this region; hence, we obtain the coefficient of variation:
CV i = 2 exp σ i μ i + ε ,
where ε is a small positive constant (e.g., 10 6 ). The coefficient of variation (CV) is a key metric characterizing the texture fluctuations of sea-surface clutter and quantifying the stability of background clutter in the target region. CV i represents the coefficient of variation corresponding to the ground-truth box b i . CV i adapts to local image information: higher CV values indicate more severe clutter fluctuations and more pronounced speckle noise.
Accordingly, we define the clutter-noise threshold parameters for positive and negative samples as follows:
( λ 1 c ( i ) , λ 2 c ( i ) ) = k pos CV i , k neg CV i , k neg > k pos > 0 ,
where k pos and k neg are the clutter-noise constants for positive and negative samples, respectively.
Finally, by combining the multi-scale noise thresholds λ s with the clutter-noise thresholds λ c , we obtain the final noise thresholds for perturbation injection:
( λ 1 ( i ) , λ 2 ( i ) ) = λ 1 s ( i ) λ 1 c ( i ) , λ 2 s ( i ) λ 2 c ( i ) .
Based on the above, we generate perturbed query samples and impose the following supervision. The noise scale is controlled by two hyperparameters λ 1 and λ 2 , which define the permissible perturbation range. Specifically, when generating a perturbation Δ , we require
| Δ | < λ 1 , for positive samples , λ 1 < | Δ | < λ 2 , for negative samples .
For positive samples, we apply an L 1 loss together with the GIoU loss to guide bounding-box regression, and we use focal loss for classification supervision so that predictions better match the ground truth. For negative samples, we also use focal loss on the classification branch, but with the target label set to background, thereby suppressing false matches.

4. Experiments and Discussion

4.1. Datasets

We evaluate FANT-Det on three publicly available SAR-ship datasets: the SAR Ship Detection Dataset (SSDD) [44], the High-Resolution SAR Images Dataset (HRSID) [45], and the Large-Scale SAR Ship Detection Dataset-v1.0 (LS-SSDD-v1.0) [46]. These datasets differ in resolution, scene context, and ship scale, providing a comprehensive benchmark for small ship detection.
SSDD constitutes the first publicly released benchmark dedicated to SAR-based ship detection. The dataset comprises 1160 single-look SAR images acquired by RadarSat-2, TerraSAR-X, and Sentinel-1, spanning ground resolutions from 1 m to 15 m. All scenes were collected around Yantai and Visakhapatnam, thereby providing data for both cluttered in-port (i.e., inshore) and open-sea (i.e., offshore) environments. Recent re-labeled statistics reveal a pronounced scale imbalance: the mean ship footprint is approximately 35 × 35 pixels, and more than 80 % of ships occupy fewer than 10 3 pixels (i.e., ships usually occupy <4% of the host image area). The sparsity of targets makes SSDD one of the de facto standards for benchmarking small ship detection methods on SAR images.
HRSID is a large-scale benchmark expressly created for ship detection and instance-level segmentation in SAR imagery. It offers 5604 image chips of 800 × 800 pixels, extracted from 136 wide-swath scenes collected by several spaceborne sensors. The imagery provides ground resolutions of 0.5 m, 1.0 m, and 3.0 m, and it encompasses both coastal-port environments and open-sea areas. The dataset produces a total of 16,951 annotated ship instances, including 9242 small ships. This makes it ideal for assessing performance on small-object detection. In total, 65% of the images are placed into the training set and 35% of the images into the test set.
LS-SSDD-v1.0 is a recent large-area SAR dataset targeting small ship detection in wide-swath images. It comprises 15 Sentinel-1 IW-mode scenes. Each scene measures approximately 24,000 × 16,000 pixels and spans a swath of about 250 km. These scenes cover diverse maritime environments, including open sea, straits, ports, and shipping lanes. For training convenience, each large image is uniformly tiled into 600 sub-images of size 800 × 800 pixels. Following the LS-SSDD protocol, the first 10 scenes form the training set and the last 5 scenes form the test set. LS-SSDD is challenging because it emphasizes very small ships against vast pure-ocean backgrounds, reflecting realistic wide-area monitoring conditions.
The public releases of SSDD, HRSID, and LS-SSDD-v1.0 do not provide standardized per-image metadata for incidence angles, meteorological conditions, or area of interest (AOI) coordinates. Therefore, we follow the official splits and report dataset-level results, with inshore stratification where applicable. The combination of three datasets covers a wide range of resolutions and ship sizes. Consequently, the performance of the methods can be validated comprehensively. All inshore and offshore scene splits adhere strictly to the official annotations and definitions.

4.2. Implementation Details and Evaluation Metrics

Implementation details. The proposed network is implemented based on the PyTorch (v1.9.0; CUDA 11.1) framework and trained end-to-end on an NVIDIA Quadro RTX 8000 GPU. The input image size is set to 800 × 800 pixels to balance small-object detection and computational efficiency.
We adopt the same training strategy for the three datasets. All experiments adhere to the official training/testing protocols of SSDD, HRSID, and LS-SSDD-v1.0 to ensure comparability. During training, we use the AdamW optimizer with a weight decay parameter of 0.0001 to update network weights after each iteration. The initial learning rate is set to 0.001 and is dynamically adjusted using the Cosine Annealing strategy. In the first 10 epochs, a warm-up strategy is applied, gradually increasing the learning rate from 0.000001 to 0.001, after which it is gradually reduced to 0.000001. Our proposed method and the comparative approaches are trained for a total of 150 epochs, with a batch size of 8. Unless otherwise stated, we do not apply classical speckle filters to inputs. This follows common practice on SSDD/HRSID/LS-SSDD-v1.0 to ensure a fair comparison and train–test consistency.
Evaluation metrics. We use precision ( P ), recall ( R ), F 1-score and average precision (AP) as evaluation metrics for the proposed model. P , R , F 1, and AP are positively correlated with model performance.
Precision ( P ) is defined as the percentage of correctly predicted targets among all predictions, which measures the accuracy of detection. Recall ( R ) quantifies the missed detection rate, representing the percentage of correctly predicted targets among all labeled targets. Their definitions are as follows:
P = TP TP + FP
R = TP TP + FN
where TP denotes true positives, FP denotes false positives, and FN denotes false negatives.
The F 1-score is defined as the harmonic mean of precision and recall:
F 1 = 2 P R P + R
AP is computed as the area under the precision–recall (PR) curve:
AP = 0 1 P ( R ) d R
AP is the average precision at IoU thresholds from 0.50 to 0.95 with a step size of 0.05. AP 0.5 and AP 0.75 are the detection accuracies when the IoU thresholds are equal to 0.5 and 0.75, respectively. APsmall denotes the AP computed on small ship instances only (i.e., area < 32 2 pixels).
Params and FLOPs are chosen to evaluate the computation complexity of models. Params are measured in millions, and the unit of FLOPs is represented by GFLOPs (1 GFLOPs = 10 9 FLOPs).

4.3. Ablation Experiments

As presented in Table 1, the baseline achieves a precision of 80.2% but a recall of only 59.4%, indicating that many targets, especially small ships, are missed despite a relatively low false alarm rate. This produces a low APsmall of 63.3% that highlights the difficulty of the baseline in detecting small ships.
Adding the NSTB dramatically increases the recall score to 70.1% by enhancing fine-grained feature extraction in the early layers. As a result, the F1-score rises to 74.9% and AP to 71.4%. Notably, APsmall increases by nearly 6.8%, confirming that NSTB greatly increases the model’s sensitivity to small ships. The precision stays roughly constant, suggesting that the extra detections from NSTB are mostly true positives. This implies that the dual-scale attention of NSTB is effective at distinguishing small ships from similar clutter, boosting recall without inflating the false alarm rate.
Incorporating the FADEN also yields balanced gains in both precision and recall. With FADEN, precision reaches 83.1% and recall increases to 65.2%, resulting in an F1-score of 73.1% and AP of 70.2%. APsmall improves to 68.6%, an absolute increase of 5.3% compared to the baseline. These results indicate that multi-scale feature alignment and adaptive background filtering help the detector find more targets across scales while reducing background clutter responses. In other words, FADEN achieves balanced gains in precision and recall, effectively boosting the overall detection performance and demonstrating a strong suitability for small-object detection.
The AM-CDN primarily boosts precision. With AM-CDN, precision increases by 4.8%, the highest among single-module ablations, reflecting significantly fewer false positives due to the contrastive noise training strategy. Recall sees only a slight increase to 61.1%, so the F1-score and AP improvements are modest. As expected, APsmall shows a modest improvement because AM-CDN places a greater emphasis on enhancing discrimination in complex clutter. Notably, AM-CDN achieves this precision improvement without incurring any additional model complexity: the parameter count and FLOPs remain unchanged at 48.5 M and 280.1 G, respectively, thereby yielding an efficiency improvement at no additional computational cost.
When combining modules, we observe further performance gains owing to their complementary benefits. The pairwise integration of modules reveals complementary synergies: combining NSTB with FADEN boosts recall without sacrificing precision; pairing NSTB with AM-CDN strengthens overall robustness; and merging FADEN with AM-CDN most effectively mitigates clutter-induced errors. These dual synergies underscore each module’s distinct contribution and pave the way for the superior, balanced performance of the full model.
Finally, the full FANT-Det model achieves the best results across all metrics. It reaches 87.0% precision and 75.5% recall, yielding an F1-score of 80.8%. The AP improves to 75.5%, and APsmall reaches 74.5%, which corresponds to a 9.8% increase in overall AP and a 11.2% increase in APsmall relative to the baseline. These results validate that each component contributes significantly to performance. Furthermore, the observed accuracy gains require only a 10.3% increase in parameter count and an 8.6% increase in the computational cost. The NSTB and FADEN impose minimal overhead, and AM-CDN introduces no additional runtime expense. Ablation studies show that each proposed module addresses a distinct challenge. Together, they render FANT-Det more effective than the baseline for SAR ship detection, particularly when detecting small ships under challenging conditions.
Table 2 further compares the detection performance of NAS-FPN [47], BiFPN [48], ASFF [49] and the proposed FADEN in terms of P , R , F 1-score, AP and APsmall on the SSDD and HRSID datasets. Across both datasets, FADEN delivers the best scores in every metric. In SSDD, FADEN attains an AP of 70.2%, exceeding the second-ranked BiFPN by 1.4%, while its APsmall reaches 68.6%, a further 2.1% ahead of ASFF. In HRSID, FADEN still leads, improving AP by 1.2% over BiFPN and boosting APsmall by 2.2% relative to ASFF. In contrast, although NAS-FPN, BiFPN, and ASFF yield modest improvements, they remain hampered by feature misalignment. Experimental evidence demonstrates that the integration of lightweight attention and semantic flow alignment in FADEN leads to substantial gains in ship detection performance, especially for small-scale targets.

4.4. Algorithm Performance Comparison

The proposed FANT-Det is evaluated against SOTA detectors on the SSDD, HRSID and LS-SSDD-v1.0 benchmark datasets to demonstrate its superior performance. Firstly, extensive experiments assessing detection accuracy are conducted on the SSDD, HRSID and LS-SSDD-v1.0 benchmark datasets. Subsequently, qualitative comparisons in representative scenarios are presented to illustrate the effectiveness of the proposed method. The detection results on three datasets are summarized in Table 3, Table 4 and Table 5, respectively. Intuitively, FANT-Det surpasses the competing detectors in all evaluation metrics across these datasets. Moreover, the performance gains of our approach become even more pronounced for small targets and complex inshore scenes.
In a quantitative comparison with current SOTA methods on the SSDD dataset, FANT-Det achieves improvements of 7.2% overall, 7.9% in AP, an improvement in APsmall on the entire dataset, and 12.4% in AP on the inshore dataset, respectively. On the HRSID dataset, FANT-Det achieves improvements of 3.0% overall, 5.0% in AP, an improvement in APsmall on the entire dataset, and 14.2% in AP on the inshore dataset, respectively. Likewise, on LS-SSDD-v1.0, our model attains the highest P , R , F 1-score with 86.7%, 75.6%, 80.8%, along with an AP0.5 of 82.8% that exceeds the previous best by 1.9%. SSDD comprises a mixture of inshore and offshore scenes. HRSID offers high-resolution imagery containing numerous small ships. LS-SSDD-v1.0 presents wide-area scenes dominated by targets with a low SNR. These dataset characteristics collectively demonstrate the superior generalization capability of the algorithm. “Inshore” denotes coastal and harbor scenes and “Entire” refers to the full official split; LS-SSDD-v1.0 comprises large, wide-swath scenes. FANT-Det attains inshore gains by targeting coastal clutter. NSTB preserves small ship cues and suppresses nearshore clutter. FADEN aligns cross-scale features using semantic flow and refines channels. AM-CDN adapts the denoising margin with target-scale and clutter factors. These components reduce shoreline false alarms and raise small-boat recall, producing larger gains on inshore subsets. These results confirm that the proposed approach delivers SOTA detection performance for small ships, especially in challenging inshore environments.
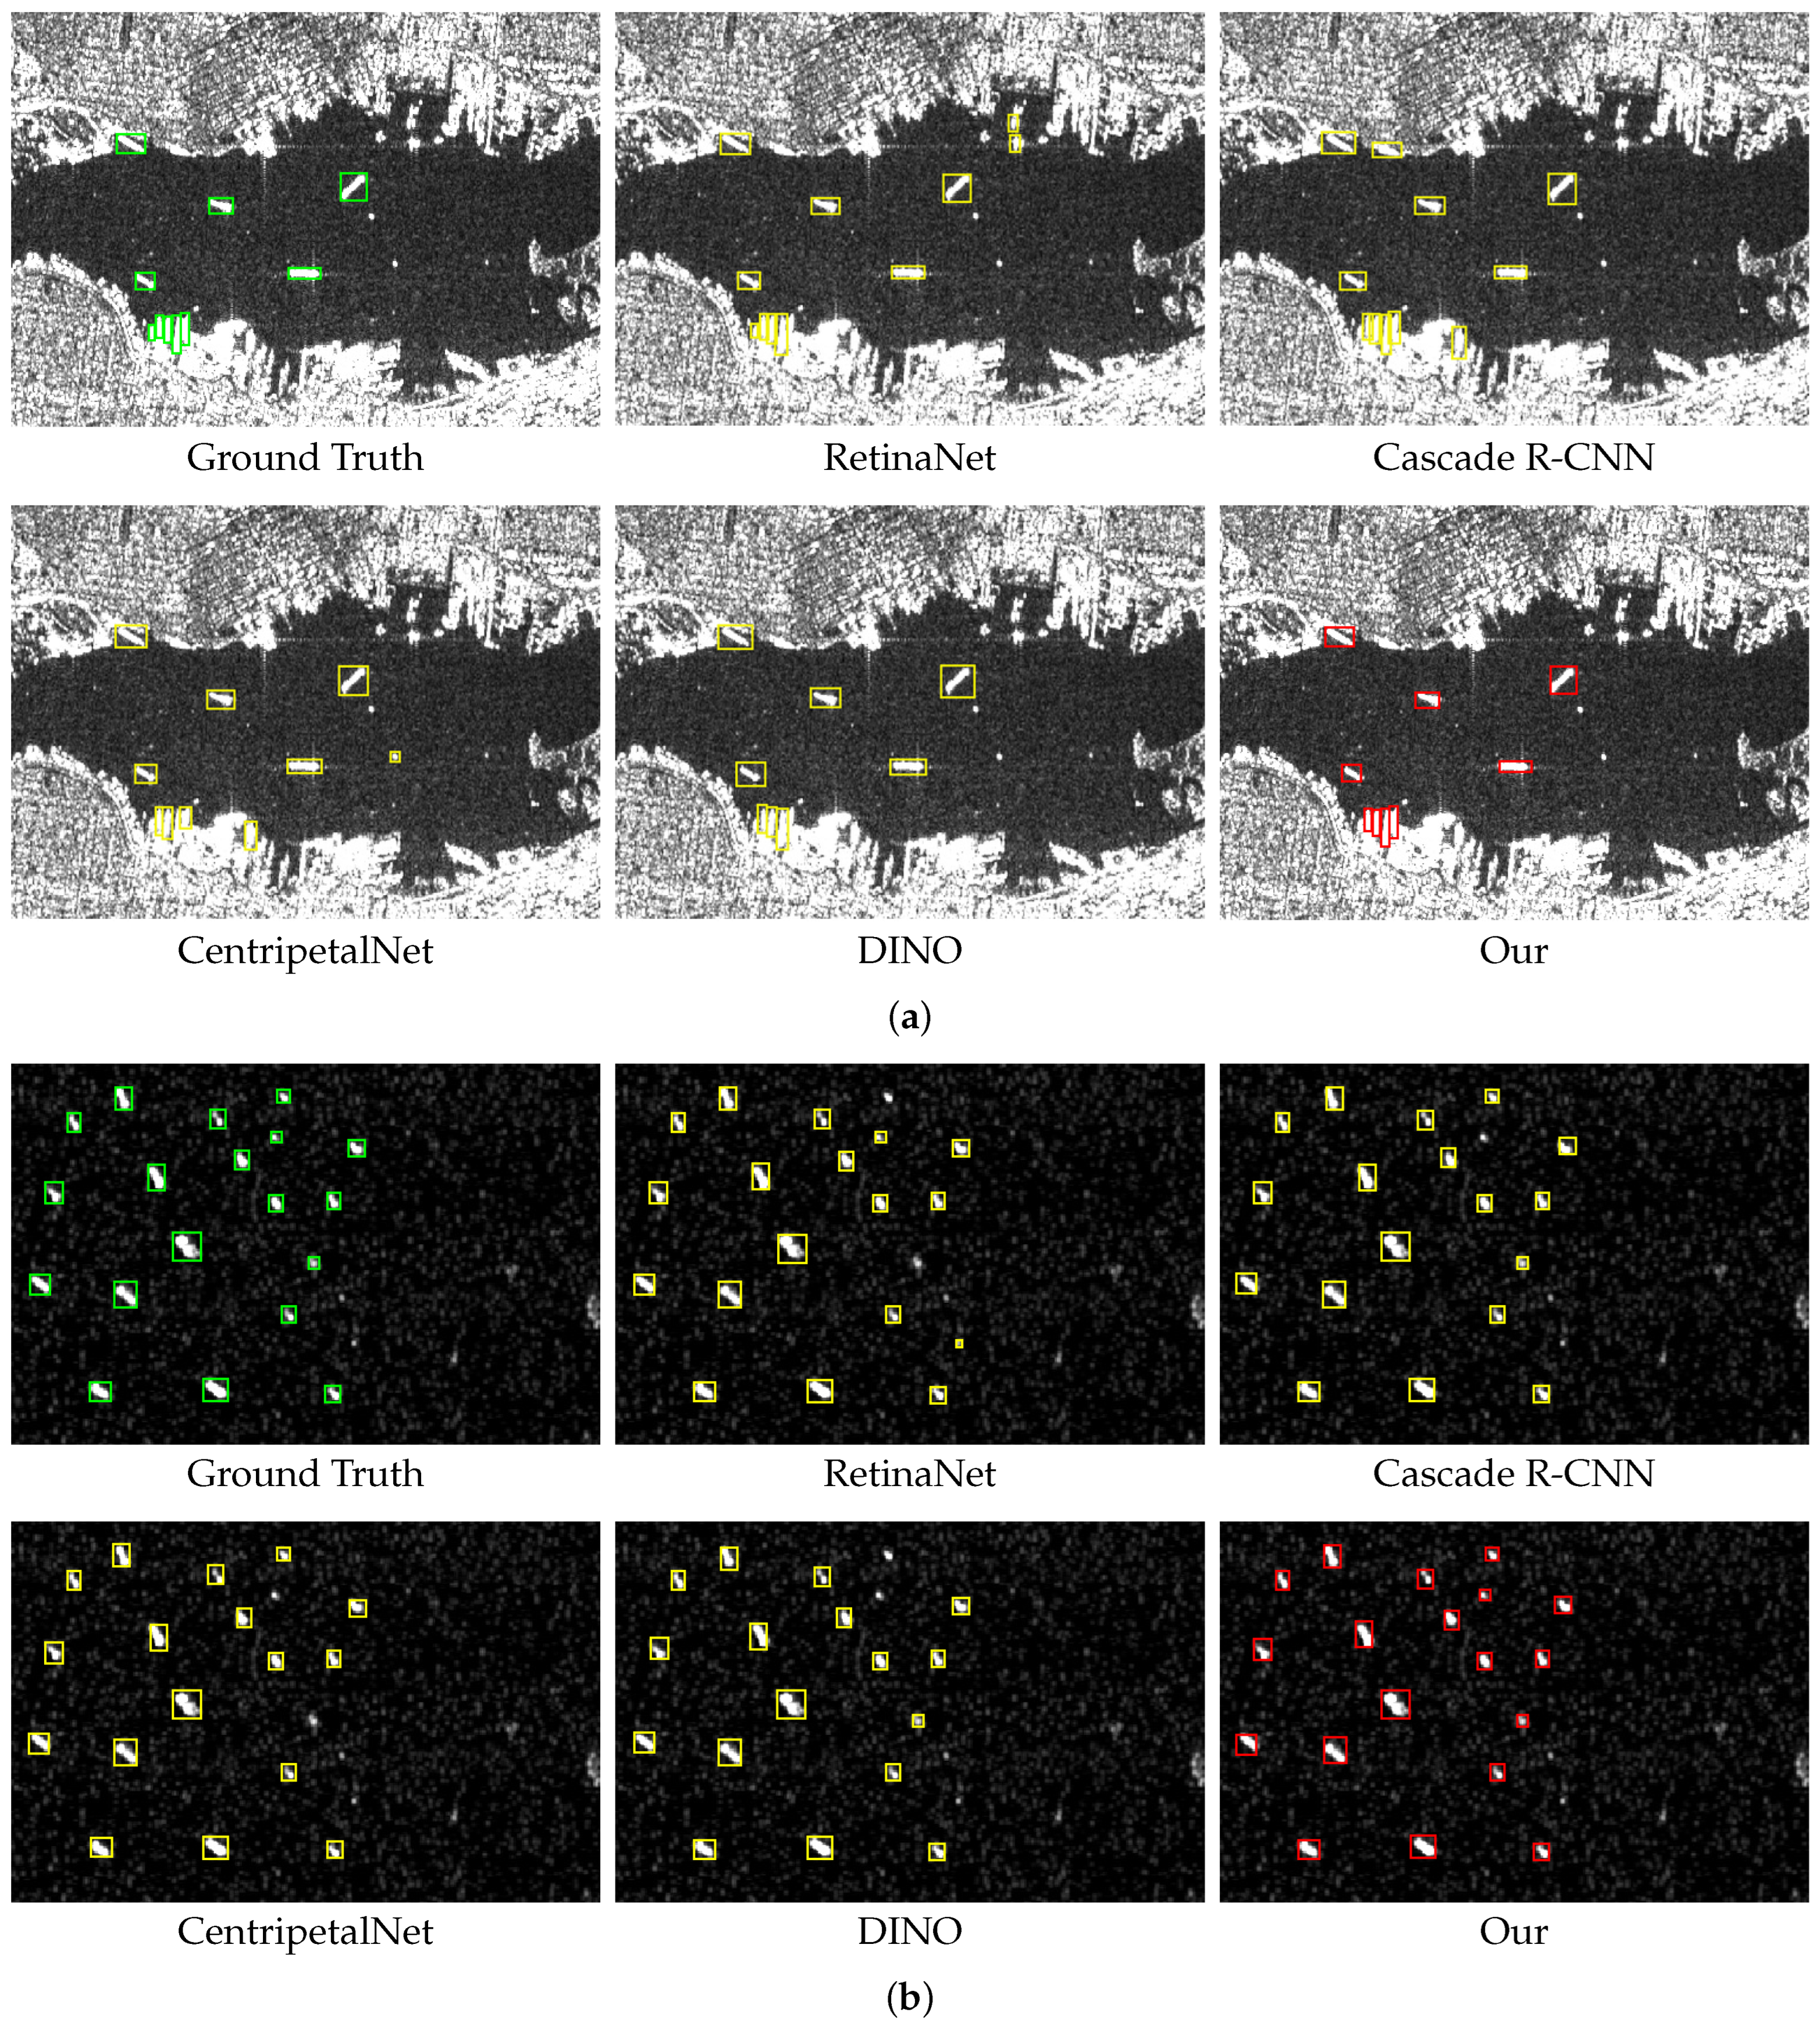
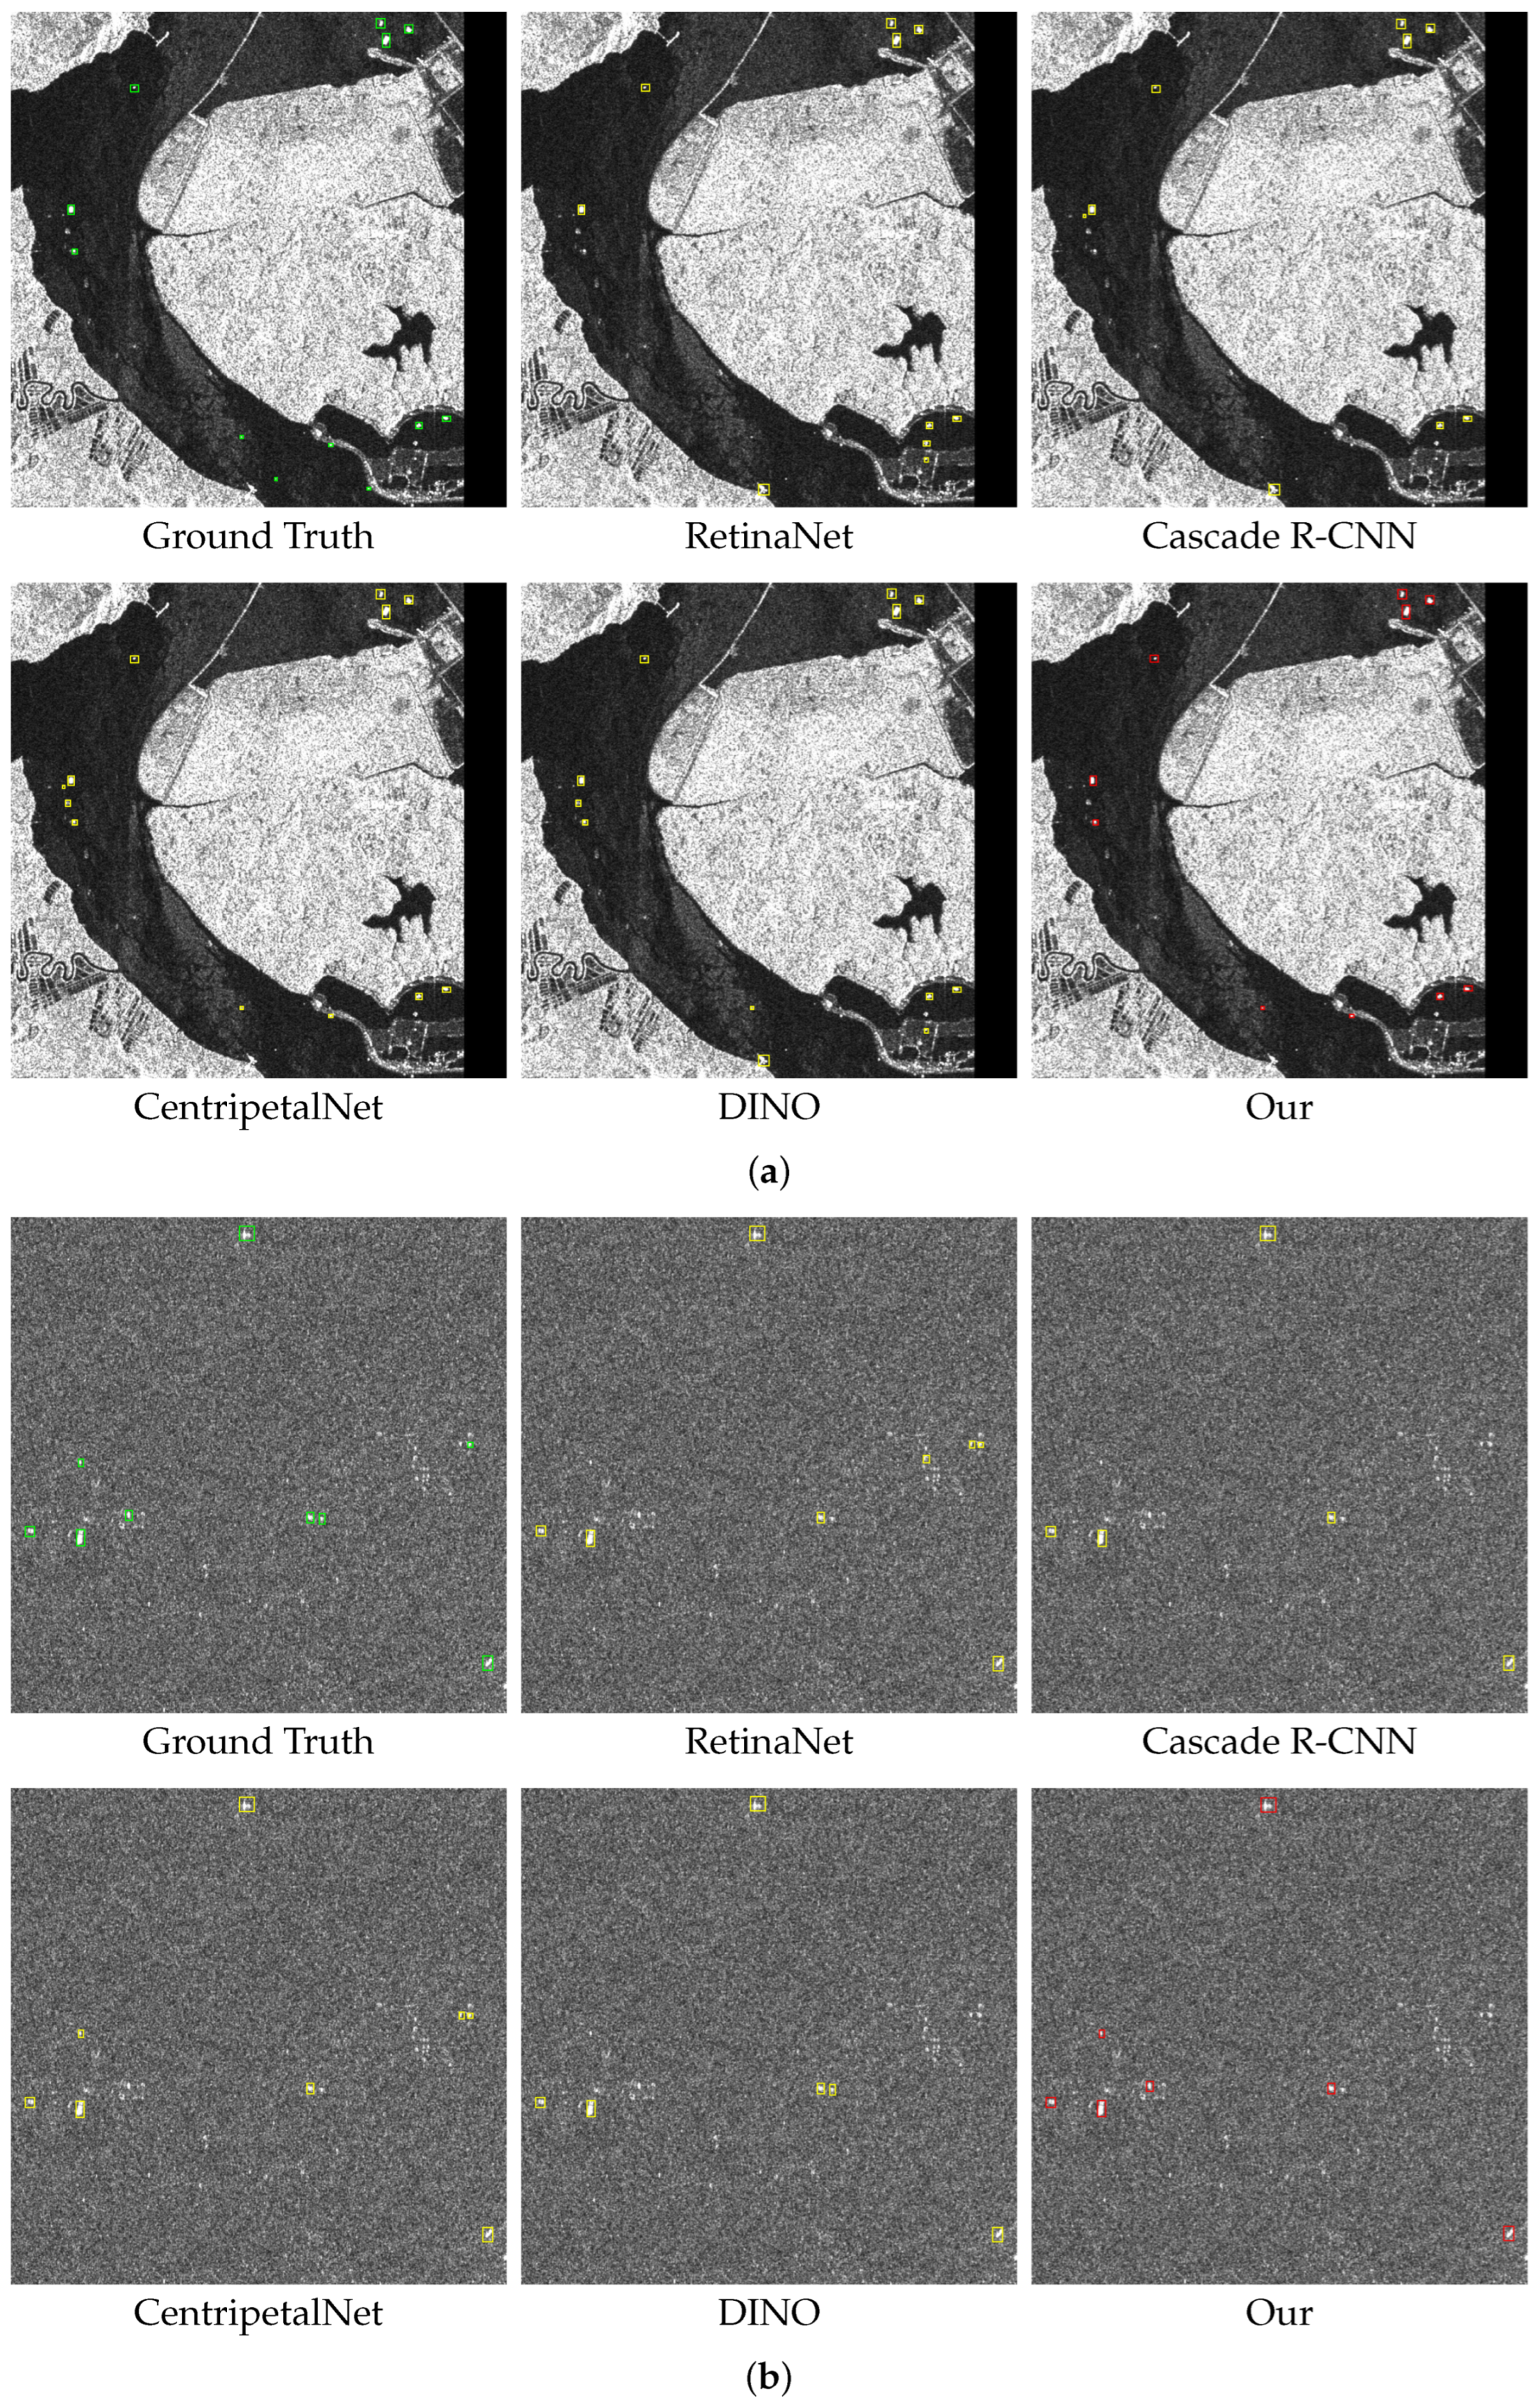
Figure 5a depicts a complex port environment with numerous clutter sources. Existing detectors exhibit both missed detections and false alarms in these scenarios, and Figure 5b shows the visualization results for a scene with heavy sea-clutter interference. In contrast, the proposed network effectively suppresses interference and accurately localizes targets. Figure 6a,b show detection results under inshore and offshore conditions, respectively, in scenarios featuring densely distributed small ships. The proposed method achieves higher precision and yields substantially lower rates of missed detections and false alarms compared to alternative algorithms. Figure 7a and Figure 7b illustrate detection outcomes in large-scale, wide-area images characterized by a low SNR and a reduced ship-to-background ratio, under inshore and offshore settings, respectively. These results demonstrate that the proposed approach can discriminate between ships and background using limited information, with particularly notable improvements for small-scale ship detection in inshore environments.

5. Conclusions

In this paper, we present FANT-Det, an end-to-end transformer framework tailored for precise small ship detection in SAR imagery. We recognize that the prevalence of small targets and the presence of strong speckle/clutter jointly constrain detection performance. To this end, the NSTB enriches fine-grained feature representation, while the FADEN mitigates the feature misalignment problem common to conventional pyramids, thus strengthening multi-scale fusion. Moreover, the AM-CDN strategy guides the network to emphasize scale-aware and clutter-aware cues, yielding a more reliable localization of tiny ships. Experimental results confirm that FANT-Det delivers SOTA performance on the SSDD, HRSID and LS-SSDD-v1.0 datasets. Evaluations under inshore conditions underscore the robustness of the framework in complex coastal environments. Results on the LS-SSDD-v1.0 dataset further validate its detection capability in wide-area scenarios.
Despite these advances, the proposed method retains room for improvement under extreme conditions. Under a very low SNR with strong speckle and sea clutter in SAR imagery, small ships can be masked, lowering recall. Future work will examine multimodal data fusion to add complementary cues when available. Lightweight network design will also be pursued to improve real-time processing.

Author Contributions

Conceptualization, H.L.; Methodology, H.L.; Software, H.L.; Validation, H.L. and J.H.; Formal analysis, D.W.; Investigation, D.W. and J.H.; Resources, D.W. and X.Z.; Data curation, H.L.; Writing—original draft preparation, H.L.; Writing—review & editing, H.L. and J.H.; Visualization, H.L.; Supervision, X.Z. and D.Y.; Project administration, D.Y. All authors have read and agreed to the published version of the manuscript.

Funding

This research was funded by the National Natural Science Foundation of China (NSFC), grant number 62305088. The APC was funded by the authors.

Data Availability Statement

Publicly available datasets were analyzed in this study—SSDD, HRSID, and LS-SSDD-v1.0 (see Section 4.1 and the cited dataset references). Additional materials (e.g., trained weights and source code) are not publicly available at this time due to institutional policies and confidentiality agreements; they may be shared by the corresponding author upon reasonable request for research purposes.

Conflicts of Interest

The authors declare no conflicts of interest. The funders had no role in the design of the study; in the collection, analyses, or interpretation of data; in the writing of the manuscript; or in the decision to publish the results.

References

  1. Li, J.; Xu, C.; Su, H.; Gao, L.; Wang, T. Deep learning for SAR ship detection: Past, present and future. Remote Sens. 2022, 14, 2712. [Google Scholar] [CrossRef]
  2. Li, J.; Chen, J.; Cheng, P.; Yu, Z.; Yu, L.; Chi, C. A survey on deep-learning-based real-time SAR ship detection. IEEE J. Sel. Top. Appl. Earth Obs. Remote Sens. 2023, 16, 3218–3247. [Google Scholar] [CrossRef]
  3. Sun, Z.; Leng, X.; Zhang, X.; Zhou, Z.; Xiong, B.; Ji, K.; Kuang, G. Arbitrary-direction SAR ship detection method for multi-scale imbalance. IEEE Trans. Geosci. Remote Sens. 2025, 63, 5208921. [Google Scholar] [CrossRef]
  4. Zhang, H.; Wang, W.; Deng, J.; Guo, Y.; Liu, S.; Zhang, J. MASFF-Net: Multi-azimuth scattering feature fusion network for SAR target recognition. IEEE J. Sel. Top. Appl. Earth Obs. Remote Sens. 2025, 18, 19425–19440. [Google Scholar] [CrossRef]
  5. Galdorisi, G.; Goshorn, R. Bridging the policy and technology gap: A process to instantiate maritime domain awareness. In Proceedings of the OCEANS 2005 MTS/IEEE, Washington, DC, USA, 17-23 September 2005; IEEE: Piscataway, NJ, USA, 2005; pp. 1–8. [Google Scholar]
  6. Deng, J.; Wang, W.; Zhang, H.; Zhang, T.; Zhang, J. PolSAR ship detection based on superpixel-level contrast enhancement. IEEE Geosci. Remote Sens. Lett. 2024, 21, 4008805. [Google Scholar] [CrossRef]
  7. Sun, Z.; Leng, X.; Lei, Y.; Xiong, B.; Ji, K.; Kuang, G. BiFA-YOLO: A novel YOLO-based method for arbitrary-oriented ship detection in high-resolution SAR images. Remote Sens. 2021, 13, 4209. [Google Scholar] [CrossRef]
  8. Yu, J.; Yu, Z.; Li, C. GEO SAR imaging of maneuvering ships based on time–frequency features extraction. IEEE Trans. Geosci. Remote Sens. 2022, 60, 5226321. [Google Scholar] [CrossRef]
  9. Ma, Y.; Guan, D.; Deng, Y.; Yuan, W.; Wei, M. 3SD-Net: SAR Small Ship Detection Neural Network. IEEE Trans. Geosci. Remote Sens. 2024, 62, 5221613. [Google Scholar] [CrossRef]
  10. Zhu, H.; Yu, Z.; Yu, J. Sea clutter suppression based on complex-valued neural networks optimized by PSD. IEEE J. Sel. Top. Appl. Earth Obs. Remote Sens. 2022, 15, 9821–9828. [Google Scholar] [CrossRef]
  11. Chen, Z.; Liu, C.; Filaretov, V.F.; Yukhimets, D.A. Multi-scale ship detection algorithm based on YOLOv7 for complex scene SAR images. Remote Sens. 2023, 15, 2071. [Google Scholar] [CrossRef]
  12. Gierull, C.H.; Sikaneta, I. A compound-plus-noise model for improved vessel detection in non-Gaussian SAR imagery. IEEE Trans. Geosci. Remote Sens. 2017, 56, 1444–1453. [Google Scholar] [CrossRef]
  13. Wang, C.; Jiang, S.; Zhang, H.; Wu, F.; Zhang, B. Ship detection for high-resolution SAR images based on feature analysis. IEEE Geosci. Remote Sens. Lett. 2013, 11, 119–123. [Google Scholar] [CrossRef]
  14. Shi, T.; Gong, J.; Hu, J.; Sun, Y.; Bao, G.; Zhang, P.; Wang, J.; Zhi, X.; Zhang, W. Progressive class-aware instance enhancement for aircraft detection in remote sensing imagery. Pattern Recognit. 2025, 164, 111503. [Google Scholar] [CrossRef]
  15. Hu, J.; Li, Y.; Zhi, X.; Shi, T.; Zhang, W. Complementarity-aware Feature Fusion for Aircraft Detection via Unpaired Opt2SAR Image Translation. IEEE Trans. Geosci. Remote Sens. 2025, 63, 5628019. [Google Scholar] [CrossRef]
  16. Yu, J.; Pan, B.; Yu, Z.; Li, C.; Wu, X. Collaborative optimization for SAR image despeckling with structure preservation. IEEE Trans. Geosci. Remote Sens. 2024, 63, 5201712. [Google Scholar] [CrossRef]
  17. Girshick, R. Fast r-cnn. In Proceedings of the IEEE International Conference on Computer Vision, Santiago, Chile, 7–13 December 2015; pp. 1440–1448. [Google Scholar]
  18. Li, J.; Qu, C.; Shao, J. Ship detection in SAR images based on an improved faster R-CNN. In Proceedings of the 2017 SAR in Big Data Era: Models, Methods and Applications (BIGSARDATA), Beijing, China, 13–14 November 2017; IEEE: Piscataway, NJ, USA, 2017; pp. 1–6. [Google Scholar]
  19. Kang, M.; Ji, K.; Leng, X.; Lin, Z. Contextual region-based convolutional neural network with multilayer fusion for SAR ship detection. Remote Sens. 2017, 9, 860. [Google Scholar] [CrossRef]
  20. Kang, M.; Leng, X.; Lin, Z.; Ji, K. A modified faster R-CNN based on CFAR algorithm for SAR ship detection. In Proceedings of the 2017 International Workshop on Remote Sensing with Intelligent Processing (RSIP), Shanghai, China, 18–21 May 2017; IEEE: Piscataway, NJ, USA, 2017; pp. 1–4. [Google Scholar]
  21. Ren, S.; He, K.; Girshick, R.; Sun, J. Faster R-CNN: Towards real-time object detection with region proposal networks. IEEE Trans. Pattern Anal. Mach. Intell. 2016, 39, 1137–1149. [Google Scholar] [CrossRef] [PubMed]
  22. Redmon, J.; Divvala, S.; Girshick, R.; Farhadi, A. You only look once: Unified, real-time object detection. In Proceedings of the IEEE Conference on Computer Vision and Pattern Recognition, Las Vegas, NV, USA, 27–30 June 2016; pp. 779–788. [Google Scholar]
  23. Zhang, L.; Liu, Y.; Zhao, W.; Wang, X.; Li, G.; He, Y. Frequency-adaptive learning for SAR ship detection in clutter scenes. IEEE Trans. Geosci. Remote Sens. 2023, 61, 5215514. [Google Scholar] [CrossRef]
  24. Zhong, Y.; Wang, J.; Peng, J.; Zhang, L. Anchor box optimization for object detection. In Proceedings of the IEEE/CVF Winter Conference on Applications of Computer Vision, Snowmass Village, CA, USA, 1–5 March 2020; pp. 1286–1294. [Google Scholar]
  25. Bodla, N.; Singh, B.; Chellappa, R.; Davis, L.S. Soft-NMS–improving object detection with one line of code. In Proceedings of the IEEE International Conference on Computer Vision, Venice, Italy, 22–29 October 2017; pp. 5561–5569. [Google Scholar]
  26. Feng, Y.; You, Y.; Tian, J.; Meng, G. OEGR-DETR: A novel detection transformer based on orientation enhancement and group relations for SAR object detection. Remote Sens. 2023, 16, 106. [Google Scholar] [CrossRef]
  27. Carion, N.; Massa, F.; Synnaeve, G.; Usunier, N.; Kirillov, A.; Zagoruyko, S. End-to-end object detection with transformers. In Proceedings of the European Conference on Computer Vision, Glasgow, UK, 23–28 August 2020; Springer: Cham, Switzerland, 2020; pp. 213–229. [Google Scholar]
  28. Dai, H.; Du, L.; Wang, Y.; Wang, Z. A modified CFAR algorithm based on object proposals for ship target detection in SAR images. IEEE Geosci. Remote Sens. Lett. 2016, 13, 1925–1929. [Google Scholar] [CrossRef]
  29. Gao, G.; Ouyang, K.; Luo, Y.; Liang, S.; Zhou, S. Scheme of parameter estimation for generalized gamma distribution and its application to ship detection in SAR images. IEEE Trans. Geosci. Remote Sens. 2016, 55, 1812–1832. [Google Scholar] [CrossRef]
  30. Pappas, O.; Achim, A.; Bull, D. Superpixel-level CFAR detectors for ship detection in SAR imagery. IEEE Geosci. Remote Sens. Lett. 2018, 15, 1397–1401. [Google Scholar] [CrossRef]
  31. Miao, T.; Zeng, H.; Yang, W.; Chu, B.; Zou, F.; Ren, W.; Chen, J. An Improved Lightweight RetinaNet for Ship Detection in SAR Images. IEEE J. Sel. Top. Appl. Earth Obs. Remote Sens. 2022, 15, 4667–4679. [Google Scholar] [CrossRef]
  32. Sun, K.; Liang, Y.; Ma, X.; Huai, Y.; Xing, M. DSDet: A lightweight densely connected sparsely activated detector for ship target detection in high-resolution SAR images. Remote Sens. 2021, 13, 2743. [Google Scholar] [CrossRef]
  33. Bai, L.; Yao, C.; Ye, Z.; Xue, D.; Lin, X.; Hui, M. A novel anchor-free detector using global context-guide feature balance pyramid and united attention for SAR ship detection. IEEE Geosci. Remote Sens. Lett. 2023, 20, 4003005. [Google Scholar] [CrossRef]
  34. Shen, J.; Bai, L.; Zhang, Y.; Momi, M.C.; Quan, S.; Ye, Z. ELLK-Net: An efficient lightweight large kernel network for SAR ship detection. IEEE Trans. Geosci. Remote Sens. 2024, 62, 5221514. [Google Scholar] [CrossRef]
  35. Wang, S.; Gao, S.; Zhou, L.; Liu, R.; Zhang, H.; Liu, J.; Jia, Y.; Qian, J. YOLO-SD: Small ship detection in SAR images by multi-scale convolution and feature transformer module. Remote Sens. 2022, 14, 5268. [Google Scholar] [CrossRef]
  36. Li, K.; Zhang, M.; Xu, M.; Tang, R.; Wang, L.; Wang, H. Ship detection in SAR images based on feature enhancement Swin transformer and adjacent feature fusion. Remote Sens. 2022, 14, 3186. [Google Scholar] [CrossRef]
  37. Hu, B.; Miao, H. An improved deep neural network for small-ship detection in SAR imagery. IEEE J. Sel. Top. Appl. Earth Obs. Remote Sens. 2023, 17, 2596–2609. [Google Scholar] [CrossRef]
  38. Zong, Z.; Song, G.; Liu, Y. DETRs with Collaborative Hybrid Assignments Training. In Proceedings of the IEEE/CVF International Conference on Computer Vision (ICCV), Paris, France, 2–3 October 2023; pp. 6748–6758. [Google Scholar]
  39. Zhu, X.; Su, W.; Lu, L.; Li, B.; Wang, X.; Dai, J. Deformable detr: Deformable transformers for end-to-end object detection. arXiv 2020, arXiv:2010.04159. [Google Scholar]
  40. Li, F.; Zhang, H.; Liu, S.; Guo, J.; Ni, L.M.; Zhang, L. Dn-detr: Accelerate detr training by introducing query denoising. In Proceedings of the IEEE/CVF Conference on Computer Vision and Pattern Recognition, New Orleans, LA, USA, 18–24 June 2022; pp. 13619–13627. [Google Scholar]
  41. Zhang, H.; Li, F.; Liu, S.; Zhang, L.; Su, H.; Zhu, J.; Ni, L.; Shum, H.Y. DINO: DETR with Improved DeNoising Anchor Boxes for End-to-End Object Detection. In Proceedings of the The Eleventh International Conference on Learning Representations, Kigali, Rwanda, 1–5 May 2023. [Google Scholar]
  42. Yu, C.; Shin, Y. SMEP-DETR: Transformer-Based Ship Detection for SAR Imagery with Multi-Edge Enhancement and Parallel Dilated Convolutions. Remote Sens. 2025, 17, 953. [Google Scholar] [CrossRef]
  43. Liu, W.; Zhou, L. Multi-level Denoising for High Quality SAR Object Detection in Complex Scenes. IEEE Trans. Geosci. Remote Sens. 2024, 62, 5226813. [Google Scholar] [CrossRef]
  44. Zhang, T.; Zhang, X.; Li, J.; Xu, X.; Wang, B.; Zhan, X.; Xu, Y.; Ke, X.; Zeng, T.; Su, H.; et al. SAR ship detection dataset (SSDD): Official release and comprehensive data analysis. Remote Sens. 2021, 13, 3690. [Google Scholar] [CrossRef]
  45. Wei, S.; Zeng, X.; Qu, Q.; Wang, M.; Su, H.; Shi, J. HRSID: A high-resolution SAR images dataset for ship detection and instance segmentation. IEEE Access 2020, 8, 120234–120254. [Google Scholar] [CrossRef]
  46. Zhang, T.; Zhang, X.; Ke, X.; Zhan, X.; Shi, J.; Wei, S.; Pan, D.; Li, J.; Su, H.; Zhou, Y.; et al. LS-SSDD-v1. 0: A deep learning dataset dedicated to small ship detection from large-scale Sentinel-1 SAR images. Remote Sens. 2020, 12, 2997. [Google Scholar] [CrossRef]
  47. Ghiasi, G.; Lin, T.Y.; Le, Q.V. Nas-fpn: Learning scalable feature pyramid architecture for object detection. In Proceedings of the IEEE/CVF Conference on Computer Vision and Pattern Recognition, Long Beach, CA, USA, 15–20 June 2019; pp. 7036–7045. [Google Scholar]
  48. Tan, M.; Pang, R.; Le, Q.V. Efficientdet: Scalable and efficient object detection. In Proceedings of the IEEE/CVF Conference on Computer Vision and Pattern Recognition, Seattle, WA, USA, 13–19 June 2020; pp. 10781–10790. [Google Scholar]
  49. Liu, S.; Huang, D.; Wang, Y. Learning spatial fusion for single-shot object detection. arXiv 2019, arXiv:1911.09516. [Google Scholar] [CrossRef]
  50. Sohan, M.; Sai Ram, T.; Rami Reddy, C.V. A review on yolov8 and its advancements. In Proceedings of the International Conference on Data Intelligence and Cognitive Informatics, Tirunelveli, India, 18–20 November 2024; Springer: Singapore, 2024; pp. 529–545. [Google Scholar]
  51. Cai, Z.; Vasconcelos, N. Cascade r-cnn: Delving into high quality object detection. In Proceedings of the IEEE Conference on Computer Vision and Pattern Recognition, Salt Lake City, UT, USA, 18–23 June 2018; pp. 6154–6162. [Google Scholar]
  52. Liangjun, Z.; Feng, N.; Yubin, X.; Gang, L.; Zhongliang, H.; Yuanyang, Z. MSFA-YOLO: A multi-scale SAR ship detection algorithm based on fused attention. IEEE Access 2024, 12, 24554–24568. [Google Scholar] [CrossRef]
  53. Ge, Z.; Liu, S.; Wang, F.; Li, Z.; Sun, J. Yolox: Exceeding yolo series in 2021. arXiv 2021, arXiv:2107.08430. [Google Scholar] [CrossRef]
  54. Wang, N.; Gao, Y.; Chen, H.; Wang, P.; Tian, Z.; Shen, C.; Zhang, Y. NAS-FCOS: Fast neural architecture search for object detection. In Proceedings of the IEEE/CVF Conference on Computer Vision and Pattern Recognition, Seattle, WA, USA, 13–19 June 2020; pp. 11943–11951. [Google Scholar]
  55. Dong, Z.; Li, G.; Liao, Y.; Wang, F.; Ren, P.; Qian, C. Centripetalnet: Pursuing high-quality keypoint pairs for object detection. In Proceedings of the IEEE/CVF Conference on Computer Vision and Pattern Recognition, Seattle, WA, USA, 13–19 June 2020; pp. 10519–10528. [Google Scholar]
  56. Liu, Y.; Yan, G.; Ma, F.; Zhou, Y.; Zhang, F. SAR ship detection based on explainable evidence learning under intraclass imbalance. IEEE Trans. Geosci. Remote Sens. 2024, 62, 5207715. [Google Scholar] [CrossRef]
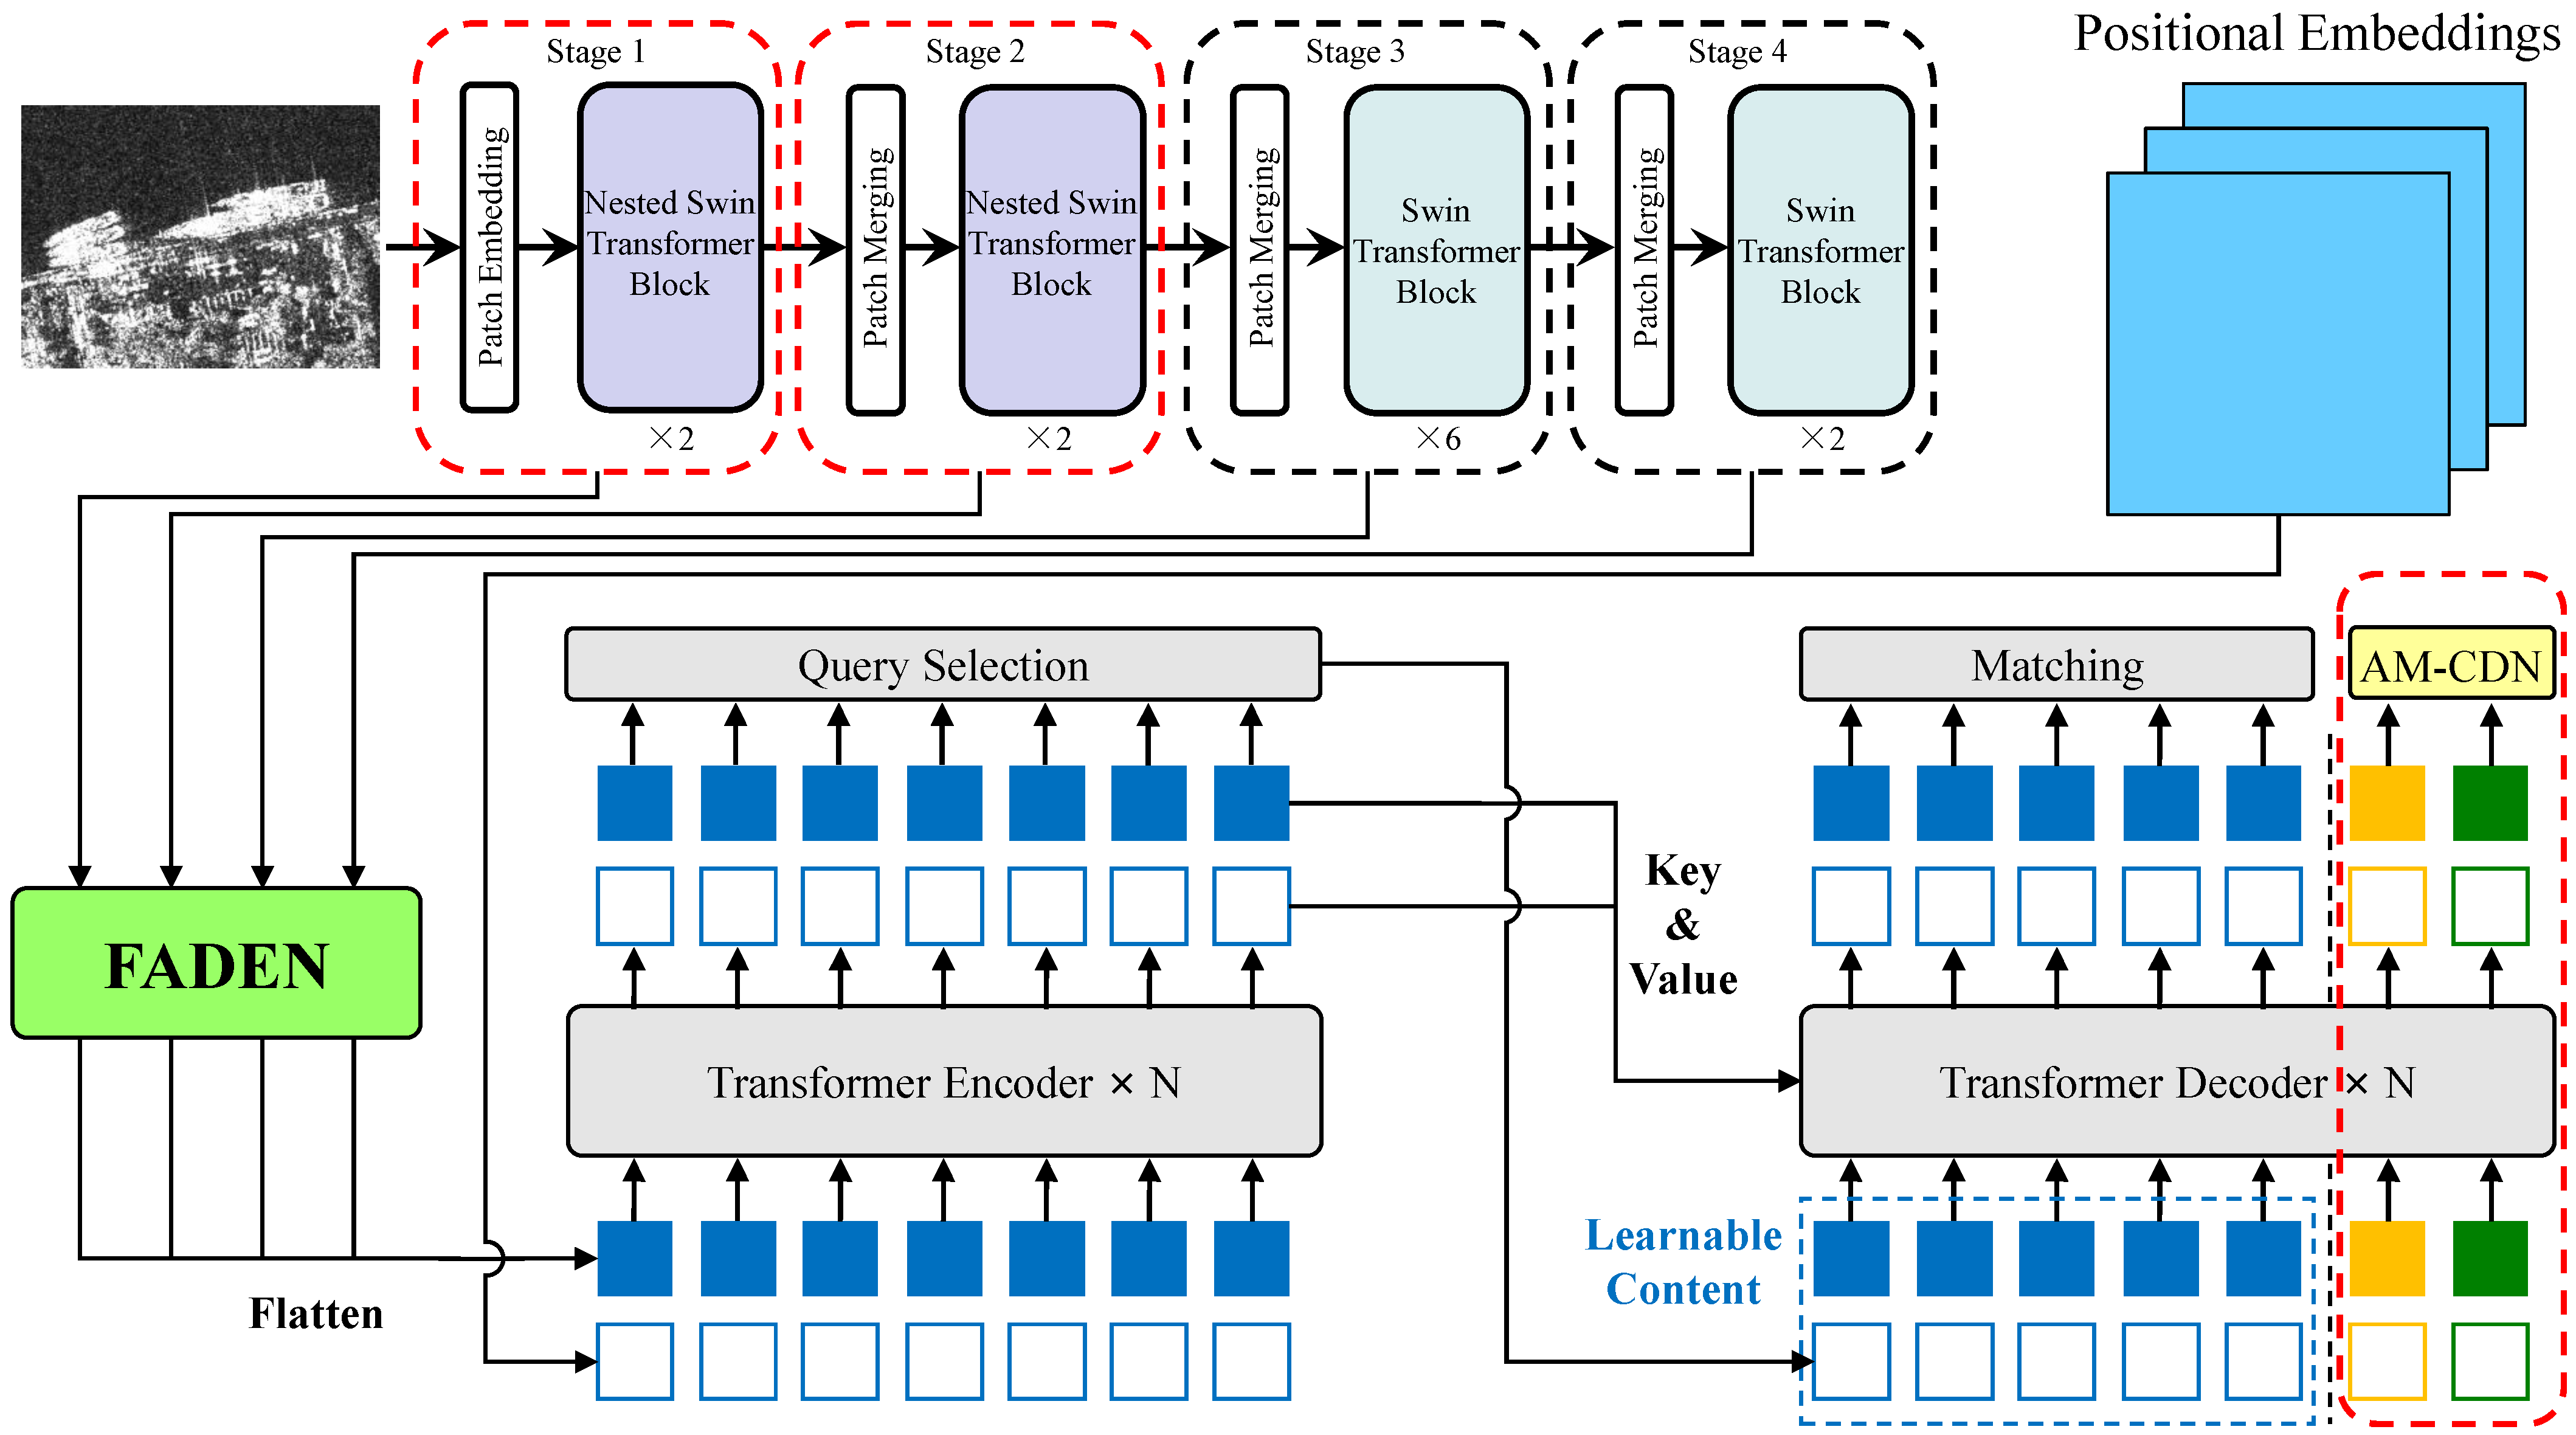
Figure 1. Overview of the proposed FANT-Det. In our architecture, DINO serves as the baseline. We develop a novel backbone network, a feature fusion network and a training strategy tailored for SAR ship detection. Red dashed boxes highlight the main changes beyond the baseline.
Remotesensing 17 03416 g001
Figure 2. (a) The architecture of two successive nested Swin transformer blocks. Arrows denote data flow. The Global Window-based Multi-head Self-Attention (GW-MSA) and the Sub-Window-based Multi-head Self-Attention (SW-MSA) are multi-head self-attention modules using regular windowing configurations, whereas Global Shifted Window-based Multi-head Self-Attention (GSW-MSA) and the Shifted Sub-Window-based Multi-head Self-Attention (SSW-MSA) employ shifted windowing configurations. (b) Schematic depiction of the relationship between X ˜ w and X ˜ w , i ; the red and green grids indicate the M × M window partitions on X and the S × S sub-window partitions on X w , respectively.
Remotesensing 17 03416 g002
Figure 3. (a) The architecture of the flow-aligned depthwise efficient channel attention network (FADEN). (b) Implementation of the Flow Alignment Module (FAM) and the Depthwise Separable Efficient Channel Attention (DSECA). FAM learns semantic flow to align feature maps from different scales. DSECA is a residual structure combined with attention mechanisms. Panels (a,b): arrows denote data flow.
Remotesensing 17 03416 g003
Figure 4. Overall structure of the proposed Adaptive Multi-Scale Contrastive Denoising (AM-CDN) strategy. Although both positive and negative samples correspond to anchor points in four-dimensional space, they are represented for simplicity as points on concentric squares in two-dimensional space. Panels: arrows denote data flow (brown for the clutter branch and blue for the scale branch); dotted frames highlight exemplar patches used to estimate the respective factors.
Remotesensing 17 03416 g004
Figure 5. Comparison results of the proposed FANT-Det and existing methods on the SSDD dataset. Green, red, and yellow bounding boxes represent ground truth, FANT-Det detections and comparative method detections, respectively. (a) Ship detection in a complex inshore scene with heavy interference. (b) Ship detection in an offshore scene where ships are dispersed across the area and small ships are present.
Remotesensing 17 03416 g005
Figure 6. Comparison results of the proposed FANT-Det and existing methods on the HRSID dataset. Green, red, and yellow bounding boxes represent ground truth, FANT-Det detections and comparative method detections, respectively. (a) Ship detection in a complex inshore environment with numerous small ships. (b) Ship detection under offshore conditions featuring a dense distribution of small ships.
Remotesensing 17 03416 g006
Figure 7. Comparison results of the proposed FANT-Det and existing methods in the LS-SSDD-v1.0 dataset. Green, red, and yellow bounding boxes represent ground truth, FANT-Det detections and comparative method detections, respectively. (a) Ship detection in a complex inshore environment with extremely small ships. (b) Ship detection under offshore conditions characterized by severe noise interference.
Remotesensing 17 03416 g007
Table 1. Ablation results of FANT-Det on the SSDD dataset. Bold data is the best result.
ConfigurationP (%)R (%)F1 (%)AP (%)APsmall (%)Params (M)FLOPs (G)
Baseline (Swin-T + DINO)80.259.468.365.763.348.5280.1
+NSTB80.470.174.971.470.151.6294.2
+FADEN83.165.273.170.268.650.4290.0
+AM-CDN85.061.171.068.265.548.5280.1
+NSTB + FADEN82.773.577.874.072.953.5304.2
+NSTB + AM-CDN83.871.076.972.871.151.6294.2
+FADEN + AM-CDN85.565.474.171.870.250.4290.0
+NSTB + FADEN + AM-CDN87.075.580.875.574.553.5304.2
Table 2. Results of ablation experiments with different feature fusion networks (%). Bold data is the best result.
DatasetMethodsPRF1APAPsmall
SSDDNAS-FPN [47]76.561.568.267.264.1
BiFPN [48]81.162.570.668.865.2
ASFF [49]79.263.570.568.066.5
FADEN83.165.273.170.268.6
HRSIDNAS-FPN72.158.464.563.562.7
BiFPN80.558.667.866.164.9
ASFF76.660.767.764.866.2
FADEN82.562.770.667.368.4
Table 3. Comparison of detection results with SOTA detectors on SSDD (%). Bold data is the best result.
CategoryModelEntireInshore
AP AP0.5 AP0.75 APsmall AP AP0.5 AP0.75
Anchor-basedRetinaNet [31]45.379.148.745.826.353.124.1
YOLOv8 [50]61.395.770.158.843.584.246.7
Cascade RCNN [51]66.193.276.965.350.980.156.8
HRSDNet [32]67.592.679.866.652.879.958.2
MSFA-YOLO [52]66.298.776.956.657.195.960.6
Anchor-freeYOLOX [53]54.988.360.252.138.171.439.4
NAS-FCOS [54]59.190.767.359.439.873.637.2
CentripetalNet [55]60.890.968.861.340.573.041.2
FBUA-Net [33]61.196.277.659.9
Ellk-Net [34]63.995.674.657.2
Transformer-basedDeformable DETR [39]59.290.871.558.744.169.348.4
CO-DETR [38]60.891.373.160.145.770.249.5
DINO [41]65.791.278.363.350.576.153.4
OEGR-DETR [26]93.984.0
RT-DINO [42]68.397.259.892.6
FANT-Det (Ours)75.598.991.074.569.596.884.0
Table 4. Comparison of detection results with SOTA detectors on HRSID (%). Bold data is the best result.
CategoryModelEntireInshore
APAP0.5AP0.75APsmallAPAP0.5AP0.75
Anchor-basedRetinaNet [31]55.280.560.356.435.361.736.1
YOLOv8 [50]63.290.472.562.056.183.657.9
Cascade RCNN [51]63.982.873.164.856.074.262.7
HRSDNet [32]65.283.074.565.655.873.663.1
MSFA-YOLO [52]67.192.776.753.7
Anchor-freeYOLOX [53]54.988.360.252.138.171.439.4
NAS-FCOS [54]57.283.864.058.150.675.353.4
CentripetalNet [55]61.285.164.962.445.874.348.0
FBUA-Net [33]69.190.379.669.6
Ellk-Net [34]66.890.676.068.9
Transformer-basedDeformable DETR [39]55.281.964.158.947.664.050.8
CO-DETR [38]56.583.266.460.848.865.351.1
DINO [41]64.187.273.264.848.475.652.9
OEGR-DETR [26]64.990.574.466.7
RT-DINO [42]92.281.3
FANT-Det (Ours)72.193.582.274.670.391.580.1
Table 5. Comparison of detection results with SOTA detectors on LS-SSDD-v1.0 (%). Bold data is the best result.
CategoryMethodsPRF1AP0.5
CNN-basedRetinaNet [31]71.569.370.464.1
YOLOv8 [50]83.568.175.075.7
Cascade RCNN [51]84.772.177.980.5
EDHC [56]85.872.978.880.9
YOLOX [53]83.973.878.579.3
NAS-FCOS [54]80.273.676.875.7
CentripetalNet [55]81.675.178.278.9
Transformer-basedDeformable DETR [39]80.766.572.972.0
CO-DETR [38]84.170.276.576.3
DINO [41]76.262.968.467.3
RT-DETR [42]85.373.078.779.2
FANT-Det (Ours)86.775.680.882.8
Note (LS-SSDD-v1.0). Large, wide-swath Sentinel-1 IW-mode scenes (15 large-scale images, ∼24,000 × 16,000 px) designed for small ship detection under large-area backgrounds.
Disclaimer/Publisher’s Note: The statements, opinions and data contained in all publications are solely those of the individual author(s) and contributor(s) and not of MDPI and/or the editor(s). MDPI and/or the editor(s) disclaim responsibility for any injury to people or property resulting from any ideas, methods, instructions or products referred to in the content.