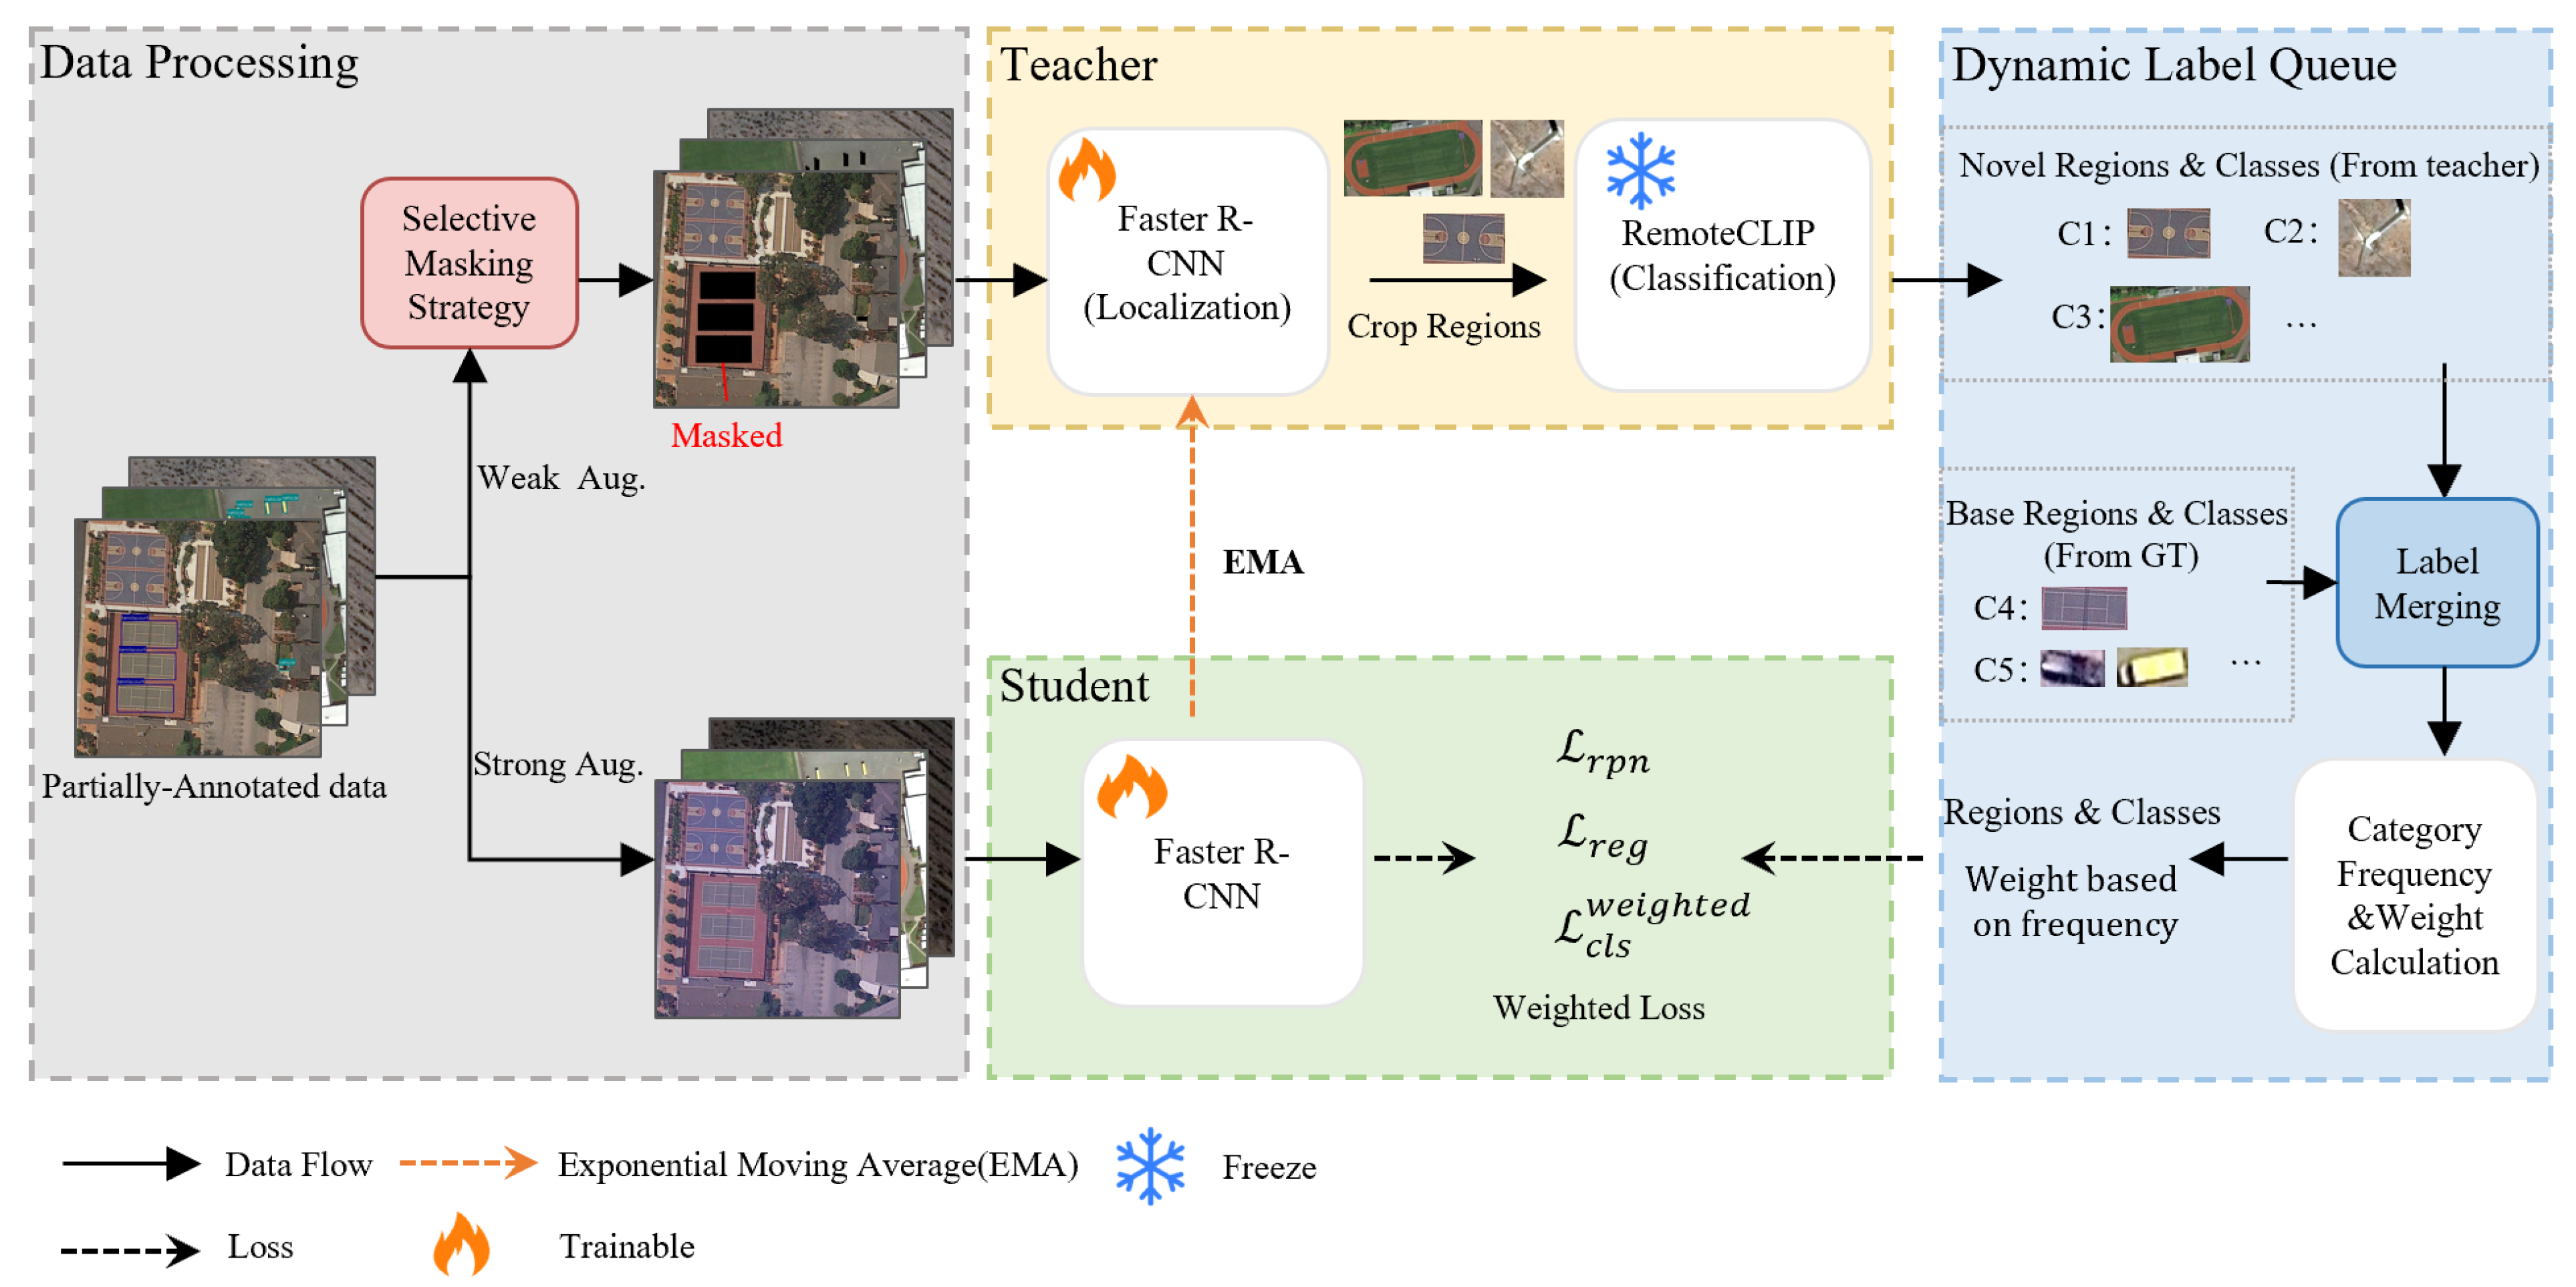
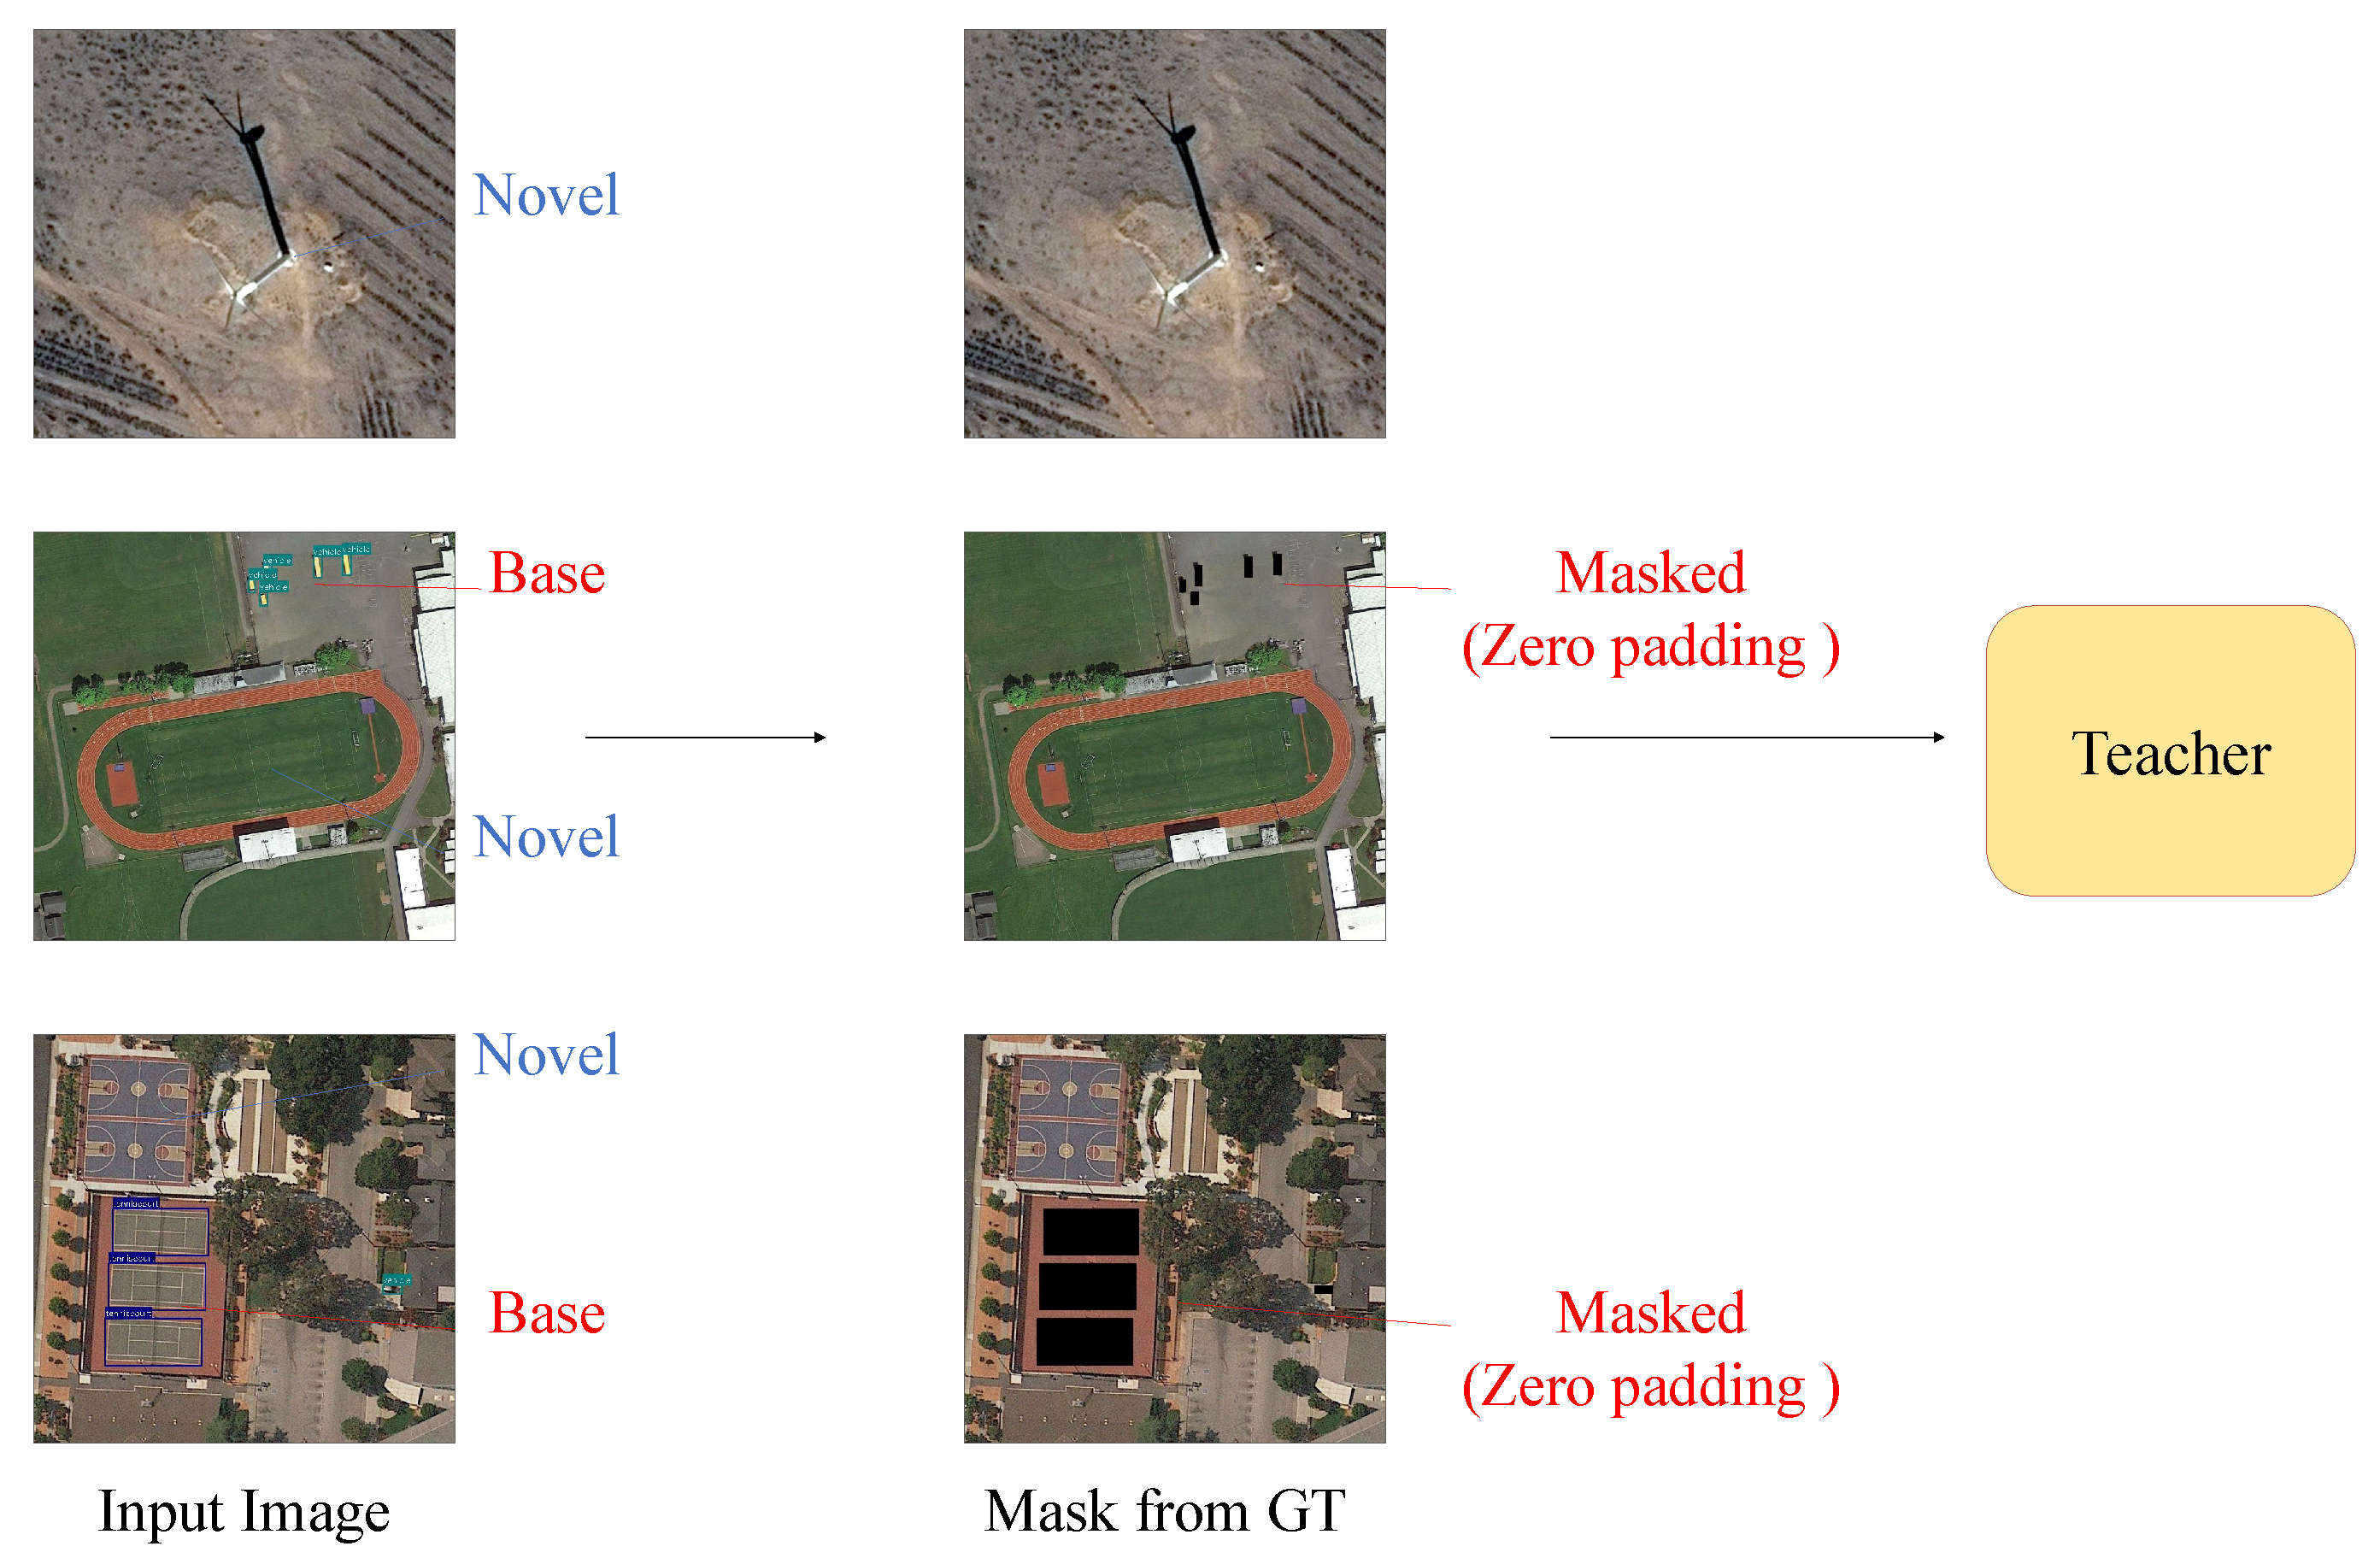
To validate the effectiveness of our proposed components, we conduct comprehensive ablation studies focusing on the key innovations of our framework.
4.2.1. Effectiveness of Selective Masking Strategy
Table 3 demonstrates the results of the ablation study, comparing different masking strategies. Without any masking strategy, the student model achieves an overall mAP of 37.6%, a base categories mAP of 39.4%, a novel category mAP of 30.5%, and a harmonic mean of 34.4%. The Gaussian blur masking strategy shows improvement with an overall mAP of 40.3%, a base categories mAP of 41.1%, a novel category mAP of 37.1%, and a harmonic mean of 39.0%. Our proposed zero padding masking strategy achieves the best performance with an overall mAP of 42.7%, a base categories mAP of 43.5%, a novel category mAP of 39.5%, and a harmonic mean of 41.4%.
The progressive improvements demonstrate the effectiveness of different masking approaches. Compared to non-masking, zero padding achieves a relative improvement of 13.6% in overall mAP, 10.4% in base categories detection, and a substantial improvement of 29.5% in the detection of novel categories. More importantly, zero padding outperforms Gaussian blur with a 5.96% relative improvement in overall mAP and a 6.47% improvement in novel category detection, validating our theoretical analysis regarding complete information suppression.
These results confirm that by completely masking base category regions through zero padding, the teacher model more effectively focuses on discovering novel category targets. The generated high-quality pseudo-labels, when merged with accurate ground-truth annotations of base categories, provide more complete and consistent supervision signals for the student model. The superior performance of zero padding over Gaussian blur validates our information-theoretic approach, demonstrating that complete information suppression is more effective than partial information degradation for novel category discovery.
4.2.2. Effectiveness of Queue-Based Dynamic Frequency Weighting
Table 4 presents a comprehensive comparison of different weighting strategies applied to address class imbalance in novel category detection. The results clearly demonstrate the progressive improvement achieved by more sophisticated weighting mechanisms.
When employing static weights where all categories are assigned uniform importance (w = 1.0), the model achieves modest performance with 37.1% overall mAP and only 18.3% mA. The integration of Class-Balanced Loss, which adjusts weights based on effective sample numbers computed from the dynamic label queue, provides notable improvement, achieving 39.2% overall mAP and 29.1% mA. However, our proposed dynamic frequency weighting mechanism yields the most significant performance gains, reaching 42.7% overall mAP and 39.5% mA.
The quantitative analysis reveals several key insights. Compared to static weighting, our dynamic approach delivers a substantial 21.2 percentage point improvement in novel category detection (from 18.3% to 39.5%), representing a remarkable 115.8% relative enhancement. Even when benchmarked against the established CB Loss method, our information-theoretic weighting strategy maintains a significant edge with 10.4 percentage points improvement in mA (from 29.1% to 39.5%) and 3.5 percentage points improvement in overall mAP. The harmonic mean shows consistent improvement from 25.4% (static) to 34.3% (CB Loss) to 41.4% (ours), demonstrating better balanced performance across base and novel categories.
Table 5 provides detailed per-category analysis, revealing both the effectiveness and limitations of dynamic weighting for addressing class imbalance issues. The results are particularly striking for the most challenging rare categories. For airport detection, our method achieves 38.5% AP with 69.1% recall, compared to complete failure (0.0% AP and recall) with static weighting. The basketball court and ground track field also show consistent improvements across all methods, with our approach achieving the best performance (65.1% AP and 41.1% AP, respectively).
However, the analysis also reveals persistent challenges in extremely rare categories. Windmill detection, which represents the most severe class imbalance challenge, shows limited improvement with our method achieving only 13.2% AP and 18.1% recall. While this represents a significant improvement over static weighting (complete failure) and CB Loss, the recall rate remains substantially lower compared to other novel categories.
To understand the root causes of this performance gap, we conducted detailed quality analysis of pseudo-labels across novel categories. We sampled 300 instances from each novel category during VisDroneZSD training to analyze confidence scores. The results reveal that the windmill has an average confidence of only 42.2%, while the basketball court achieves 78.1%, corresponding with the confidence patterns shown in
Figure 3. Additionally, statistical analysis of the VisDroneZSD test set shows that windmill targets have an average size of only 2807 pixels, compared to the basketball court at 18,327 pixels and the ground track field at 54,760 pixels, with the windmill being nearly 20 times smaller than the ground track field.
We believe the fundamental causes are attributed to the following: Small object problem—windmill targets are significantly smaller than other categories, leading to insufficient feature extraction and limited model recognition capability on small-scale targets. Since standard geometric bounding boxes are used, the actual pixels occupied by windmills are far smaller than the statistical results, as they are mostly composed of linear structures, further exacerbating the difficulty for RPN extraction.
Based on these findings, we propose specific improvement directions for future research: integrating small object detection enhancement modules, such as multi-scale feature fusion and specialized feature extractors for small targets, and introducing context-aware mechanisms that leverage geographic and environmental context information to assist small target identification.
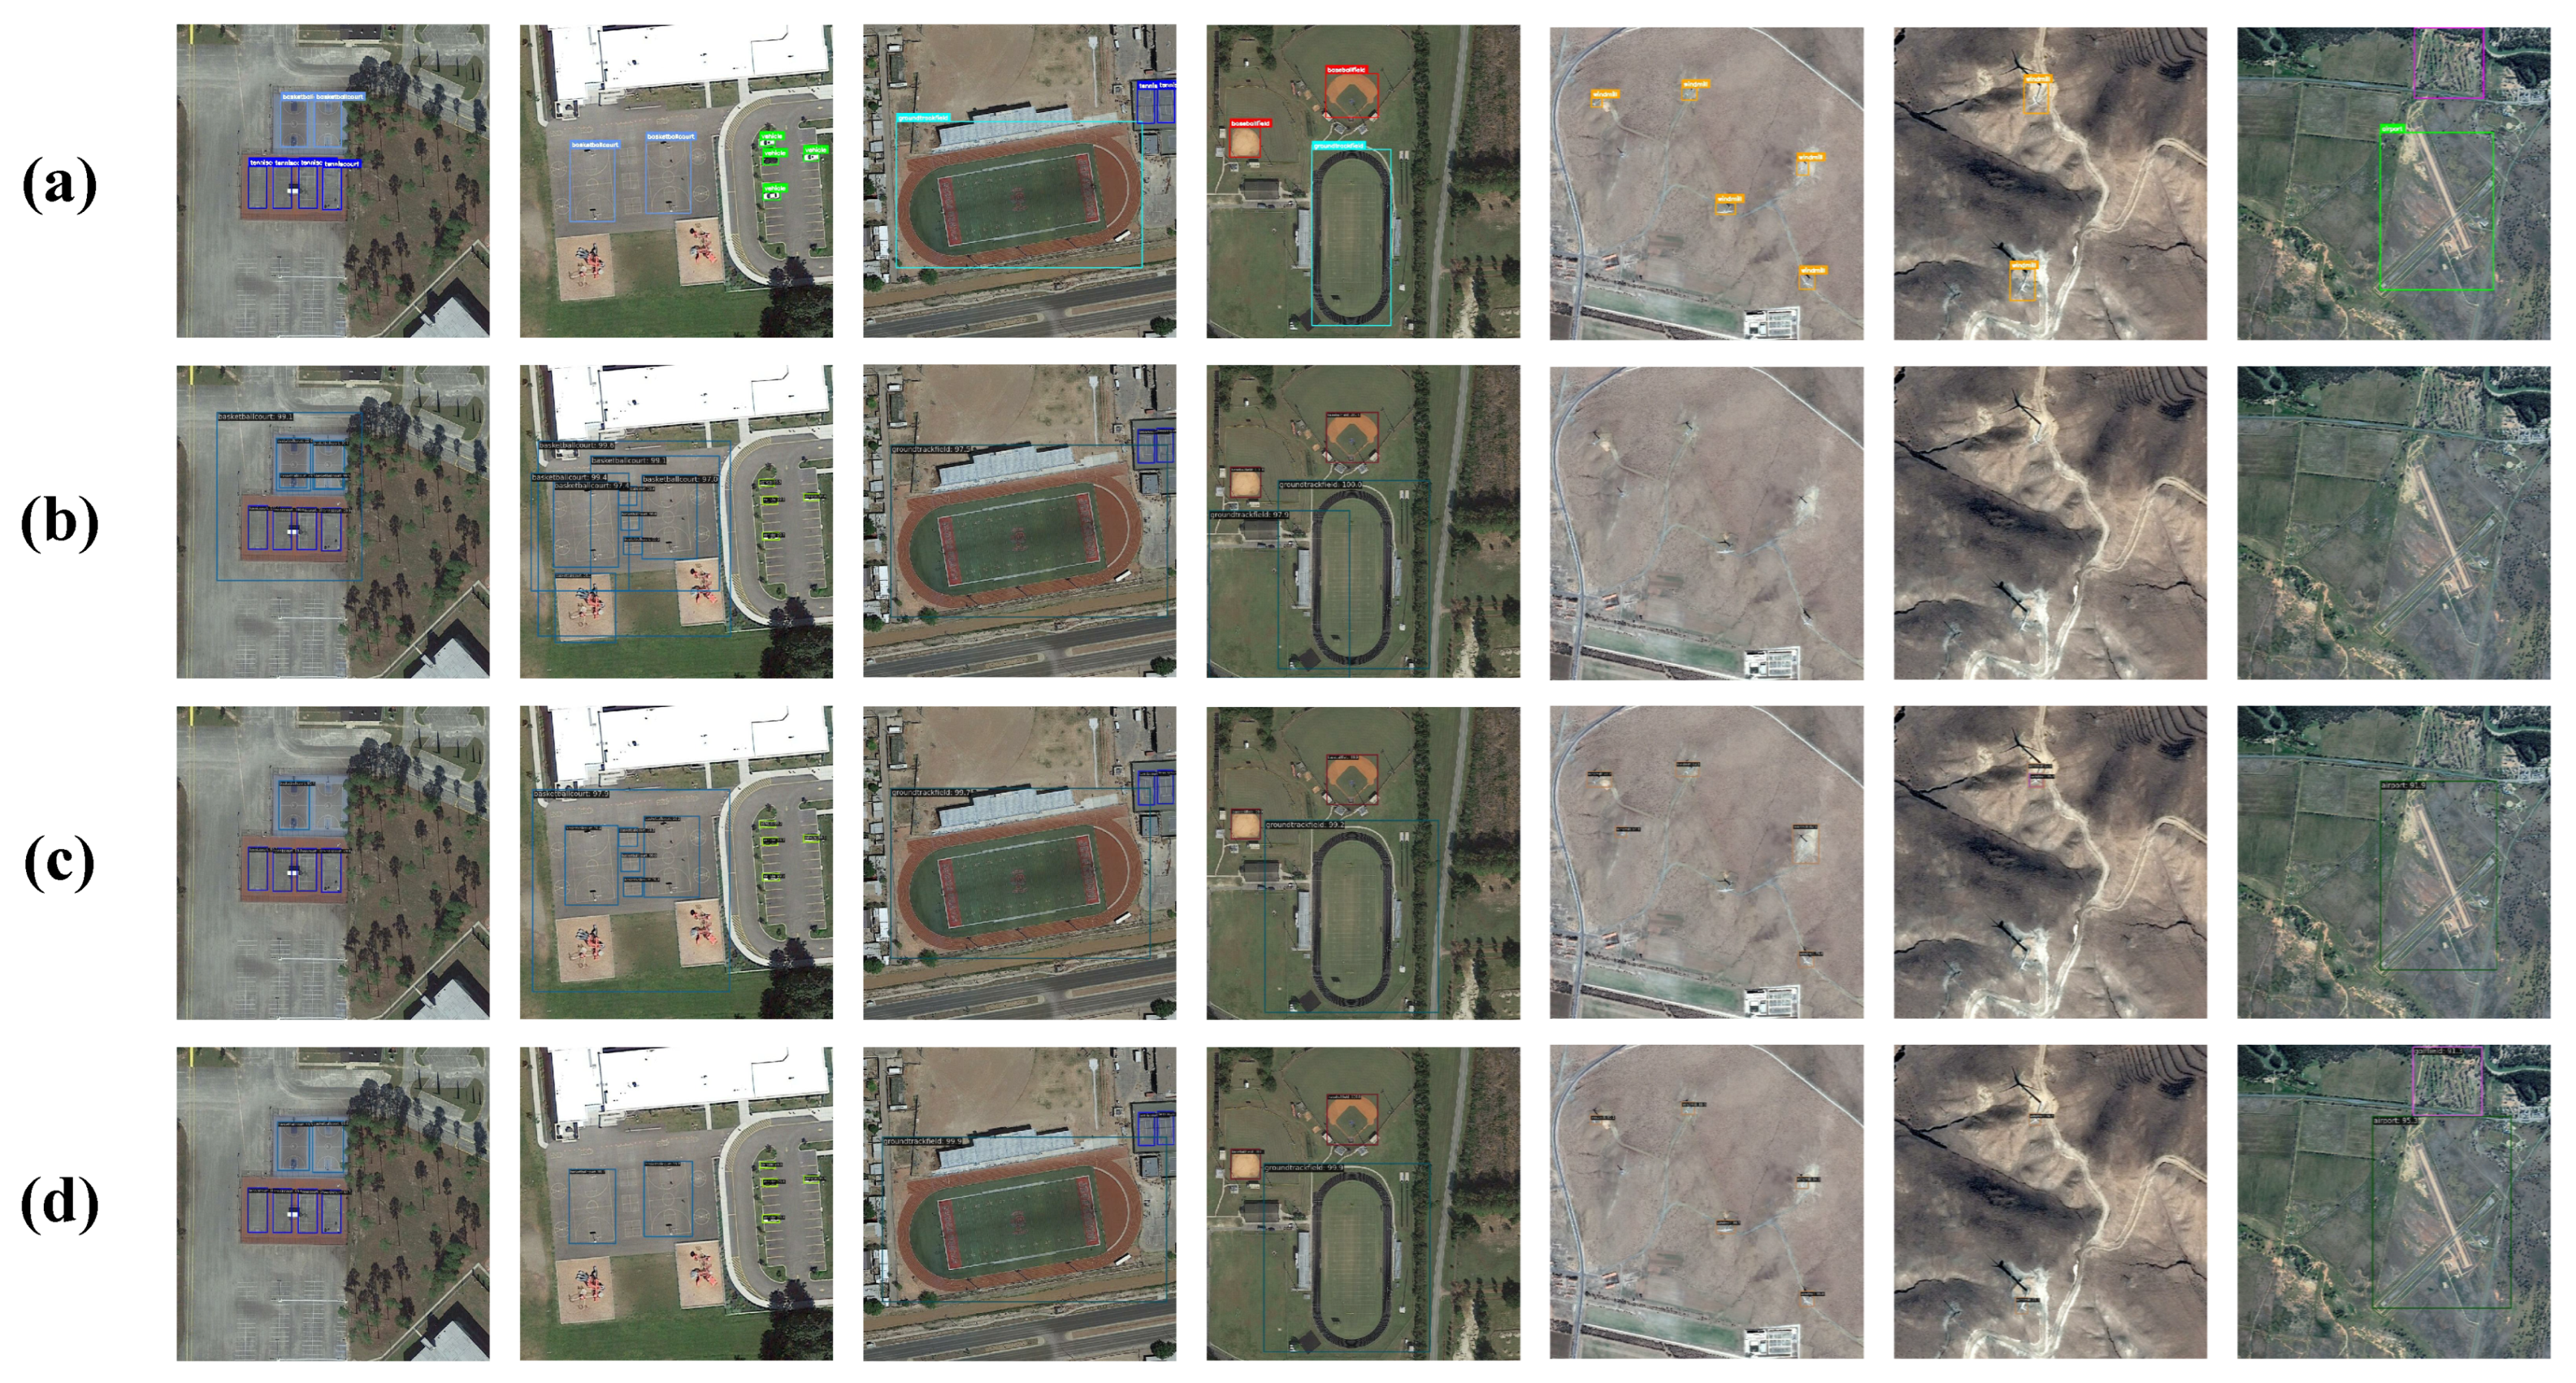
Figure 3 provides a qualitative visualization of the effectiveness of different weighting strategies on novel category detection. The results corroborate the quantitative findings presented in
Table 4 and
Table 5, demonstrating clear visual improvements across all categories.
As shown in the figure, the static weighting approach (row a) fails completely to detect the most challenging categories, airport and windmill, producing no detection results for these rare object types. This complete failure corresponds to the 0 AP values reported in
Table 5 for these categories. Furthermore, the static weighting method suffers from numerous false positives in basketball court and ground track field detection, indicating poor discrimination capability. The CB Loss method (row b) shows improved performance compared to static weighting, successfully detecting some instances of airport and windmill categories, but still exhibits suboptimal localization accuracy and confidence scores.
In contrast, our proposed dynamic frequency weighting method (row c) achieves the most accurate detection results with precise bounding box localization and minimal false negatives. Notably, the windmill category shows significant confidence score improvements compared to CB Loss, demonstrating the effectiveness of our information-theoretic weighting approach in addressing severe class imbalance. The visual results confirm the quantitative analysis, showing that our method not only improves detection recall for rare categories but also enhances overall detection precision across all novel object types.
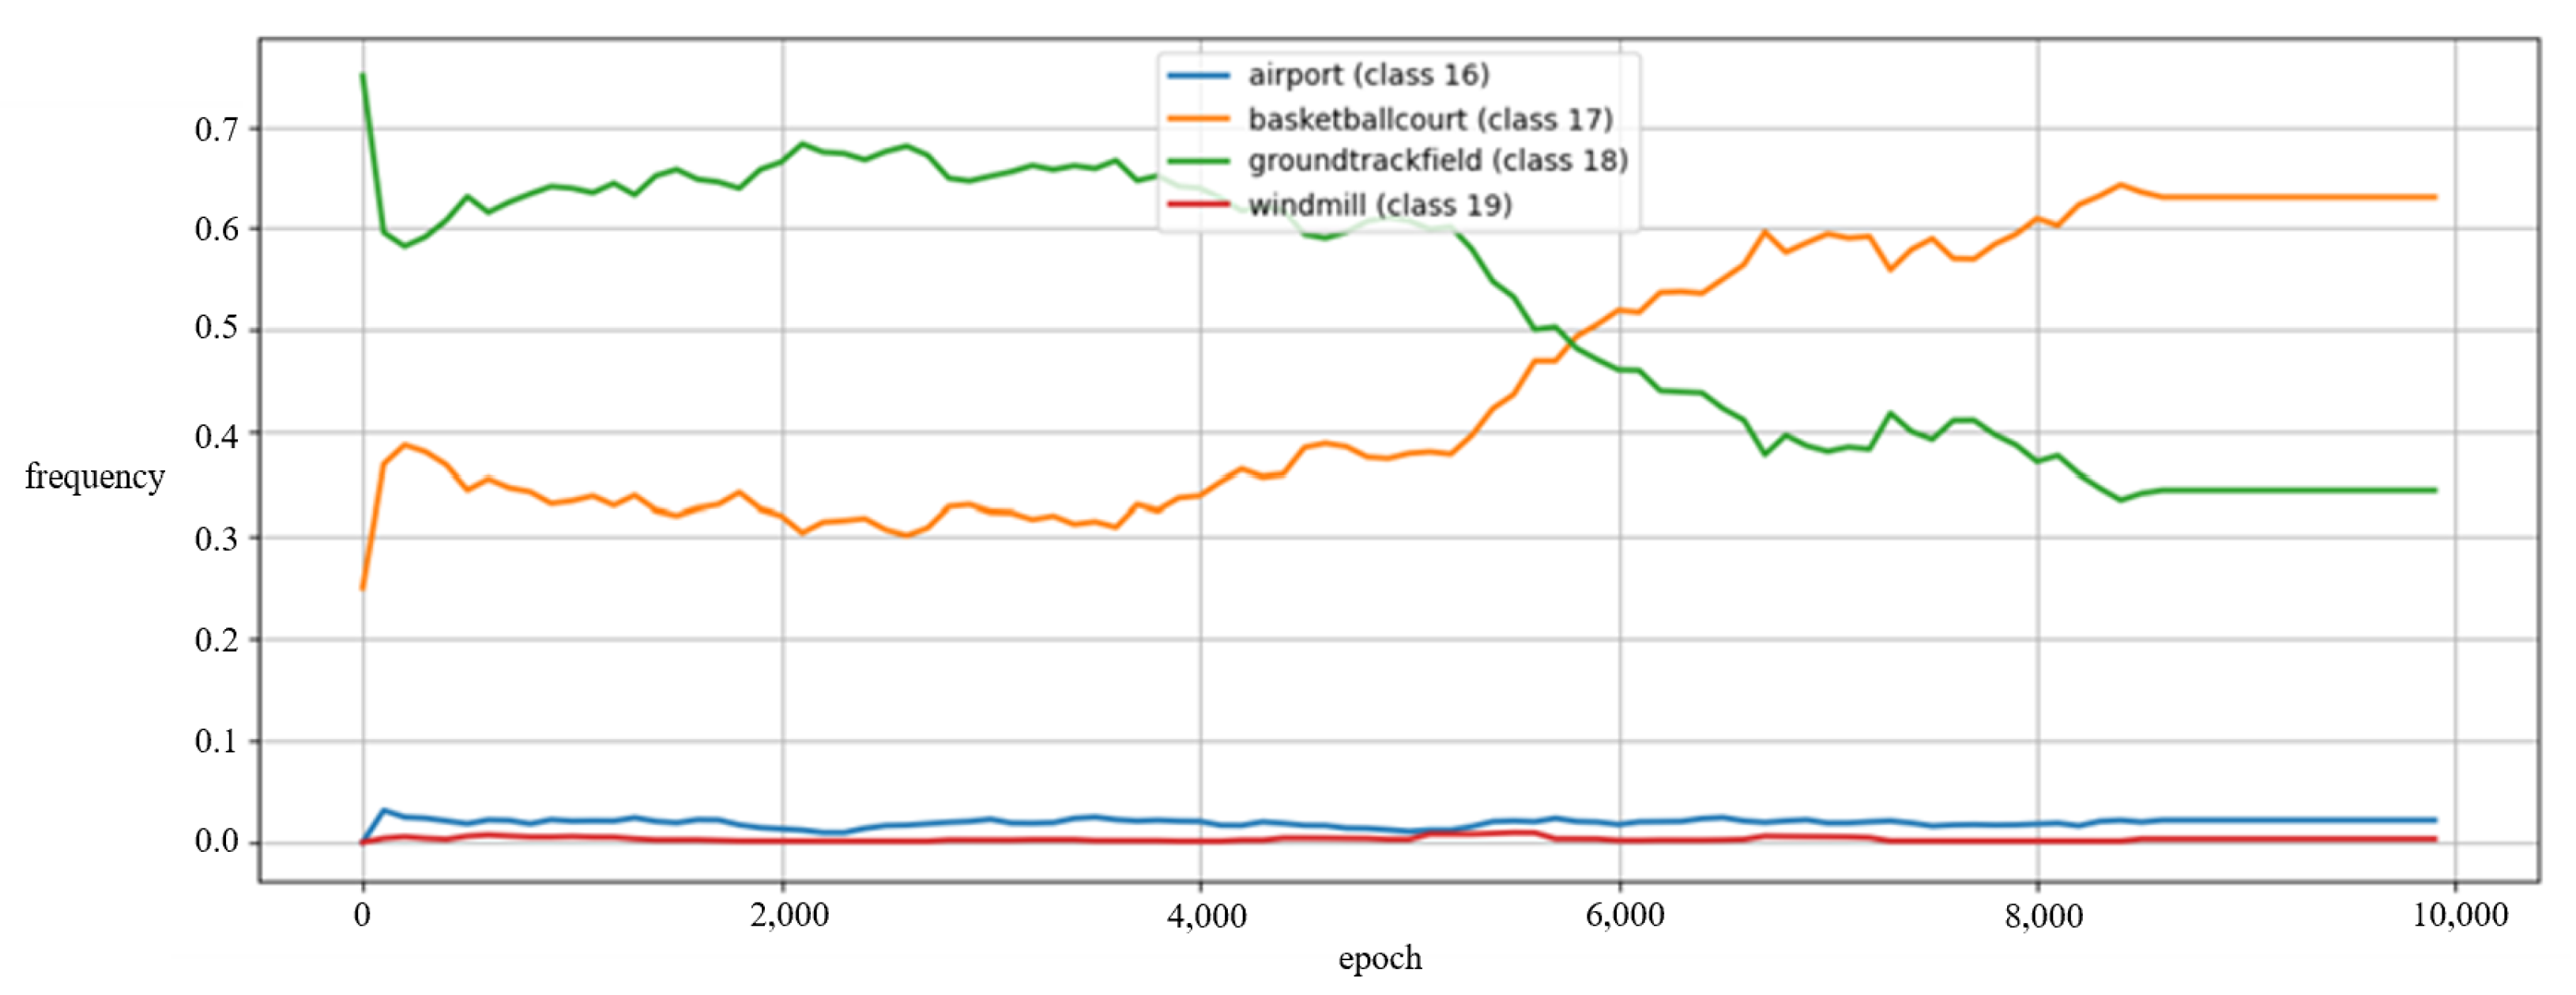
Figure 4 illustrates the frequency evolution of each novel category in the pseudo-label queue during the training process, clearly revealing the dynamic characteristics of the class imbalance problem. The horizontal axis represents the training epochs during the pseudo-label introduction phase. The following key observations can be made from the figure: The ground track field dominates in the early training stage with a frequency as high as 0.75, but gradually decreases to 0.35 as training progresses. The basketball court exhibits the opposite trend, rising from an initial frequency of 0.25 to 0.65, ultimately becoming the most frequently detected category. Meanwhile, the airport and windmill categories maintain frequencies close to 0 throughout the entire training process, demonstrating severe scarcity.
This dynamic change in frequency distribution fully validates the necessity of our proposed dynamic weight adjustment mechanism. Traditional static weighting schemes cannot adapt to such time-varying category distributions, nor can they accommodate the variations of rare categories across different datasets. Our method, by real-time monitoring of frequency changes and correspondingly adjusting weights, can provide higher learning weights for rare categories (such as airport and windmill), ensuring that the model is not dominated by frequent categories. This effectively improves the detection performance of these difficult categories, which also explains why we observe performance improvements from the dynamic weighting mechanism in the ablation experiments shown in
Table 4.
4.2.3. Parameter Sensitivity Analysis
Impact of the information intensity coefficient: To investigate the impact of the information intensity coefficient
on our dynamic weighting mechanism, we conduct a comprehensive sensitivity analysis, as shown in
Table 6. The coefficient
controls the influence of self-information on the weight calculation, where
indicates that novel category weights are uniformly set to 1.0 (equivalent to no dynamic adjustment).
The experimental results reveal a clear pattern in performance variation across different values. When , representing the absence of dynamic weight adjustment, the model achieves baseline performance with 37.1% overall mAP and 18.3% mA. As increases to 2, substantial improvements are observed across all metrics, with mA rising to 32.6% (78.1% relative improvement) and the harmonic mean increasing from 25.4% to 37.2%.
The optimal performance is achieved at , where the model reaches peak performance with 42.7% overall mAP, 39.5% mA, and 41.4% harmonic mean. This optimal value demonstrates that moderate weight adjustment based on self-information provides the best balance between emphasizing rare categories and maintaining training stability. The substantial improvement from to (115.8% relative improvement in mA) validates the effectiveness of our information-theoretic approach.
However, further increasing to 8 and 16 leads to performance degradation, with mA dropping to 36.3% and 26.5%, respectively. When is too small, the weight adjustment is insufficient to address the severe class imbalance, resulting in continued dominance by frequent categories. Conversely, when is too large, excessive weight adjustment leads to training instability and reduced overall performance, as the loss becomes dominated by potentially noisy pseudo-labels from rare categories. The performance decline at (26.5% mA) demonstrates that overly aggressive weighting can be counterproductive. These findings confirm that provides the optimal trade-off between addressing class imbalance and maintaining robust training dynamics.
The analysis provides valuable insights for practitioners implementing our dynamic frequency weighting mechanism. The results demonstrate that selecting an appropriately moderate value of (around 4) is sufficient to achieve substantial performance improvements without requiring extensive hyperparameter tuning. Importantly, the findings suggest that pursuing excessively large values is not only unnecessary but also potentially detrimental to model performance. This robustness to parameter selection makes our method practically applicable across different datasets and scenarios, as users can expect reliable improvements by choosing values in the moderate range (2–4) rather than engaging in aggressive parameter optimization.
Impact of the Weight Update Interval:
Table 7 presents the impact of different weight update intervals on both model performance and computational efficiency. The update interval determines how frequently the dynamic weights are recalculated based on the current dynamic label queue statistics, balancing between responsiveness to distribution changes and computational overhead.
The experimental results demonstrate that moderate update frequencies yield optimal performance. With an update interval of 50–100 iterations, the model achieves peak performance, with the 50-iteration interval reaching 40.1% mA and 41.5% harmonic mean, while the 100-iteration interval achieves 42.7% overall mAP. These frequencies provide an effective balance between timely response to class distribution changes and training stability.
When the update interval is too frequent (25 iterations), although the model responds quickly to distribution changes, the performance shows slight degradation (39.4% mA), potentially due to weight fluctuations that introduce training instability. Conversely, when the update interval is too sparse (500 iterations), significant performance deterioration occurs, with mA dropping to 36.3% and the harmonic mean declining to 39.5%. This demonstrates that infrequent updates fail to adequately respond to class distribution changes and cannot fully exploit the advantages of dynamic adjustment, resulting in limited improvement for novel categories.
An important practical consideration is the computational overhead introduced by the dynamic weighting mechanism. The training time analysis reveals that the weight update frequency has minimal impact on computational cost, with per-iteration training times ranging from 0.860 s to 0.878 s across all tested intervals. The difference between the most frequent (25 iterations) and least frequent (500 iterations) update schedules is merely 0.018 s per iteration. For a typical training scenario of 10,000 iterations, this translates to approximately 3 min additional training time, which is negligible considering the substantial performance improvements achieved. This analysis confirms that our dynamic weighting mechanism introduces minimal computational burden while providing significant performance gains, making it highly practical for real-world applications.
Impact of the Smoothing Coefficient:
Table 8 presents the impact of different smoothing coefficient values on the stability and responsiveness of our dynamic weighting mechanism. The parameter sensitivity analysis for the smoothing coefficient
reveals the importance of our dynamic loss weighting mechanism. The results demonstrate a clear inverted-U-shaped performance curve across different
values.
When (no smoothing), the model achieves moderate performance with 40.1% overall mAP and 37.3% mA. This setting allows weights to change drastically based on immediate results, leading to training instability and suboptimal convergence. The relatively poor performance indicates that excessive responsiveness to short-term fluctuations harms the learning process.
As increases to 0.5, performance improves significantly to 41.6% overall mAP and 39.2% mA, demonstrating that moderate smoothing helps stabilize the training process while maintaining reasonable adaptability to distribution changes.
The optimal performance is achieved at , reaching 42.7% overall mAP and 39.5% mA. This value provides an effective balance between maintaining historical weight information and adapting to recent distribution changes, ensuring stable convergence while preserving sufficient responsiveness to evolving pseudo-label statistics.
When becomes too large (0.95), performance degrades significantly to 39.1% overall mAP and 33.5% mA. This excessive smoothing makes the weighting mechanism overly conservative, failing to adapt promptly to changing class distributions and essentially approaching static weighting behavior. The substantial performance drop confirms that insufficient responsiveness limits the effectiveness of our dynamic adjustment strategy.
Impact of the Short-Term Frequency Window Size:
Table 9 presents the impact of different short-term frequency window sizes on model performance. The results demonstrate a clear performance pattern that validates our choice of window size for the dynamic loss weighting mechanism.
When the window size is too small (about 50 updates), the model achieves suboptimal performance with 41.7% overall mAP and 37.8% mA. This reduced performance indicates that overly small windows make the frequency statistics too sensitive to short-term fluctuations, leading to unstable weight adjustments that can negatively impact training.
The window size of 300 updates shows improved performance compared to 50, achieving 42.2% overall mAP and 39.6% mA. It is already similar to the best outcome.
Our chosen window size of 500 updates achieves the best overall performance with 42.7% overall mAP. This configuration effectively balances short-term adaptability with sufficient stability to avoid noise interference, confirming the appropriateness of our parameter selection.
When the window becomes excessively large (5000 updates), performance degrades significantly to 40.5% overall mAP and 35.2% mA. This substantial decline indicates that overly large windows reduce the mechanism’s responsiveness to recent distribution changes, losing the benefits of dynamic adaptation.


