Highlights
What are the main findings?
- Doppler radar data assimilation significantly improves the initial analysis of mesoscale systems and enhances the accuracy of short-term (0–3 h) quantitative precipitation forecasts, especially for heavy rainfall (>15 mm), compared to using only wind profiler radar data.
- The Barnes filter analysis reveals that forecast improvements from radar data assimilation are most pronounced at the mesoscale but are inherently limited to the first 2–3 h, after which skill rapidly decays. In contrast, large-scale systems show greater stability and predictability over a 6-h forecast period.
What is the implication of the main finding?
- This study underscores the critical value of high-resolution Doppler radar data for initializing and predicting mesoscale convective events, directly leading to more accurate and reliable short-term weather warnings for heavy rainfall.
- The findings highlight a fundamental predictability limit for mesoscale systems and suggest that future research should prioritize techniques to extend the useful forecast window of such rapidly evolving weather phenomena.
Abstract
This study explores the impact of assimilating Doppler radar data on short-term numerical weather forecasting for a heavy rainfall event in Southern China, focusing on different spatial scales. Results show that radar data assimilation significantly improves the initial analysis and enhances the accuracy of hourly precipitation forecasts by providing more detailed mesoscale system information, compared to assimilating only wind profiler radar data. The Barnes filter analysis reveals that radar data assimilation has a more pronounced effect on mesoscale systems, with improvements primarily concentrated in the first 2 h of the forecast. However, this improvement diminishes rapidly beyond the 2 h lead time, indicating the inherent predictability limits of mesoscale systems. In contrast, large-scale systems exhibit a greater stability and predictability, with radar data assimilation having a relatively smaller but still positive impact. The study emphasizes the importance of radar data assimilation for short-term forecasts at different spatial scales and suggests that future work prioritize extending mesoscale predictability.
1. Introduction
Numerical forecasting has rapidly advanced in recent years, leading to improved accuracy in weather prediction models. However, there still remains significant uncertainty in numerical forecasts at short time scales for extreme and high-impact weather events [1,2,3]. One important source of forecast error in numerical prediction often stems from initial errors [4,5,6,7,8]. Therefore, it is of crucial importance to enhance the accuracy of near-term numerical forecasts for heavy rain by incorporating additional observational data to refine the initial conditions.
Compared with conventional observations, Doppler weather radar delivers three-dimensional clouds and precipitation information at a higher spatio-temporal resolution and simultaneously depicts the structure and evolution of atmospheric flow [9,10,11]. It is commonly served as an important tool for monitoring mesoscale convective systems [12,13]. In many studies, Doppler weather radar observations are assimilated into NWP models to evaluate their impact on the forecasts of various weather systems, including the tornadic thunderstorm [14], supercell [15], squall line [16], Meiyu frontal rainfall [17], and tropical cyclone [18,19,20,21,22].
Diverse assimilation techniques, including the three-dimensional variational scheme (3DVar), the four-dimensional variational scheme (4DVar), the ensemble Kalman filter (EnKF), and the hybrid technique combining EnKF and 3DVar, which have been widely employed to assimilate Doppler radar data. Most studies on the radar data assimilation of radar data have been focused on using the 3DVar method because of its stability and lower computational cost [10,23,24,25,26]. 4DVar, capable of accurately retrieving both wind and thermodynamic fields, is a more sophisticated algorithm and has been integrated into radar assimilation systems such as the variational Doppler radar analysis system (VDRAS) [27], Japan Meteorological Agency’s 4DVar [28], China Meteorological Administration’s global forecast system [29], and the Weather Research and Forecasting (WRF) Model [30,31]. EnKF is also widely used for radar data assimilation (DA) due to its ability to provide flow-dependent covariance using an ensemble of forecasts. It is sometimes hybridized with 3DVar [32].
The enhancement of numerical forecasts by assimilating radial velocity and by assimilating radar reflectivity may be different. Xiao and Sun (2007) [10] assimilated radar reflectivity directly as a model variable using WRF-3DVar and indicated that reflectivity assimilation significantly modified the initial humidity and cloud water mixing ratio, whereas radial velocity assimilation has a larger impact on the initial wind. Tian et al. (2017) [33] showed that radar reflectivity DA improved storm event precipitation forecasting more significantly than radial velocity DA. Tsai et al. (2014) [34] suggested that radar reflectivity DA results in a faster response in quantitative precipitation nowcasting compared to radial velocity DA. Pu et al. (2009) [18] found that radar reflectivity DA can improve Hurricane Dennis’s thermodynamic and hydrological composition of the initial vortex, leading to more accurate precipitation forecasts than radar velocity DA. Conversely, radar velocity DA has a significant influence on the storm track and intensity. Similar results can also be seen in the analysis of Typhoon Morakot (2009) [35], Typhoon Jangmi (2008) [21], and Hurricane Ike (2012) [19].
Although the performance of different radar variables and DA methods varies across hindcast experiments, studies commonly show that radar DA significantly improves short-term precipitation forecasts by better resolving small-scale dynamic and thermodynamic structures in the initial conditions [25,36,37,38]. These studies mainly focus on evaluating the impact of radar DA on short-term forecasts at different validity times. Sun and Wang (2013) [30] investigated that radar DA by 3DVar had a positive effect on 0–6 h quantitative precipitation forecasts. Tsai et al. (2014) [34] indicated that the rainfall intensity and distribution for the first 6 h were improved with radar DA. Wang et al. (2016) [39] showed that the 24 h forecast of the typhoon best track and precipitation had the highest prediction skills after assimilating radar data. Bachmann et al. (2019) [40] compared the precipitation skill of 0–6 h forecasts with and without radar DA. All evidence suggest that radar DA is particularly effective for short-term numerical forecasts, but few studies have investigated the impact of radar DA on the short-term forecasts at different spatial scales.
In this paper, the impact of assimilating radar DA on the short-term numerical forecast of a heavy rainfall event in Southern China is investigated by separating the analyses and forecasts into different spatial scales using the Barnes filter method [41]. Then the influences of radar DA in meso- and large-scale structures of analyses and forecasts are explored. The weather case, quality control of observational data, model configuration, and experimental design are described in Section 2. In Section 3, the impacts of DA with and without radar data on the analysis and forecast of precipitation greater than 0.1 and 15 mm are compared. The relevant mechanisms are diagnosed and examined. Finally, the summary and conclusions are given in Section 4.
2. Weather Case, Model, and Experimental Design
2.1. Weather Case
An extreme precipitation event occurred in the Fujian Province of China during 14 to 17 May 2019. Figure 1a shows the observed 24 h accumulated precipitation from 1200 UTC 15 May to 1200 UTC 16 May.
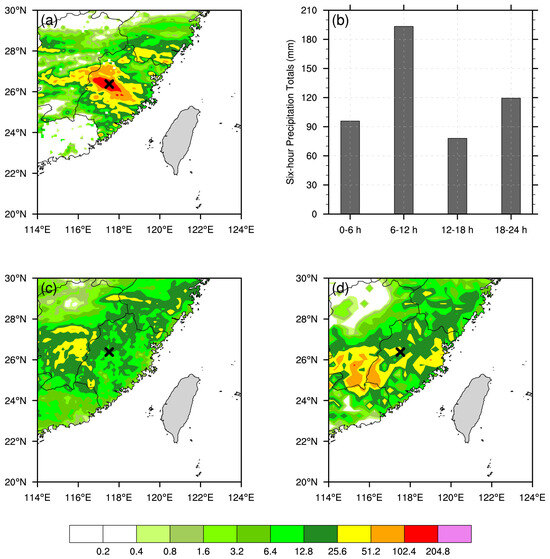
Figure 1.
(a) Observed 24 h accumulated precipitation in Fujian Province of China from 201905151200 to 201905161200 (UTC). (b) The 6-hour accumulated precipitation for 0–6, 6–12, 12–18, and 18–24 h from 1200 UTC 15 May 2019. (c) The 24 h accumulated precipitation forecasts from the European Centre for Medium-Range Weather Forecasts, initialized at 1200 UTC on 15 May. (d) Same as (c), but for NCEP. “×” in (a,c,d) denotes the observed maximum 24 h accumulated precipitation center.
It is noteworthy that the maximum 24 h accumulated precipitation in west-central Fujian was 308.9 mm, which broke the local historical record since 1961. Each maximum 6-hour accumulation (0−6, 6−12, 12−18, and 18−24 h, starting at 1200 UTC 15 May 2019) exceeded 70 mm. The 6−12 UTC period recorded a peak value of 193.3 mm (Figure 1b). Most global numerical weather prediction (NWP) models were limited in their ability to forecast this extreme precipitation event. Both the intensity and distribution of 24 h accumulated precipitation forecasts from the European Centre for Medium-Range Weather Forecasts (ECMWF) and the National Centers for Environmental Prediction (NCEP) were not similar, based on the observations (Figure 1c,d).
Although the forecasts of precipitation location and intensity from mesoscale models were more accurate than that of the global models, the forecasted maximum 24 h precipitation was less than the observations, substantially underestimating the event and thereby degrading forecast utility. This exceptionally rare rainfall event served as a case study to evaluate the impact of radar DA at different spatial scales.
2.2. Model Configuration and Data
The Weather Research and Forecasting Model (Version 3.7) [42] with the 3DVar data assimilation scheme [43] is used to perform the experiments in this study. Same as in [44], the model domains are nested with 141 × 131 coarse grid points in the parent domain (D01) and 241 × 241 fine grid points in the inner domain (D02) (Figure 2). The horizontal resolutions of the two domains are 18 and 6 km, respectively, and the model is vertically divided into 53 layers. The physical parameterizations are the same as in the experiments carried out in [44], including the WRF single-moment five-class microphysics scheme [45], the rapid radiative transfer model longwave radiation scheme [46], the Goddard shortwave radiation scheme [47], the Grell 3D cumulus parameterization scheme [48], and the MYJ planetary boundary layer scheme [49]. Global forecasts from the global forecast system (GFS) at NCEP provide the background fields for data assimilation and free model forecasts.
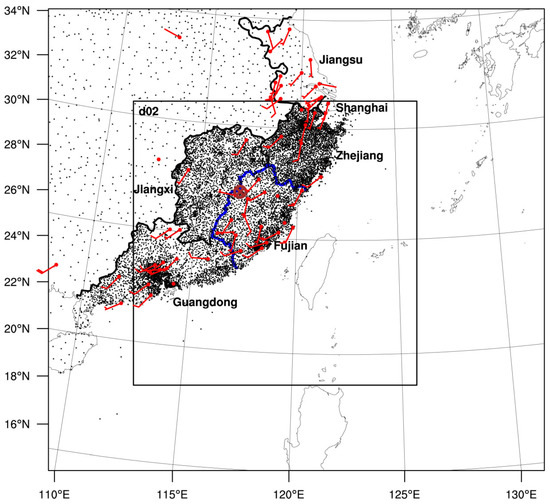
Figure 2.
Extent of the parent and nested (d02) model domains. Locations of the automatic weather stations and wind profile radar stations are indicated by black and red dots, respectively. Red wind barbs show wind profile radar observations at 1200 UTC 15 May. The red symbol of “ⓧ” marks the S-band weather radar site. The blue curve outlines Fujian Province.
The observations of the wind profiler radar (WPR), automatic weather station (AWS), and S-band weather radar are collected by the China Meteorological Administration (CMA) (Figure 2). There are approximately 42 WPR stations in D02, and all the observations are used for the DA experiment. The 850-hPa wind observations reveal that low-level convergence collocated with the extreme precipitation site, confirming that WPR winds are consistent with the precipitation. Both reflectivity and velocity observations from the S-band weather radar (Z9598) closest to the precipitation center have been assimilated in the sensitivity DA experiments, with reflectivity being assimilated directly as a model variable. The radar detection range and resolution are 230 km and 1°*1 km, respectively. Observational data was assimilated solely in D02 with the 3DVar data assimilation scheme. AWS observations are withheld from the DA experiments and used solely for the independent verification of forecast accuracy.
2.3. Radar Data Preprocessing
Radar data are preprocessed using the Python ARM Radar Toolkit (Py-ART, V1.11.0) [50]. Quality control includes reflectivity despeckling, velocity dealiasing, and velocity texture filtering. Reflectivity values below 10 DBZ are discarded to focus on the severe convection cores. Then, the quality-controlled radar reflectivity and velocity data are interpolated from spherical to Cartesian coordinates. Observation errors for radar reflectivity and velocity are estimated as the nine-point standard deviation around each central grid point [23]. After quality control, the radar reflectivity and velocity data are preprocessed by a typical thinning step. They are smoothed and interpolated into a grid with a horizontal resolution of 6 km that is the same as the resolution in the WRF model (Figure 3).
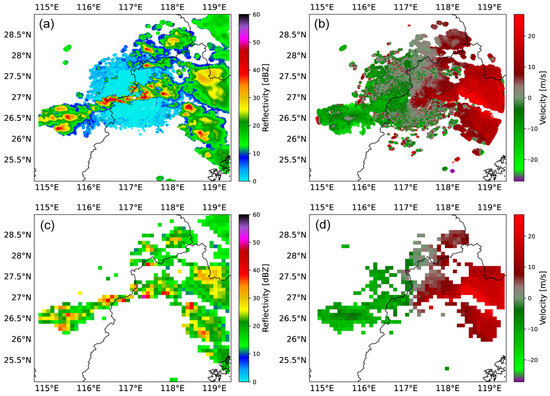
Figure 3.
(a) Radar reflectivity and (b) velocity from S-band weather radar station (Z9598) at 1200 UTC 15 May 2019. (c,d) Same as (a,b), but for (c) radar reflectivity and (d) velocity after 6 km horizontal thinning.
2.4. Experimental Design
Focusing on the 6 h peak precipitation window (1800 UTC 15 May to 0000 UTC 16 May 2019), this study examines how the Doppler radar DA affects forecasts of this event. Hindcast experiments were conducted within a cycling DA and forecast framework based on the WRF-3DVar (Figure 4). The WRF model was cold started at 1500 UTC 15 May, with first-guess (FG) and boundary conditions downscaled from the NCEP GFS global forecast. A 3 h forecast without DA was performed to provide the FG for the first DA cycle, initialized at 1800 UTC 15 May. Observations were then assimilated during the first DA cycle to produce the analysis that initialized a 6 h forecast with hourly output. Afterward, hourly assimilation was performed over the next six DA cycles, with FG fields taken from the preceding 6 h forecast. In the sensitivity experiment (RAD), both WPR and S-band radar data were assimilated, whereas the control run (CTL) used only WPR observations (Table 1).
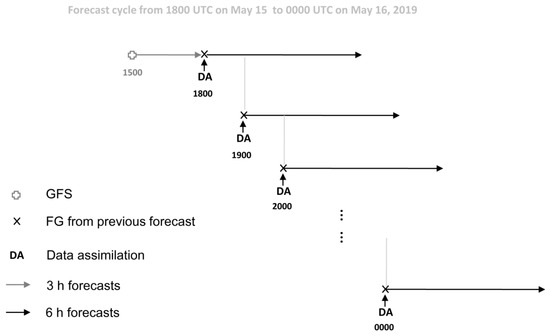
Figure 4.
Schematic of the analysis and prediction cycle. “GFS” indicates a cold start using GFS forecast as first guess. “×” denotes warm start every hour using the previous cycle’s forecast as background. DA represents the analysis time at which data assimilation was performed. The gray line with an arrow represents the 3 h forecast used to generate the first guess, while the black dashed line with an arrow represents the 6 h free forecast.

Table 1.
Sensitivity experiments and the observations assimilated in the experiments.
2.5. Methods
2.5.1. Barnes Filtering Method
The Barnes filtering method is a widely used technique in atmospheric sciences for spatial interpolation and data smoothing [41], which is particularly effective in separating mesoscale features from larger-scale atmospheric data. The method applies low-pass filtering to smooth the data and employs weighted averaging to update field estimates, with weights decreasing as the distance to the target point increases. By iteratively refining the initial estimate, first correction, and final correction, Barnes filtering produces a smooth and accurate spatial field.
For a target point , mesoscale features are calculated by removing the large-scale component from the original field:
where indicates the large-scale component (formulated in Appendix A). and are the original and mesoscale atmospheric fields, respectively. and represent the longitude and latitude.
2.5.2. Threat Score and Bias Score
Surface precipitation forecasts were verified against automatic weather station (AWS) observations using the Threat Score () and Bias Score ():
where is the number of forecasted events, the number of observed events, and is the number of correct forecasts. ranges from 0 to 1, with higher values indicating better skill.
is defined as
ranges from 0 to positive infinity. A value ≈ 1 indicates an unbiased forecast, while a value > 1 (<1) signifies overestimation (underestimation).
2.5.3. Pattern Correlation Method
The pattern correlation method is widely used to quantify the similarity between datasets or patterns, with the Pearson correlation coefficient (PCC) being a common approach. It measures the linear relationship between two variables, ranging from −1 (perfect negative correlation) to +1 (perfect positive correlation), with 0 indicating no linear relationship. This method is applied in fields such as image recognition, time series analysis, signal processing, and data clustering, which is sensitive to outliers and primarily captures linear relationships.
The PCC is a measure of the linear relationship between two variables. Its formula is
where and are the ith data points of the two variables, and and are their means. is the sample number of the data points.
3. Results
3.1. Improvement in the Initial Analysis by Assimilating Radar Data
An effective data assimilation system can incorporate observational data into the analysis, resulting in an analysis that better aligns with the observations compared to the background [44]. To evaluate the agreement between radar observations (“O”) and both the background (“B”) and analysis (“A”), the probability density function (PDFs) of the observation-minus-background (OMB) and observation-minus-analysis (OMA) differences for the RV and REF, averaged over all cases, are assessed. As shown in Figure 5, the PDFs of both OMB and OMA for RV and REF present a Gaussian-like distribution with an approximately zero mean (Figure 5), implying that the fitting of both the analysis and background is nearly unbiased (i.e., exhibit approximately zero skewness). Quantitatively, the standard deviation of OMA is smaller than that of OMB by about 15% for the RV (2.85 vs. 3.37 m s−1) and 9% for the REF (3.64 vs. 4.00 DBZ), suggesting that the analysis fits the observations better than the background.
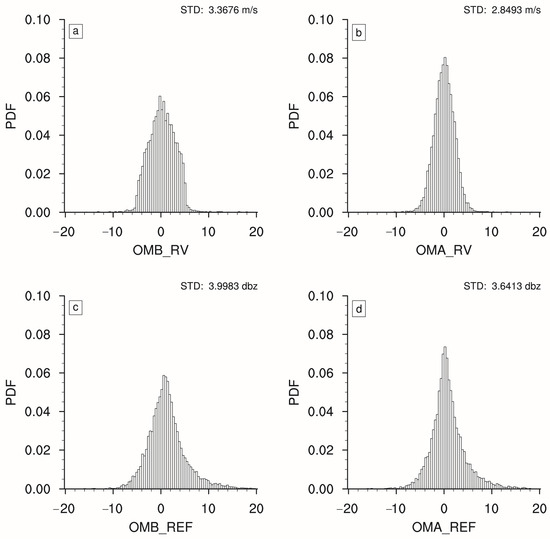
Figure 5.
Probability density functions (PDFs) of (a) observation-minus-background (OMB) and (b) observation-minus-analysis (OMA) for radial velocity (RV) averaged over all cases. (c,d) Same as (a,b) but for radar reflectivity (REF). STD indicates the standard deviation.
Figure 6 shows 850-hPa meridional wind and wind vector analyses at 2000 UTC 15 May 2019 for CTL (Figure 6a), RAD (Figure 6b), and their analysis increment (i.e., analysis minus FG) (Figure 6c,d). Near 26°N, 117.5°E, where the heavy rainfall event occurred (Figure 1a), the RAD analysis exhibits stronger northerly winds than the CTL analysis. The southerly–northerly wind convergence in the RAD analysis (Figure 6b) is more favorable for heavy rainfall than the purely southerly wind in the CTL analysis (Figure 6a). The RAD analysis increment reveals a clearer convergent southerly–northerly couplet (Figure 6d), implying that radar observations resolve finer meso- and small-scale structures than WPR observations and thus enhance localized short-term heavy-rain forecasts. Similar features also appear at 925 and 700 hPa. Radar data assimilating intensifies the low-level southerly–northerly convergence near 26°N, 117.5°E. Conversely, radar data assimilation enhances the upper-level southerly–northerly divergence at 300 hPa over the same area. This low-level convergence coupled with the upper-level divergence favors heavy precipitation development.
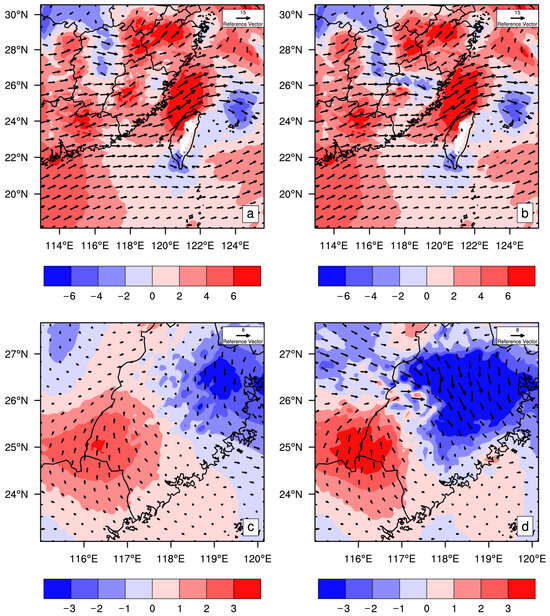
Figure 6.
Analyses of 850-hPa meridional wind (shaded, units: m s−1) and wind vectors (units: m s−1) for (a) CTL and (b) RAD at 2000 UTC 15 May 2019. (c,d) Same as (a,b) but for analysis increments (i.e., analysis minus FG). Red shading represents southerly winds, while blue shading represents northerly winds.
3.2. Improvement in the Forecast by Assimilating Radar Data
The TS and BIAS for hourly precipitation forecasts from CTL and RAD, averaged over all cases, are shown in Figure 7. Both CTL and RAD exhibit a greater forecast skill for precipitation thresholds exceeding 0.1 mm (Figure 7a). Although the TS declines from 0.19 to 0.15 with the lead time, RAD consistently outperforms CTL in the hourly precipitation forecast, especially within the first 5 h. The maximum TS improvement of RAD over CTL reaches about 11% for the 0.1 mm thresholds at the 1 h lead time. For precipitation exceeding 15 mm, RAD demonstrates a significantly higher forecast skill than CTL. The TS of RAD is nearly three times that of CTL at 1h. It possibly implies that the WPR observation assimilated in the CTL are sparser and thus cannot provide as detailed information on mesoscale systems as radar observations. Compared with radar assimilation, the lack of mesoscale detailed in the WPR-based analyses may yield a less accurate precipitation forecast.
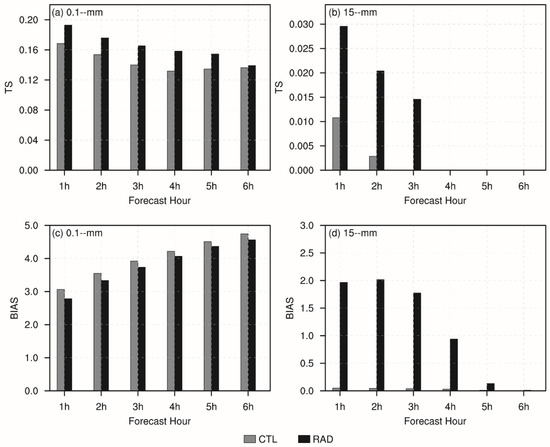
Figure 7.
Sample mean (a,b) Threat Score and (c,d) Bias Score for the predictions of hourly precipitation exceeding 0.1 and 15 mm in CTL (gray bars) and RAD (black bars).
BIAS values of hourly precipitation exceeding 0.1 mm are similar between the CTL and RAD (Figure 7c). But for precipitation exceeding 15 mm, the CTL shows a significantly lower BIAS than RAD (Figure 7d), suggesting that the forecast with less detailed mesoscale information in the analysis may underestimate the area of heavy hourly rainfall. By resolving detailed mesoscale structures, radar assimilation enlarges the heavy-rain area and thus yields a higher forecast skill for intense precipitation.
Since the 6 h maximum accumulated precipitation peaked at 193.3 mm between 1800 UTC 15 May and 0000 UTC 16 May 2019 (Figure 1b), the hourly precipitation skill of CTL and RAD, initialized at 2000 UTC 15 May, is examined (Figure 8). Observations (Figure 8c,f,i) reveal a pronounced precipitation maximum over central Fujian, with hourly amounts exceeding 15 mm. Noticeable underestimation occurs in CTL (Figure 8a,d,g), where both the precipitation area and intensity are markedly smaller than observed. Meanwhile, the RAD better captures the intensity of the maximum precipitation center than CTL (Figure 8b,e,f). This improvement likely reflects radar assimilation refining the structure and intensity of mesoscale systems in the initial conditions (see Figure 6). Moreover, the forecasting skill of both RAD and CTL deteriorated markedly after the third hour, suggesting that the predictability limits of such mesoscale systems may be approximately three hours. To address this question, the CTL and RAD analyses and forecasts are decomposed into large-scale and mesoscale components using the Barnes filter, and the predictability of each scale is subsequently examined.
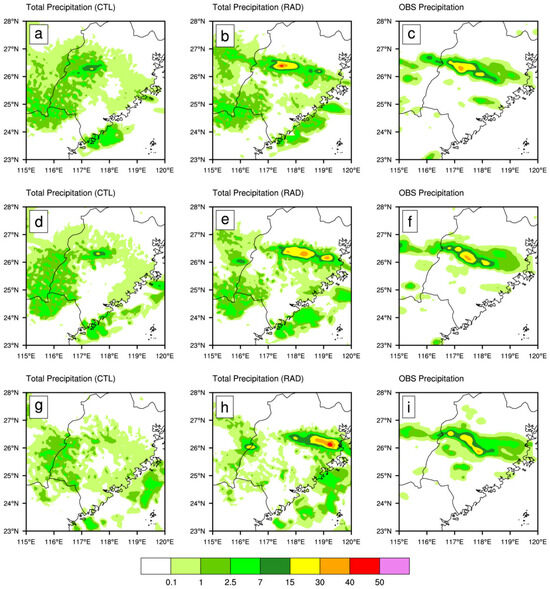
Figure 8.
Hourly precipitation forecasts from (a,d,g) CTL and (b,e,h) RAD at 2100, 2200, and 2300 UTC 15 May 2019, initialized at 2000 UTC 15 May 2019, with (c,f,i) as the corresponding observations.
3.3. Impact of Radar DA on the Predictions at Different Spatial Scales
3.3.1. Selection of Weight Constant in the Response Function
The Barnes filter is a widely used spatial filtering technique that applies Gaussian weights to interpolate each grid point, yielding a low-pass filter that removes high-frequency fluctuations. By tuning the filtering constant C, low-frequency fluctuations at various scales are retained, enabling the separation of large-scale and mesoscale systems. Figure 9 illustrates the response functions for different filtering constants C. For a smaller C (e.g., 2000), the filter function converges rapidly at shorter wavelengths, and the response function quickly reaches its maximum value. This results in the filtering of small-scale wave systems with wavelengths less than 200 or 300 km. Conversely, for larger values of C (e.g., 40,000), the filter function converges at longer wavelengths, and the response function approaches its maximum more gradually. Thus, the filter predominantly affects larger-scale waves, removing systems with wavelengths smaller than 1000 km. In this study, a value of C = 7000 is chosen to separate systems with wavelengths smaller than 500 km from larger-scale features.
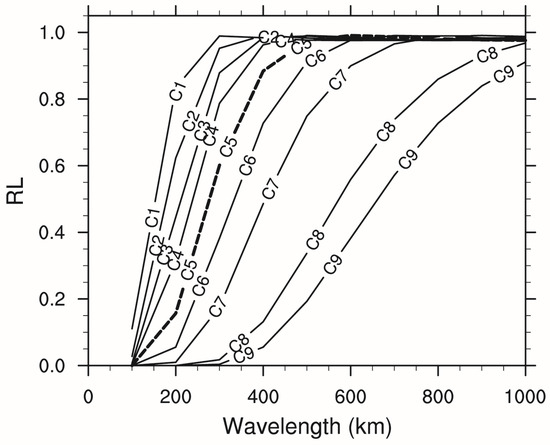
Figure 9.
Modified response functions versus wavelengths. C1–C9 represent filtering constants 2000, 3000, 4000, 5000, 7000, 10,000, 15,000, 30,000, and 40,000. When the response function is 0, the wave is fully preserved; when it is 1, the wave is entirely filtered out.
3.3.2. Impact of Radar DA on the Analysis at the Meso- and Large-Scale
Figure 10 compares meso- and large-scale analysis increments of 850-hPa divergence and wind vectors between the CTL and RAD experiments. In CTL, which assimilates only wind profiler radar data with a coarse spatial resolution of ~80 km, the resulting mesoscale divergence field is spatially homogeneous and weakly convergent. Wind vectors are scattered, reflecting the wind profiler radar’s inability to resolve fine-scale atmospheric structures (Figure 10a). At the large-scale, the convergence is weak, and the wind vectors lack necessary details (Figure 10c).
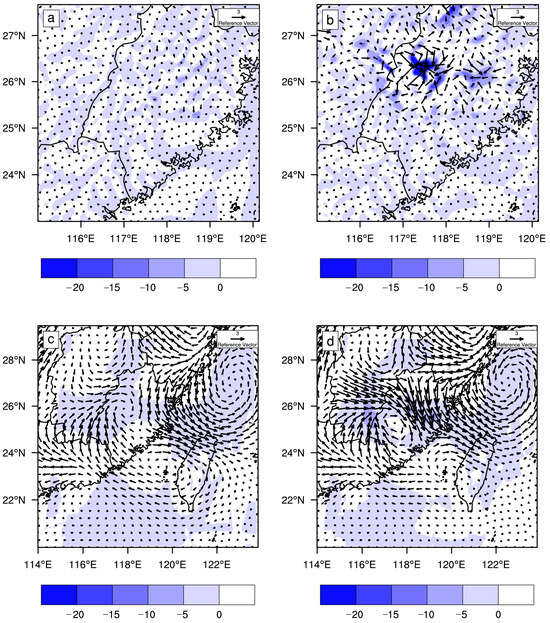
Figure 10.
Analysis increments of 850-hPa divergence (shaded, units: 10–5 s−1) and wind vectors (units: m s−1) for (a) CTL and (b) RAD at mesoscale, initialized at 2000 UTC 15 May 2019. (c,d) Same as (a,b) but for large-scale increments.
In contrast, the RAD experiment, which assimilates both the wind profiler and Doppler weather radar data, shows notable improvements. The Doppler weather radar, featuring a high spatial resolution of 1 km, enables RAD to resolve more concentrated and intense convergence zones at the mesoscale (Figure 10b). Correspondingly, wind vectors accordingly show a clear tendency to converge. The large-scale RAD field reveals local convergence characteristics and distinct wind vector circulation patterns (Figure 10d). Evidently, Doppler radar assimilation markedly enhances the accuracy of analyzing these key atmospheric parameters.
3.4. Temporal Evolution of Meso- and Large-Scale Systems in the Analysis
Figure 11 shows 850-hPa wind and divergence analyses at different spatial scales from 1800 UTC 15 May to 0000 UTC 16 May 2019. At the mesoscale, the RAD experiment exhibits well-defined strong convergence zones. RAD wind vectors also show a concentrated and organized convergence pattern, confirming its superiority in resolving mesoscale wind field convergence.
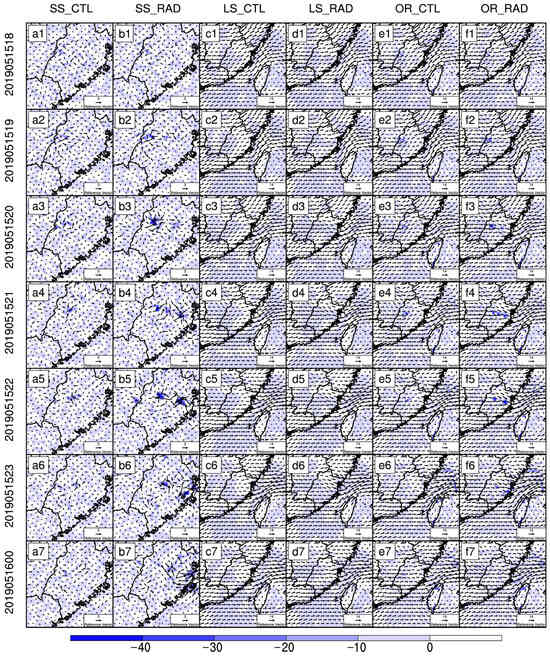
Figure 11.
Analysis of 850-hPa divergence (shaded, units: 10−5 s−1) and wind vectors (units: m s−1). (a1–a7) CTL analysis at mesoscale initialized at 1800−2300 UTC 15 May 2019 and 0000 UTC 16 May 2019. (b1–b7) Same as (a1–a7) but for RAD. (c1–c7,d1–d7) Same as (a1–a7,b1–b7) but for large-scale analysis. (e1–e7,f1–f7) Same panels for original analysis.
In the large-scale analysis, RAD (Figure 11(d1–d7)) provides a more finer-scale convergence field and wind vector circulation patterns than CTL (Figure 11(c1–c7)). Likewise, in the original analysis, RAD (Figure 11(f1–f7)) captures details more effectively than the CTL (Figure 11(e1–e7)). In summary, assimilating Doppler radar data markedly improves the depiction of mesoscale wind field convergence and the multi-scale temporal evolution of weather systems.
Because the RAD analysis resolves finer observational detail, the averaged Pearson correlation coefficients (PCCs) of 850-hPa zonal (U) and meridional (V) winds between the RAD analyses across all cases are calculated (Figure 12). For both zonal (U) and meridional (V) winds at the large-scale, the PCCs between the current and late-hour wind analysis show a gradual, steady decline, reflecting the slow evolution and persistence of the large-scale circulation systems. Compared with large-scale wind fields, the PCCs of mesoscale zonal and meridional components decline rapidly within the first three hours. After 3 h, the PCC index saturates at a low value, indicating that mesoscale wind fields evolve fastest and are the least predictable.
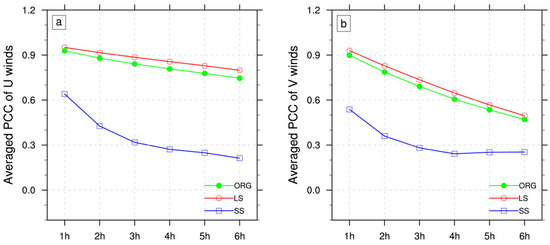
Figure 12.
Averaged Pearson correlation coefficients (PCCs) of 850-hPa wind analysis for all RAD cases: (a) zonal (U) and (b) meridional (V). Labels “1 h” to “6 h” denote correlations between the current analysis and analyses 1−6 h later.
The comparison shows that U-wind PCCs remain consistently higher and decay more slowly than V-wind PCCs, indicating the more rapid evolution of V-wind. This may be attributed to the fact that U-winds are more prominently dominated by planetary-scale circulation. Especially at the mid to high latitudes, the westerly belt imposes a stable zonal wind pattern that is easier to predict. The V-wind field, in addition to being affected by large-scale circulation, is perturbed by complex factors such as frontal activities and topographic forcing, rendering its evolution more complex and less predictable.
3.5. Predictability in the Forecast at the Meso- and Large-Scale
Average PCCs of 850-hPa wind forecasts against the corresponding analysis are compared between the CTL and RAD at 1–6 h lead times for different spatial scales (Figure 13). The results indicate that large-scale information exhibits good stability and reliability, retaining high PCCs even at the 6-hour forecast time. In contrast, the mesoscale accuracy declines rapidly, with PCCs falling 50–60% between 1 and 6 h in both the RAD and CTL. This underscores the inherent complexity and variability of mesoscale weather systems. When comparing the two experiments, RAD generally exhibited higher PCCs than CTL, especially for mesoscale forecasts within the first 3 h, demonstrating the short-term advantages of radar assimilation. Weather radar assimilation markedly improves 850-hPa wind speed forecasts, particularly for mesoscale fields. However, these improvements diminish by the 6th hour, especially for the V-wind component, indicating the short-term benefits of weather radar data assimilation. While large-scale information demonstrates greater stability in forecasts, the impact of radar assimilation on large-scale forecasts is relatively limited.
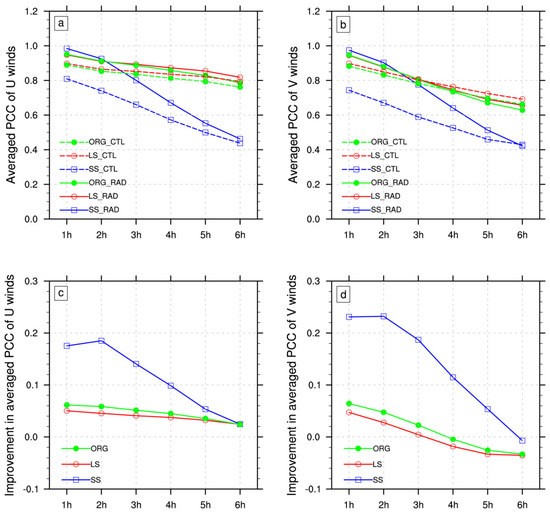
Figure 13.
Averaged Pearson correlation coefficients (PCCs) of 850-hPa wind forecasts against the corresponding analysis at the same lead time for CTL and RAD: (a) zonal (U) and (b) meridional (V). (c,d) Same as (a,b) but for PCC differences between RAD and CTL (PCC_RAD-minus-PCC_CTL). Labels “1 h” to “6 h” represent the forecast times.
3.6. Impact of Different Filter Parameters
Figure 14 illustrates how filter parameters (varying wavelengths) affect 850-hPa U- and V-wind field forecast improvements. Regardless of filter parameters, radar assimilation improves mesoscale winds only within the first 2 h and decays rapidly (Figure 14a,b). This consistent result indicates that radar assimilation offers a clear short-term forecast advantage but contributes little over a longer lead time.
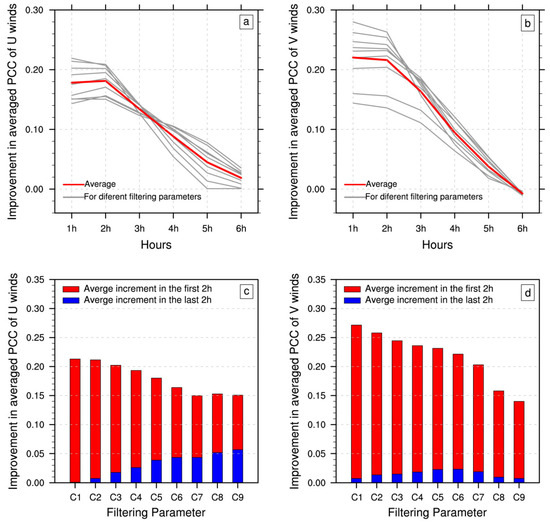
Figure 14.
PCC differences (PCC_RAD-minus-PCC_CTL) for 850-hPa (a) U- and (b) V-winds, averaged across all cases with varying filter parameters. Gray curves denote results for individual filter parameters, while red curves indicate the average across all parameters. (c,d) Mean PCC_RAD-minus-PCC_CTL versus filter parameters for the first 2 h (red bars) and last 2 h (blue bars) of forecasts.
Figure 14c,d further examine how filter parameters influence the improvement from radar assimilation. The results indicate that, as the filter parameter increases (i.e., wavelength lengthens), the enhancement effect weakens, suggesting that shorter wavelengths (mesoscale information) benefit more from radar assimilation. Moreover, the red–blue bars difference shows that shorter wavelengths yield a faster loss of both improvement and forecast skills. This highlights the greater effectiveness of radar assimilation for short-term forecasts at the mesoscale, although its effectiveness decreases rapidly over time.
4. Summary and Conclusions
This study investigated the impact of Doppler radar assimilation on short-term numerical weather forecasting for a Southern China heavy-rain event across different spatial scales. The following are the key findings and conclusions:
Improvement in Initial Analysis: Radar assimilation significantly improved the initial analysis compared to assimilating only the wind profiler data. The analysis increments showed more detailed and refined mesoscale features, particularly in the 850-hPa wind field. This improvement is crucial for enhancing the accuracy of short-term heavy precipitation forecasts.
Enhancement in Precipitation Forecasting: Radar assimilation leads to notable improvements in hourly precipitation forecasts, especially for precipitation exceeding 0.1 mm. The Threat Score and Bias Score verified that radar assimilation consistently outperformed wind profiler data assimilation, especially within the first 3 h. For precipitation over 15 mm, the improvement was even more significant, confirming that radar data resolves the mesoscale detail essential for heavy-rain accuracy.
Spatial Scale Analysis: The Barnes filter decomposition revealed that radar assimilation has a more pronounced effect on mesoscale weather systems. Improvement is primarily concentrated in the first 2 h and decays rapidly thereafter. This highlights the short-term benefits of radar assimilation and suggests that the predictability of mesoscale systems may be limited to about 3 h. This limitation may arise from the poor predictability of strongly nonlinear, rapidly evolving mesoscale weather systems.
Predictability of Weather Systems: Large-scale weather systems exhibit greater stability and predictability, maintaining relatively high Pearson correlation coefficients (PCCs), even at the validity time of 6 h. In contrast, the mesoscale systems showed a rapid decline in PCCs, indicating their inherent complexity and variability. Radar assimilation played a crucial role in enhancing the forecast accuracy for mesoscale systems in the short term but had limited impact on long-term forecasts.
Limitations and Future Work: Despite the significant improvements from radar data assimilation, the study also identified limitations. The rapid decline in forecast skill after the first few hours suggests that the predictability of mesoscale systems is inherently limited. Sparse observations and data assimilation techniques cannot fully resolve convective cells or boundary layer structures, inevitably introducing initial uncertainties. Future work should focus on refining numerical models and exploring advanced data assimilation techniques to extend the predictability of these systems. More radar data assimilation experiments for diverse weather cases (e.g., tropical cyclones, squall lines) will also be conducted.
Author Contributions
Conceptualization, G.L. and D.L.; methodology, D.L.; software, G.L.; validation, G.L., T.L. and G.Q.; formal analysis, G.L.; investigation, Z.S.; resources, Z.S.; data curation, G.Q.; writing—original draft preparation, G.L. and D.L.; writing—review and editing, D.L.; visualization, G.L. and T.L.; supervision, D.L.; project administration, D.L.; funding acquisition, D.L. All authors have read and agreed to the published version of the manuscript.
Funding
This research was funded by National Natural Science Foundation of China grant number [42205060], National Natural Science Foundation of China grant number [U2442208], Social Development Guidance Project of Fujian Province grant number [2024Y0076], and Open Project of Laboratory of Straits Meteorology grant number [2024KFKT09].
Data Availability Statement
The datasets generated during the current study are available from the corresponding author on reasonable request. The source observational data are not publicly available due to legal restrictions.
Acknowledgments
The authors sincerely thank the anonymous reviewers and academic editor for their constructive comments and suggestions.
Conflicts of Interest
The authors declare no conflict of interest.
Appendix A
Appendix A.1. Initial Field Estimate
In the first step of Barnes filtering, an initial field estimate is computed based on a weighted average of the surrounding observation points.
The weight is determined by the following formula:
where is the distance between the target point and the kth observation point , and is a constant that controls the scale of the filter. This weighted average allows us to obtain a smooth initial field estimate, which minimizes large fluctuations in space.
Appendix A.2. First Correction Step
After calculating the initial field , the next step is to make a first correction based on the observational data. The corrected field is given by the following formula:
where represents the error term, which indicates the difference between the observed value and the initial field estimate. By adding the adjustment data to the initial field value, we further correct the spatial field estimate.
In this step, the weight is also adjusted, usually based on distance, to select the appropriate weight factor. The key to this step is to use the observational data to reduce the bias in the initial estimate . is a constant with a value range from 0 to 1.
Appendix A.3. Further Correction and Final Field Estimation
Building on the second step, the Barnes filtering method further refines the final field , making the field estimate more accurate. The final field value is given by
where represents the correction error term, which indicates the difference between the first correction and the initial estimate. In this way, the final field is not just a weighted average of the initial estimate but is further reduced for errors and uncertainty to produce a smoother and more precise estimate.
Appendix A.4. Response Functions
Each step of Barnes filtering has a corresponding response function that determines the weighted influence of each stage of the filter. Here are the response functions at each stage of Barnes filtering:
Appendix A.4.1. Initial Response Function
This function describes the weighted influence of the initial estimate. Typically, the weight decays rapidly with distance, ensuring that regions far from the observation points have less impact on the estimate.
Appendix A.4.2. First Corrected Response Function
In this stage, the initial response function is further adjusted, modifying the parameter to make the field estimate smoother.
Appendix A.4.3. Final Corrected Response Function
This stage provides the final adjustment to the response function, ensuring the smoothness and accuracy of the final field estimate.
References
- Foresti, L.; Rabier, F.; Hamill, T.M.; Livings, D.M. Assessment of two approaches for very short range precipitation probabilistic prediction. Tellus A 2016, 68, 31117. [Google Scholar]
- Gebremichael, M.; Krajewski, W.F.; Kruger, E.L. Assessment and modelling of uncertainty in precipitation forecasts. J. Hydrol. 2004, 298, 58–78. [Google Scholar]
- Liao, Y.; Lu, S.; Yin, G. Short-Term and Imminent Rainfall Prediction Model Based on ConvLSTM and SmaAT-UNet. Sensors 2024, 24, 3576. [Google Scholar] [CrossRef] [PubMed]
- Bergot, T. Adaptive observations during FASTEX: A systematic survey of upstream flights. J. R. Meteorol. Soc. 1999, 125, 3271–3298. [Google Scholar] [CrossRef]
- Szunyogh, I.; Toth, Z.A.; Emanuel, K.; Bishop, C.; Snyder, C.; Morss, R.; Woolen, J.; Marchok, T. Ensemble-based targeting experiments during FASTEX: The effect of dropsonde data from the lear jet. J. R. Meteorol. Soc. 1999, 125, 3189–3217. [Google Scholar]
- Reynolds, C.A.; Webster, P.J.; Kalnay, E. Random Error Growth in NMC’s Global Forecasts. Mon. Weather Rev. 1994, 122, 1281–1305. [Google Scholar] [CrossRef]
- Collischonn, W.; Haas, R.; Andreolli, I. Forecasting River Uruguay flow using rainfall forecasts from a regional weather-prediction model. J. Hydrol. 2005, 305, 87–98. [Google Scholar] [CrossRef]
- Bruno, F.; Cocchi, D.; Greco, F.; Scardovi, E. Spatial reconstruction of rainfall fields from rain gauge and radar data. Stoch. Environ. Res. Risk Assess. 2014, 28, 1235–1245. [Google Scholar] [CrossRef]
- Jiang, J.H.; Yue, Q.; Su, H.; Kangaslahti, P.; Lebsock, M.; Reising, S.; Schoeberl, M.; Wu, L.; Herman, R.L. Simulation of Remote Sensing of Clouds and Humidity from Space Using a Combined Platform of Radar and Multifrequency Microwave Radiometers. Earth Space Sci. 2019, 6, 1234–1243. [Google Scholar] [CrossRef]
- Xiao, Q.; Sun, J. Multiple-Radar Data Assimilation and Short-Range Quantitative Precipitation Forecasting of a Squall Line Observed During IHOP_2002. Mon. Weather Rev. 2007, 135, 3381–3404. [Google Scholar] [CrossRef]
- Wakimoto, R.M.; Cai, H.; Murphy, H.V. The Superior, Nebraska, Supercell During BAMEX. Bull. Am. Meteorol. Soc. 2004, 85, 1095–1106. [Google Scholar] [CrossRef][Green Version]
- Sugimoto, S.; Crppl, N.A.; Sun, J.; Xiao, Q.; Barker, D.M. An Examination of WRF 3DVAR Radar Data Assimilation on Its Capability in Retrieving Unobserved Variables and Forecasting Precipitation Through Observing System Simulation Experiments. Mon. Weather Rev. 2009, 137, 4011–4029. [Google Scholar] [CrossRef]
- Chang, S.F.; Sun, Y.C.; Sun, J.; Tai, S.-L. The Implementation of the Ice-Phase Microphysical Process into a Four-Dimensional Variational Doppler Radar Analysis System (VDRAS) and Its Impact on Parameter Retrieval and Quantitative Precipitation Nowcasting. J. Atmos. Sci. 2016, 73, 1015–1038. [Google Scholar] [CrossRef]
- Natenberg, E.; Gao, J.; Xue, M.; Carr, F.H. Analysis and Forecast of a Tornadic Thunderstorm Using Multiple Doppler Radar Data, 3DVAR, and ARPS Model. Adv. Meteorol. 2013, 281695. [Google Scholar] [CrossRef]
- Sun, J. Initialization and Numerical Forecasting of a Supercell Storm Observed during STEPS. Mon. Weather Rev. 2005, 133, 793–813. [Google Scholar] [CrossRef]
- Sun, J.; Zhang, Y. Analysis and Prediction of a Squall Line Observed during IHOP Using Multiple WSR-88D Observations. Mon. Weather Rev. 2008, 136, 2364–2388. [Google Scholar] [CrossRef]
- Li, H.; Hu, Y.; Xu, X. Characteristic Features of the Evolution of a Meiyu Frontal Rainstorm with Doppler Radar Data Assimilation. Adv. Meteorol. 2018, 9802360. [Google Scholar] [CrossRef]
- Pu, Z.; Li, X.; Sun, J. Impact of Airborne Doppler Radar Data Assimilation on the Numerical Simulation of Intensity Changes of Hurricane Dennis near a Landfall. J. Atmos. Sci. 2009, 66, 3351–3365. [Google Scholar] [CrossRef]
- Dong, J.; Xue, M. Assimilation of radial velocity and reflectivity data from coastal WSR-88D radars using an ensemble Kalman filter for the analysis and forecast of landfalling hurricane Ike (2008). Q. J. R. Meteorol. Soc. 2012, 139, 467–487. [Google Scholar] [CrossRef]
- Li, X.; Ming, J.; Wang, Y.; Zhao, K.; Xue, M. Assimilation of T-TREC-retrieved wind data with WRF 3DVAR for the short-term forecasting of typhoon Meranti (2010) near landfall. J. Geophys. Res.-Atmos. 2013, 118, 10361–10375. [Google Scholar] [CrossRef]
- Wang, M.J.; Xue, M.; Zhao, K.; Dong, J. Assimilation of T-TREC-Retrieved Winds from Single-Doppler Radar with an Ensemble Kalman Filter for the Forecast of Typhoon Jangmi (2008). Mon. Weather Rev. 2014, 142, 1892–1907. [Google Scholar] [CrossRef]
- Qian, Y.; Peng, S.; Liu, S.; Chen, S.; Wang, Z.; Wan, Q.; Chen, Z. Assessing the influence of assimilating radar-observed radial winds on the simulation of a tropical cyclone. Nat. Hazards 2018, 94, 279–298. [Google Scholar] [CrossRef]
- Xiao, Q.; Kuo, Y.H.; Sun, J.; Lee, W.-C.; Lim, E.; Guo, Y.-R.; Barker, D.M. Assimilation of Doppler Radar Observations with a Regional 3DVAR System: Impact of Doppler Velocities on Forecasts of a Heavy Rainfall Case. J. Appl. Meteorol. Climatol. 2005, 44, 768–788. [Google Scholar] [CrossRef]
- Hu, M.; Xue, M.; Gao, J.; Brewster, K. 3DVAR and Cloud Analysis with WSR-88D Level-II Data for the Prediction of the Fort Worth, Texas, Tornadic Thunderstorms. Part II: Impact of Radial Velocity Analysis via 3DVAR. Mon. Weather Rev. 2006, 134, 699–721. [Google Scholar] [CrossRef]
- Chung, K.; Zawadzki, I.; Yau, M.K.; Fillion, L. Short-Term Forecasting of a Midlatitude Convective Storm by the Assimilation of Single–Doppler Radar Observations. Mon. Weather Rev. 2009, 137, 4415–4435. [Google Scholar] [CrossRef]
- Gao, J.; Stensrud, D.J. Assimilation of Reflectivity Data in a Convective-Scale, Cycled 3DVAR Framework with Hydrometeor Classification. J. Atmos. Sci. 2012, 69, 1054–1065. [Google Scholar] [CrossRef]
- Sun, J.; Crook, N.A. Dynamical and microphysical retrieval from Doppler radar observations using a cloud model and its adjoint. Part I: Model development and simulated data experiments. J. Atmos. Sci. 1997, 54, 1642–1661. [Google Scholar] [CrossRef]
- Kawabata, T.; Kuroda, T.; Seko, H.; Saito, K. A cloud-resolving 4DVAR assimilation experiment for a local heavy rainfall event in the Tokyo metropolitan area. Mon. Weather Rev. 2011, 139, 1911–1931. [Google Scholar] [CrossRef]
- Wang, L.; Liu, Y.; Xu, D.; Zhang, L.; Leung, J.C.H.; Li, H.; Gong, J.; Zhang, B. An incremental analysis update in the framework of the four-dimensional variational data assimilation: Description and preliminary tests in the operational China Meteorological Administration Global Forecast System. Q. J. R. Meteorol. Soc. 2024, 150, 2104–2122. [Google Scholar] [CrossRef]
- Sun, J.; Wang, H. Radar Data Assimilation with WRF 4D-Var. Part II: Comparison with 3D-Var for a Squall Line over the US Great Plains. Mon. Weather Rev. 2013, 141, 2245–2264. [Google Scholar] [CrossRef]
- Wang, H.; Sun, J.; Zhang, X. Radar Data Assimilation with WRF 4D-Var. Part I: System Development and Preliminary Testing. Mon. Weather Rev. 2013, 141, 2224–2244. [Google Scholar] [CrossRef]
- Li, Y.; Wang, X.; Xue, M. Assimilation of Radar Radial Velocity Data with the WRF Hybrid Ensemble–3DVAR System for the Prediction of Hurricane Ike (2008). Mon. Weather Rev. 2012, 140, 3507–3524. [Google Scholar] [CrossRef]
- Tian, J.; Liu, J.; Yan, D.; Li, C.; Chu, Z.; Yu, F. An assimilation test of Doppler radar reflectivity and radial velocity from different height layers in improving the WRF rainfall forecasts. Atmos. Res. 2017, 198, 32–144. [Google Scholar] [CrossRef]
- Tsai, C.C.; Yang, S.C.; Liou, Y.C. Improving quantitative precipitation nowcasting with a local ensemble transform Kalman filter radar data assimilation system: Observing system simulation experiments. Tellus A 2014, 66, 21804. [Google Scholar] [CrossRef]
- Yue, J.; Meng, Z. Impact of assimilating Taiwan’s coastal radar radial velocity on forecasting Typhoon Morakot (2009) in southeastern China using a WRF-based EnKF. Sci. China Earth Sci. 2016, 60, 315–327. [Google Scholar] [CrossRef]
- Li, X.; Zeng, M.; Wang, Y.; Wang, W.; Wu, H.; Mei, H. Evaluation of two momentum control variable schemes and their impact on the variational assimilation of radar wind data: Case study of a squall line. Adv. Atmos. Sci. 2016, 33, 1143–1157. [Google Scholar] [CrossRef]
- Montmerle, T.; Faccani, C. Mesoscale assimilation of radial velocities from Doppler radars in a preoperational framework. Mon. Weather Rev. 2009, 137, 1939–1953. [Google Scholar] [CrossRef]
- Tai, S.L.; Liou, Y.C.; Sun, J.Z.; Chang, S.-F.; Kuo, M.-C. Precipitation Forecasting Using Doppler Radar Data, a Cloud Model with Adjoint, and the Weather Research and Forecasting Model: Real Case Studies During SoWMEX in Taiwan. Weather Forecast. 2011, 26, 975–992. [Google Scholar] [CrossRef]
- Wang, M.; Xue, M.; Zhao, K. An investigation on how inner-core structures obtained through radar data assimilation affect track forecasting of typhoon Jangmi (2008) near Taiwan Island. J. Geophys. Res.-Atmos. 2016, 121, 10601–10616. [Google Scholar] [CrossRef]
- Bachmann, K.; Keil, C. Impact of radar data assimilation and orography on predictability of deep convection. Q. J. R. Meteorol. Soc. 2019, 145, 117–130. [Google Scholar] [CrossRef]
- Barnes, S.L. A technique for maximizing details in numerical weather map analysis. J. Appl. Meteorol. 1964, 3, 396–409. [Google Scholar] [CrossRef]
- Skamarock, W.C.; Klemp, J.B. A time-split nonhydrostatic atmospheric model for weather research and forecasting applications. J. Comput. Phys. 2008, 227, 3465–3485. [Google Scholar] [CrossRef]
- Barker, D.M.; Huang, W.; Guo, Y.R.; Bourgeois, A.J.; Xiao, Q.N. A three-dimensional variational data assimilation system for MM5: Implementation and initial results. Mon. Weather Rev. 2004, 132, 897–914. [Google Scholar] [CrossRef]
- Liu, D.; Huang, C.; Feng, J. Influence of Assimilating Wind Profiling Radar Observations in Distinct Dynamic Instability Regions on the Analysis and Forecast of an Extreme Rainstorm Event in Southern China. Remote Sens. 2022, 14, 3478. [Google Scholar] [CrossRef]
- Hong, S.Y.; Dudhia, J.; Chen, S.H. A revised approach to ice microphysical processes for the bulk parameterization of clouds and precipitation. Mon. Weather Rev. 2004, 132, 103–120. [Google Scholar] [CrossRef]
- Mlawer, E.J.; Taubman, S.J.; Brown, P.D.; Lacono, M.J.; Clough, S.A. Radiative transfer for inhomogeneous atmospheres: RRTM, a validated correlate-k model for the longwave. J. Geophys. Res. Atmos. 1997, 102, 16663–16682. [Google Scholar] [CrossRef]
- Chou, M.D.; Suarez, M.J. A solar radiation parameterization for atmospheric studies. In Technical Report Series on Global Modeling and Data Assimilation; No. NASA/TM-1999-104606; Suarez, M.J., Ed.; NASA Technical Memorandum: Greenbelt, MD, USA, 1999; Volume 15, p. 40. [Google Scholar]
- Grell, G.A.; Devenyi, D. A generalized approach to parameterizing convection combining ensemble and data assimilation techniques. Geophys. Res. Lett. 2002, 29, 38-1–38-4. [Google Scholar] [CrossRef]
- Janjic, Z.I. The step-mountain Eta coordinate model: Further developments of the convection, viscous layer, and turbulence closure schemes. Mon. Weather Rev. 1994, 122, 927–945. [Google Scholar] [CrossRef]
- Helmus, J.J.; Collis, S.M. The python arm radar toolkit (py-art), a library for working with weather radar data in the python programming language. J. Open Res. Softw. 2016, 4, 25. [Google Scholar] [CrossRef]
Disclaimer/Publisher’s Note: The statements, opinions and data contained in all publications are solely those of the individual author(s) and contributor(s) and not of MDPI and/or the editor(s). MDPI and/or the editor(s) disclaim responsibility for any injury to people or property resulting from any ideas, methods, instructions or products referred to in the content. |
© 2025 by the authors. Licensee MDPI, Basel, Switzerland. This article is an open access article distributed under the terms and conditions of the Creative Commons Attribution (CC BY) license (https://creativecommons.org/licenses/by/4.0/).