Article

Simulation Study of the Effect of Multi-Angle ATI-SAR on Sea Surface Current Retrieval Accuracy

1
College of Oceanography and Space Informatics, China University of Petroleum (East China), Qingdao 266580, China
2
Faculty of Information Science and Engineering, Ocean University of China, Qingdao 266100, China
*
Author to whom correspondence should be addressed.
Remote Sens. 2025, 17(19), 3383; https://doi.org/10.3390/rs17193383
Submission received: 14 September 2025 / Revised: 5 October 2025 / Accepted: 7 October 2025 / Published: 8 October 2025

Abstract

Highlights

What are the main findings?
  • Retrieval accuracy for 2D currents is maximized when dual ATI-SAR viewing angles are near-orthogonal (~90°) and severely degraded when near-parallel (0°/180°).
  • Wind conditions critically impact accuracy: a perpendicular wind-current alignment minimizes velocity error but maximizes direction error, while higher wind speeds degrade both.
What is the implication of the main finding?
  • The results provide a quantitative basis for designing future satellite constellation orbits to maximize near-orthogonal observation opportunities over key ocean areas.
  • The study highlights the need for advanced retrieval algorithms that can correct for complex, wind-induced biases in multi-angle ATI-SAR data.

Abstract

This study investigates the effects of multi-angle along-track interferometric synthetic aperture radar (ATI-SAR) observations on the accuracy of sea surface current retrieval. Utilizing a high-fidelity, full-link SAR ocean simulator, this study systematically assesses the influence of three key factors—the angle between observation directions, the relative orientation of wind and current, and wind speed—on the precision of two-dimensional (2D) current vector retrievals. Results demonstrate that observation geometry is a dominant factor: retrieval errors are minimized when the two viewing directions are near-orthogonal (~90°), while near-parallel (0° or 180°) geometries result in significant error amplification. Furthermore, the angle between wind and current introduces complex, non-linear error characteristics, with a perpendicular alignment minimizing velocity error but maximizing direction error. Higher wind speeds are found to degrade both velocity and direction retrieval accuracy. Collectively, these findings provide crucial quantitative guidance for optimizing the mission design, observation planning, and algorithm development for future multi-angle ATI-SAR satellite constellations dedicated to ocean current monitoring.

1. Introduction

The ocean is a fundamental component of the Earth system, playing a pivotal role in global climate regulation, biogeochemical cycles, and resource provision. Accurate and timely observation of ocean surface dynamics, particularly sea surface currents, is therefore of paramount importance for understanding ocean circulation, predicting climate variability, supporting marine engineering, and ensuring maritime safety [1]. Sea surface currents are governed by a complex interplay of forces and facilitate the transport of heat, nutrients, and pollutants, closely linked to mesoscale and sub-mesoscale phenomena such as eddies, fronts, and internal waves [2,3,4]. High-resolution, wide-area, and accurate quantification of sea surface currents is thus a core objective in modern oceanography.
Traditional measurement techniques, such as Lagrangian drifters and Eulerian moorings, provide highly accurate point-wise data but are limited by sparse spatial coverage and high operational costs [5,6]. Remote sensing techniques have overcome some of these limitations. For instance, coastal high-frequency (HF) radars and X-band radars offer excellent nearshore coverage [7,8], while satellite altimetry provides global data on large-scale geostrophic currents [9]. However, these methods either lack open-ocean capability, are limited by coarse spatiotemporal resolution, or, in the case of optical sensors, are constrained by cloud cover, making them insufficient for resolving fine-scale, rapidly evolving ocean dynamics [10,11,12,13,14,15].
Synthetic Aperture Radar (SAR) has emerged as a powerful tool for oceanographic applications due to its all-weather, day-and-night, high-resolution imaging capabilities [16,17]. The motion of the sea surface induces a Doppler frequency shift in the SAR backscatter, which can be exploited to retrieve the surface current velocity. One established technique is the Doppler Centroid Anomaly (DCA), which estimates the line-of-sight (LOS) velocity from a single SAR image [18,19,20]. Data from missions like Sentinel-1 have facilitated broad applications of DCA in studying coastal currents and wind fields [21,22,23,24]. However, the accuracy of DCA is sensitive to system calibration errors and environmental effects from wind and waves, which can introduce significant uncertainties [25,26].
A more precise technique is Along-Track Interferometry (ATI), which uses two antennas separated along the flight direction to measure the phase difference between two nearly simultaneous SAR images, yielding the LOS velocity with higher accuracy and sensitivity [27]. The successful deployment of ATI modes on satellites like TerraSAR-X, TanDEM-X, and Gaofen-3 has enabled operational measurements with velocity accuracies approaching 0.1 m/s [28,29]. These missions have demonstrated the superior performance of ATI-SAR in capturing fine-scale oceanographic features, such as tidal flows in estuaries, river plumes, and complex eddy structures, providing unprecedented insights into coastal and shelf sea dynamics [30,31].
Despite their high precision, a fundamental limitation of both DCA and ATI-SAR is that a single observation can only measure the one-dimensional (1D) velocity component along the radar’s line of sight. To reconstruct the full two-dimensional (2D) surface current vector, various strategies have been explored, each with significant drawbacks. Current approaches often rely on combining images from ascending and descending satellite passes, but the significant time lag (typically 12–24 h) between acquisitions is too long to capture rapidly evolving currents, rendering the resulting 2D field an unreliable representation of the instantaneous flow [32]. Alternatively, partitioning a single SAR acquisition into multiple sub-apertures provides quasi-multi-angle measurements, albeit at the cost of reduced spatial resolution and increased noise [33]. Integrating SAR with other sensor data, such as optical or infrared imagery, presents its own challenges due to fundamental differences in measurement principles and spatiotemporal resolutions, which complicate data fusion [34,35].
These challenges highlight a critical need for near-simultaneous multi-angle observations to accurately resolve the 2D current vector. While no dedicated satellite mission for this purpose currently exists, this capability is becoming technologically feasible with the advent of future satellite constellations. The concept of using formations of satellites to provide the necessary multi-angle ATI-SAR measurements with short time lags represents a promising path forward. However, even with such future missions on the horizon, the optimal configuration for these multi-angle observations remains an open question. Previous studies have highlighted the potential of multi-angle approaches [36], but have not fully and systematically quantified how crucial factors—such as the angular separation between observation directions, the relative orientation of wind and current, and the ambient wind speed—collectively affect the retrieval errors. This knowledge gap presents a major hurdle for designing effective satellite missions and robust retrieval algorithms.
Therefore, this study aims to fill this knowledge gap by conducting a comprehensive simulation-based investigation. We systematically analyze the impact of multi-angle ATI-SAR observation geometry and environmental factors on the accuracy of 2D sea surface current retrieval. By elucidating the underlying error mechanisms and sensitivities, this research provides a crucial theoretical foundation and quantitative guidance for optimizing the system design, mission planning, and data processing algorithms for future multi-angle ATI-SAR satellite missions dedicated to ocean current monitoring.

2. Principles and Methods

2.1. ATI-SAR Ocean Surface Current Retrieval Principle

Along-Track Interferometric Synthetic Aperture Radar (ATI-SAR) is a powerful technique for measuring the line-of-sight (LOS) velocity of ocean surface currents by exploiting the phase difference between two SAR images acquired by along-track separated antennas. When a SAR system equipped with two along-track antennas observes a moving sea surface, the phase difference between the two images is directly related to the LOS velocity of the scatterers within each resolution cell. Figure 1 illustrates the schematic principle of ATI-SAR retrieval for sea surface LOS velocity.
In Figure 1, point O is the sub-satellite point and is taken as the origin of the coordinate system. The radar flight direction is defined as the positive x-axis (range direction). The y-axis is perpendicular to the radar flight direction in the horizontal plane (azimuth direction), and the trajectory from O to the measured point indicates the direction of the positive y-axis. The z-axis is perpendicular to the sea surface, and the trajectory from O to the satellite indicates the direction of the positive z-axis. The platform height is denoted by H , and the incidence angle is θ i .
In SAR stripmap mode, time delay is referred to as:
Δ t = B V
where Δ t is the time delay between the two acquisitions, B represents an effective along-track baseline length, and V represents radar flight speed. The phases obtained by two antennas for image formation are, respectively:
ϕ 1 = 2 π λ 2 R 1 ( t )
ϕ 2 = 2 π λ 2 R 2 ( t + Δ t )
where R 1 and R 2 are the slant ranges of the same area illuminated by two SAR antennas in succession, and λ is the radar wavelength.
After observing the same target sea surface with two antennas successively, the complex images obtained are denoted as I 1 and I 2 . They can be processed using Equation (4) to obtain the interferometric phase ϕ A T I :
ϕ A T I = arg I 1 I 2
The interferometric phase can also be expressed by Equation (5):
ϕ A T I = 4 π λ Δ R = 4 π λ B V V L O S
where V L O S represents the LOS Doppler velocity, which can be derived from Equation (6):
V L O S = λ V 4 π B ϕ A T I
Then, the radial horizontal velocity (surface velocity projected on the ground range) V r can be readily retrieved by
V r = V L O S sin θ i
The radial horizontal velocity can be expressed in the following form:
V r = V F + V O + V B
where V r is the total velocity obtained from interferometric phase, also known as Doppler velocity; V F is the ocean current velocity; V O is the orbital velocity of large-scale waves; and V B is the phase velocity of Bragg waves. This study employs CDOP to mitigate the impacts of V B and V O on ocean current retrieval.

2.2. Multi-Angle Observations Method

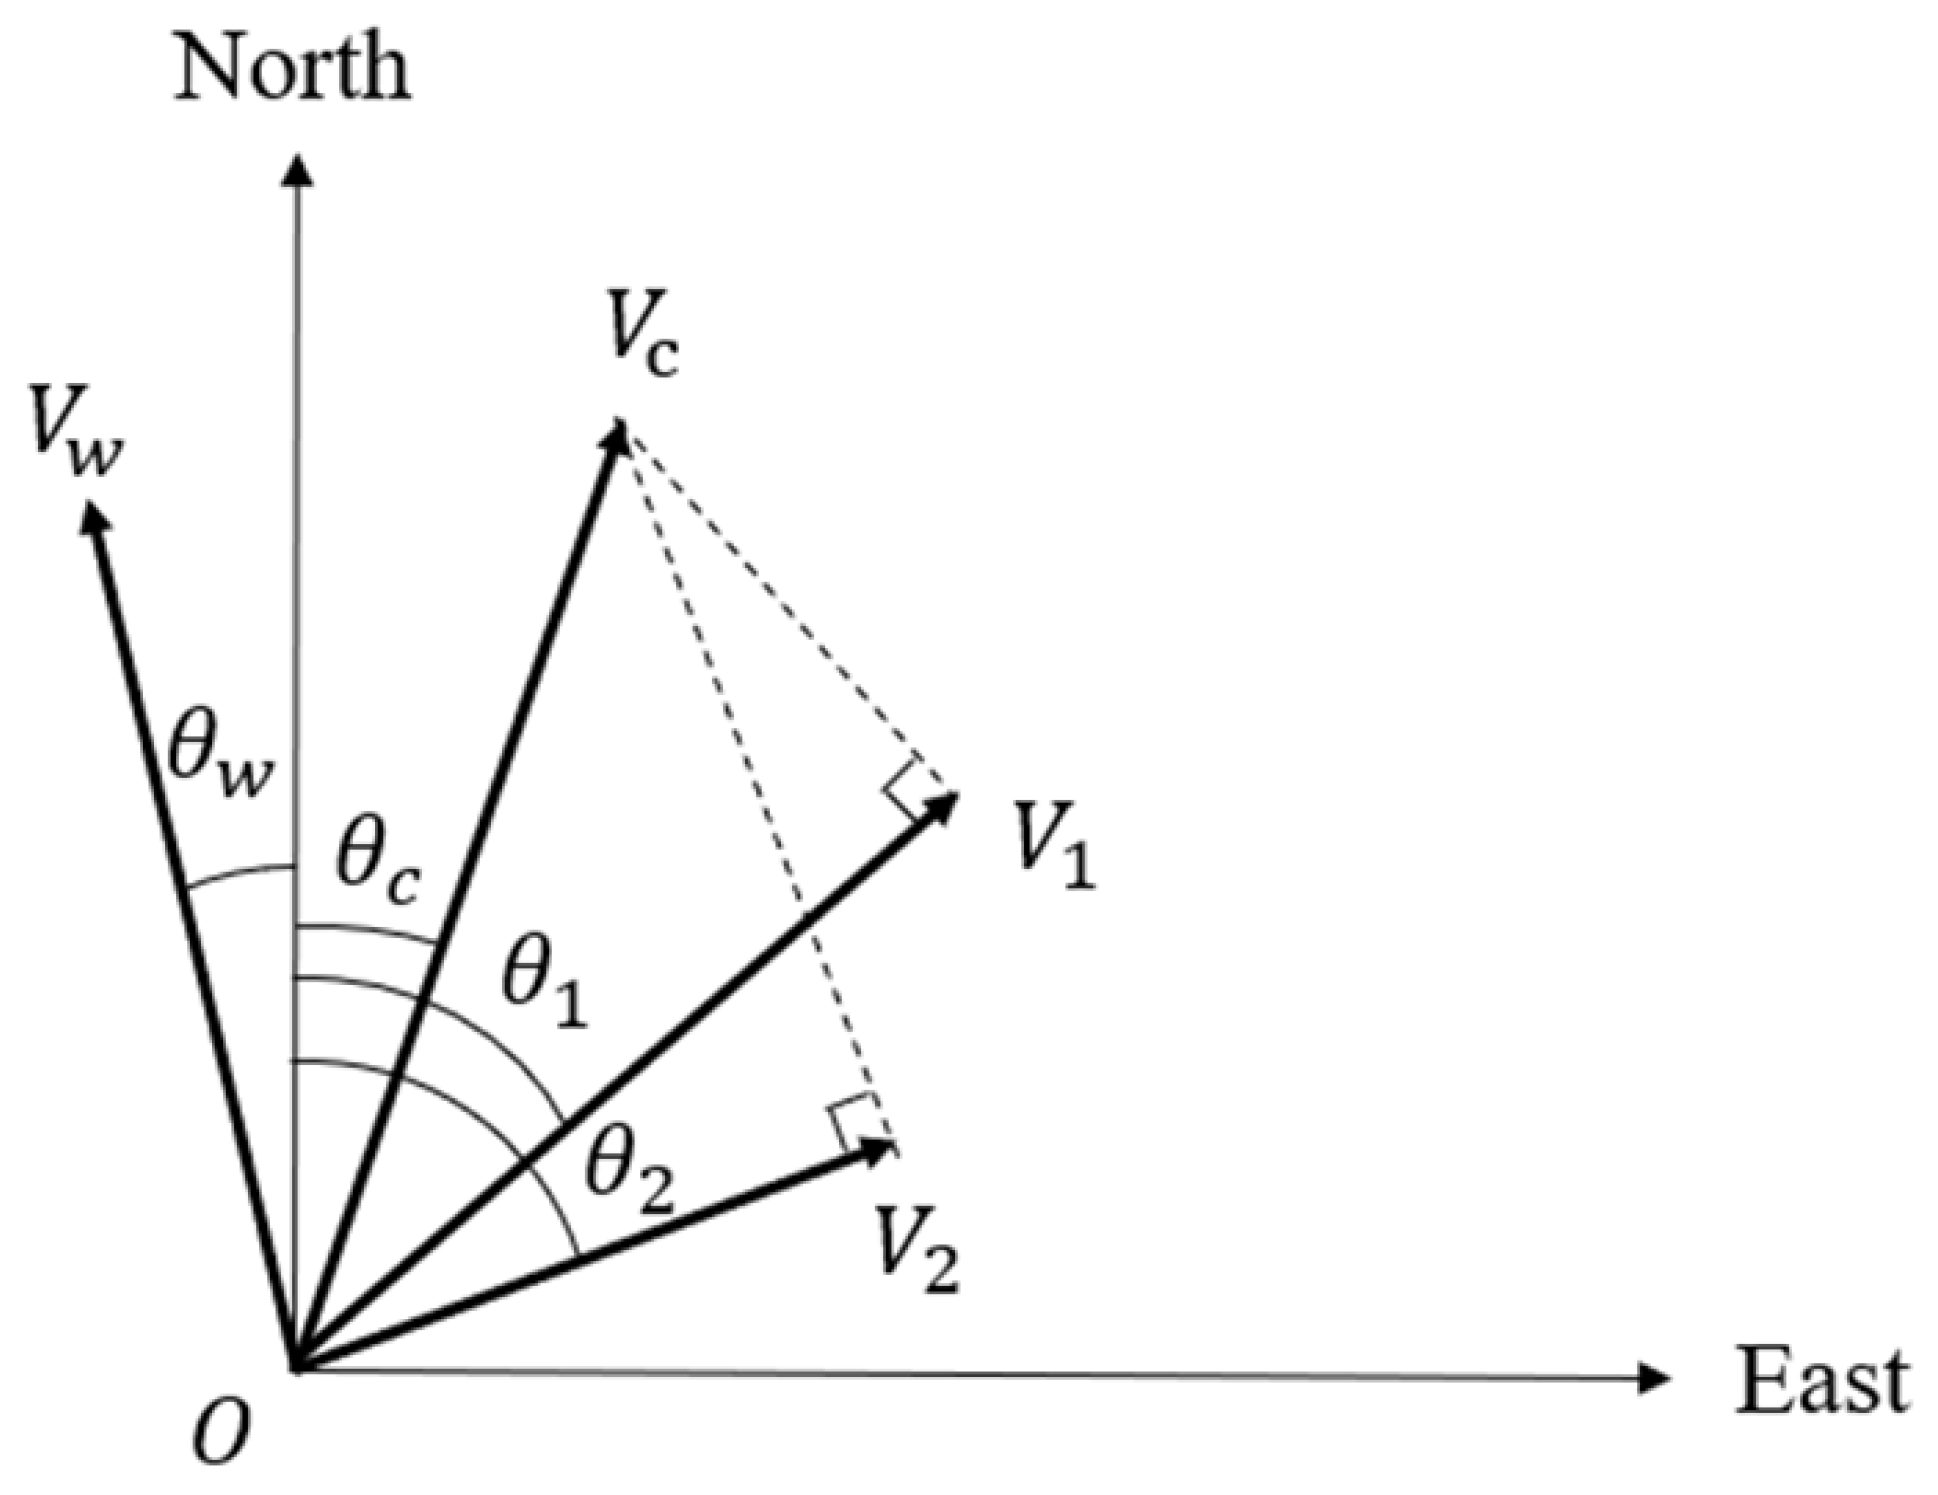
The principle of the multi-angle observation method is to reconstruct the two-dimensional (2D) surface current vector from two or more one-dimensional (1D) LOS velocity measurements obtained from different viewing geometries. The geometric framework for this reconstruction is illustrated in Figure 2. The true 2D current vector, denoted as V c with a direction θ c relative to North, is projected onto two different SAR observation azimuths, θ 1 and θ 2 . These projections yield the two measurable 1D velocities, V 1 and V 2 , respectively.
In the multi-angle observations method, the goal is to calculate the magnitude and direction of the 2D current vector from the two measured 1D velocities and their known observation azimuths. The mathematical relationship is given by the following system of equations:
V 1 = cos θ 1 θ c V c
V 2 = cos θ 2 θ c V c
θ c = θ 1 arctan V 2 V 1 cos θ 1 θ 2 V 1 sin θ 1 θ 2
V c = V 1 cos θ 1 θ c
where V c represents the two-dimensional surface current, V 1 represents the one-dimensional current in one of the observation directions, V 2 represents the one-dimensional current in the other observation direction, θ represents the angle between the two observation directions ( V 1 and V 2 ), θ 1 represents the angle between V 1 and the north direction, θ 2 represents the angle between V 2 and the north direction. θ c represents the direction of the two-dimensional ocean current. By combining Equations (9) and (10), Equations (11) and (12) can be obtained, which allows for the calculation of the two-dimensional ocean current field.
To synthesize a two-dimensional surface current field using two or more one-dimensional surface current measurements, vector composition must be performed for each pairwise combination of observation azimuth angles. The resulting two-dimensional vectors are then averaged to obtain the final two-dimensional surface current field. Increasing the number of observation azimuth angles enhances the accuracy of the synthesized two-dimensional current field.

2.3. Simulation Framework

In this study, simulated ATI-SAR data were generated using a high-fidelity, full-link SAR ocean simulation software (Version 1.0) developed by the team of Professor Xiaoqing Wang at Sun Yat-sen University [37,38]. This advanced simulator is capable of modeling the entire chain of physical processes, from the dynamic sea surface to the final complex SAR image, using a pulse-by-pulse simulation approach that can accurately capture time-varying effects. While the platform has extensive capabilities for simulating various complex phenomena and advanced SAR modes, a specific configuration of its modules was employed for the purposes of this research. Specifically, the simulation process for this study involved the following key steps. First, a time-evolving sea surface was generated based on the Donelan-Banner-Plant directional wave spectrum (D spectrum). This module simulates the dynamic velocity and position of each sea surface facet over the synthetic aperture time. Second, the radar backscatter was modeled using a hybrid approach: the average backscatter intensity was determined by the C-band geophysical model function (CMOD5), while the realistic wave texture was generated through tilt and hydrodynamic modulation models. Third, the crucial effect of temporal decorrelation, which leads to the azimuth cutoff in SAR ocean imagery, was explicitly simulated to ensure physical realism. Finally, the raw echoes from the master and slave antennas were calculated and then processed into focused, complex SAR images using the Omega-K algorithm. This specific configuration was designed to provide a physically robust foundation for systematically investigating the fundamental effects of observation geometry and environmental conditions on ATI-SAR current retrieval.
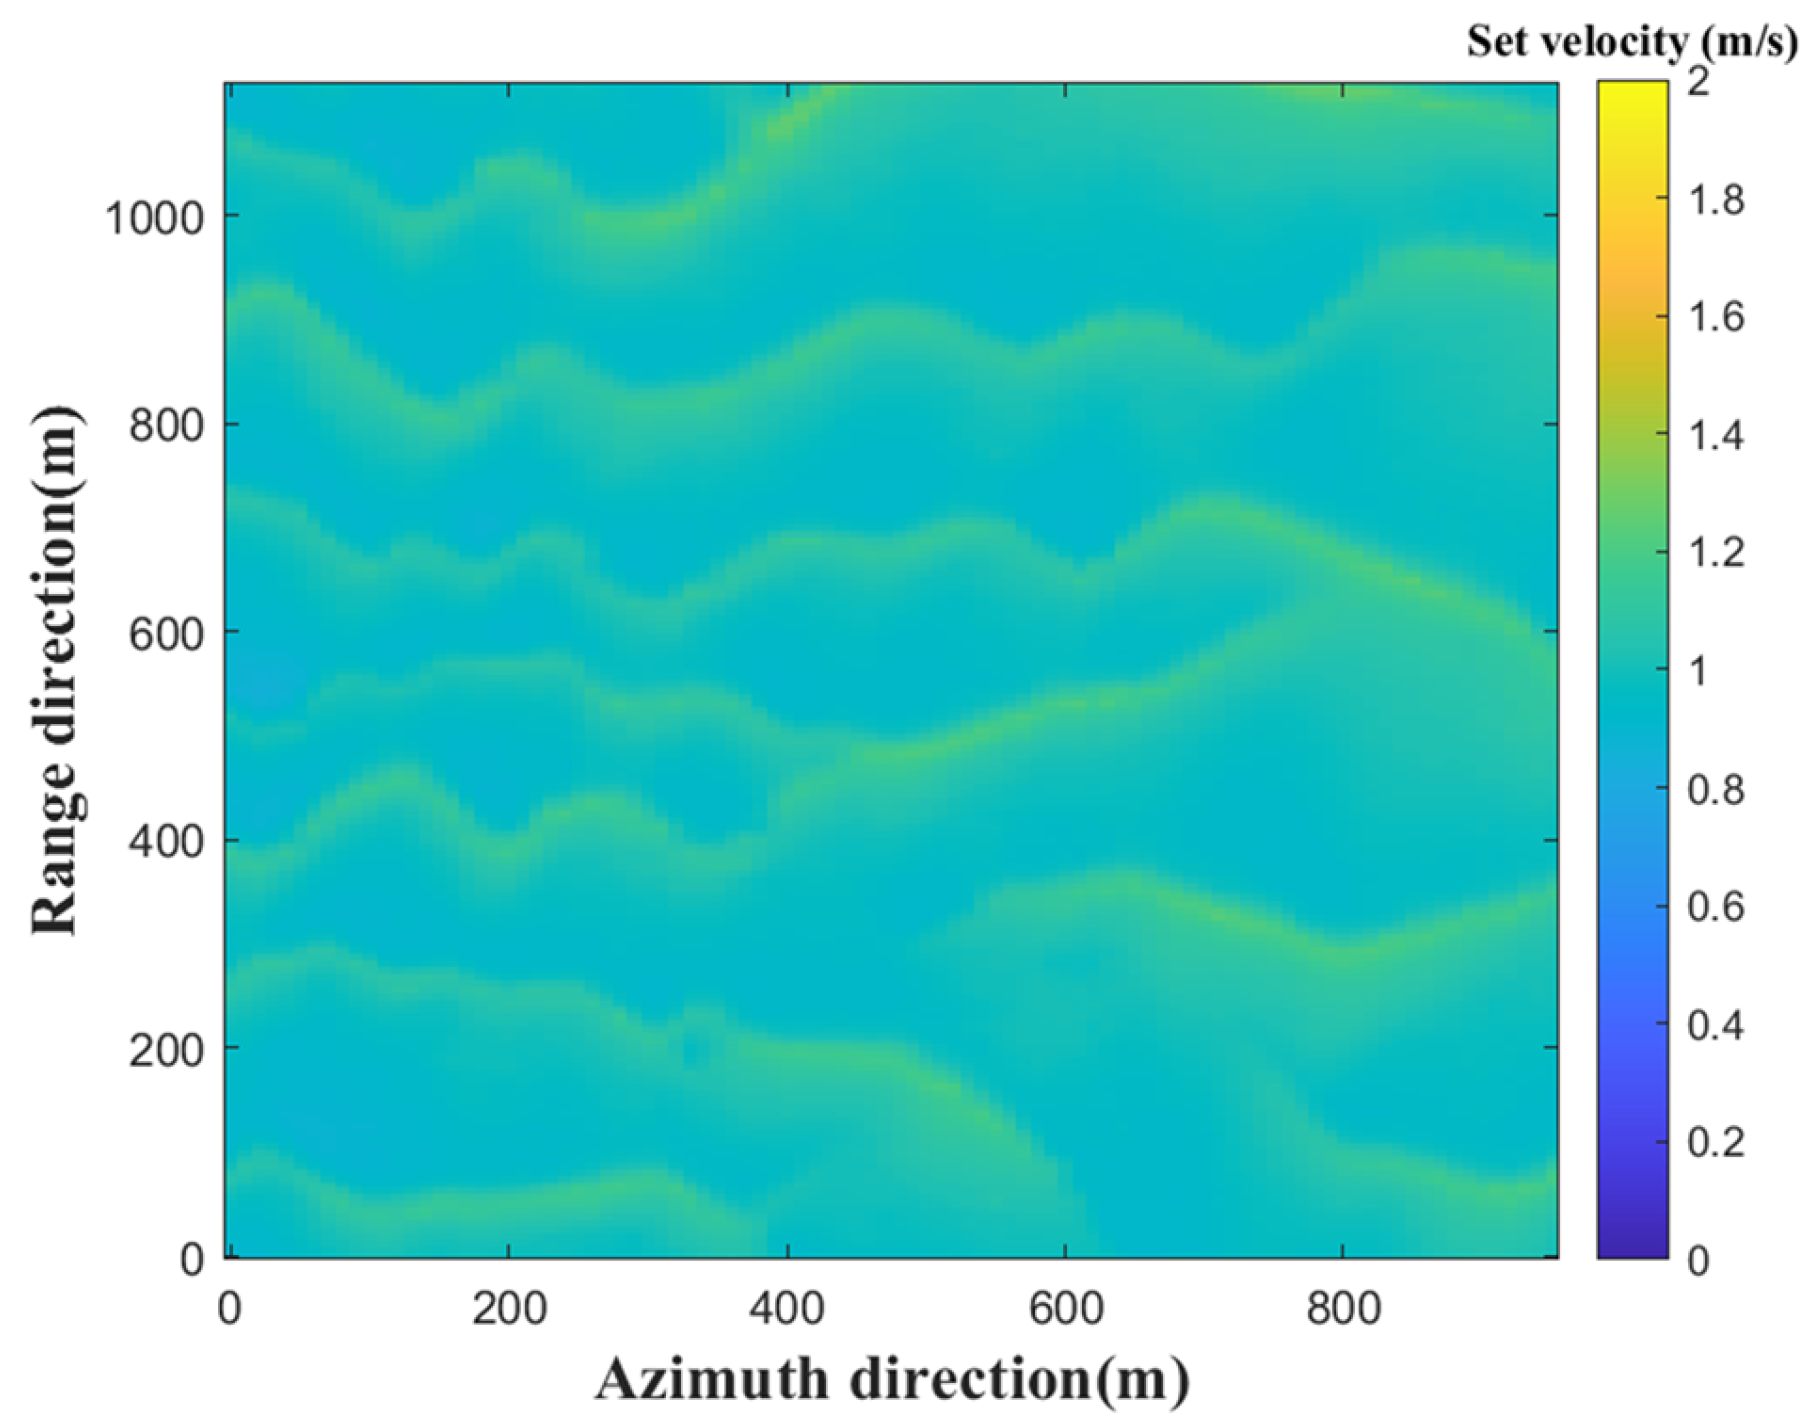
The key parameters for the ATI simulations were carefully selected to represent a realistic yet controlled scenario, allowing for a focused analysis of the fundamental error sources. The radar was configured to operate in the C-band with VV polarization, a common and well-understood setup for ocean remote sensing employed by prominent missions. To ensure that the analyzed retrieval errors were dominated by physical and geometrical factors rather than instrument noise, a high signal-to-noise ratio (SNR) of 30 dB was selected, which is representative of high-quality acquisitions from modern SAR systems. Furthermore, an incidence angle range of 40° to 55° was used; this is a standard operational range for SAR ocean observations that effectively avoids the complexities associated with near-nadir specular reflection and the low backscatter conditions at far-range grazing angles. Finally, for the baseline simulations, such as the analysis of observation angle effects, a low wind speed of 3 m/s was chosen. This condition was intentionally set to minimize wind-induced biases, thereby isolating and clarifying the impact of the observation geometry itself on retrieval accuracy. The ocean current field is set to 0°, and its spatial extent is illustrated in Figure 3.
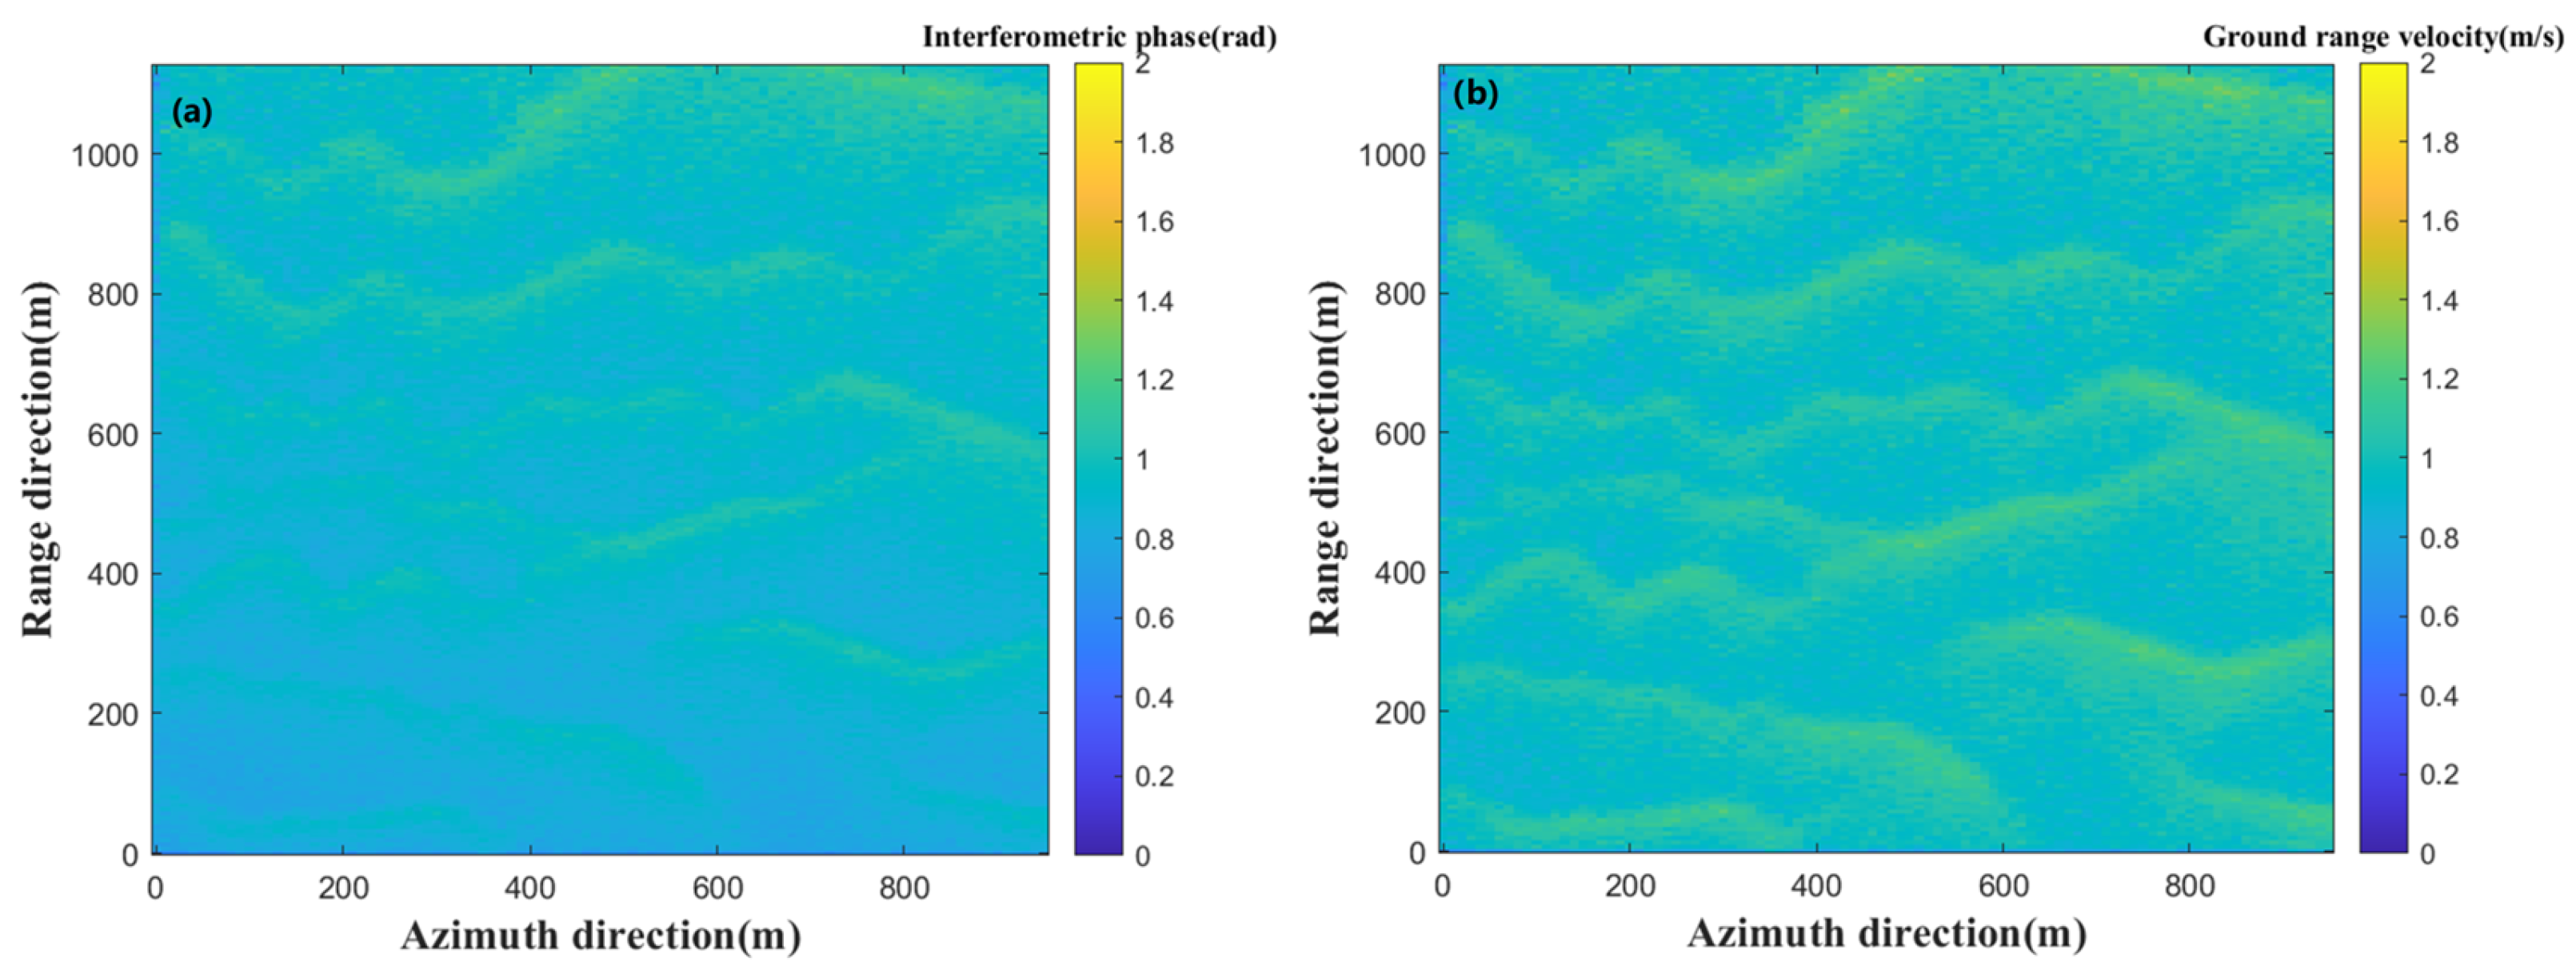
By performing interferometric processing on the phase maps of the main and secondary images obtained from the ATI simulation using Equation (5), the result is shown in Figure 4a. Subsequently, applying Equation (6) yields the radar radial horizontal velocity. After removing the contributions from large-scale wave orbital velocity and Bragg wave phase velocity, the radar radial horizontal current velocity can be derived, as illustrated in Figure 4b.
By comparing Figure 3 and Figure 4b, it can be observed that the retrieved ground-range ocean current velocity is consistent with the prescribed ocean current velocity. The bias between them is 0.05 m/s, and the root mean square error (RMSE) is 0.07 m/s. These results demonstrate the reliability of both the simulation and the retrieval method.

3. Results

This study investigates the influence of the angle between two observation directions, wind speed, wind direction, ocean current speed, and ocean current direction on the multi-angle observation method through ATI data simulation. By systematically adjusting these parameters, simulated ATI data are generated to retrieve the one-dimensional sea surface ocean current velocity in the radar radial horizontal direction. The one-dimensional ocean current velocities obtained from two different observation directions are then combined to construct a two-dimensional vector ocean current field. This retrieved field is subsequently compared and analyzed against the predefined two-dimensional ocean current field to assess the accuracy and effectiveness of the multi-angle observation method.

3.1. Effect of Observation Angle

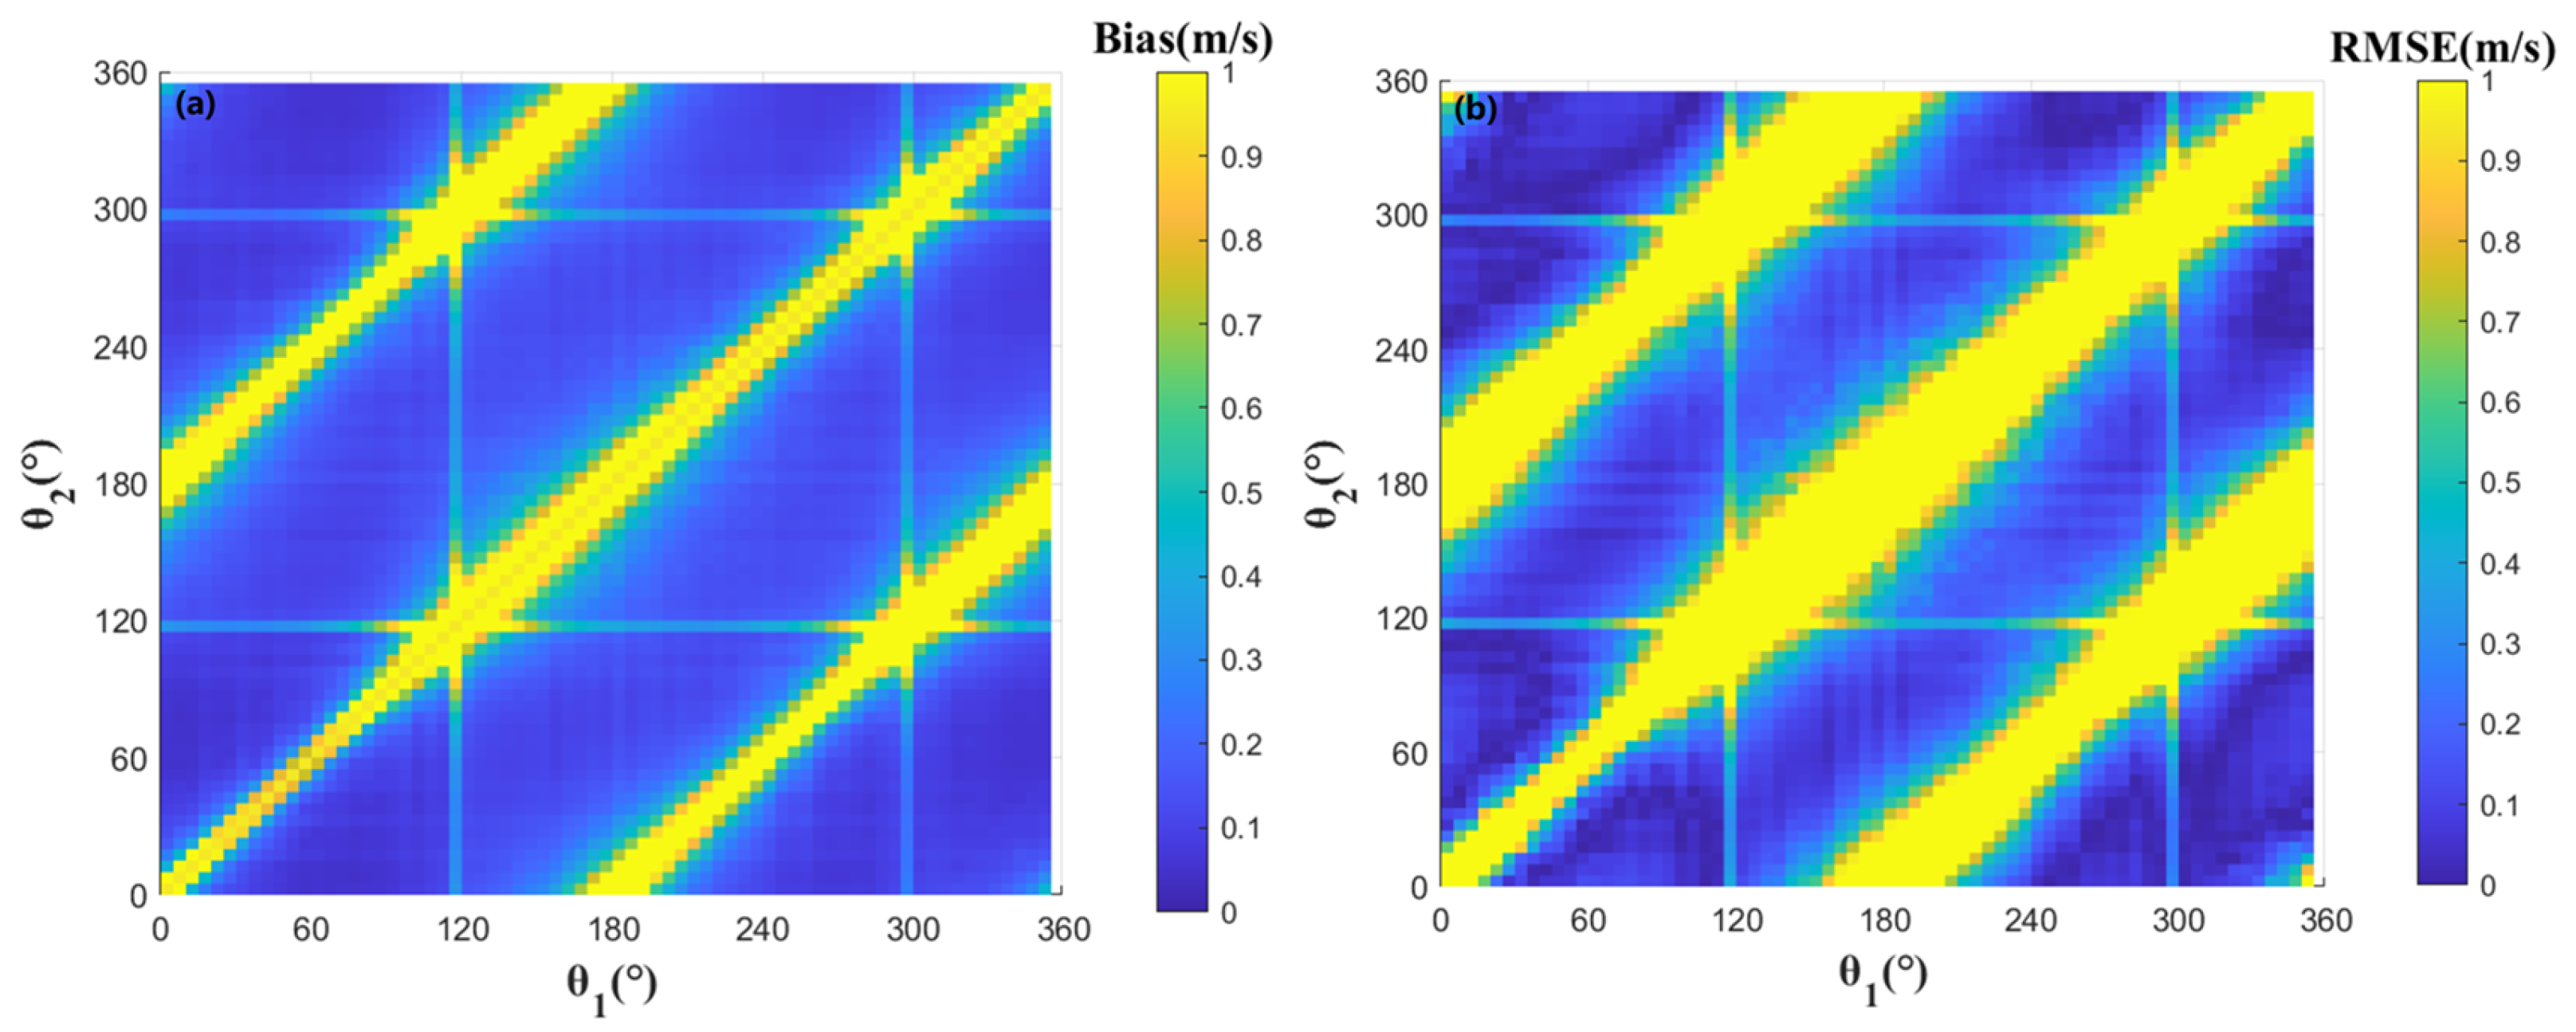
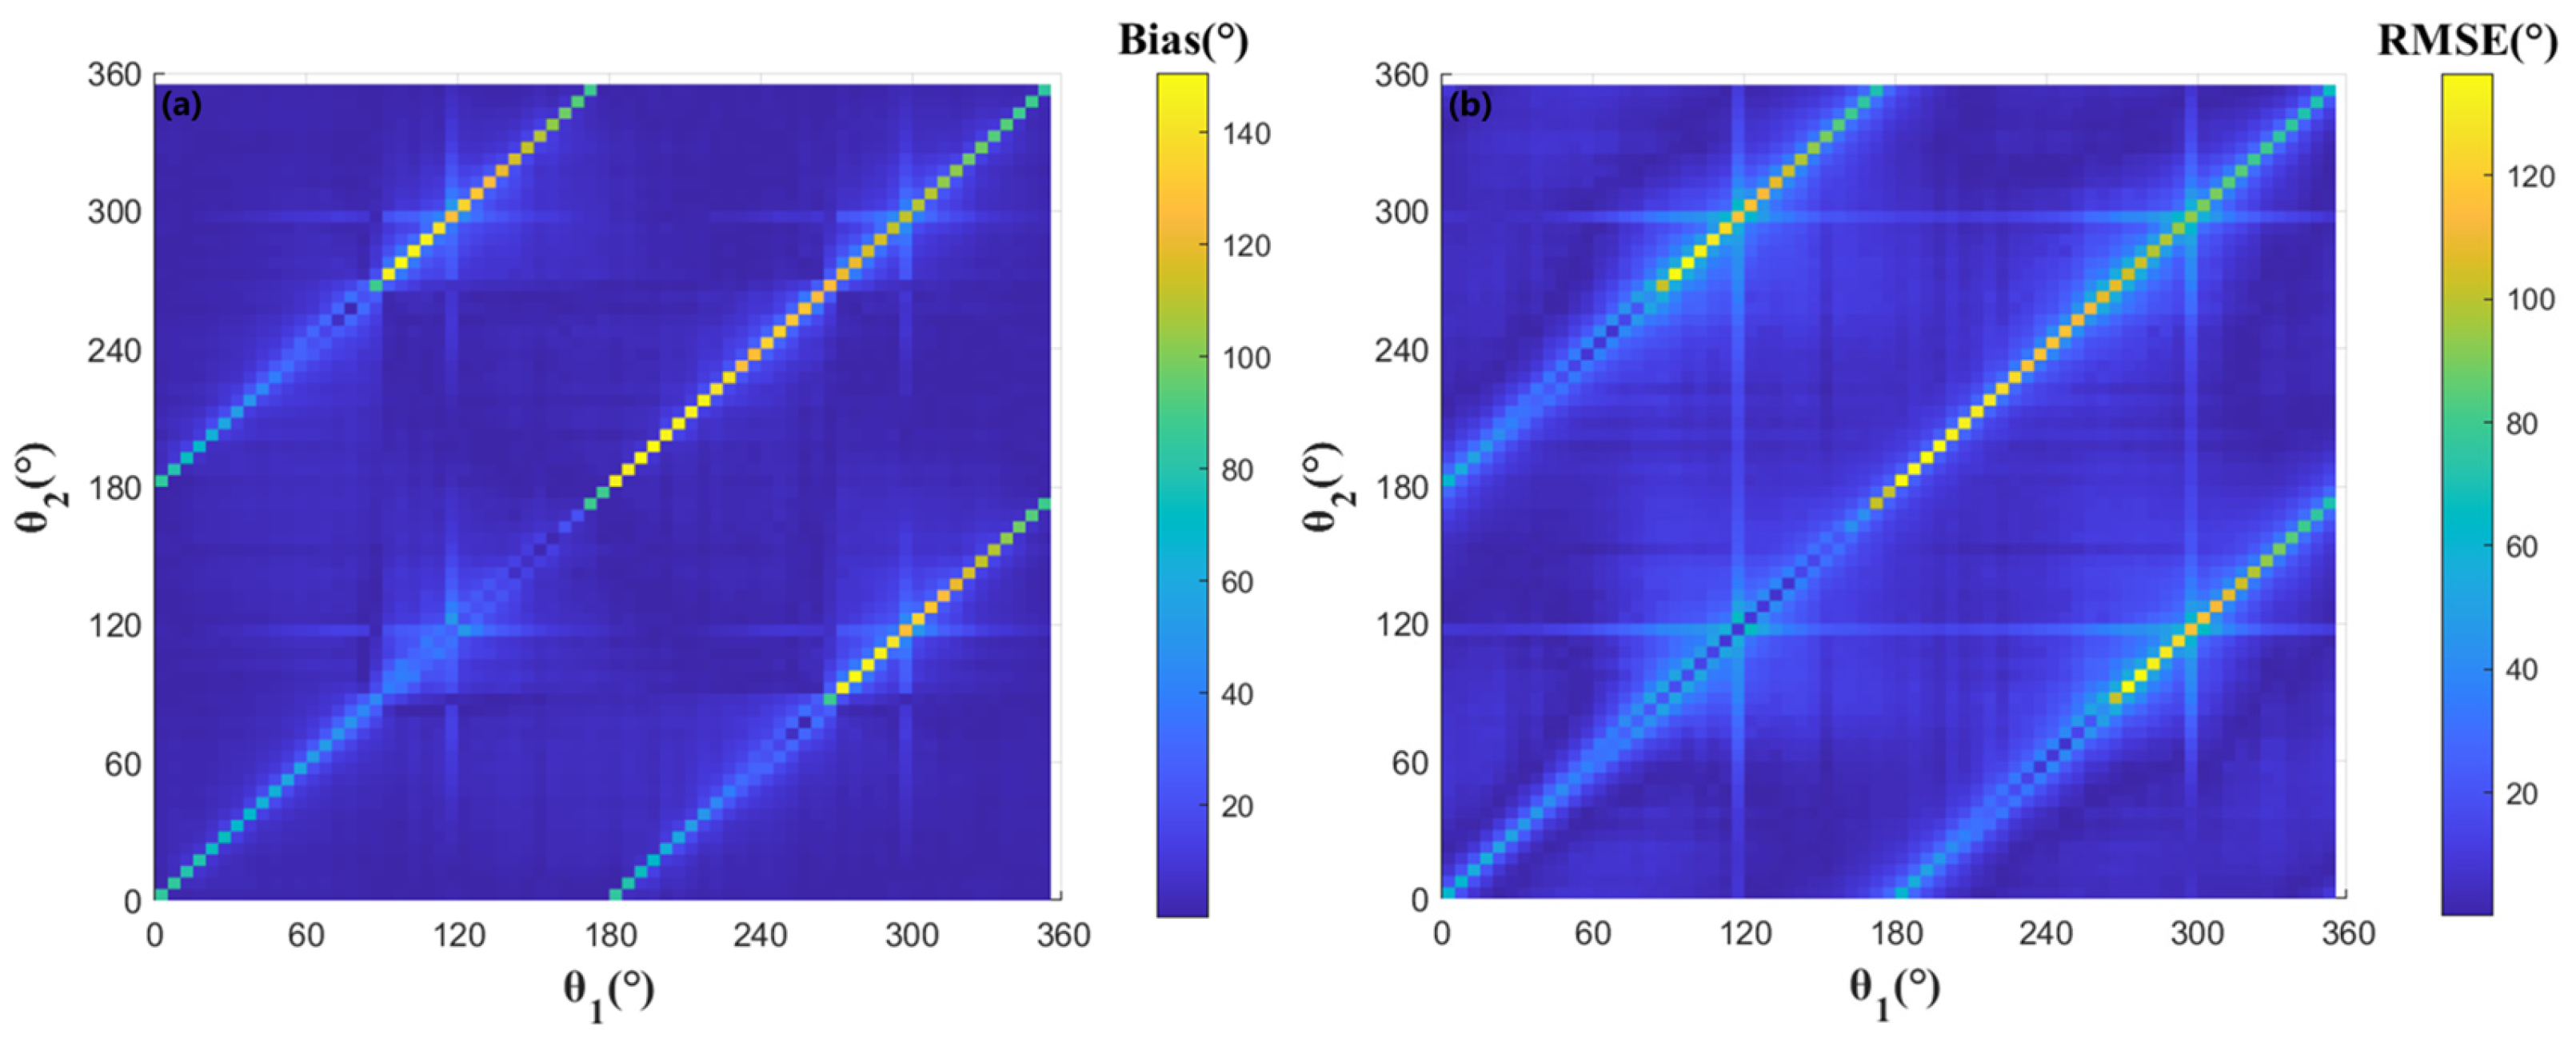
The angle between two observation directions has a significant impact on the accuracy of the two-dimensional ocean current field synthesized by the multi-angle observation method. To investigate this effect, we conducted a series of simulations where only the angle between the two observation directions was varied, while other parameters (e.g., wind speed, current field) were held constant. The geometric configuration for this analysis is based on the schematic shown in Figure 2. Specifically, we systematically varied the observation azimuths, θ 1 and θ 2 , covering the full range from 0° to 360°, to analyze how the angle between them, θ , affects the retrieval accuracy. The synthesized 2D ocean current field from each pair of observations was then compared against the predefined field. The bias and RMSE of the retrieved current velocity are shown in Figure 5, and the corresponding errors for the current direction are presented in Figure 6.
The x-axis and y-axis in Figure 5 and Figure 6 represent the angles of the two observation directions relative to the north. The color bar in each figure indicates the error magnitude. Specifically, azimuth 1 ( θ 1 ) denotes the angle between observation direction 1 and the north, while azimuth 2 ( θ 2 ) denotes the angle between observation direction 2 and the north. The retrieved two-dimensional ocean current field is evaluated by comparing the errors in current velocity and direction against the predefined ocean current field. The evaluation metrics used are bias and RMSE.
It can be observed from Figure 5a,b that the error in the magnitude of the synthesized two-dimensional ocean current velocity reaches its maximum when the angle between the two observation directions approaches 0°, meaning the two directions are nearly parallel. Similarly, the error is also maximized when the angle approaches 180°, indicating the two observation directions are opposite to each other. In contrast, the retrieval error is minimized when the angle between the two observation directions is close to 90°, i.e., when the observation directions are perpendicular.
It is also evident from Figure 6a,b that the ocean current direction error of the retrieved two-dimensional ocean current field follows a similar distribution. This indicates that when the angle between the two observation directions approaches 90°, the error in both the magnitude and direction of the ocean current field is minimized.
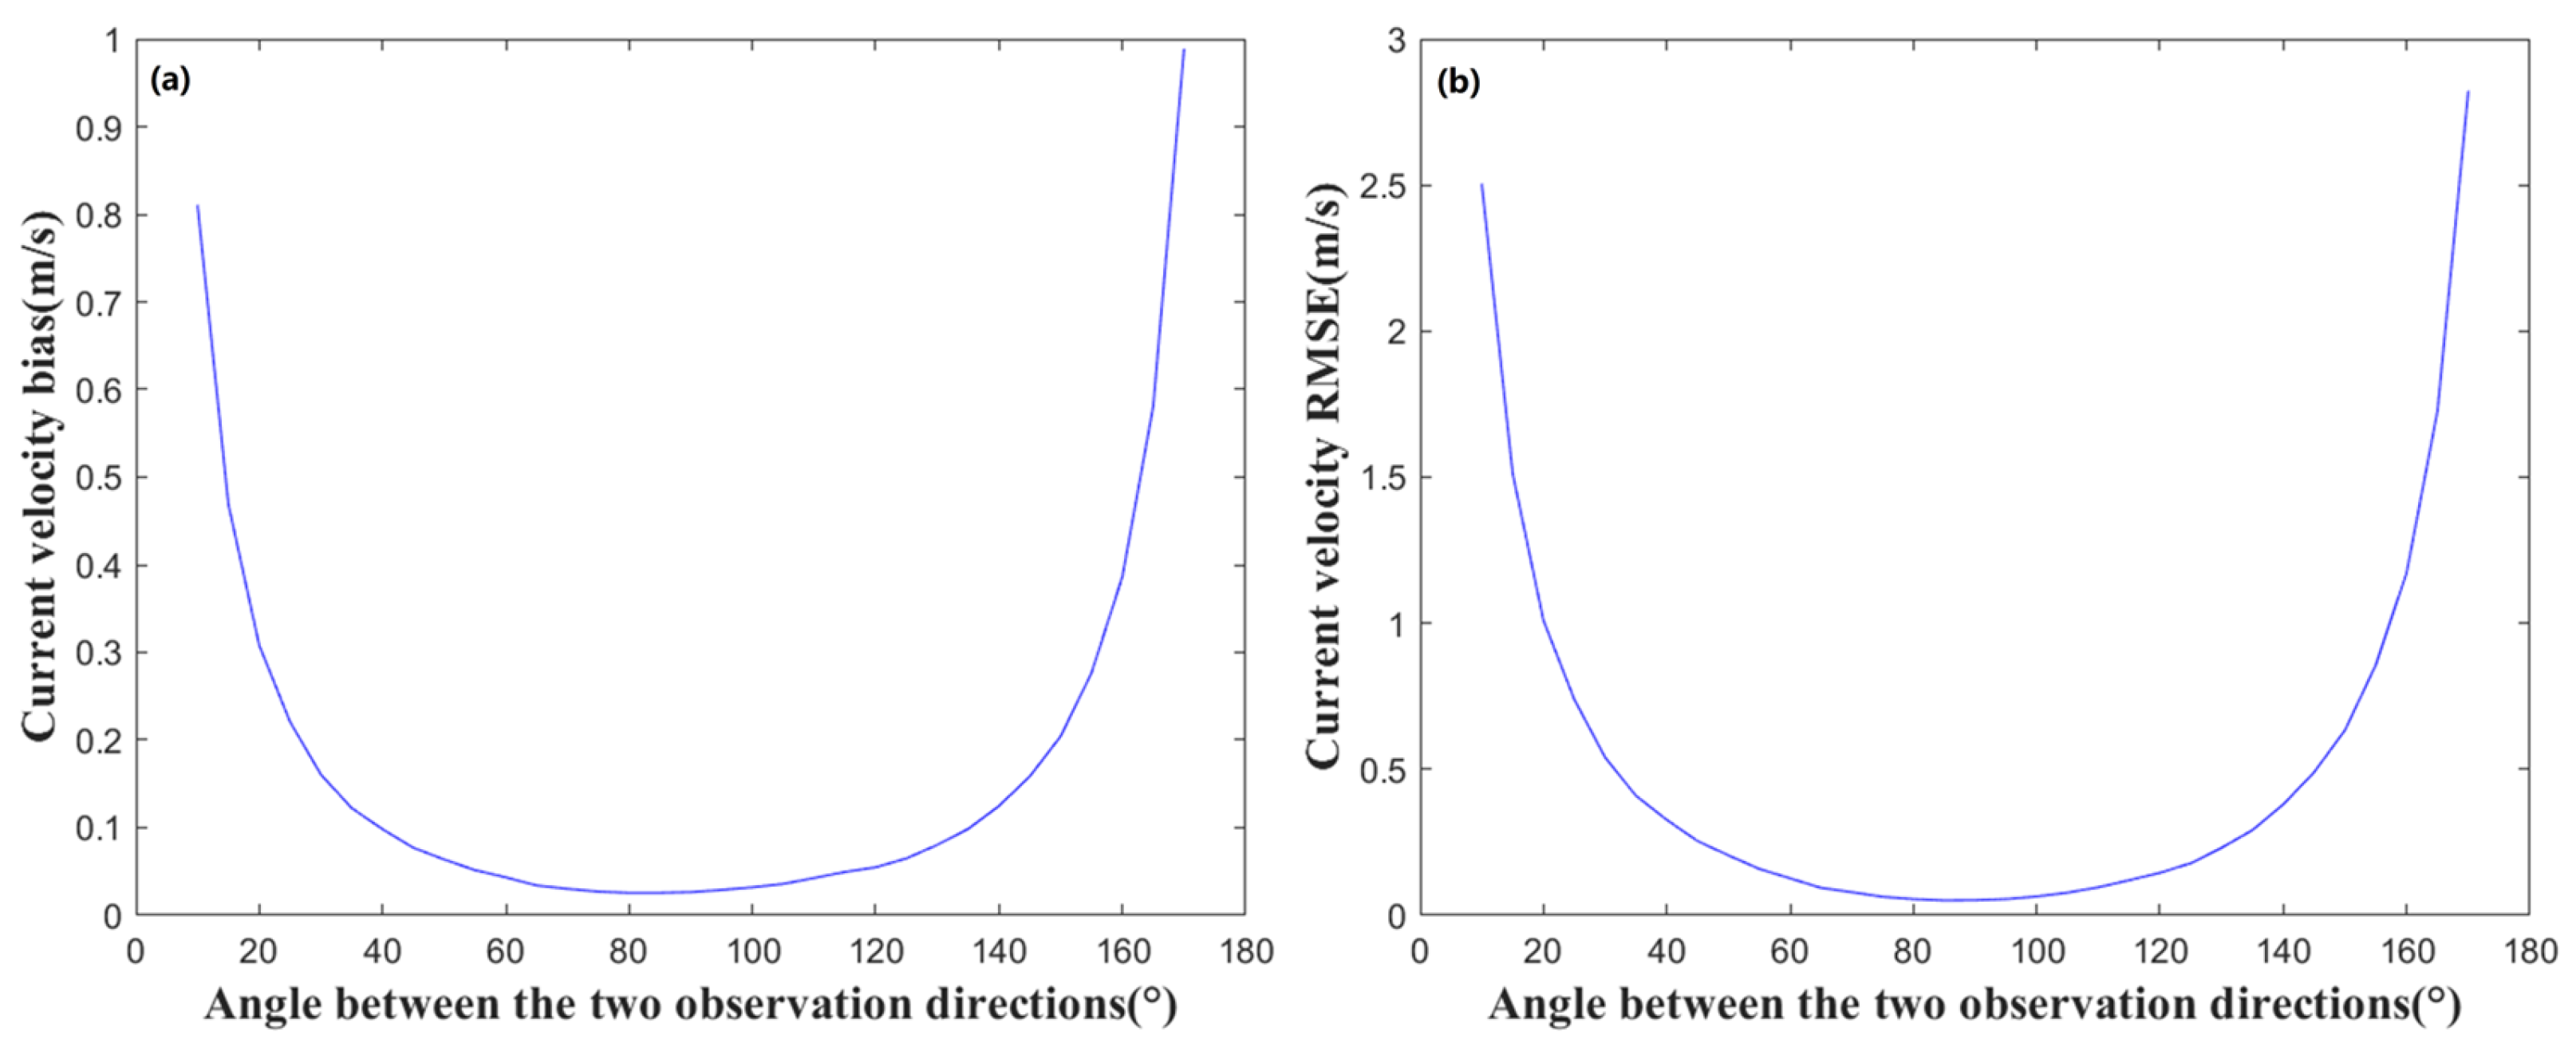
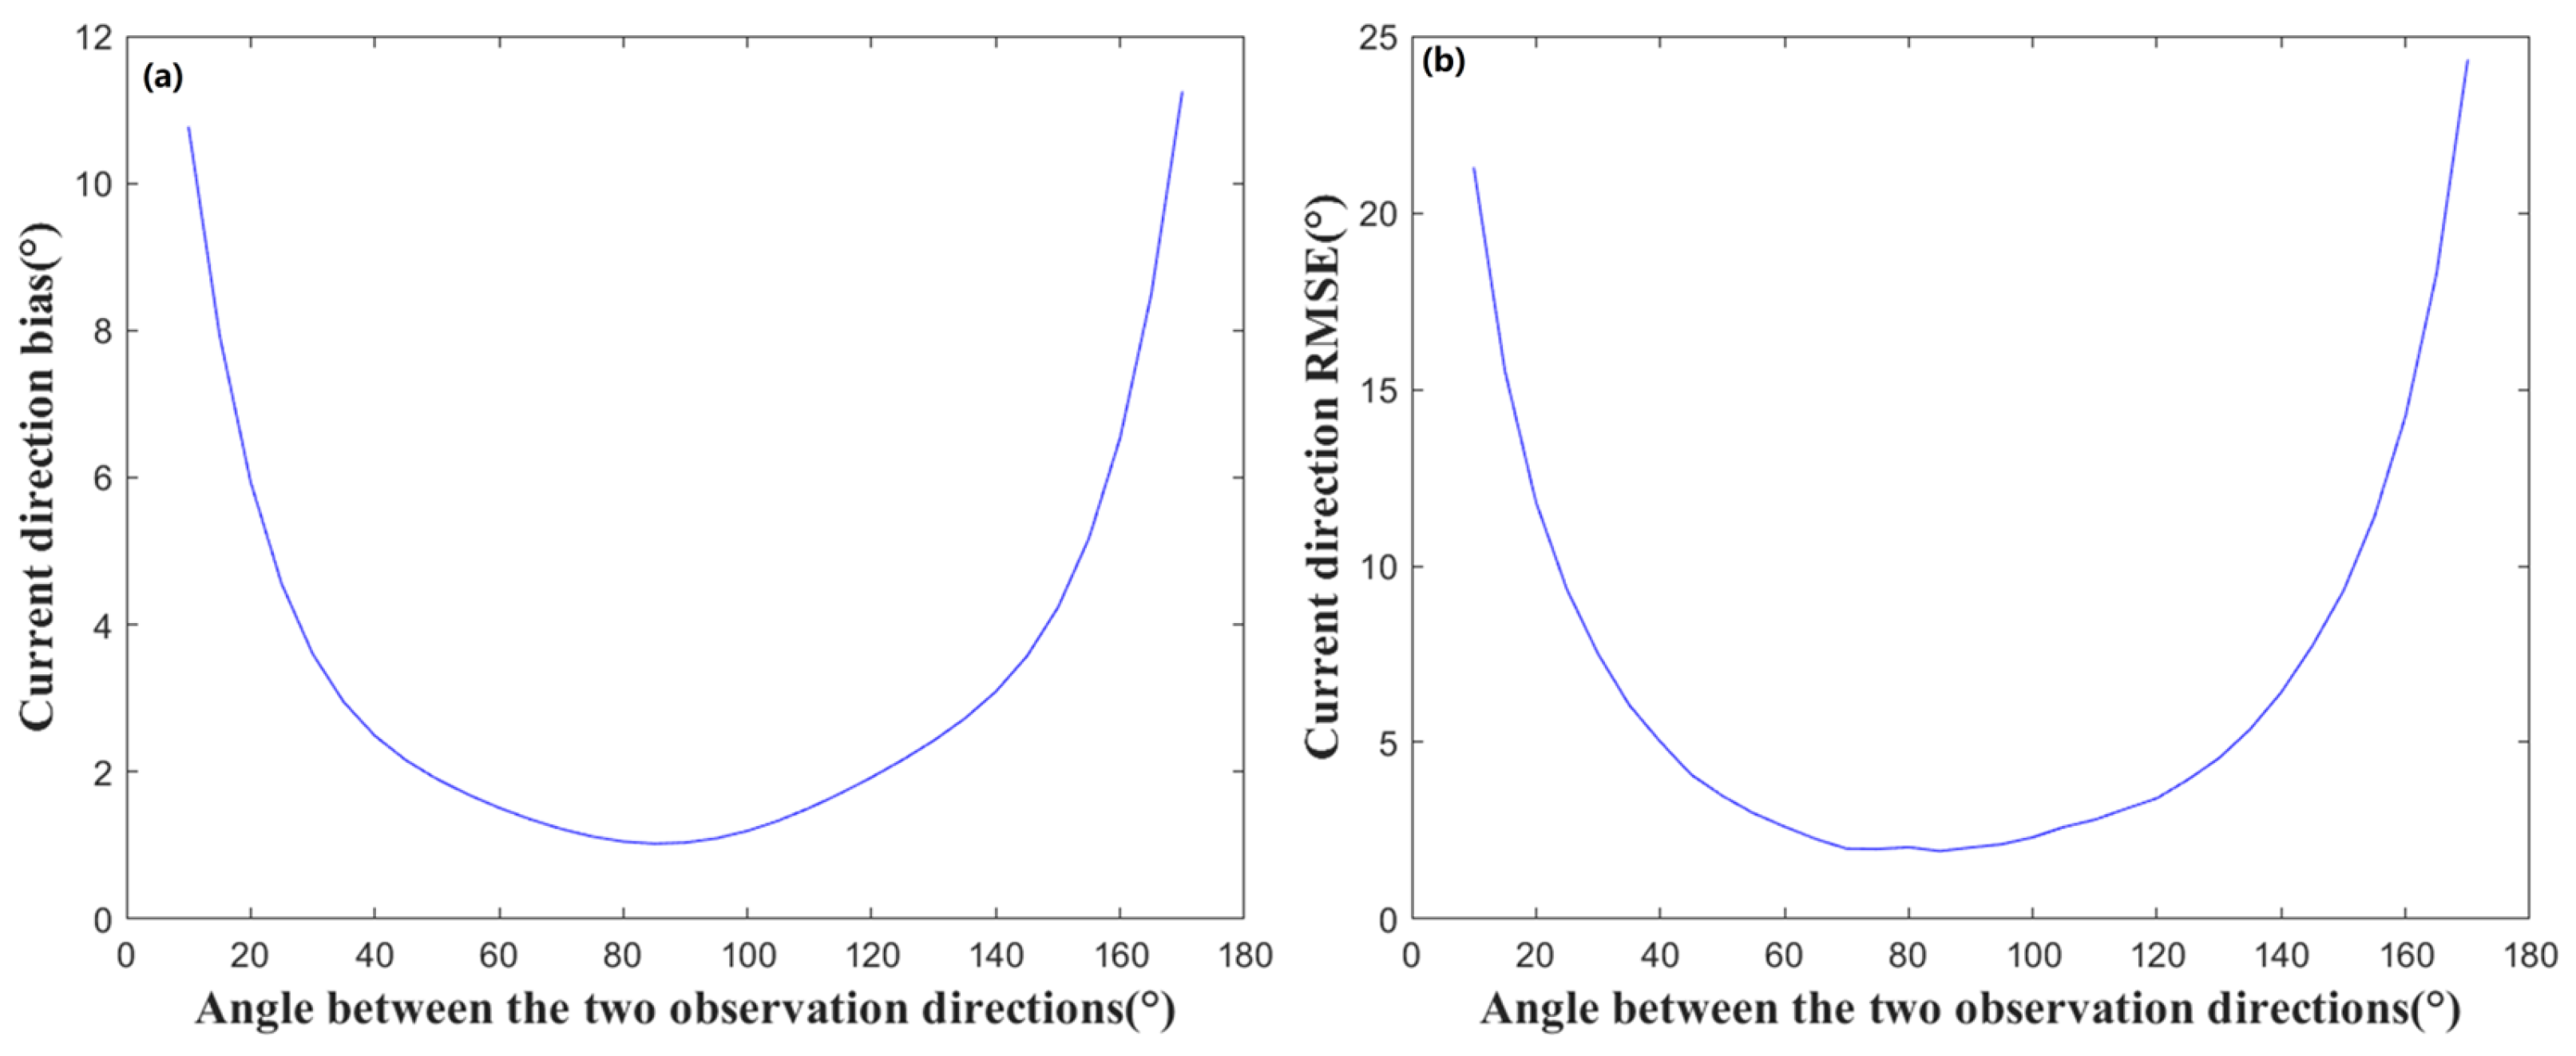
Further statistical analysis was performed to investigate the impact of the variation in the angle between the two observation directions, θ 1 and θ 2 . The data with the same angle θ between the two observation directions was averaged. The bias and RMSE of the retrieved ocean current velocity with respect to the angle variation are shown in Figure 7. Similarly, the bias and RMSE of the retrieved sea current ocean current direction with respect to the angle variation are shown in Figure 8.
The angle between the two observation directions in the range of 180° to 360° exhibits a similar trend to that observed in the range of 0° to 180°. Therefore, only the variations for angles between 0° and 180° are presented in the figures. As shown in Figure 7 and Figure 8, the errors in the retrieved two-dimensional ocean current field velocity and direction display a similar dependence on the angle between the observation directions. Notably, large errors occur when the angle is close to 0° or 180°. In contrast, when the angle falls within the range of 50° to 130°, the bias of the ocean current velocity remains within 0 to 0.1 m/s, and the RMSE stays within 0 to 0.3 m/s. Likewise, the bias of the ocean current direction is within 0° to 2°, and the RMSE is within 0° to 3°. These results indicate that the accuracy of the retrieved two-dimensional sea surface ocean current field is highest when the angle between the two observation directions is between 50° and 130°, with the minimum error occurring at an angle of 90°.
This strong dependence on observation geometry is a direct consequence of the mathematical stability of the vector reconstruction process. The retrieval of the 2D current vector is essentially solving a system of linear equations (Equations (9)–(12)). When the two observation directions are nearly parallel or anti-parallel, the system becomes geometrically ill-conditioned. In this state, the two LOS velocity measurements provide redundant information, and the system of equations becomes nearly singular. As a result, even very small errors or noise inherent in the individual LOS velocity measurements get dramatically amplified during the inversion process, leading to large errors in the final 2D current vector. Conversely, when the observation directions are orthogonal, the two LOS measurements are geometrically independent. This configuration provides the most robust basis for vector decomposition, which minimizes the propagation of measurement errors and thus yields the highest retrieval accuracy.
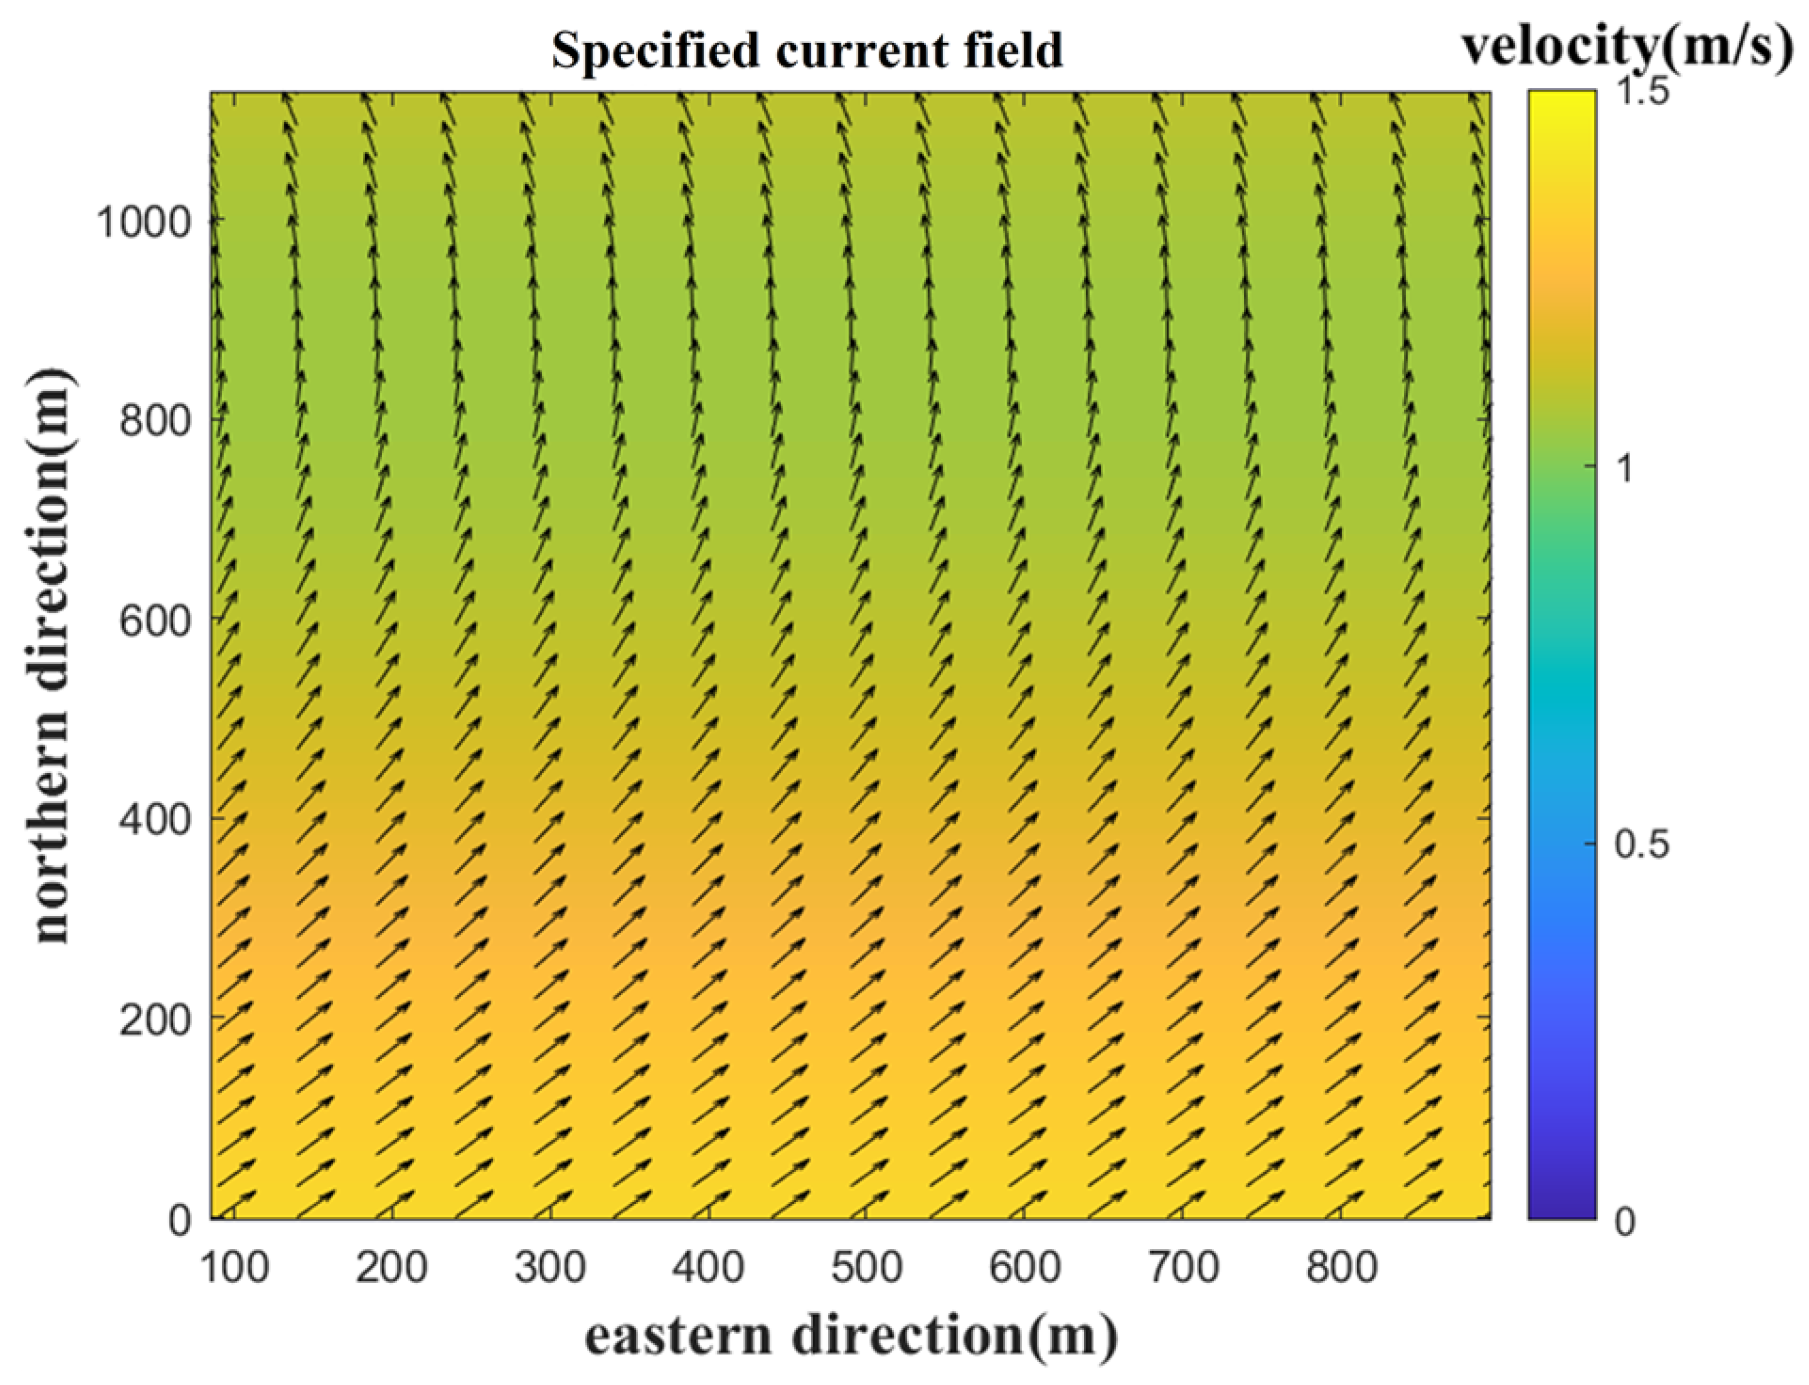
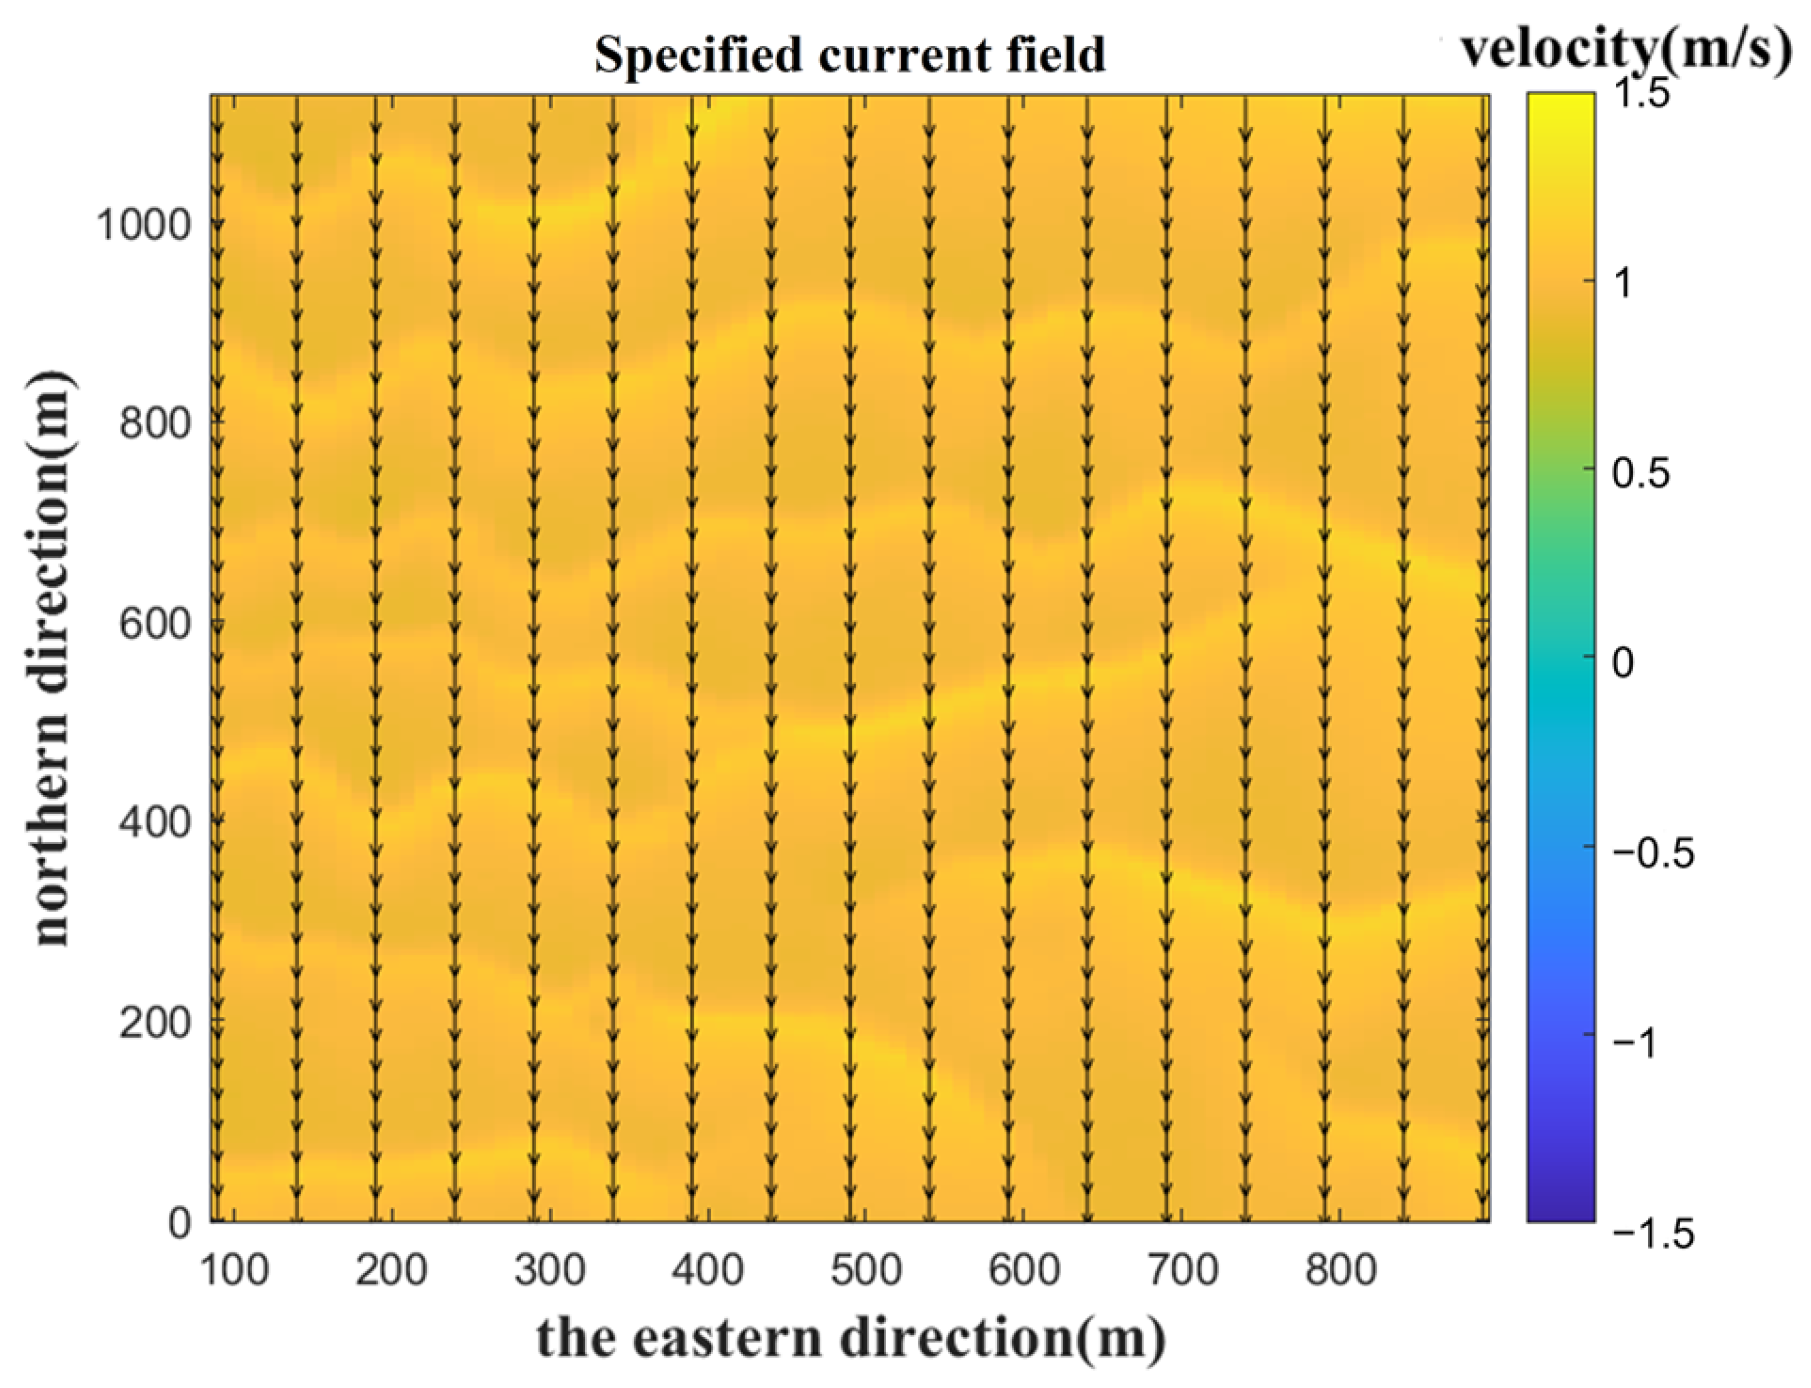
As a typical example, Figure 9 presents a specified ocean current field in which the ocean current velocity ranges from 1.05 m/s to 1.35 m/s, and the ocean current direction varies from −16° to 42°. In this scenario, the wind direction is 330°, and the wind speed is 3 m/s.
The angle between the two observation directions is 90°, with observation direction 1 set at 0°. The resulting primary and secondary images along the respective observation directions, as well as the one-dimensional surface water velocity profiles obtained after interference processing, are shown in Figure 10a and Figure 10b, respectively. The synthesized two-dimensional ocean current field is illustrated in Figure 10c.
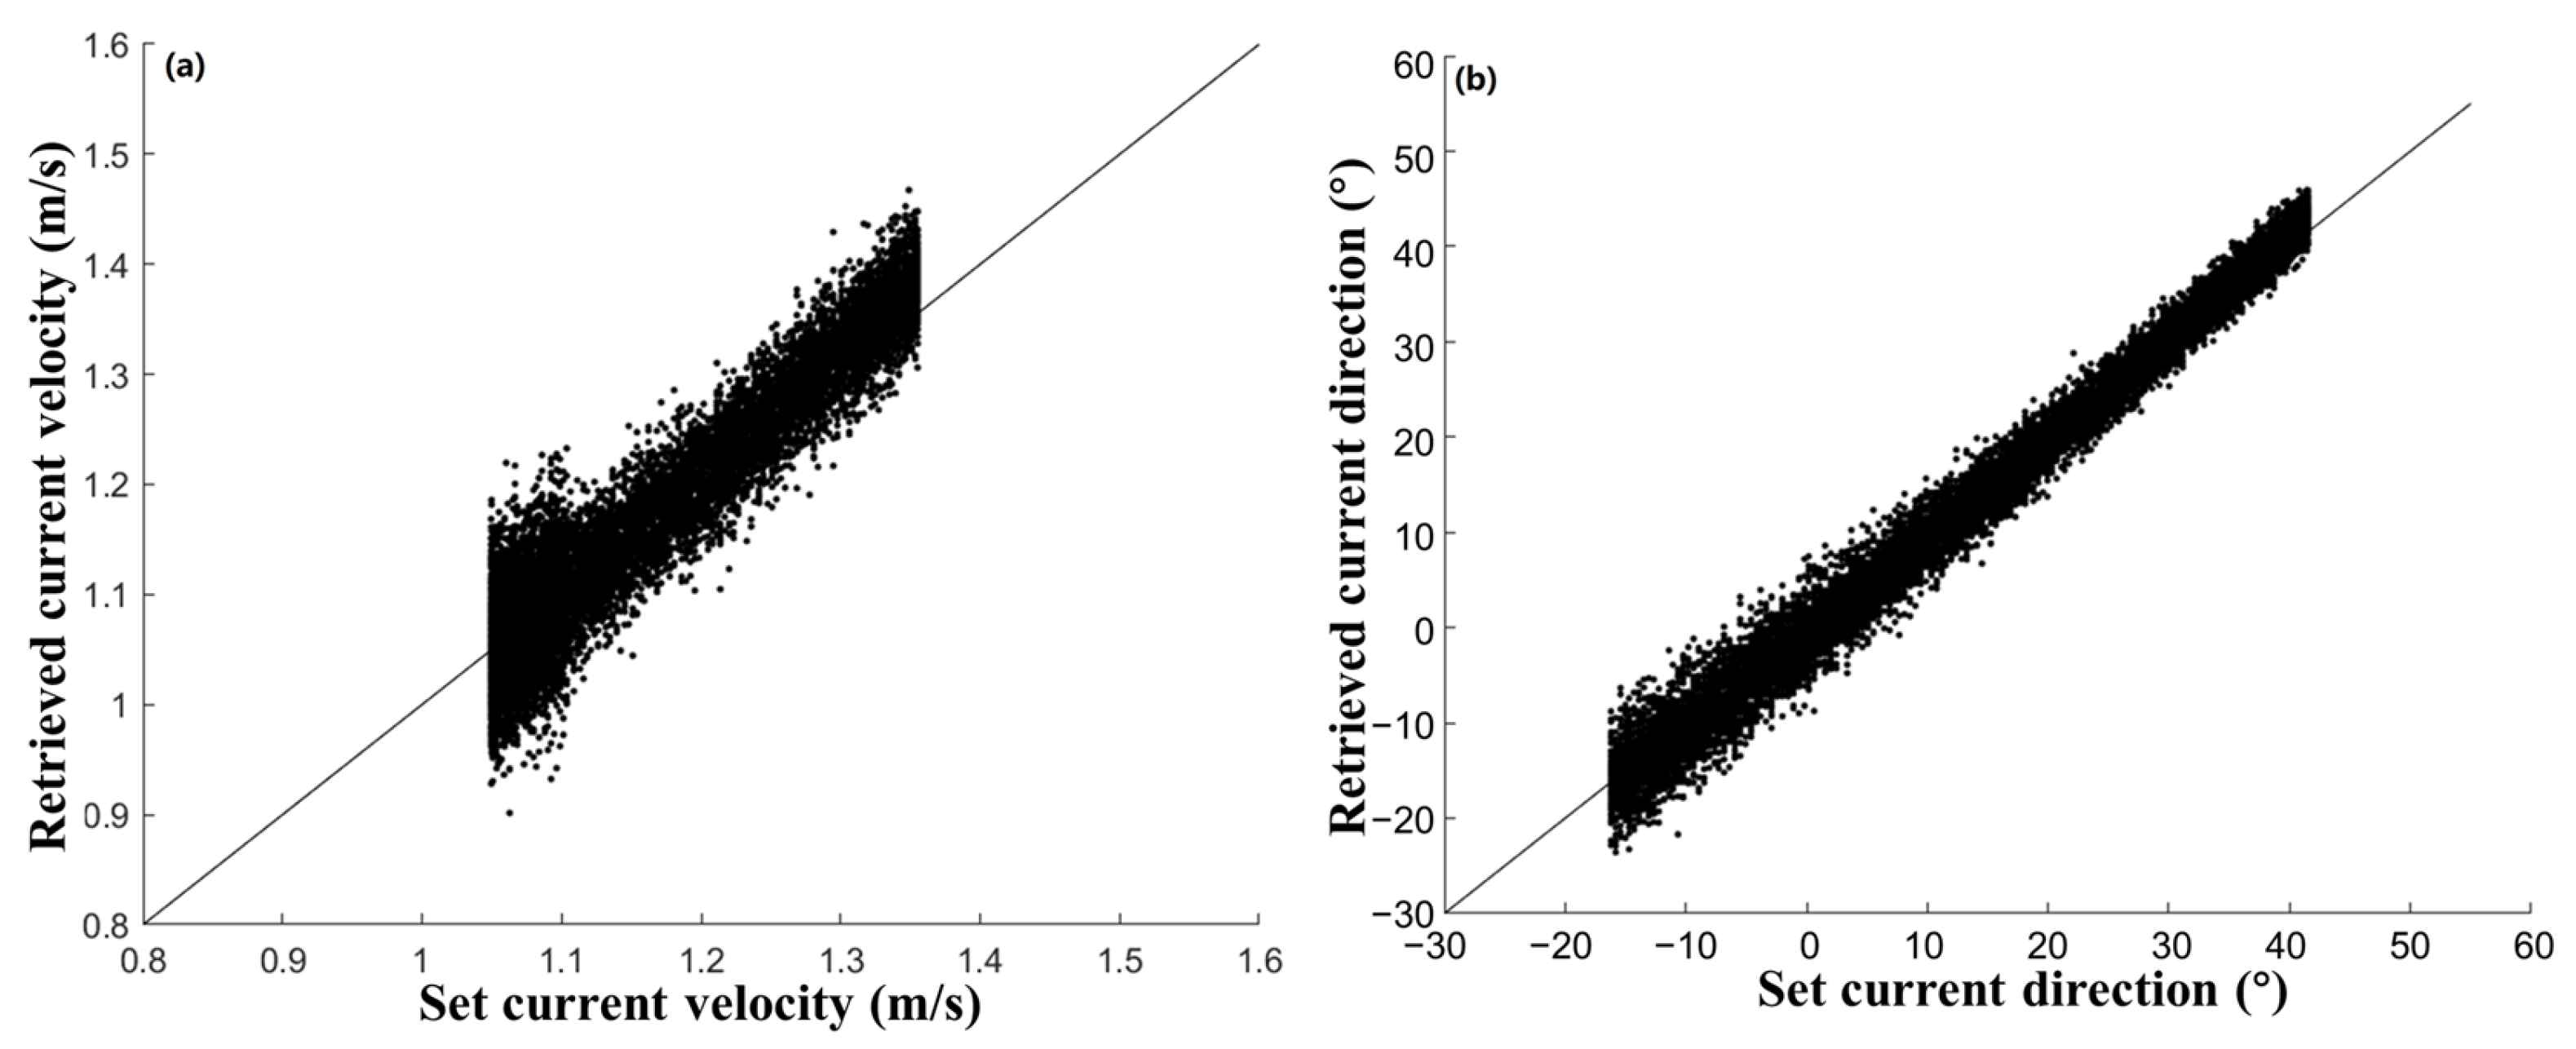
Based on the results from Figure 9 and Figure 10, a correlation analysis was conducted between ocean current velocity and direction. The resulting scatter plots are presented in Figure 11.
The statistical results are shown in Table 1.
In Table 1, r represents the correlation coefficient between the retrieved data and the reference data. According to Table 1, under the optimal dual-direction angle of 90°, the simulated retrieval of both current velocity and direction demonstrates high accuracy compared to the prescribed ocean current field.

3.2. Effect of Wind and Current Direction

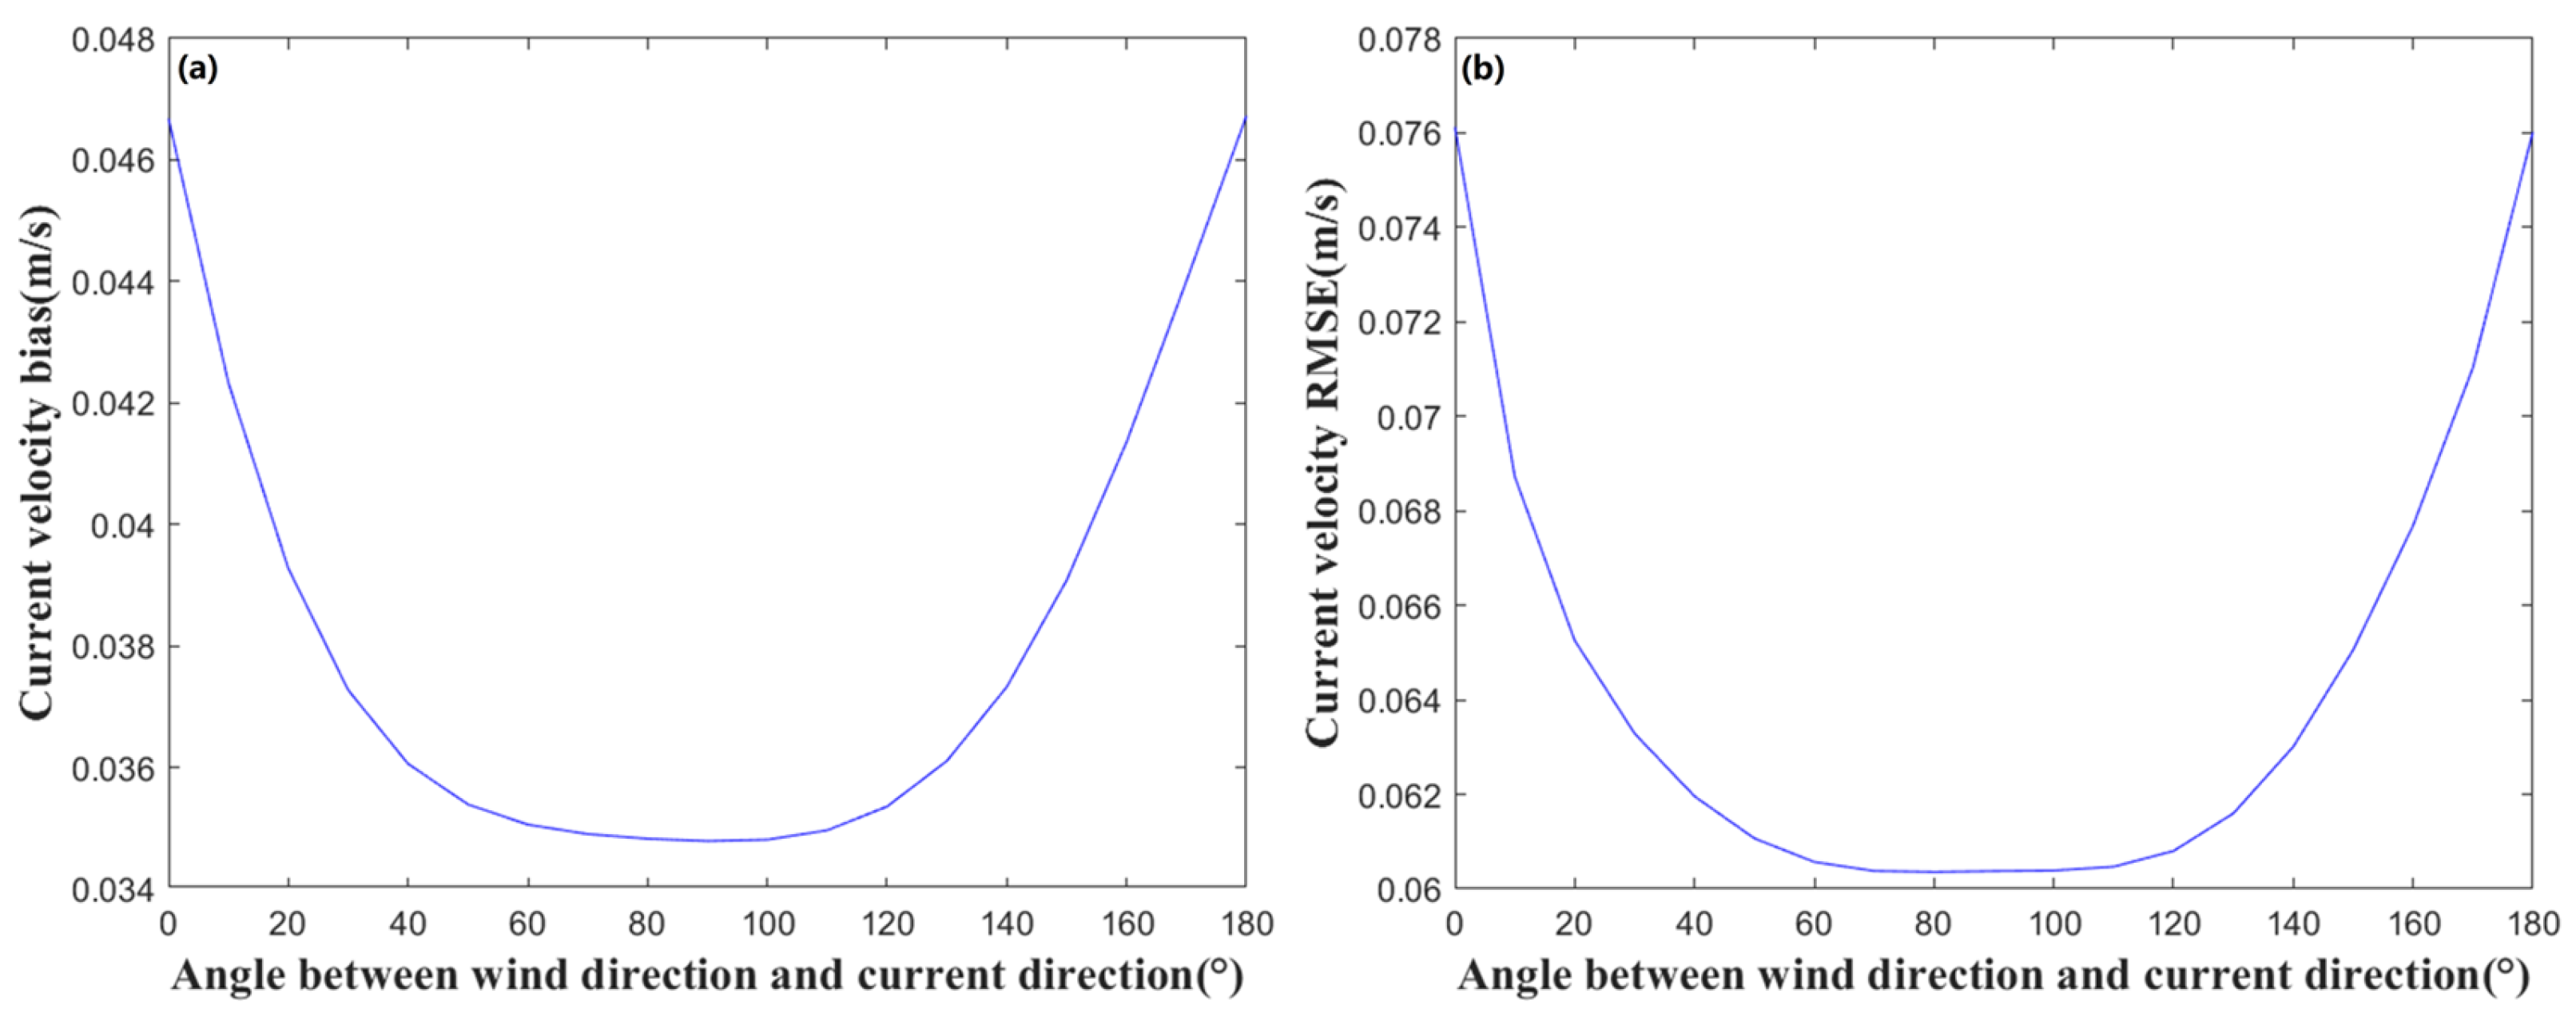
By fixing the angle θ between the two observation directions at 90° (with θ 1 = 0°) and keeping the ocean current direction ( θ c ) of the prescribed ocean current field constant, the angle between the wind direction ( θ w ) and the ocean current direction can be varied by adjusting θ w . The wind speed is set at 3 m/s. Simulations are performed for different angles between the wind direction and the ocean current direction, and the statistical analysis results for the ocean current velocity are presented in Figure 12.
The simulation results within the range of 0° to 360° exhibit periodicity, repeating every 180°. Therefore, only the results from 0° to 180° are presented in the figure. As shown in Figure 12, within this range, both the bias and RMSE of the ocean current velocity first decrease and then increase, reaching their minimum values at 90°. The statistical analysis results for the current direction are shown in Figure 13.
As shown in Figure 13, the bias and RMSE of the ocean current direction initially increase and then decrease as the angle between wind direction and ocean current direction changes. Unlike the simulation results for ocean current velocity, the error in ocean current direction reaches its maximum when the angle is close to 90°, and its minimum when the angle is nearly parallel or anti-parallel (i.e., close to 0° or 180°).
This contrasting behavior between velocity and direction errors likely stems from the complex interplay between wind-driven surface roughness, wave motion, and the SAR backscattering mechanism. The ATI-SAR measured Doppler velocity is not solely from the ocean current; it is contaminated by a wind-wave-induced velocity bias. The anisotropy of wind-generated waves relative to the radar look direction can introduce an asymmetric bias into the two LOS velocity measurements. When wind and current are perpendicular, the two orthogonal SAR looks observe the wind-generated roughness patterns from different perspectives. This asymmetry may introduce a directional bias into the vector reconstruction, leading to a larger error in the retrieved current direction. Conversely, when wind and current are parallel or anti-parallel, the wind-wave effects are more aligned with the current itself. This may result in a more symmetric bias in the two LOS measurements, preserving the directional information more faithfully, while the magnitude of this bias adds more directly to the measured velocity, thus increasing the total velocity error.
To further validate the impact of angle variations between wind direction and ocean current direction on the synthesized ocean current results, additional simulations were conducted for two specific angles: 0° and 90°. The ocean current speed was set in the range of 0.85 m/s to 1.35 m/s, with the current direction fixed at 180°. The configured ocean current field is shown in Figure 14.
With the wind direction set to 180° and wind speed at 3 m/s, an angle of 90° was selected between the two observation directions. Observation direction 1 was set to 0°, resulting in primary and secondary images at different observation angles. After interference processing, the one-dimensional surface current velocities were obtained, as shown in Figure 15a,b. By synthesizing these velocities, the two-dimensional ocean current field presented in Figure 15c was derived.
Similarly, using the ocean current field configuration shown in Figure 14, the wind direction was changed to 90°. Primary and secondary images were obtained at different observation directions and processed through interference. The resulting one-dimensional surface current velocities are presented in Figure 16a,b. By synthesizing these velocities, the two-dimensional ocean current field shown in Figure 16c was obtained.
The bias and RMSE of the velocity and direction obtained from the simulation are presented in Table 2.
Based on the simulation results presented in Table 2, Figure 15 and Figure 16, it can be observed that when the angle between the wind direction and the ocean current direction is 0°, the direction error is relatively small. Conversely, when the angle is 90°, the velocity error is minimized. The angle between wind direction and ocean current direction is determined by prevailing sea conditions and cannot be artificially controlled. These simulation results confirm that varying the angle between wind and current directions significantly influences the synthesis of multi-angle sea currents. Furthermore, when the wind direction is either perpendicular or parallel (including reverse) to the ocean current direction, the errors in the synthesized velocity and direction exhibit distinct trends.

3.3. Effect of Wind Speed

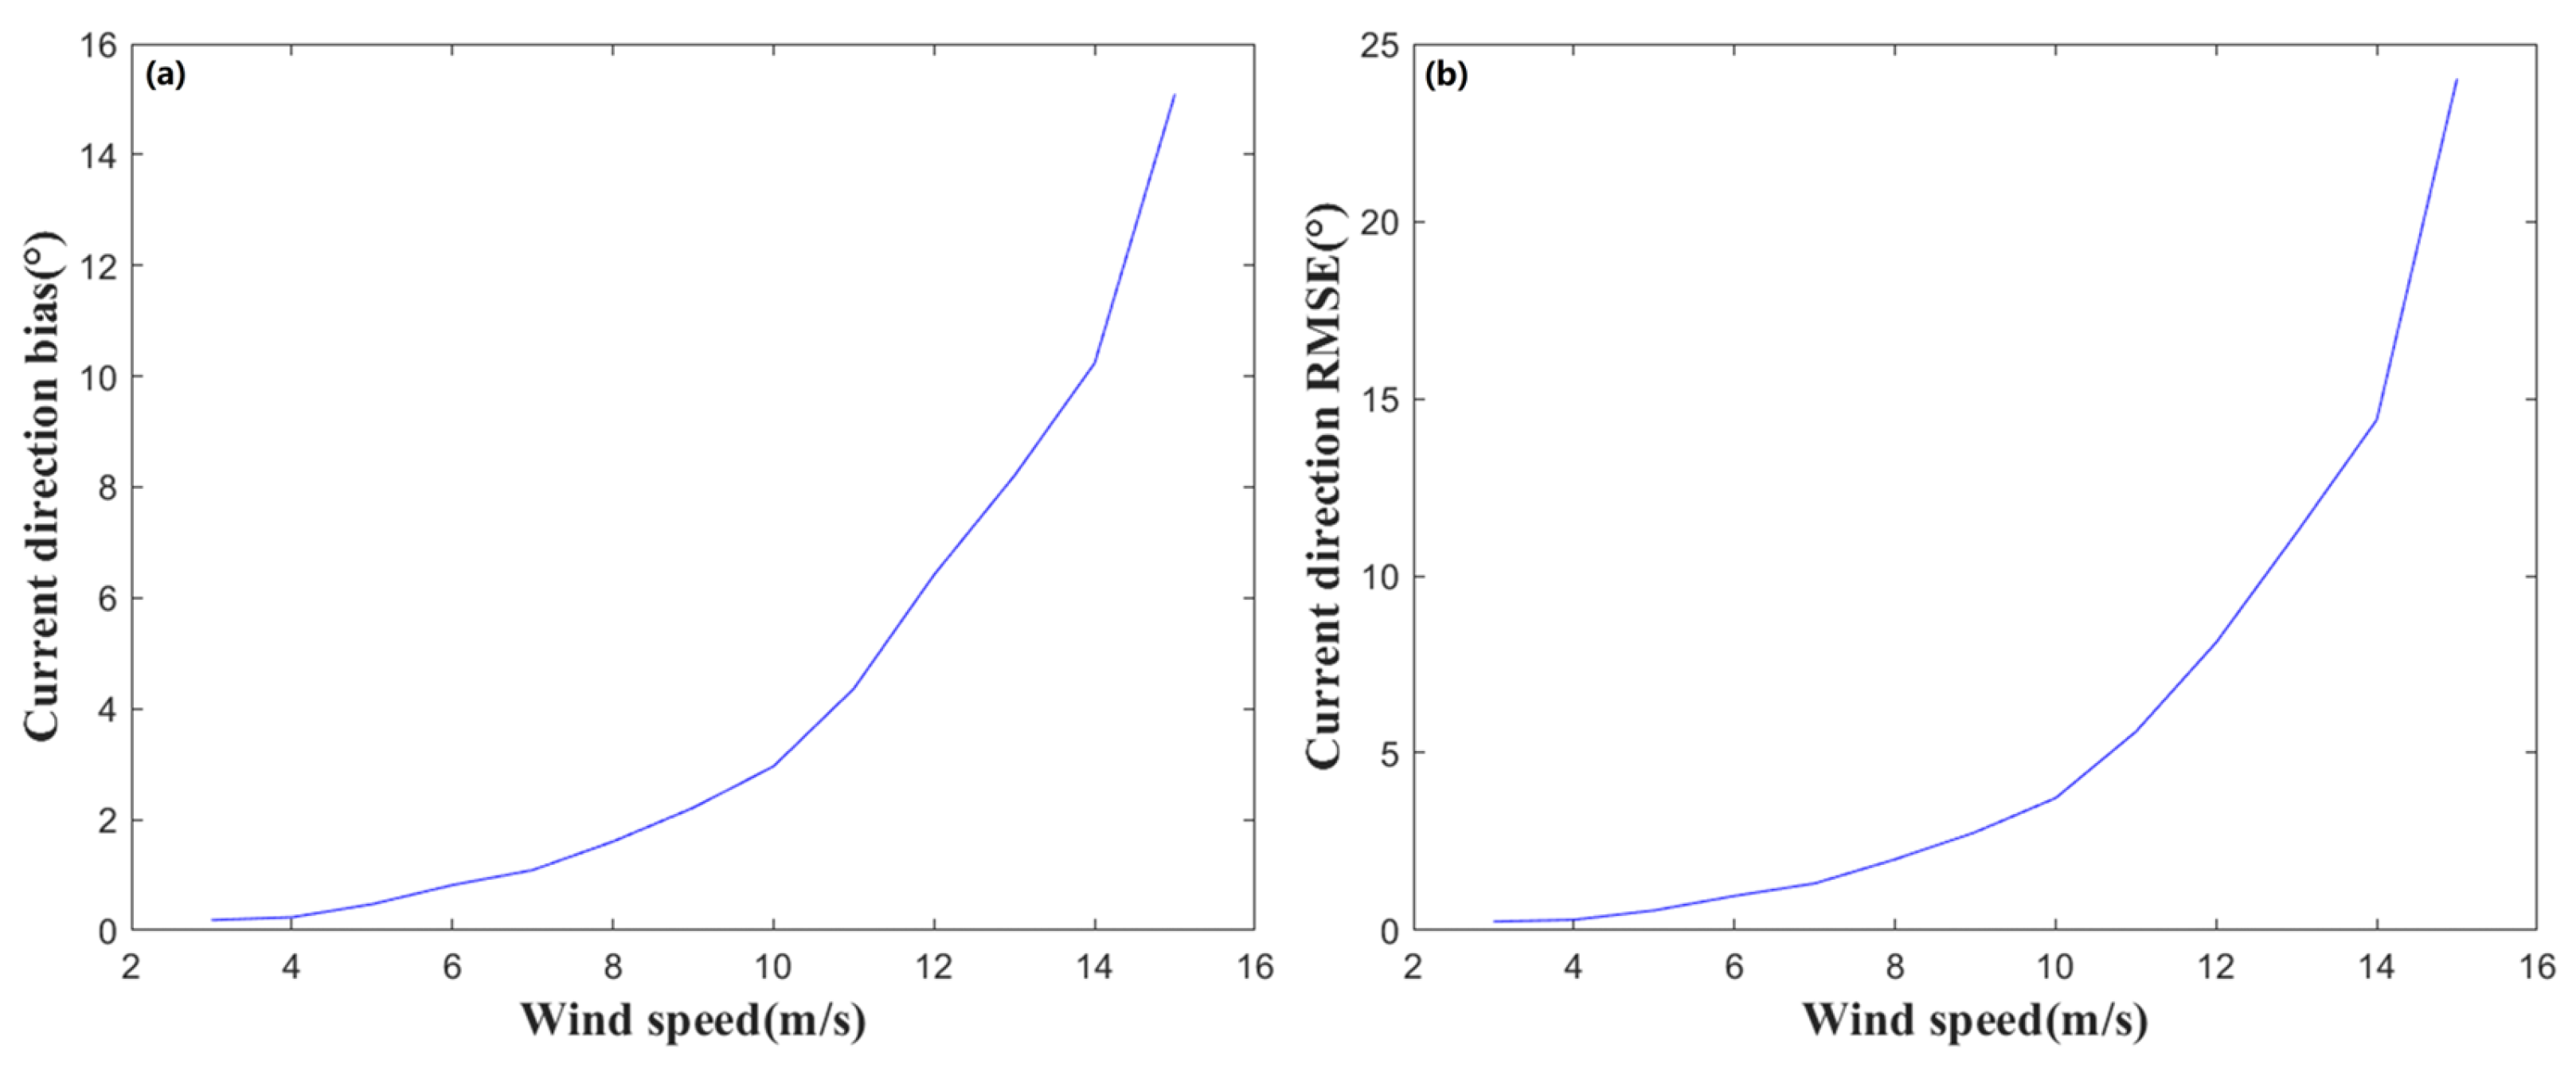
As a key factor influencing ocean conditions, wind plays a significant role in the retrieval of ocean currents and the synthesis of two-dimensional ocean current fields. To investigate this effect, simulations were conducted with a fixed wind direction and an ocean current direction angle of 330°, as well as a fixed angle θ of 90° between two observation directions, with θ 1 set to 0°. The bias and RMSE of the ocean current velocity for wind speeds ranging from 3 m/s to 15 m/s are presented in Figure 17. The corresponding bias and RMSE of the ocean current direction are shown in Figure 18.
From both Figure 17 and Figure 18, it is evident that as wind speed increases, the errors in both ocean current velocity and direction also tend to increase. When the wind speed is below 10 m/s, the bias in ocean current velocity remains relatively low, ranging from approximately 0 m/s to 0.05 m/s. However, at higher wind speeds, the bias can increase to as much as 0.07 m/s. Similarly, the bias in ocean current direction ranges from 0° to 4° at lower wind speeds, but can reach up to 14° at higher wind speeds.
The observed degradation of retrieval accuracy with increasing wind speed can be attributed to at least two primary physical mechanisms. First, higher wind speeds generate a more dynamic and chaotic sea surface. This shortens the temporal coherence time of the sea surface scatterers. The reduced coherence introduces random phase noise into the interferogram, which directly degrades the precision of the underlying LOS velocity measurements and, consequently, increases the error in the final 2D product. Second, the wind-induced velocity bias that contaminates the current signal is known to increase with wind speed. While this study employs a basic correction (CDOP) to mitigate these effects, the magnitude and complexity of the bias at higher wind speeds may overwhelm such simple corrections.

4. Conclusions

This study established a systematic simulation framework to quantitatively analyze the impact of key geometric and environmental factors on two-dimensional (2D) ocean surface current retrieval using multi-angle Along-Track Interferometric Synthetic Aperture Radar (ATI-SAR). Results demonstrate that the observation geometry is a paramount factor controlling retrieval accuracy, with a near-orthogonal (approximately 90°) angle between viewing directions being optimal for minimizing errors by ensuring a mathematically well-conditioned vector reconstruction. We also found that the relative orientation between wind and current introduces complex, non-linear biases, and that increasing wind speed consistently degrades retrieval accuracy, primarily through mechanisms of temporal decorrelation of the sea surface and stronger, uncorrected wind-wave induced velocity biases.
The primary implication of these findings is the provision of crucial, quantitative guidance for the design and application of future satellite missions aimed at monitoring ocean currents. For mission planners, the results strongly suggest that the orbital design of satellite constellations should prioritize configurations that maximize the probability of acquiring near-orthogonal observations over key oceanic regions. For algorithm developers, the quantified impact of wind conditions highlights the necessity of developing advanced retrieval algorithms that move beyond simple corrections and effectively account for wind-induced biases, potentially by assimilating ancillary wind field data from numerical models or other remote sensors.
It should be noted, however, that the simulations conducted in this study are based on idealized parameter settings. In practical applications, other factors not considered here could also affect retrieval accuracy, such as complex sea states involving swell, non-uniform current fields with strong gradients, the temporal lag between observations, and various instrumental or atmospheric disturbances. Future work should aim to incorporate these factors into more sophisticated physical models and validate the findings with field measurements to further enhance the applicability and robustness of the proposed method.

Author Contributions

Conceptualization, X.M. and H.M.; methodology, J.C. and J.Z.; software, J.Z.; validation, J.C. and J.Z.; formal analysis, X.M.; investigation, X.M.; resources, Y.W. and H.M.; data curation, J.C.; writing—original draft preparation, J.C.; writing—review and editing, X.M.; visualization, J.Z.; supervision, Y.W.; project administration, H.M.; funding acquisition, X.M. and H.M. All authors have read and agreed to the published version of the manuscript.

Funding

This work was supported by the National Natural Science Foundation of China (No. 62031005), Shandong Provincial Natural Science Foundation (No. ZR2024QD035), Fundamental Research Funds for the Central Universities (No. 23CX06031A).

Data Availability Statement

The software utilized in this study was obtained from Xiaoqing Wang from the College of Electronic and Communication Engineering, Sun Yat-sen University. The authors of this paper do not have the authority to distribute this software and the data derived therefrom. The Software is available from Professor Xiaoqing Wang.

Acknowledgments

This paper utilizes the open-source SAR simulation software developed by Xiaoqing Wang from the College of Electronic and Communication Engineering, Sun Yat-sen University. The authors would like to express their sincere gratitude for providing this valuable tool. This paper also used the GPT-4.1 model provided by OpenAI and the Gemini-2.5-pro model provided by Google solely for cleaning up language and grammar.

Conflicts of Interest

The authors declare that there are no financial interests, commercial affiliations, or other potential conflicts of interest that could have influenced the objectivity of this research or the writing of this paper.

References

  1. Morrow, R.; Fu, L.-L.; Rio, M.-H.; Ray, R.; Prandi, P.; Le Traon, P.-Y.; Benveniste, J. Ocean Circulation from Space. Surv. Geophys. 2023, 44, 1243–1286. [Google Scholar] [CrossRef]
  2. Moiseev, A.; Johnsen, H.; Hansen, M.W.; Johannessen, J.A. Evaluation of Radial Ocean Surface Currents Derived from Sentinel-1 IW Doppler Shift Using Coastal Radar and Lagrangian Surface Drifter Observations. JGR Ocean. 2020, 125, e2019JC015743. [Google Scholar] [CrossRef]
  3. Laurindo, L.C.; Mariano, A.J.; Lumpkin, R. An Improved Near-Surface Velocity Climatology for the Global Ocean from Drifter Observations. Deep. Sea Res. Part I Oceanogr. Res. Pap. 2017, 124, 73–92. [Google Scholar] [CrossRef]
  4. Du, Y.; Dong, X.; Jiang, X.; Zhang, Y.; Zhu, D.; Sun, Q.; Wang, Z.; Niu, X.; Chen, W.; Zhu, C.; et al. Ocean Surface Current Multiscale Observation Mission (OSCOM): Simultaneous Measurement of Ocean Surface Current, Vector Wind, and Temperature. Prog. Oceanogr. 2021, 193, 102531. [Google Scholar] [CrossRef]
  5. Espenes, H.; Carrasco, A.; Dagestad, K.-F.; Christensen, K.H.; Drivdal, M.; Isachsen, P.E. Stokes Drift in Crossing Windsea and Swell, and Its Effect on near-Shore Particle Transport in Lofoten, Northern Norway. Ocean Model. 2024, 191, 102407. [Google Scholar] [CrossRef]
  6. Deyle, L.; Badewien, T.H.; Wurl, O.; Meyerjürgens, J. Lagrangian Surface Drifter Observations in the North Sea: An Overview of High-Resolution Tidal Dynamics and Surface Currents. Earth Syst. Sci. Data 2024, 16, 2099–2112. [Google Scholar] [CrossRef]
  7. Kulikova, D.Y.; Gorbunov, I.G. Analysis of the Sea Surface Parameters by Doppler X-Band Radar in the Coastal Zone of the Black Sea. In Proceedings of the 2019 IEEE Conference of Russian Young Researchers in Electrical and Electronic Engineering (EIConRus), Saint Petersburg and Moscow, Russia, 28–31 January 2019; pp. 1179–1182. [Google Scholar]
  8. Devi, G.K.; Ganasri, B.P.; Dwarakish, G.S. Applications of Remote Sensing in Satellite Oceanography: A Review. Aquat. Procedia 2015, 4, 579–584. [Google Scholar] [CrossRef]
  9. Perez, E.; Andres, M.; Gawarkiewicz, G. Is the Regime Shift in Gulf Stream Warm Core Rings Detected by Satellite Altimetry? An Inter-Comparison of Eddy Identification and Tracking Products. JGR Ocean. 2024, 129, e2023JC020761. [Google Scholar] [CrossRef]
  10. De Carlo, M.; Ardhuin, F. Along-Track Resolution and Uncertainty of Altimeter-Derived Wave Height and Sea Level: Re-Defining the Significant Wave Height in Extreme Storms. JGR Ocean. 2024, 129, e2023JC020832. [Google Scholar] [CrossRef]
  11. Miao, X.; Wang, J.; Yang, Z.; Mao, P.; Miao, H. Wet Tropospheric Correction Methods for Wide-Swath Altimeters. IEEE Trans. Geosci. Remote Sens. 2022, 60, 4210317. [Google Scholar] [CrossRef]
  12. Ma, Y.; Yin, W.; Guo, Z.; Xuan, J. The Ocean Surface Current in the East China Sea Computed by the Geostationary Ocean Color Imager Satellite. Remote Sens. 2023, 15, 2210. [Google Scholar] [CrossRef]
  13. Kugusheva, A.; Bull, H.; Moschos, E.; Ioannou, A.; Le Vu, B.; Stegner, A. Ocean Satellite Data Fusion for High-Resolution Surface Current Maps. Remote Sens. 2024, 16, 1182. [Google Scholar] [CrossRef]
  14. Yang, X.; Chong, J.; Zhao, Y. Sea Surface Current Retrieval From Sequential SAR and Ocean Color Images for Eddy Kinematics Analysis: A Case Study in the Northern Tyrrhenian Sea. IEEE J. Sel. Top. Appl. Earth Obs. Remote Sens. 2024, 17, 10126–10136. [Google Scholar] [CrossRef]
  15. Ye, F.; Hao, Z.; Pan, D. An Optimization Method Based on Decorrelation Scales Analysis for Improving Surface Currents Retrieval From Sea Surface Temperature. IEEE Trans. Geosci. Remote Sens. 2024, 62, 1–17. [Google Scholar] [CrossRef]
  16. Hauser, D.; Abdalla, S.; Ardhuin, F.; Bidlot, J.-R.; Bourassa, M.; Cotton, D.; Gommenginger, C.; Evers-King, H.; Johnsen, H.; Knaff, J.; et al. Satellite Remote Sensing of Surface Winds, Waves, and Currents: Where Are We Now? Surv. Geophys. 2023, 44, 1357–1446. [Google Scholar] [CrossRef]
  17. Martin, A.C.H.; Gommenginger, C.; Marquez, J.; Doody, S.; Navarro, V.; Buck, C. Wind-wave-induced Velocity in ATI SAR Ocean Surface Currents: First Experimental Evidence from an Airborne Campaign. JGR Ocean. 2016, 121, 1640–1653. [Google Scholar] [CrossRef]
  18. Gao, L.; Guo, Y.; Li, X. Weekly Green Tide Mapping in the Yellow Sea with Deep Learning: Integrating Optical and Synthetic Aperture Radar Ocean Imagery. Earth Syst. Sci. Data 2024, 16, 4189–4207. [Google Scholar] [CrossRef]
  19. Johannessen, J.A.; Chapron, B.; Collard, F.; Kudryavtsev, V.; Mouche, A.; Akimov, D.; Dagestad, K.-F. Direct Ocean Surface Velocity Measurements from Space: Improved Quantitative Interpretation of Envisat ASAR Observations. Geophys. Res. Lett. 2008, 35, L22608. [Google Scholar] [CrossRef]
  20. Carande, R.E. Estimating Ocean Coherence Time Using Dual-Baseline Interferometric Synthetic Aperture Radar. IEEE Trans. Geosci. Remote Sens. 1994, 32, 846–854. [Google Scholar] [CrossRef]
  21. Hansen, M.W.; Collard, F.; Dagestad, K.-F.; Johannessen, J.A.; Fabry, P.; Chapron, B. Retrieval of Sea Surface Range Velocities From Envisat ASAR Doppler Centroid Measurements. IEEE Trans. Geosci. Remote Sens. 2011, 49, 3582–3592. [Google Scholar] [CrossRef]
  22. Johnsen, H.; Nilsen, V.; Engen, G.; Mouche, A.A.; Collard, F. Ocean Doppler Anomaly and Ocean Surface Current from Sentinel 1 Tops Mode. In Proceedings of the 2016 IEEE International Geoscience and Remote Sensing Symposium (IGARSS), Beijing, China, 10–15 July 2016; IEEE: Beijing, China, 2016; pp. 3993–3996. [Google Scholar]
  23. Martin, A.C.H.; Gommenginger, C.P.; Jacob, B.; Staneva, J. First Multi-Year Assessment of Sentinel-1 Radial Velocity Products Using HF Radar Currents in a Coastal Environment. Remote Sens. Environ. 2022, 268, 112758. [Google Scholar] [CrossRef]
  24. Chapron, B.; Collard, F.; Ardhuin, F. Direct Measurements of Ocean Surface Velocity from Space: Interpretation and Validation. J. Geophys. Res. 2005, 110, C07008. [Google Scholar] [CrossRef]
  25. Yang, Z.; Liu, L.; Wang, J.; Miao, H.; Zhang, Q. Extrapolation of Electromagnetic Pointing Error Corrections for Sentinel-1 Doppler Currents from Land Areas to the Open Ocean. Remote Sens. Environ. 2023, 297, 113788. [Google Scholar] [CrossRef]
  26. Yang, Z.; Wang, J.; Liu, L.; Miao, H.; Miao, X.; Zhang, Q. Estimating Effects of Wind and Waves on the Doppler Centroid Frequency Shift for the SAR Retrieval of Ocean Currents. Remote Sens. Environ. 2024, 311, 114312. [Google Scholar] [CrossRef]
  27. Romeiser, R.; Hirsch, O. Possibilities and Limitations of Current Measurements by Airborne and Spaceborne Along-Track Interferometric SAR. In Proceedings of the IGARSS 2001, Scanning the Present and Resolving the Future, Proceedings, IEEE 2001 International Geoscience and Remote Sensing Symposium (Cat. No.01CH37217), Sydney, NSW, Australia, 9–13 July 2001; IEEE: Sydney, NSW, Australia, 2001; Volume 1, pp. 575–577. [Google Scholar]
  28. Romeiser, R.; Suchandt, S.; Runge, H.; Steinbrecher, U.; Grunler, S. First Analysis of TerraSAR-X Along-Track InSAR-Derived Current Fields. IEEE Trans. Geosci. Remote Sens. 2010, 48, 820–829. [Google Scholar] [CrossRef]
  29. Romeiser, R.; Runge, H.; Suchandt, S.; Kahle, R.; Rossi, C.; Bell, P.S. Quality Assessment of Surface Current Fields From TerraSAR-X and TanDEM-X Along-Track Interferometry and Doppler Centroid Analysis. IEEE Trans. Geosci. Remote Sens. 2014, 52, 2759–2772. [Google Scholar] [CrossRef]
  30. Rashid, M.; Gierull, C.H. Retrieval of Ocean Surface Radial Velocities With RADARSAT-2 Along-Track Interferometry. IEEE J. Sel. Top. Appl. Earth Obs. Remote Sens. 2021, 14, 9597–9608. [Google Scholar] [CrossRef]
  31. Yuan, X.; Lin, M.; Han, B.; Zhao, L.; Wang, W.; Sun, J.; Wang, W. Observing Sea Surface Current by Gaofen-3 Satellite Along-Track Interferometric SAR Experimental Mode. IEEE J. Sel. Top. Appl. Earth Obs. Remote Sens. 2021, 14, 7762–7770. [Google Scholar] [CrossRef]
  32. Fernández-Prieto, D.; Sabia, R. Remote Sensing Advances for Earth System Science: The ESA Changing Earth Science Network: Projects 2009–2011; SpringerBriefs in Earth System Sciences; Springer: Berlin/Heidelberg, Germany, 2013; ISBN 978-3-642-32520-5. [Google Scholar]
  33. Li, Y.; Chong, J.; Sun, K.; Zhao, Y.; Yang, X. Measuring Ocean Surface Current in the Kuroshio Region Using Gaofen-3 SAR Data. Appl. Sci. 2021, 11, 7656. [Google Scholar] [CrossRef]
  34. Seppke, B.; Gade, M.; Dreschler-Fischer, L. From Multi-Sensor Tracking of Sea Surface Films to Mesoscale and Sub-Mesoscale Sea Surface Current Fields. In Proceedings of the SPIE Remote Sensing, Dresden, Germany, 23–26 September 2013; Volume 8888, pp. 86–96. [Google Scholar]
  35. Yang, X.; Chong, J.; Diao, L. Estimating MCC Template Size for Ocean Surface Currents Extraction from Sequential SAR Images. In Proceedings of the 2021 Photonics & Electromagnetics Research Symposium (PIERS), Hangzhou, China, 21–25 November 21 2021; IEEE: Hangzhou, China, 2021; pp. 2859–2862. [Google Scholar]
  36. Li, Y.; Chong, J.; Li, Z. A Simulation Method of Two-Dimensional Sea-Surface Current Field for Trajectory Crossing Spaceborne SAR. Appl. Sci. 2022, 12, 5900. [Google Scholar] [CrossRef]
  37. Wang, A.; Wang, X.; Chen, J.; Guo, L.; Huang, H. Wave Spectrum Retrieval Method Based on Full-Link Ocean Surface SAR Imaging Simulation. IEEE Trans. Geosci. Remote Sens. 2023, 61, 5219120. [Google Scholar] [CrossRef]
  38. Wang, X.; Qi, R.; Yao, X.; Xu, C.; Chao, X. High-Precision Simulation of Dynamic Oceans Synthetic Aperture Radar Imaging and Its Typical Application. J. Radars 2025, 14, 712–734. [Google Scholar] [CrossRef]
Figure 1. Schematic diagram of the ATI-SAR system for sea surface LOS velocity measurement.
Remotesensing 17 03383 g001
Figure 2. Schematic diagram of 2D sea surface current retrieval from multi-angle observations. The 2D current vector ( V c , with direction θ c ) is reconstructed from its one-dimensional line-of-sight components ( V 1 and V 2 ) measured along two different SAR observation azimuths ( θ 1 and θ 2 ). The angle between the observation directions is denoted by θ . The diagram also shows the relationship with the wind vector ( V w , with direction θ w ). All directional angles are defined relative to North.
Remotesensing 17 03383 g002
Figure 3. Schematic diagram of the ocean current field setting.
Remotesensing 17 03383 g003
Figure 4. ATI simulation example. (a) Interferometric phase map. (b) Retrieved ground range ocean current velocity.
Remotesensing 17 03383 g004
Figure 5. Two-dimensional ocean current velocity error under different observation angles. (a) bias of current velocity; (b) RMSE of current velocity.
Remotesensing 17 03383 g005
Figure 6. Two-dimensional ocean current direction error under different observation angles. (a) bias of current direction; (b) RMSE of current direction.
Remotesensing 17 03383 g006
Figure 7. Errors in two-dimensional ocean current field velocity under different observation angles. (a) Bias of current velocity. (b) RMSE of current velocity.
Remotesensing 17 03383 g007
Figure 8. Errors in two-dimensional ocean current field direction as a function of the angle between the two observation directions. (a) Bias of current direction. (b) RMSE of current direction.
Remotesensing 17 03383 g008
Figure 9. Example of a specified ocean current field used as input.
Remotesensing 17 03383 g009
Figure 10. Simulated two-dimensional ocean current field results. (a) Current velocity in observation direction 1; (b) Current velocity in observation direction 2; (c) Synthesized two-dimensional ocean current field.
Remotesensing 17 03383 g010
Figure 11. Scatter plots of retrieved values versus set values: (a) Scatter plot of current velocity; (b) Scatter plot of current direction.
Remotesensing 17 03383 g011
Figure 12. Ocean current velocity errors under different angles between wind direction and ocean current direction: (a) Bias of current velocity; (b) RMSE of current velocity.
Remotesensing 17 03383 g012
Figure 13. Current direction errors under different angles between wind direction and current direction: (a) Bias of current direction; (b) RMSE of current direction.
Remotesensing 17 03383 g013
Figure 14. Example of a specified ocean current field used as input for the simulation.
Remotesensing 17 03383 g014
Figure 15. Simulation results of the two-dimensional ocean current field under wind direction set to 180°: (a) Current velocity in observation direction 1; (b) Current velocity in observation direction 2; (c) Synthesized two-dimensional current field.
Remotesensing 17 03383 g015
Figure 16. Simulation results of the two-dimensional ocean current field under wind direction set to 90°: (a) Current velocity in observation direction 1; (b) Current velocity in observation direction 2; (c) Synthesized two-dimensional current field.
Remotesensing 17 03383 g016
Figure 17. Current velocity errors under different wind speeds: (a) bias of current velocity, and (b) RMSE of current velocity.
Remotesensing 17 03383 g017
Figure 18. Current direction errors under different wind speeds: (a) bias of current direction, and (b) RMSE of current direction.
Remotesensing 17 03383 g018
Table 1. Velocity and Direction Errors.
rBias (m/s)RMSE (m/s)
current velocity0.880.020.05
current direction0.991.092.00
Table 2. Simulation errors (bias and RMSE) of synthesized sea current velocity and direction under different wind directions and ocean current direction angles.
AngleCurrent VelocityCurrent Direction
Bias (m/s)RMSE (m/s)Bias (°)RMSE (°)
0.030.071.142.00
90°0.020.051.953.10
Disclaimer/Publisher’s Note: The statements, opinions and data contained in all publications are solely those of the individual author(s) and contributor(s) and not of MDPI and/or the editor(s). MDPI and/or the editor(s) disclaim responsibility for any injury to people or property resulting from any ideas, methods, instructions or products referred to in the content.