Abstract
In this study, we present a novel data assimilation framework, the Ensemble Kalman Filter One-Dimensional Variational (EnKF1D-Var) framework, which assimilates observations from a Ground-based Microwave Radiometer (GMWR), a Mie–Raman Aerosol Lidar (MRL), and a Global Navigation Satellite System Meteorology sensor (GNSS/MET). The framework integrates multi-source vertical observations of water vapor and temperature with hourly temporal and 15 m vertical resolutions, driven by GFS forecasts. Three-month-long studies from May to July 2024 at Anqing Station in subtropical China demonstrate that the EnKF1D-Var retrievals reduce biases in temperature and humidity within the low troposphere, especially for daytime retrievals, by dynamically updating the observational error covariance matrices. Maximum humidity corrections reach up to 0.075 g/kg (120 PPMV), and temperature bias reductions exceed 3%. Incremental analysis reveals that the contribution to bias correction differs across instruments. GNSS/MET plays a dominant role in temperature adjustment, while GMWR provides supplementary support. In contrast, the majority of the improvements in water vapor retrieval can be attributed to MRL observations. This study achieved a reasonable application of multiple ground-based remote sensing observations, providing a new approach for the inversion of temperature and humidity profiles in the atmospheric boundary layer.
1. Introduction
High-resolution and accurate thermodynamic profiling within the planetary boundary layer (PBL) is essential for both atmospheric research and operational weather forecasting, as it directly affects the understanding and prediction of high-impact weather events [1,2,3,4]. Sharp vertical gradients or shifts in temperature and water vapor, often triggered by synoptic- and meso-scale phenomena, such as frontal passages, convective systems, or local circulations, can significantly influence the development of severe weather [5,6,7,8], including squall lines, mesoscale convective systems, and heavy precipitation events. Consequently, there is an increasing demand for continuous, high-resolution observations of PBL thermodynamic structures [9,10].
To meet these observational requirements, various remote sensing techniques have been developed. Ground-based microwave radiometers (GMWRs) provide continuous, high-temporal-resolution retrievals of temperature and humidity profiles through radiative transfer inversion [11,12,13,14,15]. However, GMWRs typically suffer from reduced accuracy under cloudy or rainy conditions due to signal attenuation and biases in water vapor absorption modeling. Mie–Raman lidar (MRL) techniques offer high vertical resolution and sensitivity to water vapor and aerosol distributions [16,17,18,19,20], but their performance is limited in optically thick clouds and during precipitation events. Global Navigation Satellite System Meteorology (GNSS/MET) provides integrated refractivity measurements that are relatively insensitive to cloud and aerosol interference [21,22,23], yet the vertical resolution of GNSS/MET-derived profiles is inherently coarse.
Cooperating with the instruments mentioned above, numerous retrieval algorithms have been designed for individual instruments, related studies have largely focused on optimizing retrieval performance for a single sensor type, often under specific weather conditions [11,24,25] or for short-term campaigns [26,27]. While such approaches have yielded valuable insights into instrument-specific capabilities [28], they do not fully exploit the complementary strengths of active and passive remote sensing. A few studies have explored combined or synergistic retrievals [24,25,26,27,28], but these efforts are often constrained by case-specific configurations, simplified error treatments, or limited temporal coverage, leaving the operational applicability uncertain.
Addressing this need, the China Meteorological Administration (CMA) initiated the “Weak-Link Remediation Project” in 2021, deploying GNSS/MET, GMWR, and MRL systems at selected observational sites to enable continuous monitoring of high-resolution thermodynamic profiles throughout the PBL. Building on these observational capabilities, we propose an Ensemble Kalman Filter One-Dimensional Variational optimal estimation framework (EnKF1D-Var) that assimilates all three observation types simultaneously. This framework generates high-resolution thermodynamic profiles that leverage the complementary strengths of each instrument while mitigating their individual limitations. Using a three-month dataset with 1 h temporal and 15 m vertical resolutions, we investigate the respective contributions of GNSS/MET, GMWR, and MRL observations under varying meteorological conditions, providing a comprehensive assessment of multi-sensor assimilation in the PBL.
The structure of this paper is as follows: Section 2 provides a description of the observational site, instruments, and datasets. Section 3 introduces the EnKF1D-Var framework and its technical implementation. Section 4 presents the accuracy assessment and contribution analysis of the retrievals. Section 5 summarizes the findings and discusses implications for future research.
2. Instruments and Data
Three months of observations, from 1 May to 31 July 2024, were collected at Anqing Station (WMO ID: 58424) in Anhui Province, China. The rationale for selecting this site is twofold: From a topographical perspective, Anqing Station is located in the transition zone between the second and first steps of China’s terrain and lies in the middle reaches of the Yangtze River (Figure 1a). This region is frequently affected by the intensification of eastward-moving Southwest Vortices as they traverse the surrounding mountainous terrain [29,30,31,32]. From the standpoint of mesoscale weather monitoring, Anqing Station is situated in a valley between two mountain ranges and is in close proximity to the urban area. These features make it an ideal location for observing the thermodynamic structure of the boundary layer over a mountainous city under a humid subtropical monsoon climate (Figure 1b).
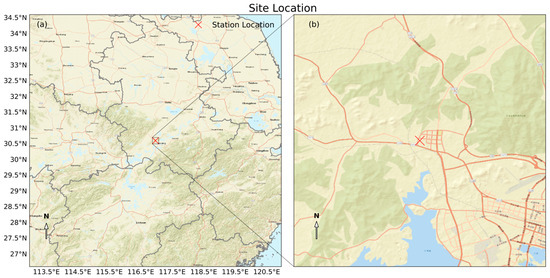
Figure 1.
(a) Large-scale terrain distribution and (b) surrounding land use types near the observation site. The site location is indicated by a red “×” symbol. The base map is provided by ArcGIS (http://server.arcgisonline.com/arcgis/rest/services, accessed on 8 July 2025).
2.1. Ground-Based Microwave Radiometer
The GMWR used for thermodynamic profiling typically have multiple channels along the water vapor absorption window from 22.2 to 31 GHz and oxygen absorption window from 51 to 60 GHz [11,12,13,14,15]. At Anqing Station, a QFW-6000 MWR (Figure 2a) developed by the 22nd Research Institute of China Electronics Technology Group Corporation (CETC) was deployed. This instrument included 7 water vapor channels centered at 22.24 GHz, 23.04 GHz, 23.84 GHz, 25.44 GHz, 26.24 GHz, 27.84 GHz, and 31.40 GHz and 7 oxygen channels centered at 51.26 GHz, 52.28 GHz, 53.86 GHz, 54.94 GHz, 56.66 GHz, 57.30 GHz, and 58.00 GHz at a temporal resolution of 2 min (https://22.cetc.com.cn/22/339013/338977/index.html, accessed on 14 July 2025).
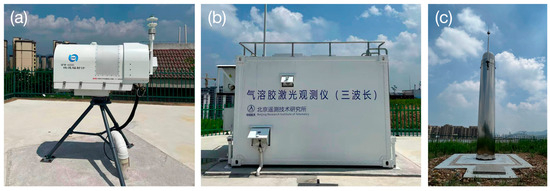
Figure 2.
QFW-6000 MWR (a) developed by the 22nd Research Institute of China Electronics Technology Group Corporation, Qingdao, China; the YLJ-2 RL (b) from the Beijing Institute of Telemetry Technology, China Aerospace Science and Technology Corporation, Beijing, China and the GNSS/MET (c) from Sinognss Technology Ltd., Shanghai, China.
2.2. Mie–Ranman Aerosol Lidar
The YLJ-2 MRL (Figure 2b) from the Beijing Research Institute of Telemetry, China Aerospace Science and Technology Corporation (CASC) operates at wavelengths of 355 nm, 532 nm, and 1064 nm [16,17,18,19,20], with single pulse energies of 0.6 mJ, 1.2 mJ, and 1.8 mJ, respectively, at a repetition rate of 1 kHz (https://www.spacechina.com/n25/n146/index.html, accessed on 14 July 2025). The spectroscopic detection system includes 2 polarized Mie scattering channels (horizontal and vertical) at 355 nm and 532 nm, 1 non-polarized elastic channel at 1064 nm, 2 nitrogen Raman channels centered at 386.7 nm and 607.5 nm, and 1 water vapor Raman channel centered at 407.5 nm. Under clear-sky conditions, the system typically provides vertical profiles extending up to approximately 5 km above ground level at a temporal resolution of 1 min. In this study, we utilize the ratio of the water vapor and nitrogen Raman channel observations, centered at 407.5 nm and 386.7 nm, respectively, to retrieve water vapor profiles, whose Raman backscatter signals are generated by the same excitation laser source at 355 nm.
2.3. Global Navigation Satellite System Meteorology Sensor
The GNSS/MET (Figure 2c), provided by Sinognss Technology Ltd. (https://www.sinognss.com/solution/#page6, accessed on 14 July 2025), is a ground-based remote sensing instrument that derives atmospheric profiles by analyzing signals from orbiting GNSS satellites [21,22,23], such as those from GPS, GLONASS, Galileo, and BeiDou constellations. As GNSS signals pass through the Earth’s atmosphere, particularly the troposphere, they experience delays primarily caused by variations in temperature, pressure, and water vapor. By measuring the zenith hydrostatic delay and zenith wet delay and applying appropriate retrieval algorithms, GNSS/MET can estimate atmospheric thermodynamic profiles with a high temporal resolution and all-weather capability with high accuracy.
2.4. Radiosonde
Two radiosondes are launched daily from Anqing Station, typically at approximately 23:15 and 11:15 UTC, and are used as reference (“truth”) data for estimating background and observation error matrices generation and accuracy evaluation, with temperature measurements at a resolution of 0.1 K and accuracy of 0.5 K, relative humidity with a resolution of 1% and accuracy of 5%, and pressure with a resolution of 0.1 hPa and accuracy of 0.5 hPa [33].
2.5. First Guess Profile
To provide first guess profiles, we utilized the 0–24 h lead-time forecast product from the National Centers for Environmental Prediction (NCEP) Global Forecast System (GFS), available at https://www.nco.ncep.noaa.gov/pmb/products/gfs/ (accessed on 7 June 2025). This dataset offered a horizontal resolution of 0.25° and includes 43 vertical pressure levels. Forecast fields were spatially interpolated to the Anqing Station location using the nearest-neighbor method and vertically densified by bilinear method. These interpolated profiles served as inputs in the optimal estimation routine.
3. EnKF1D-Var Framework
The EnKF1D-Var framework comprises three main steps (Figure 3). First, the GNSS/MET step adjusts the initial guess profile using the Zenith Total Delay (ZTD) derived from GNSS signal (Section 3.1). Second, the GMWR step refines the thermodynamic profile obtained from the GNSS/MET step by assimilating brightness temperature observations from a ground-based microwave radiometer, generating a 16-member ensemble (Section 3.2). Third, the MRL step incorporates Raman lidar observations to further update the ensemble profiles (Section 3.3). Finally, the analysis profile is derived through principal component analysis and reconstruction.
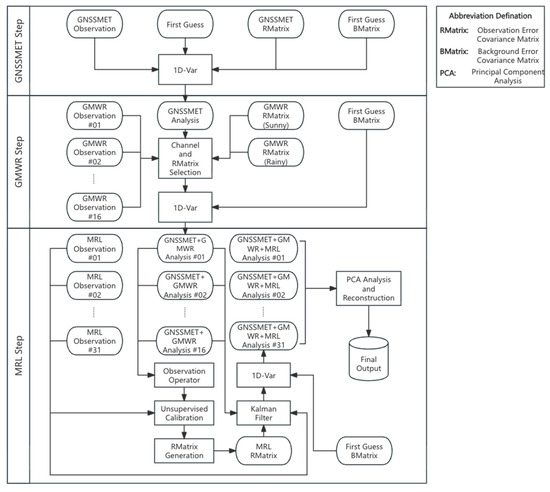
Figure 3.
EnKF1D-Var flowchart.
3.1. GNSS/MET Step
In the GNSS/MET step, the framework incorporates ZTD observations and their associated uncertainties within a 30 min assimilation window prior to the analysis time. These observations are used to adjust the first-guess temperature, water vapor, and pressure profiles by minimizing the following cost function Equation (1) [34]:
where denotes the cost function; the analysis result; the first guess; the background error covariance matrix; the observation vector; the observation operator; and the observation error covariance.
The observation operator consists of a forward model and Jacobian model. The forward model simulates the from the thermodynamic profile, using Equations (2)–(4) [35,36]:
where and denote the zenith hydrostatic delay and zenith wet delay, respectively. In Equation (3), and refer to the dry air pressure and water vapor pressure, respectively; is the ambient temperature, refers to the integral upper limit, and refers to the layer thickness.
The Jacobian model computes the partial derivatives of with respect to temperature, pressure, and water vapor using Equations (5)–(7) [37,38]:
Since GNSS/MET provides measurement uncertainties for each observation, the observation error covariance matrix R is constructed as a diagonal matrix, where each diagonal element equals the square of the corresponding observation uncertainty. All off-diagonal elements are set to zero. The background error covariance matrix B used in the EnKF1D-Var framework remains the same across all steps and will be detailed in Section 3.4.
3.2. GMWR Step
In the GMWR step, the analysis result from the GNSS/MET step is used as the first guess to generate an ensemble of thermodynamic profiles. This is achieved by applying the 1D-Var method (Equation (1)) to 16 sets of ground-based microwave radiometer (GMWR) observations. The observation operator employs RTTOV-gb [39] to simulate brightness temperature and compute its Jacobians with respect to temperature and water vapor.
Unlike GNSS/MET observations, which are largely insensitive to weather conditions, the reliability of GMWR measurements is strongly influenced by the atmospheric state, especially in water vapor-sensitive channels (Table 1). To address this limitation, a channel and observation error covariance matrix selection procedure is applied before each 1D-Var minimization. This procedure first diagnoses the prevailing weather conditions by comparing the brightness temperature (BT) measured by the onboard thermal infrared (8–14 µm) sensor with the 2 m air temperature from the co-located automatic weather station integrated into the GMWR system. As is the well-established theory that the cloud-induced downward radiation elevates thermal infrared BT relative to clear-sky conditions at the same 2 m air temperature [40,41], the BT–temperature difference provides a practical and widely applicable indicator for identifying and quantifying cloudiness. Within this framework, if the difference is smaller than −30 K, the condition is classified as “Clear,” indicating minimal cloud contamination. Otherwise, it is categorized as “Cloudy or Rainy,” reflecting substantial cloud contributions to observation errors. Based on the diagnosed weather condition, the corresponding observation error covariance matrix () is loaded, and channel selection is performed. For “Cloudy or Rainy” conditions, only observations from three oxygen channels—56.66 GHz, 57.30 GHz, and 58.00 GHz—are retained. For “Clear” conditions, all channel observations with observation-minus-simulation departures smaller than their respective measurement uncertainties (i.e., the square root of the diagonal elements of ) are accepted.

Table 1.
Measurement uncertainty of GMWR channels under clear and cloudy or rainy conditions.
The observation error covariance matrices for “Clear” and “Cloudy or Rainy” conditions are computed using the following equation (Equation (8)):
where denotes the GMWR observation, denotes the simulation generated by RTTOV-gb driven by radiosonde observation, and stands for the mathematical expectation.
Within a 30 min assimilation window, this channel and covariance selection routine is executed 16 times using GMWR observations at 2 min intervals. Each iteration initializes a 1D-Var minimization using the GNSS/MET analysis as the first guess. By the end of this step, an ensemble of 16 thermodynamic profiles—each incorporating both GNSS/MET and GMWR observational information—is generated and ready for subsequent analysis.
3.3. MRL Step
Following the GMWR step, the MRL step further refines the water vapor information in the ensemble thermodynamic profiles by minimizing the cost function (Equation (1)), using the ratio of two Raman channel observations as the observational constraint. Similar to the GNSS/MET step, we construct the observation operator based on Equations (9)–(11) [42]:
where represents the simulated backscatter signal for the H2O channel, centered at a wavelength of 407.5 nm; is the instrument constant for H2O channel; denotes the Raman backscatter differential cross-section of water vapor molecules; is water vapor molecule number density at altitude ground level ; and the terms and represent the atmospheric transmittance integrated from to at wavelength 355.0 nm () and wavelength 407.5 nm (), respectively. Similarly, represents the simulated backscatter signal for the nitrogen (N2) channel, centered at a wavelength 387.6nm; is the instrument constant for N2 channel; denotes the Raman backscatter differential cross-section of nitrogen molecules, is the number density of nitrogen molecules at altitude of ground level , and represent the atmospheric transmittance integrated from to at wavelength 387.6 nm (). Based on the relations (Equations (12) and (13)):
Equation (11) can written as:
where and denote the atmospheric extinction coefficients at the Raman scattering wavelengths of water vapor and nitrogen. Defining and considering the fact that the volume concentration of nigtrogen is relatively steady (~78.08%), Equation (14) and its partial derivative against water vapor can be expressed as:
The backscatter ratio simulation and Jacobian modules are implemented in a bias-free manner by neglecting Mie scattering effects from atmospheric aerosols. To mitigate this limitation, we introduce a calibration module based on a random forest algorithm [43], using 100 trees and a squared error splitting criterion. To mitigate overfitting, we allow the nodes to expand until all the leaves are pure or until all the leaves contain less than 2 samples. As demonstrated in Figure 4, the RL observation operator is capable of generating low-bias simulations under both clear and cloudy conditions.
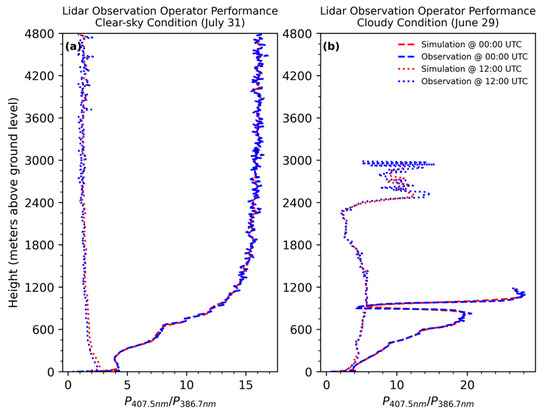
Figure 4.
Simulation ratio from RL observation operator using radiosonde (red lines) under the clear-sky condition (a) and cloudy condition (b) compared to the ratio calculated from RL observations (blue lines). Dotted lines represent the comparison valid at daytime (00:00 UTC); dashed lines represents the comparison valid at nighttime (12:00 UTC).
As discussed in Section 2.2, the laser pulse energy at 355 nm is reduced to 0.6 mJ to meet CMA’s cost-efficiency and maintenance requirements. This adjustment introduces a major challenge for retrieving water vapor profiles from Raman channels: during daytime, strong solar background noise can severely suppress useful signals. In addition, aerosol and cloud contamination further degrade the observational accuracy and limit the effective detection range of the Raman channels. To mitigate these issues, a quality control procedure is performed immediately after the observation ingestion step. This procedure computes the 355 nm Linear Depolarization Ratio (LDR) and the ratios between N2 (or H2O) signals and the 355 nm horizontally polarized backscatter signal. By applying a Fast Fourier Transform (FFT) [44] to these ratios, the routine identifies amplitude profiles and detects inflection points. Observations within the lidar blind zone up to the lowest inflection point—where the gradient of the modulus of the complex amplitude reaches its minimum—are retained, while those above the upper inflection point are discarded. As illustrated in Figure 5, before quality control (Figure 5a,d,g), Raman lidar (RL) observations are strongly contaminated by solar radiation, aerosols, and clouds. After performing the procedure (Figure 5b,e,h), these disturbances are effectively removed, while the essential profile structure within the planetary boundary layer (PBL) is preserved. Time–height reflectivity from the Ka-band cloud radar (Figure 5c,f,i) is also included to indicate the presence of clouds and precipitation. Furthermore, as previous studies have demonstrated that MRLs suffer from overlap effects in the near range—typically from the surface up to several hundred meters [45,46]—MRL observations below 75 m above ground level are excluded from the EnKF1D-Var framework. This threshold follows the results concluded from a series of experiments conducted by the Meteorological Observation Center (MOC) of the CMA within the China Aerosol Raman Lidar Network (CARLNET) [47].
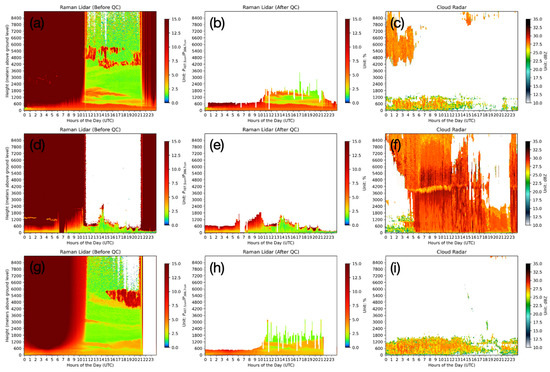
Figure 5.
Time–height cross-sections of MRL H2O and N2 Raman channel observation ratio before (a,d,g) and after (b,e,h) quality control, demonstrating the removal of contamination from solar radiation, aerosols, and clouds while retaining the profile structure within the planetary boundary layer (PBL). Reflectivity from the Ka-band cloud radar (c,f,i) is shown to indicate cloud and precipitation conditions during the same periods. First row (a,b,c) represents the normal condition, second row (d,e,f) represents the precipitive condition, and third row (g,h,i) represents the high-temperature condition.
Given that water vapor exhibits higher spatiotemporal variability than temperature—especially within the PBL—the process error covariance matrix (), representing simulation uncertainty of the lidar observation operator, cannot be neglected. Therefore, an ensemble-based approach is adopted to estimate using the thermodynamic profile ensemble from the GMWR step. Simulated backscatter ratios are generated for each ensemble member, and are then calculated following Equation (8), while the observation error covariance matrix for the RL ratio is obtained using the same approach as in Section 3.2.
To suppress measurement noise caused by low laser pulse energy and a high repetition rate, and to retain the integrity of physical signals, a synthetic observation generation operator is employed. This operator combines the forward-simulated ratio and RL measurements via a Kalman filter [48]. In the initialization phase, the Kalman filter uses the simulated ratio as the prior estimate and initializes the observation (process) error covariance matrix with and . During the recursive update, RL observations at a 1 min resolution are assimilated within a 30 min time window. After filtering, the final outputs include a synthetic ratio and an updated observation error covariance matrix , which dynamically combines the static observation error () and the process error (). Using the synthetic ratio and updated , the ensemble thermodynamic profiles are updated via Equation (1) and subsequently passed into a Principal Component Analysis (PCA) module [49,50,51,52]. Finally, the analysis profile is reconstructed using the top 25 principal components.
3.4. Background Error Covariance Matrix
The background error covariance matrix () plays a crucial role in determining the weight of the first guess profile and observation in the 1D-Var process. It is derived from the differences between radiosonde observations and the 12 h lead-time GFS forecasts () valid at 00:00 and 12:00 UTC from 1 May to 31 July 2024, using the following Equation (10):
where stands for the mathematical expectation.
4. Results
4.1. Evaluation Against Radiosonde
Five sets of analyzed thermodynamic profiles were generated using GFS forecasts with lead times of 0, 6, 12, 18, and 24 h, all valid at 00:00 UTC and 12:00 UTC as first guesses for both optimal and practical approaches. Through the data assimilation framework, ground-based remote sensing observations collected within a −5 to +25 min time window centered at 23:15 UTC and 11:15 UTC were assimilated, respectively. The selection of this observation window is based on the radiosonde launch schedule and the ascent rate of the balloon: typically, radiosondes are launched approximately 45 min before the validation time, and the balloon ascends to 6000 m above ground level in about 25–30 min. A total of 920 profiles were evaluated, with each dataset comprising 184 profiles collected between 1 May and 31 July 2024.
4.1.1. General Performance
As shown by the solid lines in Figure 6a, which represent the average across all five analyzed profile datasets, the EnKF1D-Var framework generally reduces the mean temperature bias by approximately 0.0074 K (~1%) above 2100 m above ground level (AGL) compared to the first guess. No significant improvement below 2100 m was found. Benefiting from a more accurate initial condition, the analysis profiles based on the 0 h lead-time GFS forecast (dashed lines in Figure 6a) demonstrate the best performance, with the smallest mean biases. In contrast, profiles initialized with the 24 h lead-time forecast exhibit relatively inferior performance. Generally, by effectively assimilating GMWR and GNSS/MET observations, the EnKF1D-Var framework reduces the mean temperature bias to below 0.8 K, even when using less accurate background forecasts. The Root Mean Squared Error (RMSE) profiles of temperature (Figure 6b) indicate modest improvements in the reduction of random errors in the analysis. Similarly, the analysis results using the 0 h lead-time forecast (dashed line) present the best performance when compared with both the five-dataset average (solid line) and the 24 h lead-time forecast (dotted line). As shown in Figure 6c, the EnKF1D-Var framework also reduces the water vapor mean bias below 1200 m AGL using integrated ground-based remote sensing observations. In particular, the mean bias is reduced by approximately 70 to 120 PPMV below 300 m AGL. The influence of the forecast lead time of the first guess is also evident: the analysis based on the 0 h lead-time forecast outperforms the average, whereas the profiles based on the 24 h lead-time forecast show larger biases. Consistent with the temperature analysis, RMSE reductions in water vapor are observed after applying the EnKF1D-Var process (Figure 6d); however, the magnitude of RMSE reduction is generally smaller than that of the mean bias correction. In conclusion, the EnKF1D-Var framework can produce more accurate thermodynamic profiles by effectively updating the first guess using GNSS/MET, GMWR, and MRL observations. Despite variations in the forecast quality of the initial condition, the framework consistently reduces both systematic biases and random uncertainties. For practical use, users can optimally select the mean values of the 24 h forecasts of GFS as the first guess.
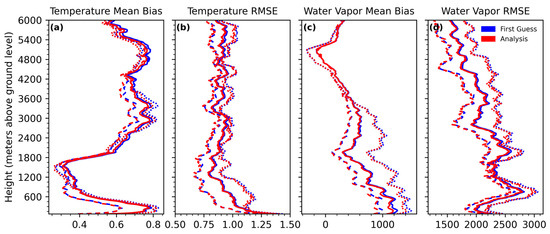
Figure 6.
Performance evaluation of the EnKF1D-Var framework in correcting thermodynamic profile biases using integrated ground-based remote sensing observations. (a) Vertical profiles of mean temperature bias for different forecast lead times: 0 h (dashed lines), 24 h (dotted lines), and the mean of five datasets (solid lines), representing the confidence interval and the general performance. (b) Corresponding Root Mean Squared Error (RMSE) profiles for temperature. (c) Mean bias of water vapor profiles. (d) RMSE of water vapor profiles.
4.1.2. Day–Night Difference
Day–night performance differences represent another important aspect of the EnKF1D-Var analysis of thermodynamic profiles. As shown in Figure 7a,e, the mean temperature bias of the analysis at 00:00 UTC (daytime, 08:00 local time) is relatively higher than that at 12:00 UTC (nighttime, 20:00 local time). Moreover, the advantage of using the 0 h lead-time forecast over the 24 h lead-time forecast—clearly observed in the 00:00 UTC evaluation—cannot be identified in the 12:00 UTC evaluation (Figure 7e). Nevertheless, the reduction in the mean bias achieved by the EnKF1D-Var analysis is evident in both daytime and nighttime assessments. Furthermore, the vertical range over which the best performance occurs is consistent between the two times and aligns with the optimal range identified in Section 4.1.1. In contrast to the mean bias results, the RMSE evaluation (Figure 7b,f) shows less pronounced day–night differences. The analysis based on the 0 h lead-time forecast consistently yields the lowest RMSE, whereas the analysis initialized with the 24 h lead-time forecast shows larger RMSE values than the five-profile average. As shown in Figure 7c,g, the height range of best performance in terms of the water vapor mean bias shifts with time. At 00:00 UTC, it is reduced to approximately 900 m AGL, whereas at 12:00 UTC, it is elevated to around 1650 m AGL. These altitudes are 300 m lower and 450 m higher than those identified in Section 4.1.1. This deviation is likely caused by the influence of solar radiation on the vertical distribution of water vapor. Despite the vertical shift, the magnitude of mean bias reduction remains nearly identical between the 00:00 and 12:00 UTC evaluations, and is also consistent with the results presented in Section 4.1.1. Differences in water vapor RMSE between day (Figure 7d) and night (Figure 7h) are not significant. The analysis using the 0 h lead-time forecast as the first guess consistently outperforms the dataset average, while that using the 24 h lead-time forecast performs below average. Also, the analysis valid at 00:00 UTC (daytime) is generally better than 12:00 UTC (nighttime). The overall reduction magnitude closely matches the results discussed in Section 4.1.1.
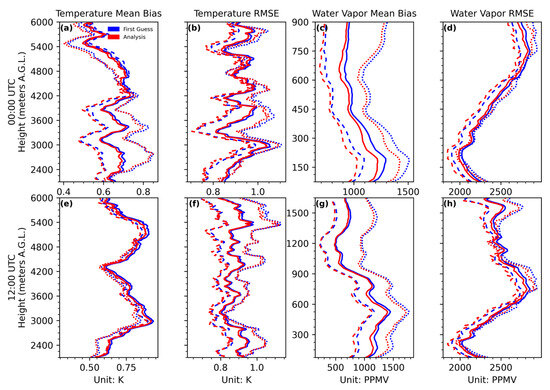
Figure 7.
Comparison of EnKF1D-Var analysis performance at 00:00 UTC (panels (a–d)) and 12:00 UTC (panels (e–h)) for thermodynamic profiles. Panels (a,e) show vertical profiles of mean temperature bias for different forecast lead times (0 h, 24 h, and dataset average). Panels (b,f) present the corresponding temperature RMSE profiles. Panels (c,g) illustrate water vapor mean bias profiles, while panels (d,h) depict the water vapor RMSE. All evaluations are based on the assimilation of integrated ground-based remote sensing observations under varying forecast initialization conditions and local times.
4.1.3. Performance Under Different Weather Conditions
To evaluate the performance of the EnKF1D-Var thermodynamic profiles under different weather conditions, three categories—precipitation, high-temperature, and normal—are defined based on surface observations (Figure 8). Precipitation days are identified when the 24 h accumulated precipitation exceeds 1 mm, and high-temperature days are defined as those with a daily maximum temperature exceeding 35 °C. All remaining days, which do not fall into either category, are classified as normal conditions.
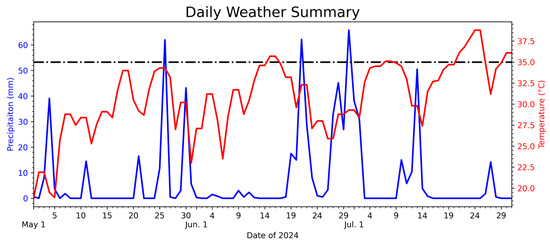
Figure 8.
Time series of daily meteorological factors at Anqing Station from 1 May to 31 July 2024: precipitation (blue solid line), maximum daily temperature (red solid line), and high-temperature threshold (black dashed line).
The temperature mean bias (Figure 9a,c,e) and RMSE (Figure 9b,d,f) remain relatively stable across different weather conditions. Specifically, the mean bias ranges from 0.45 K to 1.00 K, while the RMSE varies between 0.60 K and 1.15 K. Nevertheless, notable differences are observed: the mean bias associated with precipitation cases is generally lower than that under normal and high-temperature conditions. In addition, the region of significant improvement—defined as where the analysis profile reduces the mean bias by more than 0.02 K compared to the first guess—extends from 3000 m to 6000 m AGL under normal conditions (Figure 9a). This region descends to 2100 m AGL during precipitation events (Figure 9b) and remains between 2100 m and 3000 m AGL under high-temperature conditions (Figure 9c). In contrast to the mean bias, the reduction in the RMSE is less pronounced, and the vertical distribution of improvement differs. The regions where the EnKF1D-Var framework yields a detectable positive impact on RMSE are located between 5400 m and 6000 m AGL under normal conditions and between 5100 m and 5700 m AGL during precipitation (Figure 9b,d). However, under high-temperature conditions, the RMSE improvement is less evident (Figure 9f).
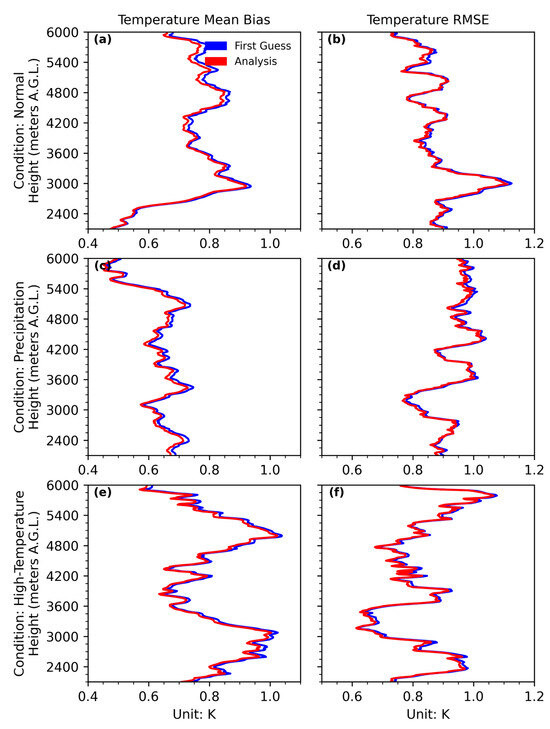
Figure 9.
Vertical profiles of temperature mean bias (a,c,e) and RMSE (b,d,f) under different weather conditions: normal (a,b), precipitation (c,d), and high temperature (e,f), indicating that EnKF1D-Var is capable of improving temperature and water vapor retrievals in all conditions. Profiles are derived from EnKF1D-Var analysis and corresponding first guess.
Under normal weather conditions, the water vapor mean bias reduction achieved by the EnKF1D-Var framework is most pronounced below 850 m AGL, with a maximum reduction of approximately 180 PPMV at 150 m AGL (Figure 10a). During precipitation events (Figure 10c), the region of significant bias reduction extends upward to 1000 m AGL, and the reduction at 300 m AGL increases to about 210 PPMV, indicating that the EnKF1D-Var framework performs more effectively in correcting water vapor under precipitative conditions than under normal conditions. In contrast, under high-temperature conditions (Figure 10e), the vertical distribution of water vapor mean bias reduction is less distinct, with the analysis profile showing a consistent improvement of approximately 50 to 150 PPMV compared to the first guess throughout the lower atmosphere. Unlike the mean bias, the RMSE of the analysis profile is generally reduced by about 50 PPMV across all three weather conditions, and the vertical distribution of RMSE reduction appears more homogeneous than that of the mean bias (Figure 10b,d,f).
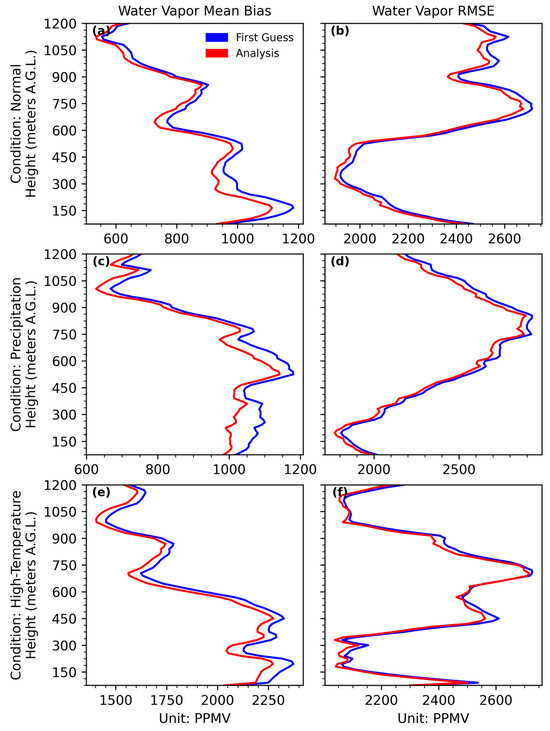
Figure 10.
Vertical profiles of water vapor mean bias (a,c,e) and RMSE (b,d,f) under different weather conditions: normal (a,b), precipitation (c,d), and high temperature (e,f). Profiles compare the EnKF1D-Var analysis with the corresponding first guess, with variations in the magnitude and vertical extent of bias and RMSE reductions across the three scenarios.
4.2. Instrument Contribution Analysis
The results presented in Section 4.1 demonstrate that the EnKF1D-Var framework is capable of generating more accurate thermodynamic profiles by effectively reducing both systematic (mean bias) and random (RMSE) errors present in the first guess. This improvement is achieved through the integration of ground-based remote sensing observations from GNSS/MET, GMWR, and MRL. In this section, we further investigate the individual contributions of these observation types to the improvement in analysis profile accuracy.
4.2.1. Temperature
The temperature-related added value from GNSS/MET observations is generally greater than that from GMWR. Under normal conditions, the temperature analysis increments derived from GNSS/MET range from −0.6 K to 0.55 K (Figure 11a), whereas those from GMWR are confined to a narrower range of −0.07 K to 0.14 K (Figure 11d). During precipitation events, the contribution from GNSS/MET decreases to a range of −0.3 K to 0.4 K (Figure 11b), while GMWR maintains a relatively stable impact between −0.08 K and 0.07 K (Figure 11e). Under high-temperature conditions (Figure 11c,f), the influence of both GNSS/MET and GMWR on temperature adjustments further diminishes, with GNSS/MET contributing within a range of −0.08 K to 0.16 K and GMWR within a range of −0.025 K to 0.06 K, respectively. Additionally, GMWR observations exhibit a stratification phenomenon: layers with significant temperature modifications are primarily located at 2100–2700 m, 3150–3600 m, 3750–4350 m, 4650–5250 m, and 5550–6300 m above ground level. However, under high-temperature conditions, the influence of GMWR becomes negligible in the 3750–5250 m layer.
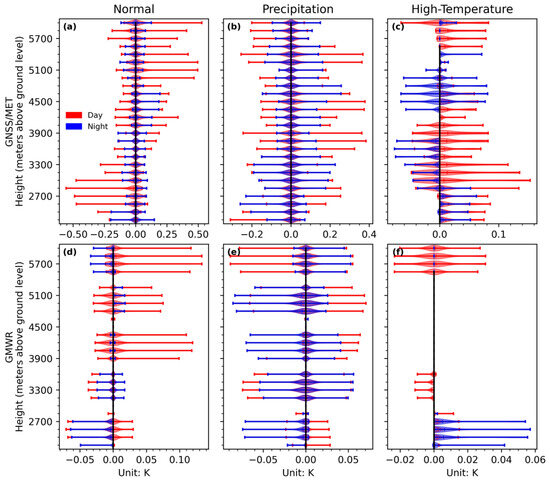
Figure 11.
Vertical profiles of temperature analysis increments attributed to GNSS/MET (a–c) and GMWR (d–f) observations under different weather conditions: normal (a,d), precipitation (b,e), and high temperature (c,f). Red and blue lines represent daytime (00:00 UTC) and nighttime (12:00 UTC) assimilation results, respectively. The vertical range and magnitude of temperature modifications vary with sensor type, weather condition, and time of day.
Despite their differences, both GNSS/MET and GMWR observations tend to produce cold modifications between 2100 m and 3300 m, and warm modifications above 3300 m under normal conditions (Figure 11a,d). During the daytime (indicated by red lines), the magnitude of these modifications is generally larger than that observed at night (blue lines). Under precipitation conditions (Figure 11b,e), the day–night differences in added value are less pronounced, and the cold–below/warm–above modification pattern is less distinct compared to that under normal conditions. Under high-temperature conditions, GNSS/MET observations (Figure 11c) generally contribute a warm adjustment to the first guess during the daytime. However, at night, the warm influence is mostly limited to the 2100–2700 m layer. At other levels, the modifications tend to be either neutral (e.g., between 4350 m and 4950 m) or cold (e.g., between 3000 m and 3900 m).
4.2.2. Water Vapor
Since the contributions of GNSS/MET and GMWR observations to the water vapor analysis increments are generally less than 10 PPMV, this section focuses solely on the impact of MRL observations on the first-guess water vapor profiles. As shown in Figure 12, the vertical distribution of the analysis increment is highly dependent on weather conditions during the daytime. Overall, MRL observations consistently provide a dry correction to the first guess, except for a minor wet adjustment between 300 m and 450 m under precipitation conditions (Figure 12b). Under normal conditions (Figure 12a), MRL observations correct the moist bias of the first guess by introducing a dry increment from the surface to 450 m during both the daytime and nighttime, with different magnitudes: the added value remains within 50 PPMV at night but exceeds 140 PPMV during the day. A similar pattern is observed between 1200 m and 1650 m. Between 450 m and 1175 m, MRL observations provide alternating wet and dry adjustments to the first guess during the day, with a maximum wet (dry) correction of 276 PPMV (167 PPMV) at around 825 m. Under precipitation conditions (Figure 12b), the nighttime impact of MRL is more pronounced than during the daytime. Below 875 m, although wet corrections are more detectable during the day, dry modifications dominate in magnitude. Above 875 m, wet modifications begin to exceed dry ones during the daytime, while dry adjustments continue to dominate at night. Under high-temperature conditions (Figure 12c), dry corrections are detected below 875 m, with a stronger impact during the day than at night. Above 875 m, daytime modifications are negligible, whereas nighttime dry corrections can reach up to 280 PPMV at around 1425 m.
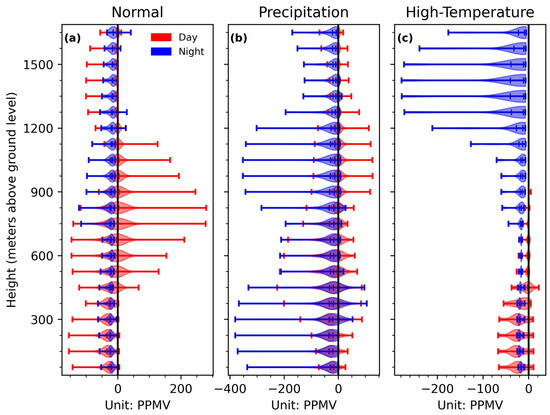
Figure 12.
Vertical profiles of water vapor analysis increments derived from MRL observations under different weather conditions: normal (a), precipitation (b), and high temperature (c). Red and blue lines represent daytime (00:00 UTC) and nighttime (12:00 UTC) results, respectively. The magnitude and vertical structure of MRL-induced corrections to the first-guess water vapor profiles vary with weather conditions and time of day.
5. Discussion and Conclusions
This study evaluated the performance of the EnKF1D-Var framework in generating thermodynamic profiles by assimilating integrated ground-based remote sensing observations, including GNSS/MET, GMWR, and MRL. The findings from over 900 profile evaluations across various forecast lead times, times of day, and weather conditions provide several key insights.
First, the EnKF1D-Var framework consistently reduced both systematic (mean bias) and random (RMSE) errors in temperature and water vapor profiles compared to the first guess. These improvements were most prominent when short lead-time forecasts (0 h) were used as the background, highlighting the importance of accurate initial conditions. Nevertheless, even with longer lead times (e.g., 24 h), the framework maintained a capacity to improve the analysis quality, demonstrating robustness against initial forecast degradation.
Second, notable diurnal differences were observed in the assimilation outcomes. Daytime analyses exhibited larger temperature biases than nighttime ones, likely due to the influence of solar radiation on boundary layer development. Interestingly, the best-performing vertical levels shifted with time in water vapor analysis, indicating the need to account for solar-induced variability in assimilation strategies.
Third, weather condition-dependent behavior was evident in both temperature and humidity retrievals. Under precipitation, the EnKF1D-Var framework exhibited the strongest performance in correcting water vapor biases, particularly in the lower atmosphere. In contrast, temperature RMSE improvements were less sensitive to weather changes, though high-temperature conditions were found to suppress the effectiveness of both temperature and humidity corrections at higher altitudes.
Instrument-specific contribution analysis revealed that GNSS/MET observations generally offered a greater added value in temperature profile correction compared to GMWR, especially under normal and precipitation conditions. GMWR exhibited stratified correction layers, with decreasing influence under extreme heat. For water vapor, MRL was the only sensor providing meaningful corrections, predominantly dry, with variations in magnitude and direction depending on height, time of day, and weather regime. The layered dry corrections from MRL observations significantly enhanced near-surface humidity estimates, particularly under precipitation conditions.
In conclusion, the EnKF1D-Var framework demonstrates strong potential for enhancing high-resolution thermodynamic profile analyses through the assimilation of ground-based remote sensing observations. Its robustness across forecast lead times with high computation efficiency: less than 3 min using a server with an 8-core ARMv8 architecture CPU and 16 GB RAM, ability to adapt to different weather conditions, and sensitivity to diurnal cycles make it a valuable tool for improving local weather analysis and short-term forecasting. Future efforts should focus on expanding the observational network, optimizing the observation operator for non-linear processes, and incorporating cloud and precipitation-sensitive observations to further refine boundary layer and convective-scale analyses.
Author Contributions
B.D. planned the measurement campaign. S.W. and F.D. carried out the ground-based observations. Q.Z. designed the EnKF1D-Var framework, conducted all the coding work, and performed the data analysis. Q.Z. drafted the manuscript. M.S. reviewed and revised the manuscript. M.S. secured the financial support for this study. All authors have read and agreed to the published version of the manuscript.
Funding
This research is supported by the National Nature Science Foundation of China under grant 42307132, the Ministry of Science and Technology of China under grant 2024YFC3013001, and Lushan Cloud and Fog Special Project of Jiangxi Meteorological Bureau under grant JX2023LSYWZX01.
Data Availability Statement
The ground-based microwave radiometer (GMWR), Mie–Raman lidar (MRL), and GNSS/MET observations used in this study were collected at Anqing Station and are part of the operational network of the China Meteorological Administration (CMA). These data can be found using the url: https://doi.org/10.5281/zenodo.16791027. GFS forecast data are available from the National Centers for Environmental Prediction (NCEP) via https://www.nco.ncep.noaa.gov/pmb/products/gfs/ (accessed on 7 June 2025). Radiosonde data from Anqing Station are archived by the CMA and can be found via https://www.ncei.noaa.gov/data/igra/ (accessed on 7 June 2025).
Acknowledgments
The authors sincerely thank the anonymous reviewers for their constructive comments and insightful suggestions, which have greatly improved the quality and clarity of this manuscript. We are also grateful to the Academic Editor for their careful handling of the peer review process and valuable guidance throughout the revision.
Conflicts of Interest
The authors declare no conflicts of interest.
References
- Wulfmeyer, V.; Hardesty, R.M.; Turner, D.D.; Behrendt, A.; Cadeddu, M.; Di Girolamo, P.; Schluessel, P.; van Baelen, J.; Zus, F. A Review of the Remote Sensing of Lower-Tropospheric Thermodynamic Profiles and Its Indispensable Role for the Understanding and Simulation of Water and Energy Cycles. Rev. Geophys. 2015, 53, 819–895. [Google Scholar] [CrossRef]
- Wagner, T.J.; Klein, P.M.; Turner, D.D. A New Generation of Ground-Based Mobile Platforms for Active and Passive Profiling of the Boundary Layer. Bull. Am. Meteorol. Soc. 2019, 100, 137–153. [Google Scholar] [CrossRef]
- Turner, D.D. Improved Ground-Based Liquid Water Path Retrievals Using a Combined Infrared and Microwave Approach. J. Geophys. Res. 2007, 112, D15204. [Google Scholar] [CrossRef]
- Hu, J.; Yussouf, N.; Turner, D.D.; Jones, T.A.; Wang, X. Impact of Ground-Based Remote Sensing Boundary Layer Observations on Short-Term Probabilistic Forecasts of a Tornadic Supercell Event. Weather Forecast. 2019, 34, 1453–1476. [Google Scholar] [CrossRef]
- Geerts, B.; Parsons, D.; Ziegler, C.; Weckwerth, T.; Biggerstaff, M.; Clark, R.; Coniglio, M.; Demoz, B.; Ferrare, R.; Gallus, W., Jr.; et al. The 2015 Plains Elevated Convection At Night field project. Bull. Am. Meteorol. Soc. 2017, 98, 767–786. [Google Scholar] [CrossRef]
- Löhnert, U.; Maier, O. Operational profiling of temperature using ground-based microwave radiometry at Payerne: Prospects and challenges. Atmos. Meas. Tech. 2012, 5, 1121–1134. [Google Scholar] [CrossRef]
- Foth, A.; Pospichal, B. Optimal estimation of water vapour profiles using a combination of Raman lidar and microwave radiometer. Atmos. Meas. Tech. 2017, 10, 3325–3344. [Google Scholar] [CrossRef]
- Teixeira, J.; Piepmeier, J.R.; Nehrir, A.R.; Ao, C.O.; Chen, S.S.; Clayson, C.A.; Fridlind, A.M.; Lebsock, M.; McCarty, W.; Salmun, H.; et al. Toward a global planetary boundary layer observing system: A summary. Bull. Am. Meteorol. Soc. 2025, 106, E1566–E1579. [Google Scholar] [CrossRef]
- Barrera-Verdejo, M.; Crewell, S.; Löhnert, U.; Orlandi, E.; Di Girolamo, P. Ground-based lidar and microwave radiometry synergy for high vertical resolution absolute humidity profiling. Atmos. Meas. Tech. 2016, 9, 4013–4028. [Google Scholar] [CrossRef]
- Turner, D.D.; Löhnert, U. Ground-based temperature and humidity profiling: Combining active and passive remote sensors. Atmos. Meas. Tech. 2021, 14, 3033–3048. [Google Scholar] [CrossRef]
- Cimini, D.; Hewison, T.J.; Martin, L.; Güldner, J.; Gaffard, C.; Marzano, F.S. Temperature and humidity profile retrievals from ground-based microwave radiometers during TUC. Meteorol. Z. 2006, 15, 45–56. [Google Scholar] [CrossRef]
- Schnitt, S.; Foth, A.; Kalesse-Los, H.; Mech, M.; Acquistapace, C.; Jansen, F.; Löhnert, U.; Pospichal, B.; Röttenbacher, J.; Crewell, S.; et al. Ground- and ship-based microwave radiometer measurements during EUREC4A. Earth Syst. Sci. Data 2024, 16, 681–700. [Google Scholar] [CrossRef]
- Cimini, D.; Nelson, M.; Güldner, J.; Ware, R. Forecast Indices from a Ground-Based Microwave Radiometer for Operational Meteorology. Atmos. Meas. Tech. 2015, 8, 315–333. [Google Scholar] [CrossRef]
- Askne, J.I.; Westwater, E.R. A Review of Ground-Based Remote Sensing of Temperature and Moisture by Passive Microwave Radiometers. EEE Trans. Geosci. Remote Sens. 2007, 45, 340–352. [Google Scholar] [CrossRef]
- Hewison, T.J. 1D-VAR Retrieval of Temperature and Humidity Profiles from a Ground-Based Microwave Radiometer. IEEE Trans. Geosci. Remote Sens. 2007, 45, 2163–2168. [Google Scholar] [CrossRef]
- Behrendt, A.; Nakamura, T.; Onishi, M.; Baumgart, R.; Tsuda, T. Combined Raman Lidar for the Measurement of Atmospheric Temperature, Water Vapor, Particle Extinction Coefficient, and Backscatter Coefficient. Appl. Opt. 2002, 41, 7657–7666. [Google Scholar] [CrossRef] [PubMed]
- Bennett, L.J.; Blyth, A.M.; Burton, R.R.; Gadian, A.M.; Weckwerth, T.M.; Behrendt, A.; Di Girolamo, P.; Dorninger, M.; Lock, S.-J.; Smith, V.H.; et al. Initiation of Convection over the Black Forest Mountains during COPS IOP15a. Q. J. R. Meteorol. Soc. 2011, 137, 176–189. [Google Scholar] [CrossRef]
- Brocard, E.; Philipona, R.; Haefele, A.; Romanens, G.; Mueller, A.; Ruffieux, D.; Simeonov, V.; Calpini, B. Raman Lidar for Meteorological Observations, RALMO—Part 2: Validation of Water Vapor Measurements. Atmos. Meas. Tech. 2013, 6, 1347–1358. [Google Scholar] [CrossRef]
- Di Girolamo, P.; Marchese, R.; Whiteman, D.N.; Demoz, B.B. Rotational Raman Lidar Measurements of Atmospheric Temperature in the UV. Geophys. Res. Lett. 2004, 31, L01106. [Google Scholar] [CrossRef]
- Gamage, S.M.; Sica, R.J.; Martucci, G.; Haefele, A. A 1D Var Retrieval of Relative Humidity Using the ERA5 Dataset for the Assimilation of Raman Lidar Measurements. J. Atmos. Ocean. Technol. 2020, 37, 2051–2064. [Google Scholar] [CrossRef]
- Li, L.; Zhang, H.; Yuan, Y.; Aichinger-Rosenberger, M.; Soja, B. HDTM: A Novel Model Providing Hydrostatic Delay and Weighted Mean Temperature for Real-Time GNSS Precipitable Water Vapor Retrieval. IEEE Trans. Geosci. Remote Sens. 2025, 63, 5800211. [Google Scholar] [CrossRef]
- Ma, Y.; Li, Z.; Wang, F.; Zhang, H.; Liu, J.; Chen, G.; Lü, C. Assimilating GNSS Tropospheric Products and Quantitative Evaluation of Their Contributions to Numerical Weather Prediction. IEEE Trans. Geosci. Remote Sens. 2025, 63, 5801413. [Google Scholar] [CrossRef]
- Jiang, X.; Wu, Y.; Zhang, Y. Quality Analysis of GNSS/MET Water Vapor Observation Data in Hainan Province. Nat. Sci. J. Hainan Univ. 2022, 40, 175–181. [Google Scholar] [CrossRef]
- Temimi, M.; Weston, M.J.; Khanal, S.; Ghedira, H.; Norouzi, H.; Al Mandous, A. On the analysis of ground-based microwave radiometer data during fog events. Atmos. Res. 2020, 243, 104976. [Google Scholar] [CrossRef]
- Tan, H.; Mao, J.; Chen, H.; Chan, P.W.; Wu, D.; Li, F.; Deng, T. A Study of a Retrieval Method for Temperature and Humidity Profiles from Microwave Radiometer Observations Based on Principal Component Analysis and Stepwise Regression. J. Atmos. Ocean. Technol. 2011, 28, 378–389. [Google Scholar] [CrossRef]
- Löhnert, U.; Maier, O. Operational profiling of temperature using ground-based microwave radiometry in an Alpine valley. Atmos. Meas. Tech. 2012, 5, 2613–2628. [Google Scholar] [CrossRef]
- Foth, A.; Baars, H.; Di Girolamo, P.; Mattis, I.; Radlach, M.; Schmidt, J.; Wandinger, U. Water vapor profiles from Raman lidar: Calibrated by means of the current European radiosonde network. Atmos. Chem. Phys. 2015, 15, 7753–7767. [Google Scholar] [CrossRef]
- Whiteman, D.N.; Cadirola, M.; Venable, D.; Calhoun, M.; Miloshevich, L.; Vermeesch, K.; Twigg, L.; Dirisu, A.; Hurst, D.; Hall, E.; et al. Correction technique for Raman water vapor lidar signal-dependent biases: Results from the MOHAVE-2009 campaign. Atmos. Meas. Tech. 2012, 5, 2893–2916. [Google Scholar] [CrossRef]
- Li, C.; Li, Y.; Fu, S.; Jiang, X.; Wang, X.; Li, S.; Cui, C.; Hu, Y.; Cui, W. A New Perspective on the Orographic Effect of the Windward Slope on the Multi-Scale Eastward-Moving Southwest Vortex Systems. Atmos. Res. 2022, 279, 106365. [Google Scholar] [CrossRef]
- Fu, S.M.; Mai, Z.; Sun, J.H.; Li, W.L.; Ding, Y.; Wang, Y.Q. Impacts of Convective Activity over the Tibetan Plateau on Plateau Vortex, Southwest Vortex, and Downstream Precipitation. J. Atmos. Sci. 2019, 76, 3803–3830. [Google Scholar] [CrossRef]
- Zhang, Y.; Sun, J.; Fu, S. Impacts of Diurnal Variation of Mountain-Plain Solenoid Circulations on Precipitation and Vortices East of the Tibetan Plateau during the Mei-Yu Season. Adv. Atmos. Sci. 2014, 31, 139–153. [Google Scholar] [CrossRef]
- Chen, Y.; Li, Y. Convective Characteristics and Formation Conditions in an Extreme Rainstorm on the Eastern Edge of the Tibetan Plateau. Atmosphere 2021, 12, 381. [Google Scholar] [CrossRef]
- Yao, L.; Shen, D.; Sun, X.; Wang, D.; Cao, X.; Wang, J.; Wang, D.; Zhang, C.; Guo, Q. The Beidou Navigation Radiosonde Observation Experiment and Data Evaluation. SSRN Preprint 2025. Available online: https://ssrn.com/abstract=5085235 (accessed on 14 July 2025).
- Rodgers, C.D. Inverse Methods for Atmospheric Sounding: Theory and Practice; World Scientific: Singapore, 2000; Volume 2, ISBN 981022740X. [Google Scholar]
- Xia, P.; Xia, J.; Ye, S.; Xu, C. A New Method for Estimating Tropospheric Zenith Wet-Component Delay of GNSS Signals from Surface Meteorology Data. Remote Sens. 2020, 12, 3497. [Google Scholar] [CrossRef]
- Li, L.; Wu, S.; Zhang, K.; Wang, X.; Li, W.; Shen, Z.; Zhu, D.; He, Q.; Wan, M. A New Zenith Hydrostatic Delay Model for Real-Time Retrievals of GNSS-PWV. Atmos. Meas. Tech. 2021, 14, 6379–6394. [Google Scholar] [CrossRef]
- Huang, Q.; Wang, X.; Li, H.; Zhang, J.; Han, Z.; Liu, D.; Li, Y.; Zhang, H. The Zenith Total Delay Combination of International GNSS Service Repro3 and the Analysis of Its Precision. Remote Sens. 2024, 16, 3885. [Google Scholar] [CrossRef]
- Thundathil, R.; Zus, F.; Dick, G.; Wickert, J. Assimilation of GNSS Zenith Delays and Tropospheric Gradients: A Sensitivity Study Utilizing Sparse and Dense Station Networks. EGUsphere 2025, preprint. [Google Scholar] [CrossRef]
- Cimini, D.; Hocking, J.; De Angelis, F.; Cersosimo, A.; Di Paola, F.; Gallucci, D.; Gentile, S.; Geraldi, E.; Larosa, S.; Nilo, S.; et al. RTTOV-gb v1.0—Updates on Sensors, Absorption Models, Uncertainty, and Availability. Geosci. Model Dev. 2019, 12, 1833–1845. [Google Scholar] [CrossRef]
- Smith, S.; Toumi, R. Measuring Cloud Cover and Brightness Temperature with a Ground-Based Thermal Infrared Camera. J. Appl. Meteor. Climatol. 2008, 47, 683–693. [Google Scholar] [CrossRef]
- Sun, B.; Groisman, P.Y.; Bradley, R.S.; Keimig, F.T. Temporal Changes in the Observed Relationship between Cloud Cover and Surface Air Temperature. J. Clim. 2000, 13, 4341–4357. [Google Scholar] [CrossRef]
- Foken, T. Springer Handbook of Atmospheric Measurements; Springer: Berlin/Heidelberg, Germany, 2021. [Google Scholar]
- Belgiu, M.; Drăguţ, L. Random Forest in Remote Sensing: A Review of Applications and Future Directions. ISPRS J. Photogramm. Remote Sens. 2016, 114, 24–31. [Google Scholar] [CrossRef]
- Peleg, K. Fast Fourier Transform-Based Calibration in Remote Sensing. Int. J. Remote Sens. 1998, 19, 2301–2315. [Google Scholar] [CrossRef]
- Wandinger, U.; Ansmann, A. Experimental Determination of the Lidar Overlap Profile with Raman Lidar. Appl. Opt. 2002, 41, 511–514. [Google Scholar] [CrossRef]
- Wulfmeyer, V.; Senff, C.; Späth, F.; Behrendt, A.; Lange, D.; Banta, R.M.; Brewer, W.A.; Wieser, A.; Turner, D.D. Profiling the molecular destruction rates of temperature and humidity as well as the turbulent kinetic energy dissipation in the convective boundary layer. Atmos. Meas. Tech. 2024, 17, 1175–1196. [Google Scholar] [CrossRef]
- Shao, N.; Wang, Q.; Bu, Z.; Yin, Z.; Dai, Y.; Chen, Y.; Wang, X. China Aerosol Raman Lidar Network (CARLNET)—Part I: Water Vapor Raman Channel Calibration and Quality Control. Remote Sens. 2025, 17, 414. [Google Scholar] [CrossRef]
- Sedano, F.; Kempeneers, P.; Hurtt, G. A Kalman Filter—Based Method to Generate Continuous Time Series of Medium—Resolution NDVI Images. Remote Sens. 2014, 6, 12381–12408. [Google Scholar] [CrossRef]
- Tobin, D.C.; Antonelli, P.B.; Revercomb, H.E.; Dutcher, S.T.; Turner, D.D.; Taylor, J.K.; Knuteson, R.O.; Vinson, K.H. Hyperspectral Data Noise Characterization Using Principal Component Analysis: Application to the Atmospheric Infrared Sounder. J. Appl. Remote Sens. 2007, 1, 013515. [Google Scholar] [CrossRef]
- Lu, Y.; Zhang, F. Toward Ensemble Assimilation of Hyperspectral Satellite Observations with Data Compression and Dimension Reduction Using Principal Component Analysis. Mon. Weather Rev. 2019, 147, 3505–3518. [Google Scholar] [CrossRef]
- Zhang, Q.; Shao, M. Impact of Hyperspectral Infrared Sounding Observation and Principal-Component-Score Assimilation on the Accuracy of High-Impact Weather Prediction. Atmosphere 2023, 14, 580. [Google Scholar] [CrossRef]
- Zhang, Q.; Shao, M. Assimilation of FY-3D and FY-3E Hyperspectral Infrared Atmospheric Sounding Observation and Its Impact on Numerical Weather Prediction during Spring Season over the Continental United States. Atmosphere 2023, 14, 967. [Google Scholar] [CrossRef]
Disclaimer/Publisher’s Note: The statements, opinions and data contained in all publications are solely those of the individual author(s) and contributor(s) and not of MDPI and/or the editor(s). MDPI and/or the editor(s) disclaim responsibility for any injury to people or property resulting from any ideas, methods, instructions or products referred to in the content. |
© 2025 by the authors. Licensee MDPI, Basel, Switzerland. This article is an open access article distributed under the terms and conditions of the Creative Commons Attribution (CC BY) license (https://creativecommons.org/licenses/by/4.0/).