Article

Spatiotemporal Dynamics of Bare Sand Patches in the Mu Us Sandy Land, China

1
Faculty of Geographical Science and Engineering, Henan University, Zhengzhou 450046, China
2
Key Laboratory of Geospatial Technology for the Middle and Lower Yellow River Regions (Henan University), Ministry of Education, Kaifeng 475004, China
3
Institute of Ecological Conservation and Restoration, Chinese Academy of Forestry, Beijing 100091, China
4
Key Laboratory of Desert Ecosystem and Global Change, National Forestry and Grassland Administration, Beijing 100091, China
*
Author to whom correspondence should be addressed.
Remote Sens. 2025, 17(18), 3244; https://doi.org/10.3390/rs17183244
Submission received: 25 July 2025 / Revised: 10 September 2025 / Accepted: 17 September 2025 / Published: 19 September 2025
(This article belongs to the Section Ecological Remote Sensing)

Abstract

Highlights

What are the main findings?
  • Post-2000 bare sand area decreased significantly at 530.08 km2/yr.
  • Ecological restoration initiatives were key determinants of bare sand decline.
What is the implication of the main finding?
  • Developed a comprehensive, efficient, and scalable workflow for accurate extraction and monitoring of bare sand patches.
  • Confirmed that ecological restoration policies significantly accelerated the contraction of bare sand patches, providing strong evidence for policy optimization and scale-up.

Abstract

Bare sand patches are extensively distributed in dryland ecosystems, and their spatiotemporal evolution provides critical insights into regional eco-environmental changes. The Mu Us Sandy Land, a typical dryland region, exemplifies a distinctive mosaic distribution of bare sand and vegetation patches. Based on the Google Earth Engine (GEE) platform and Landsat time-series imagery (1986–2023), this study extracted multi-temporal bare sand patches using the random forest algorithm. We quantified their spatiotemporal dynamics and identified driving mechanisms through integration with natural/socioeconomic datasets. Key findings include the following: (1) The total area of bare sand patches decreased significantly after 2000, with an average annual reduction of 530.08 km2 (p < 0.01), a rate markedly exceeding pre-2000 rates. (2) Before 2000, bare sand patches were widespread across the entire region; however, by 2023, only residual patches persisted in the northwestern regions. (3) The most significant reduction in bare sand patch area is attributable to the shrinkage of giant patches (>10 km2). (4) The spatial distribution of bare sand patches is primarily controlled by a combination of natural factors, including stream, precipitation, topography, and wind regime. (5) The principal drivers of the reduction in bare sand patch area are anthropogenic activities, such as the implementation of ecological restoration projects, advancements in agricultural technology, and transformations in breeding patterns. These findings provide a scientific foundation for desertification control and ecosystem management strategies in drylands.

1. Introduction

Drylands cover approximately 41% of the Earth’s terrestrial area, encompassing extremely arid, arid, semi-arid, and sub-humid zones. These regions support about 38% of the global population and are home to nearly one-third of the world’s biodiversity hotspots, providing habitats for 28% of endangered species [1,2]. Dryland ecosystems are inherently fragile and highly sensitive to climate change, water scarcity, land use/cover changes, and desertification, posing significant threats to food security, human livelihoods, and overall well-being [3]. Vegetation plays a crucial role in mitigating wind erosion in these regions. However, the limited water resources, coupled with the influence of topography, runoff, and wind erosion, create a highly uneven distribution of water and nutrients, which results in a patchy mosaic of vegetation and bare land [4,5,6]. In particular, bare land in coastal dunes, inland sandy areas, and grasslands are mainly composed of bare sand, including blowouts, flat sandy regions, and sand dunes. The causes, dynamic changes, heterogeneity, and inter-relationships between bare sand patches and vegetation patches are ongoing challenges in dryland research.
Extreme weather events, fire, and human or herbivore interference can significantly damage dryland vegetation, especially when thresholds are exceeded [7], resulting in the formation of small bare sand patches. As these patches grow in size, they can reach a critical threshold where wind velocities are sufficient to initiate sand movement, triggering wind erosion. Wind-blown sand activities, coupled with wind erosion and sand burial, adversely affect plant growth. Even in regions with sufficient precipitation, wind-blown sand can inhibit vegetation recovery within bare sand patches. Extended periods without vegetation recovery within bare sand patches can see them enlarging or merging, contributing to the overall expansion of bare land. Nowadays, many desert landscapes are undergoing rapid expansion of bare sand patches, driven largely by overgrazing during drought periods [8].
Significant differences exist between bare sand patches and vegetation patches in terms of plant communities, soil properties, and microclimates [9,10]. Bare sand patches in dryland ecosystems are prone to wind-induced sand movement [11]. Soil nutrients, such as nitrogen, phosphorus, and organic matter, are typically concentrated in finer soil particles [12]. These fine particles are more susceptible to wind erosion, leading to the loss of soil nutrients from bare sand patches [12]. In contrast, vegetation patches play a crucial role in intercepting surface runoff and erosion products. They also exhibit superior soil moisture retention, growth, and permeability compared to bare sand patches [13]. Vegetation patches not only enhance litter accumulation but also reduce the rate of litter removal [14]. Additionally, patch type and successional stages can influence soil microbial diversity [15].
The development of remote sensing technology has enabled more precise monitoring and extraction of bare sand patches. Traditional methods for identifying these bare sand patches include visual interpretation, natural breakpoint classification, unsupervised classification [16], supervised classification [17], and the normalized sand index (NSI) [18]. However, image spatial resolution can significantly affect the accuracy of bare sand patches extraction results [19]. With the advancement of cloud computing, Google introduced the Google Earth Engine (GEE) platform in 2010, enabling the analysis of planetary and stellar geospatial data and offering essential image data resources [20]. The platform integrates a variety of machine learning algorithms, including random forest, Support Vector Machines, and Gradient Tree Boosting. Among these, the random forest algorithm has demonstrated superior performance in extracting information on bare sand patches compared to other methods [21,22]. The GEE platform thus enables large-scale, long-term monitoring and mapping of bare sand patches with unprecedented speed and efficiency.
The Mu Us Sandy Land, located in northern China, is a major dust source characterized by a highly vulnerable ecosystem, intensive human activities, and a distinct mosaic of bare sand and vegetation patches. Over recent decades, large-scale ecological restoration projects, such as the Three-North Shelterbelt Program, the Natural Forest Resources Protection, the Grain for Green Program, and the Beijing-Tianjin Sandstorm Source Control Project, have led to remarkable vegetation recovery, a substantial decrease in bare sand patches, and the progressive restoration of ecosystem functions. While there are extensive studies on desertification and sandy land monitoring in the Mu Us Sandy Land, studies focusing on the dynamic changes in bare sand patches remain limited. These patches are among the most direct and significant indicators of regional ecological environment changes. Therefore, this research employed the Google Earth Engine (GEE) platform, Landsat imagery, and the random forest classifier to monitor bare sand patches in the Mu Us Sandy Land. The analysis focused on the spatial distribution and temporal evolution of these patches and examined the influences of both natural and anthropogenic factors. The findings offer valuable scientific guidance for regional desertification mitigation and ecosystem management strategies for the region.

2. Materials and Methods

2.1. Study Area

The Mu Us Sandy Land (37°27.5′–39°22.5′N, 107°20′–111°30′E), covering approximately 39,600 km2, is one of the four largest sandy regions in China (Figure 1). Situated on the alluvial plain between the Ordos Plateau and the Loess Plateau, the area exhibits a varied topography with elevations spanning from 909 to 1610 m, gradually descending from northwest to southeast. Located at the transition zone between arid and semi-arid regions and semi-humid areas, the Mu Us Sandy Land experiences average annual temperatures ranging from 6.0 °C to 9.0 °C, with an average wind speed of 2.00–3.60 m s−1, and annual precipitation varying between 150 and 500 mm, decreasing from southeast to northwest [23]. Both surface water and groundwater are relatively abundant in the region, which is traversed by several rivers, including the Tuwei, Yuxi, and Wuding Rivers in the eastern part of the sandy land. The dominant soil types in the area include entisols and aridisols. Entisols consist mainly of aeolian sandy soil and alluvial soil, while aridisols are predominantly chestnut-calcareous and brown-calcareous soils [24]. Vegetation types in the region are diverse, encompassing grassland, desert, and sandy vegetation. The dominant species, Artemisia ordosica, plays a crucial role in the fixation of bare sand patches and in mitigating soil erosion in the region.

2.2. Data Source and Preprocessing

This study utilized Landsat satellite data to analyze the spatiotemporal changes in bare sand patches. Compared to other satellite platforms (such as Sentinel-2 or commercial high-resolution satellites), the Landsat satellite offers long-term data continuity, suitable spatial resolution, and open data access, making it the optimal choice for conducting regional-scale long-term analysis. Images from Landsat 5 TM and Landsat 8 OLI, provided by the GEE platform, were selected for this analysis. Specifically, the “LANDSAT/LT05/C02/T1_L2” and “LANDSAT/LC08/C02/T1_L2” datasets were used, both of which are geometrically and atmospherically corrected, with a spatial resolution of 30 m. The study period, spanning from 1986 to 2023, was divided into 9 distinct intervals, each corresponding to a 5-year period, to examine the spatiotemporal changes in bare sand patches. Due to data quality issues in some years, adjacent years were used as replacements, namely, Landsat-5 images from 1986, 1991, 1996, 2000, 2005, and 2010, and Landsat-8 images from 2015, 2020, and 2023. To enhance the accuracy of bare sand extraction, data from the vegetation growth season, spanning June to September, were selected. The “QA” quality control band was applied to automatically mask clouds, snow, and cloud shadows. The median synthesis method was then applied to synthesize the data from June to September for each year, ensuring high-quality cloud-free composites [25]. The vector boundaries of the study area were uploaded to the GEE platform, enabling the clipping of imagery to the study region and the acquisition of cloud-free composites for each of the nine time periods.
The dynamics of bare sand patches are affected by various natural and anthropogenic factors. According to previous studies [26,27], the following factors were selected for analysis: temperature, precipitation, potential evapotranspiration, wind speed, rivers, topography, afforestation area, grain crop sown area, and large livestock inventory. Temperature, precipitation, and potential evapotranspiration data were obtained from China’s 1 km resolution monthly datasets of mean temperature, precipitation, and potential evapotranspiration, available from the National Tibetan Plateau Scientific Data Center [28]. Wind speed data were obtained from the ERA5-Land, the fifth-generation surface reanalysis dataset from the European Centre for Medium-Range Weather Forecasts (ECMWF), accessible via the GEE platform. River data were extracted from OpenStreetMap, a widely used and reliable open-source mapping platform. Topographic data were derived from the Space Shuttle Radar Terrain Mission (SRTM V3) digital elevation model (DEM), provided by NASA’s Jet Propulsion Laboratory (JPL) on the GEE platform, with a resolution of 30 m. Information on afforestation area, grain crop sown area, and large livestock inventory for the period 1986–2023 was obtained from the Statistical Yearbooks of Yulin and Ordos.

2.3. Sample Data

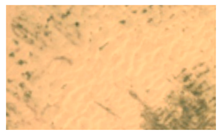
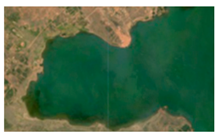
For the purposes of this study, land use/land cover (LULC) types in the Mu Us Sandy Land were divided into two main categories: bare sand and non-bare sand. The non-bare sand category includes water, forest and grassland, built-up, cropland, and other land cover types. High-resolution imagery and visual interpretation were employed to analyze the color, shape, texture, and other distinguishing characteristics of each category. Based on these analyses, interpretation markers for Landsat TM/OLI images were established (Table 1). Samples of bare sand and non-bare sand for each year were collected through visual interpretation methods from the 9 cloud-free images available on the GEE platform. The specific sample data for each period are shown in Table 2. Sample selection prioritized spatial uniformity, while also prioritizing areas with high concentrations of bare sand, such as riparian zones and wind-eroded regions, to capture the spatial heterogeneity of residual bare sand patches effectively. The number of samples in each category was dynamically adjusted over time to accurately reflect the evolving land cover conditions. To assess model accuracy, 70% of the sample points were randomly assigned to the training set, while the remaining 30% were designated to the test set.

2.4. Methods

2.4.1. Feature Dataset Construction

The feature dataset for extracting bare sand was constructed using the GEE platform. Six spectral bands were selected, including blue, green, red, near-infrared, and two shortwave infrared bands. Additionally, seven spectral indices were calculated to enhance the classification process. These indices include the normalized difference vegetation index (NDVI) [29], enhanced vegetation index (EVI) [30], ratio vegetation index (RVI) [31], modified soil adjusted vegetation index (MSAVI) [32], modified normalized difference water index (MNDWI) [33], normalized sand index (NSI) [18], and normalized difference built-up index (NDBI) [34]. The specific formulas for each index are as follows:
NDVI   =   ρ nir ρ red ρ nir   +   ρ red
EVI = 2.5   ×   ρ nir ρ red ρ nir + 6   ×   ρ red 7.5   ×   ρ blue + 1
RVI = ρ nir ρ red
MSAVI = 2   ×   ρ nir + 1   - 2 × ρ nir 2 8   ×   ρ nir ρ red 2
MNDWI = ρ green ρ swir 1 ρ green + ρ swir 1
NSI = ρ green ρ red log ρ swir 1
NDBI = ρ swir 1 ρ nir ρ swir 1 + ρ nir
where, ρ blue , ρ green , ρ red , ρ nir , and ρ swir 1 refer to the blue band, green band, red band, near-infrared band, and first shortwave infrared band in the Landsat images, respectively.
To improve the extraction of bare sand patches, both texture and topographic features were incorporated into the datasets. Texture features, which capture spatial patterns independent of color or brightness, are particularly useful for distinguishing areas with uniform appearance. The gray-level co-occurrence matrix (GLCM), a widely used statistical method for quantifying texture in digital images, enhances land cover classification by reducing errors in areas where objects exhibit similar spectral characteristics [35]. The GEE platform provides the functionality to calculate GLCM texture features efficiently. In the feature extraction process, a 3 × 3 fine-scale sliding window was applied, and the GEE platform’s default multi-directional settings (i.e., statistical comprehensive results of the four directions of 0°, 45°, 90°, and 135°) were used to enhance the rotation invariance of the texture features. To avoid information redundancy and excessive computational complexity, not all GLCM texture features were employed for classification. Drawing on existing research frameworks [36], this study selected four representative and informative texture features, including contrast, entropy, correlation, and dissimilarity, based on their ability to distinguish key land cover types. Topographic features play a crucial role in the spatial heterogeneity of dryland ecosystems [37]. Consequently, elevation and slope data extracted from the Shuttle Radar Topography Mission (SRTM V3) DEM model were included as the fundamental topographic features for this study.

2.4.2. Random Forest

Random forest [38] is a classical machine learning algorithm composed of multiple decision trees. Multiple subsets are randomly generated in the original training set, decision trees are built for each subset, and then all the decision trees are combined to form a random forest. The random forest algorithm integrates random selection of both features and samples, providing strong generalizability and high computational efficiency. These characteristics enable random forest to handle heterogeneous datasets effectively, making it extensively suitable for multidimensional classification tasks [39,40]. In the GEE platform, the random forest classifier can be applied directly. Two important parameters influence the classifier’s performance: the number of trees and the bag fraction. To optimize model accuracy, different values for these parameters were tested, with the highest overall accuracy achieved when the number of trees was set to 150 and the bag fraction to 0.8. Consequently, these values—150 trees and a bag fraction of 0.8—were selected for model training. Additionally, the constructed feature dataset for extracting bare sand was also utilized as the input for the classifier to perform model training and classification.

2.4.3. Accuracy Assessment

To evaluate the classification performance of the adopted model, a confusion matrix was constructed by comparing the predicted categories with the labeled categories of the validation samples. In this study, several accuracy indices derived from the confusion matrix were used to quantitatively evaluate the classification results. These include overall accuracy (OA), kappa coefficient (Kappa), producer accuracy (PA), and consumer accuracy (CA) [41]. The specific formulas for these indices are as follows:
O A   =   i = 1 k N i i N
Kappa = N i = 1 k N i i i = 1 k N i + N + i N 2 i = 1 k N i + N + i
PA i = N i i N + i
CA i   = N i i N i +
where N is the total number of samples, k is the total number of categories, Nii is the number of correctly categorized samples, and Ni+ and N+i are the actual and predicted sample counts for category i, respectively.

2.4.4. Dynamic Analysis of Bare Sand Patches

The change indicator [42] was used to analyze the extent and annual rate of bare sand patches from 1986 to 2023. The specific formula utilized to calculate the dynamic degree of change in bare sand patches (K) is as follows:
K   =   U b U a U a   ×   1 T   ×   100 %
where K is the dynamic degree of change in bare sand patches, Ua is the area of bare sand patches at the beginning of the study period, Ub is the area of bare sand patches at the end of the study period, and T is the length of the study period.
Bare sand patches were further categorized into hierarchical classes, and we evaluated patches of different sizes, morphologies, and ecological functions, thus providing insights into potential strategies for ecological restoration. According to hierarchy theory, complex systems can be understood by dividing them into discrete hierarchical levels. This hierarchical approach allows for a simplified understanding and prediction of system structure, function, and behavior [43]. In this study, the extracted bare sand patches were categorized into five classes in terms of their area because they exhibit different characteristics at various scales. The classification includes micro patches (<0.01 km2), small patches (0.01–0.1 km2), medium patches (0.1–1 km2), large patches (1–10 km2), and giant patches (>10 km2).

3. Results

3.1. Accuracy Assessment of Bare Sand Patch Extraction

Based on the training sample data, the random forest classifier was applied to train and classify the images into two categories: bare sand and non-bare sand. The accuracy of the extraction was then evaluated by calculating the confusion matrix for the validation dataset. The classification results for the nine time periods from 1986 to 2023 were statistically analyzed, including overall accuracy, kappa coefficient, producer accuracy, and consumer accuracy (Table 3). The results showed that the overall accuracy and kappa coefficient for the nine periods are consistently ≥ 0.98 and 0.97, respectively. The differences between categories within each period were minimal, and all categories exhibited high classification accuracy, with both producer accuracy and consumer accuracy ≥ 0.97. These findings demonstrated that the method displayed strong robustness, high mapping quality, and was well-suited for subsequent experiments and analysis.

3.2. Temporal Variation Characteristics of Bare Sand in the Mu Us Sandy Land

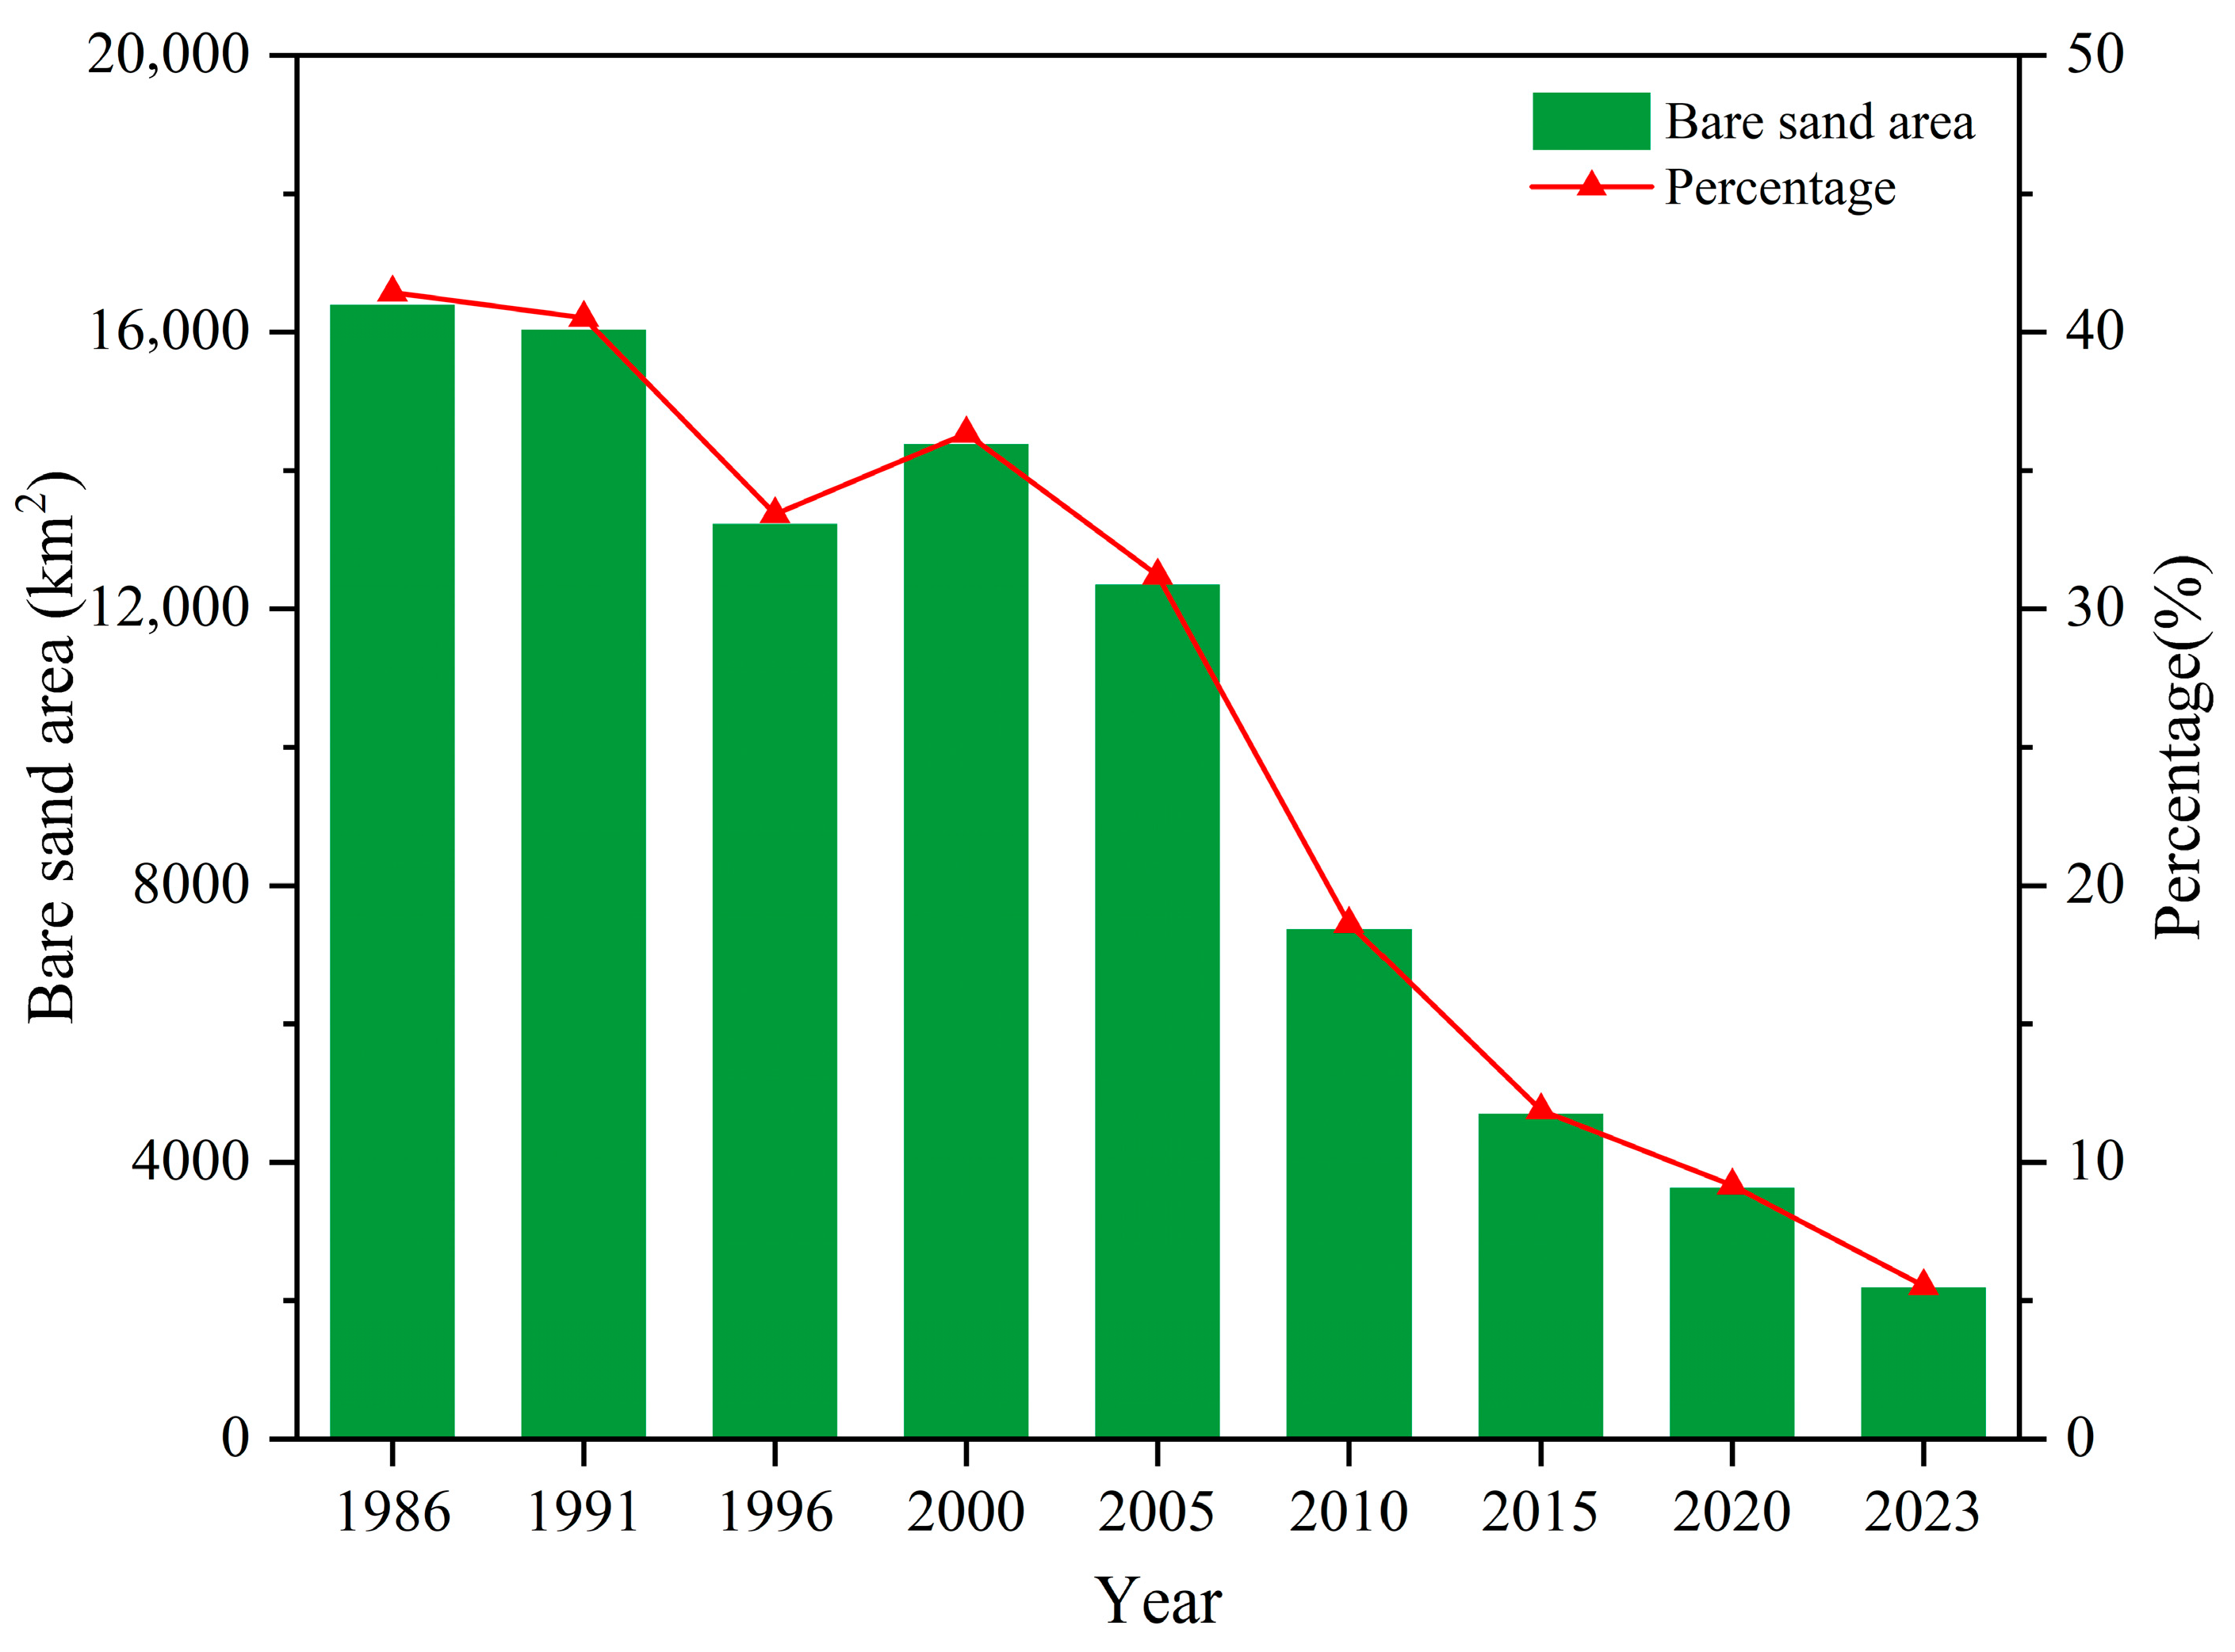
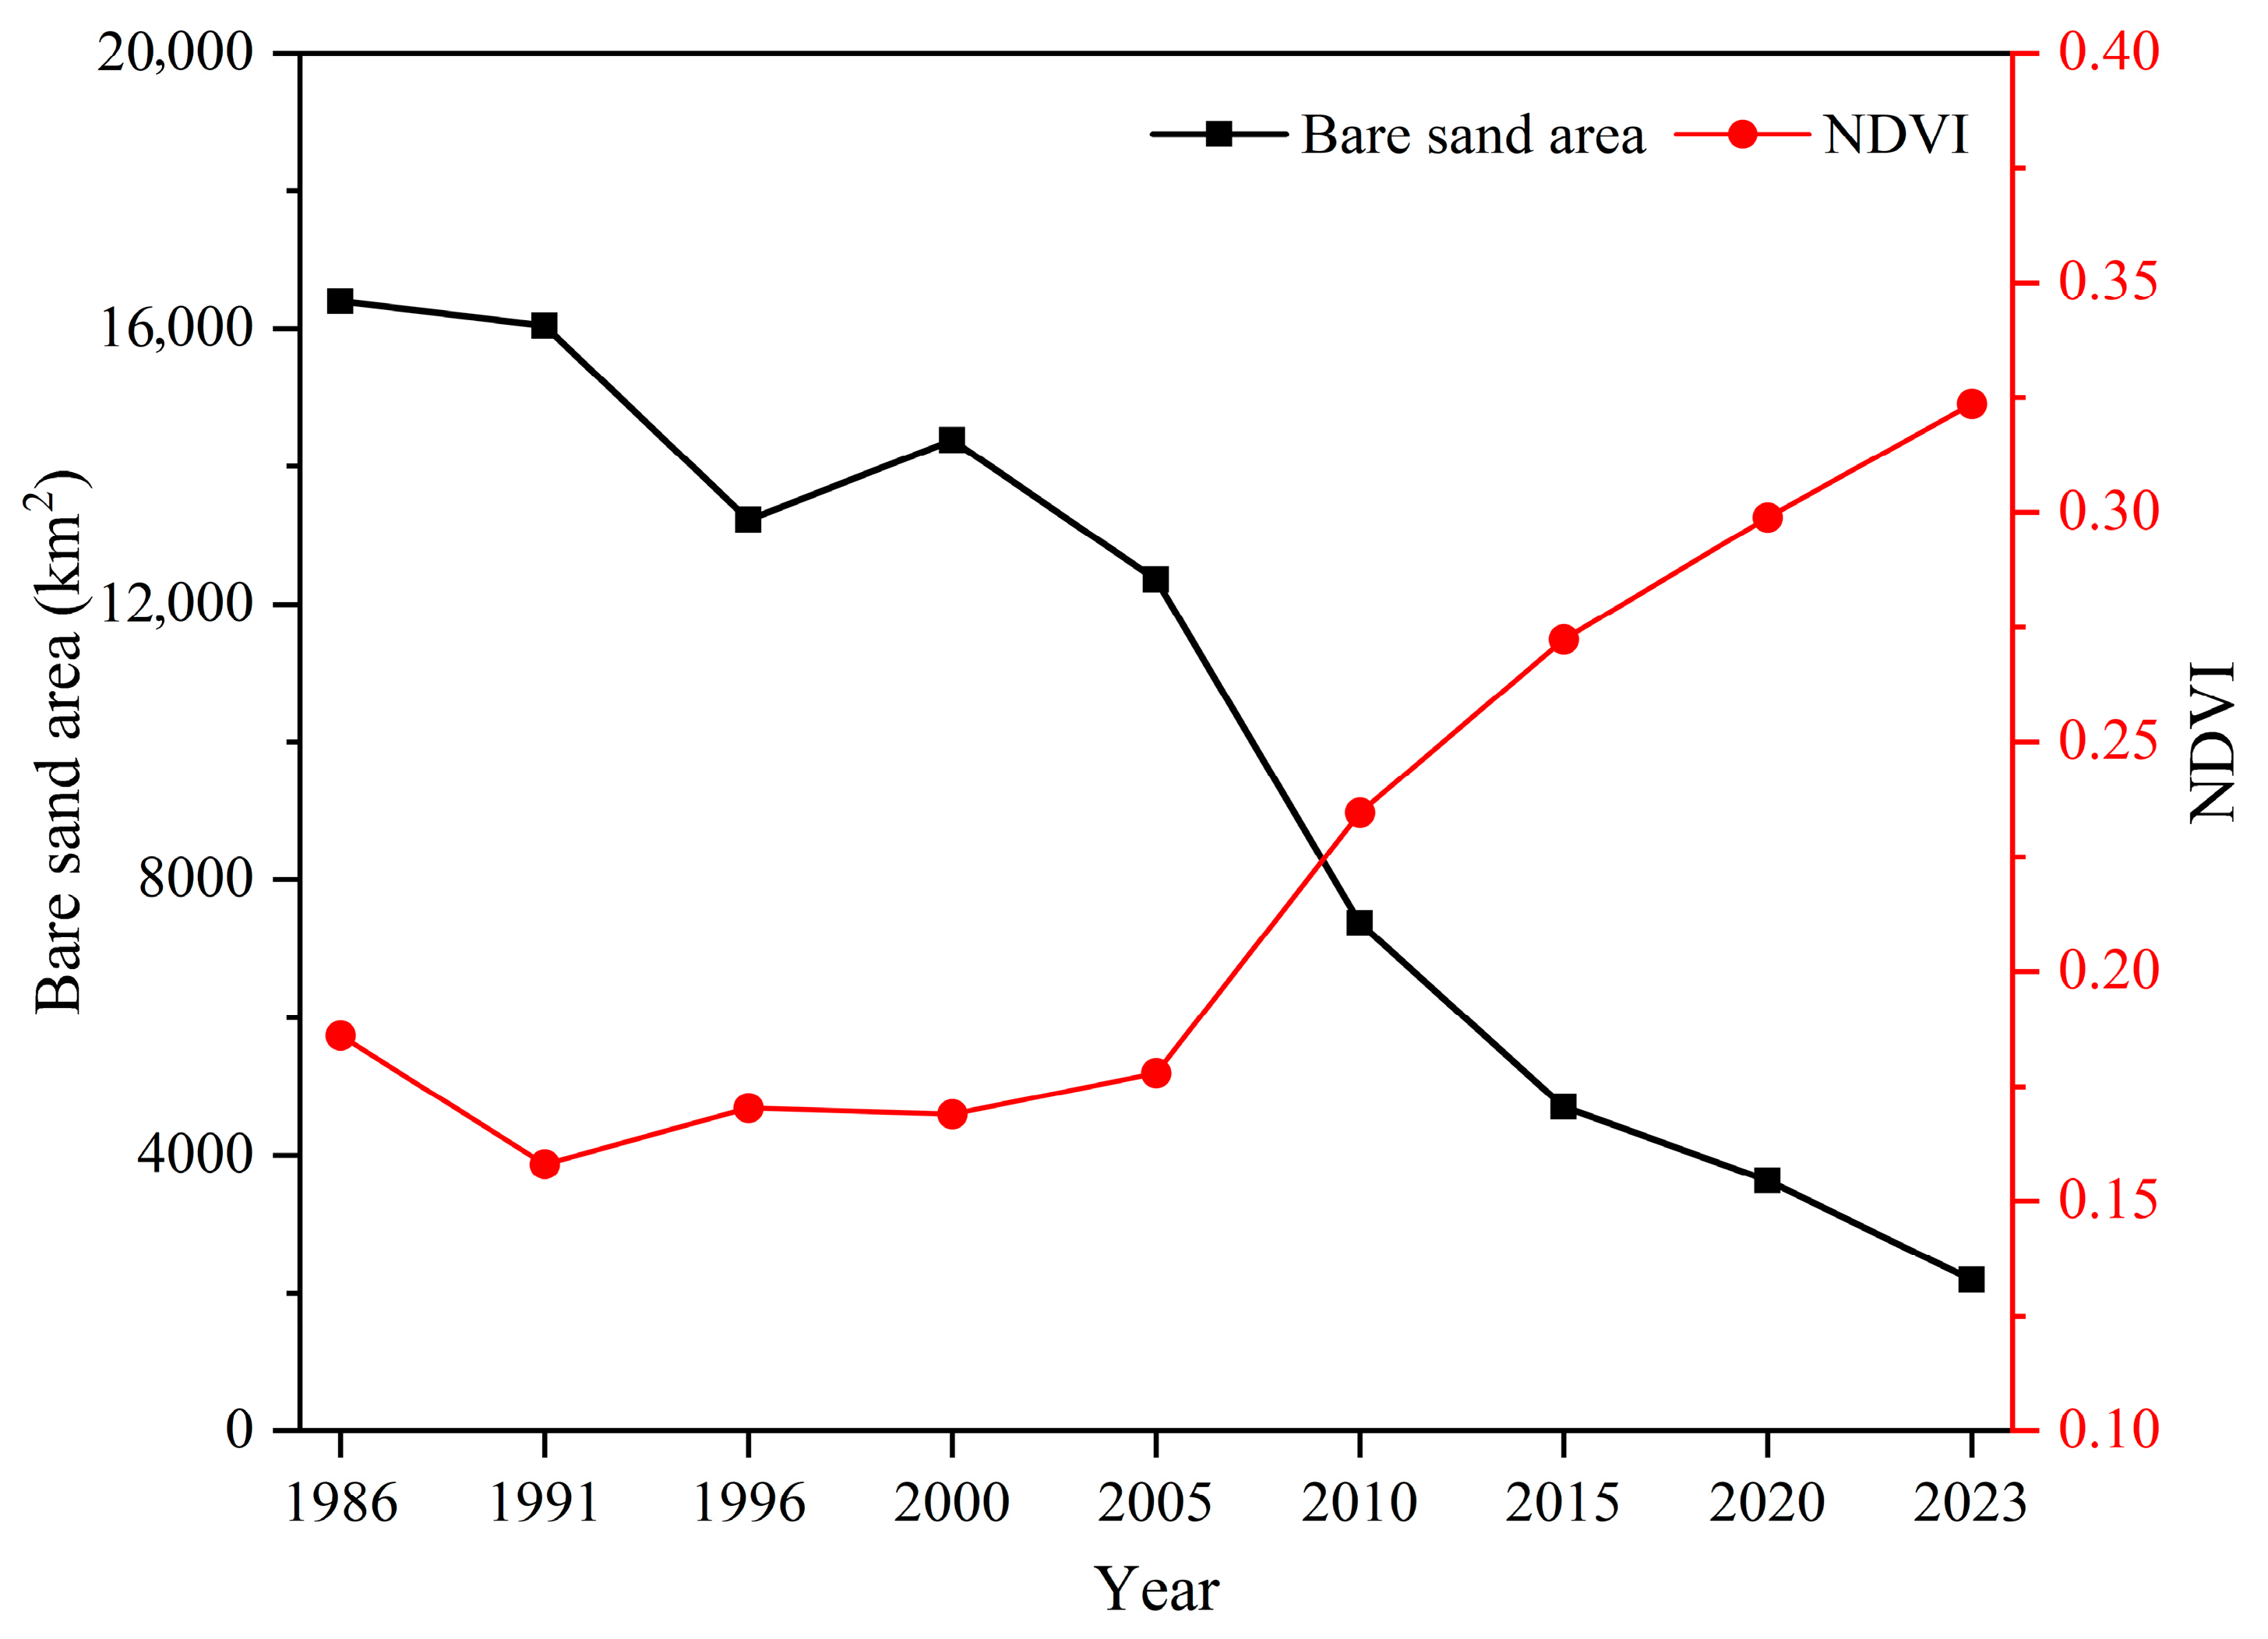
Using the GEE platform, bare sand patches in the Mu Us Sandy Land were extracted from Landsat imagery using the random forest classifier for nine periods spanning from 1986 to 2023. The temporal changes in the areas of bare sand patches in the Mu Us Sandy Land are shown in Figure 2. In 1986, the area of bare sand was at its peak, measuring 16,397.20 km2, which accounted for 41.43% of the total area of the region. By 2023, the bare sand area had decreased significantly to 2190.41 km2, accounting for 5.53% of the total area. Over the period from 1986 to 2023, the overall trend of bare sand patches in the Mu Us Sandy Land was a marked reduction. A slight increase in bare sand areas was observed in 2000, with an increase of 1156.69 km2 (an 8.75% rise) compared to 1996. However, following 2000, the bare sand patch area decreased at an average rate of 530.08 km2 per year, with the rate of decrease accelerating significantly post-2000 compared to the pre-2000 period.

3.3. Spatial Distribution Characteristics of Bare Sand in the Mu Us Sandy Land

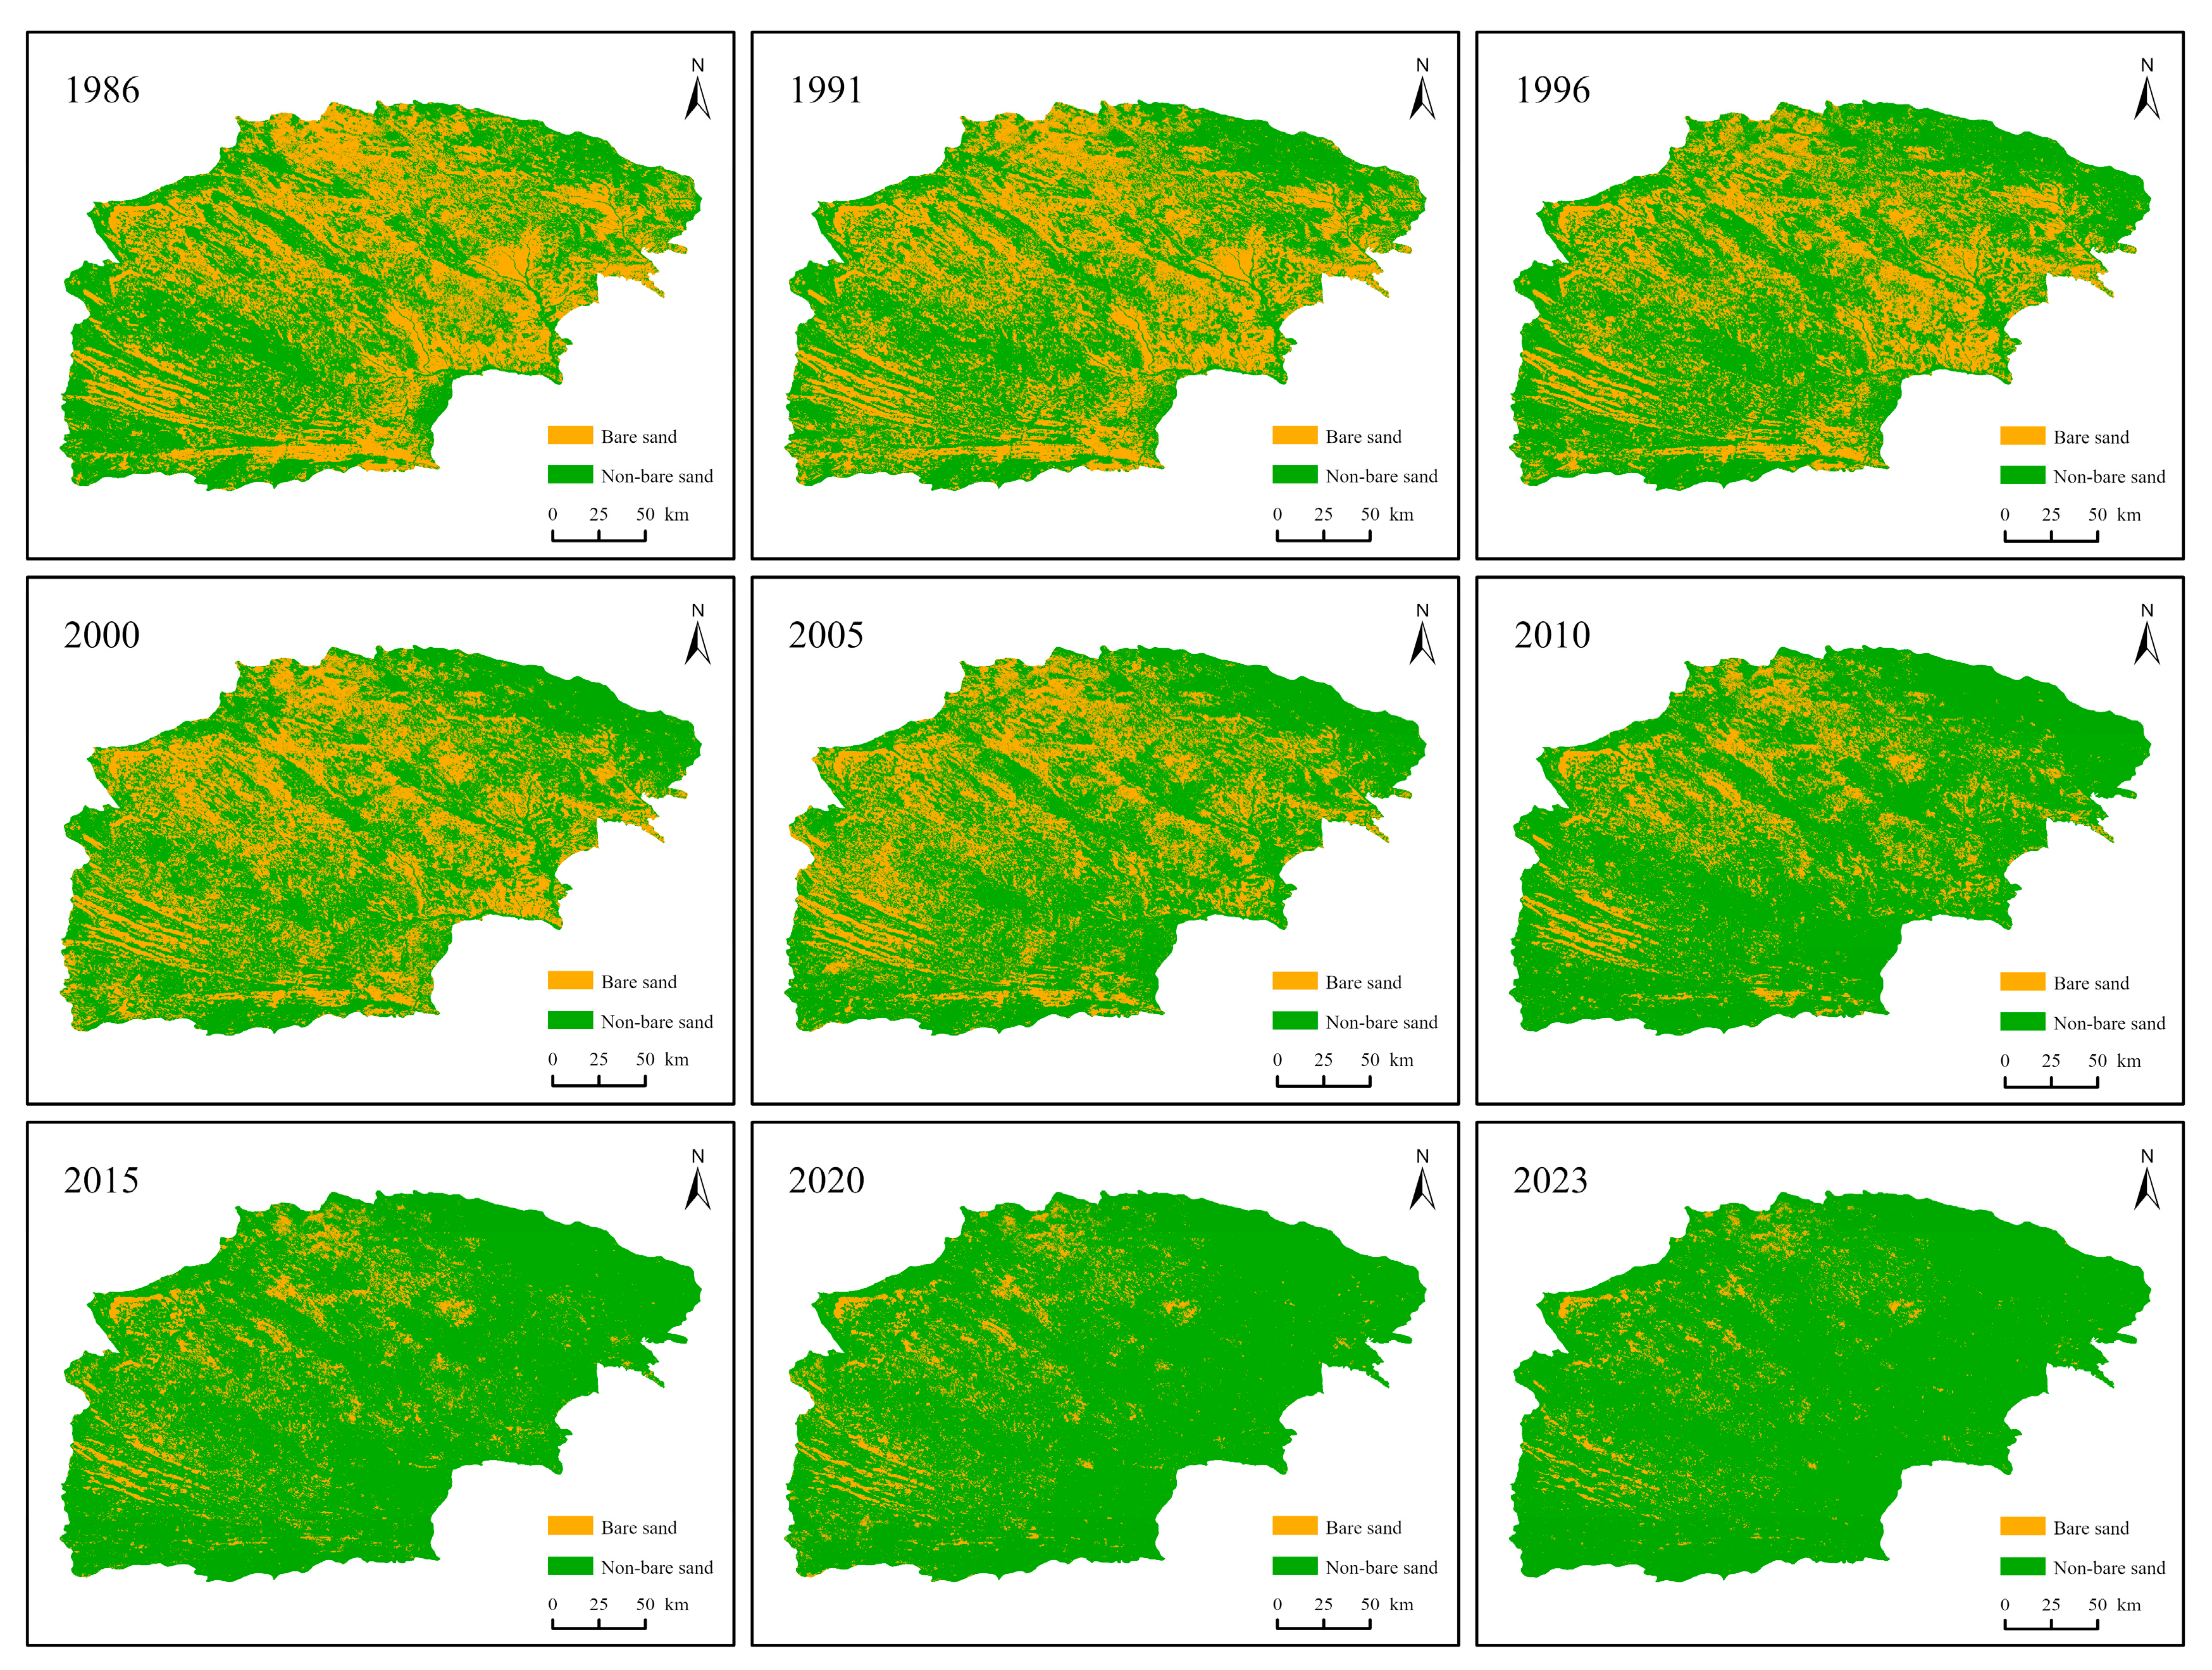
The visualization of classification results across different time periods enables an intuitive analysis of the spatial distribution of bare sand in the Mu Us Sandy Land (Figure 3). Before 2000, bare sand patches were widespread throughout the Mu Us Sandy Land, covering a large area. However, after 2000, the area of bare sand patches gradually decreased across the entire region. By 2023, bare sand patches were predominantly confined to the northwestern part of the Mu Us Sandy Land, appearing only sporadically throughout the region.

3.4. Dynamic Changes in Bare Sand Patches by Area Class

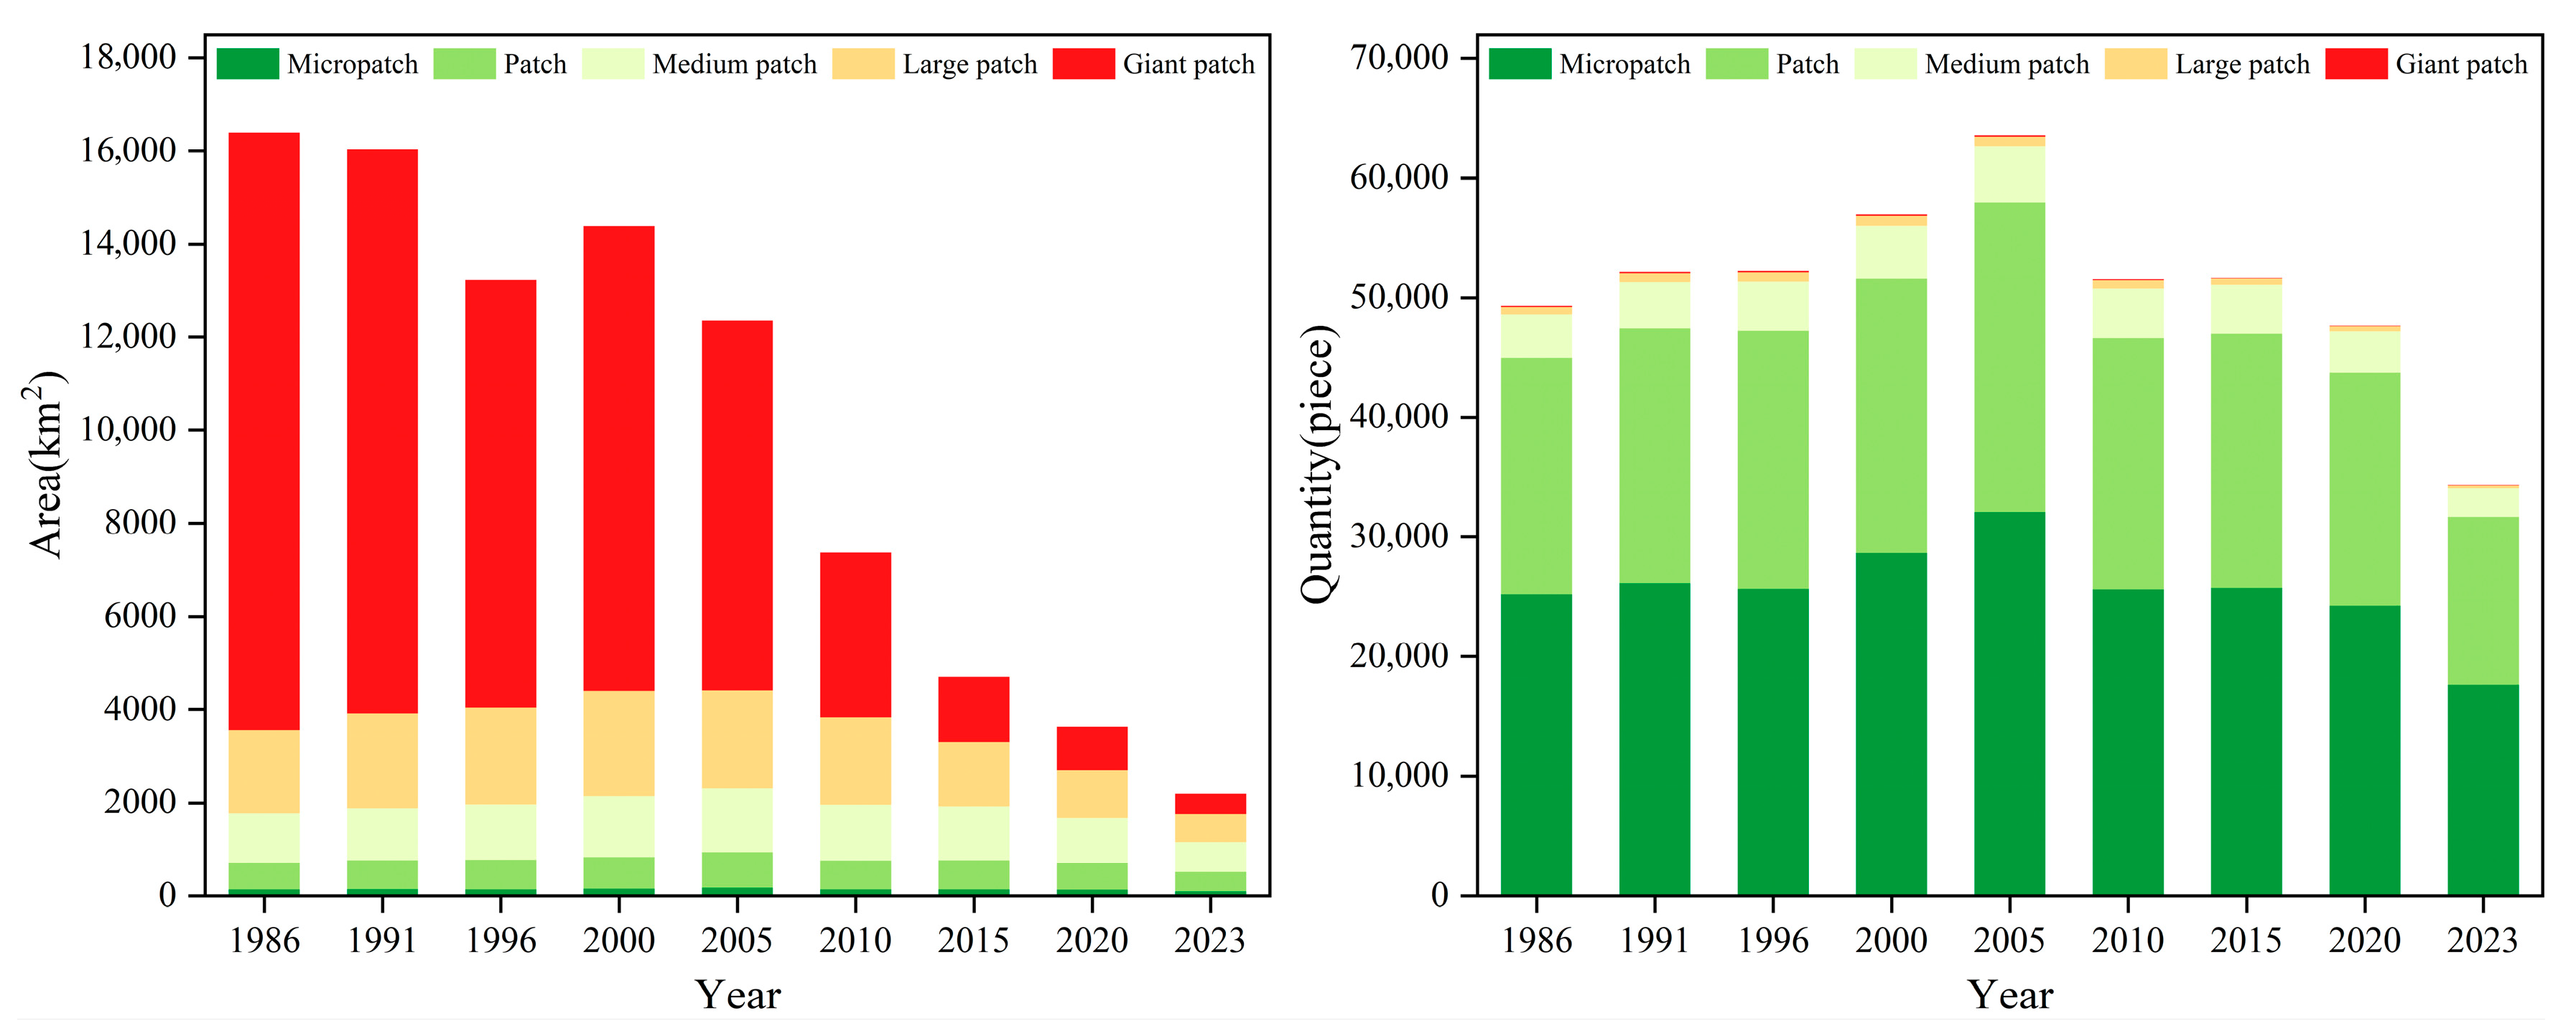
Table 4 and Figure 4 show the changes in both the area and quantity of bare sand patches across different size classes over the nine periods in the Mu Us Sandy Land. As the area of bare sand patches increases, the number of bare sand patches within that size class decreases. The temporal change characteristics of bare sand patches across different size classes exhibited significant variations. In general, the area and number of micro, small, medium, and large bare sand patches followed a pattern of initial increase followed by a decrease over the period from 1986 to 2023. The area of giant patches, however, showed a general trend of continuous decrease, which was roughly the same as that of the total area of bare sand. Meanwhile, the number of giant patches initially increased before declining continuously.
Specifically, the number of micro patches decreased from 25,168 in 1986 to 17,631 in 2023, with a corresponding area reduction of 39.78 km2. The number of small patches decreased from 19,807 to 14,038, with an area reduction of 167 km2. The number of medium patches decreased from 3608 to 2374, with an area reduction of 407.34 km2. The number of large patches decreased from 642 to 245, with an area reduction of 1192.28 km2. The number of giant patches decreased from 99 to 25, with a substantial area reduction of 12,400.39 km2. The decrease in the area of giant patches is the primary factor contributing to the overall reduction in bare sand area in the Mu Us Sandy Land.

4. Discussion

4.1. Factors Affecting the Spatial Distribution of Bare Sand Patches

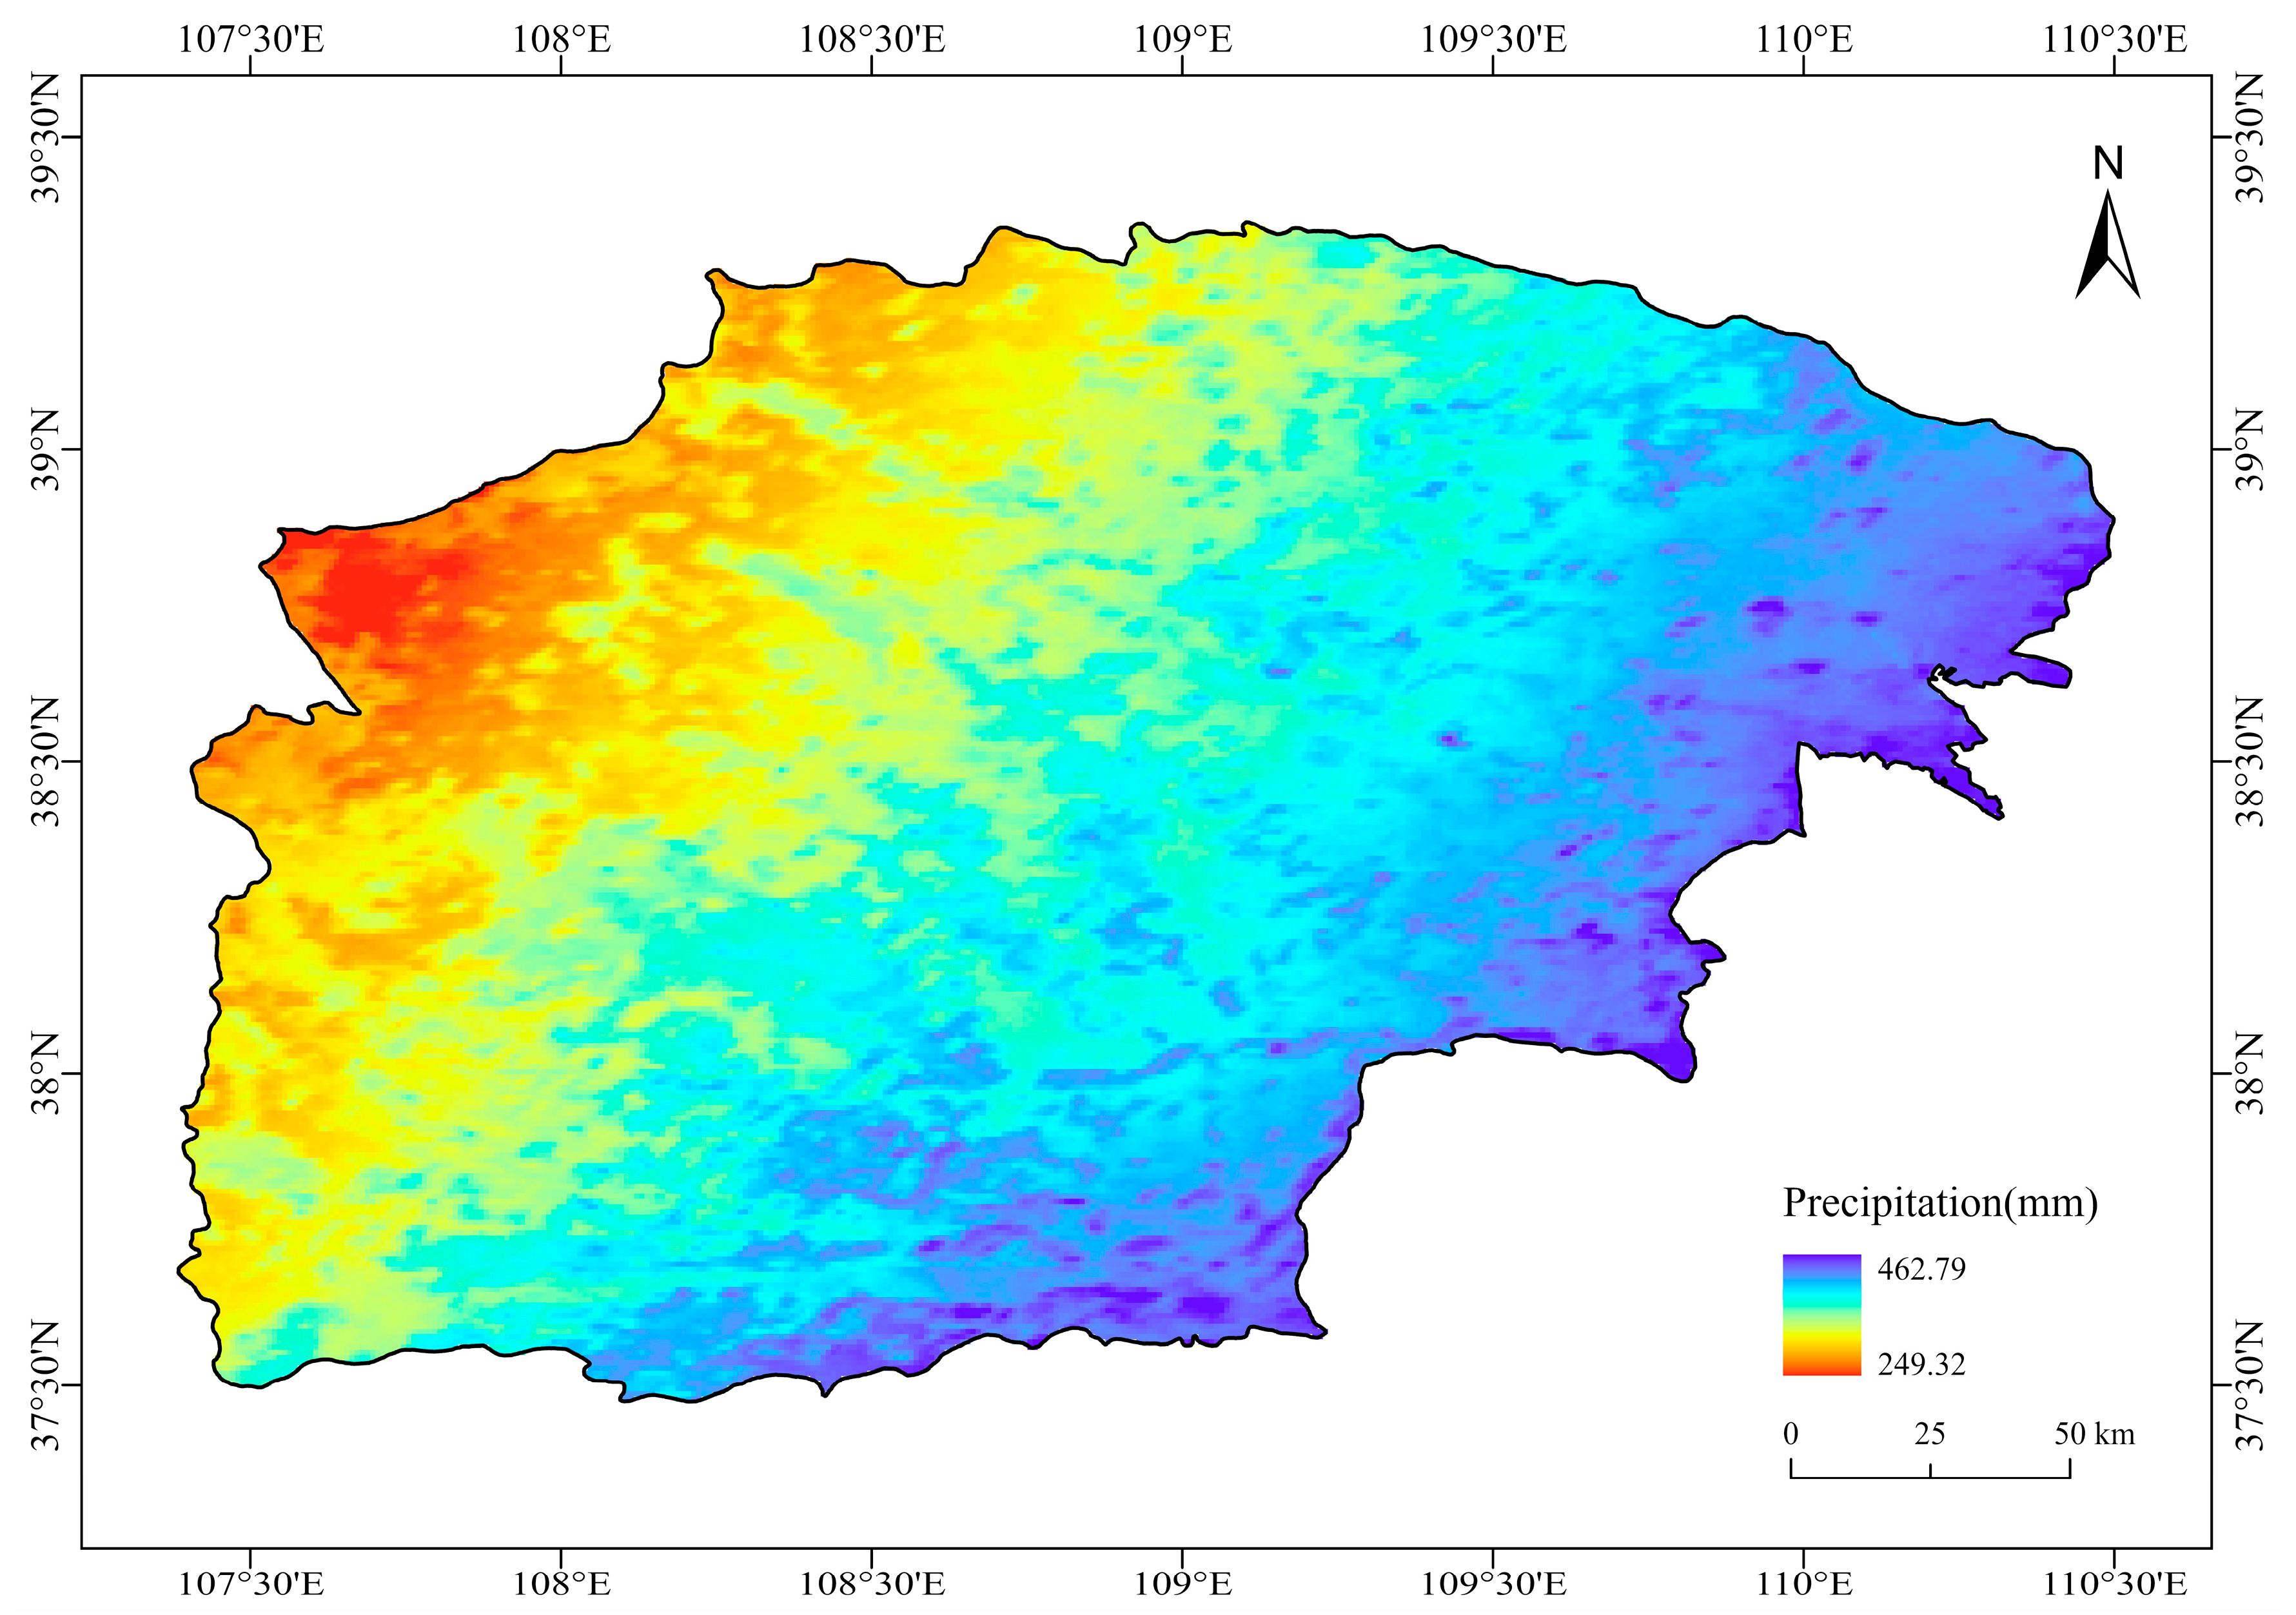
Stream and aeolian processes are important external factors affecting the landscape dynamics in arid and semi-arid regions [44]. In particular, wind direction plays a crucial role in determining the expansion direction of bare sand patches. The predominant wind direction in the Mu Us Sandy Land is from the northwest [45]. Consequently, the long axis of bare sand patches is generally consistent with this dominant wind direction, exhibiting a “northwest-southeast” orientation. This pattern is most pronounced in the southwestern part of the Mu Us Sandy Land. The region’s rivers are mainly concentrated in the southeastern region, which is characterized by lower terrain. In contrast, the northwest is significantly higher in elevation and contains only a few lakes (Figure 1). The average annual precipitation in the Mu Us Sandy Land shows considerable spatial variation (Figure 5), with precipitation generally higher in the southeast and lower in the northwest. This water resource distribution pattern plays a crucial role in shaping vegetation cover and the spatial distribution of bare sand patches. The northwest region, with its limited precipitation, poor soil moisture, and harsh vegetation growth conditions, is particularly vulnerable to the rapid expansion of bare sand patches. The lack of significant precipitation and limited water resources in this area hinder vegetation establishment and ecosystem resilience, making it challenging to control desertification through human intervention. Conversely, the southeast region, which receives more precipitation and has more streams, benefits from better water availability and conditions conducive to vegetation growth. This region exhibits higher vegetation coverage, strong ecosystem self-repair capacity, and more effective artificial management, resulting in the gradual stabilization and eventual disappearance of bare sand patches. In summary, the spatial distribution pattern of bare sand patches in the Mu Us Sandy Land is influenced by a combination of factors, including stream, precipitation, topography, and wind regime.

4.2. Factors Affecting the Temporal Variation of Bare Sand Patches

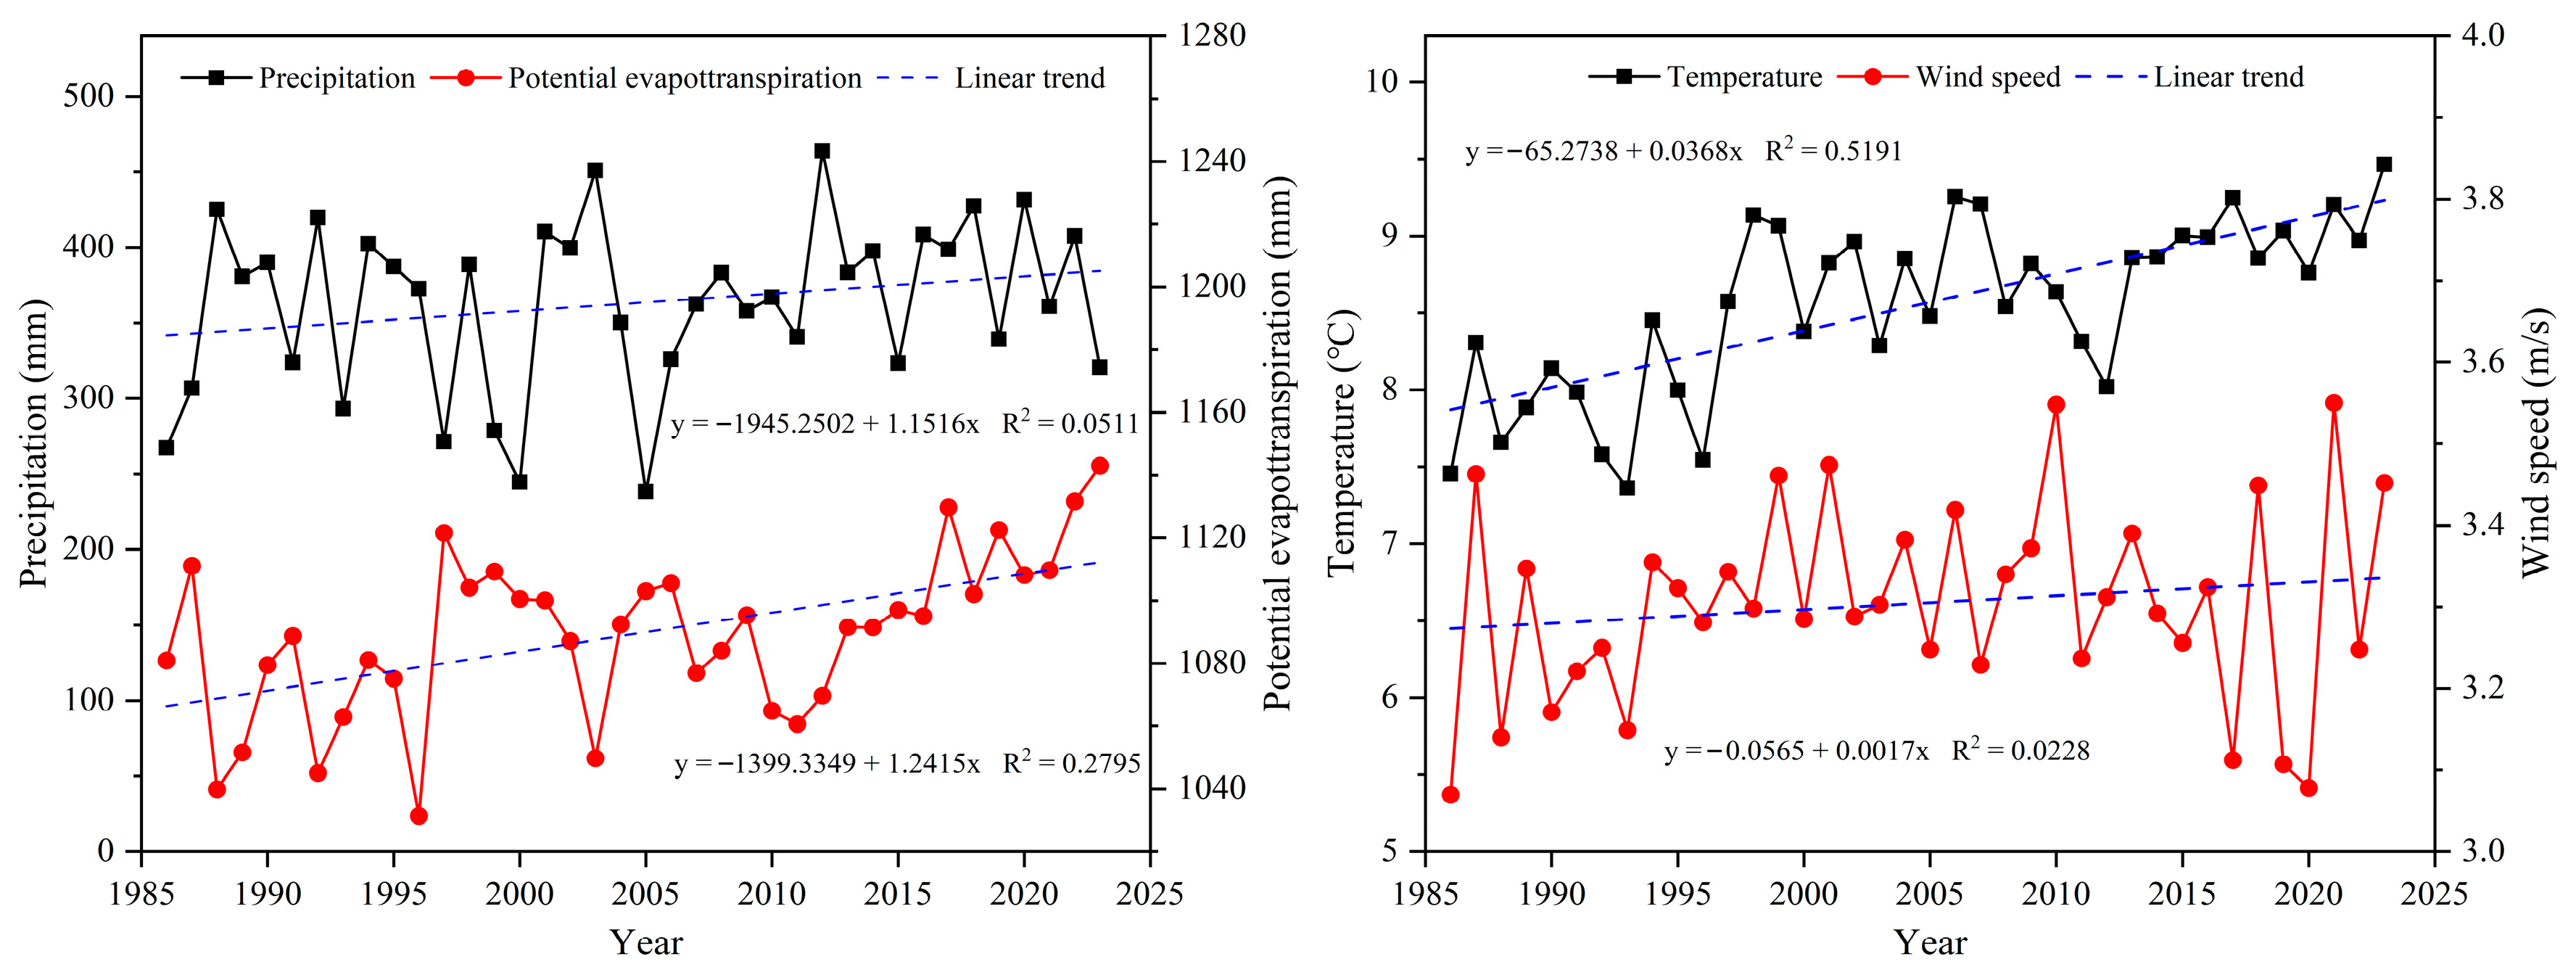
In the Mu Us Sandy Land, the area of bare sand patches exhibited a significantly inverse trend relative to the average NDVI values across the entire study area (Figure 6). This indicates that any factors influencing vegetation growth will also affect the evolution of bare sand patches. A large number of previous studies have widely acknowledged that climatic factors, particularly temperature and precipitation, are key determinants of vegetation growth [46,47,48]. However, in the current context of the Mu Us Sandy Land, climate factors are not the dominant drivers of the observed trends in the evolution of bare sand patches. Between 1986 and 2023, precipitation in the Mu Us Sandy Land ranged from 238.16 mm to 463.88 mm, with notable fluctuations but only a slight upward trend (Figure 7). In contrast, temperature and evapotranspiration displayed more obvious upward trends. Specifically, evapotranspiration values increased from 1031.30 mm to 1143.04 mm during this period. The increase in precipitation is far less than that in evapotranspiration, which was insufficient to substantially enhance soil moisture conditions or promote significant vegetation growth. Although rising temperatures can promote vegetation growth [49], the warming effect alone has not been sufficient to counterbalance the other challenges in the region. Moderate temperature increases may extend the growing season and potentially boost vegetation productivity, which could, in turn, reduce the area of bare sand patches. Wind speed in the Mu Us Sandy Land has remained relatively constant and has not reversed the trends observed in bare sand patches. However, the period from 1996 to 2000 stands out, as precipitation sharply declined from 372.68 mm to 244.49 mm, while potential evapotranspiration increased from 1031.30 mm to 1100.50 mm (Figure 7), indicating a severe drought event. These extreme climatic conditions severely suppressed vegetation growth, leading to a substantial decline in surface vegetation cover. Although the Grain for Green program began around 2000, afforestation efforts did not show significant increases between 1996 and 2000. During this period, the ecological restoration projects were still in their early stages, and their sand fixation effects had not yet materialized. Consequently, the expansion of bare sand patches during this period can primarily be attributed to drought-induced vegetation degradation and surface activation.
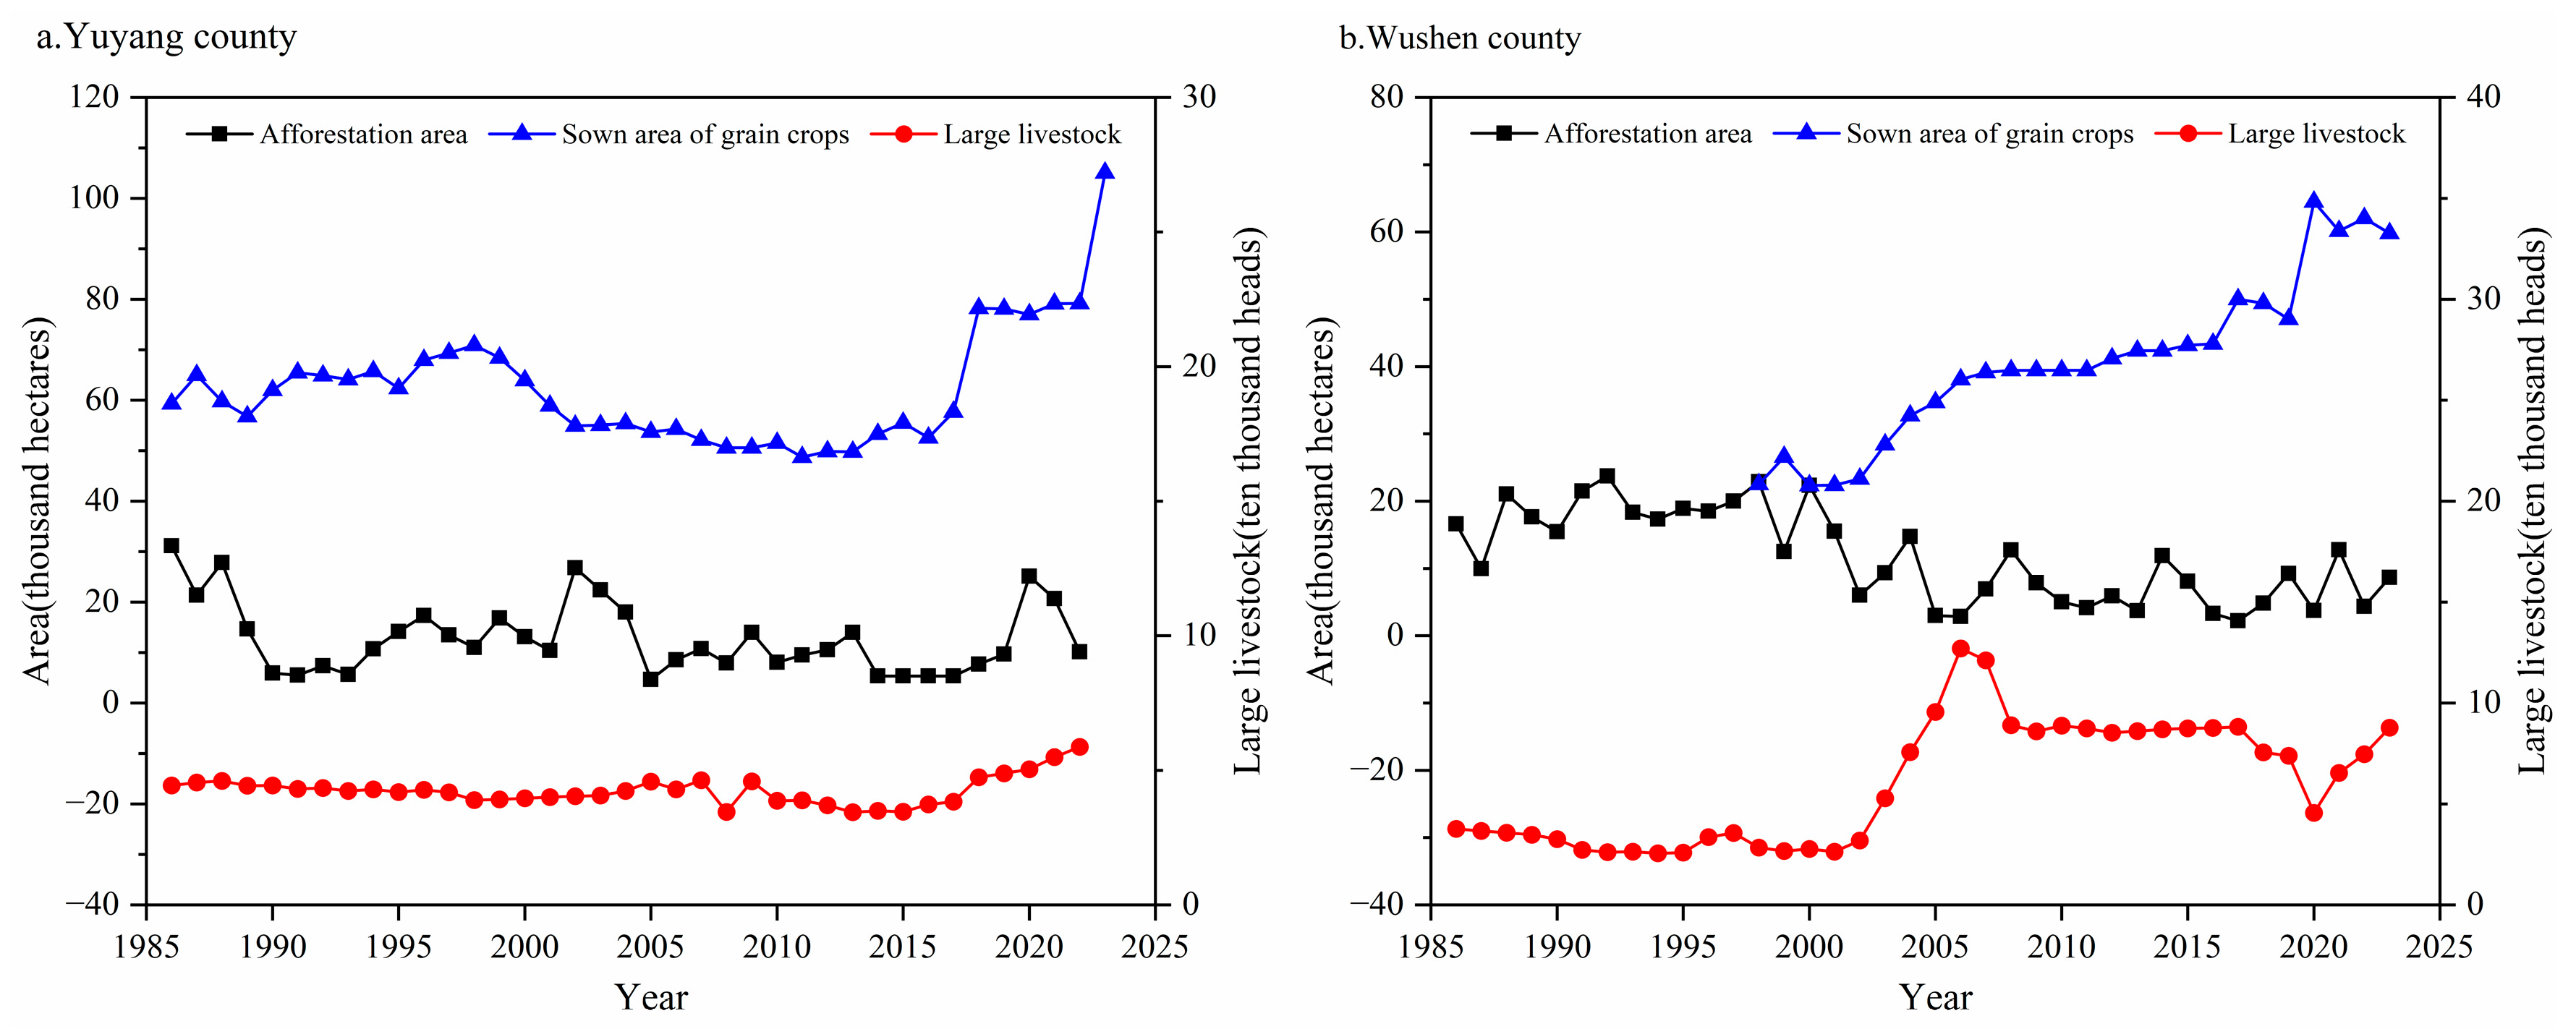
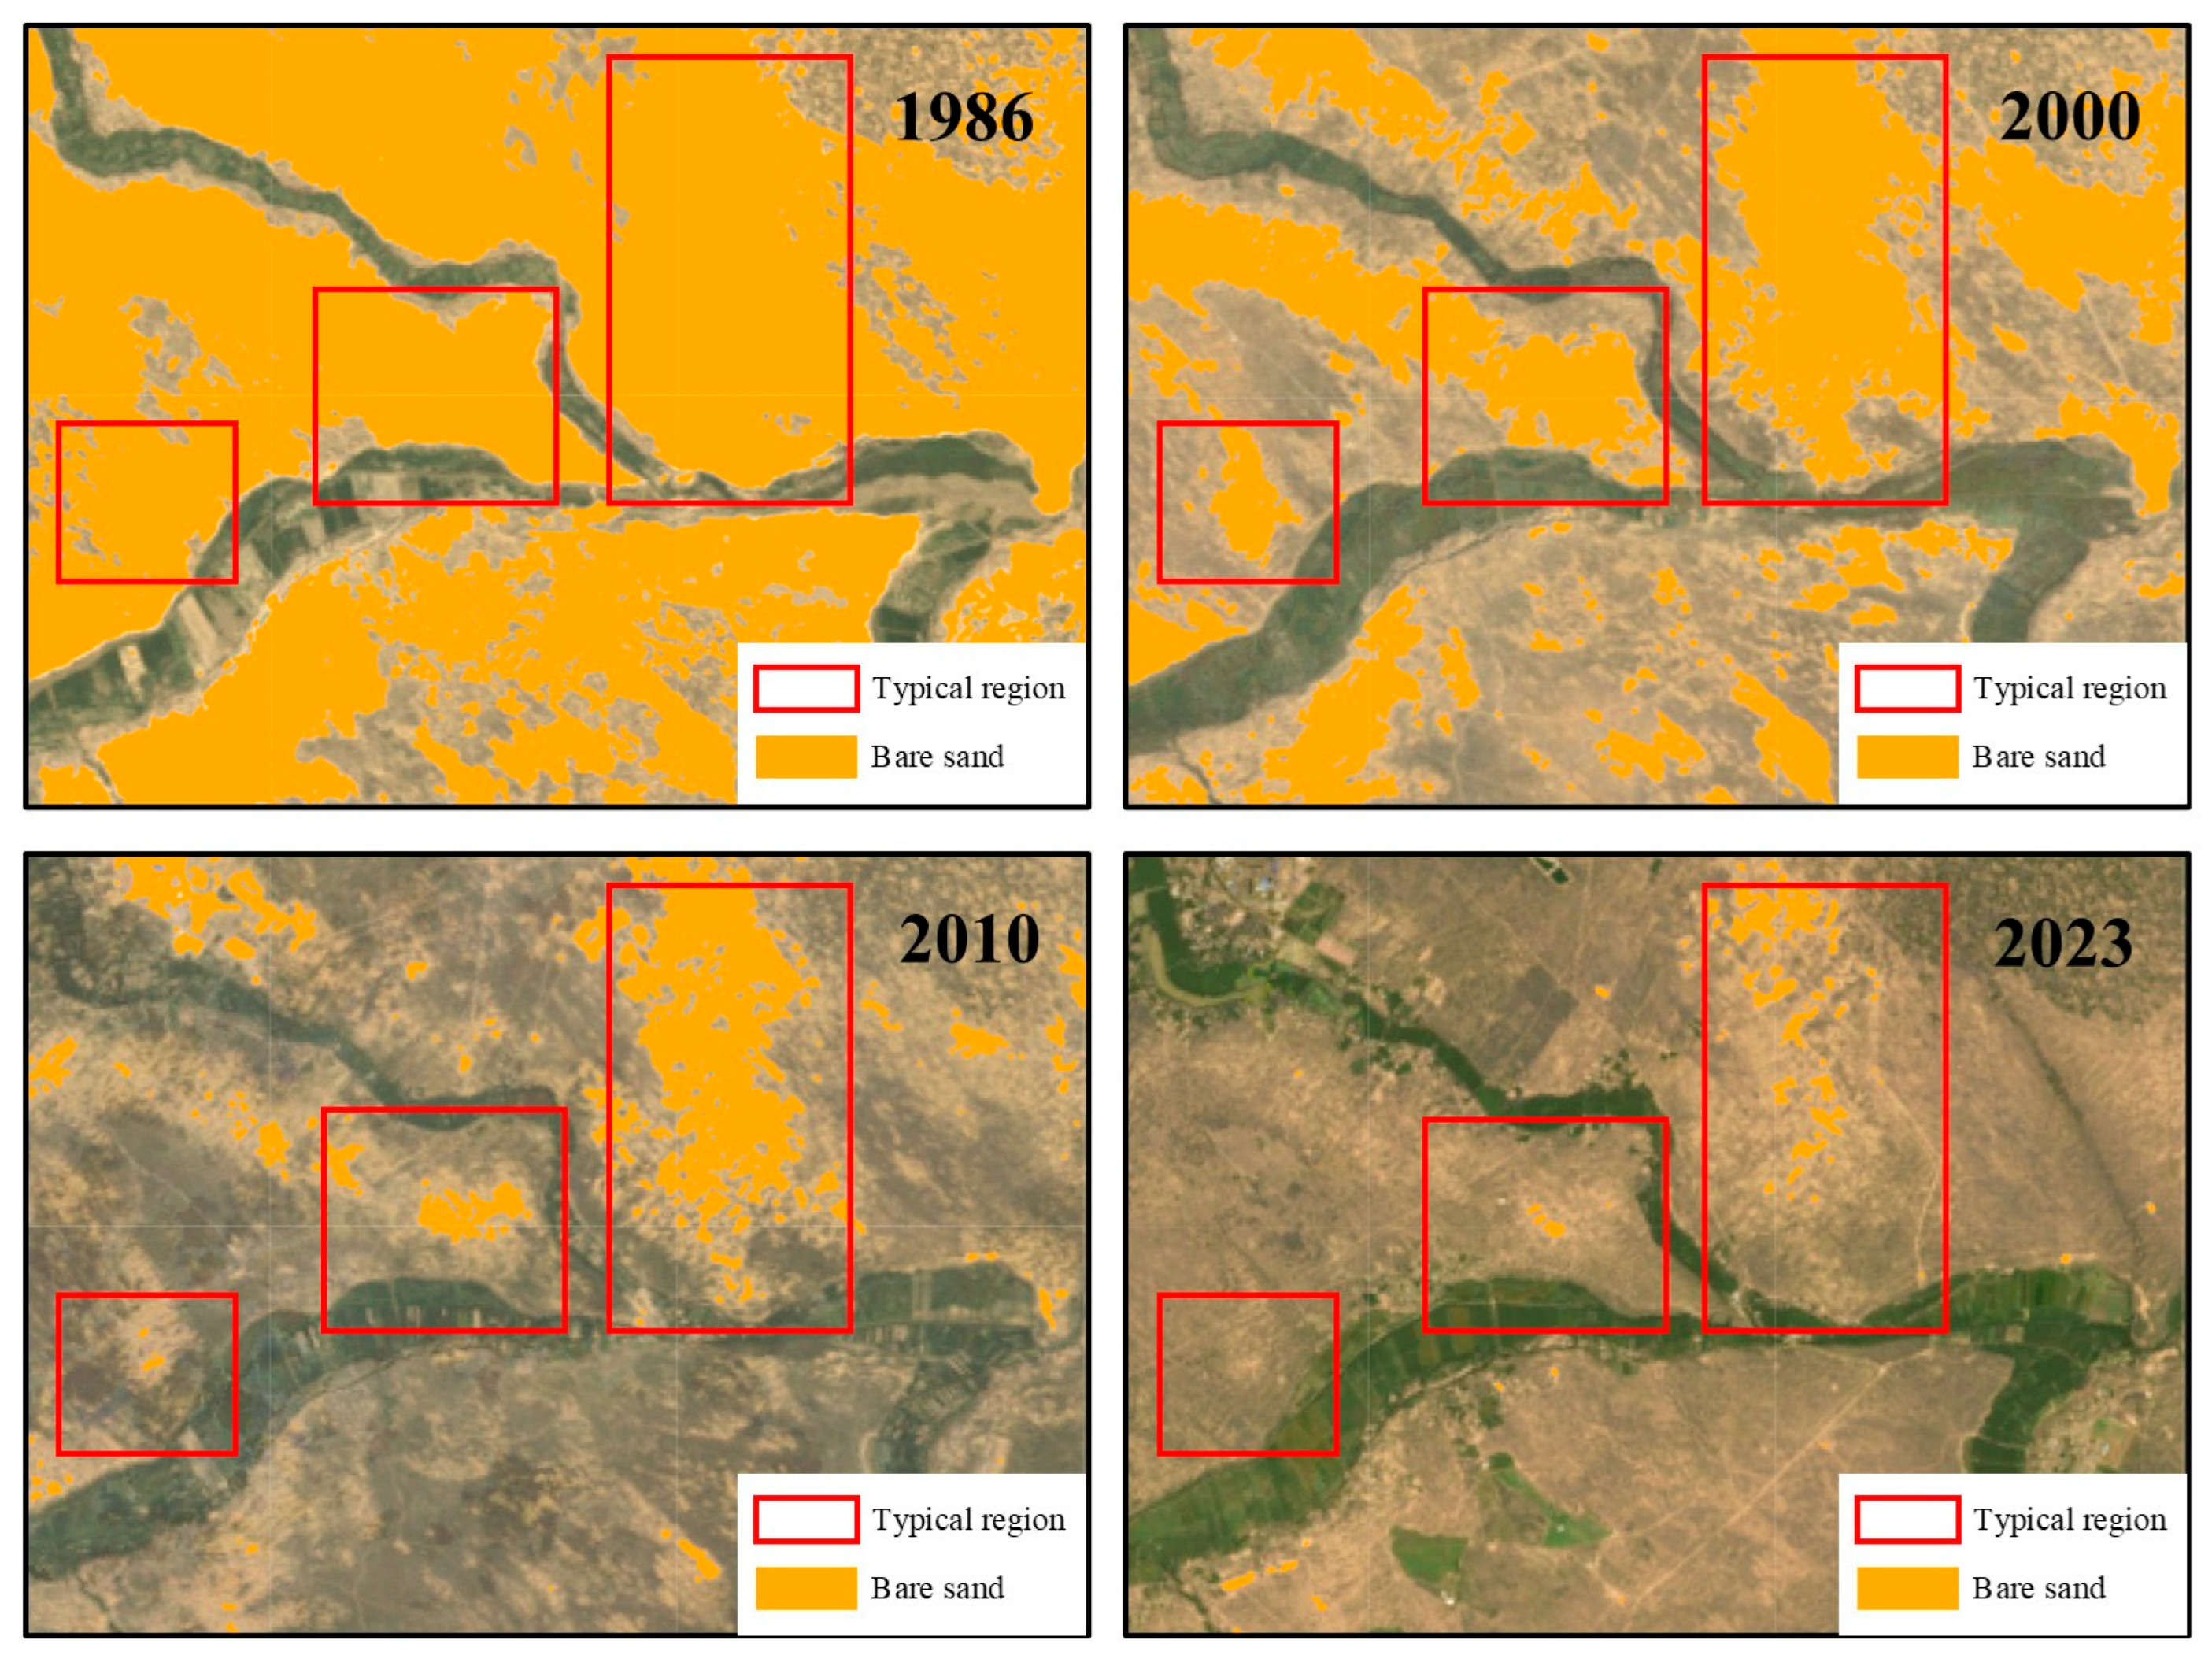
Since 1979, a series of large-scale ecological projects have been implemented in the Mu Us Sandy Land, including the Three-North Shelterbelt Forest System, Natural Forest Land Resource conservation, Grain for Green, and the Beijing and Tianjin Sandstorm Source Controlling project [50]. Concurrently, human activities such as urban construction and agricultural activities have also been continuously strengthened. By 2022, Yuyang County and Wushen County, located within the Mu Us Sandy Land, had accomplished a cumulative afforestation area of 911,500 hectares (Figure 8). This extensive afforestation has led to a significant improvement in regional vegetation cover and a reduction in the distribution of bare sand patches. As clearly illustrated in Figure 9, the succession process involves a gradual transition from bare sand patches to grassland and forest, progressing from the edges toward the core. Notably, the ecological restoration project zones exhibited strong spatial correspondence with areas where bare sand patches have significantly receded. This correlation demonstrates that the restoration initiatives have played a key role in curbing wind erosion, fixing sand, and facilitating the recovery of the local ecosystem.
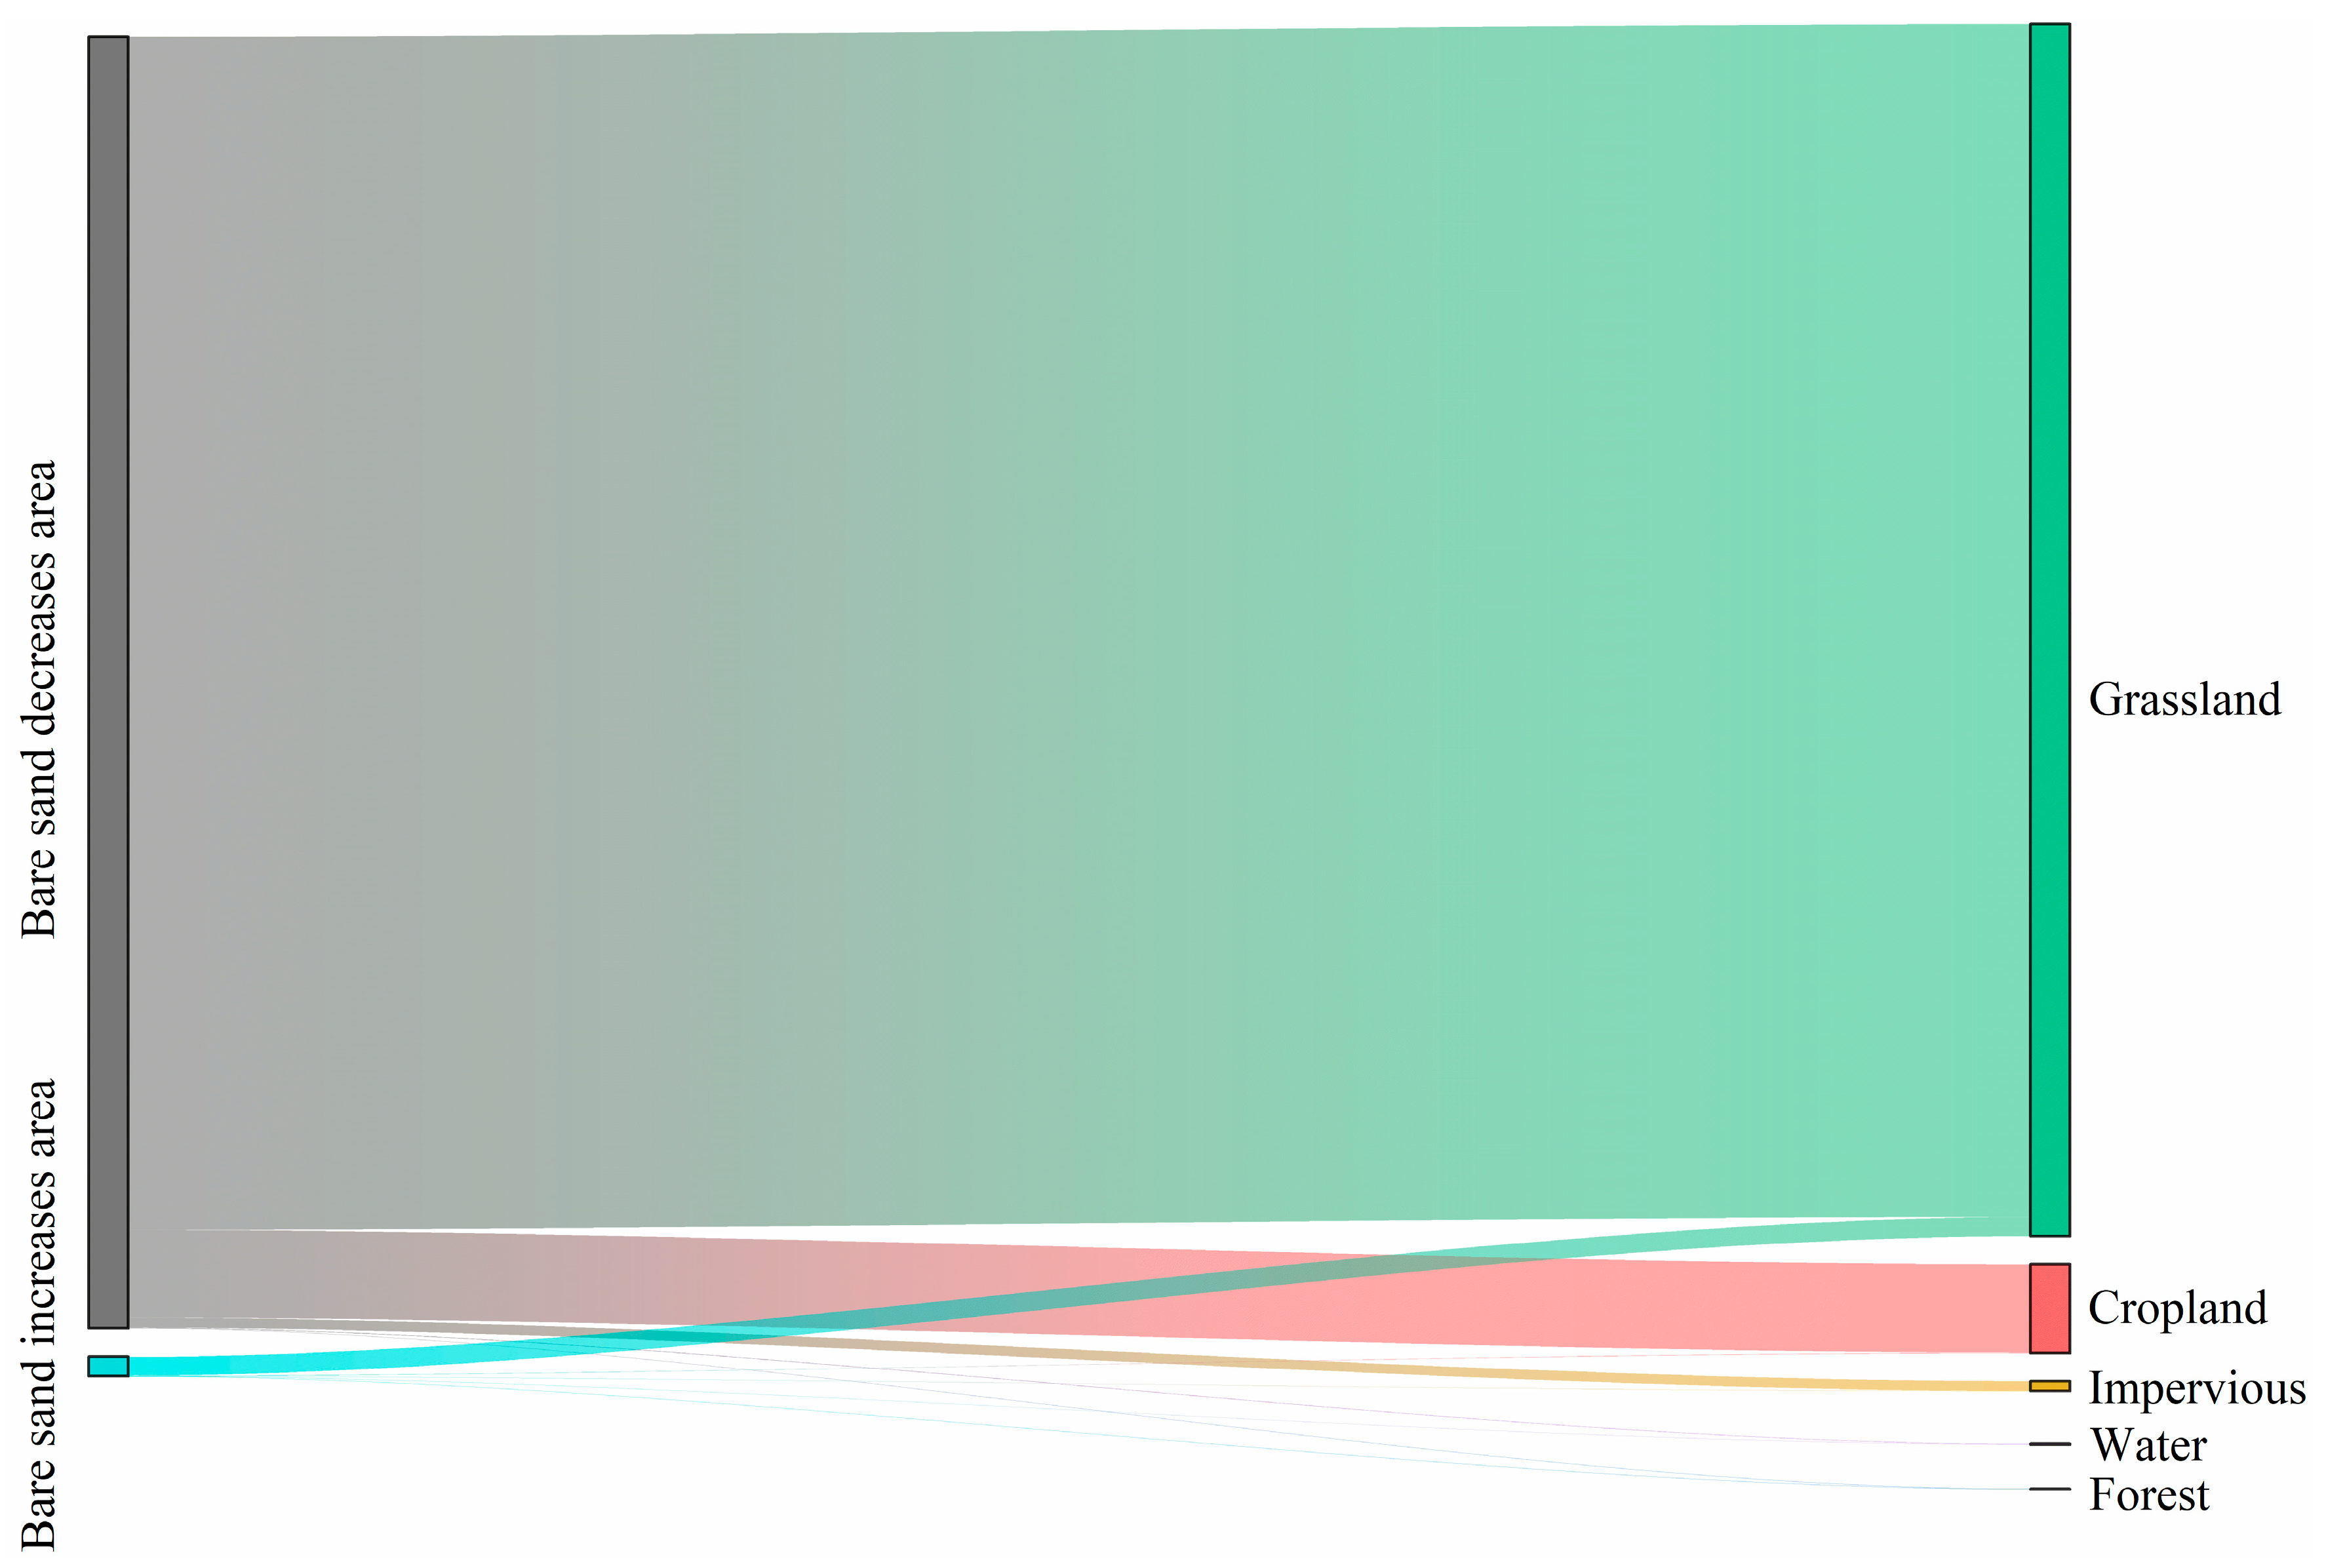
Land use transfer matrix analysis (Figure 10) reveals that, between 1986 and 2023, a total of 12,698.75 km2 of bare sand patches were converted into grassland and forest, substantially reducing the extent of bare sand areas. The launch of the “Grain for Green” program in 1999 marked a key turning point, with a marked decrease in the sown area of grain crops between 1999 and 2002, while the afforestation area increased substantially, primarily due to this ecological restoration initiative. However, from 2002 onward, the sown area of grain crops exhibited a rapid upward trend, which can be largely attributed to the widespread adoption and application of center pivot irrigation (CPI) technology, which is particularly well-suited for arid and semi-arid regions such as the Mu Us Sandy Land. According to Song et al. [51], the number and area of CPI-irrigated farmlands in the Mu Us Sandy Land increased dramatically, from 309 plots (5264 ha) in 2008 to 4829 plots (64,161 ha) in 2022. Some bare sand patches were converted into irrigated farmland as part of this transformation. This rapid expansion of irrigated agriculture not only significantly enhanced land use efficiency but also significantly reduced the extent of bare sand patches by increasing vegetation cover. As indicated by the land use transfer matrix (Figure 10), a total of 935.32 km2 of bare sand was converted to cropland between 1986 and 2023, further accelerating the decline in bare sand area.
Between 1986 and 2022, the number of large livestock in the region remained relatively stable, with a notable increase observed during 2000–2005 (Figure 8). However, since the implementation of grazing bans and rotational grazing policies around 2000, local husbandry practices have undergone significant changes. In some areas, this has led to a shift toward integrated forage cultivation-livestock systems, thereby increasing the carrying capacity per unit area. These changes have also contributed to the improvement of vegetation coverage in degraded grasslands, the promotion of soil microbial crust formation, and, ultimately, the recovery of vegetation and reduction in bare sand patches [52]. In summary, the reduction in bare sand patch area in the Mu Us Sandy Land can primarily be attributed to a combination of human activities, including the implementation of large-scale ecological projects, the promotion of advanced agricultural technologies, and changes in livestock management practices.

5. Conclusions

Utilizing the Google Earth Engine (GEE) platform and Landsat time-series imagery, this study achieved high-accuracy extraction of bare sand patches in the Mu Us Sandy Land over nine periods from 1986 to 2023. The results indicate a significant decrease in the area of bare sand after 2000, with a mean annual reduction rate of 530.08 km2. By 2023, the remaining bare sand patches were predominantly confined to the northwestern region of the study area. The overall decrease in bare sand area can primarily be attributed to the shrinkage of large patches (>10 km2). The spatial distribution of bare sand patches was influenced by a combination of natural factors, including streams, precipitation, topography, and wind regimes. However, human activities played a dominant role in the reduction of bare sand areas. Key drivers included the implementation of large-scale ecological projects, advances in agricultural technology, and transformations in livestock breeding practices. These findings provide valuable quantitative insights and offer a robust scientific foundation for decision-making in desertification control and ecological management in arid regions. Future research will focus on integrating advanced deep learning classification techniques with the GEE platform to further enhance the efficiency and accuracy of land use/land cover mapping, providing a more refined tool for monitoring and managing desertification processes.

Author Contributions

K.Y.: Data curation, Formal analysis, Methodology, Software, and Writing—original draft. Y.C.: Project administration, Visualization, and Supervision. Y.P.: Data curation, Formal analysis, Investigation, Project administration, and Writing—review and editing. All authors have read and agreed to the published version of the manuscript.

Funding

This work was supported by the Fundamental Research Funds of the Chinese Academy of Forestry (Grant No. CAFYBB2023MB017), the National Natural Science Foundation of China (U21A2014), and the Science and Technology Research Project of Henan Province (242102320229).

Data Availability Statement

The data presented in this study are available on request from the corresponding author. The data are not publicly available due to privacy or ethical restrictions.

Acknowledgments

We are grateful to the anonymous reviewers and editors for their useful comments and valuable suggestions.

Conflicts of Interest

The authors declare no conflict of interest.

References

  1. Hassan, R.; Scholes, R.J.; Ash, N. Ecosystems and Human Well-Being: Current State and Trends; Island Press: Washington, DC, USA, 2005. [Google Scholar]
  2. Fu, B.; Stafford-Smith, M.; Wang, Y.; Wu, B.; Yu, X.; Lv, N.; Ojima, D.S.; Lv, Y.; Fu, C.; Liu, Y.; et al. The Global-DEP conceptual framework—Research on dryland ecosystems to promote sustainability. Curr. Opin. Environ. Sustain. 2021, 48, 17–28. [Google Scholar] [CrossRef]
  3. FAO. Trees, Forests and Land Use in Drylands: The First Global Assessment; FAO Forestry Paper No. 184; FAO: Rome, Italy, 2019. [Google Scholar]
  4. von Hardenberg, J.; Meron, E.; Shachak, M.; Zarmi, Y. Diversity of Vegetation Patterns and Desertification. Phys. Rev. Lett. 2001, 87, 198101. [Google Scholar] [CrossRef]
  5. Yizhaq, H.; Ashkenazy, Y.; Tsoar, H. Why Do Active and Stabilized Dunes Coexist under the Same Climatic Conditions? Phys. Rev. Lett. 2007, 98, 188001. [Google Scholar] [CrossRef]
  6. Mayaud, J.R.; Wiggs, G.F.S.; Bailey, R.M. Dynamics of skimming flow in the wake of a vegetation patch. Aeolian Res. 2016, 22, 141–151. [Google Scholar] [CrossRef]
  7. Miao, Y.; Jin, H.; Cui, J. Human activity accelerating the rapid desertification of the Mu Us Sandy Lands, North China. Sci. Rep. 2016, 6, 23003. [Google Scholar] [CrossRef] [PubMed]
  8. Whitford, W.G.; Duval, B.D. Ecology of Desert Systems; Academic Press: London, UK, 2020. [Google Scholar]
  9. Chang, X.; Liu, Y.; Yang, C. Study on Influence Upon Agriophyllum squarrosum Population by the Niche Island of Nude Sandy Patches. Acta Sci. Nat. Univ. Neimonggol (Nat. Sci. Ed.) 2000, 31, 228–232. (In Chinese) [Google Scholar] [CrossRef]
  10. Marshall, J.M. Influence of topography, bare sand, and soil pH on the occurrence and distribution of plant species in a lacustrine dune ecosystem. J. Torrey Bot. Soc. 2014, 141, 29–38. [Google Scholar] [CrossRef]
  11. Gillette, D.A.; Herrick, J.E.; Herbert, G.A. Wind Characteristics of Mesquite Streets in the Northern Chihuahuan Desert, New Mexico, USA. Environ. Fluid Mech. 2006, 6, 241–275. [Google Scholar] [CrossRef]
  12. Field, J.P.; Belnap, J.; Breshears, D.D.; Neff, J.C.; Okin, G.S.; Whicker, J.J.; Painter, T.H.; Ravi, S.; Reheis, M.C.; Reynolds, R.L. The ecology of dust. Front. Ecol. Environ. 2010, 8, 423–430. [Google Scholar] [CrossRef]
  13. Ludwig, J.A.; Wilcox, B.P.; Breshears, D.D.; Tongway, D.J.; Imeson, A.C. Vegetation patches and runoff-erosion as interacting ecohydrological processes in semiarid landscapes. Ecology 2005, 86, 288–297. [Google Scholar] [CrossRef]
  14. Yan, Y.; Xin, X.; Xu, X.; Wang, X.; Yan, R.; Murray, P.J. Vegetation patches increase wind-blown litter accumulation in a semi-arid steppe of northern China. Environ. Res. Lett. 2016, 11, 124008. [Google Scholar] [CrossRef]
  15. Yu, J.; Yin, Q.; Niu, J.; Yan, Z.; Wang, H.; Wang, Y.; Chen, D. Consistent effects of vegetation patch type on soil microbial communities across three successional stages in a desert ecosystem. Land Degrad. Dev. 2022, 33, 1552–1563. [Google Scholar] [CrossRef]
  16. Madurapperuma, B.; Close, P.; Fleming, S.; Collin, M.; Thuresson, K.; Lamping, J.; Dellysse, J.; Cortenbach, J. Habitat Mapping of Ma-le’l Dunes Coupling with UAV and NAIP Imagery. Proceedings 2018, 2, 368. [Google Scholar] [CrossRef]
  17. Shumack, S.; Hesse, P.; Turner, L. The impact of fire on sand dune stability: Surface coverage and biomass recovery after fires on Western Australian coastal dune systems from 1988 to 2016. Geomorphology 2017, 299, 39–53. [Google Scholar] [CrossRef]
  18. Secu, C.V.; Stoleriu, C.C.; Lesenciuc, C.D.; Ursu, A. Normalized Sand Index for Identification of Bare Sand Areas in Temperate Climates Using Landsat Images, Application to the South of Romania. Remote Sens. 2022, 14, 3802. [Google Scholar] [CrossRef]
  19. Smyth, T.A.G.; Wilson, R.; Rooney, P.; Yates, K.L. Extent, accuracy and repeatability of bare sand and vegetation cover in dunes mapped from aerial imagery is highly variable. Aeolian Res. 2022, 56, 100799. [Google Scholar] [CrossRef]
  20. Gorelick, N.; Hancher, M.; Dixon, M.; Ilyushchenko, S.; Thau, D.; Moore, R. Google Earth Engine: Planetary-scale geospatial analysis for everyone. Remote Sens. Environ. 2017, 202, 18–27. [Google Scholar] [CrossRef]
  21. Pizarro, S.E.; Pricope, N.G.; Vargas-Machuca, D.; Huanca, O.; Ñaupari, J. Mapping Land Cover Types for Highland Andean Ecosystems in Peru Using Google Earth Engine. Remote Sens. 2022, 14, 1562. [Google Scholar] [CrossRef]
  22. Jiang, Z.; Ni, X.; Xing, M. A Study on Spatial and Temporal Dynamic Changes of Desertification in Northern China from 2000 to 2020. Remote Sens. 2023, 15, 1368. [Google Scholar] [CrossRef]
  23. Feng, K.; Wang, T.; Liu, S.; Yan, C.; Kang, W.; Chen, X.; Guo, Z. Path analysis model to identify and analyse the causes of aeolian desertification in Mu Us Sandy Land, China. Ecol. Indic. 2021, 124, 107386. [Google Scholar] [CrossRef]
  24. Wang, Z.; Zhang, T.; Pei, C.; Zhao, X.; Li, Y.; Hu, S.; Bu, C.; Zhang, Q. Multisource Remote Sensing Monitoring and Analysis of the Driving Forces of Vegetation Restoration in the Mu Us Sandy Land. Land 2022, 11, 1553. [Google Scholar] [CrossRef]
  25. Fu, Y.; Zhang, Y. Research on temporal and spatial evolution of land use and landscape pattern in Anshan City based on GEE. Front. Environ. Sci. 2022, 10, 988346. [Google Scholar] [CrossRef]
  26. Zhu, B. The recent evolution of dune landforms and its environmental indications in the mid-latitude desert area (Hexi Corridor). J. Geogr. Sci. 2022, 32, 617–644. [Google Scholar] [CrossRef]
  27. Xia, Z.; Lü, P.; Ma, F.; Cao, M.; Yu, J. Quantifying dune migration patterns and influencing factors in the central Sahara Desert. Catena 2024, 235, 107686. [Google Scholar] [CrossRef]
  28. Peng, S.; Ding, Y.; Liu, W.; Li, Z. 1 km monthly temperature and precipitation dataset for China from 1901 to 2017. Earth Syst. Sci. Data 2019, 11, 1931–1946. [Google Scholar] [CrossRef]
  29. Townshend, J.G.; Goff, T.; Tucker, C. Multitemporal Dimensionality of Images of Normalized Difference Vegetation Index at Continental Scales. IEEE Trans. Geosci. Remote Sens. 1985, GE-23, 888–895. [Google Scholar] [CrossRef]
  30. Huete, A.R. Vegetation Indices, Remote Sensing and Forest Monitoring. Geogr. Compass 2012, 6, 513–532. [Google Scholar] [CrossRef]
  31. Jordan, C.F. Derivation of Leaf-Area Index from Quality of Light on the Forest Floor. Ecology 1969, 50, 663–666. [Google Scholar] [CrossRef]
  32. Qi, J.; Chehbouni, A.; Huete, A.R.; Kerr, Y.H.; Sorooshian, S. A Modified Soil Adjusted Vegetation Index. Remote Sens. Environ. 1994, 48, 119–126. [Google Scholar] [CrossRef]
  33. Xu, H. Modification of normalised difference water index (NDWI) to enhance open water features in remotely sensed imagery. Int. J. Remote Sens. 2007, 27, 3025–3033. [Google Scholar] [CrossRef]
  34. Zha, Y.; Gao, J.; Ni, S. Use of normalized difference built-up index in automatically mapping urban areas from TM imagery. Int. J. Remote Sens. 2010, 24, 583–594. [Google Scholar] [CrossRef]
  35. Parracciani, C.; Gigante, D.; Mutanga, O.; Bonafoni, S.; Vizzari, M. Land cover changes in grassland landscapes: Combining enhanced Landsat data composition, LandTrendr, and machine learning classification in google earth engine with MLP-ANN scenario forecasting. GIScience Remote Sens. 2024, 61, 2302221. [Google Scholar] [CrossRef]
  36. Zhao, F.; Feng, S.; Xie, F.; Zhu, S.; Zhang, S. Extraction of long time series wetland information based on Google Earth Engine and random forest algorithm for a plateau lake basin—A case study of Dianchi Lake, Yunnan Province, China. Ecol. Indic. 2023, 146, 109813. [Google Scholar] [CrossRef]
  37. Li, S.; Guo, P.; Sun, F.; Zhu, J.; Cao, X.; Dong, X.; Lu, Q. Mapping Dryland Ecosystems Using Google Earth Engine and Random Forest: A Case Study of an Ecologically Critical Area in Northern China. Land 2024, 13, 845. [Google Scholar] [CrossRef]
  38. Breiman, L. Random Forests. Mach. Learn. 2001, 45, 5–32. [Google Scholar] [CrossRef]
  39. Veronesi, F.; Hurni, L. Random Forest with semantic tie points for classifying landforms and creating rigorous shaded relief representations. Geomorphology 2014, 224, 152–160. [Google Scholar] [CrossRef]
  40. Tatsumi, K.; Yamashiki, Y.; Canales Torres, M.A.; Taipe, C.L.R. Crop classification of upland fields using Random forest of time-series Landsat 7 ETM+ data. Comput. Electron. Agric. 2015, 115, 171–179. [Google Scholar] [CrossRef]
  41. Wei, C.; Guo, B.; Fan, Y.; Zang, W.; Ji, J. The Change Pattern and Its Dominant Driving Factors of Wetlands in the Yellow River Delta Based on Sentinel-2 Images. Remote Sens. 2022, 14, 4388. [Google Scholar] [CrossRef]
  42. Qi, Y.; Pan, M.; Hao, Z.; Yang, A.; Xue, W. Variations in aeolian landform patterns in the Gonghe Basin over the last 30 years. J. Mt. Sci. 2021, 18, 2034–2047. [Google Scholar] [CrossRef]
  43. Li, J.; Chang, X.; Zhang, J.; Cai, M. Spatial analysis of distribution pattern of the mobile dune patches in the typical regions of Korqin Sand land. Sci. Surv. Mapp. 2008, 33, 100–102. (In Chinese) [Google Scholar] [CrossRef]
  44. Du, H.; Wang, Z.; Mao, D. Characteristics of Sand Dune Pattern and Fluvial-aeolian Interaction in Horqin Sandy Land, Northeast Plain of China. Chin. Geogr. Sci. 2018, 28, 624–635. [Google Scholar] [CrossRef]
  45. Pang, Y.; Wu, B.; Jia, X.; Xie, S. Wind-proof and sand-fixing effects of Artemisia ordosica with different coverages in the Mu Us Sandy Land, northern China. J. Arid Land 2022, 14, 877–893. [Google Scholar] [CrossRef]
  46. Zhang, P.; Cai, Y.; Yang, W.; Yi, Y.; Yang, Z.; Fu, Q. Contributions of climatic and anthropogenic drivers to vegetation dynamics indicated by NDVI in a large dam-reservoir-river system. J. Clean. Prod. 2020, 256, 120477. [Google Scholar] [CrossRef]
  47. Xiao, X.; Guan, Q.; Zhang, Z.; Liu, H.; Du, Q.; Yuan, T. Investigating the underlying drivers of vegetation dynamics in cold-arid mountainous. Catena 2024, 237, 107831. [Google Scholar] [CrossRef]
  48. Guo, Y.; Cheng, L.; Ding, A.; Yuan, Y.; Li, Z.; Hou, Y.; Ren, L.; Zhang, S. Geodetector model-based quantitative analysis of vegetation change characteristics and driving forces: A case study in the Yongding River basin in China. Int. J. Appl. Earth Obs. Geoinf. 2024, 132, 104027. [Google Scholar] [CrossRef]
  49. Ma, Y.; Guan, Q.; Sun, Y.; Zhang, J.; Yang, L.; Yang, E.; Li, H.; Du, Q. Three-dimensional dynamic characteristics of vegetation and its response to climatic factors in the Qilian Mountains. Catena 2022, 208, 105694. [Google Scholar] [CrossRef]
  50. Zhang, P.; Shao, G.; Zhao, G.; Master, D.C.L.; Parker, G.R.; Dunning, J.B., Jr.; Li, Q. China’s Forest Policy for the 21st Century. Science 2000, 288, 2135–2136. [Google Scholar] [CrossRef] [PubMed]
  51. Song, Z.; Du, J.; Li, L.; Zhu, X.; Chong, F.; Zhai, G.; Wu, L.; Chen, X.; Han, J. Spatiotemporal Changes of Center Pivot Irrigation Farmland in the Mu Us Region and Its Impact on the Surrounding Vegetation Growth. Remote Sens. 2024, 16, 569. [Google Scholar] [CrossRef]
  52. Liu, J.; Bian, Z.; Zhang, K.; Ahmad, B.; Khan, A. Effects of different fencing regimes on community structure of degraded desert grasslands on Mu Us desert, China. Ecol. Evol. 2019, 9, 3367–3377. [Google Scholar] [CrossRef] [PubMed]
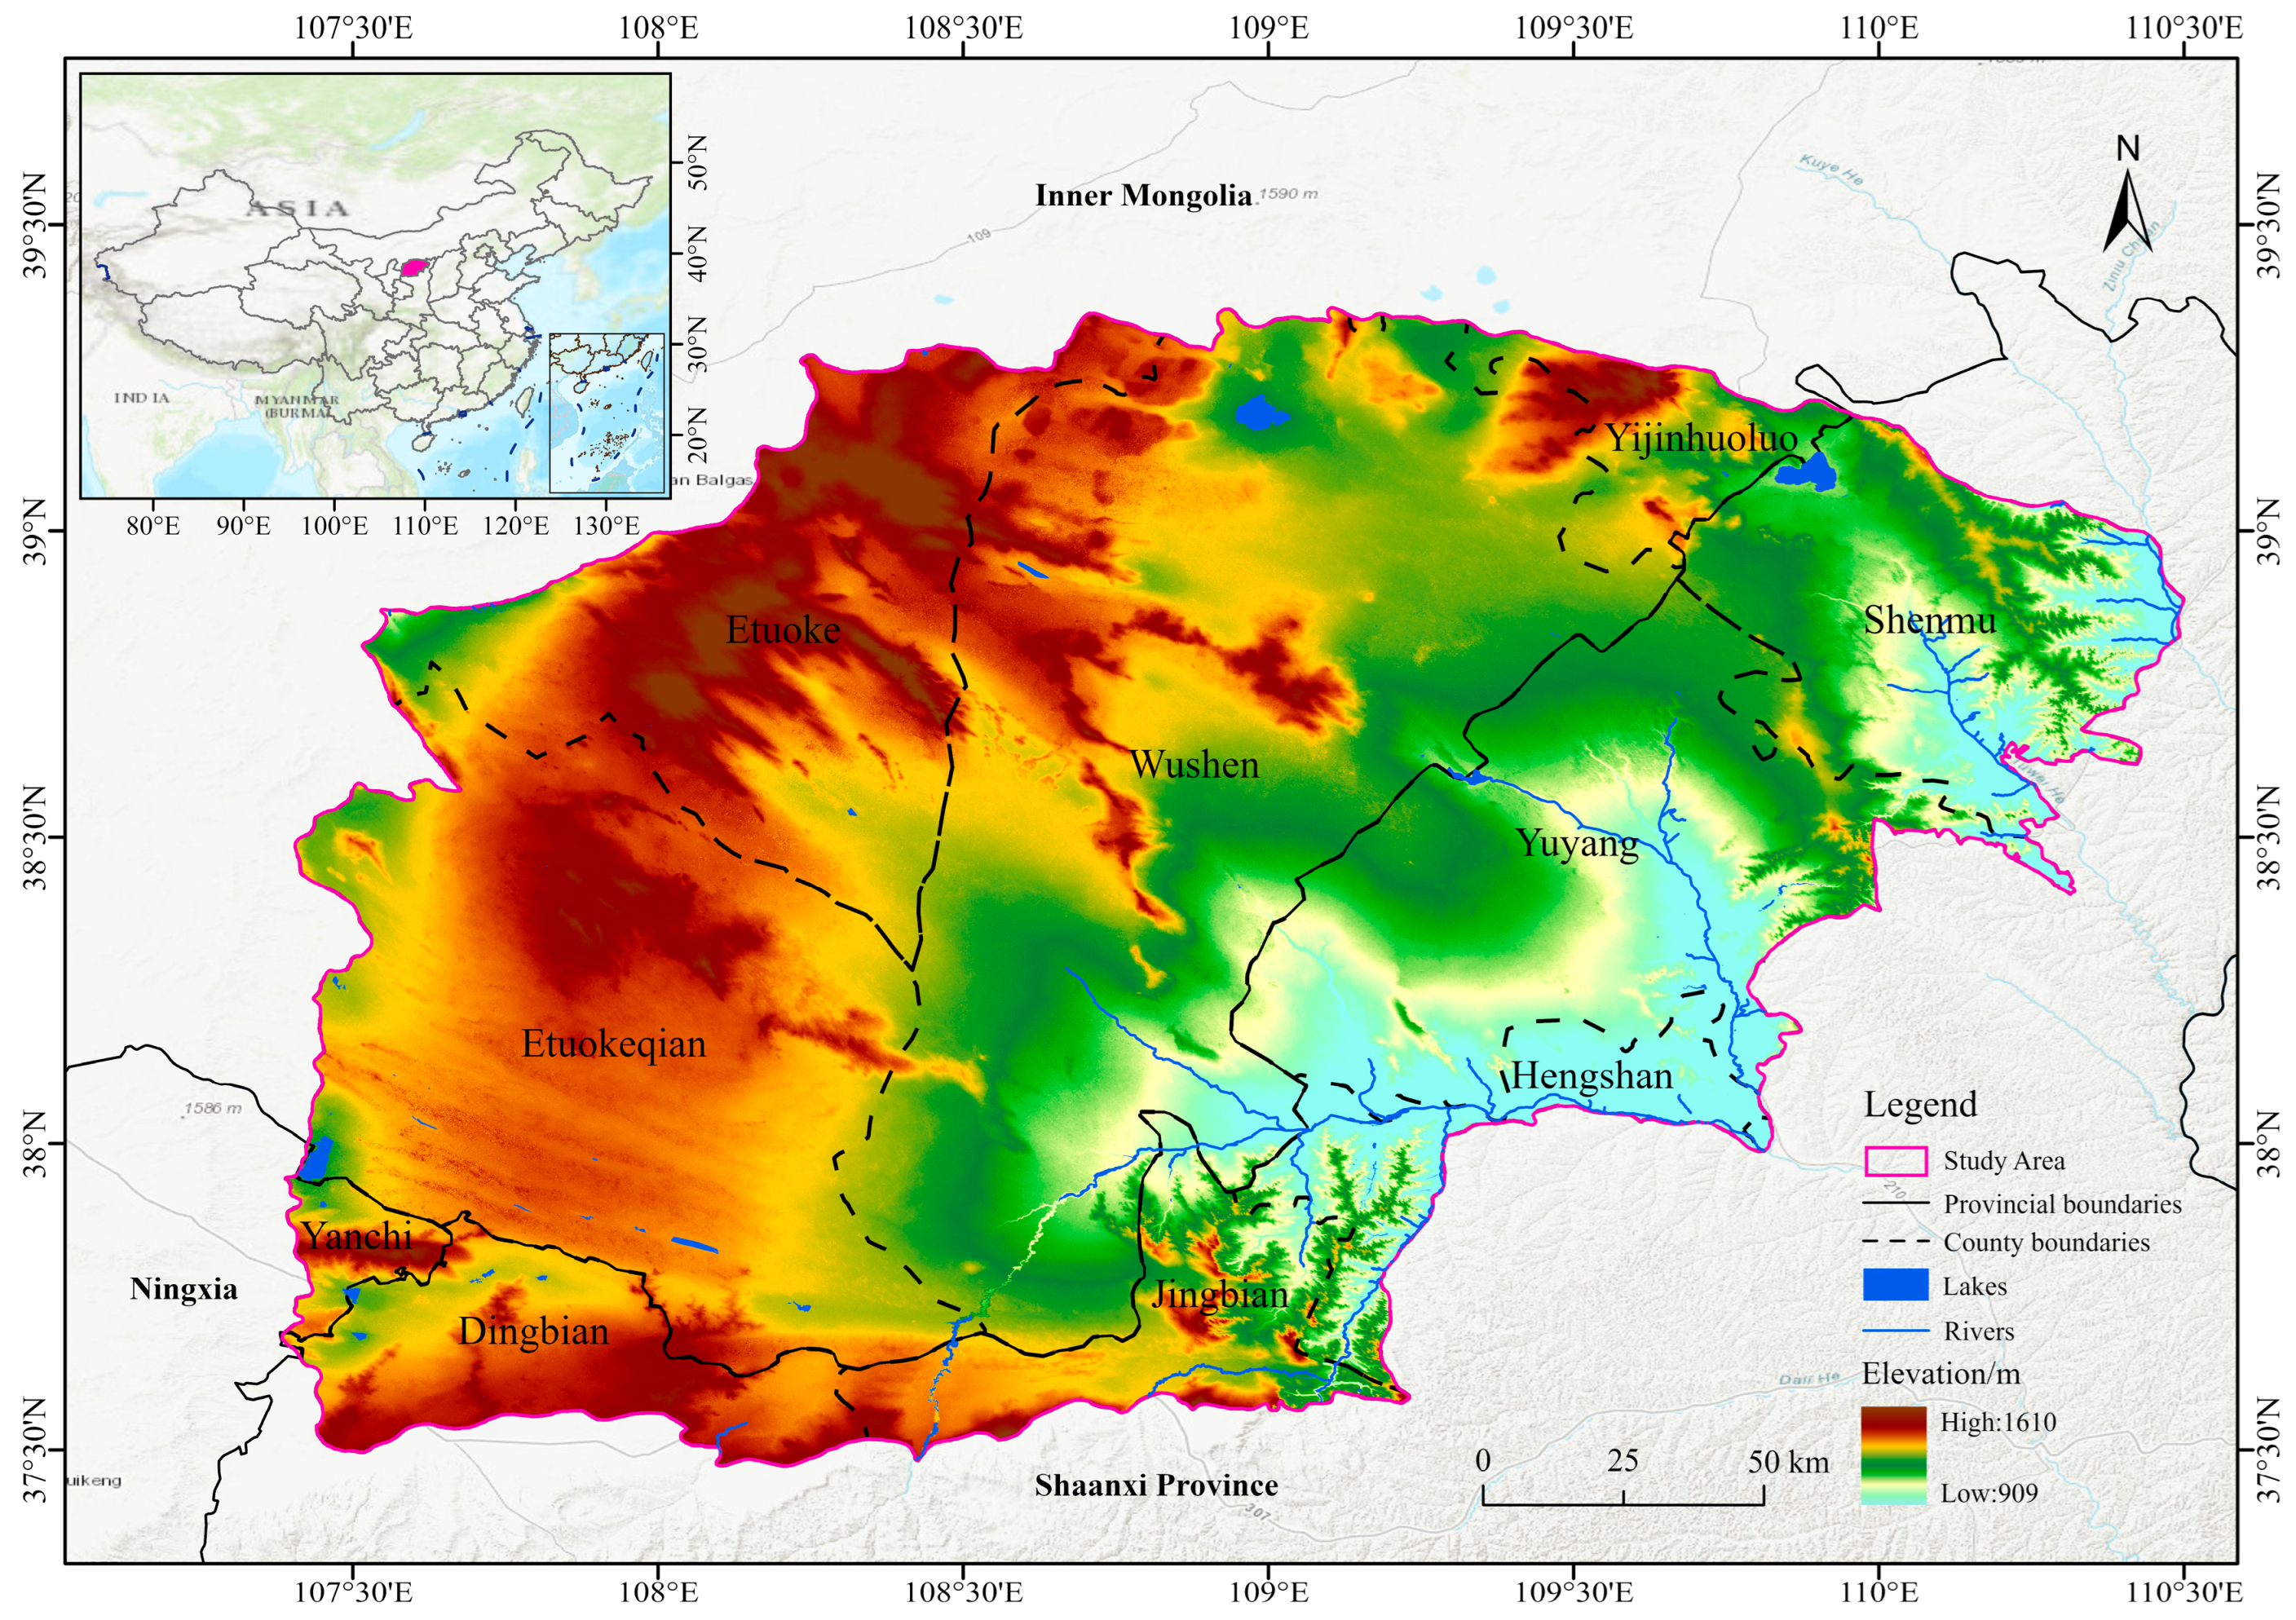
Figure 1. Overview of the study area.
Remotesensing 17 03244 g001
Figure 2. Area and percentage of bare sand in the Mu Us Sandy Land from 1986 to 2023.
Remotesensing 17 03244 g002
Figure 3. Spatial distribution of bare sand in Mu Us Sandy Land from 1986 to 2023.
Remotesensing 17 03244 g003
Figure 4. Area and quantity of bare sand patches of different grades in the Mu Us Sandy Land from 1986 to 2023.
Remotesensing 17 03244 g004
Figure 5. Spatial distribution of average precipitation in the Mu Us Sandy Land from 1986 to 2023.
Remotesensing 17 03244 g005
Figure 6. Variation trend of bare sand area and NDVI in the Mu Us Sandy Land from 1986 to 2023.
Remotesensing 17 03244 g006
Figure 7. Temporal distribution of precipitation, potential evapotranspiration, temperature, and wind speed in the Mu Us Sandy Land from 1986 to 2023.
Remotesensing 17 03244 g007
Figure 8. Temporal distribution of afforestation area, total sown area of food crops, and large livestock in the Mu Us Sandy Land from 1986 to 2023.
Remotesensing 17 03244 g008
Figure 9. Typical bare sand patches gradually transformed into afforestation areas (Base map is derived from Landsat series satellite imagery).
Remotesensing 17 03244 g009
Figure 10. Distribution of land use/land cover types in areas of bare sand change.
Remotesensing 17 03244 g010
Table 1. Interpretation mark of Landsat image.
Land Use/Land Cover TypeLandsat ImageDescription
Bare sandRemotesensing 17 03244 i001The image is light yellow with an irregular shape and water ripple texture.
Non-bare sandWaterRemotesensing 17 03244 i002The image is dark green with an irregular shape.
Forest/grasslandRemotesensing 17 03244 i003The image is light gray and densely distributed.
Built-upRemotesensing 17 03244 i004The image is gray and regular in shape.
CroplandRemotesensing 17 03244 i005The image is green with a regular shape and a smooth texture.
Table 2. Sample point data for nine periods from 1986 to 2023.
Year198619911996200020052010201520202023
Bare sand225210222252226178167160126
Non-bare sand327307338339319358381393416
Total552517560591545536548553542
Table 3. Assessment results of bare sand patch mapping for nine periods.
YearCover TypeProducer
Accuracy
Consumer AccuracyOverall
Accuracy
Kappa
Coefficient
1986Non-bare sand0.99061.00000.99420.9878
Bare sand1.00000.9852
1991Non-bare sand1.00000.98800.99290.9854
Bare sand0.98301.0000
1996Non-bare sand1.00000.99080.99390.9866
Bare sand0.98271.0000
2000Non-bare sand0.99001.00000.99460.9893
Bare sand1.00000.9886
2005Non-bare sand0.98881.00000.99360.9871
Bare sand1.00000.9855
2010Non-bare sand0.99080.99080.98740.9708
Bare sand0.98000.9800
2015Non-bare sand0.99091.00000.99400.9870
Bare sand1.00000.9833
2020Non-bare sand0.99221.00000.99360.9810
Bare sand1.00000.9705
2023Non-bare sand0.99191.00000.99410.9854
Bare sand1.00000.9791
Table 4. Area and quantity of bare sand patches by area class in the Mu Us Sandy Land from 1986 to 2023.
YearMicro PatchSmall PatchMedium PatchLarge PatchGiant Patch
Count
(Piece)
Area
(km2)
Count
(Piece)
Area
(km2)
Count
(Piece)
Area
(km2)
Count
(Piece)
Area
(km2)
Count
(Piece)
Area
(km2)
198625,168134.2719,807578.3036081051.766421791.849912,841.03
199126,135139.3221,275625.8138751118.277432026.0011512,127.81
199625,622137.4121,588639.1241211190.847702069.341239188.94
200028,634152.4822,935679.9044311308.098162260.351269981.52
200532,072170.4925,889759.4947041377.397972104.061197941.75
201025,586136.3421,025620.3041611205.826711864.27883543.38
201525,773138.4121,193625.4640971161.795331377.84431398.73
202024,213129.8519,505572.633459960.704311026.7438941.07
202317,63194.4914,038411.302374644.42245599.5625440.64
Disclaimer/Publisher’s Note: The statements, opinions and data contained in all publications are solely those of the individual author(s) and contributor(s) and not of MDPI and/or the editor(s). MDPI and/or the editor(s) disclaim responsibility for any injury to people or property resulting from any ideas, methods, instructions or products referred to in the content.