Article

Spatial and Temporal Dynamics of Water Quality in Lake Okeechobee Using Remote Sensing and Its Impact on Environmental Health

by
Moses Kiwanuka
1,2,
Ivan Oyege
1,3 and
Maruthi Sridhar Balaji Bhaskar
1,*
1
Department of Earth and Environment, Florida International University, Miami, FL 33199, USA
2
Department of Civil Engineering, Ndejje University, Kampala P.O. Box 7088, Uganda
3
Department of Chemistry, Busitema University, Tororo P.O. Box 236, Uganda
*
Author to whom correspondence should be addressed.
Remote Sens. 2025, 17(18), 3197; https://doi.org/10.3390/rs17183197
Submission received: 21 June 2025 / Revised: 17 August 2025 / Accepted: 15 September 2025 / Published: 16 September 2025

Abstract

Inland water pollution poses significant risks to aquatic environments, affecting ecological and human health while increasing drinking-water treatment costs. Continuous monitoring using reliable techniques such as satellite remote sensing is essential. This study investigates the spatial and temporal water quality dynamics of Lake Okeechobee by integrating satellite imagery with in situ water samples. The objectives are (1) to analyze water quality trends and (2) to develop linear regression models for predicting Chlorophyll-a (Chla), turbidity, and Trophic State Index (TSI) for eutrophication monitoring. Landsat 8 and 9 imagery, coupled with water quality data from monitoring stations in the South Florida Water Management District’s DBHydro database, provided measurements of Chla, total nitrogen (TN), total phosphorus (TP), and turbidity. Statistical analyses determined optimal regression models with adjusted R2 values of 0.69 and 0.93 for individual band Chla and turbidity models and 0.65, 0.82, and 0.66 for spectral band ratio models of Chla, turbidity, and TSI, respectively. Northwestern and southwestern peripheries of Lake Okeechobee exhibited Chla concentrations exceeding the 20 µg/L threshold, while turbidity peaked near the lake’s center. From 2013 to 2019, TN increased significantly, followed by a slight decline from 2019 to 2023, whereas TP exhibited no clear trend. The TSI ranged from mesotrophic to hypereutrophic states. This study demonstrates satellite remote sensing as an efficient tool for monitoring water quality changes, guiding restoration measures, and identifying highly contaminated zones through threshold-based segmentation of satellite-derived water quality maps, rather than assessing the lake as a uniform whole.

1. Introduction

Inland lakes are crucial ecosystems that provide essential services, including drinking water, recreational opportunities, and agricultural irrigation, making them economically significant for both local communities and tourists [1,2,3]. However, anthropogenic activities increasingly threaten these ecosystems, with harmful algal blooms (HABs) emerging as one of the most severe challenges. HABs have become rampant globally in recent decades, both in freshwater and marine environments [4,5,6]. Their occurrence is facilitated by the nutrient-rich flows coupled with increasing temperatures and other meteorological events such as high precipitation, storms, and hurricanes [7]. However, it could be noted that HABs can also occur under cooler and low-nutrient conditions. Lake Okeechobee, a key component of the Kissimmee River–Lake Okeechobee–Everglades system, has undergone significant alterations over the past century, resulting in complex water quality issues. The lake receives water from various point and non-point sources, including the Kissimmee River, numerous pumping stations along its southern shoreline, uncontrolled runoff from agricultural farms and urban areas, and seasonal rainfall, all contributing to its dynamic nature. Historically, the water from the lake flowed south through the Everglades, ending in the Gulf of Mexico and Florida Bay. Due to the water needs for agricultural farms and urban development, controlled C-43 and C-44 canals were built to drain Lake Okeechobee west into the Caloosahatchee River and Gulf of Mexico [8] and to the South Fork of the St. Lucie Estuary, respectively. The surrounding watershed, dominated by agricultural and urban land use, contributes high nutrient loads to the lake, which are primary sources of nitrogen and phosphorus, leading to the widespread of HABs and subsequently to eutrophication, a process characterized by excessive nutrient enrichment that degrades water quality [9,10,11].
The lake has a good history of worsening pollution because of nutrients leading to eutrophication and blue-green HABs. Historically, total phosphorus concentrations shot up in the mid-1970s from 50 μg/L to more than 100 μg/L in the late 1990s [6,12]. Eutrophication in Lake Okeechobee has resulted in frequent blooms of cyanobacteria, particularly Microcystis, which produce dense surface mats that block light, create hypoxic conditions, and lead to fish kills and poor water quality [3,13,14,15]. The Microcystis can produce microcystin, a potent hepatotoxin [16,17,18], which is detrimental to environmental and human health, causing skin diseases, respiratory distress, and liver damage in humans and animals [16,19,20,21] upon exposure [22]. In the summer of 2016, total microcystin concentration in the lake water peaked at 34 μg/L [23], which was much greater than the acceptable range globally from 0.3 to 1.5 μg/L and <10 μg/L for drinking [24] and recreational purposes [25], respectively. The acceptable United States Environmental Protection Agency’s (USEPA) mean numeric criteria for Florida lakes are shown in Table 1 [26]. USEPA stresses that for a given waterbody, the annual geometric mean of Chla, TN, or TP concentrations shall not exceed the applicable criterion concentration more than once in three years. Despite efforts by the South Florida Water Management District (SFWMD) to implement nutrient abatement strategies, these blooms persist because of the exceeded limits in the nutrients within the lake, as shown above, highlighting the need for improved monitoring and management strategies.
Remote sensing has become a powerful tool for monitoring water quality in large, hard-to-access areas. Satellite missions like Landsat, Sentinel, and MODIS have been instrumental in mapping phytoplankton and assessing water quality parameters such as Chla and turbidity [21,27,28,29]. Satellite remote sensing of harmful algal blooms (HABs) enables broad spatial coverage of surface reflectance using sensors with moderate to high spatial and temporal resolutions. For example, Sentinel-2 offers a 10 m spatial resolution [30], while Landsat 8 and 9 provide 30 m resolution with a 16-day revisit time individually, or an 8-day interval when used in combination [31,32,33]. A range of algorithms, from simple indices like the Floating Algae Index [33,34] to more complex models, have been developed to estimate harmful algal blooms (HABs) indirectly using Chlorophyll-a (Chla) as a proxy [35,36]. Multiple linear regression (MLR) using spectral band values and in situ data has been widely applied for modeling optically active water quality parameters. The authors in [37,38] used MODIS Band 2 (near-infrared) reflectance with empirical models to predict Chl-a in Lake Taihu, China, and in multiple lakes across Brazil. An emphasis on the importance of developing local algorithms, especially using moderate-resolution satellites like Landsat 8 and 9 for better accuracy in parameters such as turbidity and Chla is greatly encouraged. Turbidity is often retrieved using red/NIR band ratios from Sentinel-2 and validated against field measurements, with R2 values commonly exceeding 0.8 [39,40,41,42]. Other studies such as [29,30] have applied machine learning and deep learning techniques to inland water bodies, such as Lake Okeechobee, achieving higher predictive performance.
Satellite image quality is affected by environmental factors, such as clouds and their shadows, sun glint, and additional atmospheric haze, such as routine fires, creating data gaps. The Lake Okeechobee study area is known to have numerous clouds for most of the year and routine fires from the sugarcane plantations, which affect the quality of the satellite images [29,43,44]. This leads to less cloud-free satellite data to pair with in situ sampled data for optimal model development [45,46,47]. This issue was partially resolved by using images from both Landsat 8 and Landsat 9. Maximum care must be taken to select pixel values in cloud-free portions of the images for use. The availability of Landsat 8 and 9 imagery, with its combined eight-day revisit cycle, offers a valuable opportunity to refine algorithms for detecting early-stage algal blooms and assessing the trophic state of Lake Okeechobee [48,49,50]. The trophic state is a proxy for water quality, lake productivity, and biological integrity of water bodies [51] based on the nutrients present, such as nitrogen-limited or phosphorus-limited. Contrary to in situ sampling, where a sample collection is performed at a specific point, which might not represent the entire lake area, with satellite remote sensing, we can assess a larger spatial area, better representing the parameter concentrations. This study seeks to develop and apply remote sensing-based algorithms based on surface water reflectance to map and monitor water quality dynamics for Lake Okeechobee, utilizing the most recent Landsat 8 and 9 imagery. This is because most existing algorithms are based on Landsat 5 and 7, which have been decommissioned, and a few for Landsat 8. Therefore, in this study, a combined Landsat 8 and 9 were used. In this study, we aimed (1) to analyze the spatial and temporal trends in water quality dynamics and (2) to develop linear regression models for predicting Chla concentrations, a proxy for algal blooms, turbidity, and the Trophic State Index (TSI) for monitoring eutrophication.

2. Methods

2.1. Study Area

Lake Okeechobee (Figure 1), the largest freshwater lake in the Florida peninsula, covers approximately 1732 km2 with an average depth of 2.7 m. It is a valuable water resource to the people of Florida as a provision for flood protection, water supply, navigation, and recreation purposes [52]. The subtropical region receives an average annual rainfall of about 1400 mm and an average temperature range of 19.2 °C to 28.7 °C. The lake receives about 64% of its inflow from the Kissimmee River.

2.2. Data Collection

2.2.1. In Situ Water Quality Data

The near-surface (0.5 m deep) water quality data for Chlorophyll-a (Chla), total nitrogen (TN), total phosphorus (TP), and turbidity were obtained from the South Florida Water Management District’s corporate environmental database (DBHydro) (https://www.sfwmd.gov/science-data/dbhydro, accessed on 1 March 2023), covering the period from 2013 to 2023 [53]. Based on data availability, spatial distribution, and continuity, data were collected from widespread, spatially distributed monitoring stations, averaged by month in case of more than a single sample collection from all the sections of the lake, as shown in Figure 1 [52].

2.2.2. Landsat Satellite Data

Cloud-free and low-cloud Landsat 8 and 9 Operational Land Imager (OLI) satellite images, Collection 2 Level 2 (C2L2), with a 30 m spatial resolution, were accessed from the USGS Glovis platform. Usable matchups between in situ data and Landsat imagery were available for the months of September through April. In South Florida, the wet season typically extends from May to October, while the dry season spans from November to April. Thus, our dataset includes conditions from both the late wet season and the dry season, enabling the models to capture seasonal variability in water quality. A time lag was considered for this study. A time lag is known as a window of days or hours of satellite overpass before or after in situ water quality sampling. In most cases, a time window of ±3 h is used to generate matchups between satellite and onsite data [44]. Other studies have used 3–7 days of matchup time due to the long revisit period of Landsat satellites [54]. Scholars like [55] found that the coefficient of determination for regression models tends to decrease as the time lag between satellite overpasses and in situ data collection increases. In his study, a time lag of 1–7 days between satellite and SDD yielded appropriate results, which gives confidence to other scholars [56]. The author in [57] adopted a same-day to four-day time lag between Landsat 8 satellite and in situ sampling, which yielded a reliable Chla algorithm. Another study by [45] identified how a higher time lag of greater than four days yielded poor algorithms, while datasets within a time lag of 2 days found a high correlation between satellite data and in situ sampling. However, in our study, the satellite images were selected to correspond with the dates of in situ data collection, using a same-day matchup to ensure temporal alignment. In situ data sampling was performed between 8:30 a.m. and 1:00 p.m., meaning there was a slight deviation of hours for some dates with the satellite overpass. In our dataset, this deviation ranged from approximately 0.5 to 2.5 h, which is within the ±3 h window recommended in the literature [44] and well below the thresholds where significant accuracy loss >4 days has been reported [45]. The images were processed to extract spectral reflectance values for the selected parameters for further analysis. The Table 2 below shows individual bands with their respective spectral ranges.

2.3. Data Processing

Outliers and missing in situ data were handled using interquartile and interpolation methods, respectively, to avoid skewing the analysis. Ensuring the completeness and accuracy of the dataset was critical for reliable statistical analysis and model development. The satellite data were processed using ERDAS ERMAPPER Ver 16.7 and Esri ArcGIS Pro Ver 3.3 software. The Dark Object Subtraction (DOS) method was applied to further reduce atmospheric haze on each spectral band. Individual bands were mosaicked to create a composite image with information from all relevant bands. This composite image allowed for visual interpretation and further analysis. The surface reflectance values for the seven spectral bands of Landsat 8 and 9 were extracted at each monitoring station. The dark object subtracted band (DOSB) values were calculated by subtracting the dark band values from the individual band values to eliminate any unseen atmospheric haze. Using established spectral relationships, these spectral reflectance values were then used to estimate optically sensitive parameters (Chla and turbidity). Due to extensive cloud cover in most Landsat 9 images, approximately 30% of the 70 data points (pixels within clouds and shadows) were excluded. Algorithm development used data from autumn to late spring, as persistent summer clouds during the rainy season limited image availability.
This study applied the DOS method for atmospheric correction across all Landsat 8 and 9 images to minimize haze and scattering effects. While no formal sensitivity analysis was conducted to test alternative atmospheric correction approaches, DOS has been shown to produce stable and comparable water reflectance estimates for large, optically complex lakes [54,58]. Given the consistent application of DOS and the strong agreement between predicted and measured values in our validation, we consider it unlikely that the use of other standard atmospheric correction techniques would substantially alter the regression relationships reported here.

2.4. Statistical Analysis

2.4.1. Regression Models

This study used Minitab statistical software Ver 21.4.2 made by Minitab, LLC, State College, PA, USA to develop multiple regression algorithms linking in situ measurements (independent variables) with Landsat 8 and 9 reflectance data (dependent variables). Multiple regression was chosen because it can explicitly quantify the influence of each predictor on the target variable [59], providing insights that are valuable to stakeholders and policymakers. Such interpretability is often challenging with many machine learning models, with the exception of random forest models. Multiple regression models are valuable for hypothesis testing, which is essential in identifying significant environmental factors influencing water quality [60]. They can also produce outcomes comparable to more computationally demanding statistical techniques [61]. Unlike many machine learning models, which require large datasets, particularly during training, multiple regression can perform effectively with limited data and is easily replicable [62]. In our study, all possible regressions were generated from the available predictors, and the best subsets regression method was applied to identify models with the highest predictive power while minimizing the number of predictors. The most accurate predictive model was then selected. Given the relatively small dataset compared to what is typically required for machine learning, multiple regression was the preferred approach. Model selection considered several metrics: the S-value (standard error of estimate), R2 (coefficient of determination, which generally increases with more predictors), adjusted R2 (which penalizes unnecessary predictors), and predicted R2. A smaller S-value indicates a better model fit; however, S alone was not used to determine the best model, and all the above factors were evaluated collectively. Adjusted R2 was especially important because it accounts for both the number and contribution of predictors, unlike standard R2. The top models were further evaluated for autocorrelation using the Durbin–Watson Statistics (DW) test, and the model with the highest adjusted R2 value and no autocorrelation was chosen as the final model. Parameter differences were assessed at a 5% significance level using one-way analysis of variance (ANOVA), and Tukey’s post hoc test was employed for pairwise comparisons.

2.4.2. Trophic State Index (TSI) Calculation

The Trophic State Index (TSI) is a parameter used for a holistic assessment of the lake based on its productivity, nutrient availability, and light attenuation. This was calculated using in situ Chla, TN, and TP concentrations. TSI is often used to manage and monitor the quality of inland water bodies [34,63]. The TSI for Chla, TN, and TP were individually calculated using Equations (1)–(5) developed for lakes in Florida [64].
T S I C h l a = 16.8 + [ 14.4 × ln C h l a ]
T S I T N = 10 × [ 5.96 + 2.15 × ln T N + 0.001 ]
T S I T P = 18.6 × L N T P × 1000 18.4
T S I T P = 10 × [ 2.36 × L N ( T P × 1000 ) 2.38 ]
T S I C o m b i n e d = T S I C h l a + T S I ( T N ) 2
The final TSI formulation (Equation (5)) accounted for nutrient limitation conditions based on TN/TP ratios, classifying the lake as nitrogen-limited (TN/TP < 10), calculated by dividing in situ TN with in situ TP. It should be noted that Equations (6)–(8) were developed based on the lake’s nutrient levels [64]. In this case, Equation (8) was chosen for nitrogen-limited (8) after meeting the required nutrient range (TN/TP < 10) from the calculated ratios.
  • Nutrient Balanced Lakes (10 ≤ TN/TP ≤ 30):
    T S I = T S I C h l a + T S I T N + T S I T P / 2 2
  • Phosphorus-Limited Lakes (TN/TP > 30):
    T S I = T S I C h l a + T S I ( T P ) 2
  • Nitrogen-Limited Lakes (TN/TP < 10):
    T S I = T S I C h l a + T S I ( T N ) 2

3. Results

3.1. In Situ Water Quality Parameters

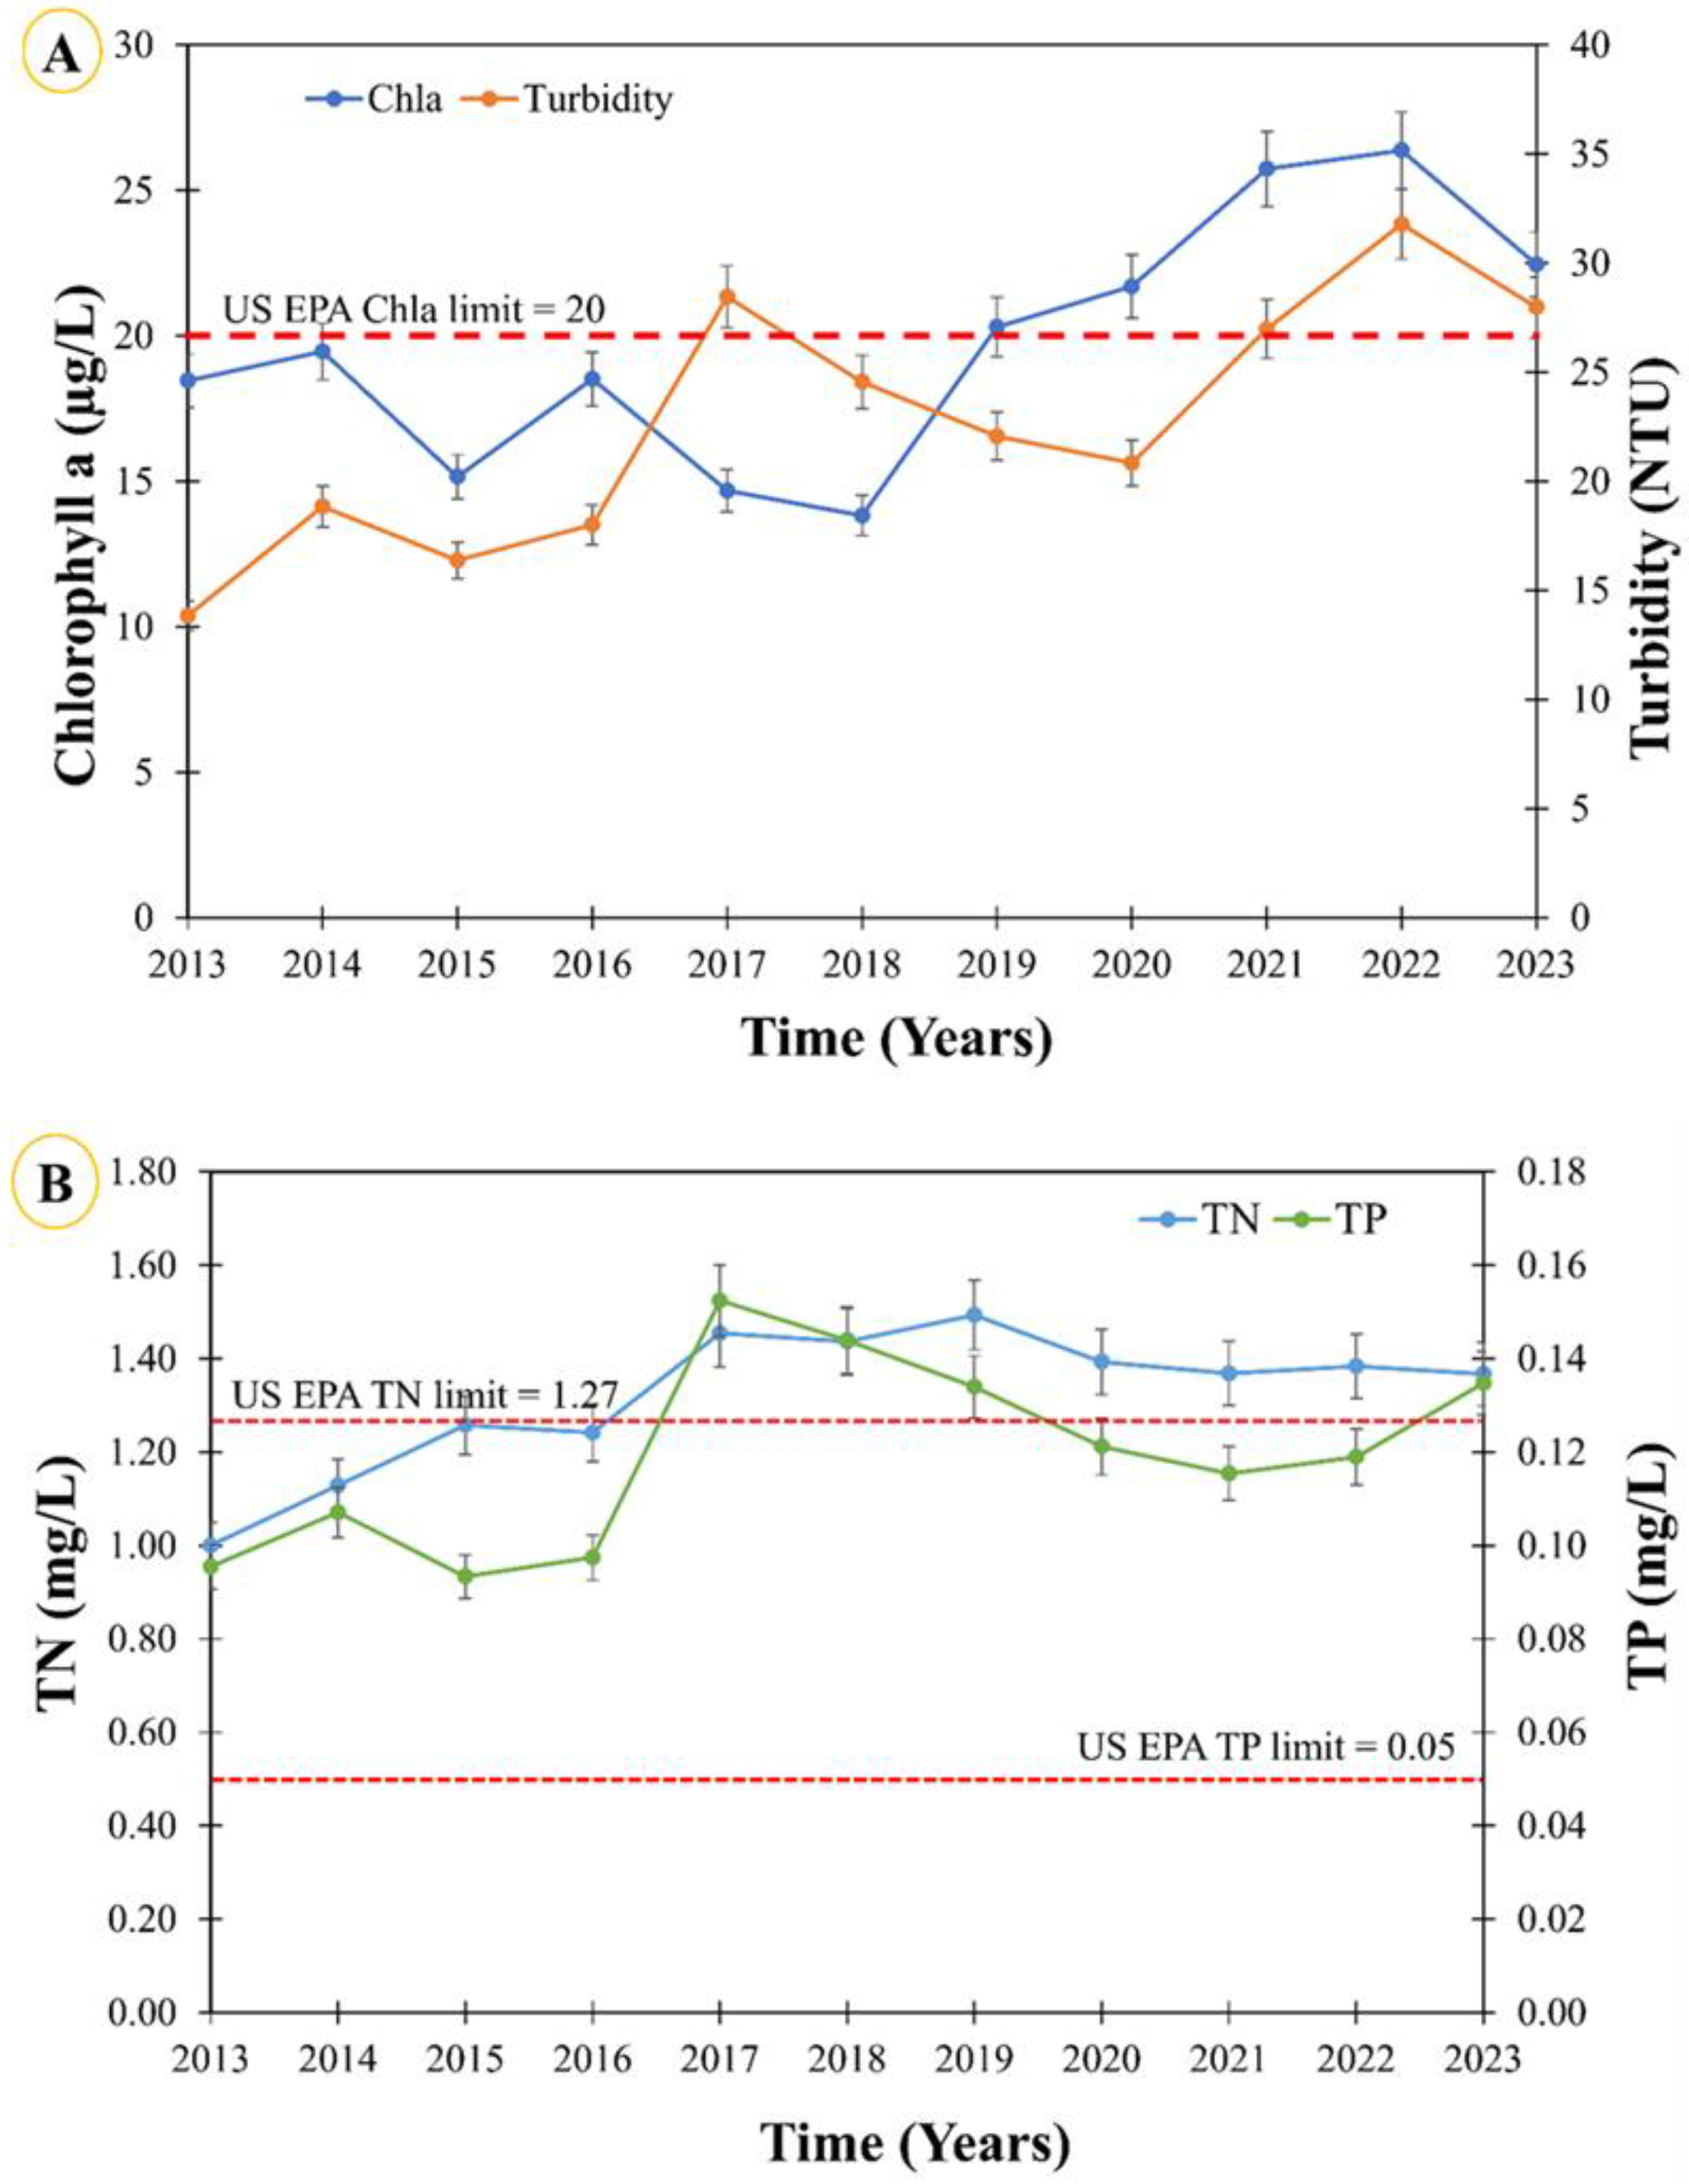
From 2013 to 2023, mean annual concentrations of Chla, turbidity (Turb), total nitrogen (TN), and total phosphorus (TP) were measured across all stations in Lake Okeechobee (Figure 2). Chla levels varied over the decade, with lower concentrations between 2013 and 2018 and a marked increase from 2019 to 2022, peaking in 2022 before slightly declining in 2023. Values exceeded the USEPA criterion of 20 µg/L from 2019 onward.
Turbidity showed fluctuations, with increases in 2013–2014, 2017, and 2021, and declines in 2015, 2018–2020, and 2023. TN concentrations rose steadily to a peak in 2019 and remained above the 1.27 mg/L USEPA threshold from 2016 onwards. TP levels were generally stable until 2016, spiked in 2017, declined to 2021, and rose again by 2023, exceeding the 0.05 mg/L criterion throughout the record.

3.2. Correlation Analysis Between In Situ Data and Landsat 8 and 9 Spectral Bands

Relationships between in situ data and Landsat 8/9 spectral bands were used to develop predictive models for Chla, turbidity, and the Trophic State Index (TSI). The best individual-band models achieved adjusted R2 values of 0.69 for Chla and 0.93 for turbidity. The best spectral ratio models achieved adjusted R2 values of 0.65 for Chla, 0.82 for turbidity, and 0.66 for TSI. These models were developed using in situ ranges of 2–40 µg/L (Chla), 10–100 NTU (turbidity), and 35–85 (TSI). Equations (9)–(13) present the final predictive formulae.
C h l a = 24.23 0.1176   B 2 + 0.0885   B 3 0.02789   B 5 + 0.1182   B 7
where B2, B3, B5, and B7 represent dark-object-subtracted digital numbers of Landsat OLI bands 2, 3, 5, and 7, respectively. A model summary for the above equations is shown in Table 3.
T u r b i d i t y = 23.16 + 0.14934   B 5 0.1246   B 6
C h l a = 89.4 125.5   R 21 + 46.49   R 31 20.00   R 54 + 39.91   R 61
T u r b i d i t y = 230.2 + 175.8   R 21 + 125.7   R 54
T S I = 49.87 247.2   R 32 + 217.8   R 42 398.8   R 53 + 471.2   R 54

3.3. Spatial Patterns from Predictive Models

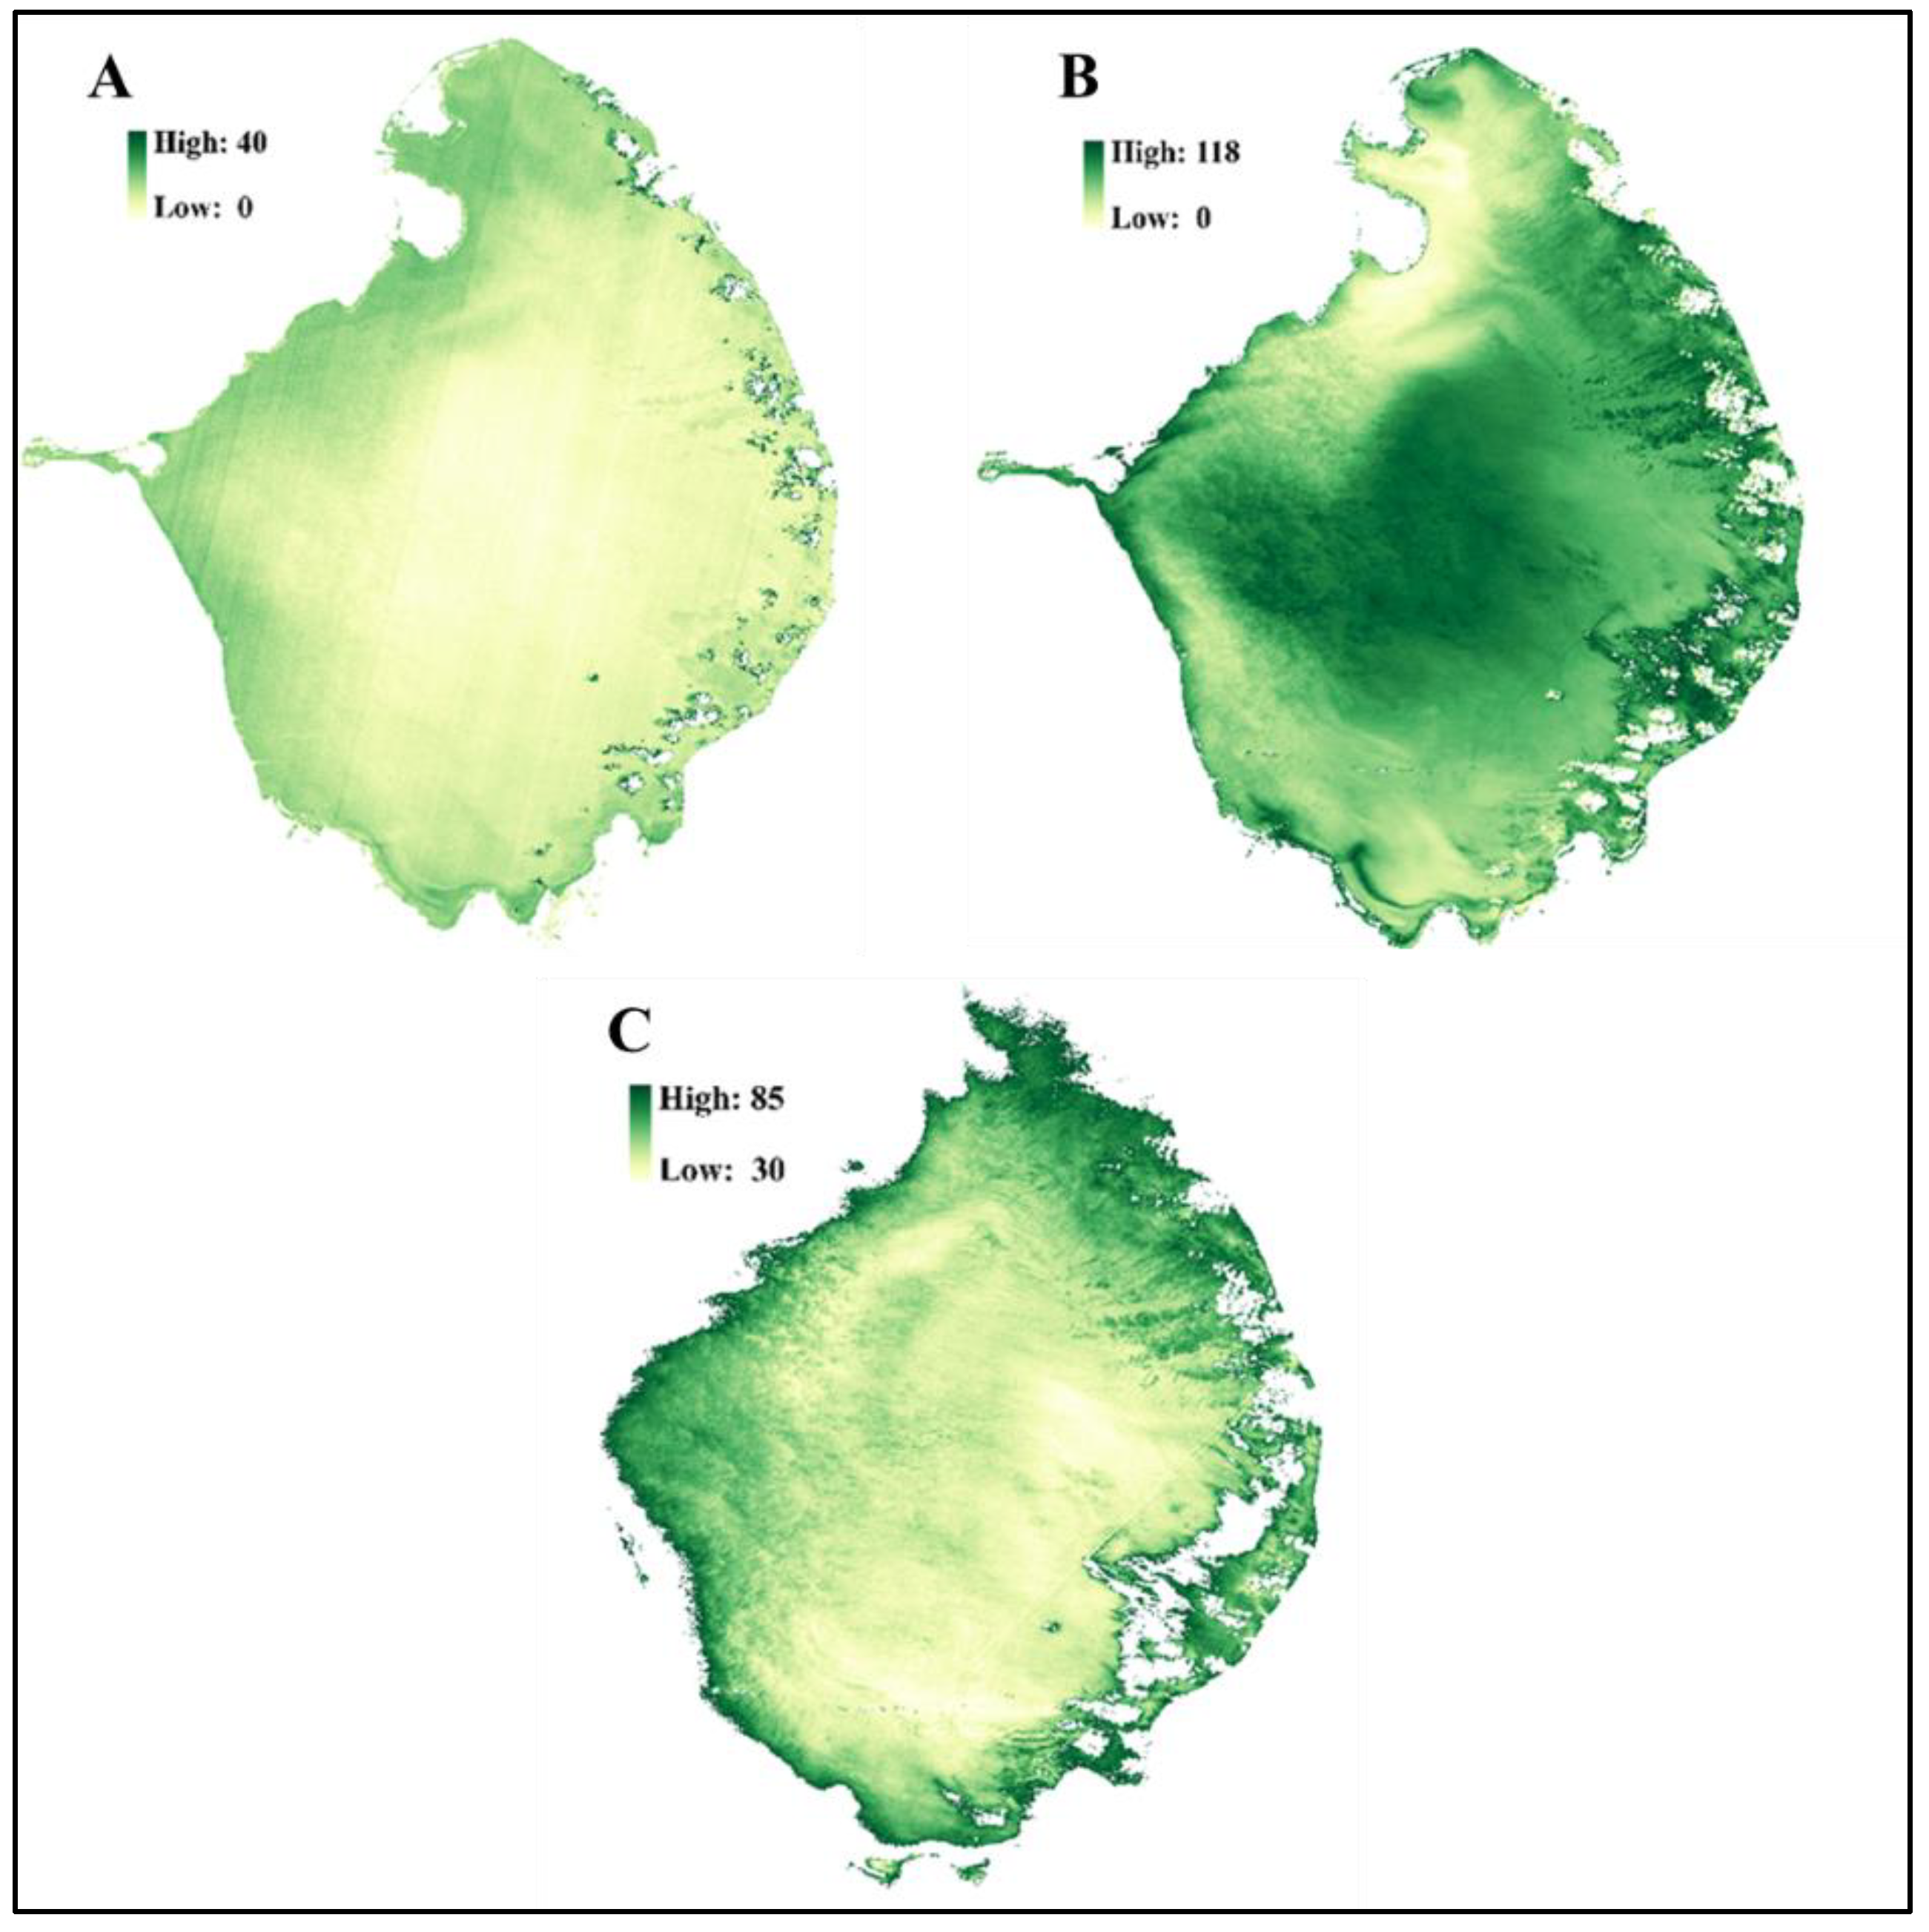
Spatial maps based on the models (Figure 3 and Figure 4) show that Chla concentrations were generally higher near the lake’s periphery than in central areas. In 2015, elevated Chla was concentrated in peripheral areas (Figure 3A), while in 2021, higher values occurred in the western and southern sections (Figure 4A).
Turbidity was highest in central areas of the lake, with elevated values extending from the western to eastern shores, particularly in the eastern sector near the Kissimmee River mouth (Figure 3B and Figure 4B). TSI values indicated mesotrophic conditions within the central lake section and hypereutrophic conditions in nearshore areas. In some years, hypereutrophic conditions extended over larger portions of the lake (Figure 3C and Figure 4C).

3.4. Model Performance Summary

Table 3 summarizes the regression statistics for individual-band and spectral ratio models. Turbidity models had the highest adjusted R2 values, followed by Chla and TSI models. For both Chla and turbidity, individual-band models performed slightly better than spectral ratio models. All models showed Durbin–Watson statistics indicating no first-order autocorrelation.

3.5. Validation and Application of Predictive Models

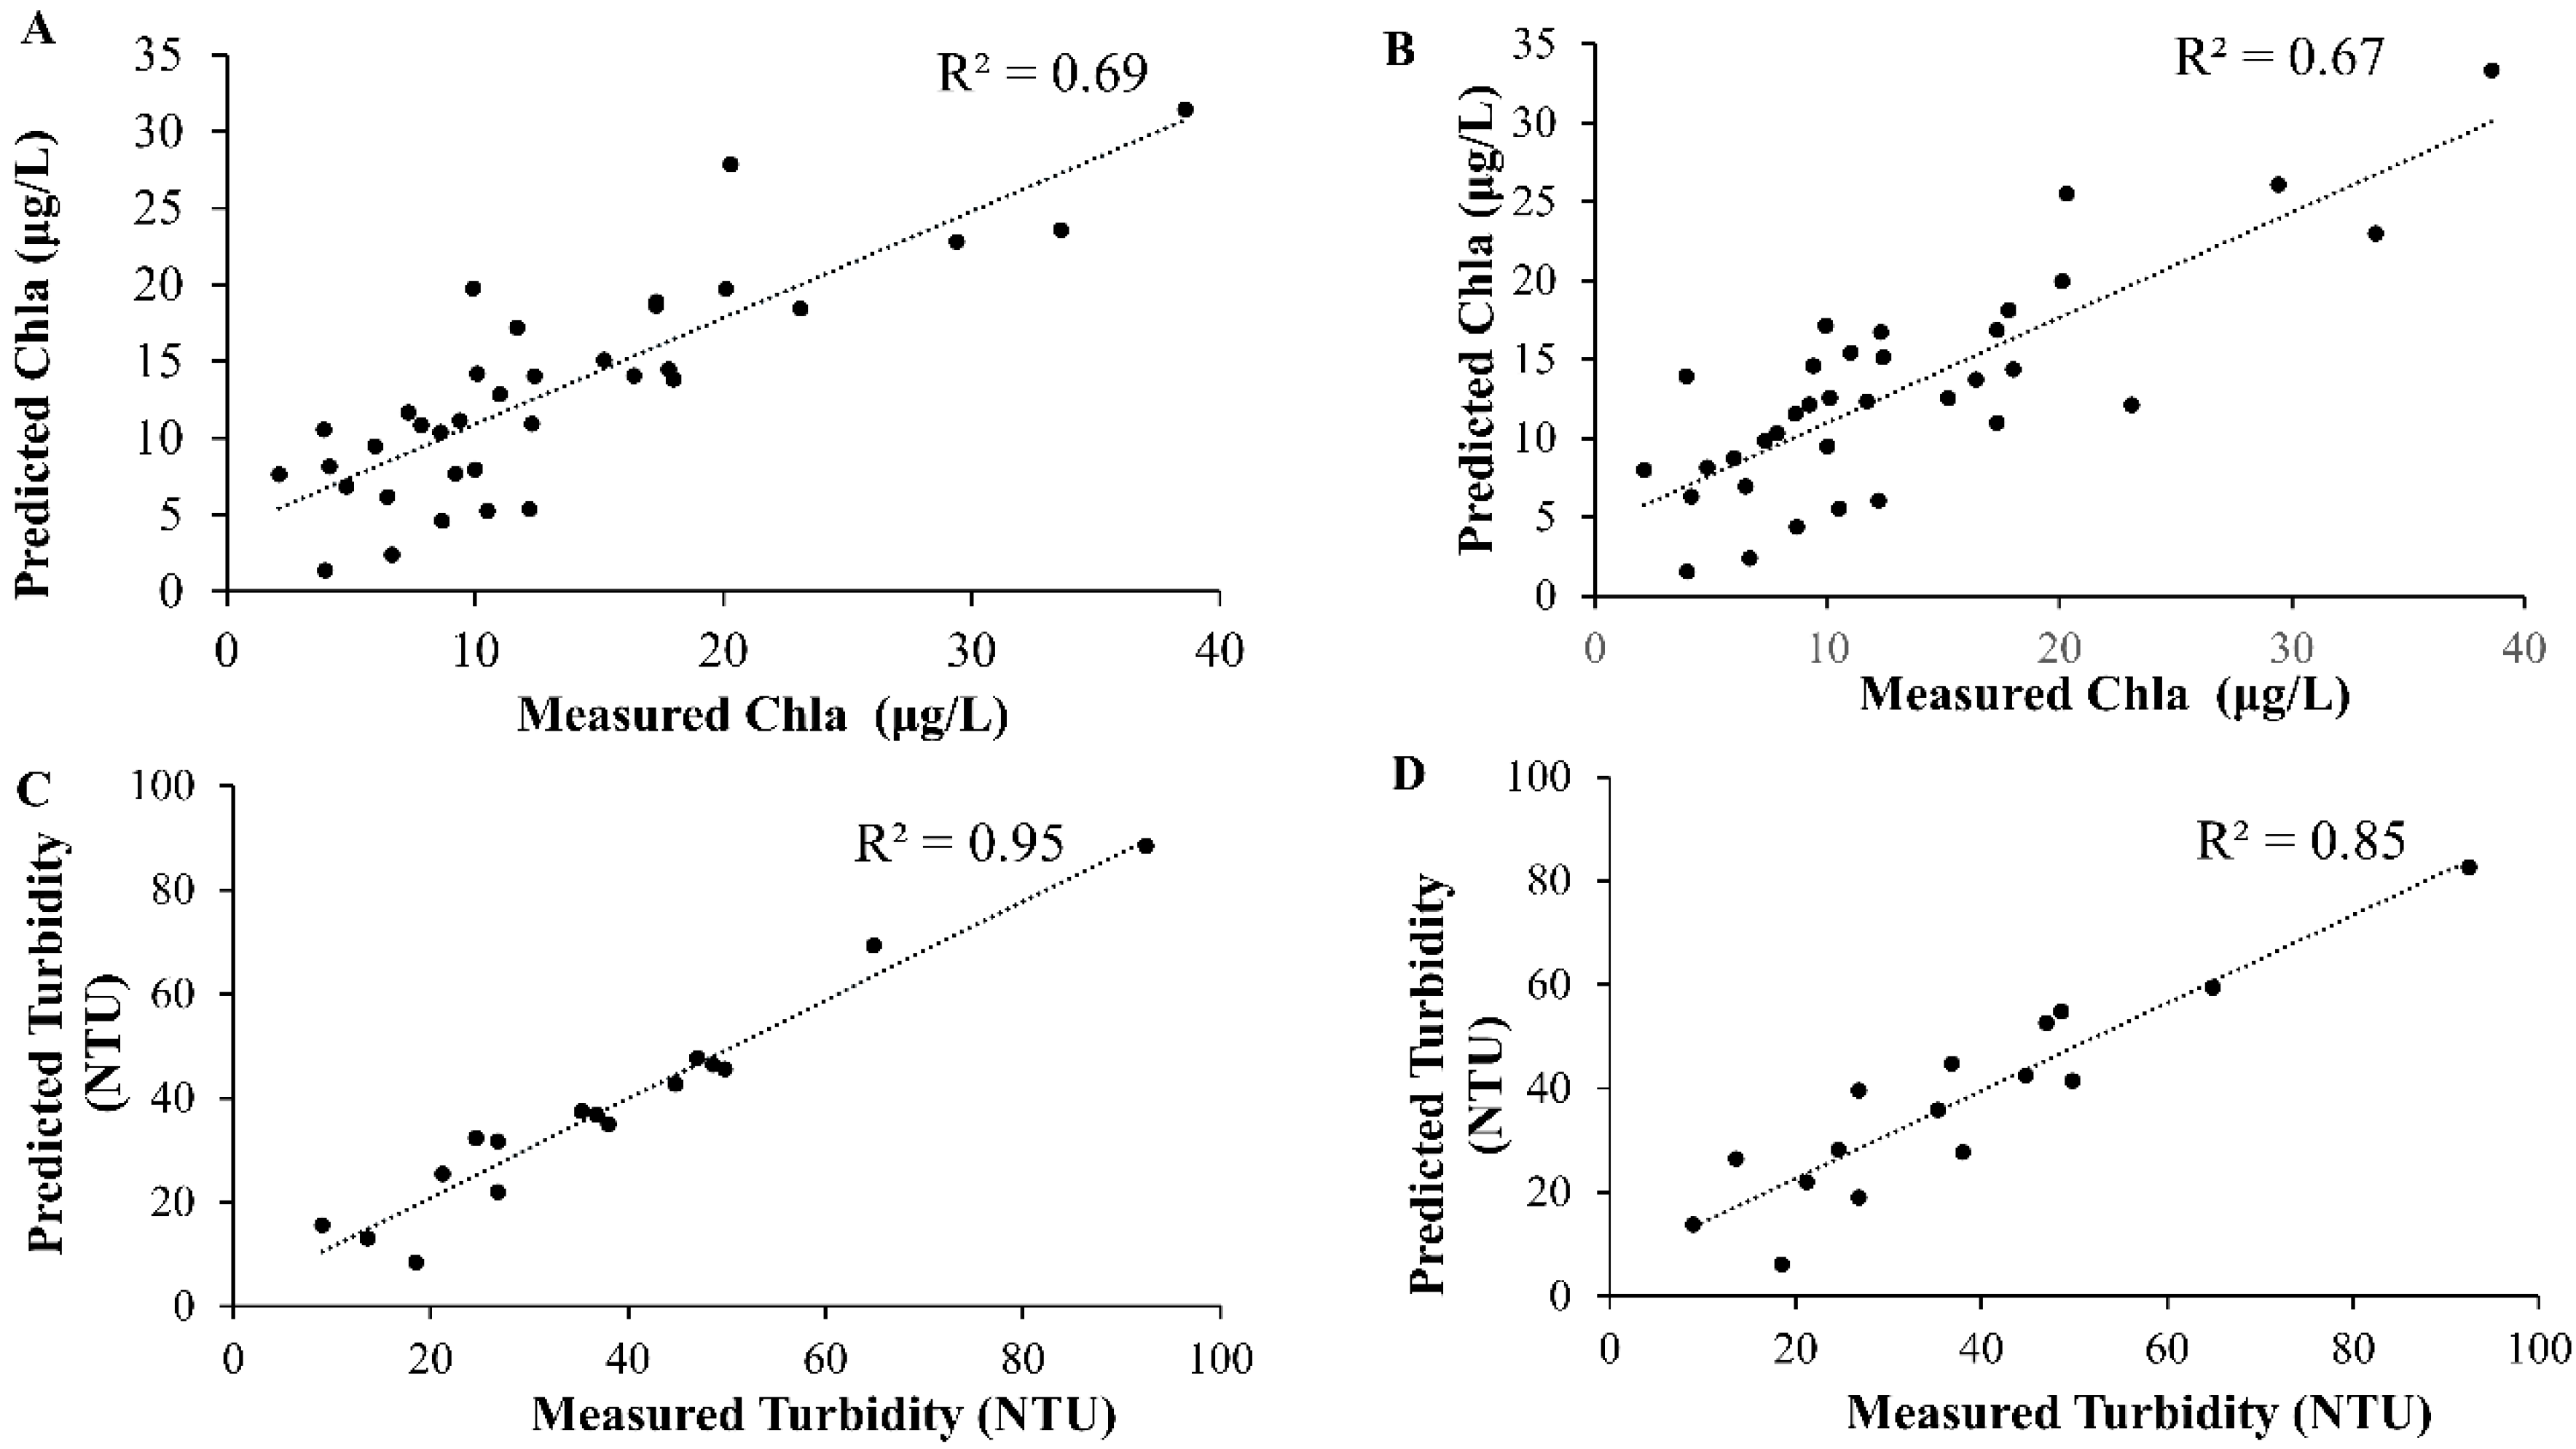
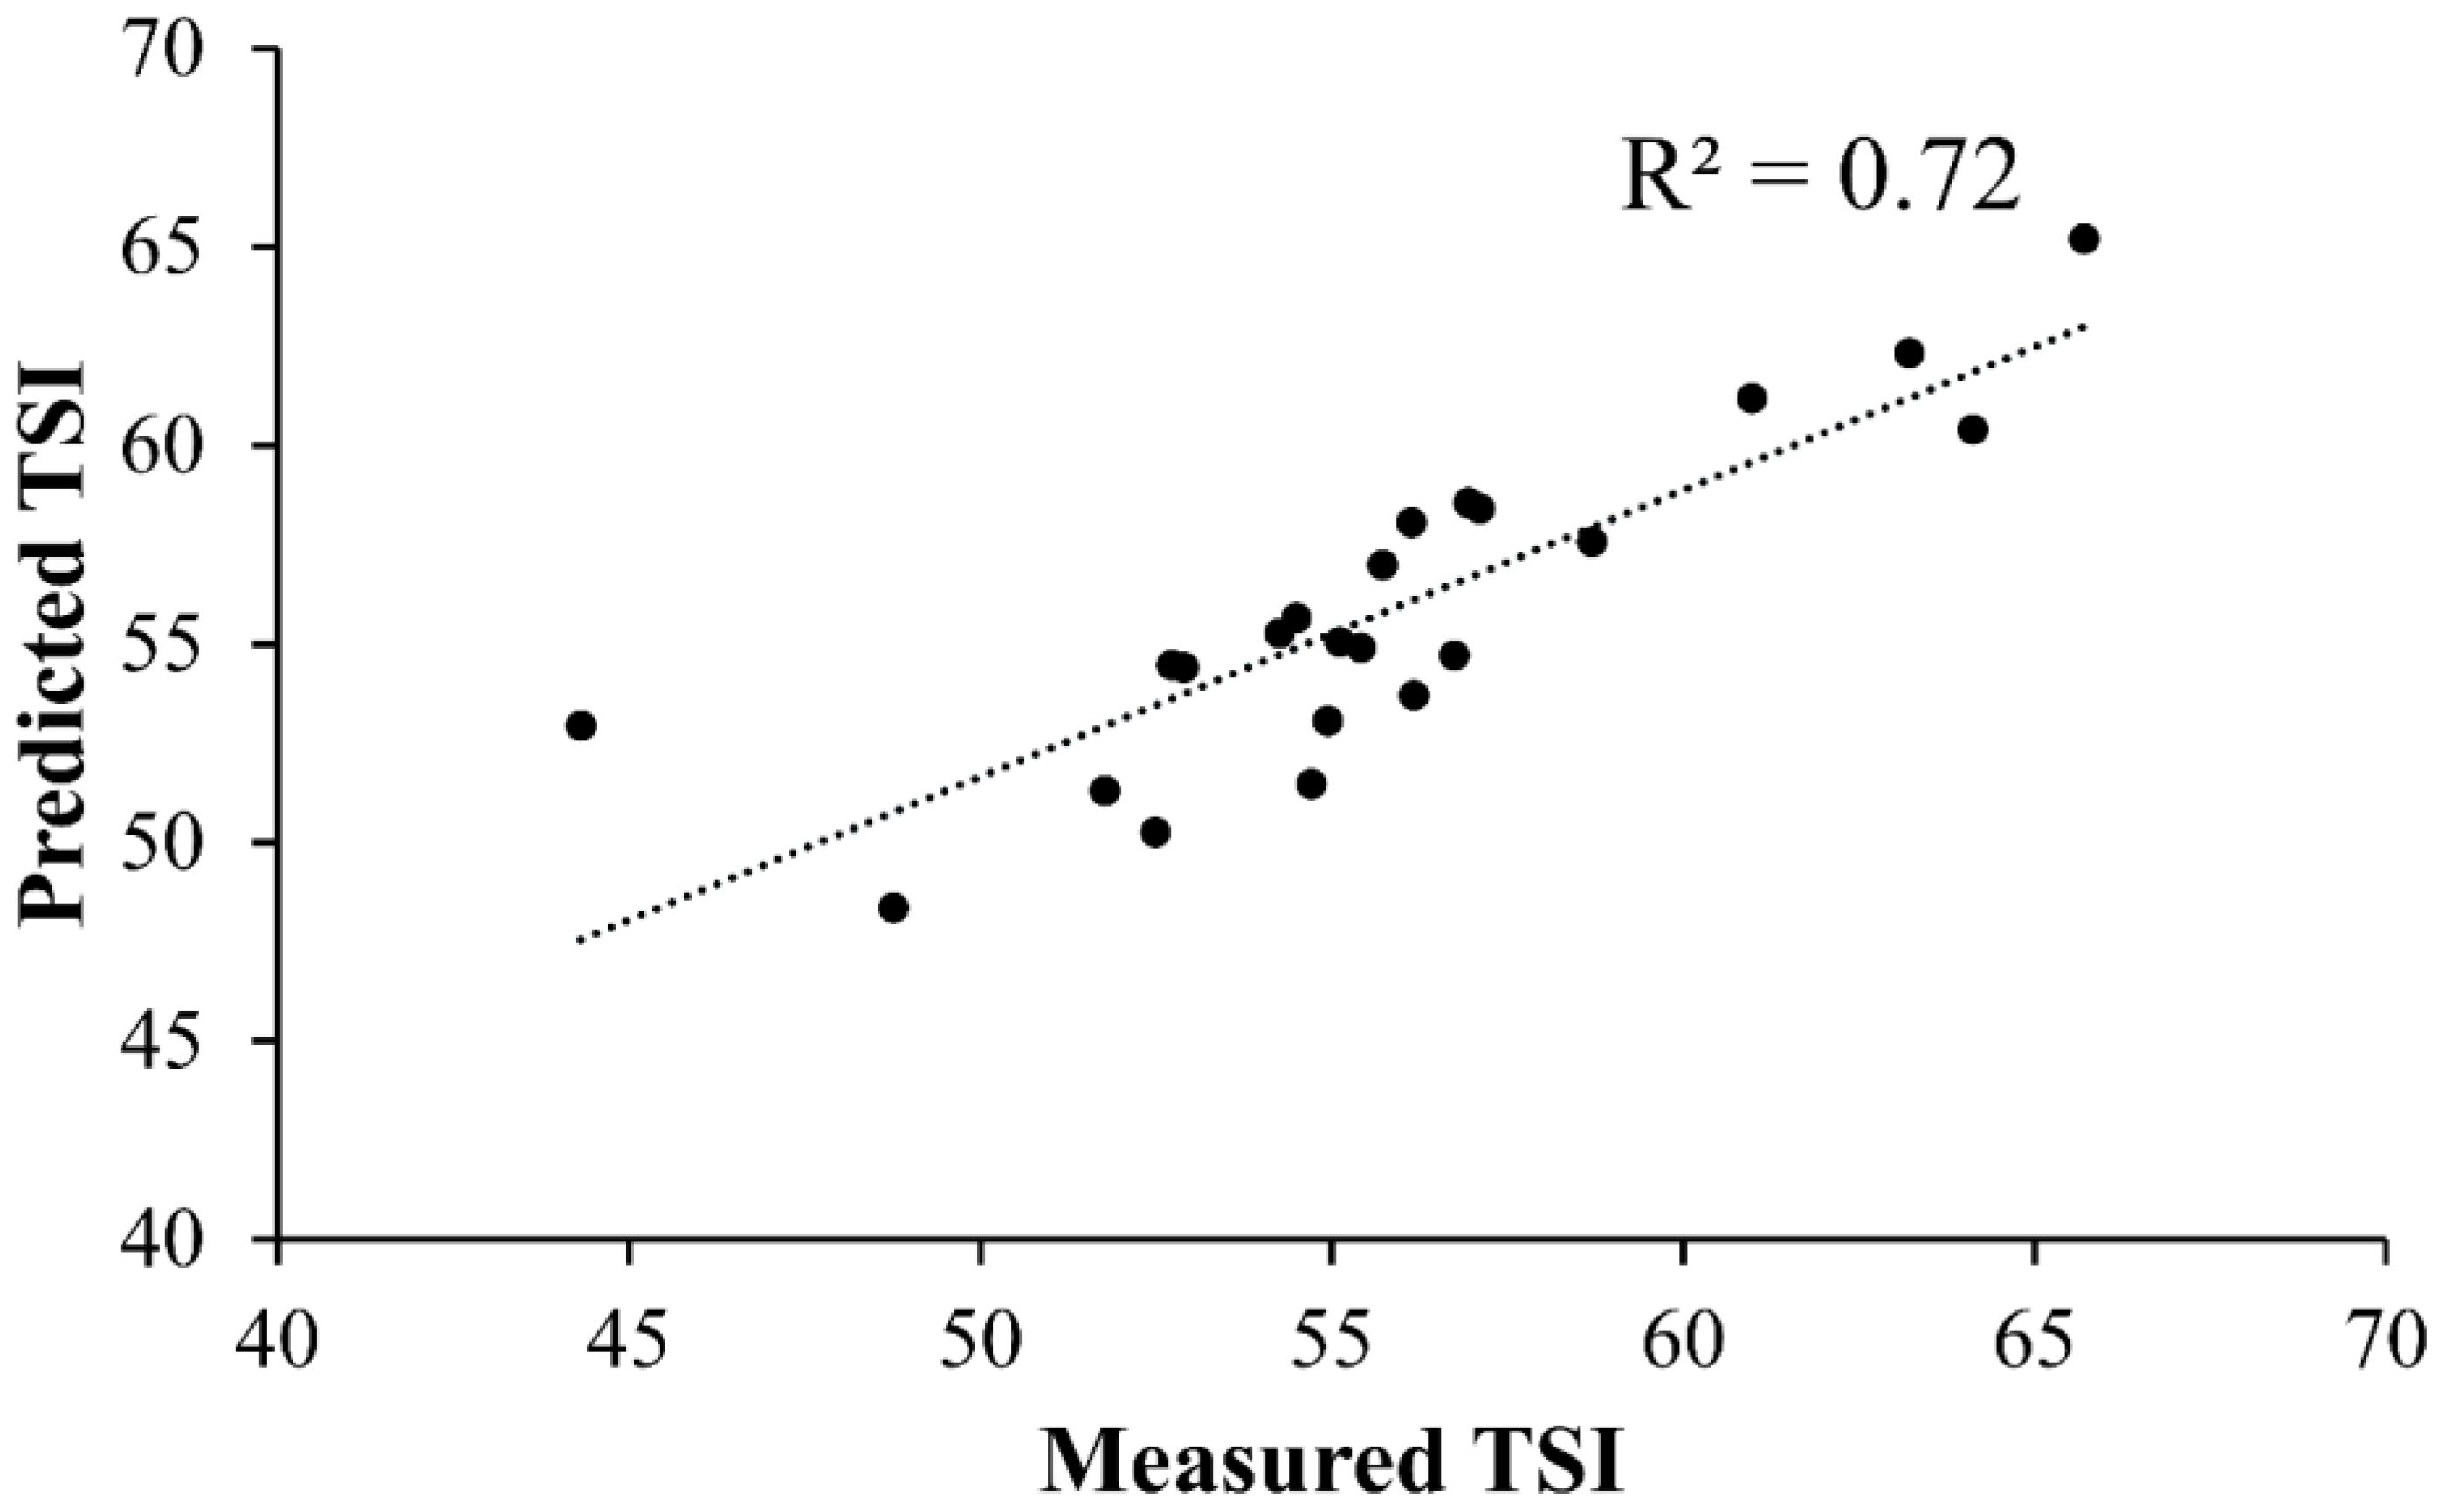
The model validation with a withheld dataset (25%) showed strong agreement between predicted and measured values (Figure 5 and Figure 6). For Chla, R2 values were 0.69 for the individual-band model and 0.67 for the spectral ratio model, with approximately 80% of values below the 20 µg/L USEPA threshold, implying that not all sections of the lake were polluted as per the threshold limits. For turbidity, R2 values were 0.95 (individual band) and 0.85 (spectral ratio). TSI predictions showed a strong linear relationship with measured values, with an R2 value of 0.72 as shown in Figure 6.

4. Discussion

4.1. On-Site Assessment of Water Quality Parameters

The decade-long dataset (2013–2023) for Lake Okeechobee confirms that the system remains nutrient-rich, with Chla, TN, and TP often exceeding USEPA and FDEP thresholds [26]. This persistent eutrophic to hypereutrophic state reflects both chronic watershed nutrient inputs and internal lake processes. In particular, the sustained exceedance of TN and TP criteria from 2016 onward suggests that, despite existing nutrient management strategies [65,66], reductions at the watershed scale have been insufficient to reverse enrichment trends. Similar persistence of elevated nutrient concentrations has been reported in other large, shallow lakes, including Lake Taihu (China) and Lake Erie (USA), where nutrient legacy effects and sediment nutrient release maintain high trophic state even after point-source controls are implemented [67,68].
Seasonal hydrology and climatic events appear to be major modulators of the observed water quality dynamics. High Chla years in the latter half of the decade coincide with above-average precipitation and warmer temperatures, which increase watershed runoff and create conditions favorable for algal proliferation [6,14]. The 2017 TP spike aligns with Hurricane Irma, whose strong winds and waves likely resuspended phosphorus-rich sediments, consistent with findings from [69] showing hurricane-driven nutrient pulses in Florida lakes. Wind-driven sediment resuspension is particularly impactful in Lake Okeechobee due to its large fetch and shallow depth, which limit vertical stratification and allow wind events to mix bottom sediments throughout the water column.
Turbidity patterns tracked closely with Chla during bloom years but also showed distinct non-algal peaks during high-wind or high-inflow events [3,70]. This dual origin, algal particles and mineral sediments, has also been documented in Lake Winnipeg [71], where turbidity increases can both precede and follow blooms depending on hydrodynamic conditions. The spatial separation of turbidity maxima in the central basin from Chla maxima in nearshore zones suggests different dominant drivers: sediment resuspension offshore and nutrient-rich inflows nearshore.
Nutrient source tracking studies have repeatedly identified the Kissimmee River as a major contributor of both nitrogen and phosphorus to Lake Okeechobee [72,73,74]. Our findings align with these assessments, as elevated nearshore nutrient concentrations and hypereutrophic TSI zones frequently appear in the river’s outflow region. Internal phosphorus cycling, driven by anoxic sediment release during warm, calm periods, likely contributes to sustaining high TP even when external loads are temporarily reduced [12]. This reinforces the conclusion from multiple Florida studies that both watershed and in-lake interventions are necessary for meaningful trophic state improvements.

4.2. Remote Sensing Correlations and Model Performance

The strong correlations between in situ water quality data and Landsat 8/9 reflectance confirm the suitability of these platforms for long-term monitoring in large, optically complex lakes. Turbidity models, with adjusted R2 up to 0.93, outperformed Chla models, which is consistent with previous work showing that suspended sediments produce a stronger and more consistent spectral signal than algal pigments [54,58]. The high accuracy for turbidity likely reflects the strong SWIR and NIR reflectance contrast between suspended solids and water.
Chla model performance (adjusted R2~0.69) was robust for low to moderate concentrations (2–40 µg/L) but may underestimate extreme bloom conditions due to spectral saturation and the complex optical effects of surface scums. This limitation is common in remote sensing of eutrophic waters [75], and can be addressed through bloom-specific calibrations or hyperspectral approaches capable of resolving pigment absorption features.
The TSI model achieved moderate accuracy (adjusted R2~0.66), reflecting the fact that TSI integrates multiple variables; Chla, Secchi depth, and TP, not all of which are directly sensed optically. Nevertheless, the ability to approximate a trophic index from satellite data offers a valuable advantage over traditional point sampling, particularly for mapping spatial heterogeneity.
Interestingly, individual-band models slightly outperformed spectral ratio models for both Chla and turbidity in this study. This contrasts with findings from clearer lakes where ratio algorithms improve performance by normalizing for atmospheric variability [34]. The lower relative gain from ratios here likely reflects the dominance of strong, direct optical signals from high concentrations of particulate matter, which can overwhelm finer spectral differences. While minor radiometric and geometric differences exist between the OLI (Landsat 8) and OLI-2 (Landsat 9) sensors, such as slight spectral band shifts and calibration refinements, previous studies have shown these differences have minimal effect on aquatic reflectance retrievals after standard atmospheric correction [32,52]. This supports our approach of combining Landsat 8 and 9 observations to maximize temporal coverage and maintain a continuous monitoring record.

4.3. Spatial Patterns and Ecological Drivers

The spatial maps derived from the models illustrate how hydrology, wind patterns, and nutrient sources shape water quality distribution. Chla hotspots along the western and southern shorelines are consistent with the location of major inflows, including the Kissimmee River and agricultural drainage canals [6]. These zones often maintain hypereutrophic conditions year-round, suggesting localized nutrient retention and recycling.
Central-lake turbidity peaks are consistent with wind-driven resuspension, with maximum intensity in the long fetch areas of the northeast–southwest axis [3]. In some years, high-turbidity plumes extend toward shorelines, potentially interacting with nutrient-rich nearshore zones to facilitate bloom development. The expansion of hypereutrophic TSI zones under certain wind and inflow conditions highlights the role of physical transport in redistributing biomass and suspended matter.
These spatial patterns match observations in other shallow lakes [76] where wind mixing and river inflows create persistent nearshore-offshore gradients. Importantly, such gradients challenge the representativeness of single-point monitoring programs and underscore the operational advantage of synoptic remote sensing.

4.4. Applications for Management and Monitoring

The combined use of in situ and Landsat-derived estimates offers a scalable, cost-effective approach for routine monitoring of large lakes. For Lake Okeechobee, where bloom formation has major ecological and socioeconomic consequences, early detection of elevated Chla at sub-bloom levels could allow water managers to implement preventive measures before blooms reach hazardous thresholds. Integration of remote sensing into state and federal monitoring frameworks could also improve spatial targeting of nutrient reduction projects, directing resources to persistent hotspot areas.
Beyond local applications, these methods are transferable to other subtropical and temperate lakes facing similar eutrophication pressures. The reliance on freely available Landsat imagery ensures long-term continuity and comparability across systems, a benefit also recognized by [29,36] in similar applications for Sentinel-3 and MERIS.

4.5. Limitations and Future Directions

Despite their strong performance, these models have limitations. The 16-day revisit time of Landsat, compounded by cloud cover, limits temporal resolution and may miss short-lived bloom events [77]. The models are calibrated primarily for low to moderate Chla and may not fully capture extreme bloom conditions. TSI prediction is constrained by the indirect sensing of some components, and atmospheric correction accuracy can influence model outputs, especially under hazy or partly cloudy conditions [78].
While multiple regression models offer interpretability and are suitable for datasets of limited size, they can be sensitive to multicollinearity among predictor variables, which may inflate variance estimates and reduce model stability. Additionally, these models assume a linear relationship between predictors and response variables, which may limit their ability to capture complex, non-linear interactions inherent in optically complex waters.
Future work could explore regularization approaches such as ridge regression and LASSO or non-linear machine learning models to address these issues while maintaining predictive accuracy. Furthermore, future work should explore integrating higher-frequency satellites such as Sentinel-2 MSI (5-day revisit) and upcoming hyperspectral missions like NASA’s PACE, which can better resolve pigment absorption features. Machine learning approaches (e.g., Random Forest, XGBoost) could also improve predictive accuracy, particularly with larger training datasets spanning a broader range of optical conditions [30]. Coupling remote sensing [78] outputs with hydrodynamic and watershed nutrient models would further enhance predictive capability, supporting adaptive management under changing climate and land-use regimes.

5. Conclusions

This study demonstrates that combining satellite remote sensing with targeted in situ sampling can effectively track the spatial and temporal dynamics of key water quality indicators in large freshwater systems. For Lake Okeechobee, retrieval algorithms developed from Landsat 8 and 9 imagery provided reliable estimates of chlorophyll-a (Chla), turbidity, and the Trophic State Index (TSI), with turbidity showing the strongest predictive performance and Chla models proving effective for detecting pre-bloom conditions below 40 µg/L.
The integration of individual-band and spectral-ratio approaches allowed us to balance accuracy with flexibility, supporting both high-precision hotspot detection and broader trophic state assessments. These capabilities are particularly valuable for a lake where nutrient and sediment inputs from agriculture, urban growth, and major tributaries such as the Kissimmee River continue to drive eutrophication pressures, even during periods of regulated nutrient application.
By moving beyond point-based sampling, the approach presented here enables managers to see where and when water quality deteriorates, respond earlier to potential bloom events, and target mitigation efforts more efficiently. Persistent challenges, such as cloud cover, revisit intervals, and the need for improved automation in cloud masking, can be addressed by integrating higher-frequency sensors like Sentinel-2, harmonizing Landsat–Sentinel data, and applying machine learning to extend monitoring to additional parameters, including nitrogen, phosphorus, and dissolved oxygen.
Sustained application of these tools, coupled with ongoing control of watershed nutrient sources and systematic monitoring of major inflows, offers a practical path toward maintaining and improving the ecological health of Lake Okeechobee. Beyond this case study, the methodology provides a transferable framework for cost-effective, large-scale monitoring of inland and coastal waters worldwide, especially in regions facing similar nutrient-driven water quality challenges. These recommendations align with the nutrient reduction strategies outlined in Florida’s Lake Okeechobee Basin Management Action Plan [79], which emphasizes targeted watershed nutrient controls, inflow monitoring, and adaptive management to improve water quality and reduce harmful algal blooms.

Author Contributions

M.K.: Writing—original draft, review and editing, methodology, data analysis, curation, and conclusion. I.O.: Writing—review and editing, discussion, and results. M.S.B.B.: Writing—review, supervision, methodology, investigation, data curation. All authors have read and agreed to the published version of the manuscript.

Funding

This research was partially funded by the NASA Florida Space Grant Consortium (FSGC) under the award number Task No. 04, FSGC-8, and FIU University Graduate School through the Dissertation Evidence Acquisition award.

Data Availability Statement

The original contributions presented in this study are included in the article. Further inquiries can be directed to the corresponding authors.

Acknowledgments

The authors are grateful for the help from Rafael Carbonell, Kimberly Gutierrez, Andrea Bustos, and Randy Leslie at Florida International University.

Conflicts of Interest

There are not any known competing financial interests or conflicts of interest that influenced this work.

References

  1. Kiwanuka, M.; Mutanda, H.E.; Niyomukiza, J.B.; Nakasagga, E. Assessment of suitability of drinking water from the springs in Urban slums of Kampala. Environ. Chall. 2023, 10, 100667. [Google Scholar] [CrossRef]
  2. Oyege, I.; Katwesigye, R.; Kiwanuka, M.; Mutanda, H.E.; Niyomukiza, J.B.; Kataraihya, D.J.; Kica, S.; Egor, M. Temporal trends of water quality parameters, heavy metals, microplastics, and emerging organic pollutants in Lake Victoria and its basin: Knowns, knowledge gaps, and future directions. Environ. Nanotechnol. Monit. Manag. 2024, 22, 100962. [Google Scholar] [CrossRef]
  3. Wang, M.; Nim, C.J.; Son, S.; Shi, W. Characterization of turbidity in Florida’s Lake Okeechobee and Caloosahatchee and St. Lucie estuaries using MODIS-Aqua measurements. Water Res. 2012, 46, 5410–5422. [Google Scholar] [CrossRef] [PubMed]
  4. Paerl, H.W.; Paul, V.J. Climate change: Links to global expansion of harmful cyanobacteria. Water Res. 2012, 46, 1349–1363. [Google Scholar] [CrossRef]
  5. O’Neil, J.M.; Davis, T.W.; Burford, M.A.; Gobler, C.J. The rise of harmful cyanobacteria blooms: The potential roles of eutrophication and climate change. Harmful Algae 2012, 14, 313–334. [Google Scholar] [CrossRef]
  6. Lapointe, B.E.; Brewton, R.A.; McFarland, M.N.; Stockley, N. Nutrient availability in a freshwater-to-marine continuum: Cyanobacterial blooms along the Lake Okeechobee Waterway. Harmful Algae 2024, 139, 102710. [Google Scholar] [CrossRef]
  7. Zeman-Kuhnert, S.; Thiel, V.; Heim, C. Effects of Weather Extremes on the Nutrient Dynamics of a Shallow Eutrophic Lake as Observed during a Three-Year Monitoring Study. Water 2022, 14, 2032. [Google Scholar] [CrossRef]
  8. Canfield, D.E., Jr.; Bachmann, R.W.; Hoyer, M.V. Restoration of Lake Okeechobee, Florida: Mission impossible? Lake Reserv. Manag. 2020, 37, 95–111. [Google Scholar] [CrossRef]
  9. Paerl, H. Nutrient and Other Environmental Controls of Harmful Cyanobacterial Blooms Along the Freshwater–Marine Continuum. In Cyanobacterial Harmful Algal Blooms: State of the Science and Research Needs; Springer: New York, NY, USA, 2008; Volume 619, pp. 217–237. [Google Scholar]
  10. Duan, H.; Ma, R.; Xu, X.; Kong, F.; Zhang, S.; Kong, W.; Hao, J.; Shang, L. Two-decade reconstruction of algal blooms in China’s Lake Taihu. Environ. Sci. Technol. 2009, 43, 3522–3528. [Google Scholar] [CrossRef]
  11. Xu, Y.; Schroth, A.W.; Isles, P.D.; Rizzo, D.M. Quantile regression improves models of lake eutrophication with implications for ecosystem-specific management. Freshw. Biol. 2015, 60, 1841–1853. [Google Scholar] [CrossRef]
  12. James, R.T.; Pollman, C.D. Sediment and nutrient management solutions to improve the water quality of Lake Okeechobee. Lake Reserv. Manag. 2011, 27, 28–40. [Google Scholar] [CrossRef]
  13. Boggess, W.G.; Johns, G.; Meline, C. Economic impacts of water quality programs in the Lake Okeechobee watershed of Florida. J. Dairy Sci. 1997, 80, 2682–2691. [Google Scholar] [CrossRef]
  14. Hajigholizadeh, M.; Moncada, A.; Kent, S.; Melesse, A.M. Land–lake linkage and remote sensing application in water quality monitoring in lake okeechobee, Florida, USA. Land 2021, 10, 147. [Google Scholar] [CrossRef]
  15. McCormick, P.V.; James, R.T. Okeechobee, Lake, Florida, USA. In Encyclopedia of Lakes and Reservoirs; Bengtsson, L., Herschy, R.W., Fairbridge, R.W., Eds.; Springer: Dordrecht, The Netherlands, 2012; pp. 581–585. [Google Scholar]
  16. Chowdhury, R.R.; Rose, S.; Ezan, F.; Sovadinová, I.; Babica, P.; Langouët, S. Hepatotoxicity of cyanotoxin microcystin-LR in human: Insights into mechanisms of action in the 3D culture model Hepoid-HepaRG. Environ. Pollut 2024, 342, 123047. [Google Scholar] [CrossRef] [PubMed]
  17. Konst, H.; McKercher, P.; Gorham, P.; Robertson, A.; Howell, J. Symptoms and pathology produced by toxic Microcystis aeruginosa NRC-1 in laboratory and domestic animals. Can. J. Comp. Med. Vet. Sci. 1965, 29, 221. [Google Scholar] [PubMed]
  18. Li, T.; Fan, X.; Cai, M.; Jiang, Y.; Wang, Y.; He, P.; Ni, J.; Mo, A.; Peng, C.; Liu, J. Advances in investigating microcystin-induced liver toxicity and underlying mechanisms. Sci Total Environ. 2023, 905, 167167. [Google Scholar] [CrossRef]
  19. Carmichael, W.W. Health effects of toxin-producing cyanobacteria: “The CyanoHABs”. Hum. Ecol. Risk Assess. Int. J. 2001, 7, 1393–1407. [Google Scholar] [CrossRef]
  20. Dawson, R. The toxicology of microcystins. Toxicon 1998, 36, 953–962. [Google Scholar] [CrossRef]
  21. Vincent, R.K.; Qin, X.; McKay, R.M.L.; Miner, J.; Czajkowski, K.; Savino, J.; Bridgeman, T. Phycocyanin detection from LANDSAT TM data for mapping cyanobacterial blooms in Lake Erie. Remote Sens. Environ. 2004, 89, 381–392. [Google Scholar] [CrossRef]
  22. Schaefer, A.M.; Yrastorza, L.; Stockley, N.; Harvey, K.; Harris, N.; Grady, R.; Sullivan, J.; McFarland, M.; Reif, J.S. Exposure to microcystin among coastal residents during a cyanobacteria bloom in Florida. Harmful Algae 2020, 92, 101769. [Google Scholar] [CrossRef]
  23. Kramer, B.J.; Davis, T.W.; Meyer, K.A.; Rosen, B.H.; Goleski, J.A.; Dick, G.J.; Oh, G.; Gobler, C.J. Nitrogen limitation, toxin synthesis potential, and toxicity of cyanobacterial populations in Lake Okeechobee and the St. Lucie River Estuary, Florida, during the 2016 state of emergency event. PLoS ONE 2018, 13, e0196278. [Google Scholar] [CrossRef]
  24. Mokoena, M. Microcystins in water containers used in the home: A review of their potential health effects. Ecotoxicol. Environ. Saf. 2024, 269, 115787. [Google Scholar] [CrossRef]
  25. HealthCanada Guidelines for Canadian Recreational Water Quality Cyanobacteria and Their Toxins: Guideline Technical Document. 2022. Available online: https://www.canada.ca/en/health-canada/services/publications/healthy-living/guidance-canadian-recreational-water-quality-cyanobacteria-toxins.html (accessed on 25 October 2024).
  26. EPA. Water Quality Standards for the State of Florida’s Lakes and Flowing Waters. Retrieved from EPA Water: Regulatory Information. 2010. Available online: http://water.epa.gov/lawsregs/rulesregs/florida_factsheet.cfm (accessed on 20 July 2024).
  27. Baltodano, A.; Agramont, A.; Lekarkar, K.; Spyrakos, E.; Reusen, I.; van Griensven, A. Exploring global remote sensing products for water quality assessment: Lake Nicaragua case study. Remote Sens. Appl. Soc. Environ. 2024, 36, 101331. [Google Scholar] [CrossRef]
  28. Kintu, I.M.; Gidudu, A.; Letaru, L. Assessment of Lake Victoria’s Trophic Status Using Satellite-Derived Secchi Disk Depth. In Earth Observations and Geospatial Science in Service of Sustainable Development Goals: 12th International Conference of the African Association of Remote Sensing and the Environment; Springer: Cham, The Netherlands, 2019; pp. 79–87. [Google Scholar]
  29. Tang, Y.; Feng, Y.; Fung, S.; Xomchuk, V.R.; Jiang, M.; Moore, T.; Beckler, J. Spatiotemporal deep-learning-based algal bloom prediction for Lake Okeechobee using multisource data fusion. IEEE J. Sel. Top. Appl. Earth Obs. Remote Sens. 2022, 15, 8318–8331. [Google Scholar] [CrossRef]
  30. Bagherian, K.; Fernández-Figueroa, E.G.; Rogers, S.R.; Wilson, A.E.; Bao, Y. Predicting chlorophyll-a concentration and harmful algal blooms in Lake Okeechobee using time-series MODIS satellite imagery and long short-term memory. J. Asabe 2024, 67, 1191–1202. [Google Scholar] [CrossRef]
  31. Jacek; Agnieszka, W.; Iwona, B.; Waldemar, G.; Katarzyna, L.-M.; Magda, Ł.; Sylwia, Ś.; Bożena, W.; Marek, Z. Application of Landsat 8 imagery to regional-scale assessment of lake water quality. Int. J. Appl. Earth Obs. Geoinf. 2016, 51, 28–36. [Google Scholar] [CrossRef]
  32. Kabir, S.; Nima, P.; Ryan, E.O.S.; Brian, B.B. Leveraging Landsat-8/-9 underfly observations to evaluate consistency in reflectance products over aquatic environments. Remote Sens. Environ. 2023, 296, 113755. [Google Scholar] [CrossRef]
  33. Liu, M.; Ling, H.; Wu, D.; Su, X.; Cao, Z. Sentinel-2 and Landsat-8 observations for harmful algae blooms in a small eutrophic lake. Remote Sens. 2021, 13, 4479. [Google Scholar] [CrossRef]
  34. Hu, M.; Ma, R.; Cao, Z.; Xiong, J.; Xue, K. Remote estimation of trophic state index for inland waters using Landsat-8 OLI imagery. Remote Sens. 2021, 13, 1988. [Google Scholar] [CrossRef]
  35. Kiwanuka, M.; Balaji, B.M.S.; Leslie, R. Developing Satellite Remote Sensing Models for Water Quality Monitoring on Lake Victoria Region of Uganda. In AGU Fall Meeting Abstracts; American Geophysical Union: Washington, DC, USA, 2024; Volume 2024, p. H11K-0826. [Google Scholar]
  36. Seegers, B.N.; Werdell, P.J.; Vandermeulen, R.A.; Salls, W.; Stumpf, R.P.; Schaeffer, B.A.; Owens, T.J.; Bailey, S.W.; Scott, J.P.; Loftin, K.A. Satellites for long-term monitoring of inland US lakes: The MERIS time series and application for chlorophyll-a. Remote Sens. Environ. 2021, 266, 112685. [Google Scholar] [CrossRef]
  37. Zhang, Y.; Lin, S.; Qian, X.; Wang, Q.g.; Qian, Y.; Liu, J.; Ge, Y. Temporal and spatial variability of chlorophyll a concentration in Lake Taihu using MODIS time-series data. Hydrobiologia 2011, 661, 235–250. [Google Scholar] [CrossRef]
  38. Ventura, D.L.T.; Martinez, J.-M.; de Attayde, J.L.; Martins, E.S.P.R.; Brandini, N.; Moreira, L.S. Long-Term Series of Chlorophyll-a Concentration in Brazilian Semiarid Lakes from Modis Imagery. Water 2022, 14, 400. [Google Scholar] [CrossRef]
  39. Chowdhury, M.; Vilas, C.; van Bergeijk, S.; Navarro, G.; Laiz, I.; Caballero, I. Monitoring turbidity in a highly variable estuary using Sentinel 2-A/B for ecosystem management applications. Front. Mar. Sci. 2023, 10, 1186441. [Google Scholar] [CrossRef]
  40. Delegido, J.; Urrego, P.; Vicente, E.; Sòria-Perpinyà, X.; Soria, J.; Pereira-Sandoval, M.; Ruiz-Verdú, A.; Peña, R.; Moreno, J. Turbidity and Secchi disc depth with Sentinel-2 in different trophic status reservoirs at the Comunidad Valenciana. Rev. Teledetección 2019, 54, 15–24. [Google Scholar] [CrossRef]
  41. Lock, M.; Saintilan, N.; van Duren, I.; Skidmore, A. Monitoring coastal water body health with Sentinel-2 MSI imagery. Remote Sens. 2023, 15, 1734. [Google Scholar] [CrossRef]
  42. Pizani, F.M.; Maillard, P.; Ferreira, A.F.; de Amorim, C.C. Estimation of water quality in a reservoir from Sentinel-2 MSI and Landsat-8 OLI sensors. ISPRS Ann. Photogramm. Remote Sens. Spat. Inf. Sci. 2020, 3, 401–408. [Google Scholar] [CrossRef]
  43. Bhaskar, M.S.; Gidudu, A. Effect of landscape changes on the water quality of Murchison bay. Int. J. Adv. Remote Sens. GIS 2020, 9, 3350–3363. [Google Scholar] [CrossRef]
  44. Cao, Z.; Ma, R.; Liu, M.; Duan, H.; Xiao, Q.; Xue, K.; Shen, M. Harmonized chlorophyll-a retrievals in inland lakes from Landsat-8/9 and Sentinel 2A/B virtual constellation through machine learning. IEEE Trans. Geosci. Remote Sens. 2022, 60, 1–16. [Google Scholar] [CrossRef]
  45. Boucher, J.; Weathers, K.C.; Norouzi, H.; Steele, B. Assessing the effectiveness of Landsat 8 chlorophyll a retrieval algorithms for regional freshwater monitoring. Ecol. Appl. 2018, 28, 1044–1054. [Google Scholar] [CrossRef]
  46. Kayastha, P.; Dzialowski, A.R.; Stoodley, S.H.; Wagner, K.L.; Mansaray, A.S. Effect of time window on satellite and ground-based data for estimating chlorophyll-a in reservoirs. Remote Sens. 2022, 14, 846. [Google Scholar] [CrossRef]
  47. Torbick, N.; Corbiere, M. A multiscale mapping assessment of lake champlain cyanobacterial harmful algal blooms. Int. J. Environ. Res. Public Health 2015, 12, 11560–11578. [Google Scholar] [CrossRef]
  48. Lillesand, T.; Kiefer, R.W.; Chipman, J. Remote Sensing and Image Interpretation; John Wiley & Sons: Hoboken, NJ, USA, 2015. [Google Scholar]
  49. O’Reilly, J.E.; Maritorena, S.; Mitchell, B.G.; Siegel, D.A.; Carder, K.L.; Garver, S.A.; Kahru, M.; McClain, C. Ocean color chlorophyll algorithms for SeaWiFS. J. Geophys. Res. Ocean. 1998, 103, 24937–24953. [Google Scholar] [CrossRef]
  50. Smith, B.; Pahlevan, N.; Schalles, J.; Ruberg, S.; Errera, R.; Ma, R.; Giardino, C.; Bresciani, M.; Barbosa, C.; Moore, T. A chlorophyll-a algorithm for Landsat-8 based on mixture density networks. Front. Remote Sens. 2021, 1, 623678. [Google Scholar] [CrossRef]
  51. Nojavan, F.; Kreakie, B.J.; Hollister, J.W.; Qian, S.S. Rethinking the lake trophic state index. PeerJ 2019, 7, e7936. [Google Scholar] [CrossRef] [PubMed]
  52. Xu, T.; Yang, T.; Zheng, X.; Li, Z.; Qin, Y. Growth limitation status and its role in interpreting chlorophyll a response in large and shallow lakes: A case study in Lake Okeechobee. J. Environ. Manag. 2022, 302, 114071. [Google Scholar] [CrossRef]
  53. DBHYDRO Database; South Florida Water Management District: West Palm Beach, FL, USA, 2023.
  54. Olmanson, L.G.; Bauer, M.E.; Brezonik, P.L. A 20-year Landsat water clarity census of Minnesota’s 10,000 lakes. Remote Sens. Environ. 2008, 112, 4086–4097. [Google Scholar] [CrossRef]
  55. Kloiber, S.M.; Brezonik, P.L.; Olmanson, L.G.; Bauer, M.E. A procedure for regional lake water clarity assessment using Landsat multispectral data. Remote Sens. Environ. 2002, 82, 38–47. [Google Scholar] [CrossRef]
  56. Tan, W.; Liu, P.; Liu, Y.; Yang, S.; Feng, S. A 30-year assessment of phytoplankton blooms in Erhai Lake using Landsat imagery: 1987 to 2016. Remote Sens. 2017, 9, 1265. [Google Scholar] [CrossRef]
  57. Darryl, K.; Jennifer, R.; Jason, G.; Brian, Z.; Mike, C.; Glen, T.; Joseph Bishop, a. Monitoring algal blooms in drinking water reservoirs using the Landsat-8 Operational Land Imager. Int. J. Remote Sens. 2018, 39, 2818–2846. [Google Scholar] [CrossRef] [PubMed]
  58. Gholizadeh, M.; Melesse, A. Study on spatiotemporal variability of water quality parameters in Florida Bay using remote sensing. J. Remote Sens. GIS 2017, 6, 100207. [Google Scholar] [CrossRef]
  59. Gholizadeh, M.H.; Melesse, A.M.; Reddi, L. Water quality assessment and apportionment of pollution sources using APCS-MLR and PMF receptor modeling techniques in three major rivers of South Florida. Sci. Total Environ. 2016, 566, 1552–1567. [Google Scholar] [CrossRef]
  60. Tyler, A.N.; Hunter, P.D.; Spyrakos, E.; Groom, S.; Constantinescu, A.M.; Kitchen, J. Developments in Earth observation for the assessment and monitoring of inland, transitional, coastal and shelf-sea waters. Sci. Total Environ. 2016, 572, 1307–1321. [Google Scholar] [CrossRef]
  61. Odermatt, D.; Gitelson, A.; Brando, V.E.; Schaepman, M. Review of constituent retrieval in optically deep and complex waters from satellite imagery. Remote Sens. Environ. 2012, 118, 116–126. [Google Scholar] [CrossRef]
  62. Matthews, M.W. A current review of empirical procedures of remote sensing in inland and near-coastal transitional waters. Int. J. Remote Sens. 2011, 32, 6855–6899. [Google Scholar] [CrossRef]
  63. Shi, K.; Zhang, Y.; Song, K.; Liu, M.; Zhou, Y.; Zhang, Y.; Li, Y.; Zhu, G.; Qin, B. A semi-analytical approach for remote sensing of trophic state in inland waters: Bio-optical mechanism and application. Remote Sens. Environ. 2019, 232, 111349. [Google Scholar] [CrossRef]
  64. Mary, P.; Joe, H.; Linda, L. Water-Quality Assessment for the State of Florida; Florida Department of Environmental Protection: Tallahessee, FL, USA, 1996; p. 317. [Google Scholar]
  65. Khare, Y.P.; Paudel, R.; Wiederholt, R.; Abiy, A.Z.; Van Lent, T.; Davis, S.E.; Her, Y. Watershed Response to Legacy Phosphorus and Best Management Practices in an Impacted Agricultural Watershed in Florida, U.S.A. Land 2021, 10, 977. [Google Scholar] [CrossRef]
  66. Pei, M.; Li, Z.; William, J.M. Investigating sources and transformations of nitrogen using dual stable isotopes for Lake Okeechobee restoration in Florida. Ecol. Eng. 2020, 155, 105947. [Google Scholar] [CrossRef]
  67. Mohamed, M.N.; Wellen, C.; Parsons, C.T.; Taylor, W.D.; Arhonditsis, G.; Chomicki, K.M.; Boyd, D.; Weidman, P.; Mundle, S.O.; Cappellen, P.V. Understanding and managing the re-eutrophication of Lake Erie: Knowledge gaps and research priorities. Freshw. Sci. 2019, 38, 675–691. [Google Scholar] [CrossRef]
  68. Paerl, H.W.; Havens, K.E.; Xu, H.; Zhu, G.; McCarthy, M.J.; Newell, S.E.; Scott, J.T.; Hall, N.S.; Otten, T.G.; Qin, B. Mitigating eutrophication and toxic cyanobacterial blooms in large lakes: The evolution of a dual nutrient (N and P) reduction paradigm. Hydrobiologia 2020, 847, 4359–4375. [Google Scholar] [CrossRef]
  69. Havens, K.E.; Fulton III, R.S.; Beaver, J.R.; Samples, E.E.; Colee, J. Effects of climate variability on cladoceran zooplankton and cyanobacteria in a shallow subtropical lake. J. Plankton Res. 2016, 38, 418–430. [Google Scholar] [CrossRef]
  70. Chang, N.-B.; Daranpob, A.; Yang, Y.J.; Jin, K.-R. Comparative data mining analysis for information retrieval of MODIS images: Monitoring lake turbidity changes at Lake Okeechobee, Florida. J. Appl. Remote Sens. 2009, 3, 033549. [Google Scholar] [CrossRef]
  71. Binding, C.; Greenberg, T.; McCullough, G.; Watson, S.; Page, E. An analysis of satellite-derived chlorophyll and algal bloom indices on Lake Winnipeg. J. Great Lakes Res. 2018, 44, 436–446. [Google Scholar] [CrossRef]
  72. Lapointe, B.E.; Barile, P.J.; Littler, M.M.; Littler, D.S. Macroalgal blooms on southeast Florida coral reefs: II. Cross-shelf discrimination of nitrogen sources indicates widespread assimilation of sewage nitrogen. Harmful Algae 2005, 4, 1106–1122. [Google Scholar] [CrossRef]
  73. Lefler, F.W.; Barbosa, M.; Zimba, P.V.; Smyth, A.R.; Berthold, D.E.; Laughinghouse, H.D. Spatiotemporal diversity and community structure of cyanobacteria and associated bacteria in the large shallow subtropical Lake Okeechobee (Florida, United States). Front. Microbiol. 2023, 14, 1219261. [Google Scholar] [CrossRef]
  74. Zhang, J.; Welch, Z.; Jones, P. Chapter 8B: Lake Okeechobee Watershed Annual Report. In 2020 South Florida Environmental Report; South Florida Water Management District: West Palm Beach, FL, USA, 2020; Volume 1. [Google Scholar]
  75. Matthews, M.W.; Bernard, S.; Robertson, L. An algorithm for detecting trophic status (chlorophyll-a), cyanobacterial-dominance, surface scums and floating vegetation in inland and coastal waters. Remote Sens. Environ. 2012, 124, 637–652. [Google Scholar] [CrossRef]
  76. Vinh, P.Q.; Ha, N.T.T.; Thao, N.T.P.; Linh, N.T.; Oanh, L.T.; Phuong, L.T.; Huyen, N.T.T. Monitoring the trophic state of shallow urban lakes using Landsat 8/OLI data: A case study of lakes in Hanoi (Vietnam). Front. Earth Sci. 2025, 19, 25–40. [Google Scholar] [CrossRef]
  77. Feng, L.; Hou, X.; Liu, J.; Zheng, C. Unrealistic phytoplankton bloom trends in global lakes derived from Landsat measurements. EarthArXiv 2020. [Google Scholar] [CrossRef]
  78. Liu, S.; Glamore, W.; Tamburic, B.; Morrow, A.; Johnson, F. Remote sensing to detect harmful algal blooms in inland waterbodies. Sci. Total Environ. 2022, 851, 158096. [Google Scholar] [CrossRef] [PubMed]
  79. Florida Department of Environmental Protection. Lake Okeechobee Basin Management Action Plan—Five-Year Review; Florida Department of Environmental Protection: Tallahassee, FL, USA, 2024; p. 59. [Google Scholar]
Figure 1. Lake Okeechobee with sampling stations (spread throughout the entire lake).
Remotesensing 17 03197 g001
Figure 2. The temporal changes in the concentrations of Chlorophyll-a (Chla), and Turbidity (A), Total Nitrogen (TN) and Total Phosphorus (TP) (B) from 2013 to 2023 using mean in situ data from all the sampled stations of Lake Okeechobee from 2013 to 2023.
Remotesensing 17 03197 g002
Figure 3. Spatial distribution of the Chlorophyll-a (A), Turbidity (B), and Trophic State Index (C) in Lake Okeechobee based on the best individual spectral band models (Chla and turbidity) and spectral ratio model for TSI applied to the 13 May 2015. Trophic state categories follow Carlson’s TSI classification: mesotrophic (TSI 40–50), eutrophic (TSI 50–70), hypereutrophic (TSI > 70).
Remotesensing 17 03197 g003
Figure 4. Spatial distribution of the Chlorophyll-a (A), Turbidity (B), and Trophic State Index (C) in Lake Okeechobee based on the best spectral ratio models applied to the 1 May 2021, Landsat 8 image. Trophic state categories follow Carlson’s TSI classification: mesotrophic (TSI 40–50), eutrophic (TSI 50–70), hypereutrophic (TSI > 70).
Remotesensing 17 03197 g004
Figure 5. Comparison of the measured vs. predicted values of the Chlorophyll-a (A,B), and Turbidity (C,D) in Lake Okeechobee using the surface reflectance individual band (A,C) and spectral ratio models (B,D).
Remotesensing 17 03197 g005
Figure 6. Comparison of the predicted vs. measured values of the Trophic State Index (TSI) of Lake Okeechobee using the spectral ratio model.
Remotesensing 17 03197 g006
Table 1. USEPA Water Quality Standards for Florida Lakes.
Lake TypeChla (μg/L)TN (mg/L)TP (mg/L)
Colored lakes201.270.05
Clear lakes, high alkalinity201.050.03
Clear lakes, low alkalinity60.510.01
Source: [26].
Table 2. Spectral wavelength ranges for Landsat 8 and 9 Operational Land Imager bands used in this study, each with a spatial resolution of 30 m.
BandsWavelength (µm)
Band 1—Aerosols0.43–0.45
Band 2—Blue0.45–0.51
Band 3—Green0.53–0.59
Band 4—Red0.64–0.67
Band 5—Near Infrared (NIR)0.85–0.88
Band 6—Shortwave Infrared (SWIR) 11.57–1.65
Band 7—Shortwave Infrared (SWIR) 22.11–2.29
Table 3. Regression Analysis and Model Summary of the Dark Object Subtracted (DOS) individual band and spectral ratio models developed for predicting the Chlorophyll-a, Turbidity, and Trophic State Index (TSI) of Lake Okeechobee.
ParameterModel TypeR2 (Adj.)R2 (Pred)SDFF-ValueDWS
ChlaIndividual0.690.574.92417.041.41
ChlaRatio0.650.554.92513.81.56
TurbidityIndividual0.930.925.16259.121.65
TurbidityRatio0.820.808.86249.571.68
TSIRatio0.660.645.16415.281.54
Disclaimer/Publisher’s Note: The statements, opinions and data contained in all publications are solely those of the individual author(s) and contributor(s) and not of MDPI and/or the editor(s). MDPI and/or the editor(s) disclaim responsibility for any injury to people or property resulting from any ideas, methods, instructions or products referred to in the content.