Article

Convex-Decomposition-Based Evaluation of SAR Scene Deception Jamming Oriented to Detection

State Key Laboratory of Complex Electromagnetic Environment Effects on Electronics and Information System, College of Electronic Science and Technology, National University of Defense Technology, Changsha 410073, China
*
Author to whom correspondence should be addressed.
Remote Sens. 2025, 17(18), 3178; https://doi.org/10.3390/rs17183178
Submission received: 4 August 2025 / Revised: 10 September 2025 / Accepted: 12 September 2025 / Published: 13 September 2025

Abstract

The evaluation of synthetic aperture radar (SAR) jamming effectiveness is a primary means to measure the reliability of jamming effects, and it can provide important guidance for the selection of jamming strategies and application of jamming styles. To address problems in traditional evaluation methods for SAR scene deception jamming, namely the simple adoption of native feature parameters, incomprehensive integration for evaluation indicator design, and the inconsideration of resulting jamming detection effects, this paper proposes a SAR scene deceptive jamming evaluation method oriented to jamming detection. First, four profound feature parameters including the brightness change gradient, texture direction contrast degree, edge matching degree, and noise suppression difference index are extracted in terms of visual and non-visual manners, which accurately highlight the differences between jamming and the background. Subsequently, through nonlinear iterative optimization and loss function design, a comprehensive evaluation indicator, i.e., with a convex decomposition is proposed, which can effectively quantify the contribution of each feature parameter and distinguish the differences in jamming concealment under different scenes. Finally, based on the measured and simulated MiniSAR datasets of urban, mountainous, and other complex scenes, a mapping correlation between the SDD and jamming detection rate is established. The evaluation results show that when the SDD is less than 0.4, the jamming is undetectable; when the SDD is greater than 0.4, for every 0.1 increase in the SDD, the jamming detection rate decreases by approximately 0.1. This provides support for the quantification of jamming effects in terms of detection rate in real applications.

1. Introduction

Synthetic aperture radar (SAR) plays an important role in remote sensing monitoring, environmental monitoring, and other fields by virtue of its all-day, all-weather imaging capability [1]. However, with the wide application of SAR technology, jamming and anti-jamming techniques for SAR have become a research hotspot, in which scene deception jamming is a widely used jamming method that simulates real scene characteristics to cover up the target information and reduce the probability of radar recognition, and its concealment directly determines the effectiveness of the jamming effect [2,3,4,5]. Therefore, the establishment of a scientific and comprehensive SAR scene deception jamming concealment evaluation system is of great value to optimize jamming strategies and enhance countermeasure capabilities [6,7,8,9].
The evaluation methods of the SAR scene deception jamming effect can be divided into two categories: the subjective evaluation method and objective evaluation method. The subjective evaluation method relies on manual interpretation of SAR images, which is limited by the knowledge level and experience of the experts, resulting in it being difficult to organize, implement, and repeat. Therefore, current studies prefer to extract quantitative indicators from the signal or image level to implement the objective evaluation. It can be roughly divided into four aspects: (1) Texture features of SAR images. For instance, Camastra, F. et al. [10] measure the degree of damage of scene deception jamming based on image texture complexity and irregularity by comparing the fractal dimensions before and after the jamming; D’Hondt, O. et al. [11] quantify the effect of scene deception jamming with the integrity of texture information of SAR images by analyzing the relationship between the jamming noise power and the information entropy; Xiang, S. et al. [12] quantify the effect of scene deception jamming using the integrity of texture information of SAR images by computing the grayscale covariance matrix results to measure the mismatch of SAR images in terms of texture orientation, contrast, and uniformity. (2) Statistical properties of SAR images. For instance, Yelmanov, S. et al. [13] measure the effect of scene deception jamming based on the uniformity of image brightness distribution and information richness by comparing the histogram distribution of grayscale and the entropy value and moments of SAR images before and after the jamming; Li, Y. et al. [14] analyze the effect of jamming with the spatial correlation between pixels of images by comparing the autocorrelation coefficients before and after the jamming. (3) Frequency domain characteristics of SAR images. For instance, Chateigner, C. et al. [15] measure the degree of destruction of image structural information by scene jamming by analyzing the frequency domain energy shift after Fourier transform; Zhang, X. et al. [16] measure the effect of jamming on image multiscale detail features by comparing the signal characteristics of each frequency band after wavelet packet transform. (4) Target-detection-related indexes. For instance, Liu, G. et al. [17] measure the effect of jamming on the target detection probability and false alarm rate by comparing the detection rate and false alarm rate of the target detection algorithm; Shang, S. et al. [18] measure the effect of jamming on the target spatial localization precision by analyzing the deviation in the target localization coordinates. (5) Neural networks for jamming evaluation. Zhang, C. et al. [19] propose a SAR radio frequency interference region-intensity feature extraction and joint evaluation network to conduct related research on radio frequency interference processing. Long, W. et al. [20] utilize a bipartite matching transformer to carry out research on SAR image detection, thereby improving the performance of SAR image detection.
Although the existing SAR scene deception jamming evaluation methods have achieved certain results, there are still the following problems: (1) The investigated objects of the evaluation methods have apparent limitations, mostly focusing on a simple background or a single jamming template, which lacks the evaluation of jamming effects under different backgrounds, different jamming templates, and different JSRs. (2) Existing SAR scene deceptive jamming evaluation methods, which are limited to the level of concealment quantification (such as measuring the difference between jamming and the background through indicators like texture and statistical characteristics), have obvious shortcomings. Their use of feature parameters is naive and one-sided, making it difficult to accurately characterize the concealment effect of jamming images. Moreover, due to the scarcity of research on SAR scene deceptive jamming evaluation, there has been a lack of effective and comprehensive feature parameters. As a result, these methods fail to establish a direct and quantifiable mapping relationship with jamming detection performance in actual SAR imaging. (3) The current evaluation index is designed with subjective-driven weighting for feature parameters, yet a physically interpretable quantitative weighting process is unconsidered. (4) The evaluation is conducted at the level of features and indexes, which measure the jamming concealment only by quantifying the differences between jamming and the background, and fail to deeply correlate with the jamming detection level. This makes it difficult to directly feedback on the actual impact of jamming on SAR imaging.
To this end, this paper proposes a SAR scene deception jamming evaluation method oriented to jamming detection. The contribution and novelty of this paper lie in the following: (1) From the perspective of the visual and non-visual content of SAR images, four elaborate feature parameters, namely brightness change gradient, texture direction contrast degree, edge matching degree, and noise suppression difference index are extracted, which highlight the difference between the jamming and background as well as the protected target, considering the dimensions of intensity, texture, edge, and noise level. (2) A convex-decomposition concept is proposed, which can adaptively and iteratively implement optimization with a preset loss function for the weight ascertained for the above feature parameters, This allows us to derive a comprehensive evaluation index, i.e., a scene deception degree (SDD), which is physically interpretable and is capable of distinguishing the differences in scene deception jamming with different patterns. (3) By manufacturing a SAR scene deception jamming dataset with different jamming templates, jamming backgrounds, and jamming-to-signal ratios (JSRs), an AI-based intelligent jamming detection is achievable, and a quantitative mapping correlation between the SDD and detection rate is established, which realizes the jamming effectiveness evaluation at the jamming detection level.

2. Generation of SAR Scene Deception Jamming Dataset

The jamming-free data presented in this paper is derived from MiniSAR data collected by Sandia National Laboratories in the United States. MiniSAR operates in the Ku band and adopts a focused beam mode, with both range and azimuth resolutions reaching 0.1 m. The original image size is 1638 × 2510 pixels, and the imaging scenes include sandy areas, urban areas, forests, airports, and so forth, which contain a plethora of manmade targets such as vehicles, aircrafts, and buildings [21,22,23,24,25]. After acquiring the SAR data, logarithmic processing is first applied to enhance the contrast between bright and dark areas in the image; this highlights the detailed information of ground objects and facilitates subsequent visual interpretation and analysis.
On this basis, an improved Lee filtering algorithm is used to suppress the inherent multiplicative speckle noise in SAR images. This method can effectively increase the equivalent number of looks of the filtered image while preserving the edge and texture features of the image, thus providing higher-quality basic data for subsequent processing.
Finally, standardization processing is performed on the SAR images to map the data to the [0, 1] interval. This step eliminates the magnitude interference caused by differences in the scattering intensity of different ground objects, realizes the unification of dimensions among multiple images, and lays a foundation for cross-image comparative analysis.
In the process of analyzing SAR scene deception jamming, this paper selected three typical scene-based deception jamming templates: tree, building, and aircraft. These templates are all based on actual targets and can simulate various potential deceptive targets in real environments [26]. They can serve as effective references for evaluating the degree of fusion between jamming and the background. In terms of jamming power selection, the JSR range is set to 0–22 dB, with jamming signals generated at 2 dB intervals. The lower limit is set to 0 dB because, at this ratio, the jamming signal is too weak to achieve an effective deceptive effect; the upper limit is set to 22 dB because when JSR reaches this level, the jamming signal becomes overly prominent and is easily identified as a false target, making it irrelevant for evaluating deceptive jamming. Additionally, to enhance the complexity of the scenarios, this paper selected 10 different backgrounds from urban, forested, and desert environments, providing a more comprehensive reference for evaluating the integration of jamming with complex backgrounds.
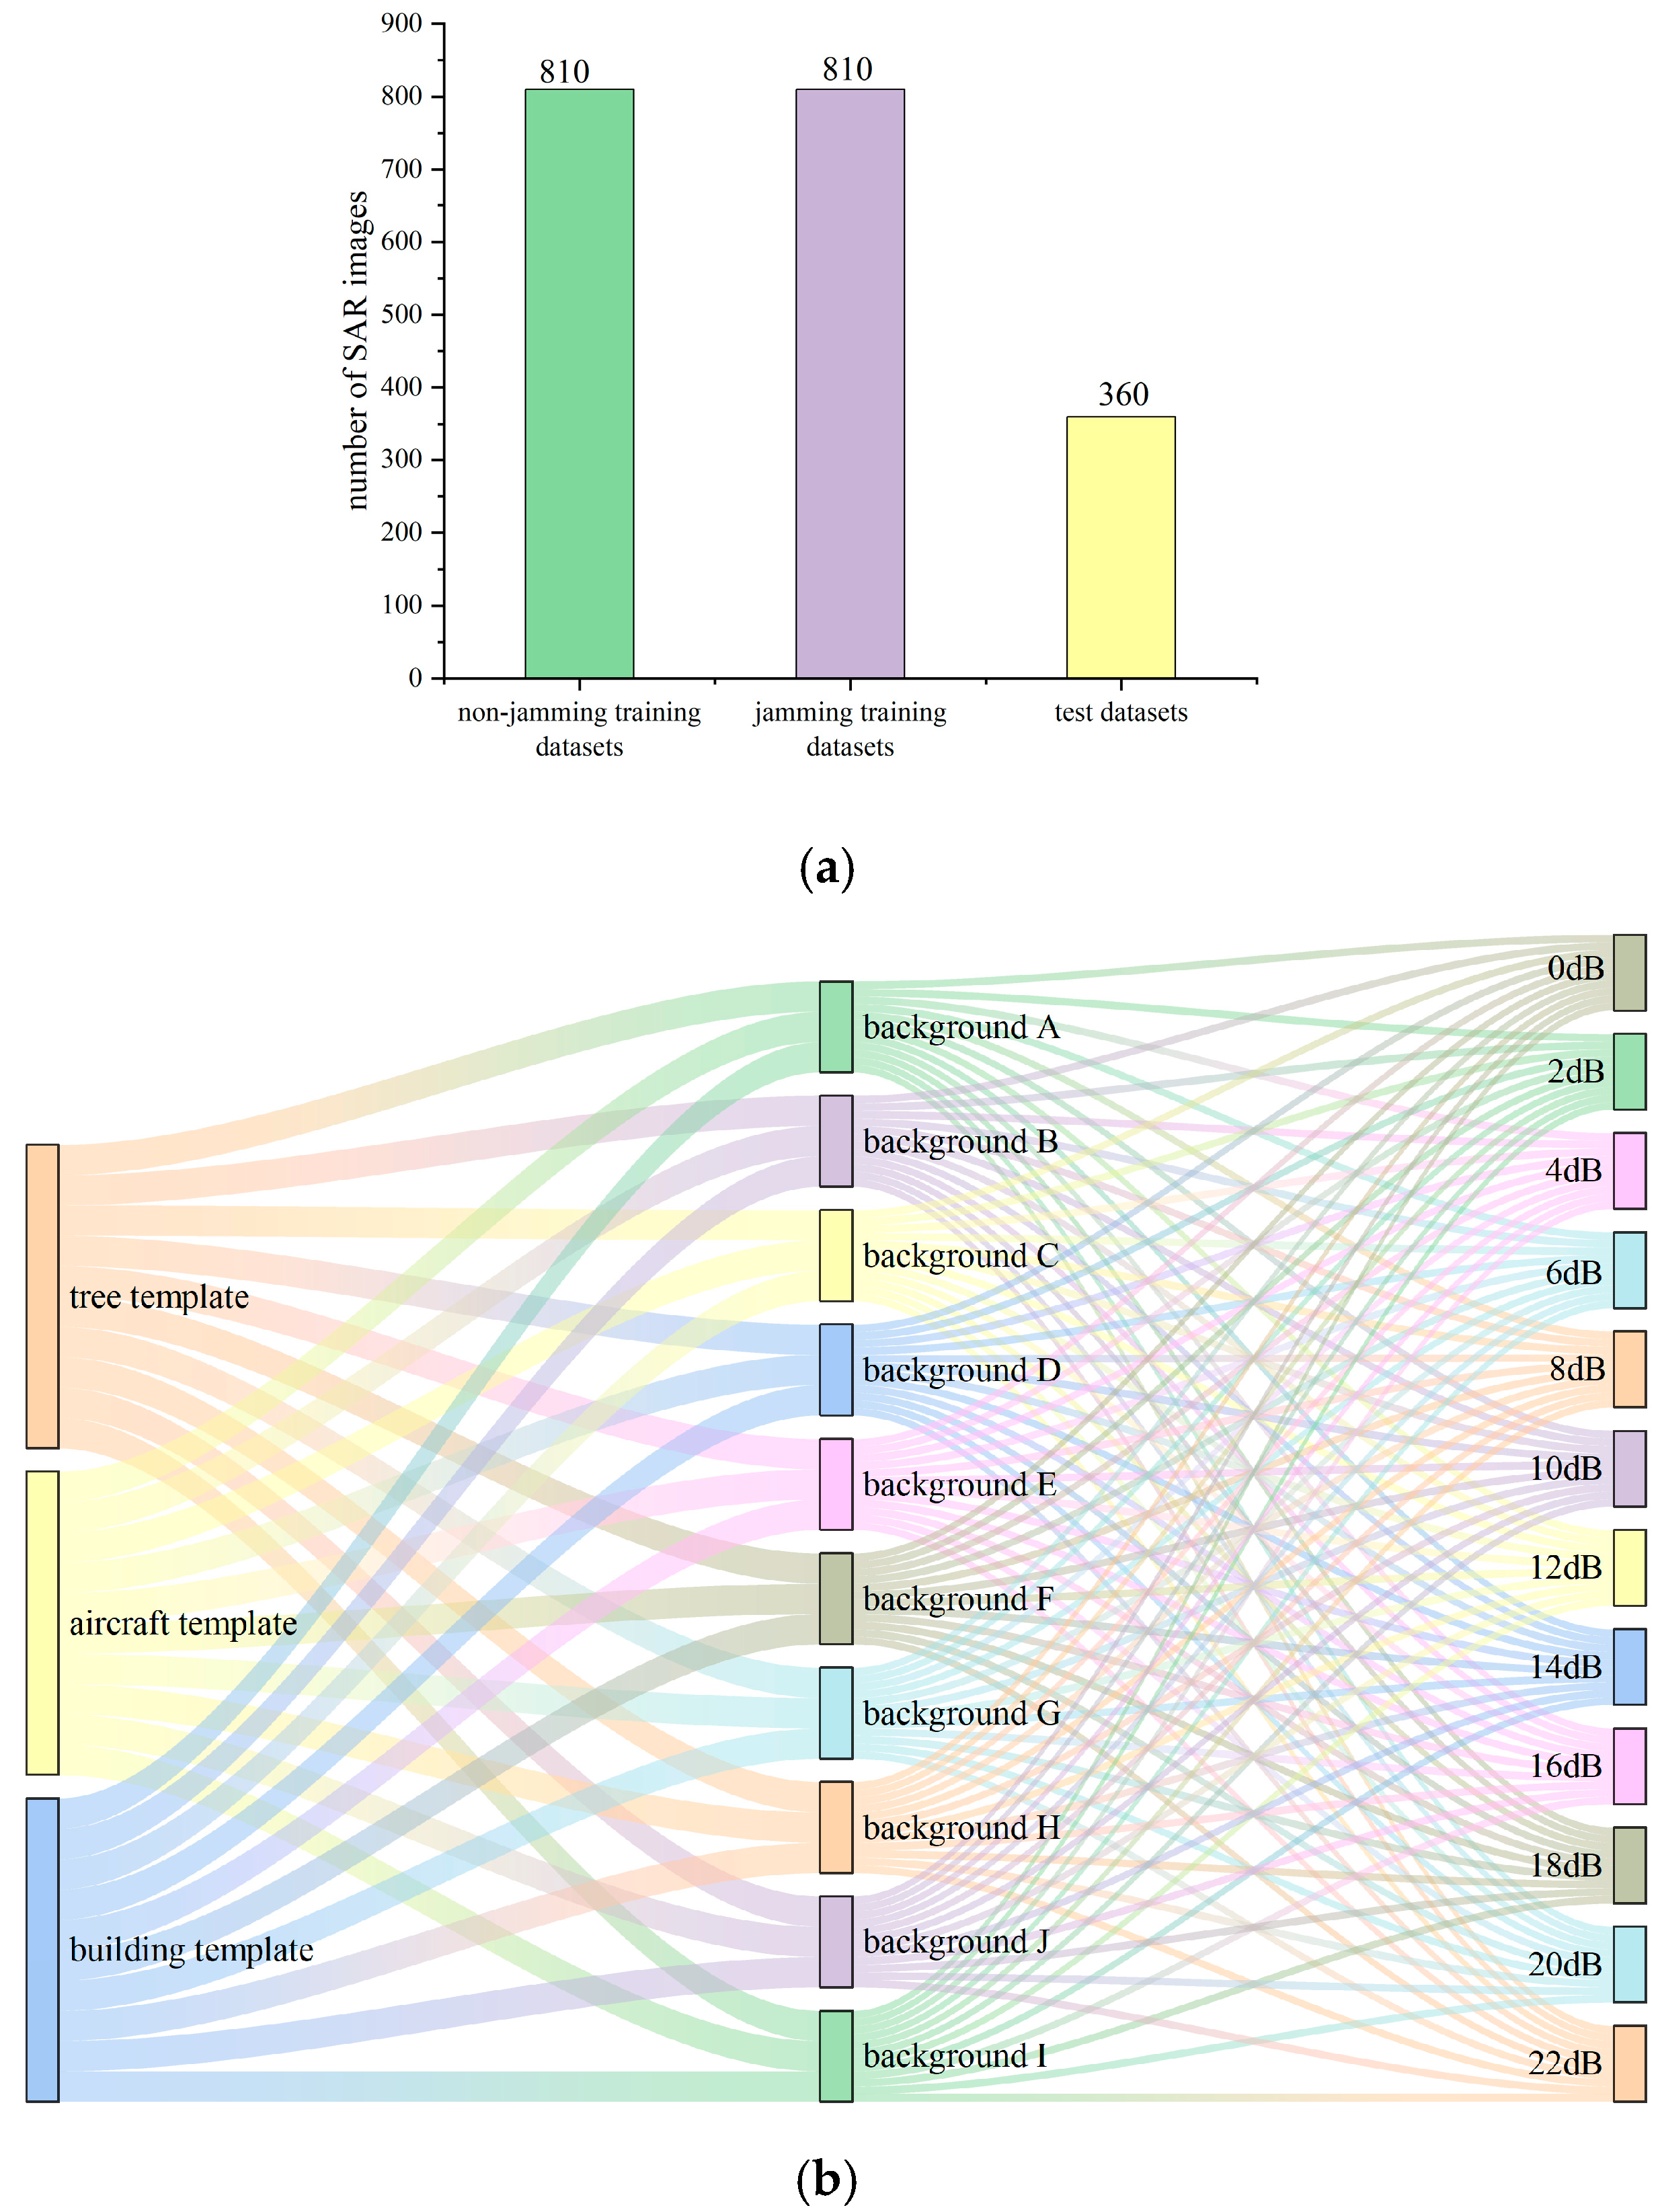
Combined with the operating parameters of MiniSAR, and by selecting different JSRs and jamming templates, a total of 1980 images under different scenes are generated in this paper, with some image data shown in Figure 1. Detailed results are presented in Figure 2a, among which 1620 images are used as the neural network training set, including 810 jamming images and 810 non-jamming images; another 360 images are used as the neural network test set. Meanwhile, the test set data are selected in this paper to build the jamming evaluation system, and the information of the test set data is shown in Figure 2b. It can be seen from the images that JSRs range from 0 to 22 dB with an interval of 2 dB, and each dB corresponds to 30 images; there are 10 different jamming backgrounds, each corresponding to 36 images; in addition, there are 3 different jamming templates, each corresponding to 120 images.

3. Visual and Non-Visual Feature Parameters

In the field of SAR image jamming concealment analysis, visual evaluation has always played a fundamental and key role. The human visual system’s perception of images enables visual evaluation to quickly construct an intuitive cognitive framework of jamming effects [27,28,29].
From a visual perspective, the degree of visual matching between jamming and the background is the core factor in assessing jamming concealment. Brightness difference, texture difference, and the degree of edge blending at the jamming are the three key dimensions of visual evaluation. Brightness difference is the most intuitive visual evaluation metric, reflecting the contrast in grayscale intensity between the jamming area and background. Texture differences focus on the arrangement, combination, and distribution patterns of elements within an image. Different landforms and jamming signals typically have unique texture characteristics, and quantifying these differences further highlights the visual structural matching between jamming and the background. Edge difference primarily evaluates the smoothness of transitions at the boundaries between jamming and background areas. Good edge blending effectively reduces the abruptness of jamming and enhances concealment. These three dimensions quantify the visual differences between jamming and the background from different perspectives, providing an intuitive, multidimensional basis for assessing the concealment effectiveness of jamming [30].
However, with the development and upgrading of jamming technology, some advanced jamming techniques have begun to consciously simulate the visual characteristics of SAR image backgrounds, achieving high fidelity replication from grayscale distribution to texture structure. In this context, from a non-visual perspective, conducting an in-depth feature analysis of signals to identify differences between jamming and background signals at the fine signal feature level has become a key factor in improving the jamming concealment evaluation system [31,32]. Therefore, this paper will systematically, comprehensively, and deeply evaluate jamming effects from both visual and non-visual dimensions.

3.1. Brightness Change Gradient

Additionally, direct brightness differences fail to account for the human eye’s relative sensitivity to brightness changes and overlook the influence of background brightness itself on the perception threshold. Research indicates that the human eye can only detect brightness changes when they exceed a specific threshold: according to Weber’s Law, visual feedback is triggered in SAR images only when the brightness change in a jamming area exceeds 1–5% of that in the background area. However, traditional Weber’s Law merely illustrates the principle that the human eye’s perception of brightness changes relies on a stepwise threshold; it does not consider the critical characteristic that subjective visual perception of brightness does not increase linearly with actual brightness.
Therefore, this paper proposes an improved feature parameter, a brightness change gradient, to quantify the brightness difference between the background and jamming areas (its expression is given in Equation (1)). This parameter inherits the core logic of Weber’s Law regarding “stepwise perception thresholds” while additionally incorporating the physical property that human visual perception of brightness follows a logarithmic pattern. This alignment makes the results more consistent with the eye’s actual perception of jamming against backgrounds of varying brightness, thereby addressing the limitation of traditional Weberian metrics in characterizing nonlinear perception.
D 1 = k ( ln ( I ) ln ( I b ) ) + C ( m I b + ε )
Specifically, k is the visual system sensitivity coefficient; C is the perceptual threshold offset, corresponding to the human eye’s dark adaptation baseline; m is the brightness gradient threshold, where only brightness changes exceeding this threshold can be perceived by the human eye. Since m is typically 1–5%, with this paper setting it to 3%, ε is a minimal coefficient set to avoid the denominator approaching 0 and causing a calculation overflow in the formula.
To identify the optimal feature parameter combination ( k , c ) that maximizes visual distinction between jamming and the background in human vision, this paper selected 100 sample images with minimal brightness differences between the background and jamming. Calculations were performed under the constraint of maximizing average brightness difference across 100 SAR images. The relevant results are shown in Figure 3. From Figure 3a, it can be seen that when the number of iterations is 43, the visual difference between jamming and the background reaches the maximum, and optimal feature parameter values at this time are = 38.18 and = 57.90.

3.2. Texture Direction Contrast Degree

When analyzing the texture differences between jamming and the background in SAR images, the human visual system exhibits strong sensitivity to differences in texture directional characteristics and structural regularities. In view of the multidirectional anisotropy and statistical regularity of SAR image texture features, the paper constructs a multidimensional texture analysis model based on GLCM: by using a sliding window mechanism to extract four directional contrast features from local regions, and combining this with a statistical mean difference quantification method, the model compares the differences between jamming and the background in SAR images from two dimensions—the texture structural regularity and directional selectivity.
Therefore, based on the perspective of jamming and background texture difference, this paper proposes an improved feature parameter, a texture direction contrast degree, to quantitatively evaluate the texture difference between the background and jamming, as shown in Equations (2) and (3).
G C θ = i = 0 N 1 j = 0 N 1 ( i μ i ) ( j μ j ) P ( i , j ) σ i σ j
D 2 = 1 K θ ( i , j ) ( G C θ j a ( i , j ) G C θ b g ( i , j ) )
Specifically, G C θ measures the linear correlation degree of each pixel within the jamming (background) in the θ direction, which can be used to analyze the texture feature association difference in jamming (background); K is the total number of direction angles θ (if setting four directions, then K = 4), which is used to normalize the summation result of the direction dimensions; in Equation (2), ( i , j ) represents the pixel grayscale level index of the GLCM matrix; in Equation (3), ( i , j ) serves as a direction-counting identifier, which has nothing to do with pixel grayscale and is only used to distinguish the calculation results of different directions. And D 2 is the quantitative result of the texture difference between jamming and the background. By traversing multi-direction and multi-feature dimensions, the difference between the two G C θ is calculated and normalized to quantify the degree of alteration in the jamming on the correlation of the image features, and the larger the difference D 2 is, the more significant the difference between jamming and the background is.

3.3. Edge Matching Degree

In analyzing the edge difference between jamming and the background, due to the human visual cortex’s mechanism of prioritizing edge information, the human eye visual system is sensitive to the grayscale changes and directional continuity of the edges. However, due to the problem of speckle noise jamming and grayscale inhomogeneity in SAR images, it is difficult for the traditional edge analysis method to reflect the real characteristics of edges.
For this reason, the paper constructs a two-dimensional edge evaluation method based on the key elements of edge perception by human eye vision: on the one hand, the grayscale consistency between regions is measured by quantifying the grayscale mean and variance matching degree on both sides of the edges; on the other hand, based on the real edge points, the suspected edge points are determined by using the local grayscale change thresholding method. The combination of the two, from the two dimensions of grayscale statistical features and geometric orientation features, realizes the comparison of differences between target edges and the background in SAR images.
Based on this, this paper proposes an improved feature parameter, an edge matching degree, to quantitatively evaluate the edge quality from the perspective of the difference between the jamming and background edges, whose expressions are shown in Equations (4)–(6).
M = 1 1 2 ( | μ Ω j μ Ω b | μ Ω b + | σ Ω j 2 σ Ω b 2 | σ Ω b 2 )
C = 1 | S G | | G |
D 3 = C M
Specifically, Ω j , Ω b is the real edge point collection G as a reference, along the edge of the normal direction respective to the jamming area and the background extends k pixels, divided into two sides of the edge of the region; μ Ω j , σ Ω j 2 is for the region Ω j within the pixel value of the mean and variance of the grayscale, and μ Ω b , σ Ω b 2 is for the region Ω b within the pixel value of the mean and variance of the grayscale; M is for the edge of the two sides of the jamming area and background of the degree of fusion, the bigger M is, the higher the jamming area and background of the integration of the degree. The larger D 3 is, the higher the fusion between the jamming area and background; S is the set of suspected edge points in the SAR image, C is the ratio of the part of G not covered by the set of suspected edge points to G , and the larger C is, the smaller the difference between the jamming area and background; this assesses the covertness of jamming from the perspectives of the difference between jamming and the background edges, the differences in the statistical characteristics of the edges around the edges, and the proportion of the suspected edge points in the real edges, respectively.

3.4. Noise Suppression Difference Index

SAR scene deception jamming usually intercepts a section of the real scene around the target as a jamming signal and superimposes it on the original scene echo to achieve the purpose of masking important targets and reducing the probability of radar identification [33].
Since the noise in the SAR image is mainly manifested as multiplicative noise proportional to the signal strength, the following signal model can be established, assuming that the jamming area is not superimposed on the pre-jamming signal, as
X 1 = S 1 N 1
Specifically, S 1 is the scattering intensity of the real scene, and N 1 is the multiplicative noise.
And the echo after the superimposed jamming signal is
X 2 = S 1 N 1 + S 2 N 2
Specifically, S 2 is the equivalent scattering intensity of the jamming signal, and N 2 is the multiplicative noise independently and identically distributed with N 1 . If the jamming signal and target signal come from the same scene, it is reasonable to assume that S 2 S 1 , that is, the intensity ratio of c = S 2 / S 1 = 1 ; at this time, the model is simplified to
X 2 = S 1 ( N 1 + c N 2 )
Taking the natural logarithm of the original scene and the interfering scene, respectively, it can be obtained that
Y 1 = ln ( S 1 ) + ln ( N 1 ) Y 2 = ln ( S 1 ) + ln ( N 1 + N 2 )
Assuming that the multiplicative noise obeys a Gaussian distribution and is N 1 , N 2 ~ Ν ( μ , σ 2 ) , when μ ~ σ 2 , by the central limit theorem, N 1 + N 2 ~ Ν ( 2 μ , 2 σ 2 ) can be obtained; through the Taylor series, ln N at the mean value of μ expanded to the second order can be obtained.
ln ( μ ) = ln ( μ ) + ( N μ ) μ ( N μ ) 2 2 μ 2
The logarithmic noise variance of the original scene can be obtained:
V a r ( Y 1 ) σ 2 μ 2 + σ 4 2 μ 4
And the logarithmic noise variance of the superimposed is
V a r ( Y 2 ) σ 2 2 μ 2 + σ 4 8 μ 4
Obviously V a r ( Y 2 ) < V a r ( Y 1 ) . This conclusion shows that the multiplicative noise in the region where the scene deception jamming is located is significantly reduced.
Although the previous visual-based jamming evaluation index can provide an intuitive preliminary analysis, when the jamming intensity is weak and the jamming template is more complex, it is difficult for the visual index to comprehensively portray the subtle differences between the jamming region and the background region. The study confirms that the relative fluctuation in multiplicative noise in the scene deception jamming is suppressed due to the enhancement of signal strength.
Therefore, in order to make up for the shortcomings of the visual evaluation index in quantitative accuracy and enhance the accuracy of jamming evaluation, this paper proposes a feature parameter, a noise suppression difference index, to quantitatively evaluate the noise difference between jamming and the background area, as shown in Equation (14):
D 4 = 1 σ log , j a m 2 σ log , b a c 2
Specifically, σ log , j a m 2 is the result of taking the logarithm of the noise in the jamming area to calculate the variance, and σ log , b a c 2 is the result of taking the logarithm of the noise in the background area to calculate the variance; D 4 reflects the degree of difference between the noise in jamming and the background; the bigger D 4 is, the bigger the difference between the noise in jamming and the background; on the contrary, the bigger the degree of exposure of jamming, the smaller D 4 is and the stronger the jamming concealment is.

4. Convex-Decomposition-Guided Evaluation Indicator for Deception Degree

4.1. Convex-Decomposition Weighting

In the evaluation of SAR scene deception jamming, the reasonable establishment of weights for each feature parameter is a core link in constructing an effective evaluation system. The traditional empirical evaluation method relies on experts’ subjective judgment on the importance of indicators, and the weight distribution is susceptible to individual cognitive biases, resulting in a lack of universality in the evaluation results. Although the statistical analysis method determines the weights based on data distribution, it is difficult to handle the strong coupling relationship between indicators in complex scenes. More critically, these methods can only reflect the contribution of indices in a statistical sense and fail to establish a connection with the actual significance of feature parameters, making it difficult to guide the optimization of physical parameters for jamming strategies.
In our work, during the initial weight setting stage, prior weights were assigned according to the physical processes corresponding to each feature parameter. For example, the weight of edge matching degree, which reflects the target scattering characteristics, is associated with the target equivalent scattering area (the edge weight of large building targets can be set to 0.4), so as to ensure the physical rationality of weight distribution.
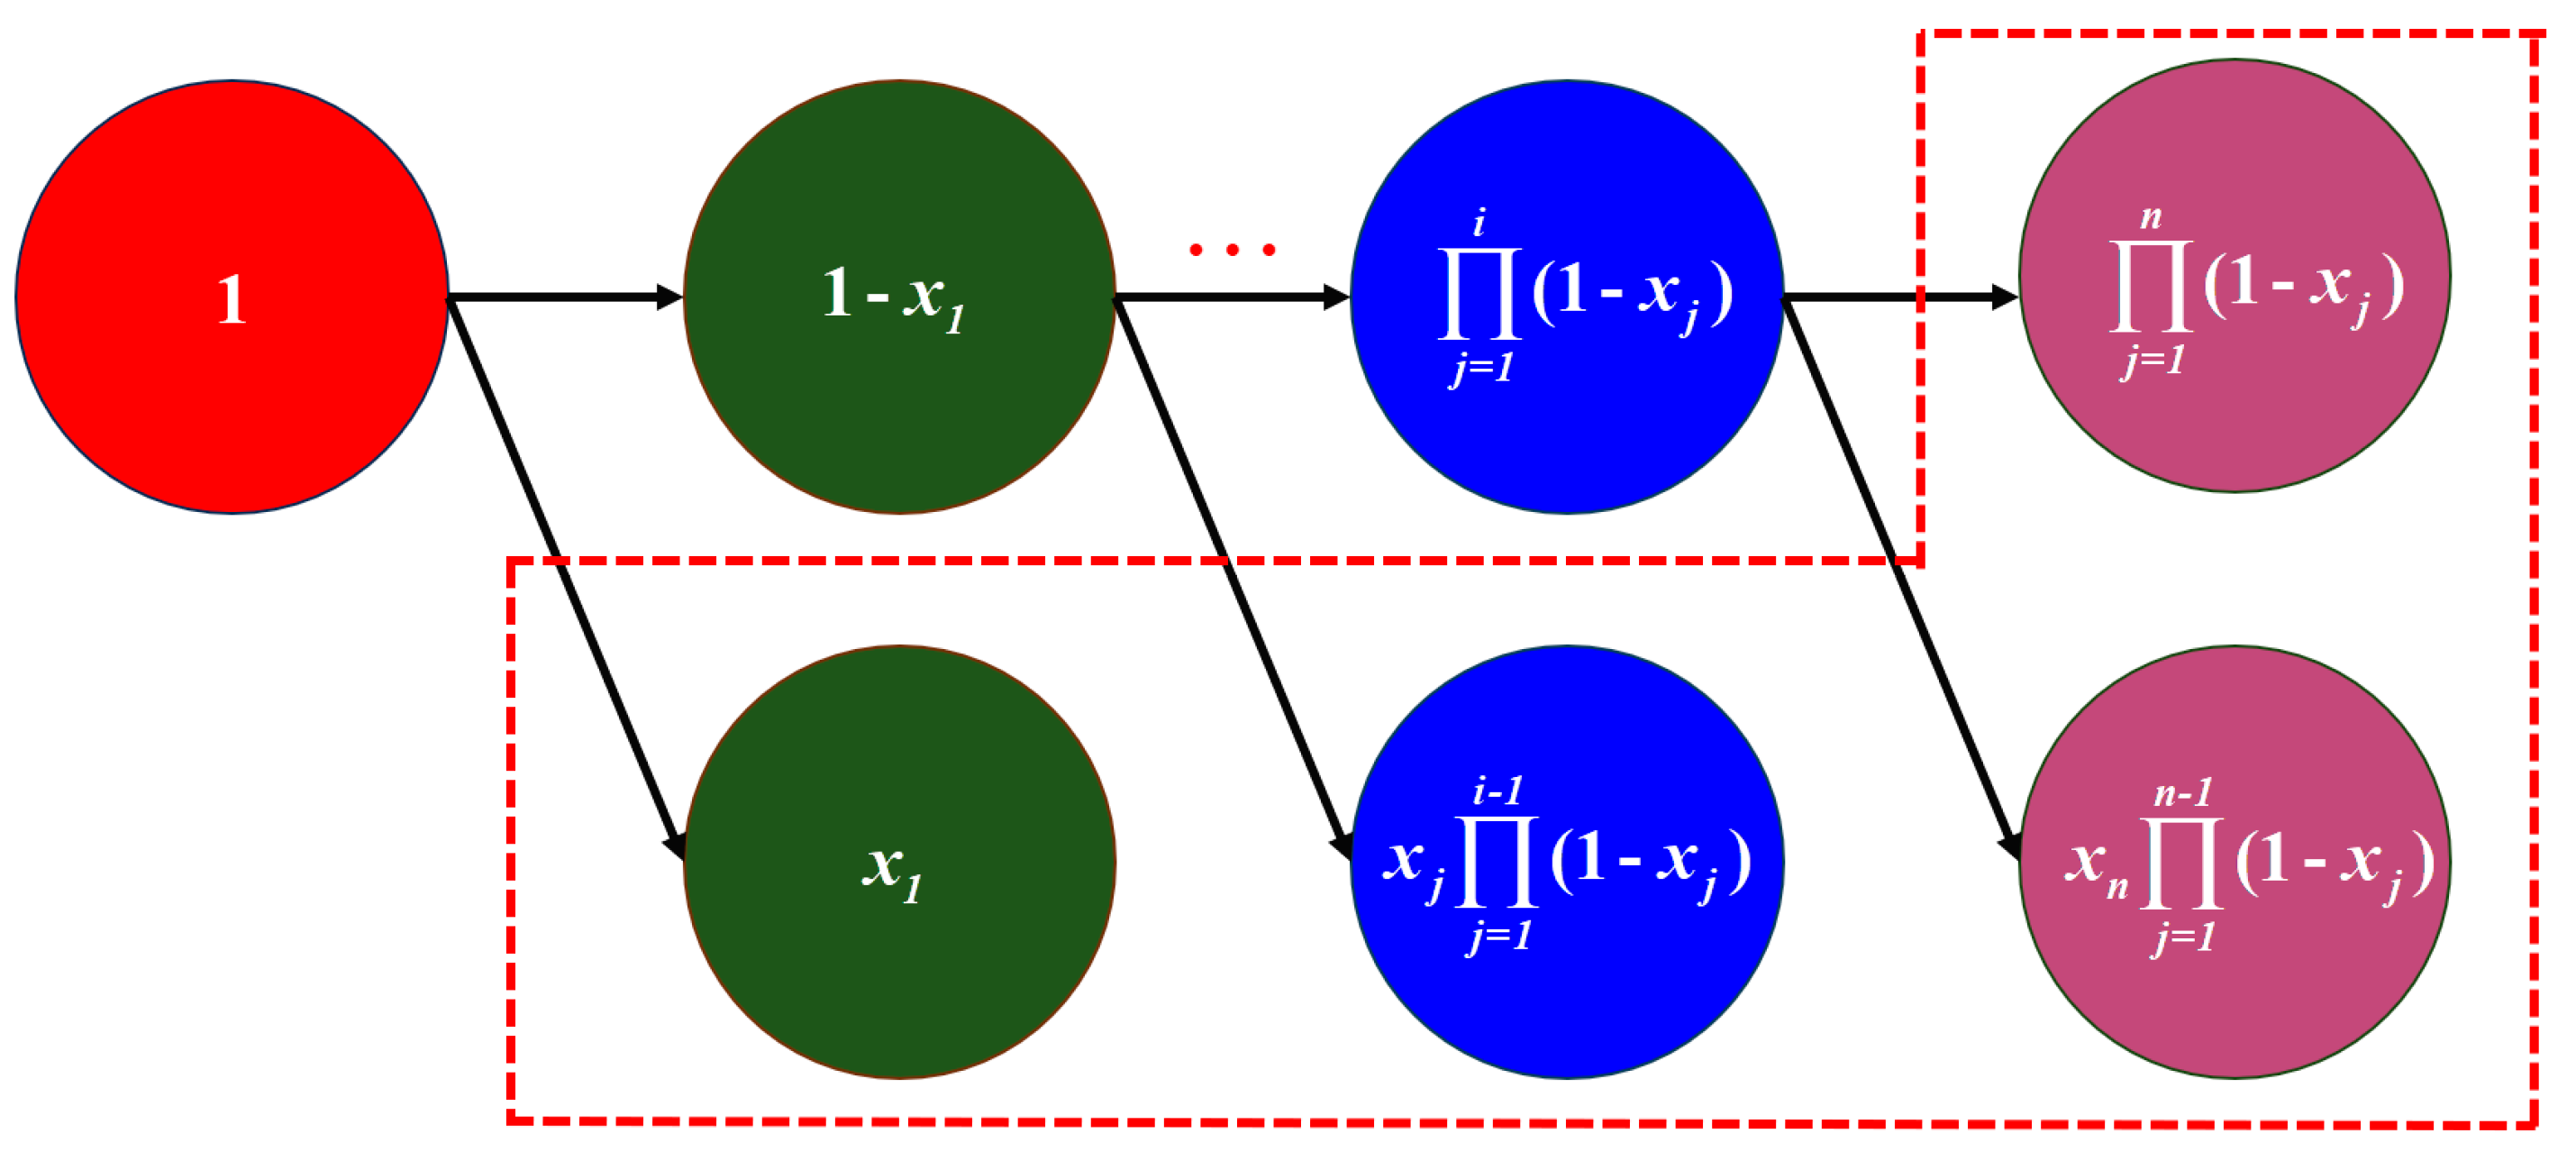
The method adopts a hierarchical weight decomposition form. By introducing interrelated weight coefficients, each feature parameter contributes in a superimposed manner, according to a specific logic in the comprehensive evaluation. Specifically, the weight of the first feature parameter participates directly in the calculation, and the weights of subsequent feature parameters are allocated based on the remaining proportion of the preceding weights, forming a progressive decomposition structure. This clearly reflects the contribution proportion of each feature parameter in the overall evaluation, as shown in Figure 4.
Subsequently, by designing a loss function with physical constraint terms, the complex optimization problem is decomposed into suboptimization for individual feature parameters. Due to the characteristics of this method, its solution process will inevitably converge to the global optimal solution, fundamentally avoiding the problem of falling into local optimal solutions and ensuring the optimality of the weight combination.
On this basis, the weight values are continuously adjusted through an iterative optimization process. Each iteration will finely revise each weight coefficient based on the current feature index data and decomposition results, making the decomposition form more in line with the actual physical scenarios and index characteristics. Finally, the globally optimal weight combination is screened out, enabling each feature index value to reach the optimal level. Hereafter, we propose and name the above processing as convex-decomposition weighting in this paper, and its form is shown in Equation (15).
H = i n ω i A i w 1 = x 1 w i = x i 1 i 1 ( 1 x j ) w n = 1 n ( 1 x i )
Specifically, H represents the comprehensive evaluation indicator, A i denotes each feature parameter, w i stands for the weight of each feature parameter, and x i is the variable in the convex-decomposition iteration process.

4.2. Convex-Decomposition-Based Scene Deception Degree

In the process of evaluating the difference between the jamming and background of SAR images, the brightness change gradient, texture direction contrast degree, edge matching degree, and noise suppression difference index were proposed to analyze the visual and non-visual differences between jamming and the background from various aspects and angles; therefore, this paper proposes a comprehensive evaluation indicator, a scene deception degree (SDD), to evaluate the covertness of SAR scene deception jamming, as shown in Equation (16); when the SDD is larger, it indicates that the covertness of the scene deception jamming is stronger, and when the SDD is smaller, it indicates that the covertness of scene deception jamming is weaker.
D = H ( D 1 , D 2 , D 3 , D 4 )
The brightness change gradient, texture direction contrast degree, and noise suppression difference index are negatively correlated with the scene deception degree, i.e., the larger the above feature parameters are, the smaller the SDD is, while edge matching degree is positively correlated with scene deception degree, i.e., the larger edge matching degree is, the larger the SDD is; therefore, after removing magnitude of feature parameters between each feature parameter, this paper establishes the relationship of feature parameters with the SDD as shown in Equation (17):
D = ω 1 ( 1 D 1 ) + ω 2 ( 1 D 2 ) + ω 3 D 3 + ω 4 ( 1 D 4 )
The reasonable determination of the weight of each feature parameter is key of scene deception degree to accurately assess jamming concealment. The brightness change gradient, texture direction contrast degree, edge matching, and noise suppression difference feature parameters portray the differences between jamming and the background from different dimensions, but the importance of each feature parameter in the overall evaluation is not equal. Therefore, this paper adopts the convex-decomposition weighting framework to quantify the weights of each feature parameter, so as to ensure that the scene deception degree can truly reflect the concealment level of the jamming.
The specific process of determining feature parameter weights is as follows:
(1)
Constructing the weight optimization model
The purpose of this section is to find the optimal w 1 , w 2 , w 3 , w 4 to minimize the fitting error between the scene deception degree and the real level of jamming concealment (obtained by the combination of manual labeling and traditional algorithms), and construct the objective function as follows:
m i n   L ( w i ) = k = 1 N ( D k A k ) 2
Specifically, N is the sample size, D k is scene deception degree calculated based on the weighting of each feature parameter, and A k is the mapping of the true concealment level of the k sample. The real concealment level A k ∈ [1, 5] (where 1 indicates “completely exposed” and 5 indicates “completely concealed”) is determined through expert annotation. The specific process is as follows: Experts are invited to independently annotate the 360 images in the test set. Based on the visual fusion degree between the jamming area and the background (brightness, texture, and edge matching effects), experts score the concealment of each sample on a 1–5 scale. After eliminating abnormal annotations with a scoring deviation exceeding one point, the average of the remaining annotations is taken as the preliminary annotation result.
(2)
Convex-Decomposition Weight Decomposition and Subproblem Construction
Since feature parameters are forwarding processing, it can be known that the weight of each feature parameter is not less than 0, and because feature parameters are interconnected to form a complete evaluation system, the sum of the weights between feature parameters must be 1. Therefore, the formula is as shown in Equation (19):
w 1 = x 1 w 2 = x 2 ( 1 x 1 ) w 3 = x 3 ( 1 x 2 ) ( 1 x 1 ) w 4 = ( 1 x 3 ) ( 1 x 2 ) ( 1 x 1 )
Since the objective function equation is about the function of each weight, the whole equation is a convex function, and the direct solution may lead to computational complexity due to the coupling of variables and so, through the convex decomposition of the original problem, is split into three independent convex subproblems, i.e.,
m i n   L = k = 1 N ( D k A k ) 2 w 2 , w 3 = C 1 m i n   L = k = 1 N ( D k A k ) 2 w 1 , w 2 = C 2 m i n   L = k = 1 N ( D k A k ) 2 w 1 , w 3 = C 3
Specifically, C 1 , C 2 , C 3 are fixed values, corresponding to fixed combinations of different feature parameter weights, respectively.
(3)
Iterative solving and convergence judgment
Initialize the values of x 1 , x 2 , and x 3 , and solve the three subproblems in order, updating x 1 , x 2 , and x 3 .
Calculate the value of the objective function corresponding to the updated combination of variables L ; if the difference with the previous round is less than a preset threshold (e.g., 10 6 ), stop the iteration; otherwise, continue to update the variables.
Through multiple rounds of iteration, the variables will gradually converge to the global optimal solution, and the final obtained x 1 , x 2 , and x 3 and the optimal weights w 1 , w 2 , w 3 , and w 4 of the four feature parameters in D are determined through Equation (19).

5. Analysis of Experimental Results

5.1. Analysis of SAR Scene Deception Jamming Feature Patametern

In order to verify the effectiveness and reliability of the proposed method, this paper utilizes the generated SAR scene deception jamming dataset to build the evaluation system. The dataset contains jamming backgrounds such as woodlands and cities and three different jamming templates for trees, airplanes, and buildings, with JSRs of 0–22 dB, totaling 360 images.
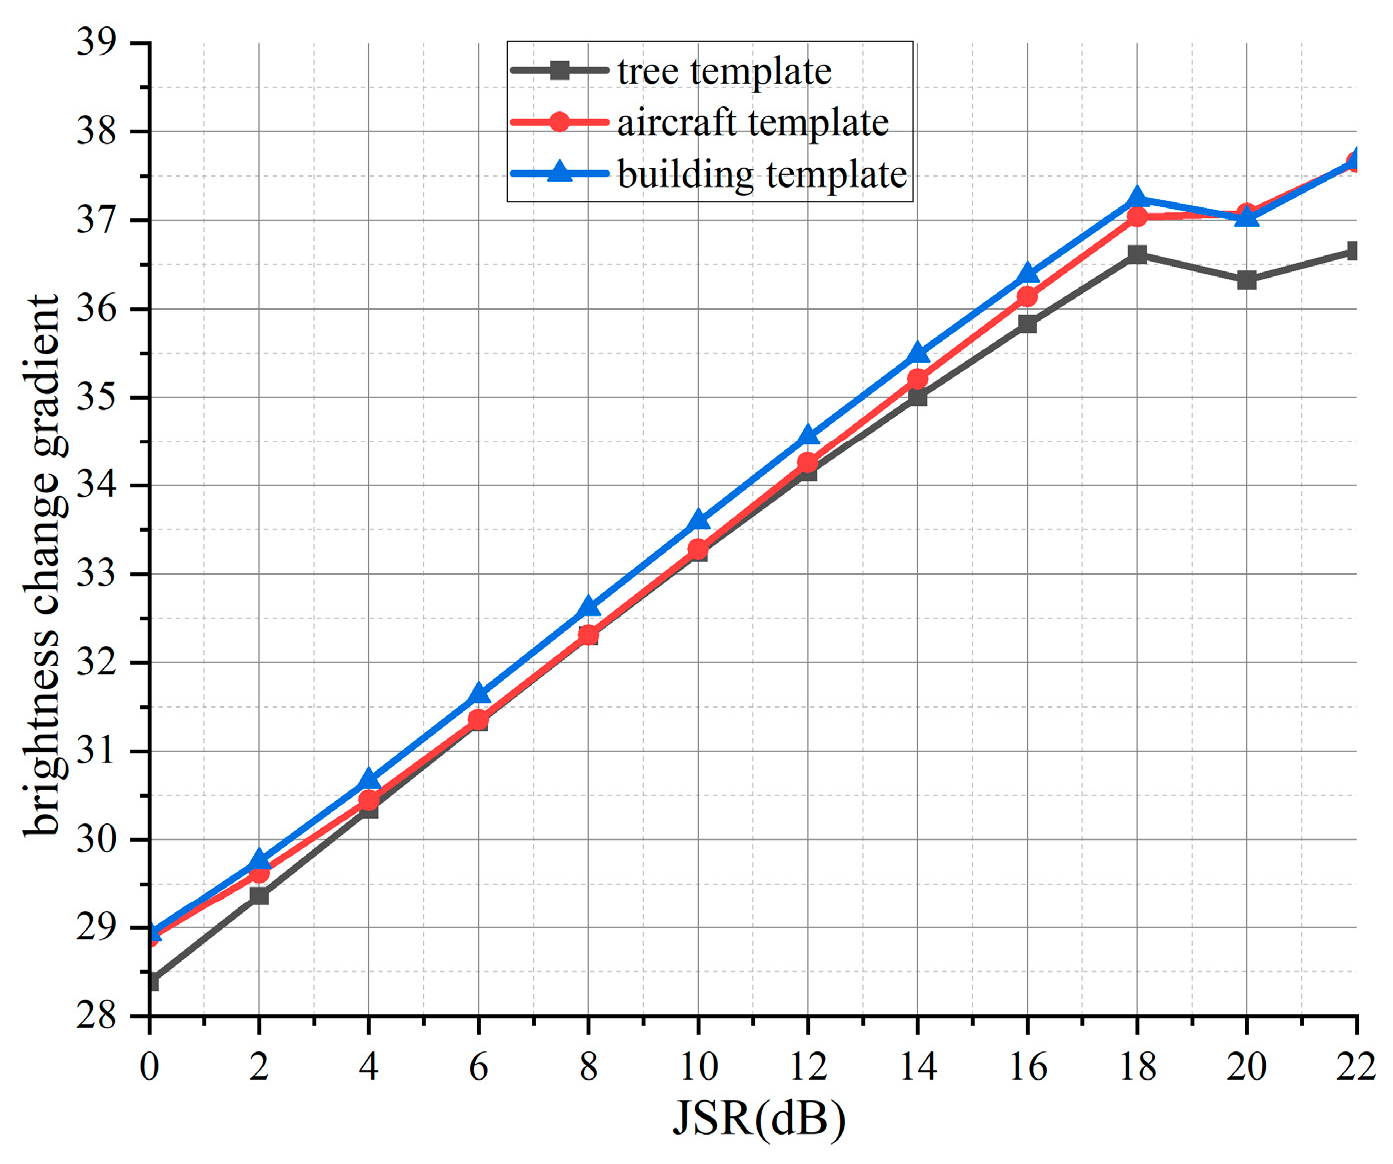
In the process of evaluating the deception jamming effect of SAR scenes, this paper discusses four feature parameters: the brightness change gradient, texture direction contrast degree, edge matching, and noise suppression difference index. Firstly, we explore the brightness change gradient. The evaluation results of this feature parameter are shown in Figure 5, where the horizontal coordinate is JSR; the vertical coordinate is the brightness change gradient; and the black, red, and blue curves correspond to the change rules of tree, airplane, and building templates with JSRs, respectively. In order to verify the universality of the evaluation, the paper selects 10 backgrounds such as woodlands and cities for a comprehensive analysis.
As can be seen in Figure 5, with the increase in JSRs, the gradient of the brightness change gradient shows a gradually increasing trend; however, when the JSR is greater than 10 dB, its rising trend slows down, and when the JSR is greater than 20 dB, the gradient of the brightness change gradient tends to stabilize. This phenomenon is consistent with the characteristics of human visual perception, i.e., brightness is not infinite when beyond a certain range, the human eye has difficulties distinguishing the subtle changes in brightness. At the same time, it can be observed that under the same conditions of JSR, there is no significant difference in the brightness change gradient of tree, airplane, and building templates. It can be seen that the brightness change gradient change can only distinguish the difference in jamming brightness but cannot distinguish the difference between different jamming templates.
The evaluation result of the texture direction contrast degree is shown in Figure 6, where the horizontal coordinate is JSR and the vertical coordinate is the texture direction contrast degree. In Figure 6a, the black, red, and blue curves correspond to the change rule of tree, airplane, and building templates with JSR under the same jamming background, respectively; in Figure 6b, the black, red, green, and blue curves correspond to the change in jamming templates with JSR under different backgrounds.
As seen in Figure 6a, with the increase in JSR, the texture direction contrast degree gradually increases, which indicates that the difference between jamming and the background gradually expands when JSR increases. The longitudinal comparison shows that the difference between the tree template and background is the largest, followed by the airplane template, and the building template has the smallest difference with the background. Therefore, under the same background conditions, the distinction of differences between jamming templates can be realized by using the texture direction contrast degree.
However, the results in Figure 6b show that although the texture direction contrast degree also shows an increasing trend with the increase in JSR, the differences between the jamming templates and background do not show a stable pattern under the same JSR. Specifically, when JSR is small, the difference between the urban background A and jamming template is the largest; while when the JSR is large, the difference between the woodland background C and the jamming template is the largest, and the difference between intermediate background and jamming template is more chaotic in the order. This phenomenon indicates that a single texture direction contrast degree feature parameter is difficult to apply to the differentiation of different jamming templates in different backgrounds.
From the above analysis, it can be seen that only texture direction contrast degree can be used to distinguish the differences in different jamming templates under the same background, but it is difficult to apply to the differentiation of different jamming templates under different backgrounds; so in order to distinguish the covertness of jamming templates between different scenes, this paper introduces the edge matching degree feature parameter in combination with the texture direction contrast degree to distinguish the differences between different backgrounds, and the evaluation of edge matching degree is shown in Figure 7. The results are shown in Figure 7; in Figure 7a, the black, red, blue, and green curves correspond to the change rule of the edge matching degree with JSRs in the urban background A area, urban background B area, woodland background C area, and woodland background D area, respectively; in Figure 7b, the black, red, blue, and green curves correspond to the change rule of the edge matching degree with JSRs in the urban background A region, urban background B region, woodland background C region, and woodland background D region. The change rule of the combined values of the edge matching degree and texture direction contrast degree with JSRs.
As can be seen in Figure 7a, the edge matching degree shows a gradual decreasing trend with the increase in JSRs, which indicates that the difference between the jamming template and background gradually expands when JSR increases. However, the vertical comparison finds that the difference between the jamming template and background also does not show a stable pattern; when the JSR is small, the difference between the urban background A area and jamming template is the largest; and when JSR is large, the difference between the woodland background D area and jamming template is the largest. Therefore, as with the texture direction contrast degree, only the edge matching degree is also difficult to apply to the differentiation of different jamming templates in different backgrounds.
However, observing the results in Figure 7b, it can be found that under any same JSR, the sum of the edge matching degree and texture direction contrast in the background of urban A is the smallest, and the background of woodland C is the largest; so combining this with Figure 7a, we can obtain the conclusion that only the texture direction and edge matching degree are both difficult to apply to the differentiation of the same jamming template under different backgrounds, but the joint evaluation of the edge matching degree and texture difference degree can differentiate the same jamming template under different backgrounds.
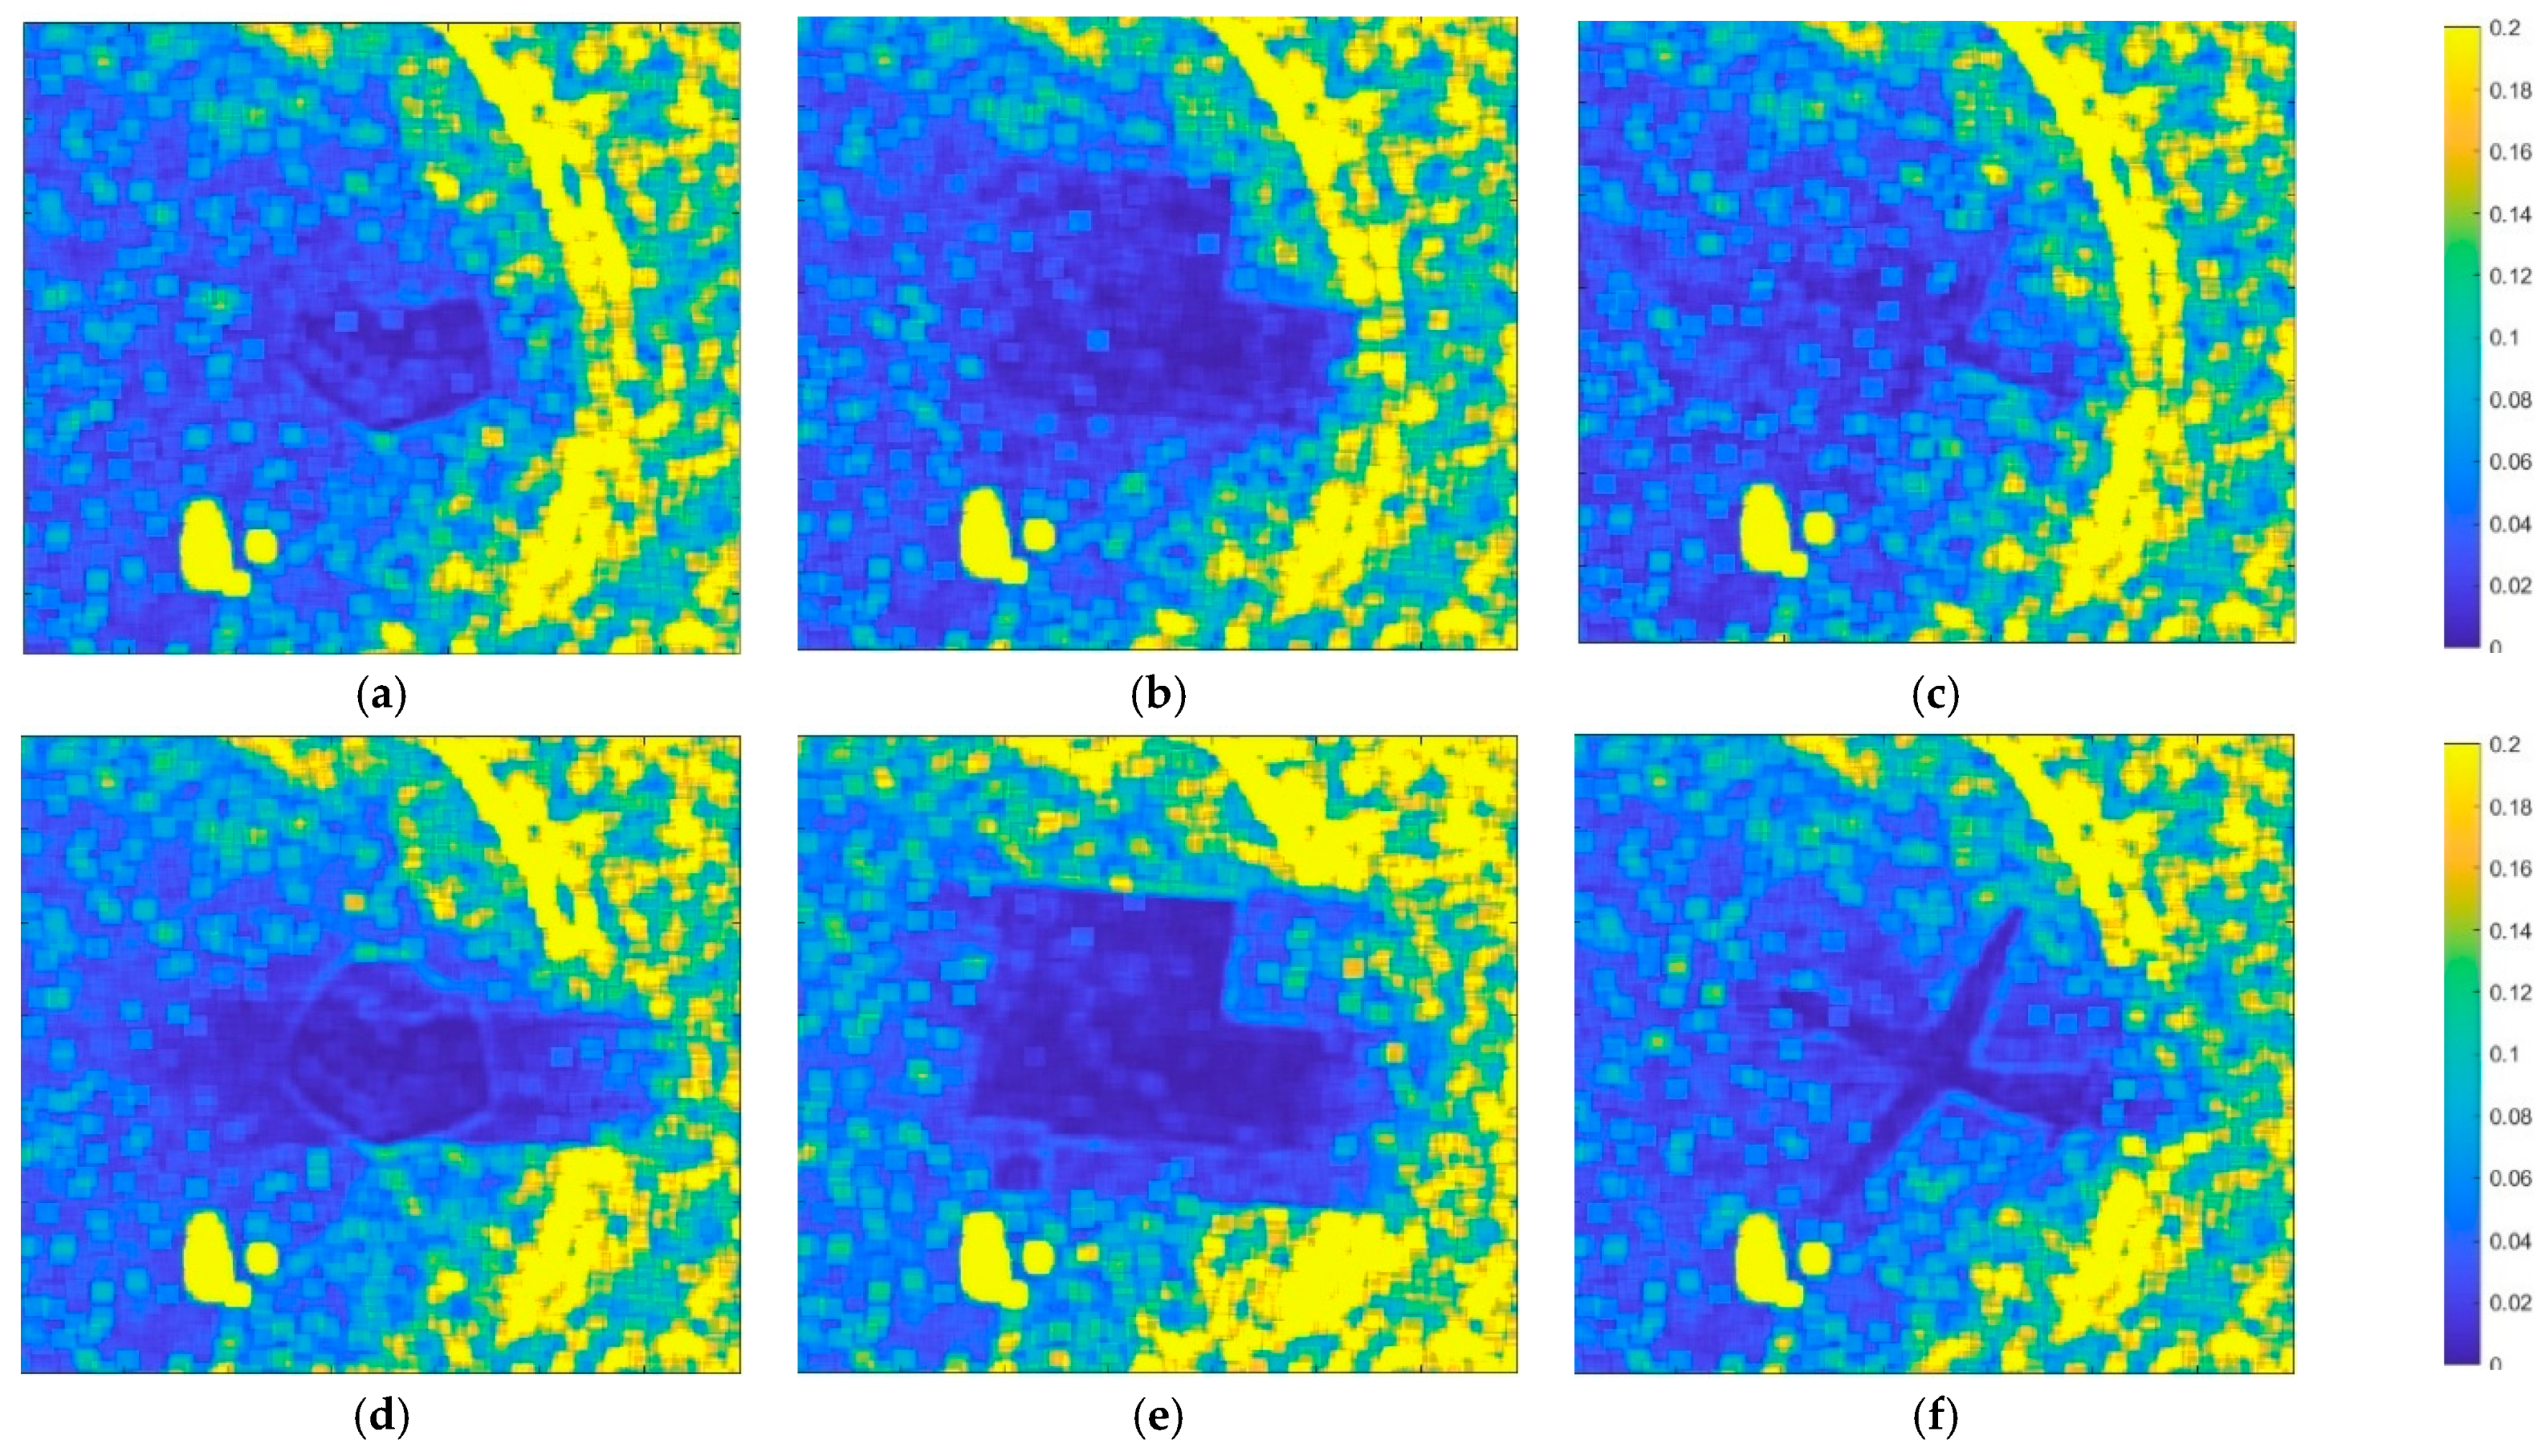
In order to verify the effectiveness of the non-visual feature parameter, the noise suppression difference index, in assessing the variability of different jamming templates, Figure 8 gives the visualization results of some multiplicative noises, in which the blue color indicates that the multiplicative noise has a lower value of logarithmic variance, and the yellow color indicates that the multiplicative noise has a higher value of logarithmic variance. (a–c) represents 10 dB, and (d–f) represents 20 dB. Vertical analysis shows that the noise in the jamming area is significantly lower than the background as JSR increases; horizontal comparison shows that the noise difference between the aircraft template and background is the smallest, while the noise difference between the building template and tree template is the largest.
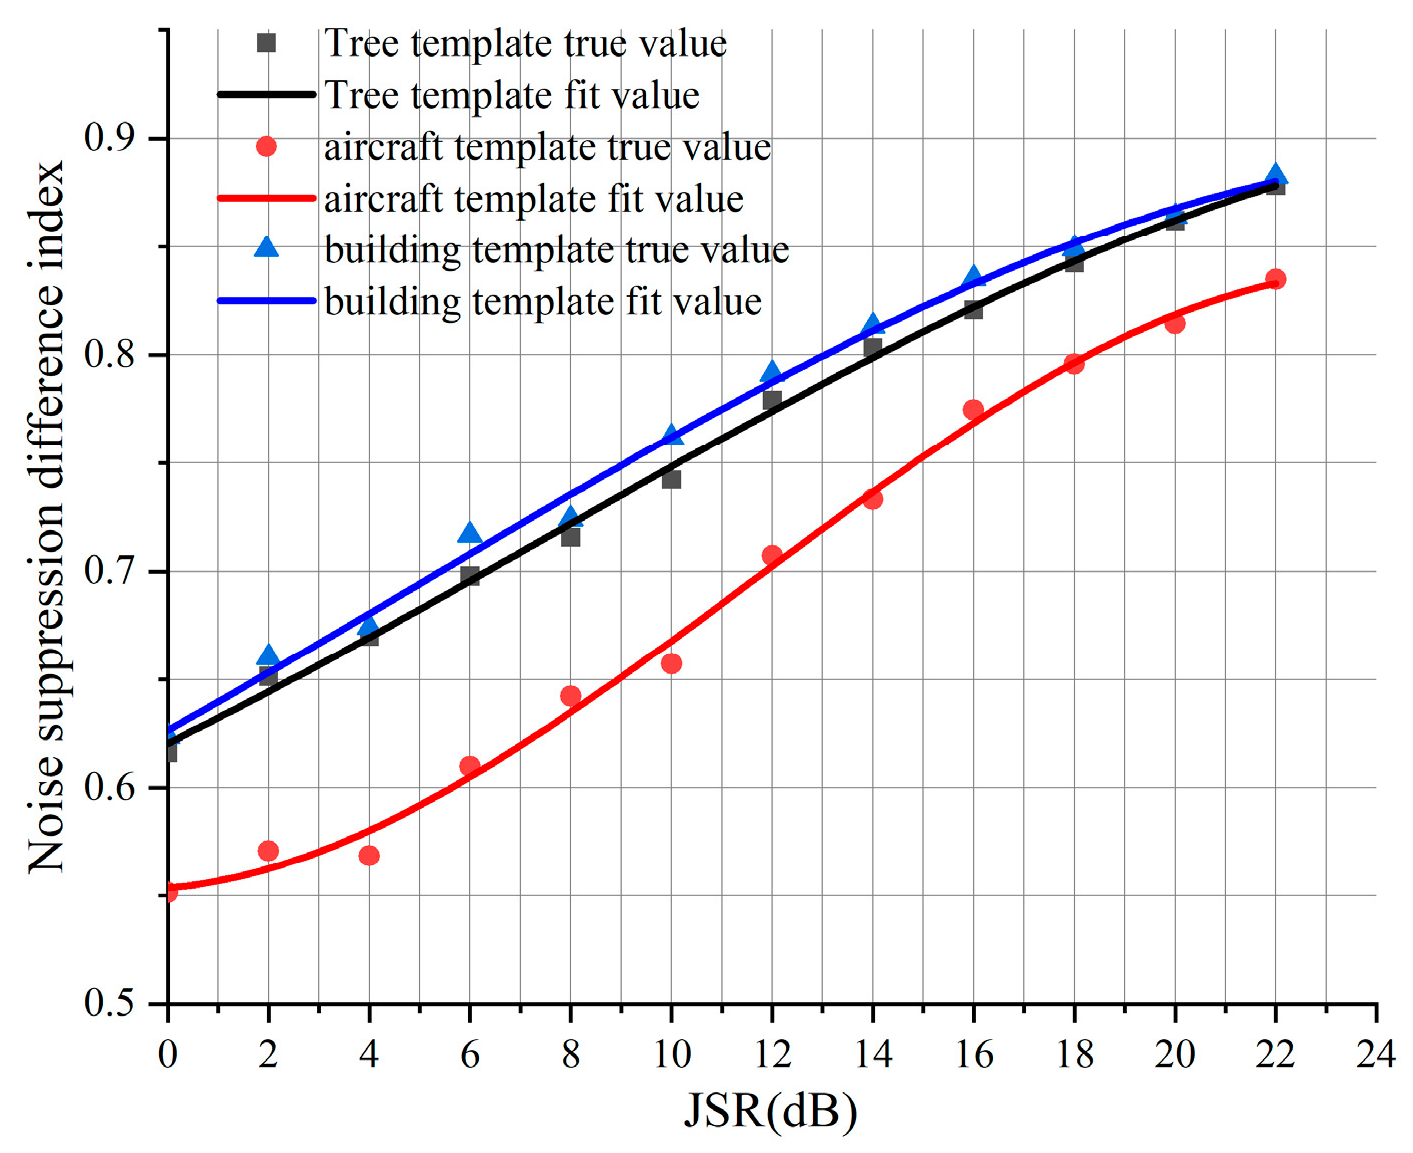
Figure 9 shows the quantization results of the noise suppression difference index, the scatter points indicate the measured values, and the curves are the fitted curves of the noise suppression difference index with the change in the JSR (the black, red, and blue colors correspond to the tree, aircraft, and building templates). The experimental results show that firstly, the noise suppression difference index of the building template is the largest, the tree template is the second largest, and the airplane template is the smallest under any JSR, indicating that the building template has the highest degree of exposure; and secondly, that the noise suppression difference index of all templates shows a rising trend with the increase in the JSR, indicating that the exposure of the jamming templates is enhanced with the increase in the JSR.

5.2. Iterative Optimization Process of Convex-Decomposition Weight Decomposition Methods

The four feature parameters analyzed earlier, namely the brightness change gradient, texture direction contrast degree, edge matching degree, and noise suppression difference index, reveal the differences between different backgrounds, different JSRs, and different templates from the dimensions of brightness, texture, edge, and noise, respectively. However, since the contribution degrees of each feature parameter to the evaluation indicator of the deception degree are significantly different and not equal, this section conducts iterative optimization based on the convex-decomposition method to determine the optimal weights among feature parameters.
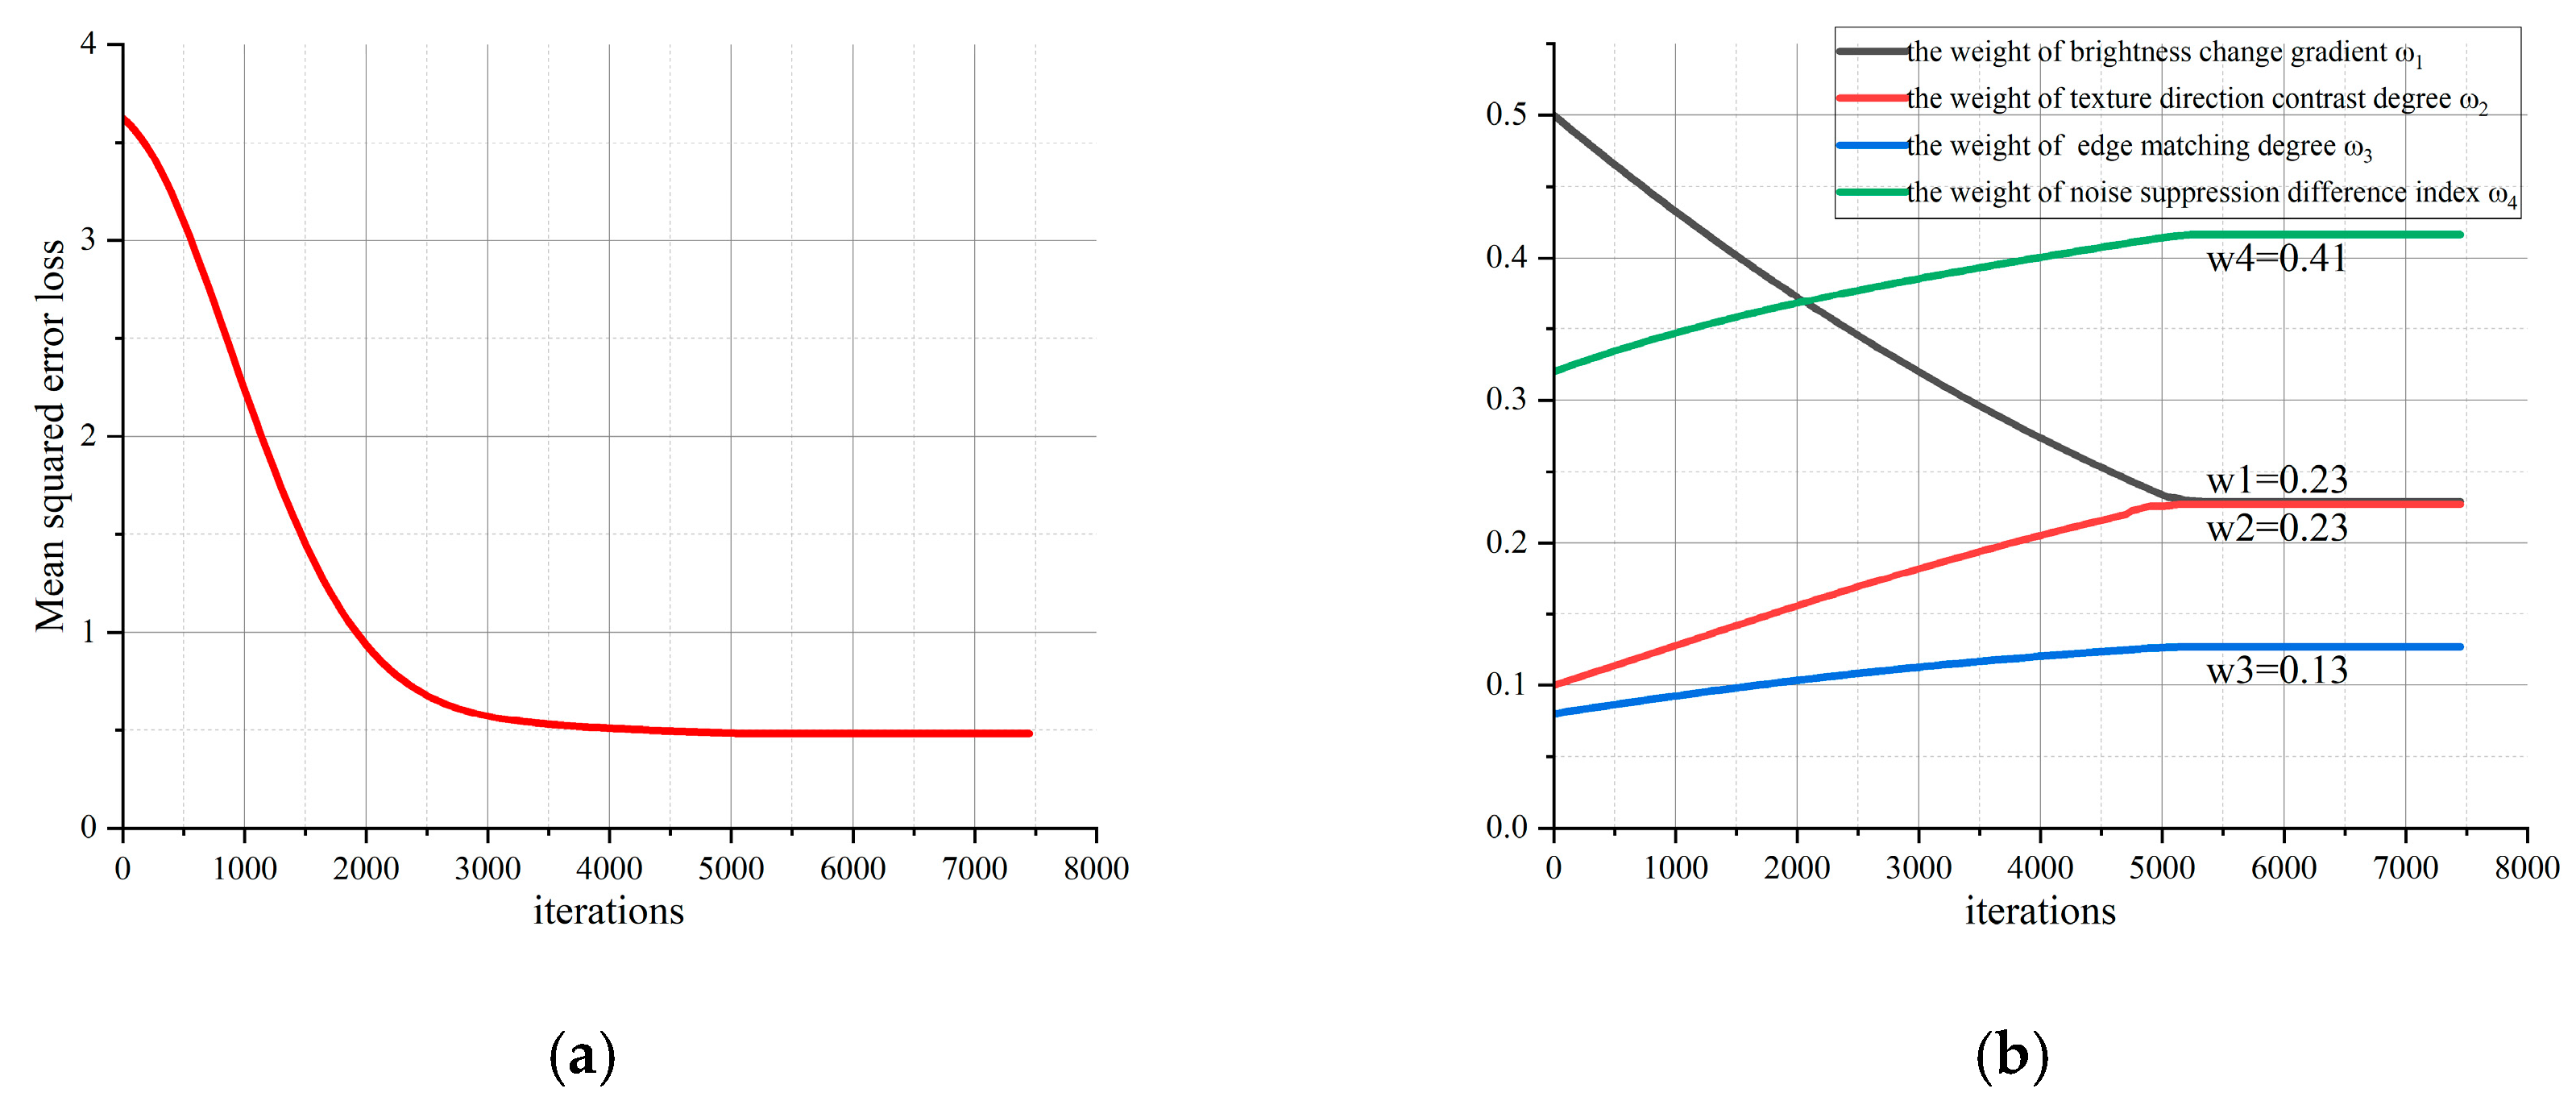
Specifically, the process of determining the weights of each feature parameter based on the convex-decomposition weight decomposition method is as follows: the formula for the deception degree is shown in Equation (21), and the specific iteration trajectory is presented in Figure 10. Figure 10a illustrates the convergence process of the mean square error loss between the deception degree and the evaluation value with the number of iterations; Figure 10b corresponds to the dynamic optimization curve of the weights of each feature parameter. It can be seen from the iteration results that the loss function error finally stabilizes at 0.48. At this time, the weights of each feature parameter converge to w 1 = 0.23 , w 2 = 0.23 , w 3 = 0.13 , and w 4 = 0.41 , respectively, indicating that this time has been stabilized to achieve the optimal weight configuration.
D = ω 1 ( 1 D 1 ) + ω 2 ( 1 D 2 ) + ω 3 D 3 + ω 4 ( 1 D 4 ) w 1 = x 1 w 2 = x 2 ( 1 x 1 ) w 3 = x 3 ( 1 x 2 ) ( 1 x 1 ) w 4 = ( 1 x 3 ) ( 1 x 2 ) ( 1 x 1 )

5.3. Analysis of the Relationship Between Scene Deception Degree and Jamming Detection Rate

In order to further quantify the correlation between the jamming effect and jamming concealment, this paper constructs a relationship model between the scene deception degree and jamming detection rate, with relevant results shown in Figure 11. Among them, Figure 11a–c, respectively, presents the variation trends of the jamming detection rate with the deception degree under tree, aircraft, and building templates, where the curves are fitting results and the scatter points are true values; Figure 11d shows the variation relationship between the jamming detection rate and scene deception degree under aircraft, building, and tree templates; Figure 11e gives the quantitative correlation characteristics between the scene deception degree and jamming detection rate within the entire test set.
From Figure 11d, it can be found that the jamming detection rate of the three templates gradually decreases as the scene deception degree is raised; when the scene deception degree is low, the jamming detection rate stays around 1.0, which makes it difficult to successfully deceive the jamming detection, and when the scene deception degree is gradually raised, with the aircraft templates in the lower deception interval (e.g., 0.2–0.6), the jamming detection rate decreases earlier; in the early stage of the tree templates (deception degree of 0.6), the jamming detection rate decreases less, and the high deception degree of 0.6 is less than 0.6, the jamming detection rate decreases less. The detection rate drop is small, with a high deception degree before the obvious decline; the building templates’ deceptions play a relatively smooth, between the aircraft and tree templates, indicating that the aircraft templates had the strongest jamming concealment, followed by the building templates, and finally the tree templates.
As can be seen in Figure 11e, when the deception degree is in the interval of 0~0.4, the jamming detection rate is maintained at 100%, indicating that jamming in this range is completely recognized; when the deception degree is more than 0.4, the jamming detection rate is in a linear decreasing trend with an increase in the deception degree, and the statistical analysis shows that its decreasing slope is about 1, that is, for every 0.1 increase in the deception degree, the jamming detection rate decreases by 0.1. This law reveals the influence of the deception degree on the covertness of jamming: When the deception degree is lower than 0.4, the abnormal characteristics of jamming have not been effectively masked, making it difficult to evade detection. However, once the scene deception degree exceeds the 0.4 threshold, the feature consistency between jamming and the background is significantly enhanced. The probability of detection decreases regularly with the increase in the scene deception degree.

6. Discussion

6.1. SAR Scene Deception Jamming Detection Results

The training set selected in this paper includes three typical jamming templates, 30 types of real SAR background images, and multiple levels of JSR parameters that are set to generate 810 jamming images and 810 non-jamming images, totaling 1620 SAR images. In this paper, we adopt the ResNet network to classify SAR image sub-blocks into jamming samples and non-jamming samples, thereby calculating the jamming detection rate. ResNet is a classic and influential network architecture in the field of deep learning. Compared with the traditional convolutional neural network, ResNet reduces the complexity of the model training by reducing the coupling between the network feature parameters and significantly improves the model’s characterization ability and generalization performance under the premise of guaranteeing computational efficiency.
In the SAR scene deception jamming detection neural network training experiments, this paper adopts the root mean square error and cross entropy as a double loss function as shown in Equations (22) and (23) to jointly optimize the model. Among them, the cross entropy is mainly used to deal with the classification task, which strengthens the model’s ability to discriminate the category features by measuring the difference between the predicted probability distribution and the true label distribution; the root mean square error focuses on the regression task, which improves the model’s accuracy of predicting continuous variables by calculating the square root of the average error squared between the predicted value and the true value. The training process is set up with a total of 100 Epochs, and each Epoch contains 100 iterations.
R M S E = 1 n i = 1 n ( y i y ^ ) 2
H ( p , q ) = i = 1 C p ( x i ) log ( q ( x i ) )
The detection results are shown in Figure 12; the first to third rows are the jamming data of tree templates, airplane templates, and building templates, respectively, and the JSR of each column is 0–18 dB, which gradually increases every 6 dB. A horizontal comparison finds that as the JSR increases, the jamming detection rate gradually increases; when the JSR reaches 12 dB, the jamming is completely exposed; by a vertical comparison, it can be found that the three kinds of template jamming probabilities have been improved; the aircraft template jamming detection rate rose significantly less than the other templates, the construction template in the first period of growth was slow, but the later period of the growth was apparent; and in the same JSR, the detection rate of the tree template jamming was higher; so in a comprehensive evaluation, under the same JSR, the aircraft template had the strongest concealment, while the tree template had the worst concealment.

6.2. Ablation Experiment

To verify the effectiveness of the feature parameters proposed in this paper, we gradually test the evaluation performance of the system after removing a single feature parameter through ablation experiments, and the results are shown in Figure 13, which contains four groups of comparison curves, corresponding to the removal of the brightness change gradient, texture direction contrast, edge matching degree, and noise suppression difference index in the four categories of core indexes for the ablation test.
After removing the brightness change gradient (Figure 13a), when the deception degree breaks through 0.4, the decay slope of the detection rate of the ablation group increases significantly, and it is lower than that of the complete system by 8%~12%. After removing the texture direction contrast (Figure 13b), when the deception degree is >0.4, the complete system shows a smooth decay trend, and after removing this indicator, the decay rhythm of the ablation group is intensified and the fluctuation amplitude of the curve increases. After removing the edge matching degree (Figure 13c), the curve of the ablation group in the interval of 0.5~0.7 of the deception degree has a sharp fluctuation in “plummeting and rebounding”, and the lowest detection rate is about 15% lower than that of the complete system. After removing the noise suppression difference index (Figure 13d), the detection rate of complete system in the interval of 0.4–0.8 of the deception degree is lower than that of the ablation group by 5–10%; in the interval of 0.6–0.9, the curve of the ablation group fluctuates drastically.
Table 1 presents the average detection rates across different SDD intervals, where (a) represents the complete system, and (b), (c), (d), and (e) correspond to the scenarios with brightness, texture, edge, and noise features removed, respectively. At low SDDs (0.2–0.4), all detection rates are close to 100%. As the SDD increases, (c) (with texture features removed) yields the lowest detection rate, while (d) (with edge features removed) yields the highest. This indicates that texture features have a more significant impact on detection, whereas edge features have a relatively smaller influence.
The results of the four ablation experiments fully demonstrate that the four types of feature parameters constructed in this paper have significant functional complementarities in the jamming detection task, and the redundancy between feature parameters in low deception scenarios makes the absence of a single feature parameter have a limited impact on the overall performance, but as the deception degree increases, feature parameters collaborate to support the accuracy and stability of the jamming detection by capturing the differentiated characteristics of the brightness, texture, edge, and noise dimensions. The absence of any feature parameter will lead to a significant decrease in the detection rate and an intensification of curve fluctuations. This verifies the necessity of the collaborative design of multidimensional indices in the complete evaluation system and highlights the adaptability value of the feature parameter system proposed in this paper for complex jamming scenarios.

7. Conclusions

Aiming at the core demand of deception jamming effectiveness evaluation in SAR countermeasures, this paper proposes an evaluation method for SAR scene deception jamming, underlining jamming detection. On the one hand, to excavate multilevel and multidimensional SAR image contents for jamming discrimination, four elaborate feature parameters, i.e., the brightness change gradient, texture direction contrast degree, edge matching degree, and noise suppression difference index, are extracted, which distinguish the jamming from the background and protected targets in visual and non-visual manners. On the other hand, to adaptively determine the weights of the above feature parameters for evaluation indicator design, a convex-decomposition weighting framework with nonlinear iterative optimization driven by a loss function design is established; this guarantees a comprehensive evaluation index, i.e., a scene deception degree (SDD), to reflect the differences in jamming concealment under different scenes. By constructing a SAR scene deception jamming dataset with different jamming templates, jamming backgrounds, and JSRs, this paper eventually correlates the SDD with jamming detection conducted on the deep learning scheme. The results reveal that when the SDD exceeds 0.4, the detection rate decreases linearly with the increasing SDD. That is, for every 0.1 increase in the SDD, the jamming detection rate decreases by approximately 0.1. This provides an intuitive basis for the quantitative evaluation of jamming effects. In the future, more complex jamming templates and backgrounds will be involved to verify the finding.

Author Contributions

Conceptualization, H.Z. (Hai Zhu) and S.Q.; methodology, H.Z. (Hai Zhu) and S.Q.; software, H.Z. (Hai Zhu); validation, H.Z. (Hai Zhu), S.Q., S.X. and H.Z. (Haoyu Zhang); formal analysis, H.Z. (Haoyu Zhang) and S.X.; investigation, H.Z. (Hai Zhu); resources, S.Q. and S.X.; data curation, H.Z. (Hai Zhu) and S.X.; writing—original draft preparation, H.Z. (Hai Zhu); writing—review and editing, S.Q. and S.X.; visualization, H.Z. (Hai Zhu) and H.Z. (Haoyu Zhang); supervision, S.Q. and S.X.; project administration, S.Q. and H.Z. (Hai Zhu); funding acquisition, S.Q. and S.X. All authors have read and agreed to the published version of the manuscript.

Funding

This research was funded by The National Natural Science Foundation of China, grant number 62471471.

Data Availability Statement

The original contributions presented in the study are included in the article, further inquiries can be directed at the corresponding author.

Conflicts of Interest

The authors declare no conflicts of interest.

References

  1. Liu, Y.; Li, J.; Yang, L.; Xu, C. Evaluation of SAR Jamming Effect Based on Texture Structure Similarity and Contour Similarity. Mod. Electron. Technol. 2023, 46, 34–38. [Google Scholar]
  2. Chen, T.; Zhang, H.; Lu, F. A Method for Evaluating SAR Jamming Effect Based on AHP and Target Detection and Recognition Performance. Command Control Simul. 2022, 44, 66–72. [Google Scholar]
  3. Gao, C.; Zhang, W.; Wang, Y.; Tan, D. SAR Jamming Effect Evaluation Method Combining Hierarchical Visual Features and Structural Similarity. Electron. Inf. Warf. Technol. 2019, 34, 46–50. [Google Scholar]
  4. Han, G.; Ma, X.; Dai, D.; Xiao, S. SAR Jamming Effect Evaluation Method Based on Structural Similarity. Mod. Def. Technol. 2012, 172, 163–167. [Google Scholar]
  5. Lu, H.; Lu, J.; Guo, J. A SAR Jamming Effect Evaluation Method Based on Correlation Measure. Mod. Def. Technol. 2008, 112, 97–99. [Google Scholar]
  6. Han, G.; Liu, Y.; Li, Y. SAR Jamming Effect Evaluation Based on Visual Weighted Processing. Radar Sci. Technol. 2011, 1, 18–23. [Google Scholar]
  7. Zhou, G.; Shi, C.; Yang, Y.; Li, H. SAR Jamming Effect Evaluation Method Based on Entropy. Aerosp. Electron. Countermeas 2006, 4, 33–35. [Google Scholar]
  8. Liu, J.; Da, T.; Sun, J.; Wang, S.; Zhang, W. An Intelligent Evaluation Method for SAR Image Jamming Effect. Shipboard Electron. Countermeas. 2020, 43, 78–82. [Google Scholar]
  9. Han, G.; Li, Y.; Xing, S.; Liu, Q.; Yang, W. Evaluation Method for Effect of New-Type SAR Deception Jamming. Acta Astronaut. 2011, 9, 1994–2001. [Google Scholar]
  10. Camastra, F.; Vinciarelli, A. Estimating the intrinsic dimension of data with a fractal-based method. IEEE Trans. Pattern Anal. Mach. Intell. 2002, 10, 1404–1407. [Google Scholar] [CrossRef]
  11. D’Hondt, O.; Lopez-Martinez, C.; Ferro-Famil, L.; Pottier, E. Quantitative analysis of texture parameter estimation in SAR images. In Proceedings of the 2007 IEEE International Geoscience and Remote Sensing Symposium, Barcelona, Spain, 23–28 July 2007; IEEE: Barcelona, Spain, 2007; pp. 274–277. [Google Scholar]
  12. Xiang, S.; Xue, J.; Yu, L.; Chen, C. No-reference depth quality assessment for texture-plus-depth images. In Proceedings of the 2014 IEEE International Conference on Multimedia and Expo (ICME), Chengdu, China, 14–18 July 2014; IEEE: Chengdu, China, 2014; pp. 1–6. [Google Scholar]
  13. Yelmanov, S.; Romanyshyn, Y. Assessment of Image Information Capacity Based on the Analysis of Brightness Increments Distribution. In Proceedings of the 2022 IEEE 41st International Conference on Electronics and Nanotechnology (ELNANO), Kyiv, Ukraine, 10–14 October 2022; IEEE: Kyiv, Ukraine; pp. 640–645. [Google Scholar]
  14. Li, Y.; Liu, M. GEO Spatial Correlation SAR Imaging Framework Using MBO2D-SC Algorithm for Sea Surface Wave Imaging Under Prolonged Synthetic Aperture Time. IEEE Sens. J. 2025, 25, 25168–25184. [Google Scholar] [CrossRef]
  15. Chateigner, C.; Guennec, Y.; Ros, L.; Siclet, C. On Asymmetrically Clipped Hybrid FSK-Based Unipolar Modulations: Performance and Frequency-Domain Analysis. In Proceedings of the 2025 IEEE Wireless Communications and Networking Conference (WCNC), Milan, Italy, 24–27 March 2025; IEEE: Milan, Italy, 2025; pp. 1–6. [Google Scholar]
  16. Zhang, X.; Zhao, L. No-reference Image Quality Evaluation Method Based on zero-shot learning and Feature Fusion. In Proceedings of the 2025 5th International Symposium on Computer Technology and Information Science (ISCTIS), Xi’an, China, 16–18 May 2025; IEEE: Xi’an, China, 2025; pp. 114–117. [Google Scholar]
  17. Liu, G.; Wang, J.; Ban, T. Frame detection based on cyclic autocorrelation and constant false alarm rate in burst communication systems. China Commun. 2015, 12, 55–63. [Google Scholar] [CrossRef]
  18. Shang, S.; Wu, F.; Zhou, Y.; Liu, Z.; Yang, Y.; Li, P. Research on Moving Target Shadow Simulation of Video SAR. In Proceedings of the 2022 5th International Conference on Information Communication and Signal Processing (ICICSP), Shenzhen, China, 26–28 November 2022; IEEE: Shenzhen, China, 2022; pp. 192–196. [Google Scholar]
  19. Zhang, C.; An, H.; Lou, M. SAR Radio Frequency Interference Region-Intensity Feature Extraction and Joint Evaluation Network. Radar Sci. Technol. 2024, 22, 391–399. [Google Scholar]
  20. Long, W.; Guo, Y.; Xu, Y. SAR Image Detection Based on Bipartite Matching Transformer. J. Signal Process. 2024, 40, 1648–1658. [Google Scholar]
  21. Cai, Z.; Xing, S.; Quan, S.; Su, X.; Wang, J. A power-distribution joint optimization arrangement for multi-point source jamming system. Results Eng. 2025, 27, 106856. [Google Scholar] [CrossRef]
  22. Ammar, M.A.; Abdel-Latif, M.S.; Elgamel, S.A.; Azouz, A. Performance Enhancement of Convolution Noise Jamming Against SAR. In Proceedings of the 2019 36th National Radio Science Conference (NRSC), Port Said, Egypt, 16–18 April 2019; IEEE: Port Said, Egypt, 2019; pp. 126–134. [Google Scholar]
  23. Cheng, S.; Zheng, H.; Yu, W.; Lv, Z.; Chen, Z.; Qiu, T. A Barrage Jamming Suppression Scheme for DBF-SAR System Based on Elevation Multichannel Cancellation. IEEE Geosci. Remote Sens. Lett. 2023, 20, 4008305. [Google Scholar] [CrossRef]
  24. Chang, X.; Li, Y.; Zhao, Y.; Du, Y.; Liu, D.; Wan, J. A Scattered Wave Deceptive Jamming Method Based on Genetic Algorithm against Three Channel SAR GMTI. In Proceedings of the 2021 CIE International Conference on Radar (Radar), Haikou, China, 15–19 December 2021; IEEE: Haikou, China, 2021; pp. 414–419. [Google Scholar]
  25. Wang, Y.; Liu, Z.; Huang, Y.; Li, N. Multitarget Barrage Jamming Against Azimuth Multichannel HRWS SAR via Phase Errors Modulation of Transmitted Signal. IEEE Geosci. Remote Sens. Lett. 2024, 21, 4014605. [Google Scholar] [CrossRef]
  26. Sun, Z.; Zhu, Z. Anti-Jamming Method for SAR Using Joint Waveform Modulation and Azimuth Mismatched Filtering. IEEE Geosci. Remote Sens. Lett. 2023, 20, 4012205. [Google Scholar] [CrossRef]
  27. Huang, L.; Dong, C.; Shen, Z.; Zhao, G. The Influence of Rebound Jamming on SAR GMTI. IEEE Geosci. Remote Sens. Lett. 2015, 12, 399–403. [Google Scholar] [CrossRef]
  28. Lv, Q.; Fan, H.; Liu, J.; Zhao, Y.; Xing, M.; Quan, Y. Multilabel Deep Learning-Based Lightweight Radar Compound Jamming Recognition Method. IEEE Trans. Instrum. Meas. 2024, 73, 2521115. [Google Scholar] [CrossRef]
  29. Zhao, B.; Huang, L.; Li, J.; Zhang, P. Target Reconstruction from Deceptively Jammed Single-Channel SAR. IEEE Trans. Geosci. Remote Sens. 2018, 56, 152–167. [Google Scholar] [CrossRef]
  30. Chen, S.; Lin, Y.; Yuan, Y.; Li, X.; Hou, L.; Zhang, S. Suppressive Interference Suppression for Airborne SAR Using BSS for Singular Value and Eigenvalue Decomposition Based on Information Entropy. IEEE Trans. Geosci. Remote Sens. 2023, 61, 5205611. [Google Scholar] [CrossRef]
  31. Zhou, F.; Tao, M.; Bai, X.; Liu, J. Narrow-Band Interference Suppression for SAR Based on Independent Component Analysis. IEEE Trans. Geosci. Remote Sens. 2013, 51, 4952–4960. [Google Scholar] [CrossRef]
  32. Huang, J.; Yin, J.; An, M.; Li, Y. Azimuth Pointing Calibration for Rotating Phased Array Radar Based on Ground Clutter Correlation. IEEE Trans. Geosci. Remote Sens. 2025, 63, 1000315. [Google Scholar] [CrossRef]
  33. Sui, R.; Wang, J.; Sun, G.; Xu, Z.; Feng, D. A Dual-Polarimetric High Range Resolution Profile Modulation Method Based on Time-Modulated APCM. IEEE Trans. Antennas Propag. 2025, 73, 1007–1017. [Google Scholar] [CrossRef]
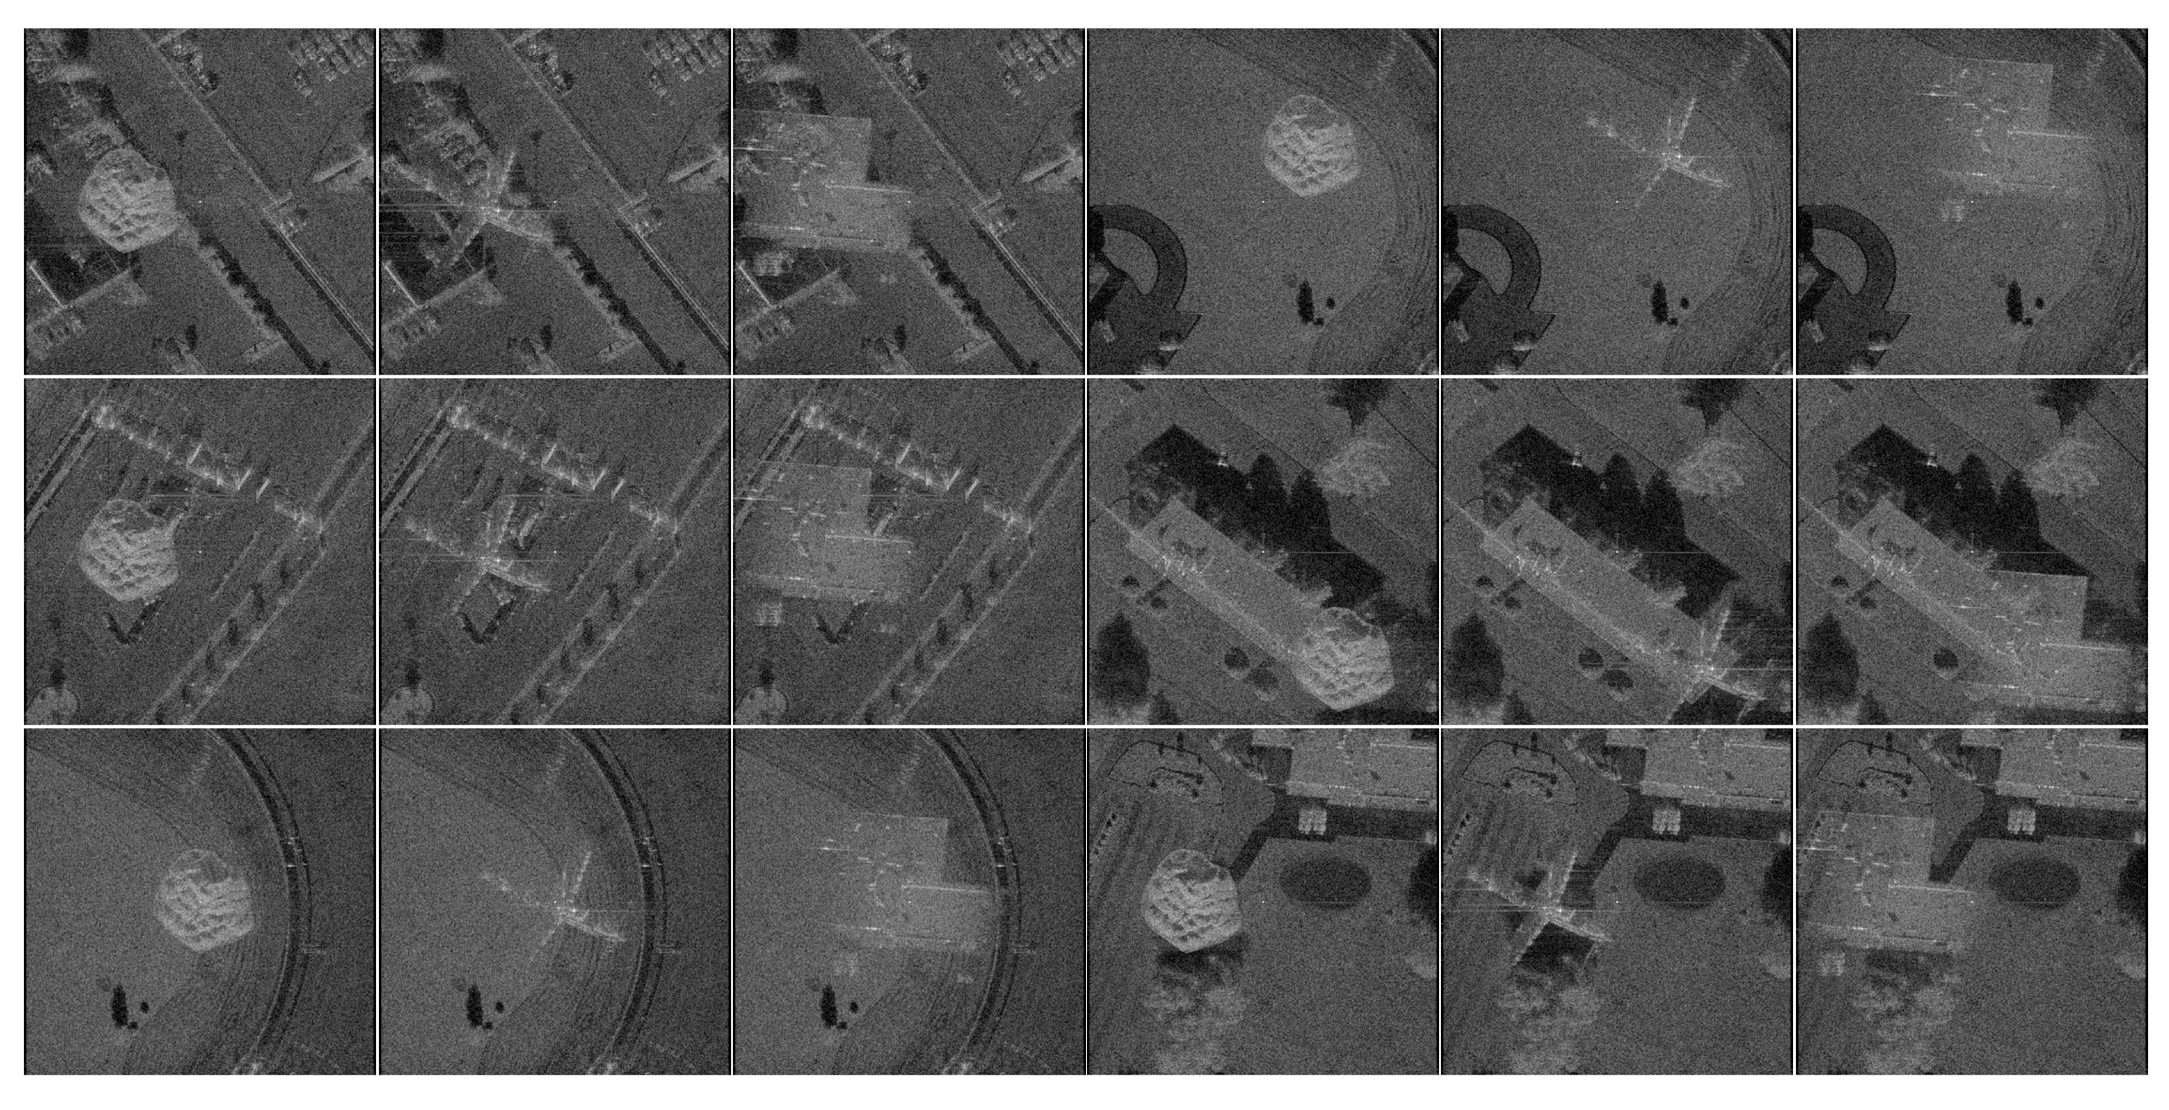
Figure 1. SAR scene deception jamming dataset under different backgrounds.
Remotesensing 17 03178 g001
Figure 2. Statistical results of SAR scene deception jamming dataset. ((a) Distribution of SAR image datasets (training datasets and test datasets); (b) the number of SAR images under different templates, different backgrounds, and different JSRs in test datasets).
Remotesensing 17 03178 g002
Figure 3. Parameter iteration process in brightness change gradient. ((a) Curve of average brightness difference between jamming and background. (b) Curves of visual system sensitivity coefficient and perceived threshold offset).
Remotesensing 17 03178 g003
Figure 4. Schematic of feature parameter weight decomposition via convex-decomposition method.
Remotesensing 17 03178 g004
Figure 5. Curves depicting the relationship between brightness change gradient and JSR for different jamming templates (tree, aircraft, building).
Remotesensing 17 03178 g005
Figure 6. Variation relationship of texture direction contrast degree under different JSRs. ((a) Curves showing the relationship between texture direction contrast degree and JSR for three jamming templates (tree, aircraft, building) under the same background. (b) Curves illustrating the relationship between texture direction contrast degree and JSR for the same jamming template across different background regions (A, B, C, D)).
Remotesensing 17 03178 g006
Figure 7. Variation relationship of edge matching degree under different JSRs. ((a) Curves demonstrating the relationship between edge matching degree and JSR for the same jamming template across different background areas (A, B, C, D). (b) Curves showing the relationship between the comprehensive value of the edge matching degree and texture direction contrast degree versus JSR for the same jamming template across different background areas (A, B, C, D)).
Remotesensing 17 03178 g007
Figure 8. Visualization results of multiplicative noise for tree, aircraft, and building jamming templates under different JSRs (blue indicates low logarithmic variance of noise, yellow indicates high logarithmic variance of noise); (a) Visualization result of multiplicative noise with 10dB tree template; (b) Visualization result of multiplicative noise with 10dB building template; (c) Visualization result of multiplicative noise with 10dB aircraft template; (d) Visualization result of multiplicative noise with 20dB tree template; (e) Visualization result of multiplicative noise with 20dB building template; (f) Visualization result of multiplicative noise with 20dB aircraft template.
Remotesensing 17 03178 g008
Figure 9. Curves depicting the relationship between noise suppression difference index and JSR for three jamming templates (tree, aircraft, building) (scatter points represent measured values, curves represent fitted results).
Remotesensing 17 03178 g009
Figure 10. Fitting process of feature parameters of convex-decomposition method. ((a) Trend of fitting error with the number of iterations. (b) Change in weights of feature parameters with number of iterations).
Remotesensing 17 03178 g010
Figure 11. Correlation between deception degree and jamming detection rate. ((ac) Relationship between scene deception degree and jamming detection rate of tree, aircraft, and building templates. (d) Correlation between scene deception degree and jamming detection rate among different templates. (e) Correlation between scene deception degree and jamming detection rate).
Remotesensing 17 03178 g011
Figure 12. Jamming detection results of some SAR images.
Remotesensing 17 03178 g012
Figure 13. Relationship between jamming detection rate and scene deception degree after removing a single feature parameter. (a) Jamming detection rate versus deception degree when removing brightness change gradient compared with the complete evaluation system; (b) Jamming detection rate versus deception degree when removing texture direction contrast degree compared with the complete evaluation system; (c) Jamming detection rate versus deception degree when removing edge matching degree compared with the complete evaluation system; (d) Jamming detection rate versus deception degree when removing noise suppression difference index compared with the complete evaluation system.
Remotesensing 17 03178 g013
Table 1. The average detection rate of each interval in the ablation experiment.
SDD Interval(a)(b)(c)(d)(e)
0.2–0.499.9%99.8%99.9%99.9%99.9%
0.4–0.695.2%86.7%99.1%97.0%94.9%
0.6–0.869.8%62.8%78.7%70.1%67.7%
0.8–1.055.5%58.4%60.5%59.6%60.0%
Disclaimer/Publisher’s Note: The statements, opinions and data contained in all publications are solely those of the individual author(s) and contributor(s) and not of MDPI and/or the editor(s). MDPI and/or the editor(s) disclaim responsibility for any injury to people or property resulting from any ideas, methods, instructions or products referred to in the content.