Article

Comprehensive Assessment of GPM-IMERG and ERA5 Precipitation Products Across Ireland

School of Transport and Civil Engineering, Technological University Dublin, D01 K822 Dublin, Ireland
*
Author to whom correspondence should be addressed.
Remote Sens. 2025, 17(18), 3154; https://doi.org/10.3390/rs17183154
Submission received: 7 August 2025 / Revised: 6 September 2025 / Accepted: 9 September 2025 / Published: 11 September 2025
(This article belongs to the Special Issue Precipitation Estimations Based on Satellite Observations)

Abstract

Accurate precipitation estimates are essential for hydrological modeling and flood forecasting, particularly in regions like Ireland where rainfall patterns are highly variable and extreme events are becoming more frequent. This study evaluates the performance of two widely used gridded precipitation datasets, ERA5 reanalysis and GPM IMERG (Early, Late, and Final run) precipitation products, against ground-based observations from 25 synoptic stations operated by Met Éireann, Ireland’s national meteorological service, over the period of 2014–2021. A grid-to-point matching method was applied to ensure spatial alignment between gridded and point-based data. The datasets were assessed using seven statistical and categorical metrics across hourly and daily timescales, meteorological seasons, and rainfall intensity classes. Results show that ERA5 consistently outperforms IMERG across most evaluation metrics, particularly for low-to-moderate intensity rainfall associated with winter frontal systems, and demonstrates strong temporal agreement and low bias in coastal regions. However, it tends to underestimate short-duration, high-intensity events and displays higher false alarm rates at the hourly scale. In contrast, IMERG-Final exhibits improved detection of extreme rainfall events, especially during summer, and performs more reliably at daily resolution. Its spatial performance is stronger than the Early and Late runs but still limited in Ireland’s western regions due to complex climatological settings. IMERG-Early and Late generally follow similar trends but tend to overestimate rainfall in mountainous regions. This study provides the first systematic intercomparison of ERA5 and IMERG datasets over Ireland and supports the recommendation of adopting a hybrid approach of combining ERA5’s seasonal consistency with IMERG-Final’s event responsiveness for enhanced rainfall monitoring and hydrological applications.

1. Introduction

Over the past recent decades, northwestern Europe, including Ireland, has experienced a noticeable increase in the frequency and intensity of extreme weather events, contributing to more frequent and severe flooding [1]. Climate projections further indicate that such extreme weather events will continue to intensify and generate flooding, especially in flood-prone regions like Ireland [2]. The unprecedented floods of winter 2015–2016 demonstrated Ireland’s vulnerability to extreme weather events and highlighted the necessity of using accurate and spatially comprehensive rainfall data for effective hydrological modeling and flood forecasting [3]. Although Ireland benefits from a well-established network of rain gauges operated by Met Éireann “https://www.met.ie/climate/what-we-measure/rainfall (accessed on 20 February 2025)”, data gaps persist in remote and upland areas, reducing the spatial coverage of ground observations.
To address these limitations, satellite-based precipitation estimates and atmospheric reanalysis products offer a practical alternative, providing continuous, spatially consistent rainfall measurement [4]. Among satellite-derived precipitation products, the Integrated Multi-satellitE Retrievals for the Global Precipitation Measurement (IMERG) mission stands out due to its high spatial (0.1° × 0.1°) and temporal (half-hourly) resolution [5]. IMERG combines microwave and infrared satellite measurements along with ground-based gauge data to provide global rainfall estimates through three distinct data products: the Early run (IMERG-Early), Late run (IMERG-Late), and Final run (IMERG-Final). These three products differ primarily in their latency and the degree of processing. IMERG-Early, with a latency of approximately four hours, supports time-critical operations such as flood forecasting [6]. IMERG-Late (available within 14 h) improves upon this by incorporating additional satellite data through backward propagation [6]. IMERG-Final, designed for research and climatological applications, undergoes monthly bias correction using Global Precipitation Climatology Centre (GPCC) gauge data, offering improved accuracy for model calibration and long-term analysis [5,6]. In parallel, ERA5, the fifth-generation reanalysis dataset from the European Centre for Medium-Range Weather Forecasts (ECMWF), delivers hourly global precipitation data at 0.25° resolution, generated through advanced data assimilation of satellite and ground observations [7].
IMERG has been extensively validated across diverse geographical and climatic conditions, with studies demonstrated its effectiveness in applications such as flood forecasting, drought monitoring, and streamflow simulation [6,8,9,10,11]. IMERG-Final has generally shown superior performance due to gauge calibration, though results vary significantly with terrain, seasonality, and precipitation type [12,13,14,15,16,17]. Beyond general precipitation estimation, IMERG has also been tested for its ability to capture extreme rainfall events, an essential capability for early warning and disaster risk reduction. Studies across China [12,18], Iran [19], Europe [16,20,21], and Turkey [22] show that while IMERG products can capture the timing and intensity of extreme events, their accuracy is highly dependent on local climate, topography, and event characteristics. IMERG-Final consistently outperforms the other runs in measuring heavy rainfall, yet the IMERG-Early and IMERG-Late remain valuable in operational forecasting.
ERA5 has been validated in recent years as it has become one of the most widely used reanalysis datasets for precipitation estimation. It provides high spatiotemporal resolution, consistent coverage, and integration of a broad range of satellite and in situ observations [23,24]. Numerous studies have demonstrated that ERA5 performs well in capturing large-scale, stratiform precipitation, particularly in mid-latitude regions influenced by frontal systems [25]. However, its accuracy tends to decline in regions with complex topography, significant land sea gradients, or convective rainfall, where event-level variability is poorly represented due to model resolution and parameterization constraints [26,27]. Evaluations across diverse regions and settings, including China, Mongolian Plateau, Spain, Iran and Ethiopia, have reported underestimation of high-intensity rainfall and reduced detection skill in mountainous and transitional climatic zones [27,28,29,30,31,32,33]. Despite clear improvements over its predecessor, ERA-Interim, ERA5 still exhibits regional biases, especially under dynamic rainfall regimes.
Despite widespread use of IMERG and ERA5 in global and regional applications ranging from streamflow simulation to extreme rainfall detection and climate trend analysis [7,23,24,34,35,36], their performance in Ireland has not been evaluated. Given Ireland’s distinct hydroclimatic setting, characterized by the coexistence of frontal and convective rainfall systems, moderate topographic variation, and increasing exposure to short-duration, high-intensity precipitation events, it is essential to assess how accurately these datasets represent local precipitation dynamics. This is particularly relevant for flood forecasting and hydrological modeling, where both accuracy and latency of precipitation estimates directly affect model performance. A dedicated evaluation of IMERG’s three latency-dependent products alongside ERA5 will help quantify their strengths and limitations and provide a scientific basis for their appropriate use in operational and research applications within the Irish context.
Thus, the aim of this study is to evaluate the accuracy and reliability of the satellite IMERG (Early, Late, Final runs) and reanalysis ERA5 precipitation datasets across Ireland. High-quality daily and hourly precipitation records from ground stations are used to assess the performance of these products over the period from 2014 to 2021. To provide a comprehensive assessment the analysis considers multiple temporal resolutions, seasonal variation, and rainfall intensity classes, with particular focus on the detection of extreme events. By addressing this regional gap, the study aims to enhance understanding of how these datasets can support hydrological, meteorological, and climate-related applications in the Irish context.

2. Materials and Methods

2.1. Study Area

The study area covers the entire Republic of Ireland, located on the Atlantic seaboard of Western Europe between latitudes 51°23′–55°26′N and longitudes 5°59′–10°40′W (Figure 1). Ireland shares a land border with Northern Ireland to the north and is bordered by the Atlantic Ocean to the west, the Celtic Sea to the south, St George’s Channel to the southeast, and the Irish Sea to the east [37]. Covering approximately 70,273 km2 [38], Ireland’s landscape is characterized by a broad, low-lying central limestone plain, surrounded by more rugged coastal uplands and mountain ranges. The highest elevation is Carrauntoohil in County Kerry, reaching 1038 m above sea level. Approximately 60% of the country’s land area lies below 100 m in elevation, while mountainous terrain is primarily confined to the west and south.
Ireland’s climate is classified as temperate maritime, shaped largely by the warm North Atlantic Drift and prevailing south-westerly winds from the Atlantic Ocean. The moderating effects of the surrounding seas and elevation gradients lead to relatively mild temperatures, with mean annual values generally ranging between 9 °C and 10 °C. Coastal regions experience slightly higher temperatures compared to inland areas, and frost days are relatively rare compared to continental Europe [38,39].
Precipitation across Ireland is predominantly driven by Atlantic frontal systems, particularly during the autumn and winter months. The southwest region receives the highest moisture influx due to exposure to prevailing westerlies and warm sea surface temperatures. Orographic uplift further intensifies rainfall in the mountainous west, where annual totals often exceed 2000–3000 mm—especially in Counties Kerry and Galway. In contrast, the eastern and central lowlands typically receive between 700 mm and 1000 mm annually, with the national average for 1981–2010 being approximately 1230 mm [39]. Rainfall exhibits pronounced seasonality: the wettest period occurs between October and January, dominated by Atlantic depressions and enhanced by ocean-atmosphere heat exchanges. In summer, rainfall increasingly includes convective activity, particularly in the more continental eastern regions. Historical records, such as those from Phoenix Park in Dublin, show August as the wettest month, highlighting the influence of localized summer convection. April tends to be the driest month nationwide [39,40].
Ireland also experiences high cloud cover throughout the year, with an average of around 50–60% sky coverage annually. The number of sunshine hours is relatively low by European standards, typically ranging between 1100 and 1600 h per year, depending on location. The western and northern coasts are generally cloudier, while the southeast tends to receive slightly more sunshine. Cloud dynamics, combined with complex orography and maritime influences, contribute to the spatial and temporal variability of rainfall across the island. These climatic and topographic conditions significantly shape Ireland’s hydrology. High rainfall totals combined with impermeable soils and a dense river network result in high runoff rates and frequent flooding, especially during the winter months [39,40].

2.2. Datasets

This study assesses a combination of satellite-derived and reanalysis-based precipitation datasets over Ireland to evaluate their performance across varied rainfall intensities, time scales, and seasons against ground-based dataset. These datasets include high-quality observations from Met Éireann’s weather stations, satellite precipitation products from the GPM-IMERG portal, and atmospheric reanalysis data from ERA5. Details of each dataset are provided below.

2.2.1. Met Éireann Synoptic Stations Data

Ground-based precipitation observations were obtained from 25 synoptic weather stations maintained by Met Éireann, the Irish national meteorological service. These stations comprise both: five human-crewed stations, namely Shannon Airport, Dublin Airport, Casement, Cork Airport, and Knock Airport, where trained observers collect hourly meteorological records, and 20 fully automatic weather stations, which operate at sub-hourly frequency and generate hourly summaries via onboard algorithms. These stations are distributed across Ireland, covering a range of climatic zones, topographies, and coastal/inland settings. The spatial distribution of the stations ensures comprehensive national coverage, including high-rainfall western coastal areas and relatively dry eastern lowlands (Figure 1). For this study, hourly and daily rainfall data were acquired for the period January 2014 to September 2021, with quality-controlled records accessed from Met Éireann’s publicly available archive “https://www.met.ie/climate/available-data (accessed on 15 January 2025)”. These observational data serve as the reference (“ground truth”) for evaluating the satellite and reanalysis datasets. To ensure consistency and comparability, the minimum rainfall threshold considered was 0.01 mm/day, and the same stations were used across all temporal and spatial analyses. Descriptive statistics of daily rainfall for the 25 synoptic stations are summarized in Table 1.

2.2.2. IMERG Satellite Precipitation Products Datasets

Satellite precipitation data were obtained from the Integrated Multi-satellite Retrievals for the Global Precipitation Measurement (GPM-IMERG) portal, version V06B, produced by NASA’s Precipitation Measurement Missions (PMM). IMERG offers three variants based on latency and processing level: IMERG Early Run (IMERG-Early)—near real-time (~4 h latency), IMERG Late Run (IMERG-Late)—intermediate (~14 h latency), and IMERG Final Run (IMERG-Final), post-processed and bias-corrected using gauge data (typically ~3.5 months delay). All versions provide 0.1° × 0.1° spatial resolution and 30 min temporal resolution, globally, between 60°N and 60°S. For this study, the three IMERG datasets were obtained for the duration between January 2014 to September 2021 via the NASA Precipitation Portal (https://gpm.nasa.gov/data/directory, accessed on 5 February 2022). The data were processed in HDF5 format and converted to CSV after spatial sub-setting over Ireland. To match the temporal resolution of station data, IMERG products were aggregated to hourly and daily time steps.
IMERG V06 includes several improvements over earlier versions. Notably, it replaces the cloud-top motion vector estimation from infrared (IR) data with motion fields derived from total precipitable water vapor based on reanalysis, improving motion vector accuracy. Additionally, V06 includes a new “likelihood of liquid precipitation” layer to better differentiate between liquid, solid, and mixed-phase precipitation. Spatial coverage was also extended by morphing microwave data at higher latitudes, enhancing performance in mid-latitude regions such as Ireland [41,42]. This makes V06B especially suitable for evaluating performance in the challenging coastal, topographically complex regions of western Ireland.

2.2.3. European Centre for Medium-Range Weather Forecast (ECMWF) Reanalysis-5 (ERA5)

The ERA5 dataset is the fifth-generation atmospheric reanalysis product developed by the European Centre for Medium-Range Weather Forecasts (ECMWF). ERA5 improves upon its predecessor (ERA-Interim) by incorporating advances in model physics, resolution, and data assimilation. It is based on the Integrated Forecasting System (IFS) Cycle 41r2, operational since 2016, and employs a four-dimensional variational (4D-Var) data assimilation system. ERA5 provides hourly precipitation data at a 0.25° × 0.25° spatial resolution, along with over 140 meteorological variables on 137 vertical levels [7].
ERA5 data for the Irish domain were obtained from the Copernicus Climate Data Store (CDS) (https://cds.climate.copernicus.eu/, accessed on 5 January 2023) for the period 2014–2021. The hourly data were aggregated to daily resolution using a custom Python (v 3.9.13) script, ensuring consistency with the IMERG and station data.

2.3. Methodology

2.3.1. Coordinate Matching

To ensure accurate spatial alignment between gridded precipitation datasets (IMERG and ERA5) and ground-based observations from synoptic stations, a grid-to-point matching approach was applied. For each station, the nearest grid cell centroid was identified using a spatial search radius of half the grid resolution (0.05° for IMERG, 0.125° for ERA5). This process, adapted from the Coordinate Matching Process (CMP) method [43], ensured that each station’s observations corresponded spatially with the appropriate grid-based estimate.

2.3.2. Evaluation Framework

To evaluate the accuracy and reliability of satellite-based and reanalysis precipitation products across Ireland, a comprehensive evaluation framework was developed, incorporating multiple temporal and climatological dimensions. The assessment focused on two gridded dataset, IMERG (satellite-based) and ERA5 (reanalysis), using ground-based observations from 25 synoptic stations operated by Met Éireann as the reference or “truth” data. The evaluation covered an eight-year period from 2014 to 2021, enabling both long-term and seasonal comparisons.
Temporal resolution was a central aspect of the framework. Both hourly and daily precipitation data were assessed to capture the dataset’s performance across different rainfall timescales. The analysis enabled the evaluation of both short-duration rainfall events and accumulated daily totals, which are common under Ireland’s maritime climate. For each timescale, spatial detection skill was also evaluated, whereby the ability of IMERG and ERA5 to correctly detect rainfall events at individual station locations across the country was quantified. This allowed spatial differences in performance to be mapped and interpreted in terms of geographic or climatic influences.
The framework also accounted for seasonal variability by aggregating daily rainfall data into four standard meteorological seasons: Spring (March–May), Summer (June–August), Autumn (September–November), and Winter (December–February). This seasonal evaluation was essential for evaluating whether the datasets maintained consistent performance under different climatological conditions, as precipitation dynamics in Ireland are known to vary significantly throughout the year due to the influence of Atlantic weather systems and changing synoptic patterns. Within each season, spatial patterns in detection skill and error magnitude were assessed across all stations to evaluate whether product reliability was consistent across different regions of Ireland.
Furthermore, the framework incorporated a rainfall intensity-based evaluation to examine how well IMERG and ERA5 captured varying magnitudes of precipitation events. A classification scheme adapted from established rainfall intensity thresholds in previous studies [44,45], applied to both hourly and daily data. This approach defined thresholds for light, moderate, heavy, and very heavy rainfall, as outlined in Table 2, allowing for the assessment of product behavior across different intensity regimes.
Overall, the evaluation framework integrates multiple axes of comparison, temporal scale, seasonal representation, intensity classification, and spatial distribution, to provide a comprehensive assessment of precipitation product performance. The spatial dimension, in particular, ensures that regional disparities in detection accuracy and estimation skill are fully captured, helping to identify geographic limitations or strengths in the datasets. The results of this framework are further quantified using statistical performance metrics outlined in the following section.

2.3.3. Evaluation Metrics

Seven statistical and categorical performance metrics were used to assess the ability of IMERG and ERA5 to replicate observed rainfall and its statistical characteristics. These metrics were categorized to quantify the accuracy of the precipitation in terms of:
Detection:
  • Probability of Detection (POD): measures the proportion of observed rainfall events that were successfully captured by the satellite or reanalysis dataset. Values range from 0 to 1, with higher values indicating better detection performance and fewer missed events.
  • False Alarm Ratio (FAR): quantifies the frequency with which rainfall was incorrectly detected by the dataset when no precipitation occurred. It also ranges from 0 to 1, with lower values reflecting fewer false alarms and thus better performance.
  • Critical Success Index (CSI): evaluates overall detection accuracy by accounting for both missed and falsely detected events. Values range from 0 to 1, where higher values indicate stronger agreement with observations.
Errors in rainfall magnitude:
  • Mean Absolute Error (MAE): and Root Mean Squared Error (RMSE) assess the magnitude of differences between estimated and observed precipitation amounts. Both are expressed in the same units as precipitation. Lower values indicate higher agreement in precipitation amount, with RMSE being more sensitive to larger errors due to squaring.
  • Relative Bias (BIAS): reflects the average tendency of the dataset to overestimate or underestimate precipitation, expressed as a percentage. Values near 0% suggest minimal bias, while positive or negative values indicate overestimation or underestimation, respectively.
Correlation between precipitation datasets:
  • Pearson Correlation Coefficient (CC): measures the degree of linear association between the temporal variability of the dataset and observed rainfall. It ranges from −1 to 1, with values closer to 1 indicating strong agreement, and values near 0 or negative indicating weak or inverse correlation.
The mathematical definitions for all metrics are provided in Table 3.

3. Results

This section presents the evaluation results of the IMERG-Early, IMERG-Late, IMERG-Final and ERA5 datasets, using observations from 25 synoptic stations across Ireland. The analysis focuses on three key aspects: (i) temporal performance at hourly and daily resolutions, (ii) seasonality representation, and (iii) rainfall intensity detection capabilities of the precipitation datasets.

3.1. Temporal Resolution Evaluation

3.1.1. Detection Accuracy Across Temporal Scales

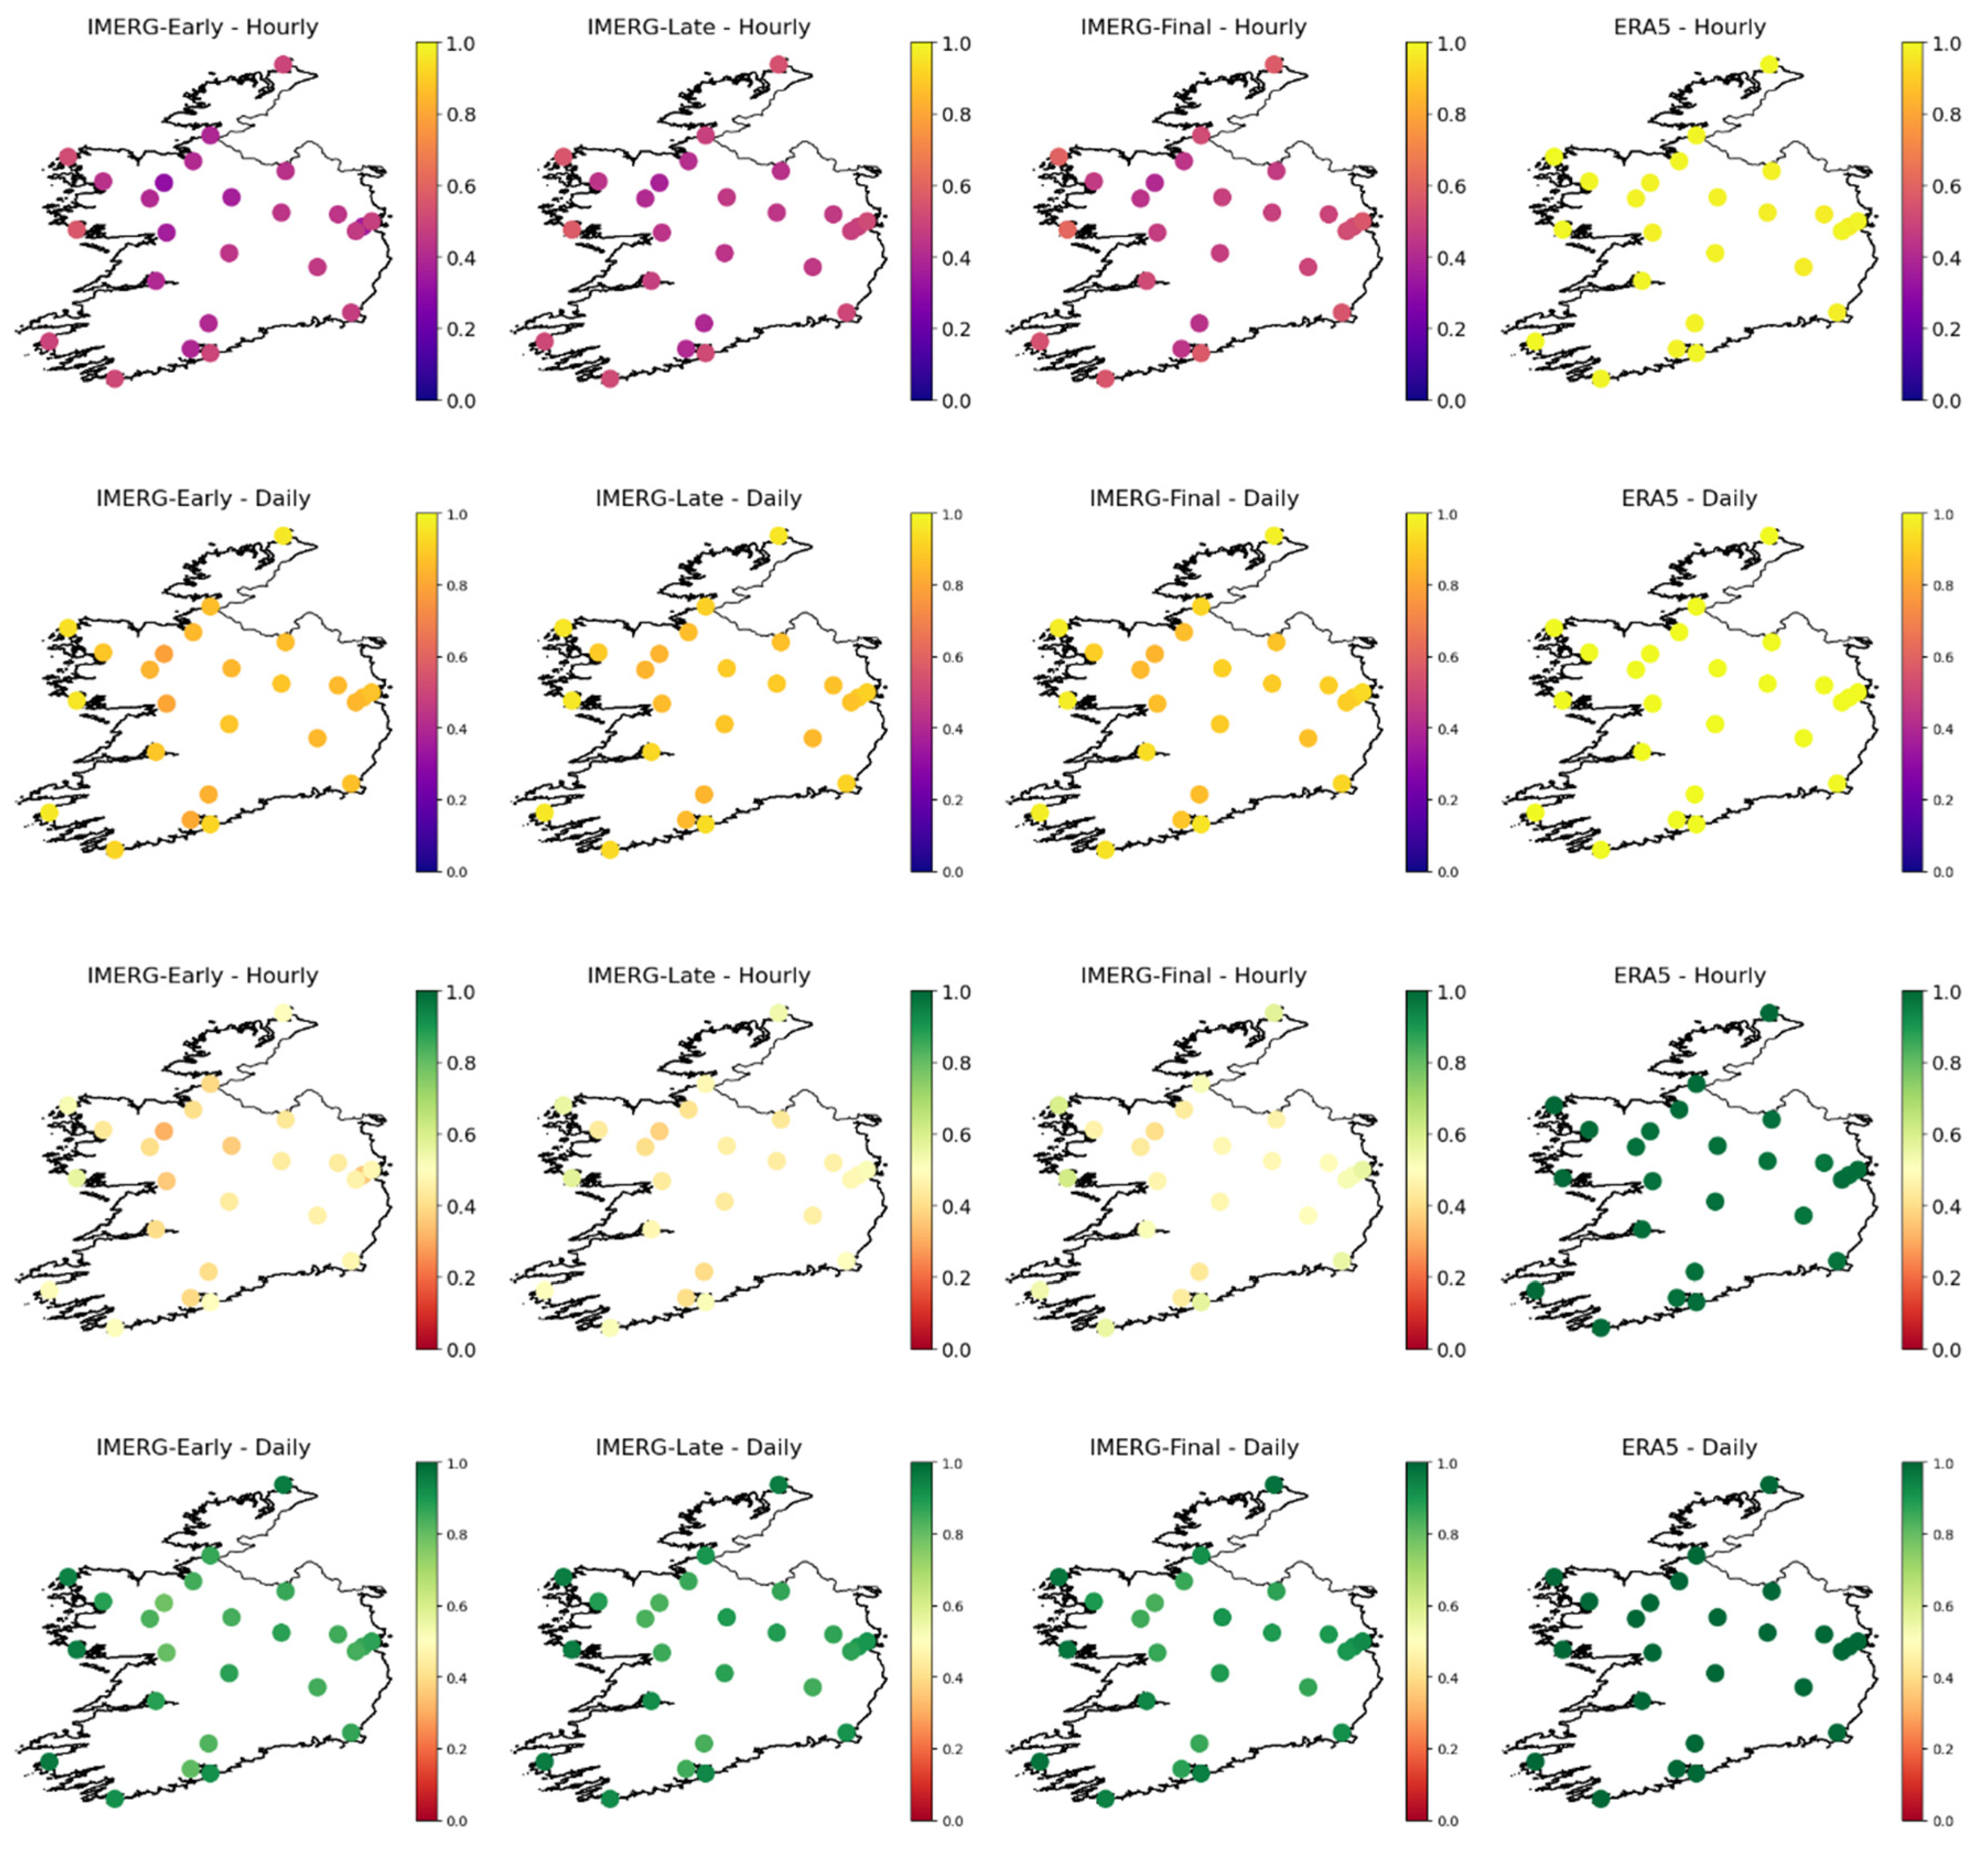
Detection performance across 25 Irish stations (2014–2021) reveals substantial resolution-dependent variability (Figure 2). At the hourly scale, all products demonstrate limitations in capturing short-duration rainfall events, with notable differences in performance. ERA5 exhibits the highest detection rates, with POD values ranging from 0.88 to 0.96, outperforming IMERG across nearly all stations. However, this comes at the cost of increased false positives, as reflected by its high FAR values (0.68–0.84). IMERG products detect rainfall less frequently, with PODs of 0.38–0.57 (IMERG-Early/IMERG-Late) and up to 0.62 for IMERG-Final, especially in coastal and southern regions. However, their lower FAR values indicate more conservative detection. CSI scores, which balance hits and false alarms, are highest for IMERG-Early (0.27–0.32) among the satellite products, while IMERG-Late and Final score lower (~10% reduction) though still lower than ERA5.
On the daily scale, all products exhibit substantial improvements in detection skill. ERA5 reaches near-perfect POD (0.98–1.00) and CSI (~0.80), while IMERG-Final achieves POD up to 0.97 and CSI ~0.75. IMERG-Early and Late record similar PODs (0.80–0.96) and slightly lower CSI values (~0.73), reflecting persistent under detection in some inland regions. FAR values decline markedly at the daily scale across all products, illustrating the well-known dampening effect of temporal averaging. IMERG-Early consistently produces the lowest daily FAR (0.09–0.26), followed by IMERG-Late and IMERG Final. ERA5 retains the highest FAR (0.21–0.38) even at daily resolution, suggesting an overestimation tendency in marginal events.
The detection metrics underscore critical trade-offs associated with the precipitation estimation methodologies underlying each product. ERA5 consistently exhibits the highest Probability of Detection (POD), reflecting its effective capturing of a wide spectrum of rainfall events, likely due to its reliance on atmospheric reanalysis and data assimilation techniques that provide a continuous, spatially coherent precipitation field. However, this strength in detection comes with the drawback of an elevated False Alarm Ratio (FAR), particularly pronounced at the hourly scale. This pattern suggests that ERA5 may overpredict marginal events due to its smooth, model-driven precipitation field. This pattern suggests that ERA5 may over-predict light or borderline precipitation near the detection threshold, which could be due to the nature of its model-generated precipitation fields. These fields tend to be spatially and temporally continuous, as they are derived from assimilation of multiple data sources and interpolation techniques. As a result, weak precipitation signals may be extended over broader areas or time periods than observed, potentially increasing the likelihood of false detections. Conversely, IMERG products demonstrate distinct operational characteristics, with IMERG-Early and IMERG-Late specifically exhibiting lower POD alongside markedly reduced FAR. This outcome indicates a deliberate prioritization of precision over recall, driven primarily by their dependence on near-real-time passive microwave and infrared retrievals. These retrieval methods inherently require robust precipitation signatures to trigger detection, thereby failing to detect lighter, more transient rainfall events that do not generate clear radiometric signals. This selective detection approach inherently reduces false alarms but sacrifices the capability to capture subtle or rapidly evolving precipitation phenomena, particularly those typical of localized convective or brief stratiform events. IMERG-Final balances the two extremes by incorporating gauge-based correction, improving POD without significantly increasing FAR, particularly at daily resolution.
Spatially (Figure 2), detection skill exhibits a distinct coastal to inland gradient closely aligned with Ireland’s dominant rainfall generating mechanisms. Coastal stations such as Valentia Observatory (Station ID: 2275) and Sherkin Island (Station ID: 775) demonstrate consistently higher detection accuracy due to frequent exposure to Atlantic frontal systems, which typically produce widespread, sustained rainfall events easier to detect by satellite sensors. Consequently, these coastal stations achieve higher POD and CSI and lower FAR, particularly evident in ERA5 and IMERG-Final products. In contrast, inland and upland regions, such as Knock Airport (Station ID: 4935 with highest elevation among stations), Oak Park (Station ID: 375) near in the Wicklow Mountains, frequently experience localized convective and orographic rainfall events. These events are typically short-lived and fragmented, challenging satellite-based sensors reliant on passive microwave and infrared retrievals, leading to notably lower detection scores and higher FARs in these areas.

3.1.2. Error Analysis

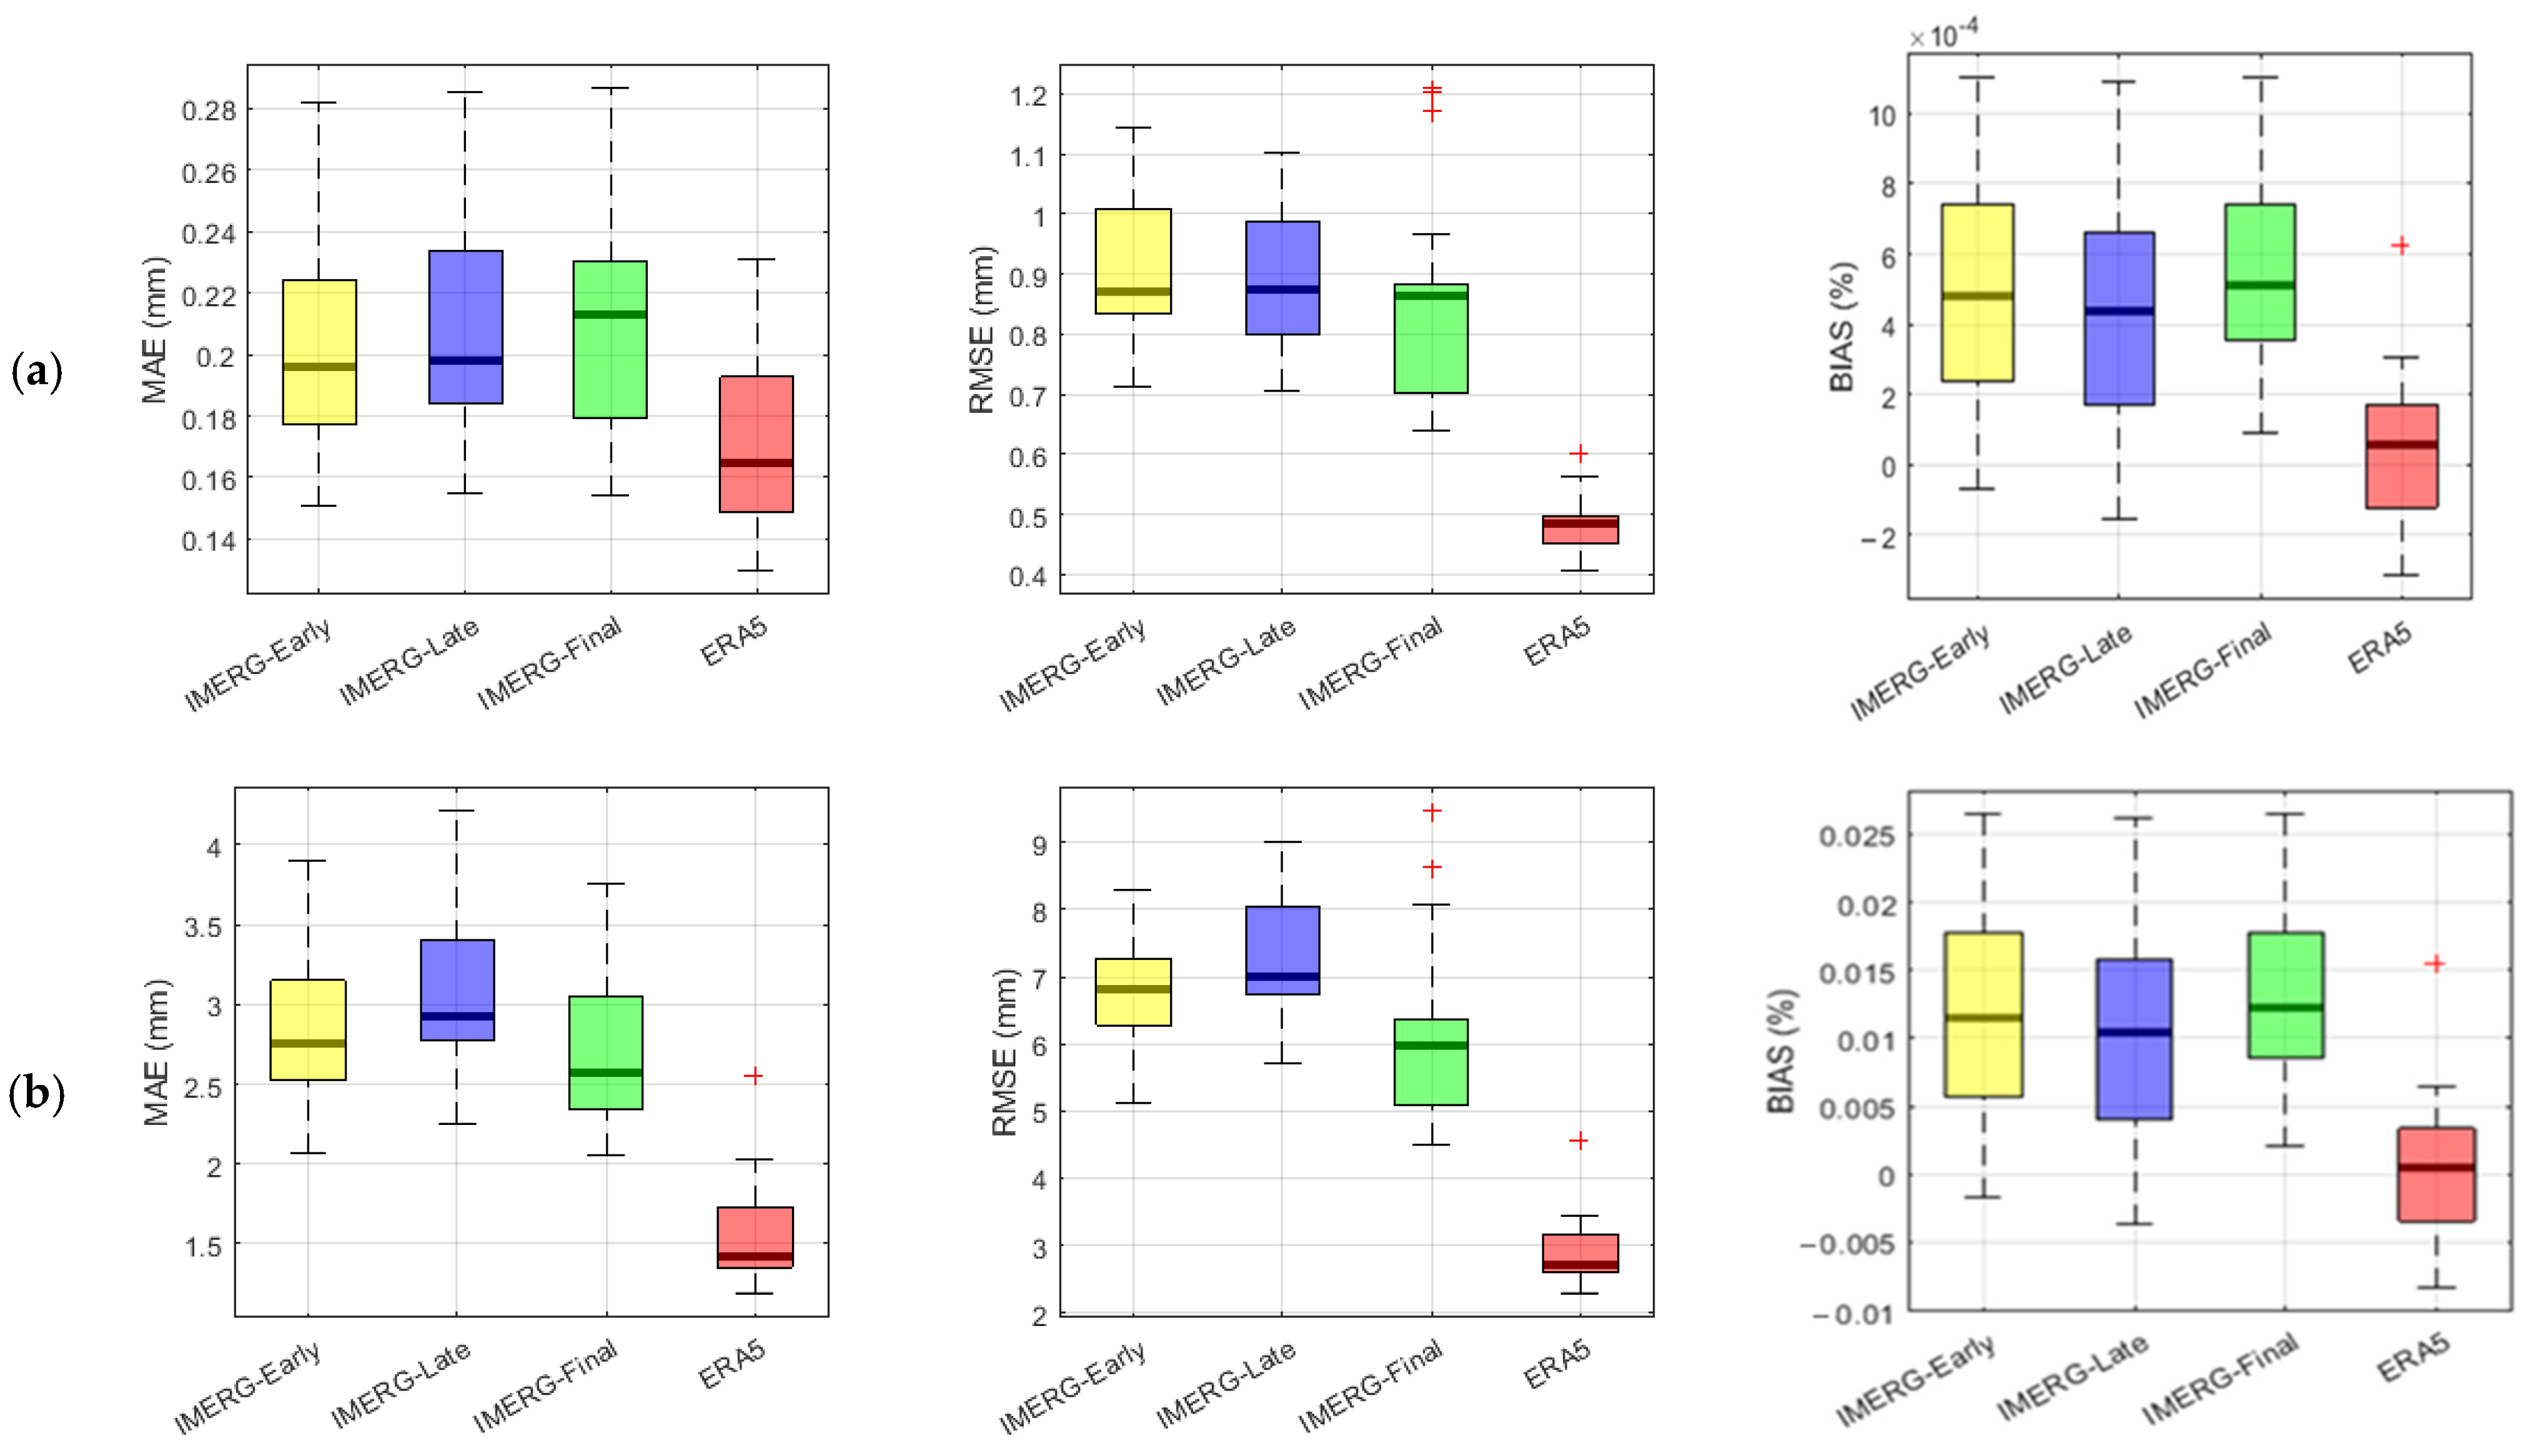
At the hourly scale, ERA5 clearly demonstrates superior accuracy relative to IMERG products, reflected by the lowest average MAE (~0.16 mm) and RMSE (~0.45 mm), alongside negligible bias. Boxplots in Figure 3a show that ERA5 has not only the lowest medium error values but also the narrowest interquartile ranges across all three statistics, indicating high spatial consistency in its performance across the 25 synoptic stations. This exceptional performance can be attributed to the reliance of ERA5’s on atmospheric reanalysis and continuous data assimilation which enables the production of more stable and spatially coherent hourly precipitation estimates.
Among the IMERG products, IMERG-Early shows the lowest median MAE (~0.20 mm) and RMSE (~0.80 mm) at the hourly scale. IMERG-Final, while benefiting from gauge-based correction, displays higher median errors (~0.21 mm MAE and ~0.85 mm RMSE) and a relatively narrower spread compared to IMERG-Late, which exhibits the broadest variability in both MAE (~0.22 mm) and RMSE (~0.90 mm). In terms of bias, all IMERG variants exhibit a positive skew, with median BIAS values ranging from approximately 1% to 1.5%, indicating a tendency to slightly overestimate rainfall, particularly in IMERG-Late. ERA5, by contrast, shows minimal and near-zero bias, reinforcing its balanced error structure.
At the daily scale (Figure 3b), absolute error values increase due to cumulative rainfall quantities, but relative performance patterns persist among the products. ERA5 remains the most accurate, with RMSE and MAE around 2.8 mm and 1.5 mm, respectively, and minimal bias, reinforcing its reliability for both time steps. IMERG-Final shows improved performance relative to IMERG-Early and IMERG-Late, with daily RMSE around 6 mm and MAE around 2.7 mm. IMERG-Early and Late show higher and more dispersed errors, with BIAS slightly positive (~1.5%) but more spatially variable.

3.1.3. Datasets Correlation

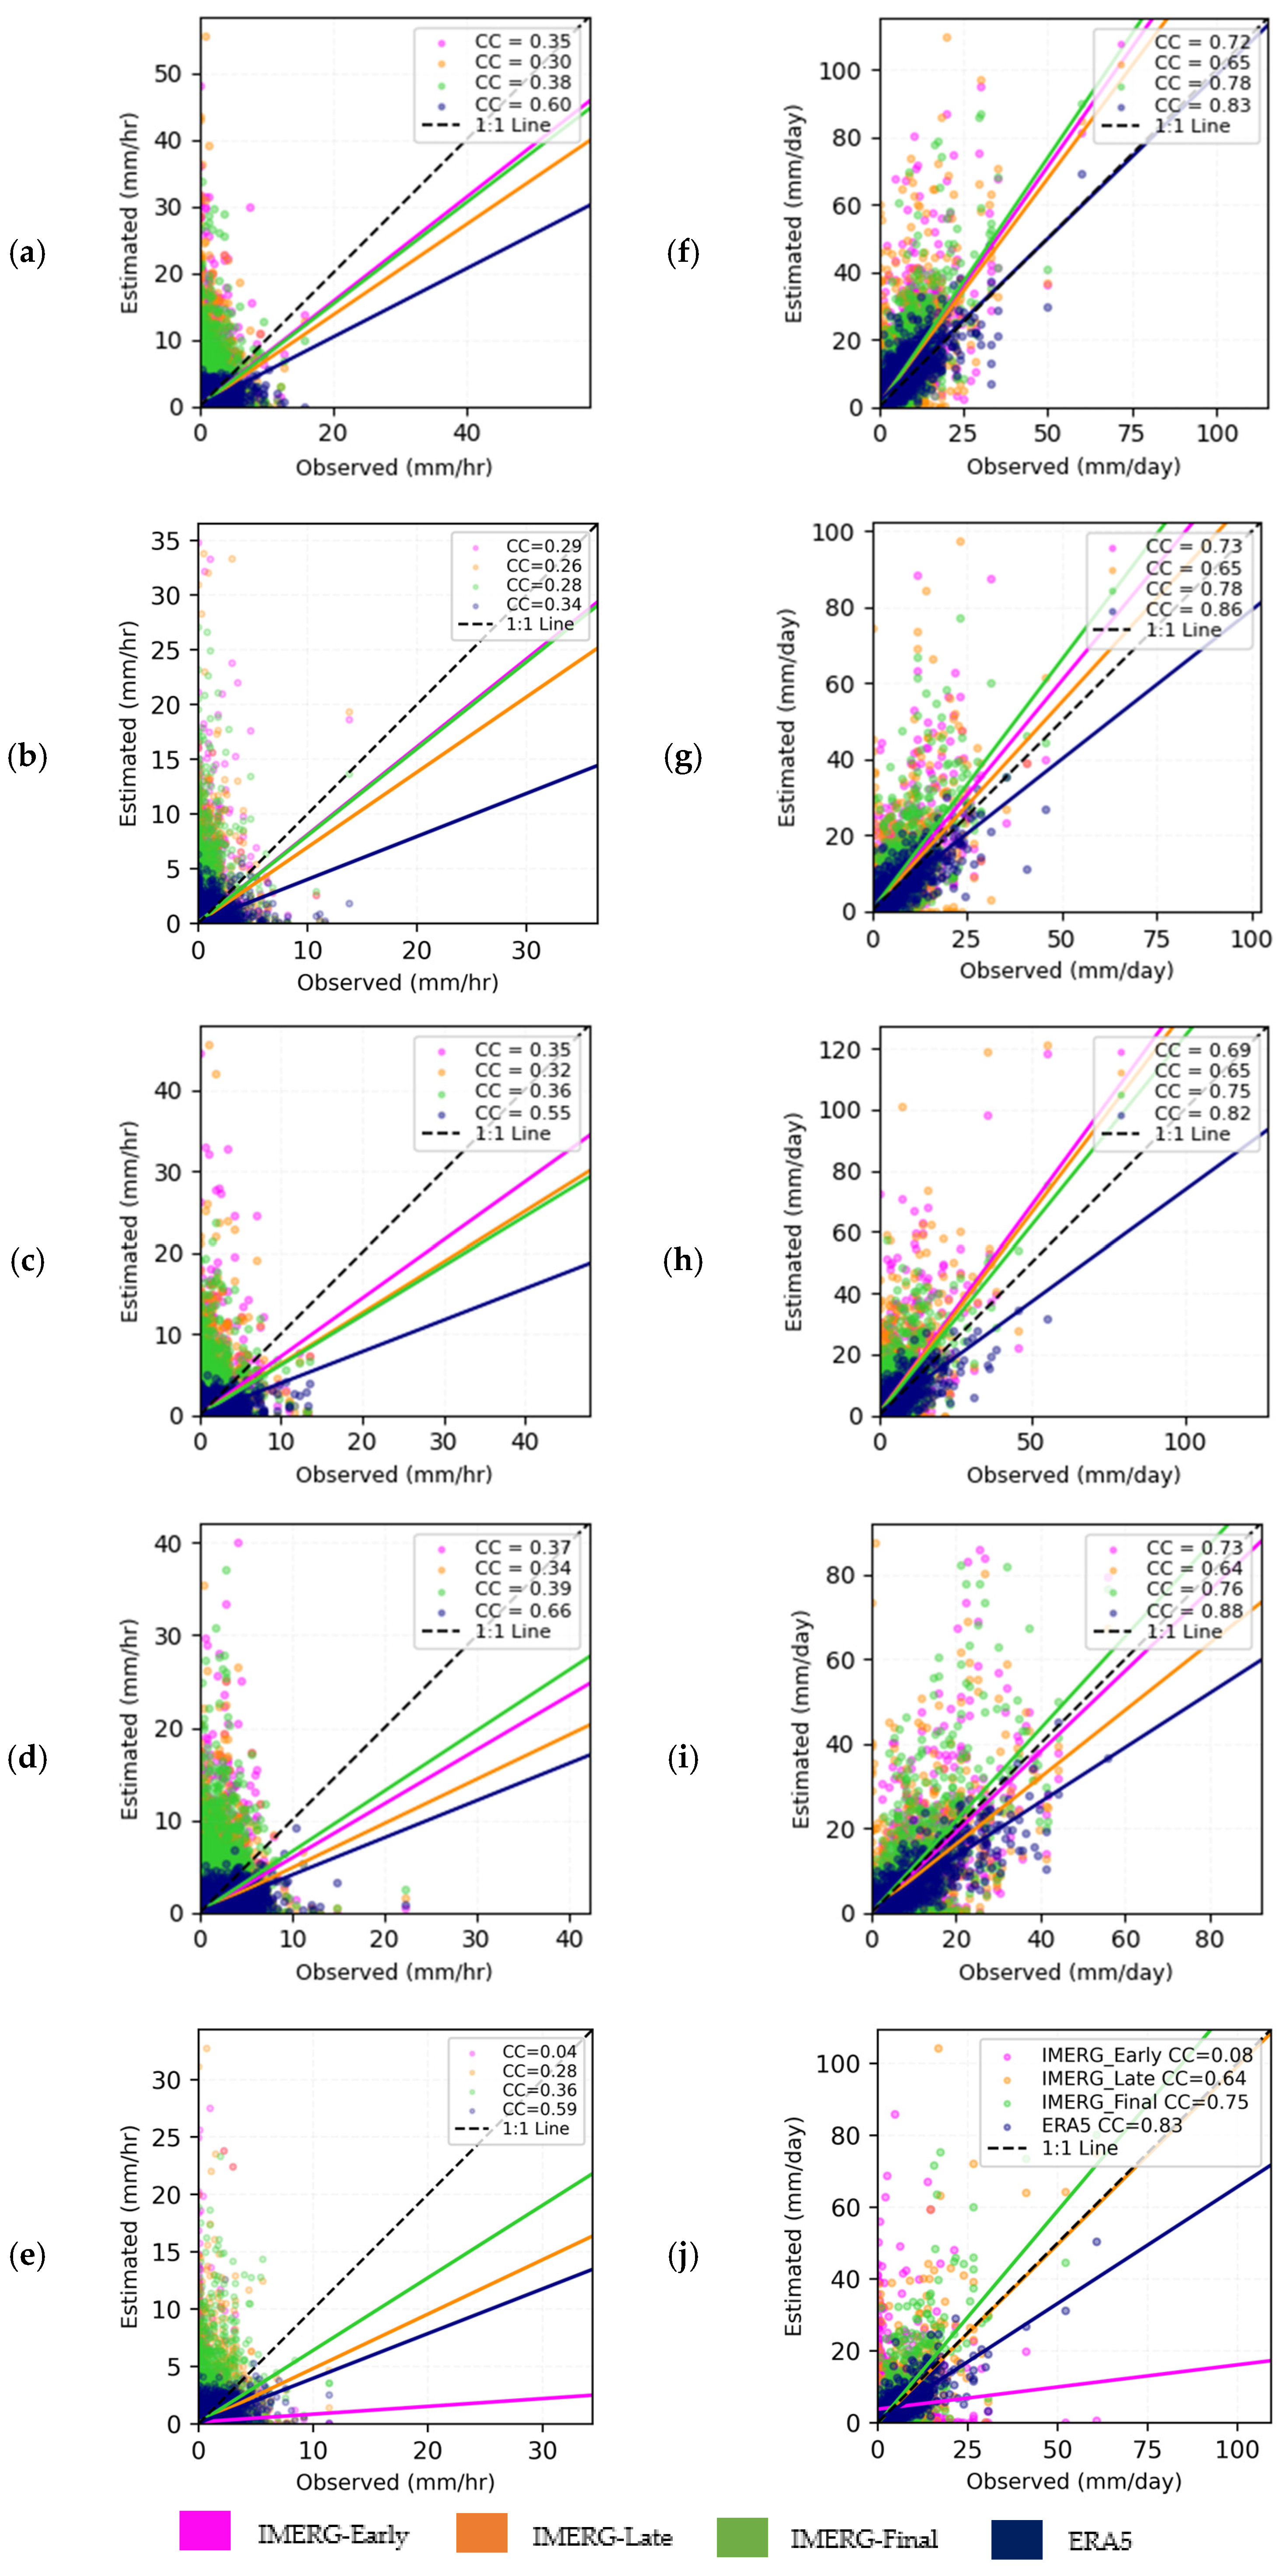
Average correlation coefficients (CC) across the 25 stations show modest performance at the hourly time series, with ERA5 leading (CC = 0.41), followed by IMERG-Final (0.36), IMERG-Early (0.34), and IMERG-Late (0.30). On the daily time series, ERA5 achieves CC = 0.86, and IMERG-Final improves most notably (CC = 0.75), followed by IMERG-Early (0.68) and IMERG-Late (0.62).
To illustrate temporal correlation patterns in more detail, scatter plots were generated for five representative stations across Ireland selected to capture geographic diversity, elevation contrasts, and rainfall regimes. These include Mace Head (Station ID 275), an exposed Atlantic coastal site at low elevation; Oak Park (Station ID 375), an inland site in the southeast located in a rain-shadow environment; Cork Airport (Station ID 3904), a southern high-elevation site; Knock Airport (Station ID 4935), the highest-elevation site in the west, frequently affected by Atlantic systems; and Casement (Station ID 3723), an inland lowland site in the east. Together, these stations span coastal and inland settings, upland and lowland conditions, and Atlantic-influenced versus sheltered environments. The correlation results for the 25 stations are provided in Table A1 (Appendix A). For all stations, two scatter plots are presented: one at the hourly scale (Figure 4a–e) and one at the daily scale (Figure 4f–j), comparing observed precipitation against estimates from the four satellite and reanalysis products (IMERG-Early, IMERG-Late, IMERG-Final, and ERA5). In each graph regression line and correlation coefficients (CC) are provided.
The plots reveal clear temporal-scale-dependent patterns. At the hourly scale, all products show limited agreement with observations, along with systematic underestimation, especially during high-intensity events. While ERA5 typically yields the highest CCs and most consistent regression behavior, the three IMERG versions often perform similarly to one another, indicating that post-adjustment offers limited benefit at this temporal resolution. The scatter and low regression slopes observed in hourly data likely stem from a combination of detection limitations, sensor revisit frequency, and rainfall timing mismatches across the products.
On a daily scale, performance improves markedly across all products. While ERA5 consistently achieves the highest correlation values, IMERG-Early and IMERG-Late frequently perform comparably to IMERG-Final, suggesting that the benefit of gauge correction is not uniform and may depend on regional rainfall characteristics. For instance, at Mace Head, a coastal station influenced by complex frontal systems, all products show substantial improvement, with IMERG-Final (CC = 0.78) closely tracking ERA5 (0.83). At Oak Park, an inland station situated in a rain-shadow region, IMERG-Final improves from 0.34 hourly correlation to 0.78 at the daily scale, aligning closely with IMERG-Early (0.73). At Casement, a lowland semi-urban site, all three IMERG products perform similarly across both time scales, indicating that post-processing adds limited value in such settings. Similarly, at Cork Airport, an upland site, the IMERG variants show nearly identical hourly CCs (ranging from 0.34 to 0.39), and all improve at the daily scale, though IMERG-Final maintains a slight lead. By contrast, at Knock Airport (western, high-elevation), daily CCs rank among the highest, with IMERG-Final approaching ERA5, whereas IMERG-Early is poor at both timescales.

3.2. Seasonal Based Evaluation

To understand how precipitation product performance varies with seasonal rainfall regimes in Ireland, this section evaluates detection accuracy, error statistics, correlation, and spatial patterns for daily precipitation across the four meteorological seasons, winter, spring, summer, and autumn. The assessment focuses on IMERG-Early, IMERG-Late, IMERG-Final, and ERA5 datasets against ground-based observations.
Consistent with established Irish climatology, winter and autumn are predominantly frontal with orographic enhancement along the Atlantic margin, whereas summer is more convectively influenced over land; spring is transitional. We interpret the seasonal results below in this climatological context without classifying individual events, (https://www.met.ie/climate/climate-of-ireland accessed on 4 September 2025) [40,46].

3.2.1. Seasonal Detection Accuracy

The detection accuracy of the IMERG-Early, IMERG-Late, IMERG-Final, and ERA5 precipitation products were evaluated using POD, CSI, and FAR metrics across different seasons: Spring, Summer, Autumn and Winter over Ireland from 2014 to 2021.
The seasonal evaluation of precipitation detection accuracy reveals how product performance is shaped by Ireland’s rainfall-generating mechanisms and seasonal variability. Table 4 presents the seasonal averages and standard deviations for the Probability of Detection (POD), Critical Success Index (CSI), and False Alarm Ratio (FAR) across 25 stations. During the Winter months, when precipitation is dominated by large-scale frontal systems, detection conditions are generally favorable. This is particularly evident in winter, which exhibited the clearest separation in performance between ERA5 and the IMERG variants. ERA5 achieved perfect detection scores (POD = 1.00 ± 0.00, CSI = 0.73 ± 0.05), with minimal false alarms (FAR = 0.13 ± 0.05), indicating its superior capacity to detect persistent winter precipitation events. However, the perfect POD partly reflects ERA5’s tendency to produce frequent light precipitation due to its coarse resolution and convective parameterization [47,48]; this can inflate false alarms in other seasons (spring–autumn). Hence, POD = 1 should not be read as flawless performance but interpreted alongside CSI and FAR.
In contrast, IMERG products had notably lower POD values (~0.81–0.83), with modest CSI (~0.69–0.70), and higher FARs (~0.18–0.19), with IMERG-Final outperforming IMERG-Early and IMERG-Late. As rainfall patterns become more variable in spring, all IMERG variants demonstrated improvement in POD (~0.86–0.89), but CSI remained relatively unchanged compared to winter (~0.67), suggesting increased false alarms and/or marginal improvements in hit rates. ERA5 maintained perfect POD but suffered a substantial increase in FAR (0.37 ± 0.00), the highest among all seasons, indicating frequent over-detection during the transitional season when rainfall events are less spatially extensive and more variable in intensity.
Summer presents the most challenging conditions for all products due to localized, high-intensity convective storms. IMERG-Final slightly outperformed the IMERG-Early and IMERG-Late products in POD (0.89 ± 0.06) and CSI (0.68 ± 0.05), with a relatively lower FAR (0.25 ± 0.08), although differences were marginal. ERA5, despite retaining a perfect POD, showed the lowest CSI (0.63 ± 0.05) of any season and a high FAR (0.34 ± 0.07), indicating frequent false alarms linked to its coarse representation of convective events. Toward the end of the year, performance across all products improved as precipitation reverted to more frontal and stratiform patterns. In autumn, detection scores improved across all datasets. IMERG-Final again led the IMERG group in CSI (0.73 ± 0.05) and POD (0.88 ± 0.05), while also achieving the lowest FAR (0.18 ± 0.05). ERA5 remained consistent with high detection accuracy (POD = 1.00 ± 0.00, CSI = 0.73 ± 0.07), although its FAR (0.29 ± 0.04) remained higher than those of IMERG products, highlighting its tendency toward overprediction even during stratiform-dominated periods.
In summary, the seasonal analysis shows that ERA5 consistently offers the highest POD and CSI, particularly during Winter and Autumn, though often at the cost of high FAR in Spring and Summer. IMERG-Final emerges as the most reliable among the satellite-based products, showing notable improvement over IMERG-Early and IMERG-Late, especially during Autumn and Winter, when rainfall events are more widespread and persistent.

3.2.2. Seasonal Error and Correlation Analysis

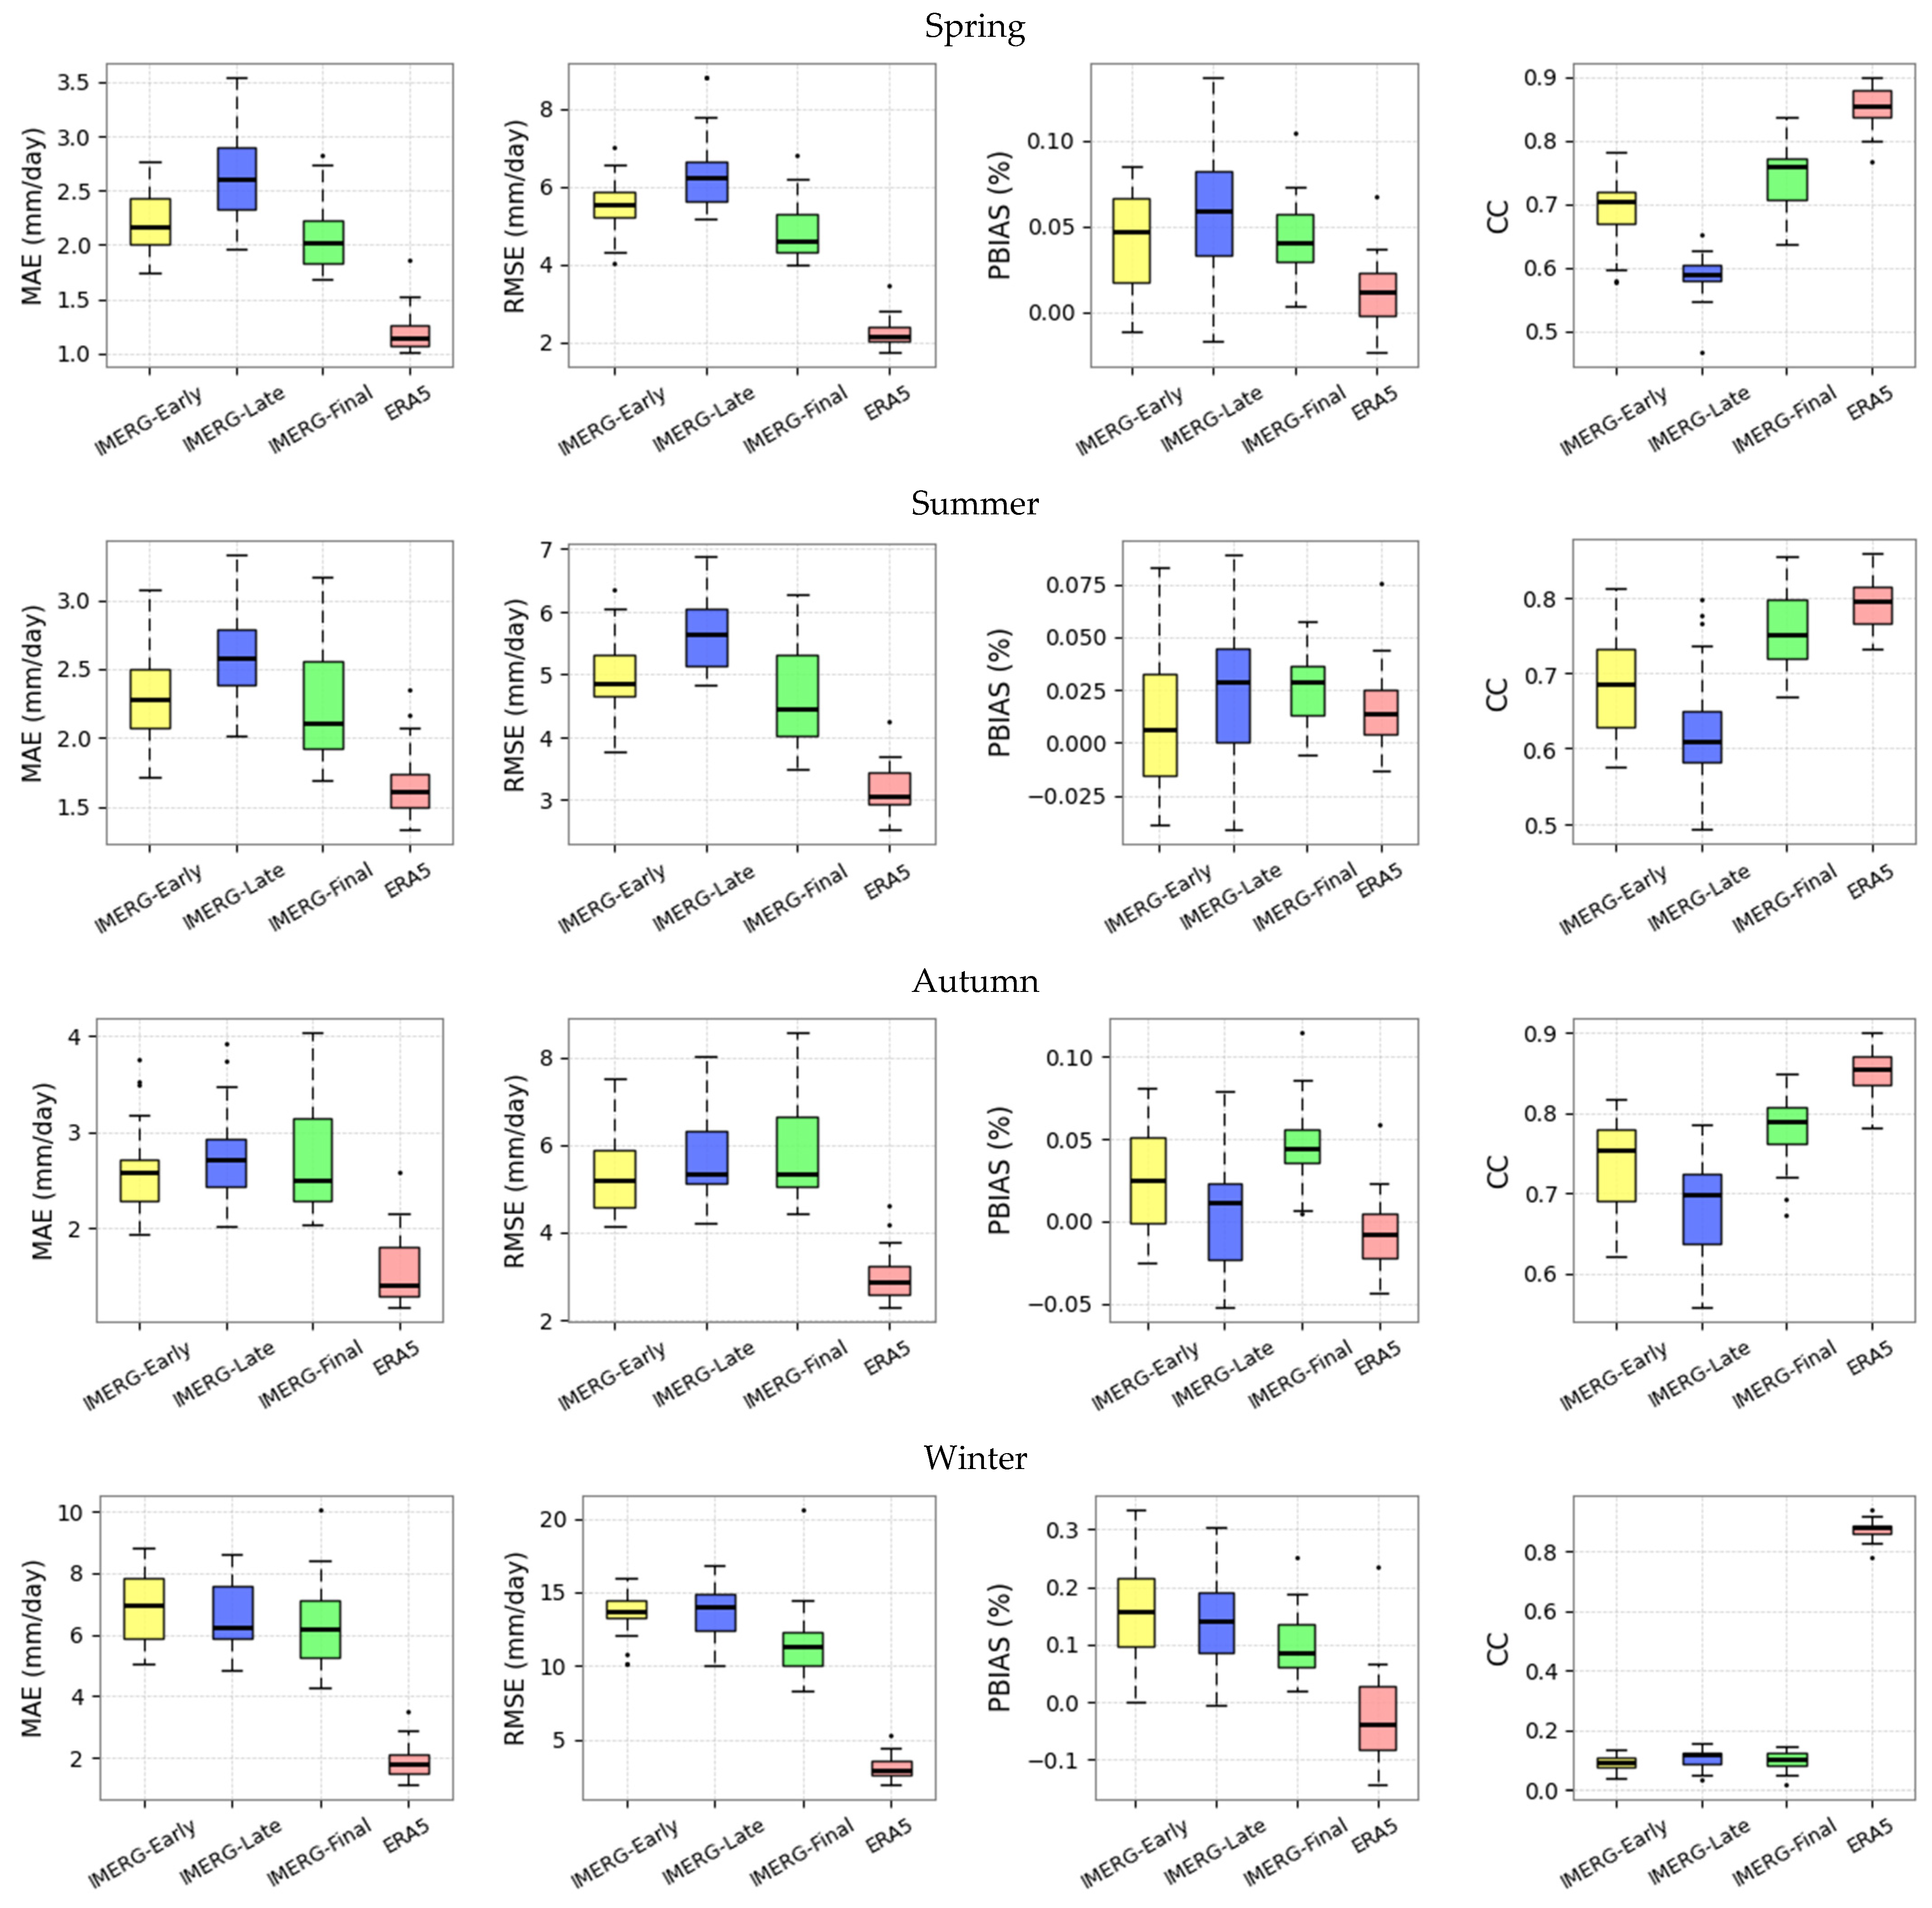
The seasonal analysis of precipitation estimation errors and biases for ERA5 and IMERG products reveals clear performance distinctions across seasons, as illustrated by MAE, RMSE, and BIAS metrics (Figure 5). ERA5 consistently achieves the lowest error magnitudes, maintaining a distinct advantage over IMERG products throughout the year. This superiority is most pronounced in winter, where ERA5 records a median MAE of 1.7 mm/day and RMSE of 3 mm/day, in contrast to the significantly higher values from IMERG-Early (7 mm/day MAE, 13 mm/day RMSE), IMERG-Late (6.5 mm/day, 14 mm/day), and IMERG-Final (6.2 mm/day, 11.5 mm/day).
Error variability further distinguishes the products. ERA5 maintains stable performance in autumn and spring, when rainfall is less intense and more spatially coherent. However, all products exhibit increased errors spread in winter, reflecting greater difficulty in capturing the season’s stratiform rainfall. IMERG-Final consistently performs better than IMERG-Early and Late, particularly in spring and summer, but still lags behind ERA5.
The relative bias (BIAS) analysis (Figure 5) reinforces this distinction. ERA5 shows near-zero bias across autumn, spring, and summer, indicating balanced precipitation estimates. In contrast, IMERG products tend to overestimate precipitation throughout the year, with winter showing the highest biases, up to +30%, and greatest variability, especially for IMERG-Early and IMERG-Late. IMERG-Final demonstrates moderate improvements with reduced bias in summer, but its performance remains inconsistent compared to ERA5. Although ERA5 shows a slight underestimation tendency in winter, it remains small in both magnitude and spread. Notably, the interquartile range of BIAS for IMERG-Final narrows compared to the other versions, indicating reduced bias variability and improved calibration in the post-processed product.
Correlation coefficient (CC) analysis further supports these findings (Figure 5). ERA5 consistently exhibits strong temporal agreement with observations, achieving median CC values above 0.85 across all seasons with minimal interstation variation. IMERG-Final shows clear improvements over the IMERG-Early and IMERG-Late, especially in autumn and summer, where its CC approaches that of ERA5. However, in spring, IMERG-Early and IMERG-Late drop below 0.7 and show broader variability, while IMERG-Final maintains relatively stable correlation. The weakest performance appears in winter where all IMERG products experience a sharp decline in CC, with medians falling below 0.2, indicating poor alignment with observed rainfall timing. ERA5 remains unaffected, retaining high correlation even under these conditions.
In summary, ERA5 demonstrates superior performance across all metrics, MAE, RMSE, BIAS, and CC, and maintains consistent accuracy and temporal coherence throughout the year. IMERG-Final, while clearly improved over its predecessors, still exhibits substantial errors and variability, particularly in winter.

3.2.3. Spatial Distribution of Seasonal Precipitation

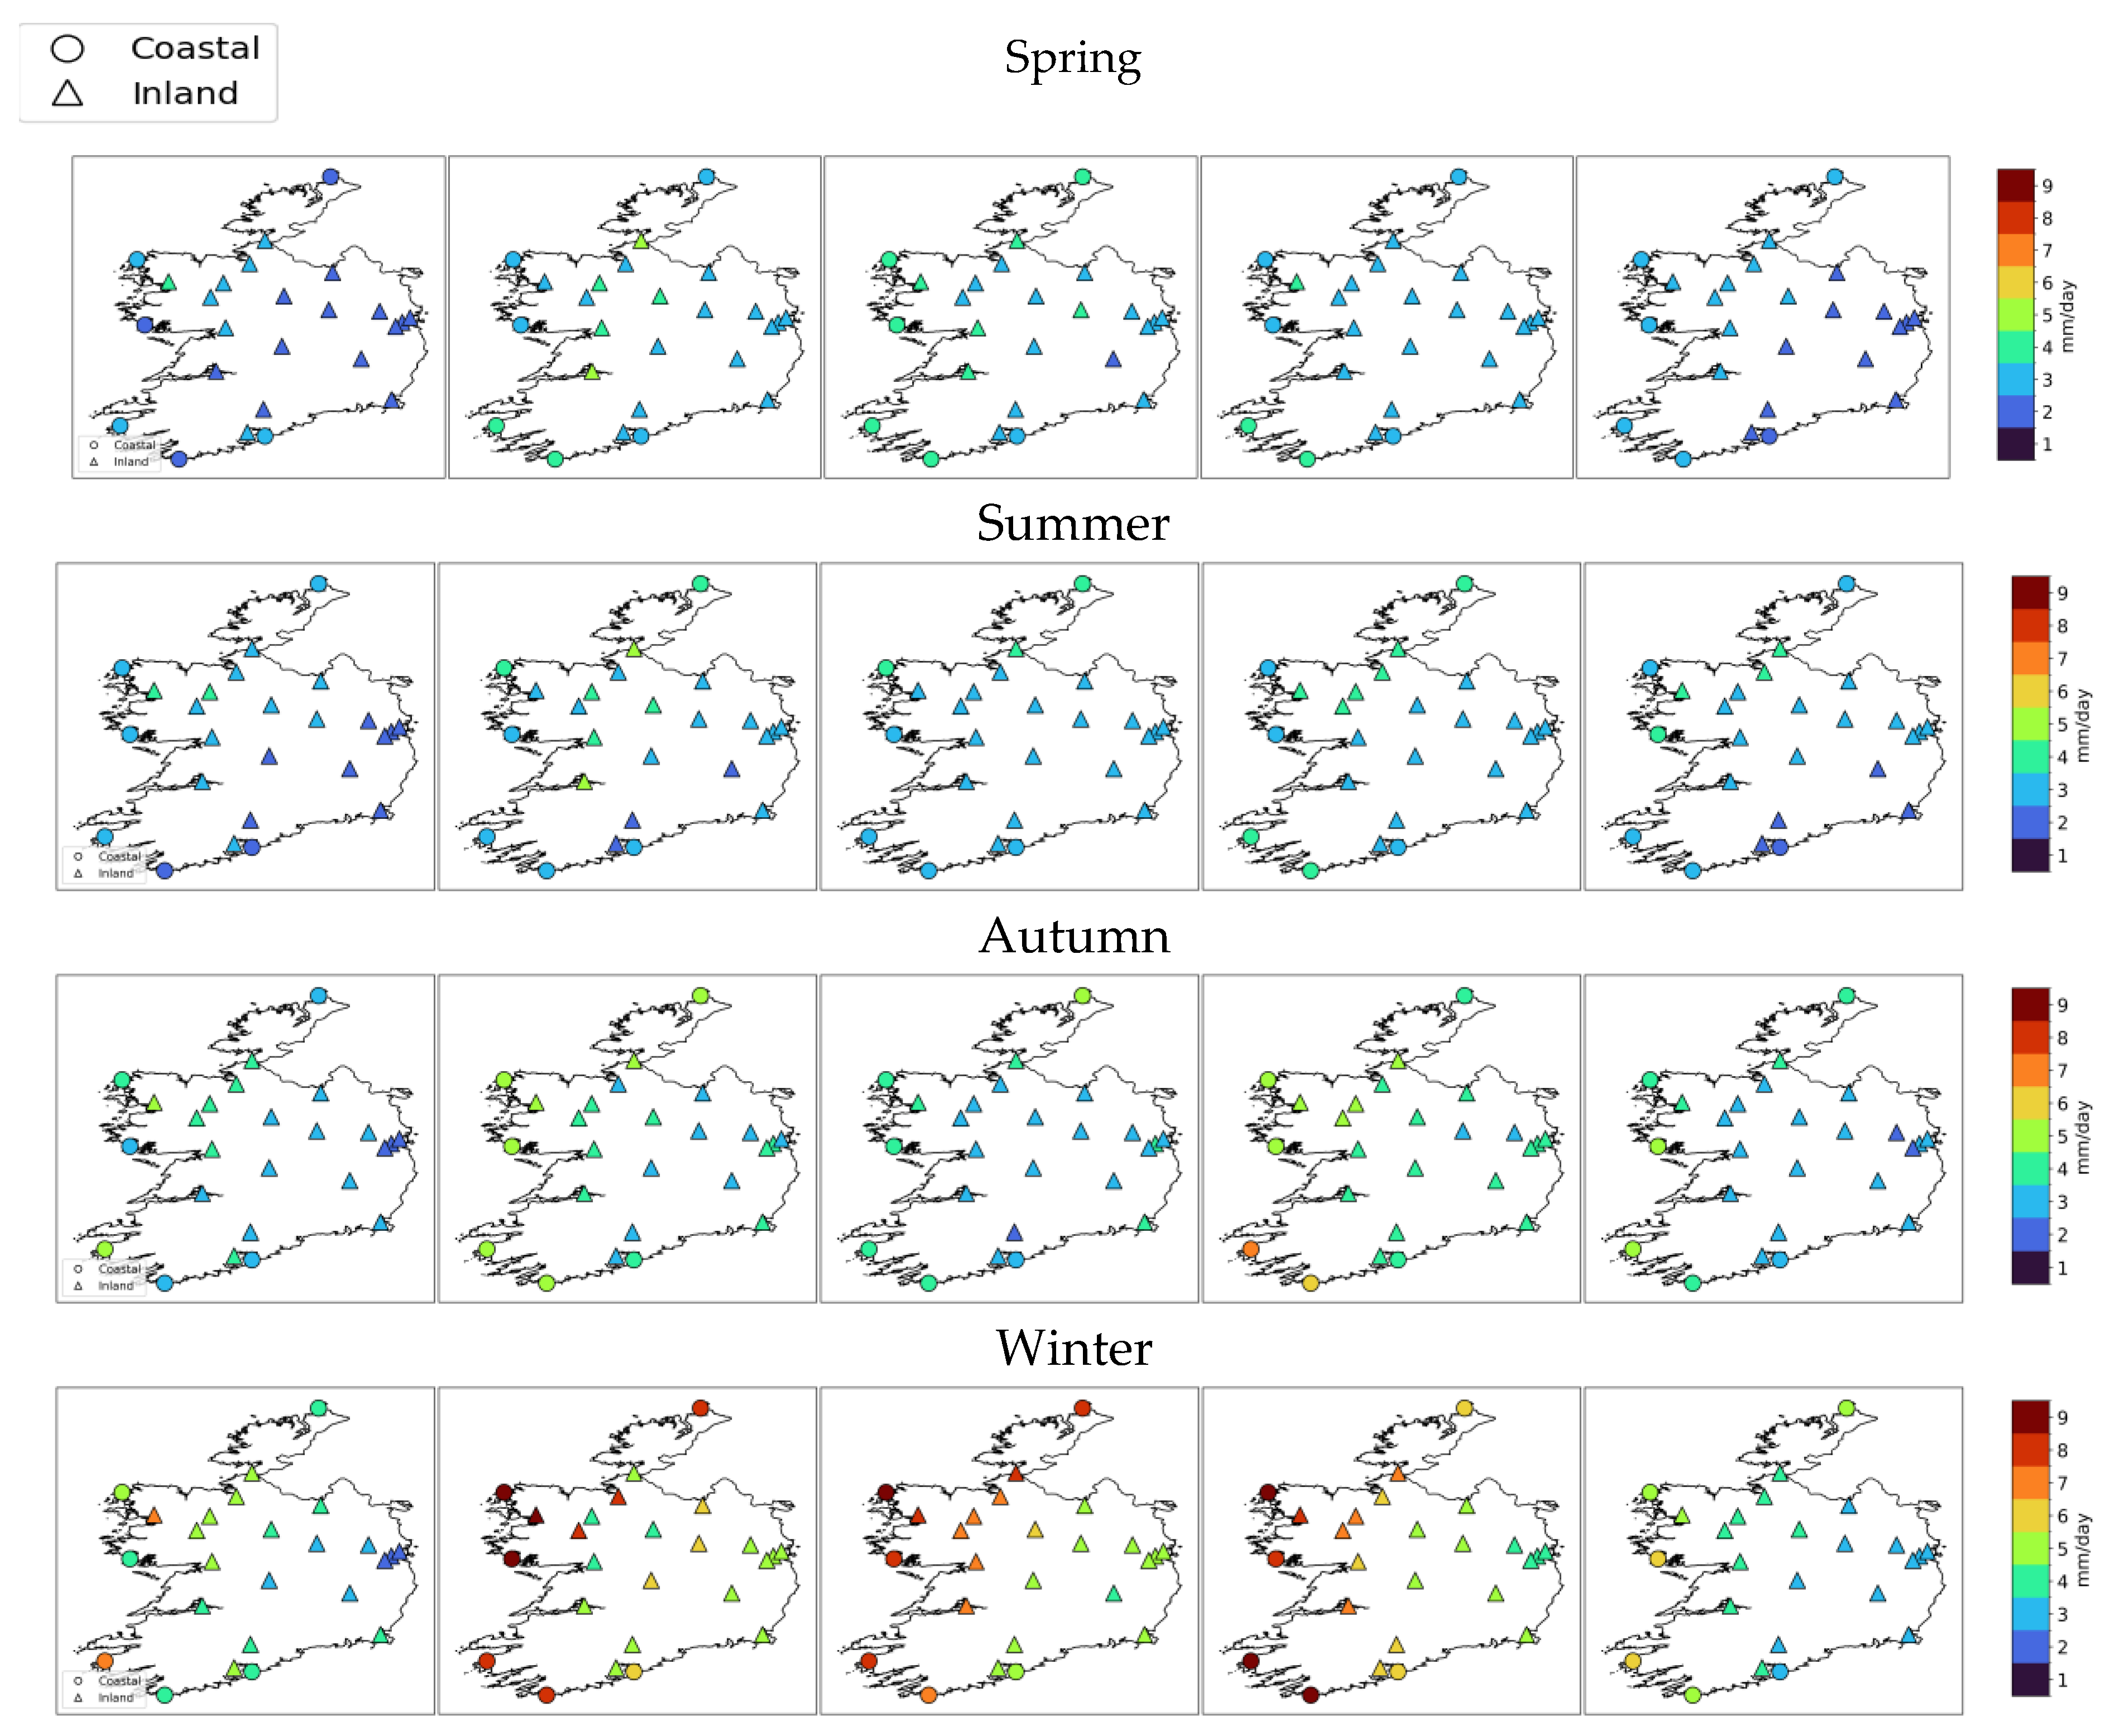
Observed precipitation across Ireland exhibits distinct seasonal spatial patterns, shaped by Atlantic exposure and proximity to coast. Winter and autumn (frontal-dominated seasons), exhibited a west-to-east gradient, with daily means exceeding 7 mm/day at maritime exposed coastal stations (Valentia, Belmullet) and declining to 2–3 mm/day in inland and east. These gradients reflect the dominance of synoptic-scale frontal systems and orographic enhancement during the wetter months. In contrast, spring and especially summer (convectively influenced over land) display more spatially uniform distributions, with average daily precipitation typically ranging from 1.5 to 4 mm/day, associated with more stable atmospheric conditions and localized convective events (Figure 6).
Across all seasons, the IMERG products tend to overestimate precipitation, though the magnitude and spatial structure of these biases vary (Figure 6). IMERG-Early consistently exhibits the highest overestimations, particularly evident in the west and south during winter and autumn, where estimates exceed observations by more than 2 mm/day. It also tends to flatten spatial gradients in spring and summer by overestimating drier eastern regions, resulting in a spatially homogeneous but unrealistic distribution. IMERG-Late shows marginal improvement, but similar biases persist. IMERG-Final offers better spatial coherence, especially during spring and summer, though it continues to overestimate rainfall in high-precipitation areas and smooths regional contrasts, particularly in autumn.
Across all seasons, ERA5 provides a clear improvement over the satellite-based products, accurately reproducing both the magnitude and spatial distribution of rainfall (Figure 6). It captures the west–east gradients in winter and autumn and the reduced variability in spring and summer, with mean deviations from gauges generally below 0.5 mm/day in the latter seasons. The most pronounced seasonal contrasts arise in winter at Atlantic-exposed coastal stations (Figure 6), Malin Head (ID 1575) in the north, Belmullet (ID 2375) and Mace Head (ID 275) in the west, and Valentia Observatory (ID 2275) and Sherkin Island (ID 775) in the southwest, where all three IMERG runs markedly overestimate daily precipitation, while ERA5 remains close to observations, typically within ±1 mm/day and showing only slight overestimation.
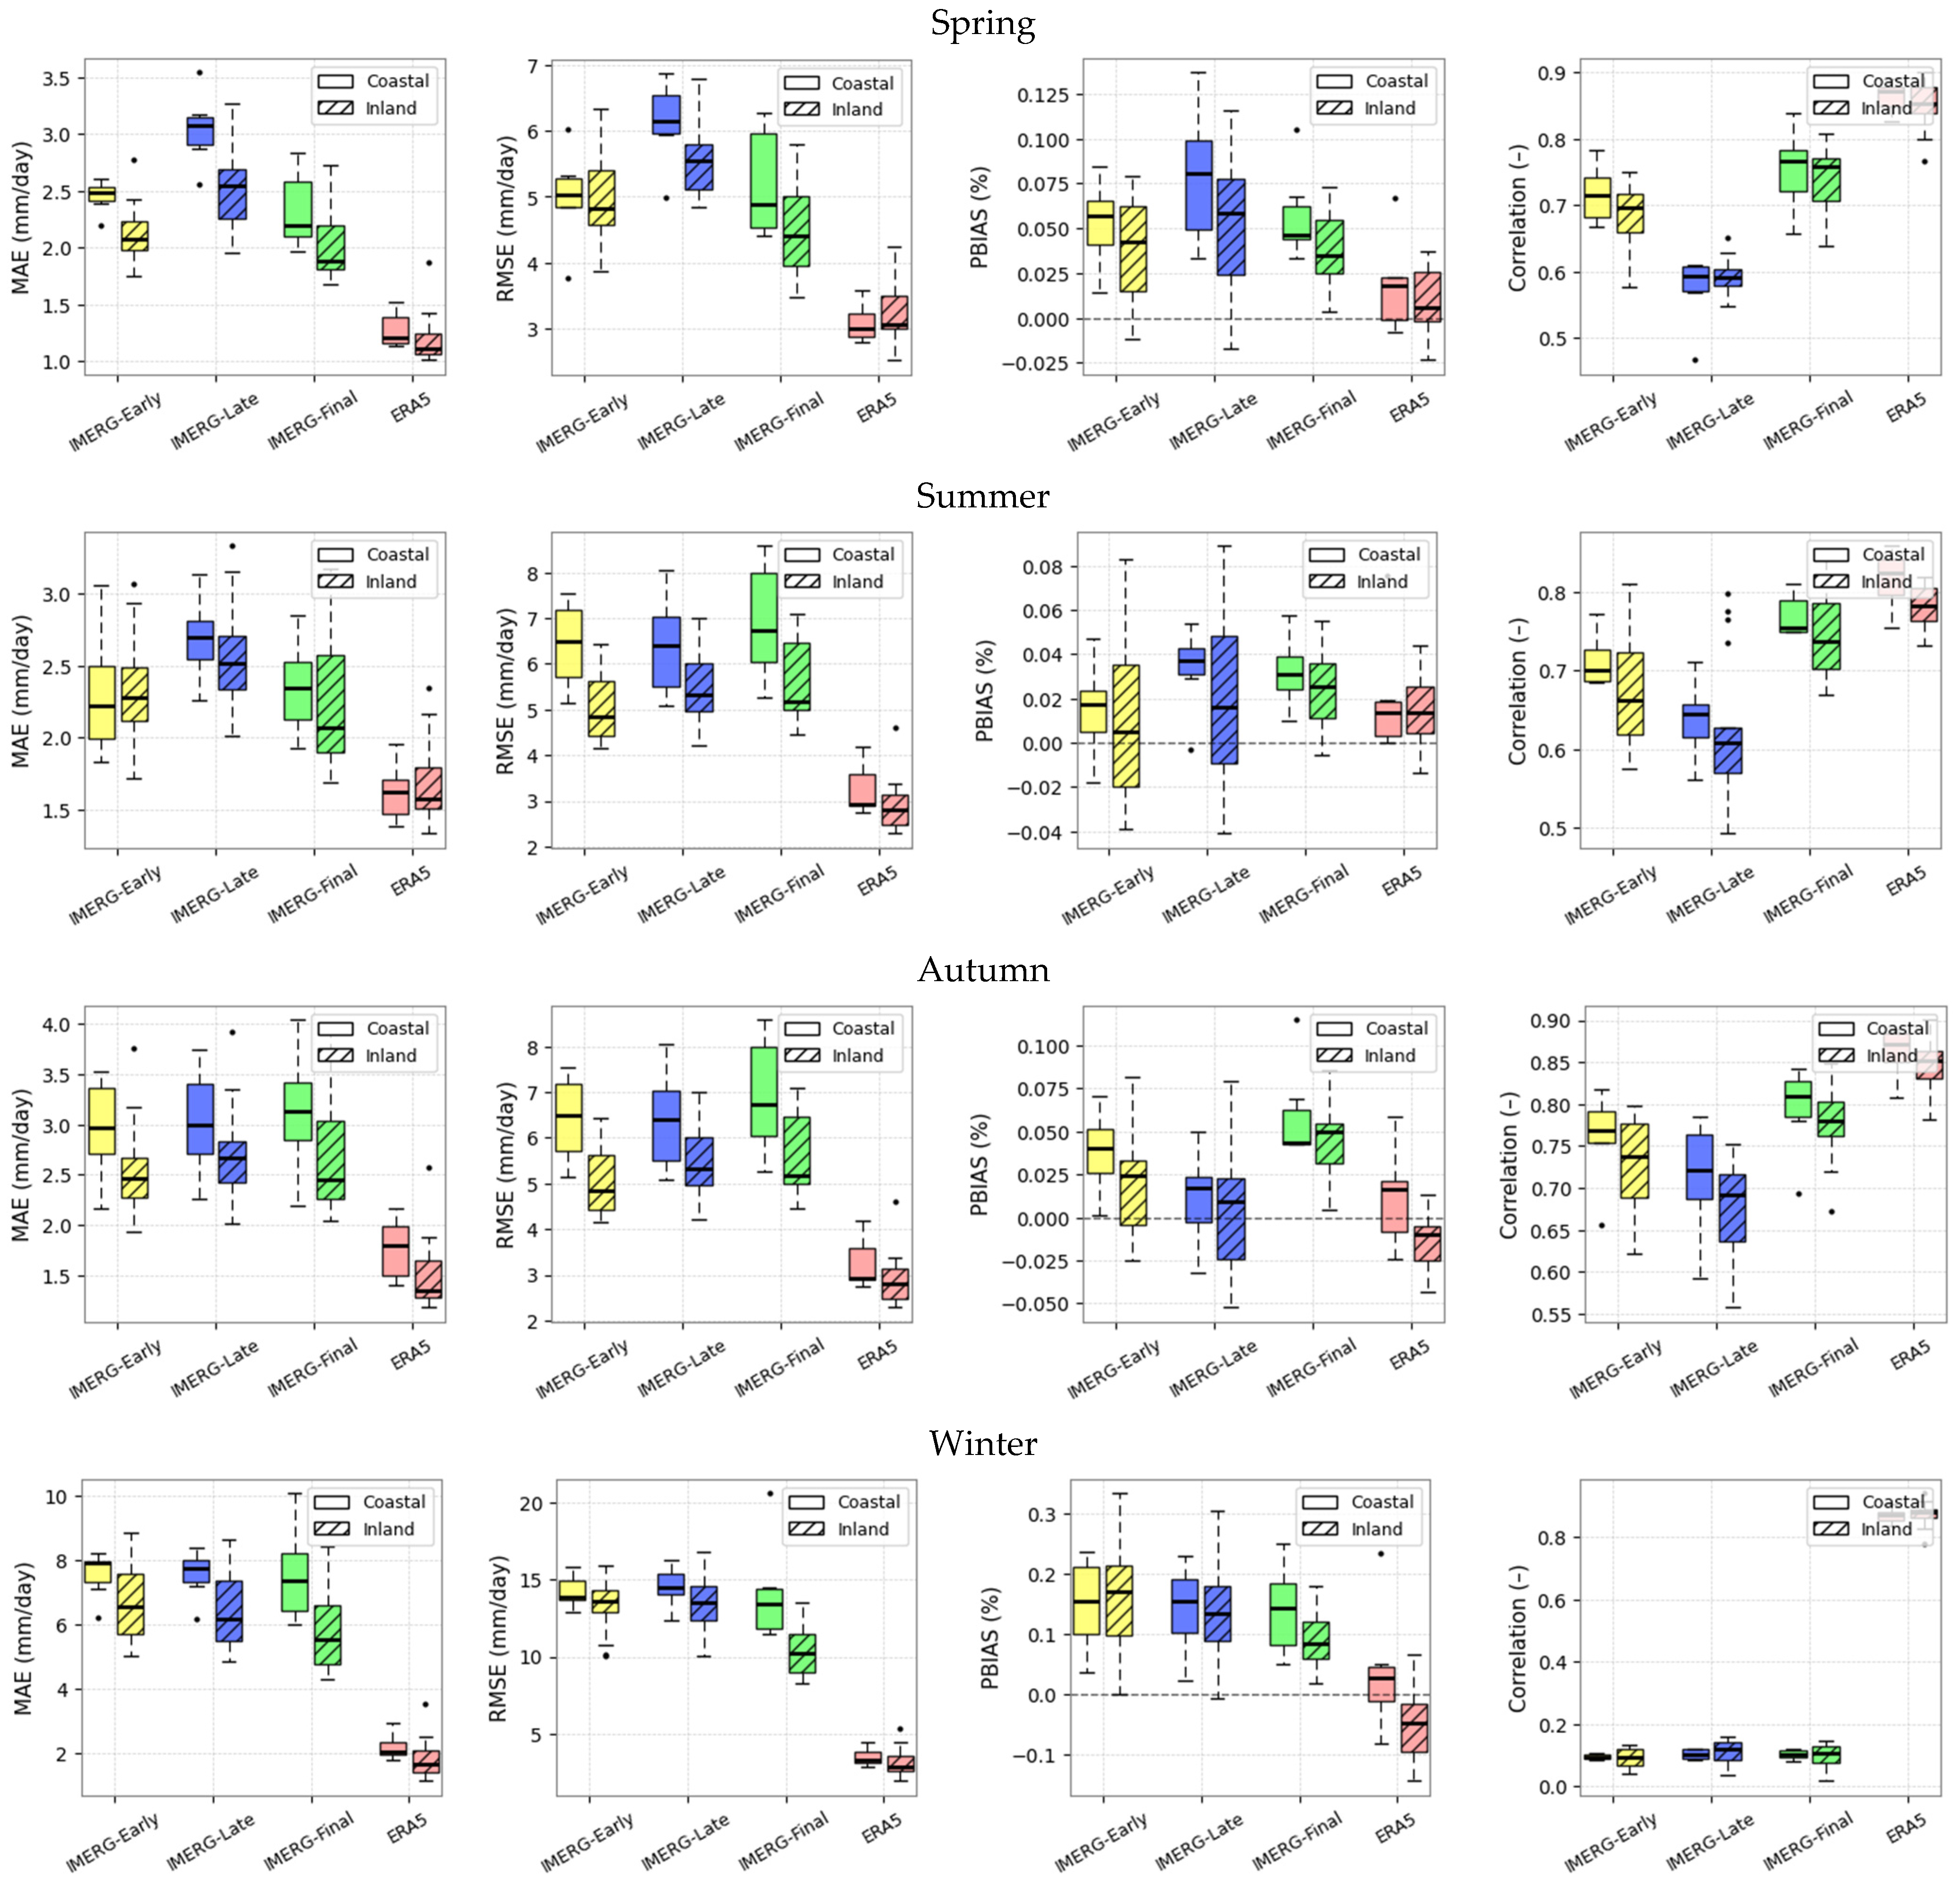
To further explore the underperformance at coastal stations, Appendix A Figure A1 separates the evaluation into coastal and inland groups. The contrast is prominent errors in terms of RMSE and MAE are consistently larger at coastal locations, particularly in winter when coastal errors are nearly doubled compared to inland sites. This pattern is visible across all IMERG runs, with only limited improvement in the IMERG-Final. In contrast, ERA5 maintains comparatively low errors with little difference between coastal and inland stations, underlining its robustness across different settings.
Bias and correlation results reinforce this coastal penalty. IMERG products tend to overestimate rainfall at coastal stations in all seasons while more pronounced during winter. Simultaneously, correlations at coastal stations weaken, dropping well below those inland and in some cases minimizing almost entirely, reflecting a loss of temporal reliability. ERA5 again shows more consistent behavior, with biases remaining close to zero and correlations strong in both station groups. These findings confirm that the systematic weaknesses of IMERG are magnified in Atlantic-exposed environments, whereas ERA5 demonstrates stability across Ireland’s diverse settings.

3.3. Intensity-Based Evaluation

This analysis encompasses four rainfall intensity classes: light rain, moderate rain, heavy rain, and very heavy rain, as illustrated in Table 3. Both hourly and daily time scale datasets were utilized in this analysis. The results are presented in terms of detection accuracy, error metrics, and correlation analysis for each time scale.

3.3.1. Detection Accuracy

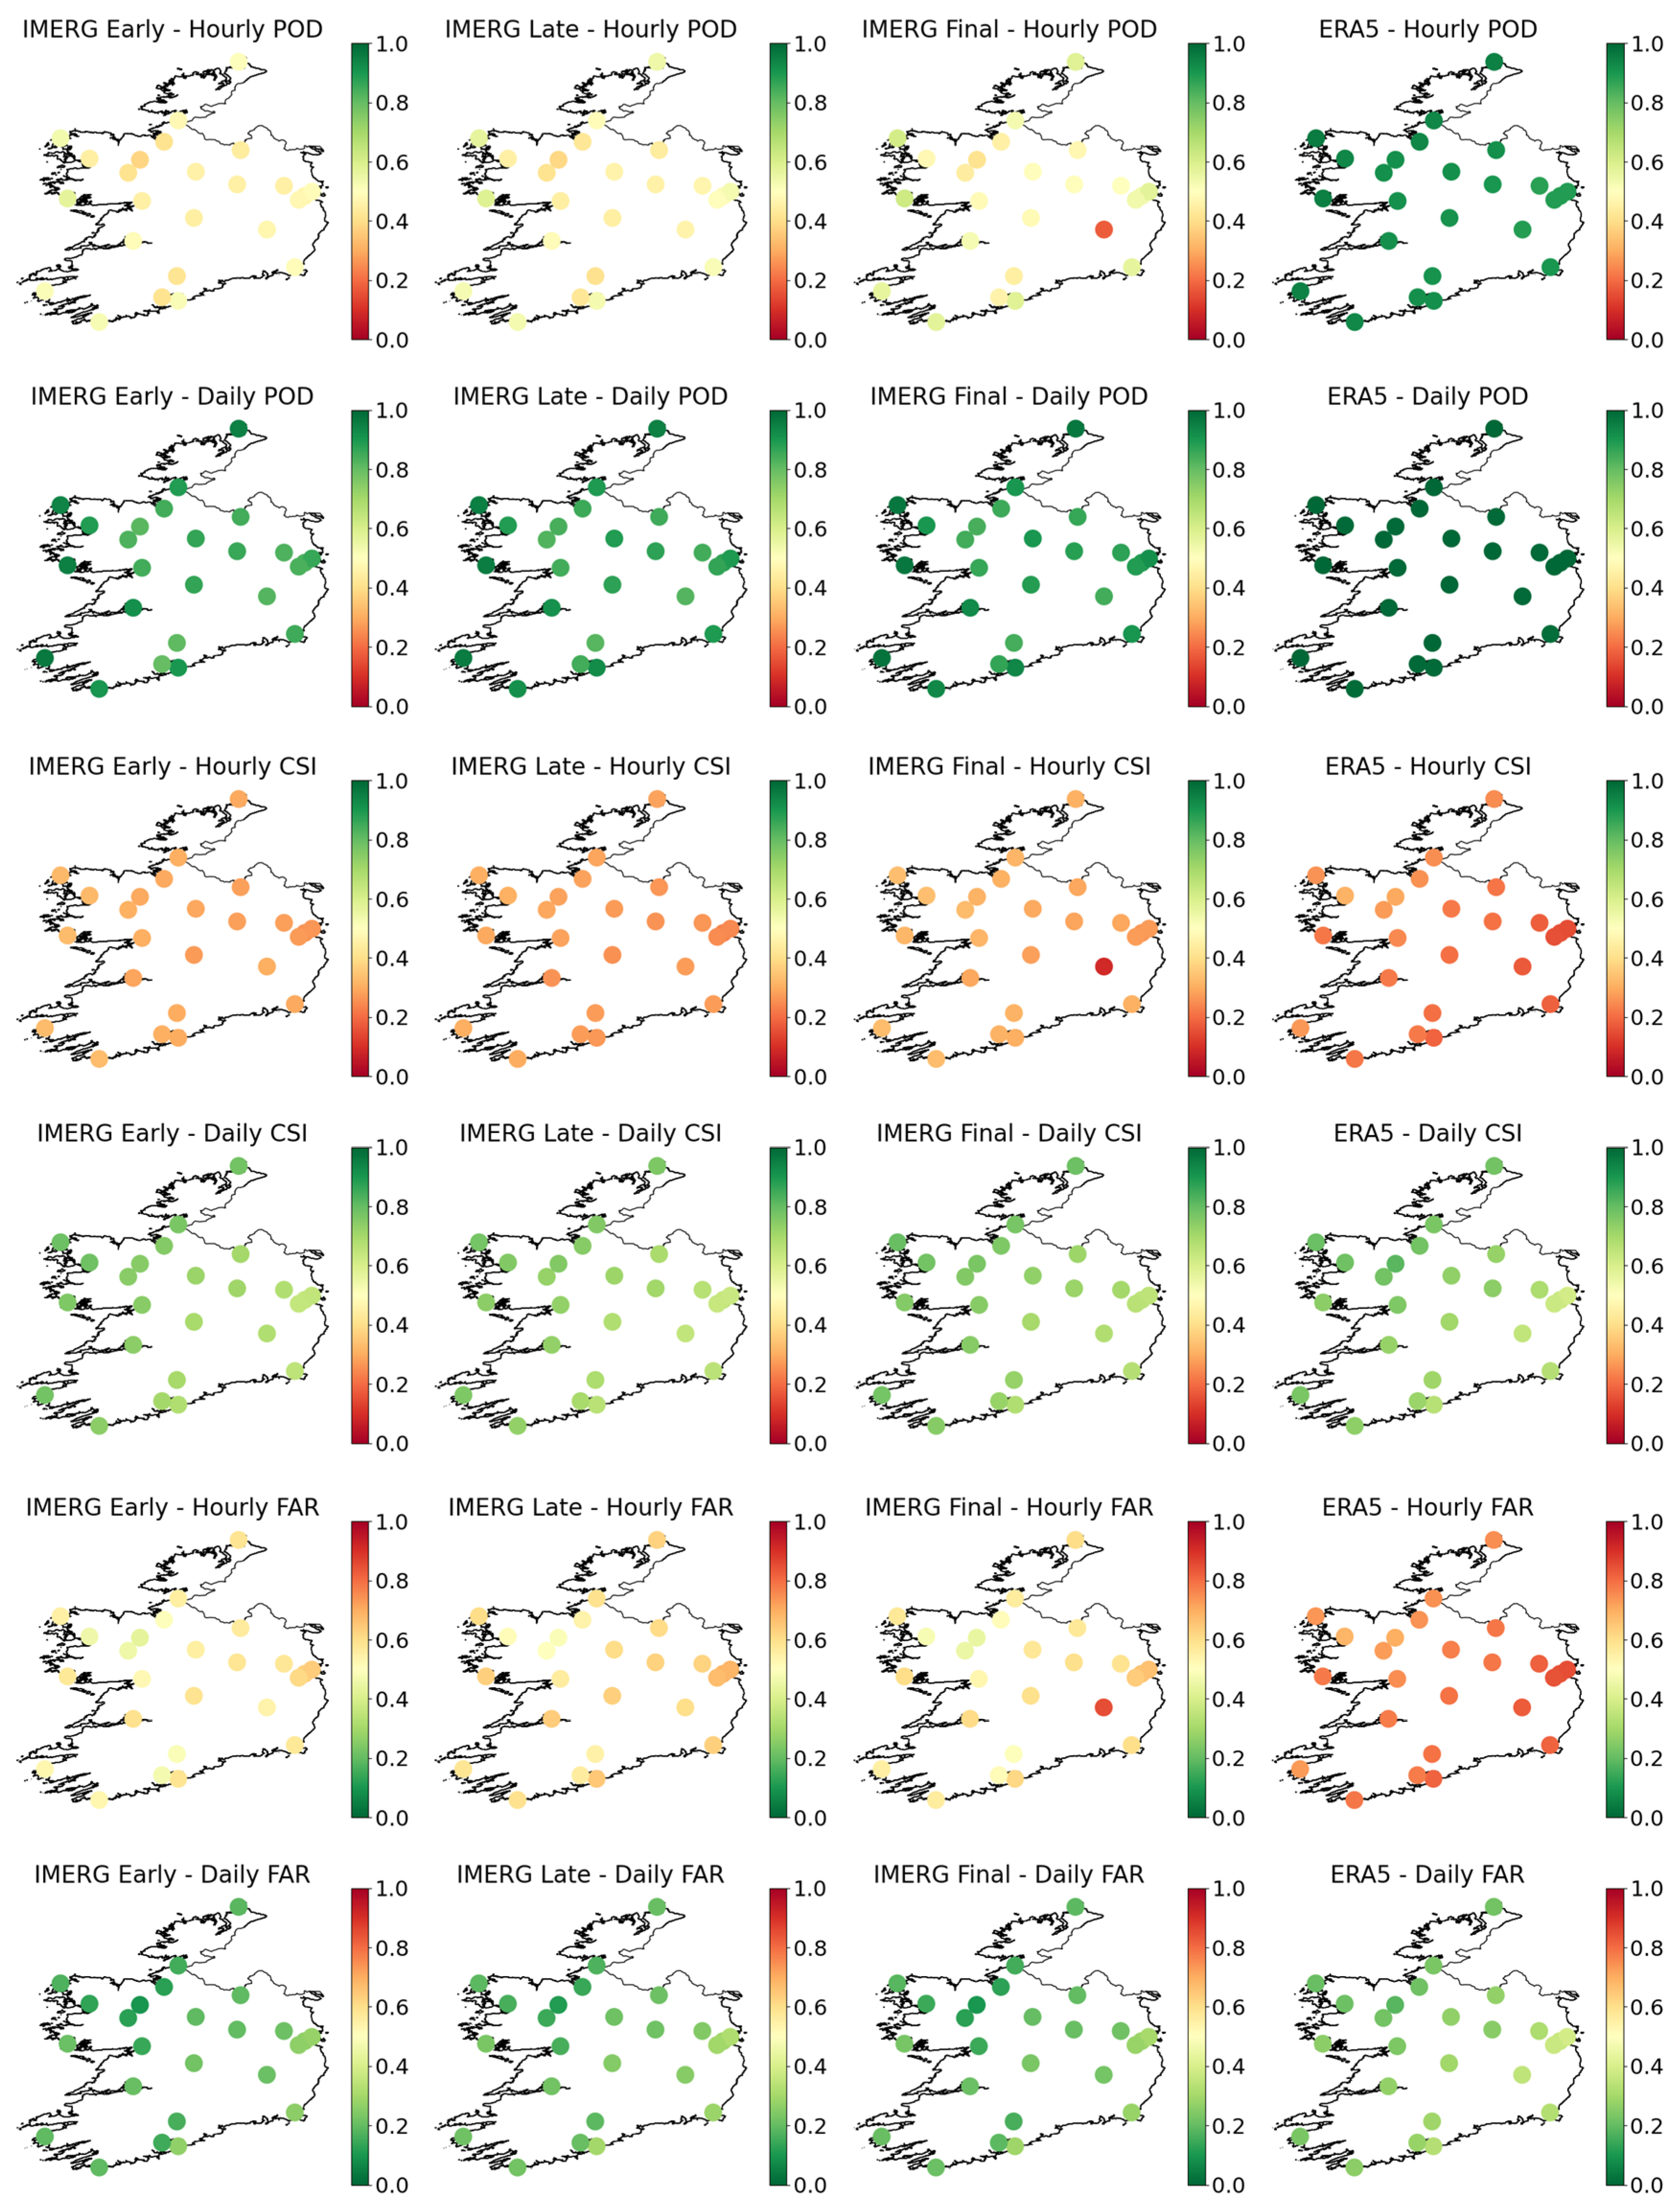
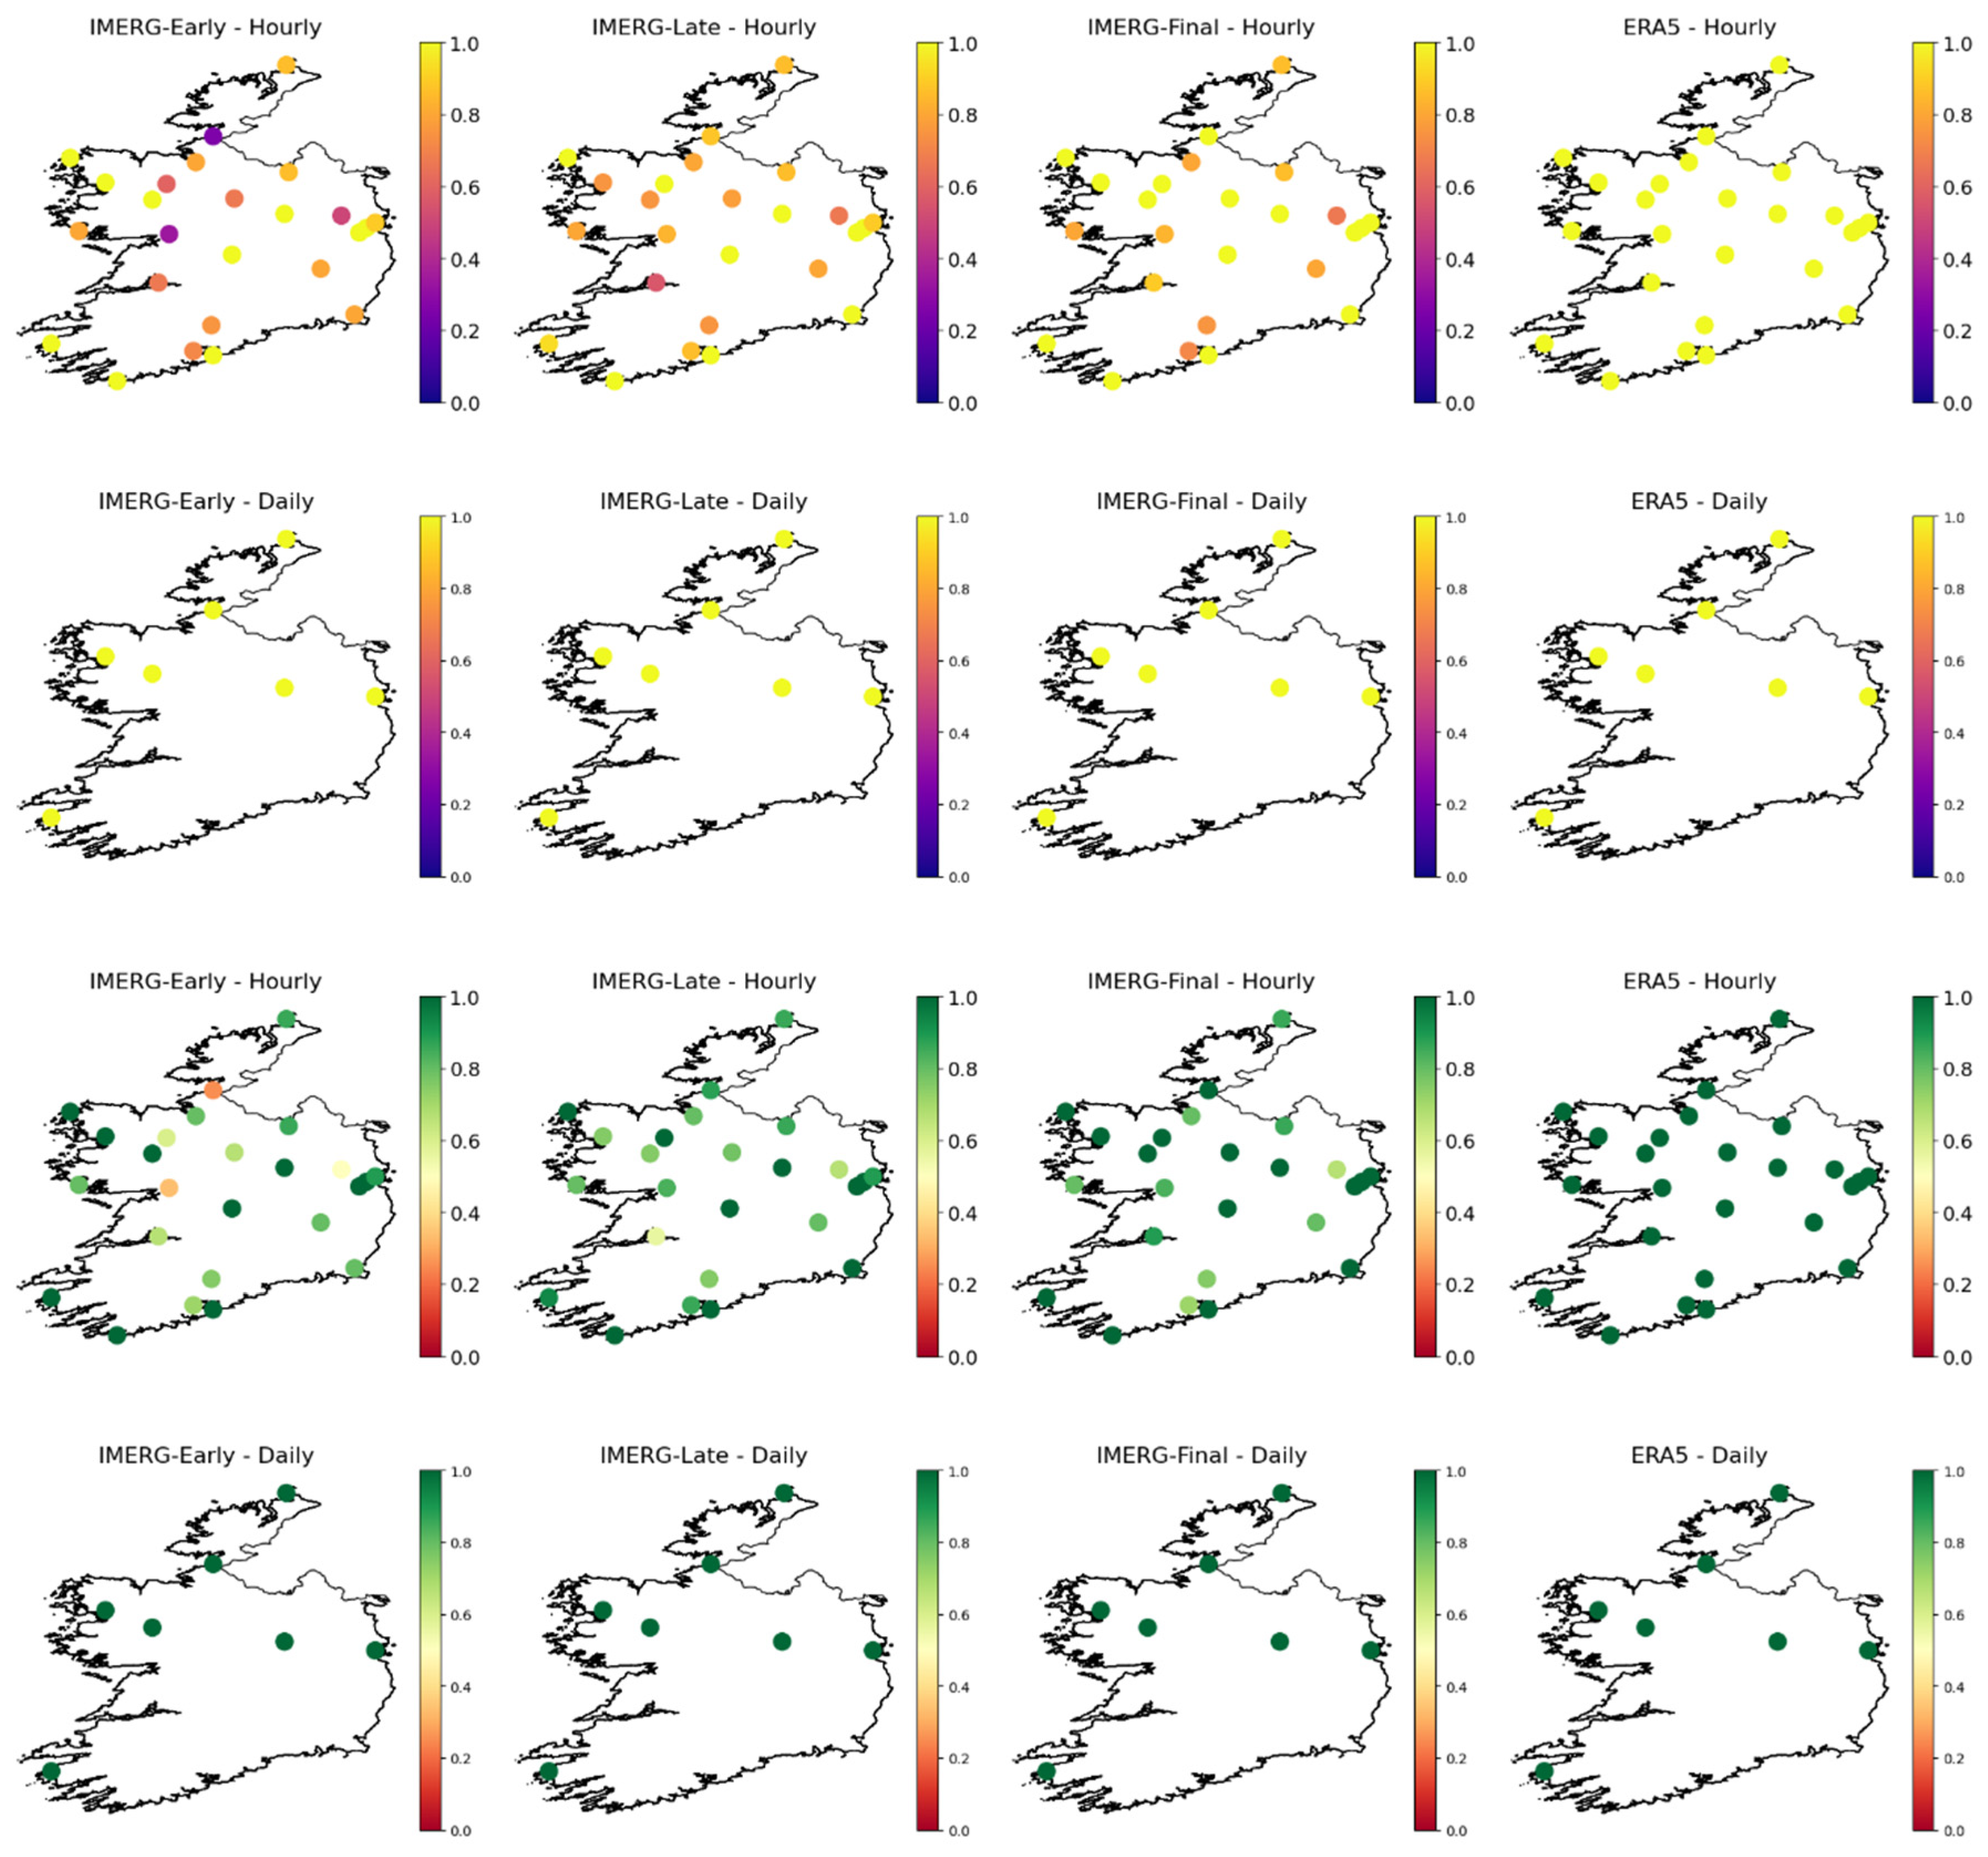
This section evaluates the ability of ERA5 and IMERG precipitation products to detect rainfall events across four intensity classes: light, moderate, heavy, and very heavy rainfall. Figure 7 and Figure 8 present the spatial patterns of POD, CSI, and FAR for light and very heavy rainfall consequently, selected for detailed discussion due to their contrasting meteorological characteristics and operational importance. Light rainfall is frequent but challenging to detect reliably, while very heavy rainfall represents high-impact extremes requiring precise monitoring. Results for moderate and heavy rainfall detection are provided in Appendix A (Figure A2 and Figure A3).
Light rainfall (typically stratiform, widespread, and low intensity) showed the greatest contrast between products (Figure 7). ERA5 shows outstanding performance in detecting light rain at both hourly and daily scales, with POD and CSI values exceeding 0.95 at all 25 stations. This consistent skill reflects its ability to capture widespread stratiform precipitation associated with frontal systems, which are common year-round, particularly along the western seaboard. In contrast, the IMERG products exhibit greater variability. At the hourly scale, IMERG-Early and IMERG-Late show modest POD values (0.3–0.6), with notably poorer performance at inland stations, particularly at higher-elevation sites such as Knock Airport. This suggests limitations in the satellite retrievals under weak convective activity, which often dominate Irish light rain. IMERG-Final shows no substantial improvement over earlier runs at these locations, suggesting that post-processing offers limited benefit in capturing precipitation in complex inland or high-elevation environments. At daily resolution, IMERG-Final achieves consistent POD values between 0.85 and 0.95 across most stations, closing the performance gap with ERA5. The consistently zero FAR across all products in this class confirms their ability to avoid false rain detection, even if sensitivity varies.
Moderate rainfall, which forms the bulk of Irish daily accumulations, was also well detected by all products, with POD and CSI scores above 0.8 in most cases. ERA5 generally outperformed IMERG products, though IMERG-Final performed competitively, particularly on a daily scale. IMERG-Early displayed more spatial variability in hourly data, with inland stations showing slightly lower detection. No false alarms were recorded across any product for this class (FAR = 0).
Heavy rainfall detection was uniformly strong across products and time scales. ERA5 and IMERG-Final achieved consistent PODs above 0.9, particularly on a daily scale. IMERG-Late and Early showed marginally lower performance in hourly data, with some variability across western stations. Notably, FAR remained at zero for heavy rainfall across all stations and products, indicating high precision and a lack of false alarms under these well-defined events.
Detection of very heavy rainfall events reveals clear product contrasts shaped by the rarity, intensity, and spatial localization of these extremes (Figure 8). These events are often associated with orographic enhancement along Ireland’s western highlands and convective outbreaks tied to Atlantic depressions or tropical remnants. At the hourly scale, ERA5 exhibits flawless detection (POD and CSI = 1, FAR = 0) across all stations, demonstrating strong assimilation of both synoptic and convective signals. In contrast, IMERG-Early shows the greatest variability and weakest detection skill, while IMERG-Late performs marginally better but still falls short of the consistency observed in IMERG-Final. For example, IMERG-Early fails to detect events at Athenry (ID:1875) and Finner (ID:2075) with POD dropping to 0.25. IMERG-Late performs marginally better but still shows under detection in the Midlands and southeast. At the daily scale, however, all products, ERA5, IMERG-Early, IMERG-Late, and IMERG-Final, achieved perfect detection (POD = CSI = 1, FAR = 0) at the six stations (Valentia Observatory (ID:2275), Finner (ID:2075), Malin Head (ID:1575), Newport (ID:1175), Mullingar (ID:875), and Dublin Airport (ID:532)) where very heavy rain was observed.
Overall, ERA5 demonstrates the highest detection reliability across all rainfall intensity classes, with consistently strong POD and CSI values and zero false alarms. IMERG-Final shows marked improvement over IMERG-Early and IMERG-Late, especially at the daily resolution, capturing a greater number of events across a wider range of stations. Detection limitations are most pronounced in IMERG-Early, especially for low-intensity and spatially variable rainfall, where under detection is more frequent. Spatial detection patterns closely follow Ireland’s climatic gradients, stations in coastal and orographically influenced western and northern regions tend to show higher detection rates, while inland and sheltered stations exhibit more variability and occasional detection gaps.

3.3.2. Error and Correlation Analysis

This section evaluates the accuracy and consistency of ERA5 and IMERG precipitation products using error and correlation metrics across varying rainfall intensities considering both hourly and daily temporal resolutions to capture differences in product performance under different event scales. The performance across the four rainfall intensity classes is illustrated in the radar charts in Figure 9, with expanded Table A2 provided in Appendix A.
For light precipitation events, ERA5 consistently outperforms all IMERG products, exhibiting the lowest error statistics across all metrics. Its MAE averages approximately 0.4 mm/h and 1.7 mm/day, with RMSE values of 0.6 mm/h and 2.8 mm/day. IMERG-Final ranks next in performance, with MAE values near 0.7 mm/h and 3.2 mm/day, and demonstrates greater stability than IMERG-Early and IMERG-Late, particularly at the daily scale. IMERG-Early shows the widest error spread, indicating reduced consistency. Relative Biases (BIAS) for all products remain low in this class. ERA5 exhibits near-zero bias at both temporal resolutions, while IMERG-Final shows a slight positive bias of approximately +1% at hourly scale. IMERG-Early fluctuates between −2% and +2%, depending on station and resolution. Correlation coefficients (CC) are highest for ERA5, reaching up to 0.55 hourly and 0.80 daily. IMERG-Final follows with CC values of ~0.48 (hourly) and ~0.73 (daily), while other IMERG products remain below 0.45 at hourly resolution.
As rainfall increases, error magnitudes rise for all products. Nonetheless, ERA5 maintains its lead, with MAE values of approximately 2.0 mm/h and 5.1 mm/day, and RMSE values of 2.8 mm/h and 9.2 mm/day. IMERG-Final continues to outperform other IMERG variants, with MAE values around 2.7 mm/h and 10.5 mm/day. IMERG-Early and IMERG-Late exhibit higher errors, with MAE exceeding 2.9 mm/h and 11.5 mm/day. BIAS variability also increases. ERA5 remains tightly centered between −1.5% and +0.2%, while IMERG products show greater spread, ranging from −5% to +8% in daily resolution. Correlation coefficients decline modestly: ERA5 reaches ~0.65 (daily), followed by IMERG-Final (~0.60), whereas hourly CC values drop to ~0.45 or lower across most IMERG products, reflecting timing mismatches.

3.3.3. Time Series Analysis of Very Heavy Rainfall Events

To further investigate the limitations of precipitation products during extreme rainfall conditions, we conducted an event-centered time series analysis for seven representative cases, using daily rainfall data from ERA5 and IMERG (Early, Late, Final) products. These cases were drawn from the most extreme observed events, defined as days exceeding the top 5 percentile of daily rainfall across the station network, and were selected to capture geographic and seasonal diversity. The set includes Dublin Airport (inland east), Mullingar (central inland), Newport (western coast), Malin Head (northern coast), Finner (northwest coast), and Valentia Observatory (southwest coast), covering autumn, winter, and summer events while keeping the analysis focused and interpretable. Each event was visualized across an 11-day window (±5 days from the event day), allowing assessment of peak timing, structure, and accumulation characteristics in comparison to ground observations.
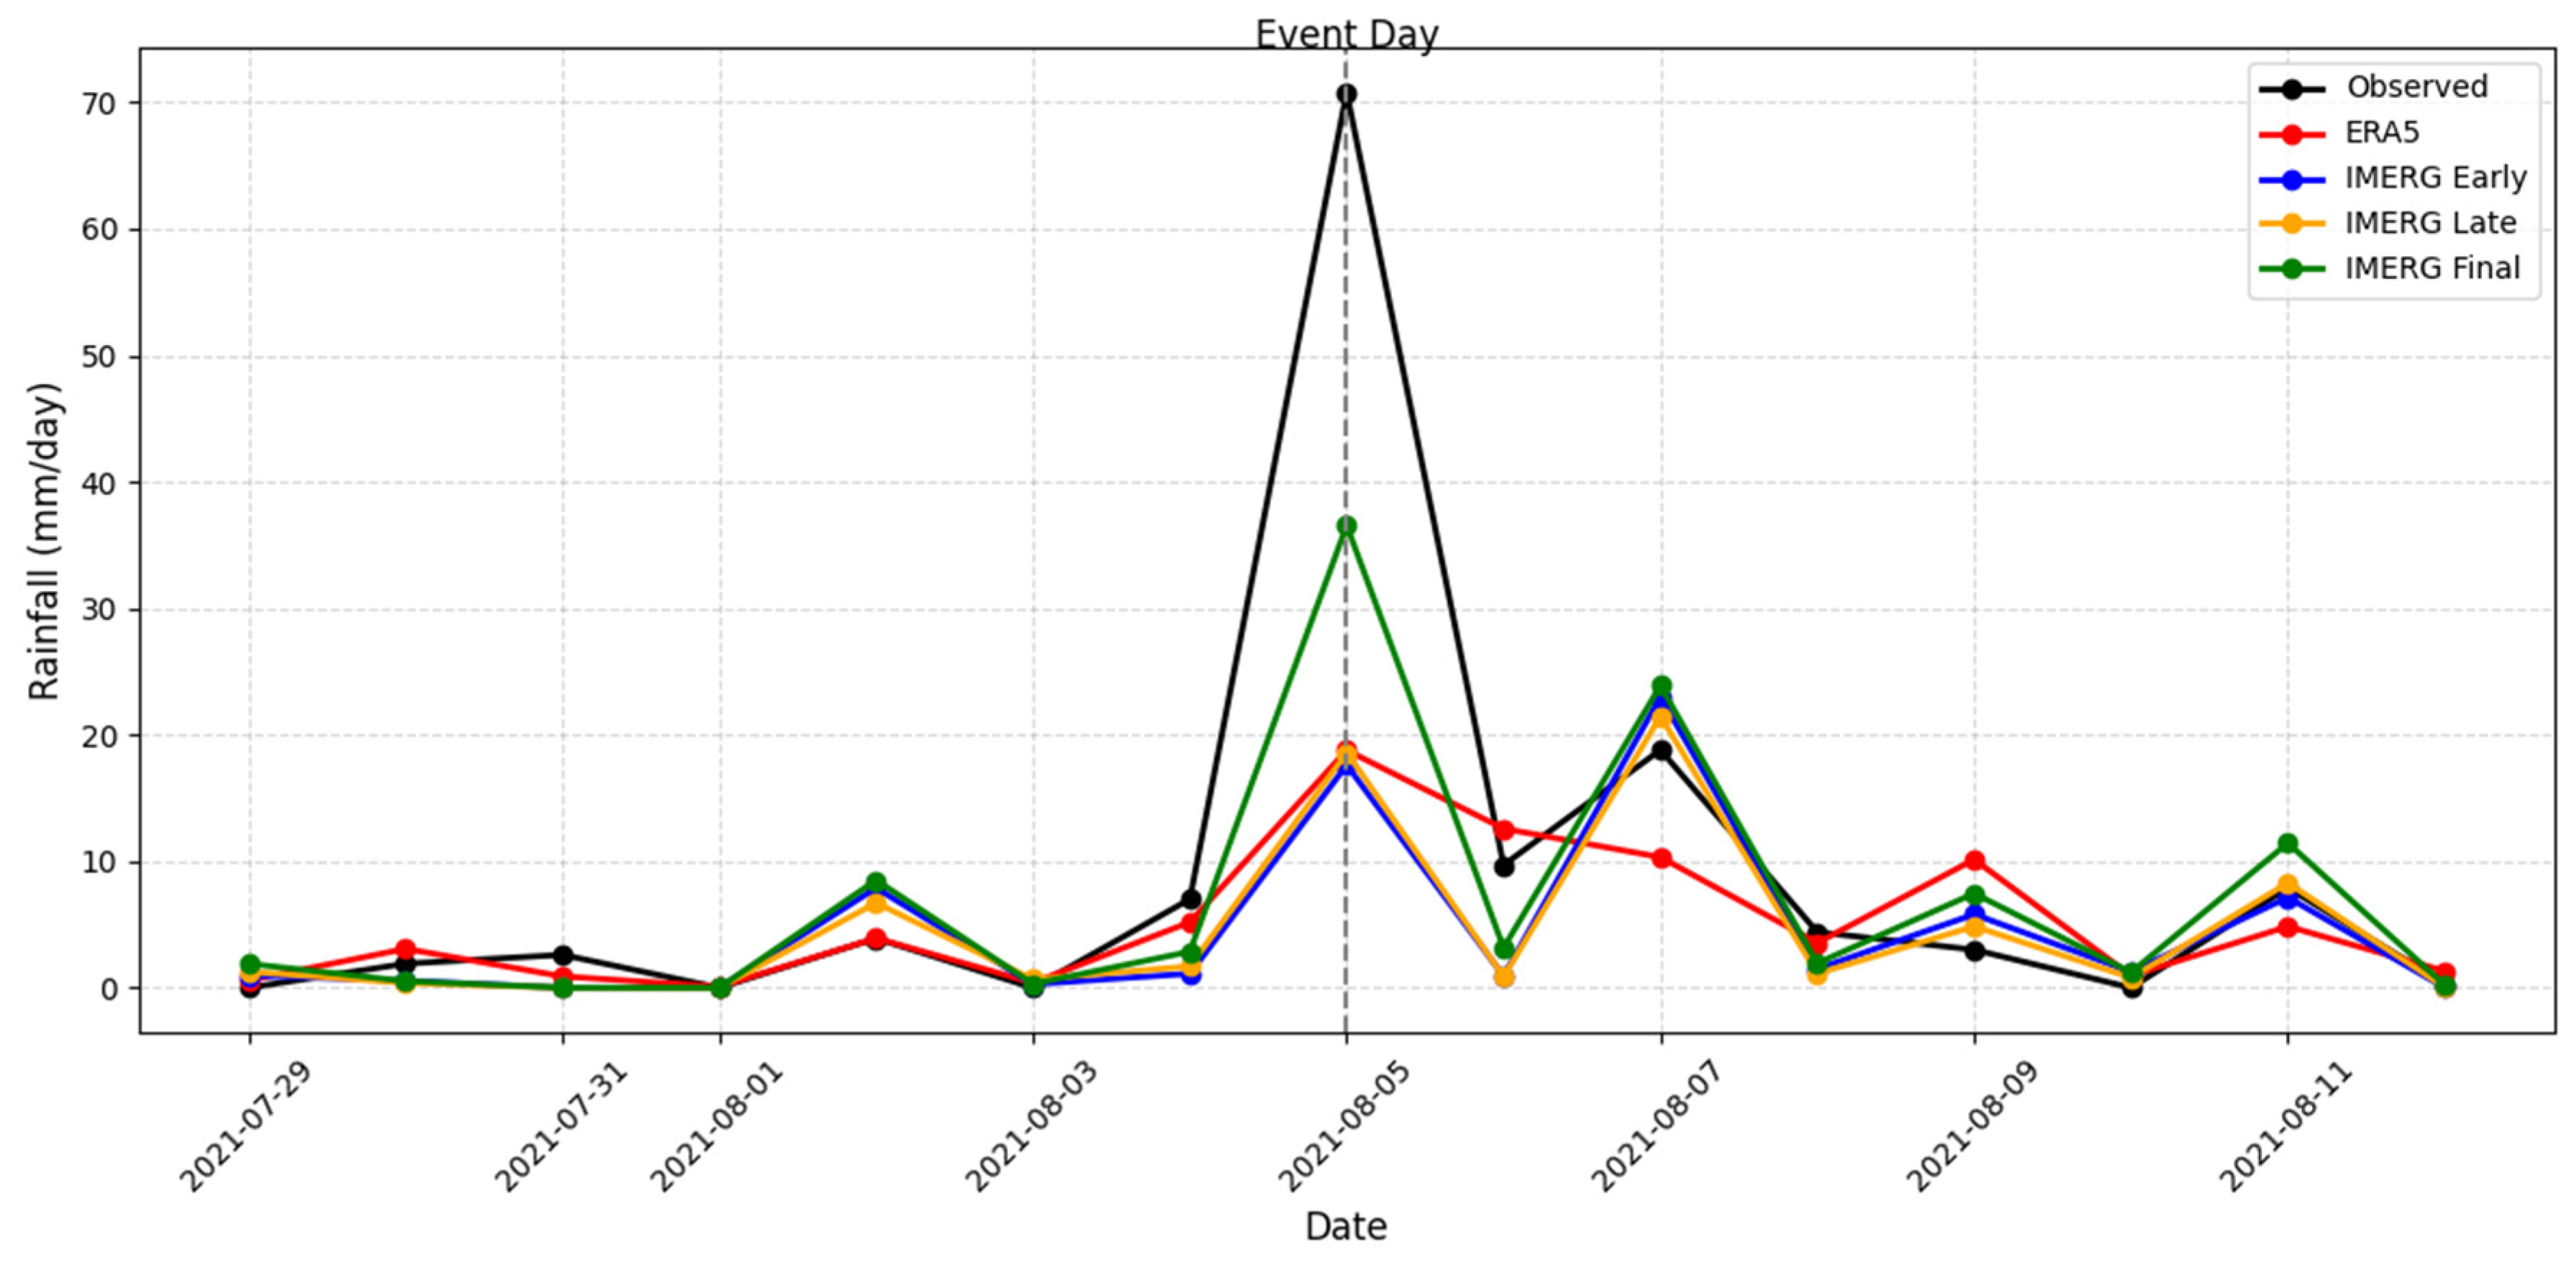
Overall, all products generally captured the timing of very heavy rainfall events. However, ERA5 consistently underestimated peak magnitudes with errors exceeding 60% in many cases despite correctly identifying the event day. For example, during the event at Mullingar station (875) on 5 August 2021 (Figure 10), ERA5 recorded only 70% of the observed peak (18.8 mm compared to 70.8 mm observed). IMERG-Final better represented the timing and event shape, estimating a higher peak (36 mm), although it still substantially underestimated the true magnitude, likely due to retrieval challenges in elevated terrain.
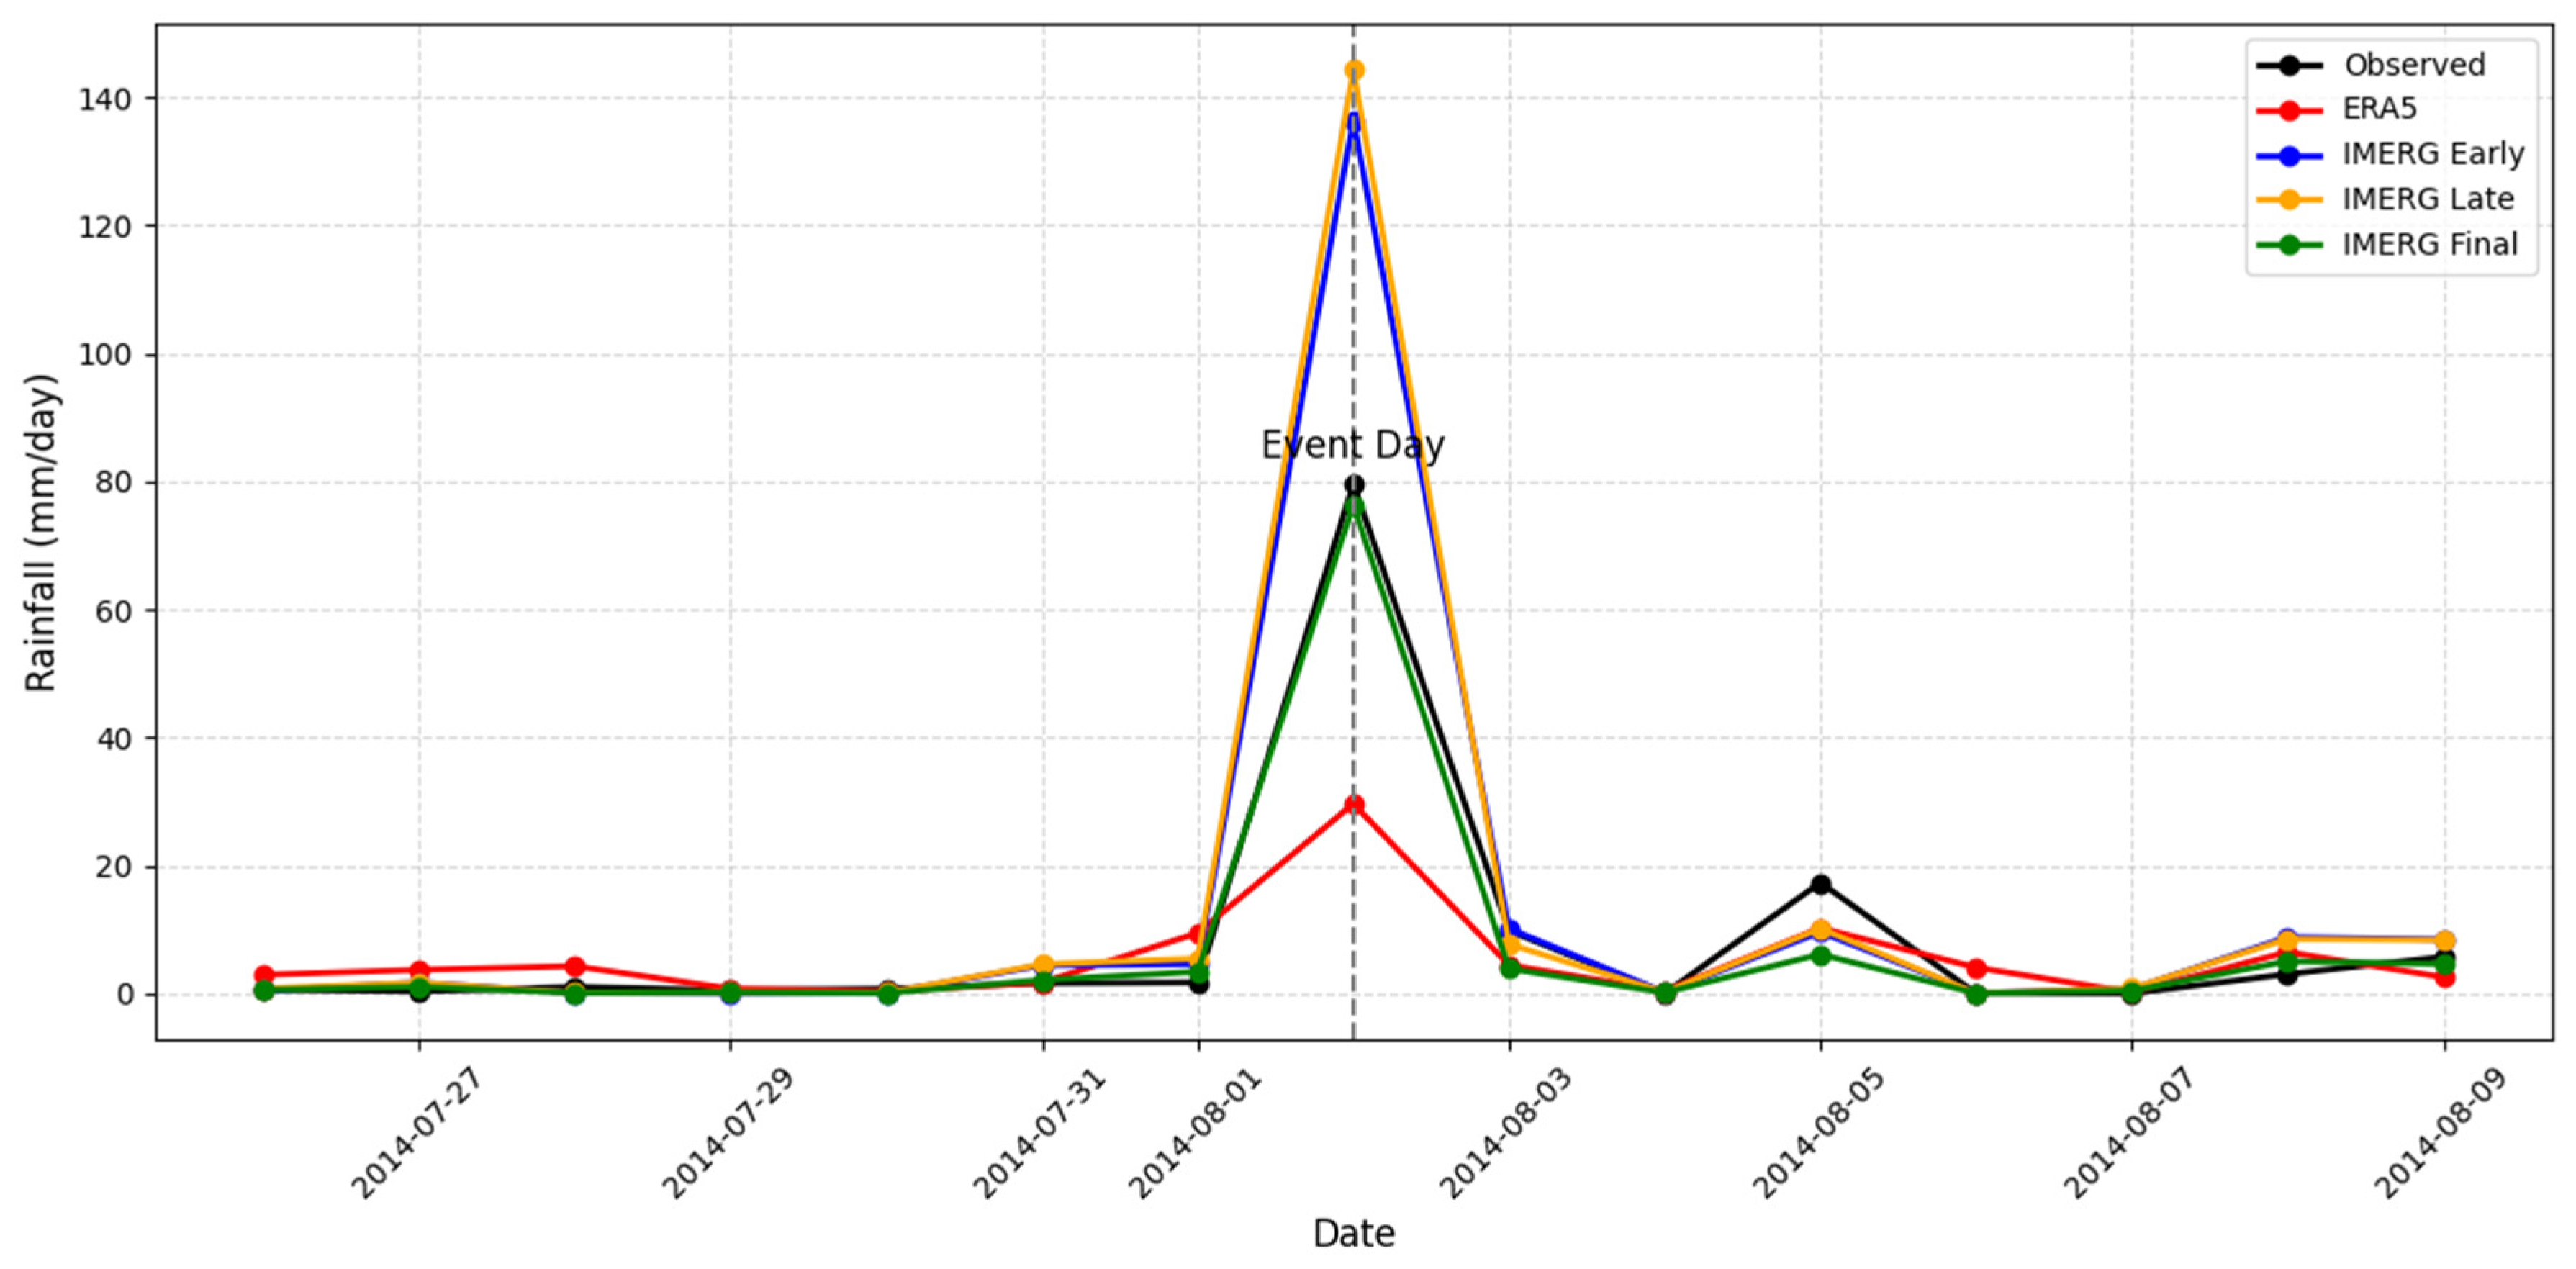
IMERG products, particularly IMERG-Final, exhibited sharper and more intense peaks that aligned better with observations. In contrast, ERA5 followed the general event profile but failed to reproduce intensities. At Dublin Airport station (ID:532) on 2 August 2014 (Figure 11), ERA5 estimated 47.5 mm versus 105.7 mm observed at nearby Station 2275. Surrounding days showed similar patterns, suggesting that ERA5 does not redistribute rainfall temporally but instead systematically underrepresents localized extremes, likely due to resolution limits and limited responsiveness to convective dynamics.
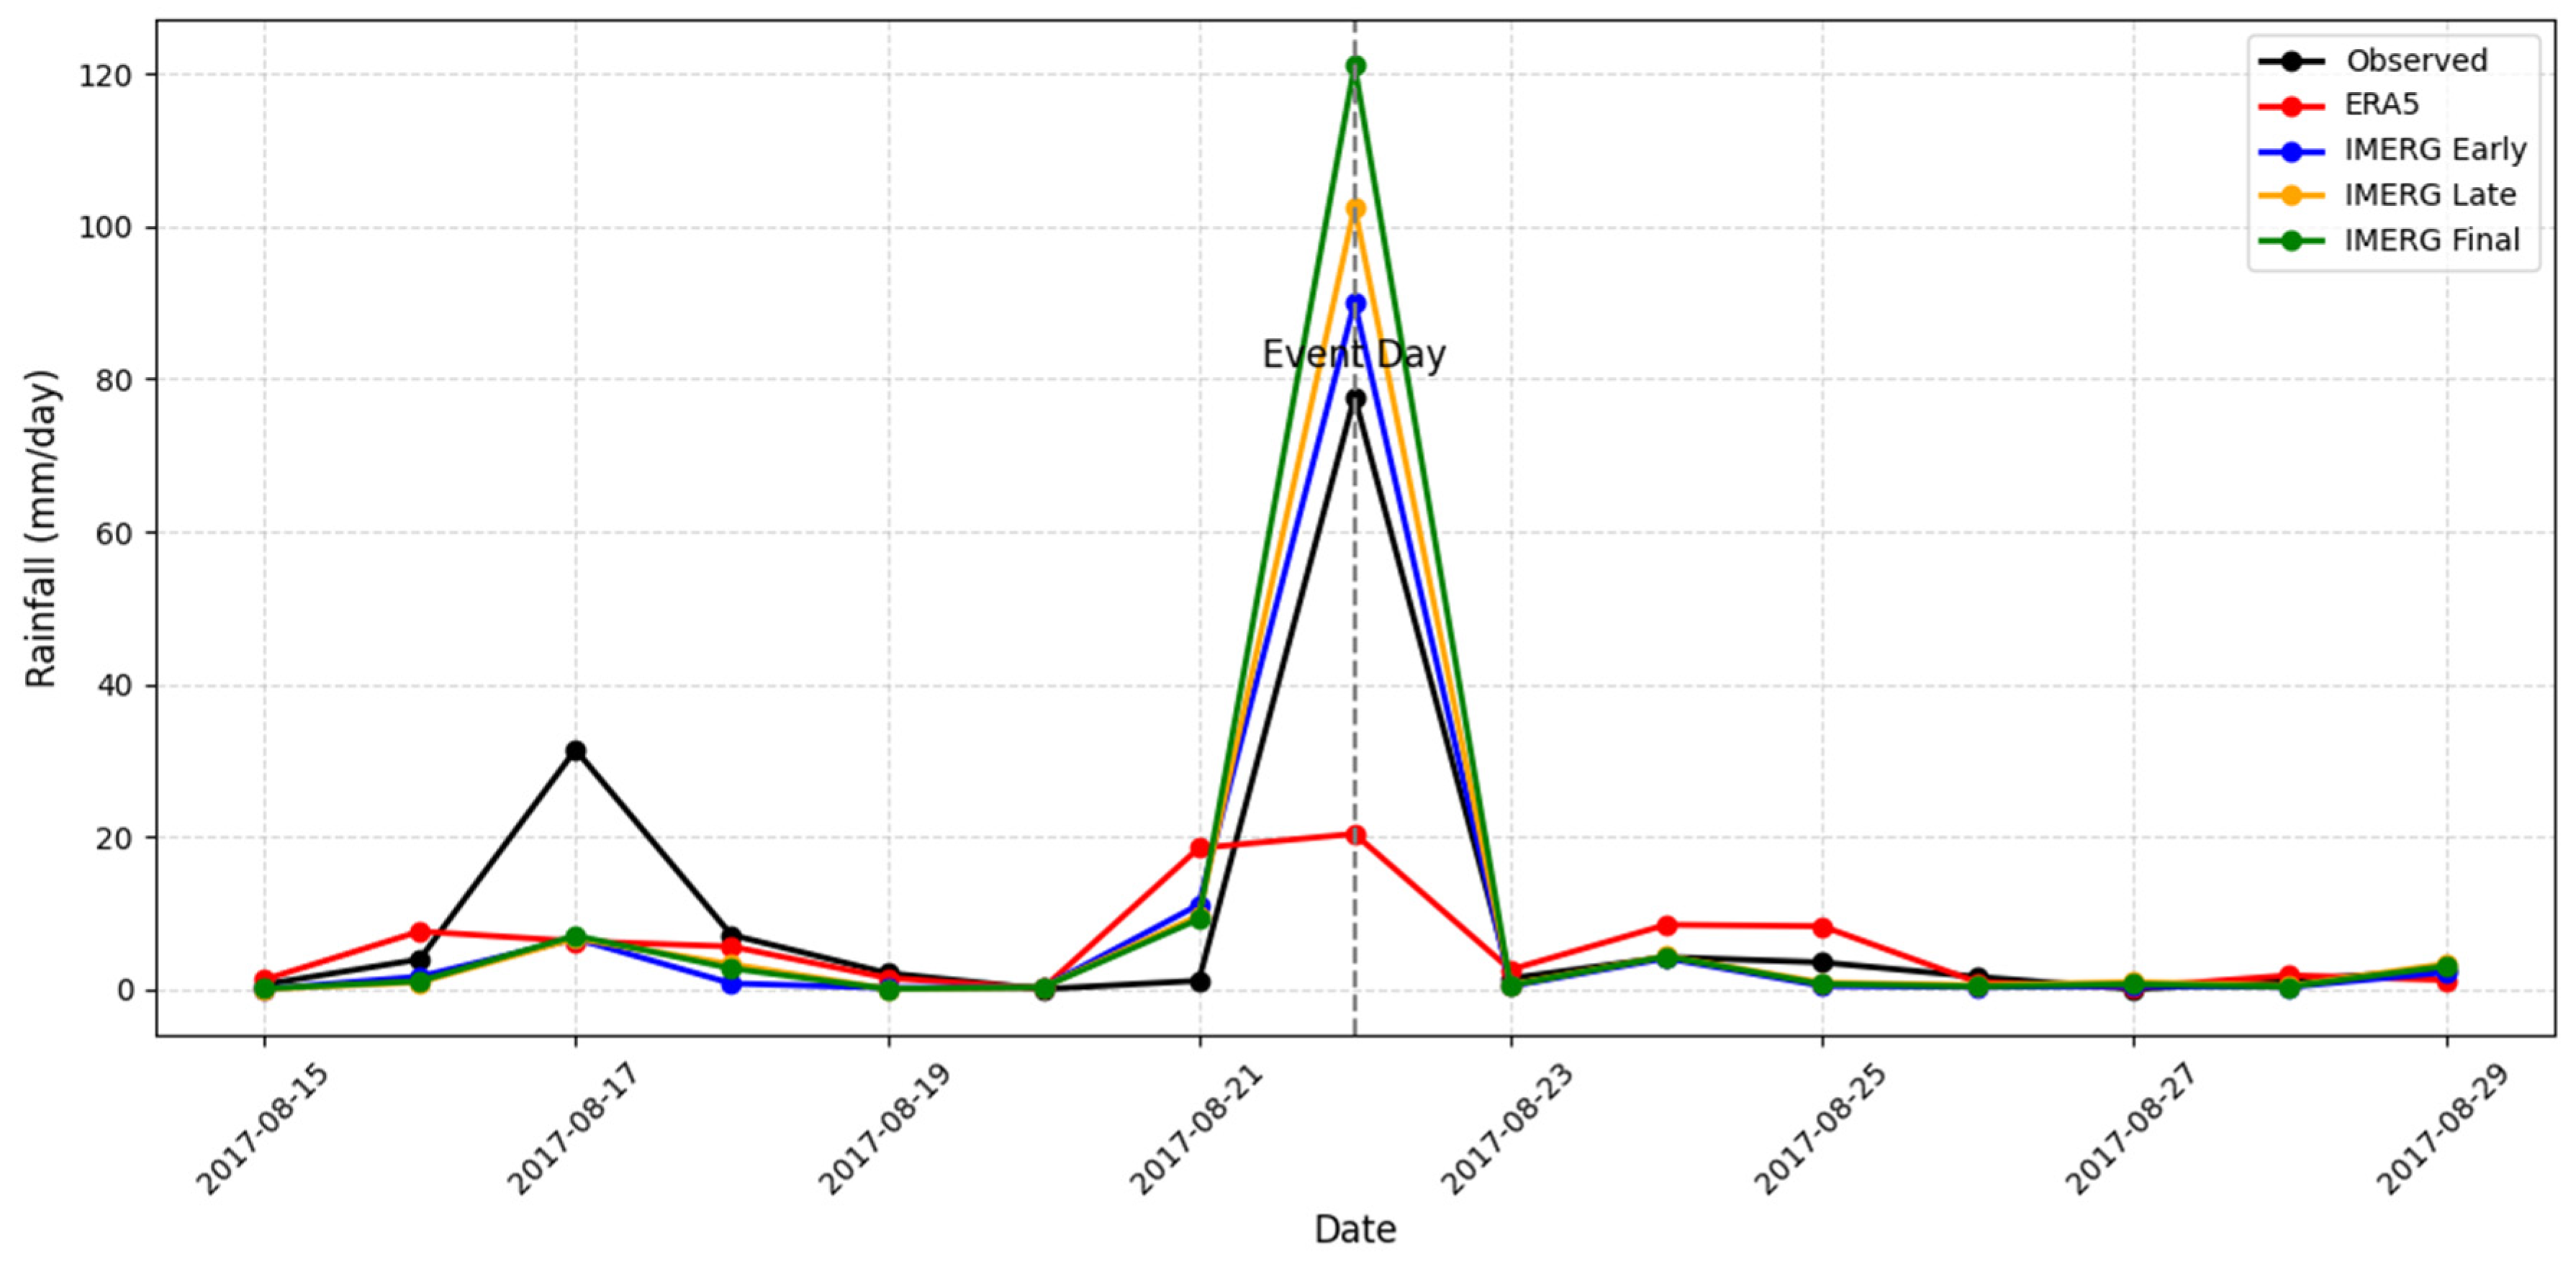
Cumulative rainfall comparisons reinforced these findings. At Malin Head (ID:1575) on 22 August 2017 (Figure 12), ERA5’s total event accumulation was less than half the observed amount, despite capturing the general temporal structure. IMERG products, by contrast, more effectively represented both peak intensities and total accumulation within the event window.
These case-specific findings were supported by broader patterns observed across all stations (see Appendix A Table A3). ERA5 exhibited systematic underestimation of peak intensities and event totals, with peak error exceeding −60% and correlation coefficients dropping below 0.70 at several stations. Conversely, IMERG-Final generally performed robustly across spatial domains, aligning more closely with ground truth in both coastal (e.g., Finner, Malin Head) and inland regions (e.g., Mullingar). It showed moderate overestimation at high-elevation and coastal stations but minimal systematic bias. IMERG-Early and Late followed similar trends but with slightly dampened peaks and more timing errors. Persistent overestimation in certain western stations may reflect algorithm sensitivity to orographic uplift and persistent cloud-top signals.

4. Discussion

This study assesses the performance of ERA5 and IMERG precipitation products across Ireland’s diverse hydroclimatic regimes. Product performance was strongly influenced by rainfall type and intensity, seasonal regimes, and prevailing circulation mechanisms. These patterns reflect Ireland’s dual hydroclimatic structure, where frontal systems and embedded convective shafts dominate winter rainfall in western regions, enhanced by ocean-atmosphere interactions along Atlantic storm tracks. In contrast, convective activity in summer becomes more pronounced over land, particularly in the more continental east, contributing to a more even seasonal rainfall distribution in those areas [40].
ERA5 demonstrated consistent performance under low-to-moderate rainfall, particularly during winter and in frontal dominated coastal regions. Its assimilation-driven framework effectively captures large-scale synoptic patterns with strong seasonal coherence. However, it consistently underestimates high intensity rainfall, especially during summer, and exhibits elevated false alarm rates at finer temporal scales. These shortcomings confirm findings from other mid-latitude regions, including China and Spain, where ERA5 has shown seasonal detection limitations and intensity-dependent biases [27,28]. In central and northern Europe, ERA5’s wet bias, driven by excessive wet-day frequency, and its coarse effective resolution have been highlighted as critical issues, limiting its reliability for localized event-scale analysis [49].
IMERG-Final, by contrast, displayed heightened sensitivity to convective extremes and demonstrated strong performance in capturing high-intensity, short-duration rainfall events, particularly in eastern and inland Irish catchments during summer. This aligns with improvements introduced in the V06B algorithm, including enhanced gauge calibration and refined microwave-infrared merging. While IMERG-Final exhibited greater spatial variability than ERA5, this reflects its responsiveness to localized extremes rather than inconsistency. Similar performance patterns have been reported across convective-dominated regions such as the Qinghai–Tibet Plateau and Southwestern Iran, where IMERG-Final outperformed other satellite products in capturing rainfall intensity and seasonal variability [19,50]. Despite this, terrain remains a limiting factor. A study over the Mongolian Plateau [32] found IMERG-Early and IMERG-Late to overestimate rainfall in elevated areas, a pattern partially repeated in western Ireland. Although the performance gap between IMERG-Final and the earlier products was relatively small, spatial variability was more evident in climatological complex settings, reinforcing the need for caution when using lower-latency products in such settings.
The comparison between IMERG-Early and IMERG-Late revealed some unexpected patterns. Despite being designed as a refined version, IMERG-Late often underperformed relative to IMERG-Early in this study. This was most evident at Atlantic-exposed coastal stations such as Malin Head, Belmullet, Valentia observatory, Mace Head, and Sherkin Island, where IMERG-Late showed lower correlations and higher RMSE values. This is most likely due to the dominant precipitation mechanisms in these regions, which are mainly driven by frontal systems and orographic uplift. IMERG’s passive microwave (PMW) retrieval component depends heavily on scattering signals from ice particles in the mid-to-upper troposphere, while its infrared (IR)-based retrievals rely on cold cloud-top temperatures as proxies for precipitation intensity. Orographic and frontal precipitation typically produce weaker ice scattering signatures and less pronounced cooling of cloud tops, which makes both PMW and IR proxies less sensitive. Consequently, the IMERG-Late algorithm, which relies on morphing techniques to propagate PMW estimates forward and backward in time, may struggle in capturing these light precipitation events, resulting in degraded quantification performance. In contrast, IMERG-Early may rely more directly on the initial PMW observations when available, leading to relatively better (though still imperfect) capturing of these precipitation events. Thus, in this coastal–orographic context, IMERG-Late shows reduced effectiveness relative to IMERG-Early [51].
The observed complementarity between ERA5 and IMERG-Final mirrors findings from the conterminous US region (CONUS) [26], where reanalysis products performed better in terrain-driven settings and satellite products excelled in convective zones. Our results reinforce this distinction in Ireland: ERA5 offers spatial and seasonal stability under frontal regimes, while IMERG-Final captures convective extremes with greater reliability. This suggests that a hybrid or bias-corrected integration of both datasets could enhance precipitation inputs for hydrological modeling.
Daily temporal aggregation significantly improved both datasets, particularly IMERG-Final, by reducing high-frequency noise and enhancing correlation with observed data, as reported in previous studies [14]. This supports its operational value in flood forecasting and event-scale monitoring, though residual spatial biases still necessitate localized corrections.

5. Conclusions

This study provides a regional, ground-truth-based evaluation of ERA5 and GPM-IMERG precipitation products (IMERG-Early, IMERG-Late, and IMERG-Final) across Ireland’s varied hydrometeorological settings in 2014–2021. The conclusions can be summarized as follows:
  • ERA5 consistently demonstrated strong detection skills and climatological stability particularly under stratiform and low-to-moderate rainfall conditions. Its performance was strongest during Autumn and Winter, when large-scale synoptic systems dominate, making it well suited for baseline hydrological modeling. However, ERA5 tended to underestimate very heavy rainfall and exhibited elevated false alarm rates at finer temporal scales, limiting its reliability in convective environments such as those observed in summer.
  • IMERG-Final demonstrated enhanced responsiveness to short-duration, high-intensity events, particularly when aggregated to daily resolution (64.4 > mm/day). This was most evident during summer, when such events are occasionally associated with convective activity. During very heavy rainfall events, it achieved up to 18% lower MAE, 17% lower RMSE, and 13% higher correlation compared to ERA5, reflecting improved accuracy in capturing peak intensities and temporal structure associated with convective storms.
  • IMERG-Early and IMERG-Late demonstrated performance levels that were comparable to IMERG-Final within a narrow margin, despite their lower latency and reduced post-processing. While IMERG-Final generally demonstrated better statistical accuracy, improving MAE and RMSE by approximately 10–15%, correlation coefficients by 5–10%, and CSI by up to 3 percentage points, these improvements remained modest across seasons and rainfall intensities. Notably, IMERG-Early exhibited strong rainfall detection sensitivity and performed comparably to IMERG-Final during spring and summer. The differences among the IMERG products were especially narrow under very heavy rainfall conditions, where all three converged in terms of error and correlation.
  • These findings confirm that precipitation datasets are not interchangeable. Instead, their strengths are complementary: ERA5 offers spatial and seasonal consistency, while IMERG-Final enhances responsiveness to localized extremes. These differences make it valuable for retrospective validation, model calibration and performance benchmarking in Irish catchments.
Future work should explore dynamic, adaptive frameworks that combine the strengths of both datasets, whether through hybrid models, bias correction techniques, or machine learning approaches that account for rainfall type, intensity, and seasonal structure.

Author Contributions

Conceptualization, S.M. and A.N.; methodology, S.M., A.N. and M.M.; coding, S.M. and M.M.; validation, S.M., A.N. and M.M.; formal analysis, S.M.; investigation, S.M. and A.N.; data curation, S.M. and M.M.; writing—original draft preparation, S.M.; writing—review and editing, A.N.; visualization, S.M.; supervision, A.N.; project administration, A.N. All authors have read and agreed to the published version of the manuscript.

Funding

The research conducted in this publication was funded by the Irish Research Council under 2021 Government of Ireland Postgraduate (GOIPG) Scholarship under the grant number [GOIPG/2021/1388].

Data Availability Statement

The original contributions presented in this study are included in the article. Further inquiries can be directed to the corresponding author.

Conflicts of Interest

The authors declare no conflicts of interest.

Appendix A

Figure A1. Seasonal boxplots of MAE, RMSE, BIAS, and Correlation for IMERG and ERA5 precipitation products across 25 stations in Ireland (2014–2021). Columns represent evaluation metrics, with each product separated into two groups: coastal and inland stations.
Remotesensing 17 03154 g0a1
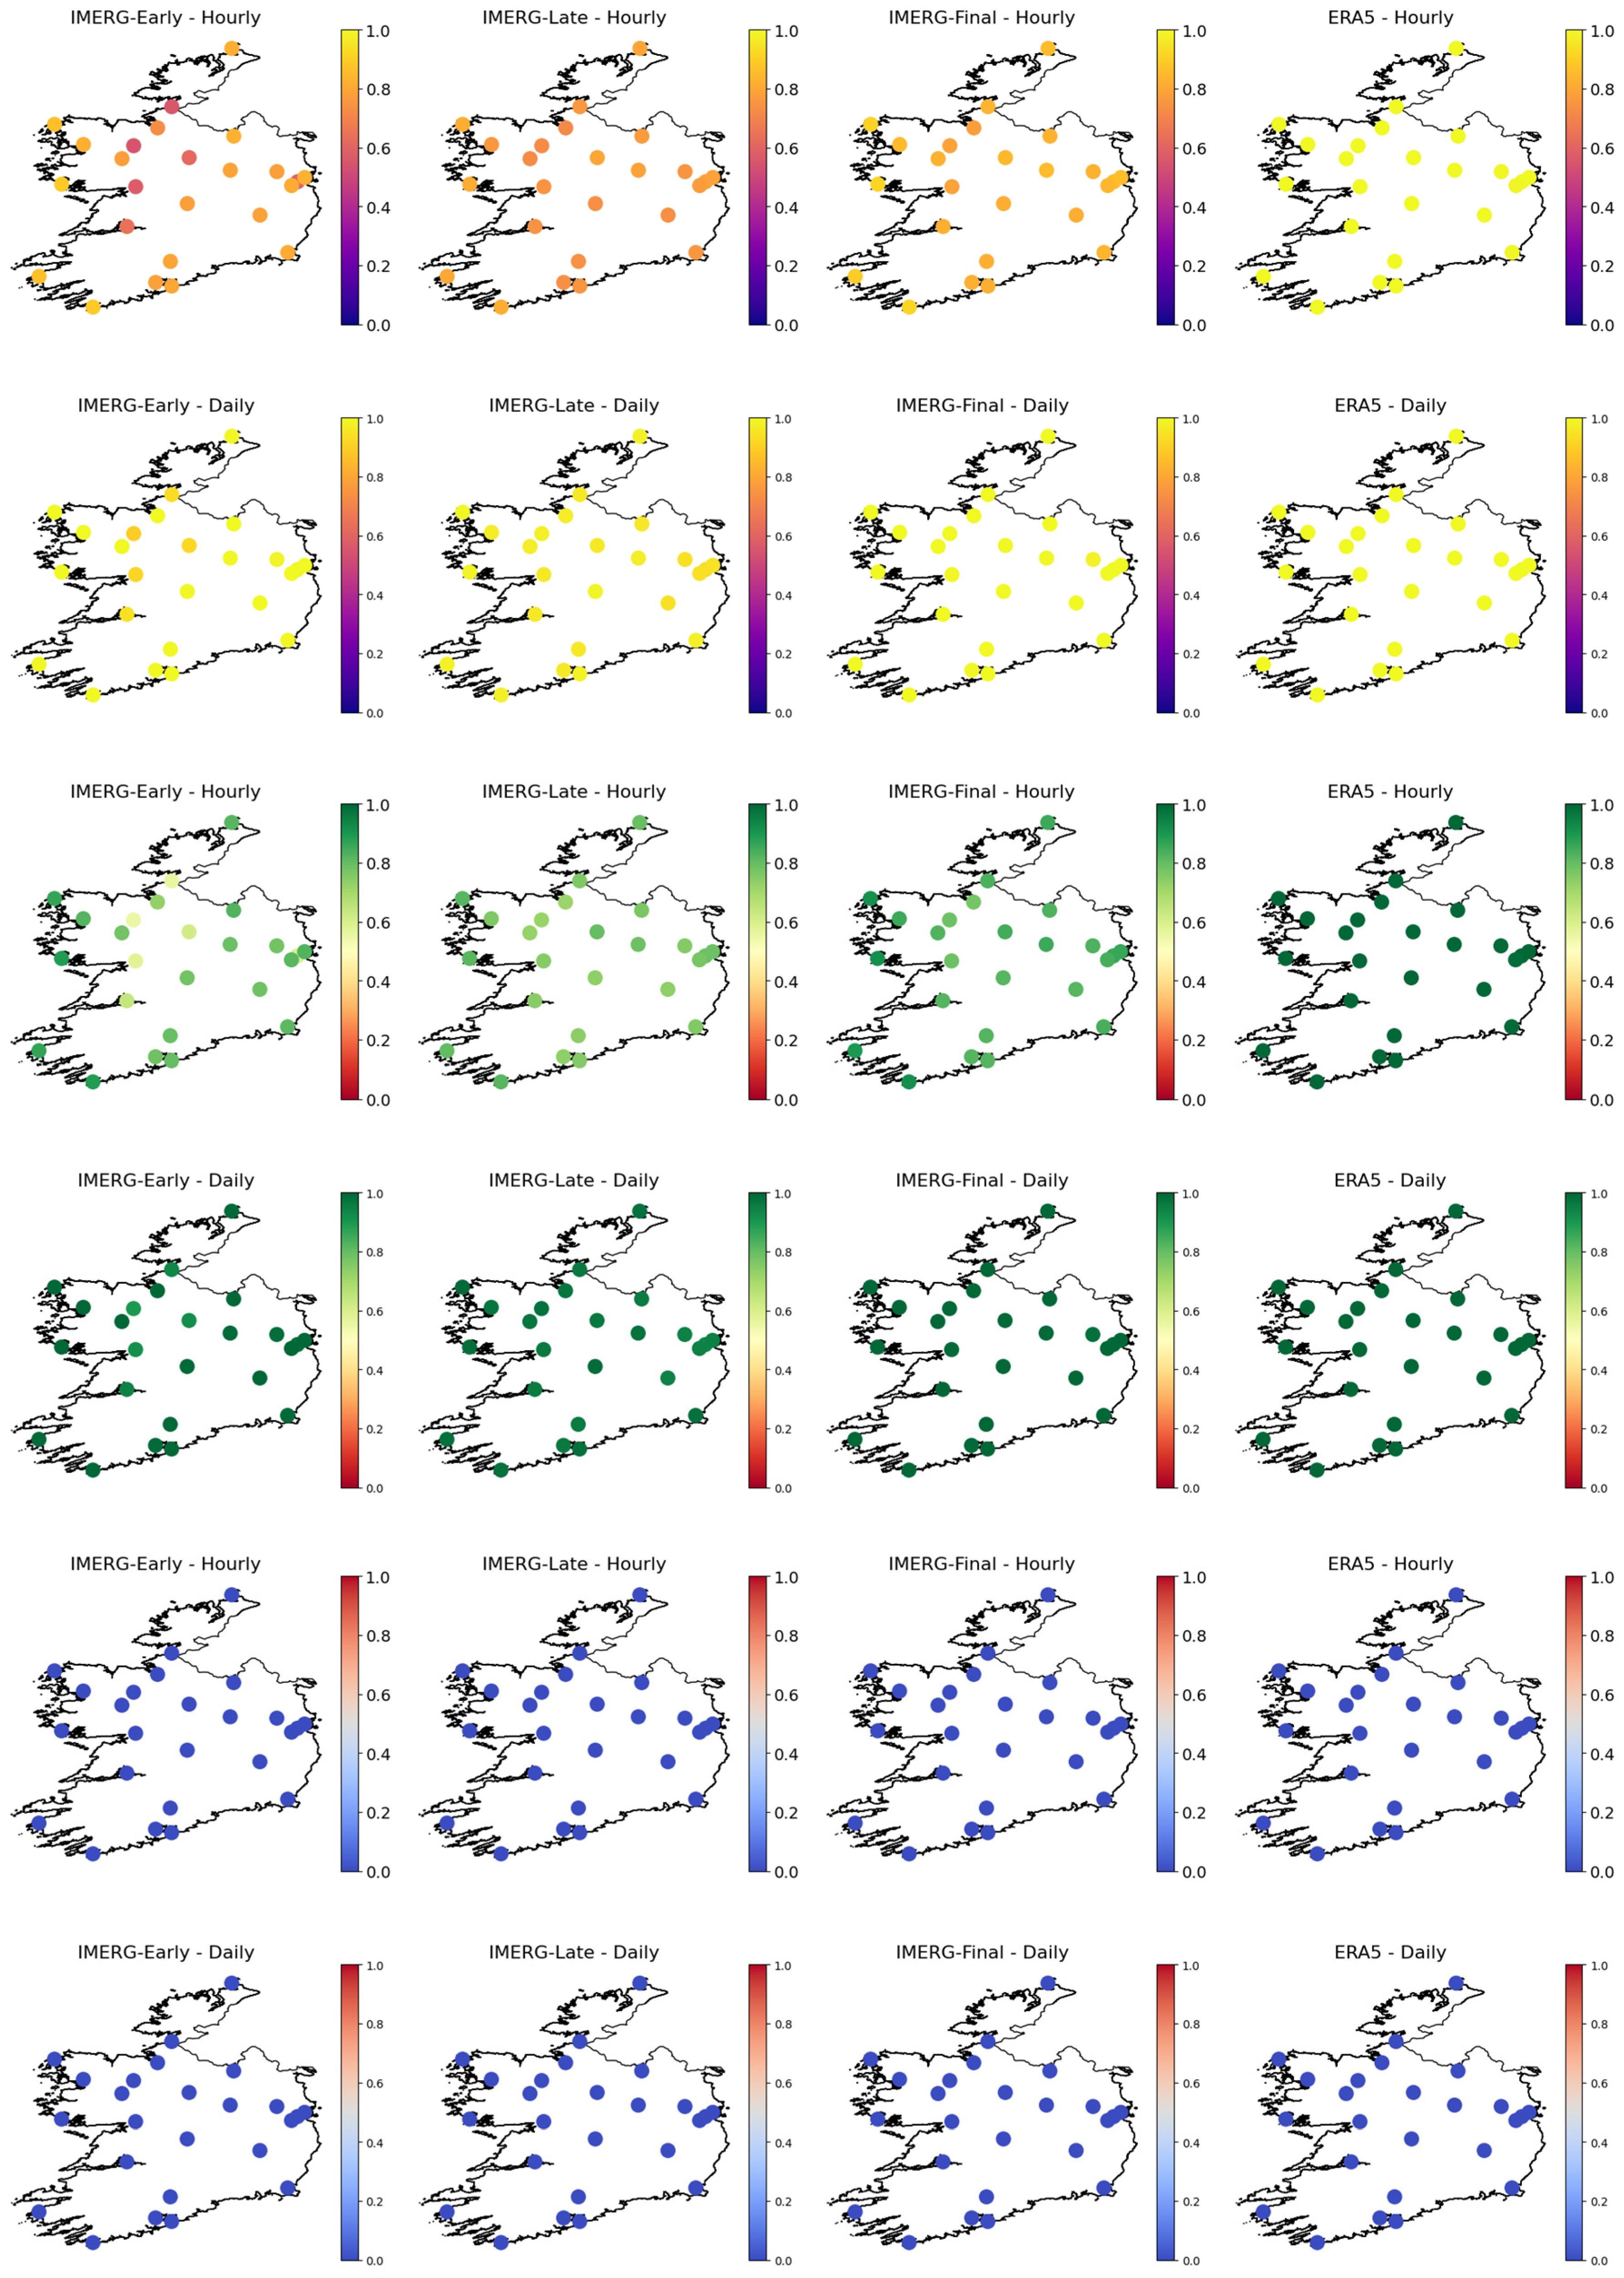
Figure A2. Spatial distribution of detection accuracy metrics (POD, CSI, FAR) for Moderate rain class across 25 synoptic stations in Ireland during 2014–2021. Each metric is presented in two rows, corresponding to hourly (top) and daily (bottom) resolutions. Columns represent precipitation products: IMERG-Early, IMERG-Late, IMERG-Final, and ERA5.
Remotesensing 17 03154 g0a2
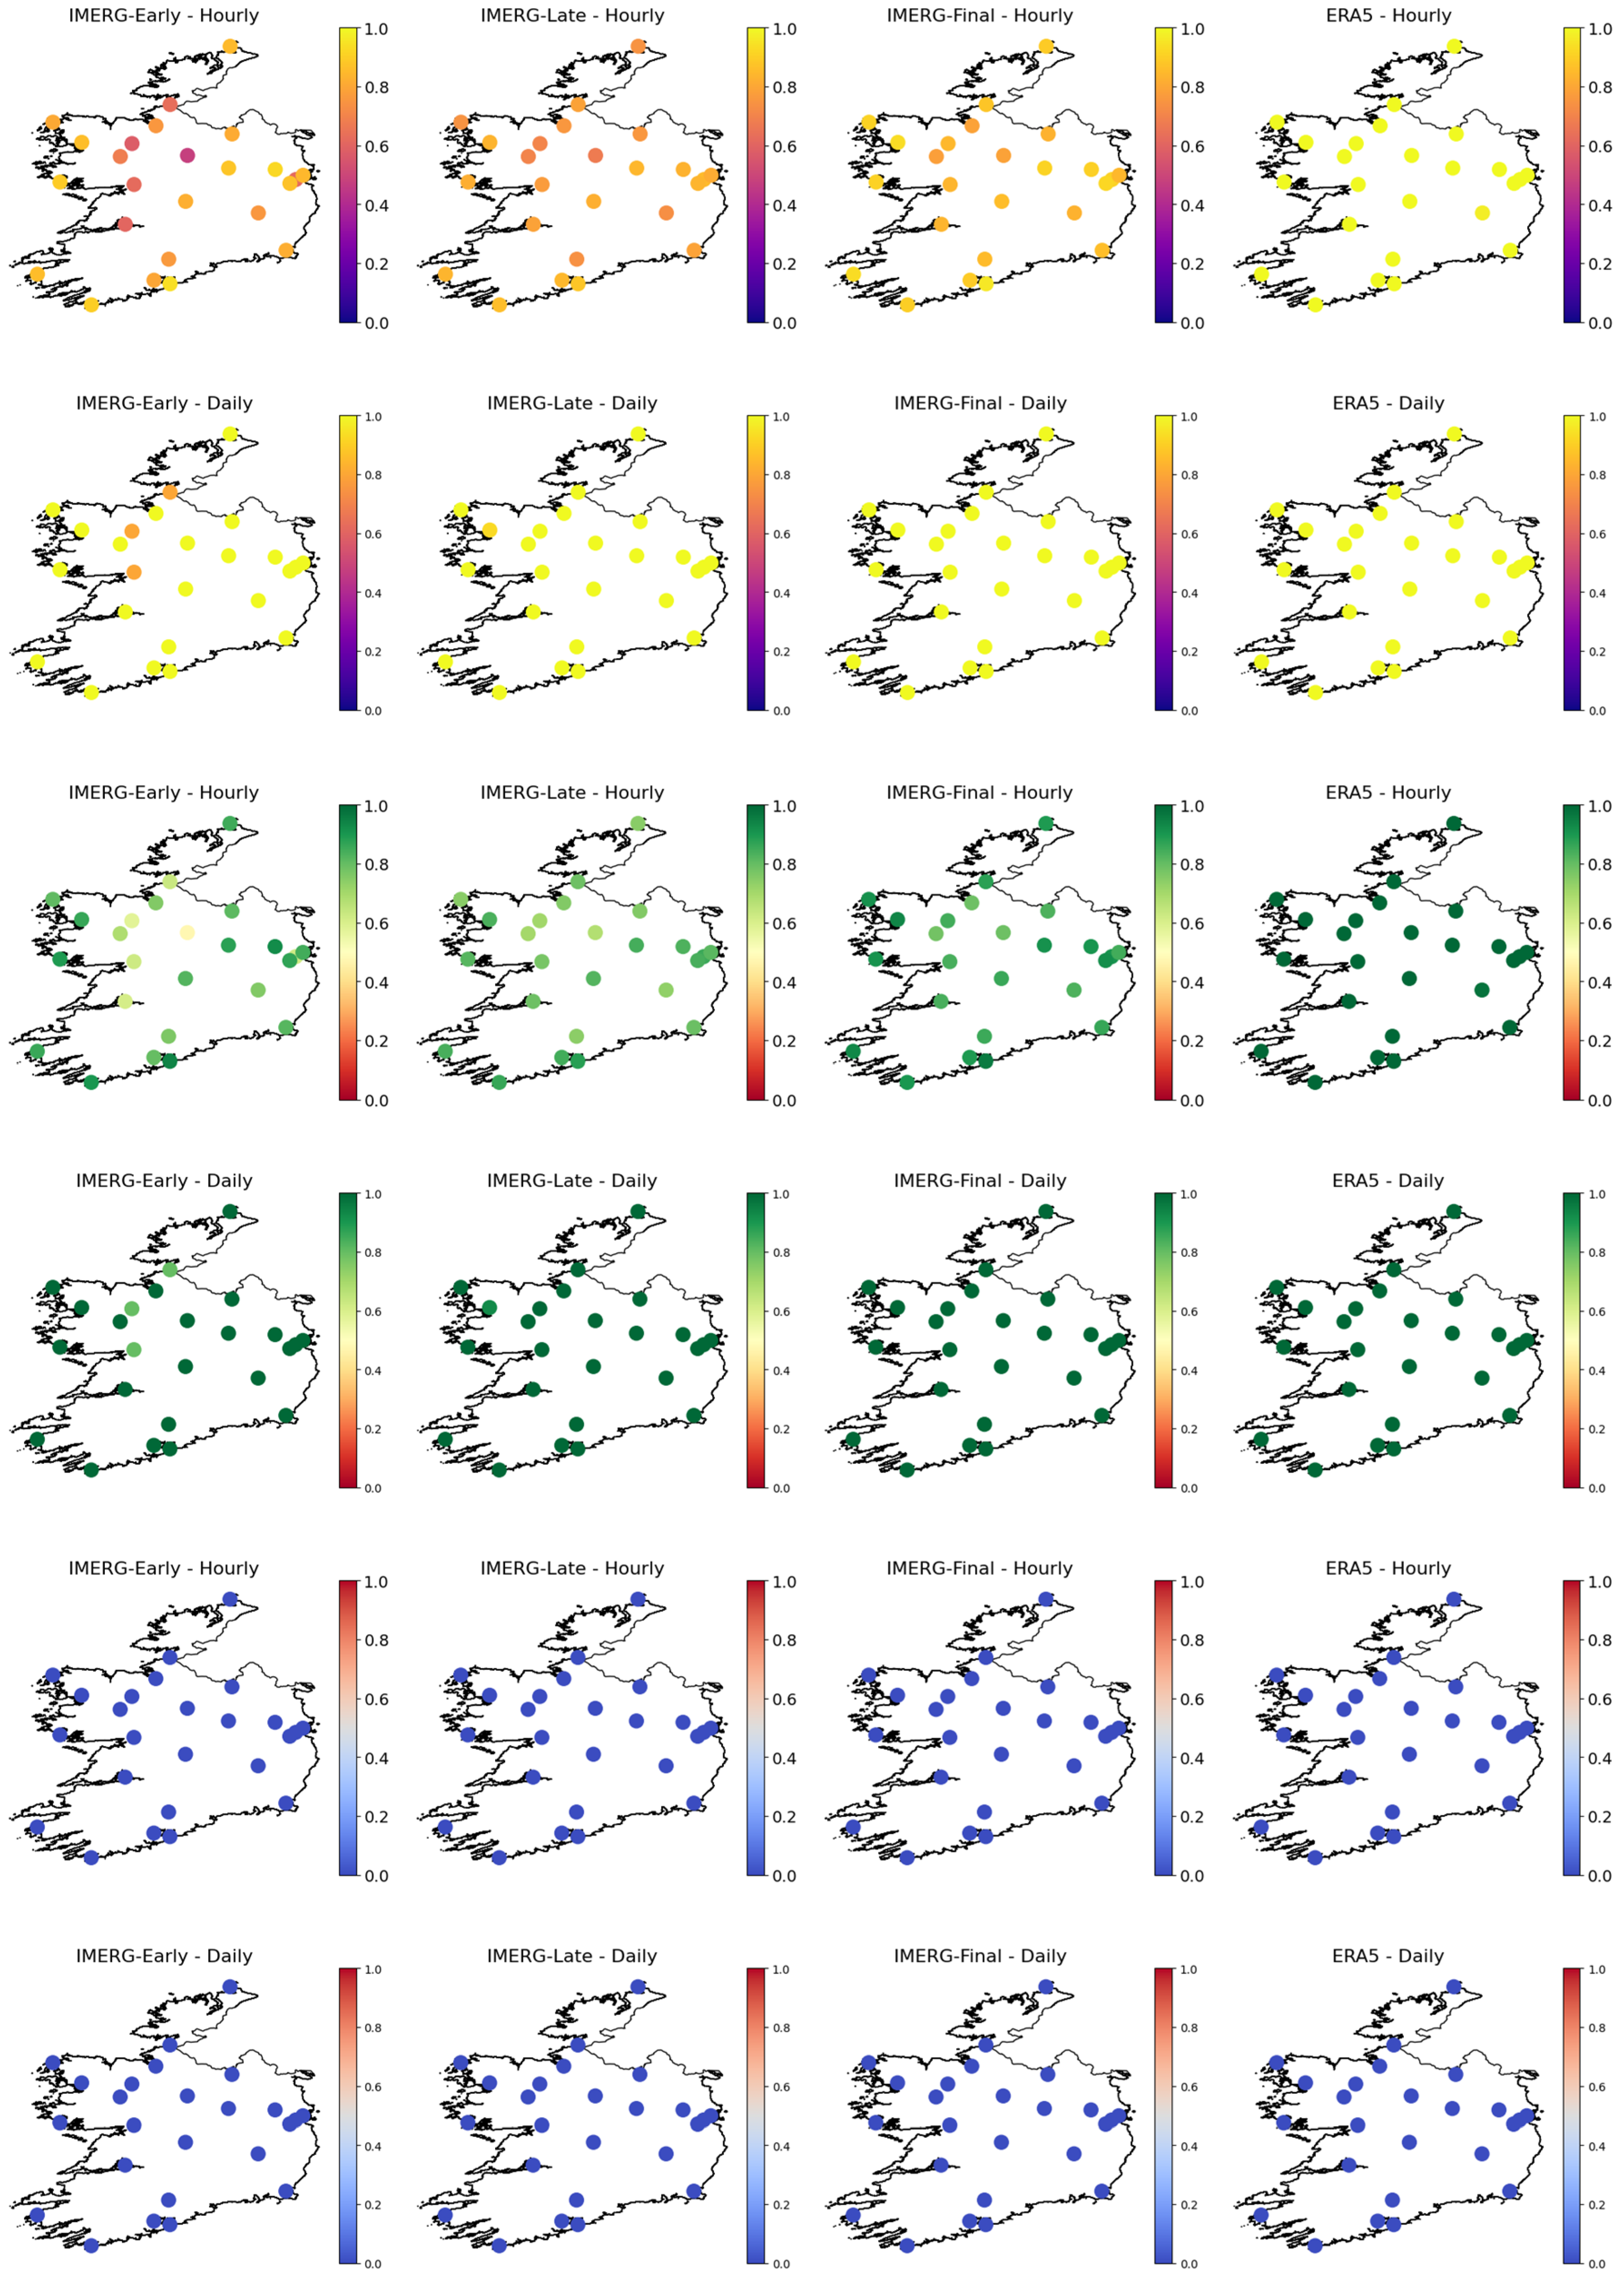
Figure A3. Spatial distribution of detection accuracy metrics (POD, CSI, FAR) for Heavy rain class across 25 synoptic stations in Ireland during 2014–2021. Each metric is presented in two rows, corresponding to hourly (top) and daily (bottom) resolutions. Columns represent precipitation products: IMERG-Early, IMERG-Late, IMERG-Final, and ERA5.
Remotesensing 17 03154 g0a3
Table A1. Correlation coefficients (CC) between gauges and IMERG (Early, Late and Final) and ERA5 at hourly and daily resolution across 25 synoptic stations.
Station IDTime ResPrecipitation Product
IMERG-EarlyIMERG-LateIMERG-FinalERA5
175Hourly0.25360.24410.27240.3352
Daily 0.66890.62790.72680.8176
275Hourly0.34670.30090.37990.6004
Daily 0.72310.65390.78340.8328
375Hourly0.29110.260.2850.3433
Daily 0.73130.6470.78390.8582
518Hourly0.05310.2510.320.5243
Daily 0.1550.62720.74020.8175
532Hourly0.26340.24410.27910.334
Daily 0.67870.65510.7530.81
575Hourly0.35050.3210.38990.6234
Daily 0.70410.63480.76620.8649
675Hourly0.32850.28820.34890.5305
Daily 0.67650.60790.7570.841
775Hourly0.35530.31590.38190.6567
Daily 0.75440.65320.790.8725
875Hourly0.34360.31560.37260.5447
Daily 0.64480.60640.75120.8263
1075Hourly0.33490.30740.36250.6311
Daily 0.71230.62690.75310.8578
1175Hourly0.29860.26570.3310.5421
Daily 0.61350.55170.68550.7637
1275Hourly0.32350.28360.33290.5465
Daily 0.68710.6210.73040.8248
1375Hourly0.33130.30820.36480.5499
Daily 0.65040.63040.74440.814
1475Hourly0.32710.28290.36880.5552
Daily 0.65950.59250.74440.8226
1575Hourly0.29630.25990.32720.5461
Daily 0.64750.58340.72280.8123
1775Hourly0.35290.31680.35950.6497
Daily 0.67690.61870.74990.8622
1875Hourly0.04970.27410.34690.542
Daily 0.13130.56940.70310.8026
1975Hourly0.03410.29470.35360.5457
Daily 0.13840.62350.73770.8446
2075Hourly0.02910.2820.32420.5004
Daily 0.05070.58340.6960.7986
2175Hourly0.35380.30770.3770.5802
Daily 0.70490.62330.75180.8482
2275Hourly0.36220.31090.38170.6541
Daily 0.70950.61820.76670.878
2375Hourly0.31080.29450.30290.6054
Daily 0.67540.62860.69820.8627
3723Hourly0.2580.23250.2740.3391
Daily 0.69040.65460.74940.8179
3904Hourly0.37310.33860.39120.6604
Daily 0.73220.63660.75840.8841
4935Hourly0.03790.27610.35680.5874
Daily 0.07970.63920.74660.8282
Table A2. Errors and correlation measures of ERA5 and IMERG precipitation products (Early, Late, Final) across four rainfall intensity classes (Light, Moderate, Heavy, Very Heavy) at hourly and daily temporal resolutions, presented as mean ± standard deviation across 25 synoptic stations in Ireland (2014–2021).
Rainfall ClassProductHourly (mm/h)Daily (mm/day)
MAERMSEBIASCCMAERMSEBIASCC
LightIMERG_Early0.7 ± 0.01.6 ± 0.20.0 ± 0.000.24 ± 0.043.3 ± 0.56.1 ± 1.00.02 ± 0.020.44 ± 0.10
IMERG_Late0.7 ± 0.01.5 ± 0.20.00 ± 0.000.23 ± 0.033.3 ± 0.46.3 ± 0.80.02 ± 0.020.40 ± 0.04
IMERG_Final0.7 ± 0.11.5 ± 0.20.00 ± 0.000.27 ± 0.033.0 ± 0.35.3 ± 0.60.02 ± 0.010.53 ± 0.04
ERA50.4 ± 0.00.6 ± 0.00.00 ± 0.000.46 ± 0.041.7 ± 0.22.5 ± 0.30.01 ± 0.010.67 ± 0.04
ModerateIMERG_Early2.9 ± 0.23.9 ± 0.5−0.08 ± 0.040.04 ± 0.0411.4 ± 1.317.1 ± 2.30.12 ± 0.110.32 ± 0.08
IMERG_Late2.9 ± 0.13.8 ± 0.4−0.08 ± 0.020.03 ± 0.0411.7 ± 1.117.3 ± 2.10.09 ± 0.080.33 ± 0.07
IMERG_Final2.7 ± 0.23.5 ± 0.6−0.07 ± 0.030.04 ± 0.0410.5 ± 1.914.7 ± 3.20.14 ± 0.070.40 ± 0.08
ERA52.0 ± 0.12.2 ± 0.1−0.13 ± 0.040.12 ± 0.075.1 ± 0.66.5 ± 0.7−0.09 ± 0.040.52 ± 0.07
HeavyIMERG_Early5.1 ± 0.45.8 ± 0.6−0.91 ± 0.35−0.03 ± 0.1022.8 ± 9.527.4 ± 10.8−4.64 ± 13.000.05 ± 0.61
IMERG_Late5.0 ± 0.35.7 ± 0.5−0.92 ± 0.35−0.04 ± 0.1120.7 ± 9.425.7 ± 12.30.16 ± 10.580.19 ± 0.54
IMERG_Final4.8 ± 0.55.4 ± 0.6−0.86 ± 0.34−0.03 ± 0.1117.2 ± 8.720.5 ± 10.01.61 ± 7.620.28 ± 0.54
ERA54.7 ± 0.35.0 ± 0.3−1.10 ± 0.360.04 ± 0.1116.5 ± 4.718.6 ± 4.9−9.27 ± 6.180.40 ± 0.50
Very HeavyIMERG_Early10.6 ± 2.111.3 ± 2.5−14.36 ± 7.200.18 ± 0.5340.1 ± 23.640.4 ± 23.4−26.96 ± 55.21−1.00 ± nan
IMERG_Late10.4 ± 2.211.2 ± 2.5−14.42 ± 7.550.14 ± 0.5132.0 ± 23.032.0 ± 23.0−9.08 ± 48.84−1.00 ± nan
IMERG_Final10.2 ± 2.010.9 ± 2.3−14.24 ± 7.430.20 ± 0.4919.9 ± 10.320.7 ± 10.9−6.06 ± 26.32−1.00 ± nan
ERA511.6 ± 1.612.2 ± 2.2−16.21 ± 8.11−0.07 ± 0.4841.4 ± 13.741.7 ± 13.8−46.73 ± 18.161.00 ± nan
Table A3. Summary of peak intensity, timing lag, total accumulated rainfall, and correlation coefficients for ERA5 and IMERG precipitation products (Early, Late, Final) during selected very heavy rainfall events across multiple stations in Ireland (2014–2021). Metrics are computed over an 11-day window (±5 days from the event day) and include peak rainfall (mm), relative peak error (%), timing difference in days, total rainfall (mm), and Pearson correlation coefficient (CC) with observed data.
Event DateStationProductPeak (mm)Peak Error (%)Peak Timing Lag (days)Total (mm)CC
2 August 2014Dublin Airport (ID: 532)Observed79.6--151.41
ERA529.63−62.800103.660.93
IMERG Early136.3671.300256.90.98
IMERG Late144.3381.300261.270.98
IMERG Final76.29−4.200148.140.97
5 August 2021Mullingar (ID: 875)Observed70.8--1551
ERA518.77−73.50094.90.82
IMERG Early23−67.50086.660.71
IMERG Late21.46−69.70083.790.76
IMERG Final36.54−48.400126.660.91
11 September 2015Newport (ID:1175)Observed82--142.91
ERA561.31−25.200127.730.97
IMERG Early69.29−15.500107.940.98
IMERG Late76.04−7.300109.390.99
IMERG Final103.0125.600150.870.99
5 December 2015Malin Head (ID:1575)Observed83.8--364.41
ERA553.11−36.600276.370.82
IMERG Early90.087.500310.30.88
IMERG Late102.5722.400319.040.9
IMERG Final121.1344.600381.970.91
5 December 2015Finner (ID:2075)Observed72.9--226.41
ERA545.91−37.000196.370.96
IMERG Early88.6421.600245.250.93
IMERG Late79.028.400217.980.94
IMERG Final85.7917.700276.270.92
3 October 2016Valentia Observatory (ID:2275)Observed105.7--218.11
ERA547.54−55.000138.50.97
IMERG Early55.9−47.100184.810.9
IMERG Late59.13−44.100180.770.92
IMERG Final79.52−24.800250.330.92

References

  1. Blöschl, G.; Hall, J.; Viglione, A.; Perdigão, R.A.P.; Parajka, J.; Merz, B.; Lun, D.; Arheimer, B.; Aronica, G.T.; Bilibashi, A.; et al. Changing climate both increases and decreases European river floods. Nature 2019, 573, 108–111. [Google Scholar] [CrossRef]
  2. Arnell, N.W.; Gosling, S.N. The impacts of climate change on river flood risk at the global scale. Clim. Chang. 2016, 134, 387–401. [Google Scholar] [CrossRef]
  3. Sherlock, E.; Duffy, S. 05-Establishing the Flood Forecast Centre and Expanding Met Eireann’s Rainfall Radar Network. In Proceedings of the Irish National Hydrology Conference 2019, Athlone, Ireland, 19 November 2019. [Google Scholar]
  4. Kidd, C.; Levizzani, V. Status of satellite precipitation retrievals. Hydrol. Earth Syst. Sci. 2011, 15, 1109–1116. [Google Scholar] [CrossRef]
  5. Huffman, G.J.; Bolvin, D.T.; Braithwaite, D.; Hsu, K.; Joyce, R.; Kidd, C.; Nelkin, E.J.; Xie, P. Algorithm Theoretical Basis Documen Version 4.5. In NASA Global Precipitation Measurement (GPM) Integrated Multi-SatellitE Retrievals for GPM (IMERG); NASA: Greenbelt, MD, USA, 2015. [Google Scholar]
  6. Wang, Z.; Zhong, R.; Lai, C.; Chen, J. Evaluation of the GPM IMERG satellite-based precipitation products and the hydrological utility. Atmos. Res. 2017, 196, 151–163. [Google Scholar] [CrossRef]
  7. Hersbach, H.; Bell, B.; Berrisford, P.; Hirahara, S.; Horányi, A.; Muñoz-Sabater, J.; Nicolas, J.; Peubey, C.; Radu, R.; Schepers, D.; et al. The ERA5 global reanalysis. Q. J. R. Meteorol. Soc. 2020, 146, 1999–2049. [Google Scholar] [CrossRef]
  8. Wang, D.; Wang, X.; Liu, L.; Wang, D.; Huang, H.; Pan, C. Evaluation of TMPA 3B42V7, GPM IMERG and CMPA precipitation estimates in Guangdong Province, China. Int. J. Climatol. 2019, 39, 738–755. [Google Scholar] [CrossRef]
  9. Tang, G.; Ma, Y.; Long, D.; Zhong, L.; Hong, Y. Evaluation of GPM Day-1 IMERG and TMPA Version-7 legacy products over Mainland China at multiple spatiotemporal scales. J. Hydrol. 2016, 533, 152–167. [Google Scholar] [CrossRef]
  10. Hamouda, M.A.; Hinge, G.; Yemane, H.S.; Al Mosteka, H.; Makki, M.; Mohamed, M.M. Reliability of GPM IMERG Satellite Precipitation Data for Modelling Flash Flood Events in Selected Watersheds in the UAE. Remote Sens. 2023, 15, 3991. [Google Scholar] [CrossRef]
  11. Biswas, S.; Singh, C.; Bharti, V. An assessment of GPM IMERG Version 7 rainfall estimates over the North West Himalayan region. Atmos. Res. 2025, 315, 107910. [Google Scholar] [CrossRef]
  12. Fang, J.; Yang, W.; Luan, Y.; Du, J.; Lin, A.; Zhao, L. Evaluation of the TRMM 3B42 and GPM IMERG products for extreme precipitation analysis over China. Atmos. Res. 2019, 223, 24–38. [Google Scholar] [CrossRef]
  13. Pan, X.; Wu, H.; Chen, S.; Nanding, N.; Huang, Z.; Chen, W.; Li, C.; Li, X. Evaluation and Applicability Analysis of GPM Satellite Precipitation over Mainland China. Remote Sens. 2023, 15, 2866. [Google Scholar] [CrossRef]
  14. Moazami, S.; Najafi, M.R. A comprehensive evaluation of GPM-IMERG V06 and MRMS with hourly ground-based precipitation observations across Canada. J. Hydrol. 2021, 594, 125929. [Google Scholar] [CrossRef]
  15. Hsu, J.; Huang, W.R.; Liu, P.Y. Performance assessment of GPM-based near-real-time satellite products in depicting diurnal precipitation variation over Taiwan. J. Hydrol. Reg. Stud. 2021, 38, 100957. [Google Scholar] [CrossRef]
  16. Navarro, A.; García-Ortega, E.; Merino, A.; Sánchez, J.L.; Kummerow, C.; Tapiador, F.J. Assessment of IMERG precipitation estimates over Europe. Remote Sens. 2019, 11, 2470. [Google Scholar] [CrossRef]
  17. Boluwade, A. Spatial-Temporal Evaluation of Satellite-Derived Rainfall Estimations for Water Resources Applications in the Upper Congo River Basin. Remote Sens. 2024, 16, 3868. [Google Scholar] [CrossRef]
  18. Zhou, C.; Gao, W.; Hu, J.; Du, L.; Du, L. Capability of imerg v6 early, late, and final precipitation products for monitoring extreme precipitation events. Remote Sens. 2021, 13, 689. [Google Scholar] [CrossRef]
  19. Keikhosravi-Kiany, M.S.; Balling, R.C. Evaluation of GPM IMERG Early, Late, and Final Run in Representing Extreme Rainfall Indices in Southwestern Iran. Remote Sens. 2024, 16, 2779. [Google Scholar] [CrossRef]
  20. Ramsauer, T.; Weiß, T.; Marzahn, P. Comparison of the GPM IMERG final precipitation product to RADOLAN weather radar data over the topographically and climatically diverse Germany. Remote Sens. 2018, 10, 2029. [Google Scholar] [CrossRef]
  21. Sungmin, O.; Foelsche, U.; Kirchengast, G.; Fuchsberger, J.; Tan, J.; Petersen, W.A. Evaluation of GPM IMERG Early, Late, and Final rainfall estimates using WegenerNet gauge data in southeastern Austria. Hydrol. Earth Syst. Sci. 2017, 21, 6559–6572. [Google Scholar] [CrossRef]
  22. Aksu, H.; Taflan, G.Y.; Yaldiz, S.G.; Akgül, M.A. Evaluation of IMERG for GPM satellite-based precipitation products for extreme precipitation indices over Turkiye. Atmos. Res. 2023, 291, 106826. [Google Scholar] [CrossRef]
  23. Tarek, M.; Brissette, F.P.; Arsenault, R. Evaluation of the ERA5 reanalysis as a potential reference dataset for hydrological modelling over North America. Hydrol. Earth Syst. Sci. 2020, 24, 2527–2544. [Google Scholar] [CrossRef]
  24. Lavers, D.A.; Simmons, A.; Vamborg, F.; Rodwell, M.J. An evaluation of ERA5 precipitation for climate monitoring. Q. J. R. Meteorol. Soc. 2022, 148, 3152–3165. [Google Scholar] [CrossRef]
  25. Crossett, C.C.; Betts, A.K.; Dupigny-Giroux, L.A.L.; Bomblies, A. Evaluation of daily precipitation from the era5 global reanalysis against ghcn observations in the northeastern united states. Climate 2020, 8, 148. [Google Scholar] [CrossRef]
  26. Beck, H.E.; Pan, M.; Roy, T.; Weedon, G.P.; Pappenberger, F.; Van Dijk, A.I.J.M.; Huffman, G.J.; Adler, R.F.; Wood, E.F. Daily evaluation of 26 precipitation datasets using Stage-IV gauge-radar data for the CONUS. Hydrol. Earth Syst. Sci. 2019, 23, 207–224. [Google Scholar] [CrossRef]
  27. Jiang, Q.; Li, W.; Fan, Z.; He, X.; Sun, W.; Chen, S.; Wen, J.; Gao, J.; Wang, J. Evaluation of the ERA5 reanalysis precipitation dataset over Chinese Mainland. J. Hydrol. 2021, 595, 125660. [Google Scholar] [CrossRef]
  28. Gomis-Cebolla, J.; Rattayova, V.; Salazar-Galán, S.; Francés, F. Evaluation of ERA5 and ERA5-Land reanalysis precipitation datasets over Spain (1951–2020). Atmos. Res. 2023, 284, 106606. [Google Scholar] [CrossRef]
  29. Ahmed, J.S.; Buizza, R.; Dell’Acqua, M.; Demissie, T.; Pè, M.E. Evaluation of ERA5 and CHIRPS rainfall estimates against observations across Ethiopia. Meteorol. Atmos. Phys. 2024, 136, 17. [Google Scholar] [CrossRef]
  30. Malayeri, A.K.; Saghafian, B.; Raziei, T. Performance evaluation of ERA5 precipitation estimates across Iran. Arab. J. Geosci. 2021, 14, 2676. [Google Scholar] [CrossRef]
  31. Jiao, D.; Xu, N.; Yang, F.; Xu, K. Evaluation of spatial-temporal variation performance of ERA5 precipitation data in China. Sci. Rep. 2021, 11, 17956. [Google Scholar] [CrossRef]
  32. Xin, Y.; Yang, Y.; Chen, X.; Yue, X.; Liu, Y.; Yin, C. Evaluation of IMERG and ERA5 precipitation products over the Mongolian Plateau. Sci. Rep. 2022, 12, 21776. [Google Scholar] [CrossRef] [PubMed]
  33. Izadi, N.; Karakani, E.G.; Saadatabadi, A.R.; Shamsipour, A.; Fattahi, E.; Habibi, M. Evaluation of era5 precipitation accuracy based on various time scales over iran during 2000–2018. Water 2021, 13, 2538. [Google Scholar] [CrossRef]
  34. Cantoni, E.; Tramblay, Y.; Grimaldi, S.; Salamon, P.; Dakhlaoui, H.; Dezetter, A.; Thiemig, V. Hydrological performance of the ERA5 reanalysis for flood modeling in Tunisia with the LISFLOOD and GR4J models. J. Hydrol. Reg. Stud. 2022, 42, 101169. [Google Scholar] [CrossRef]
  35. Giannaros, C.; Dafis, S.; Stefanidis, S.; Giannaros, T.M.; Koletsis, I.; Oikonomou, C. Hydrometeorological analysis of a flash flood event in an ungauged Mediterranean watershed under an operational forecasting and monitoring context. Meteorol. Appl. 2022, 29, e2079. [Google Scholar] [CrossRef]
  36. Sheffield, J.; Wood, E.F.; Pan, M.; Beck, H.; Coccia, G.; Serrat-Capdevila, A.; Verbist, K. Satellite Remote Sensing for Water Resources Management: Potential for Supporting Sustainable Development in Data-Poor Regions. Water Resour. Res. 2018, 54, 9724–9758. [Google Scholar] [CrossRef]
  37. Rohan, P.K. The Climate of Ireland, 2nd ed.; Stationery Office: London, UK, 1986. [Google Scholar]
  38. Regan, S.; Goodhue, R.; Naughton, O.; Hynds, P. Geospatial drivers of the groundwater δ18O isoscape in a temperate maritime climate (Republic of Ireland). J. Hydrol. 2017, 554, 173–186. [Google Scholar] [CrossRef]
  39. Walsh, S. Climatological Note No.14: A Summary of Climate Averages for Ireland 1981–2010. Met Éireann 2012, 582, 16. [Google Scholar]
  40. Sweeney, J.C. Changing synoptic origins of Irish precipitation. Trans. Inst. Br. Geogr. 1985, 10, 467–480. [Google Scholar] [CrossRef]
  41. Huffman, G.J.; Bolvin, D.T.; Braithwaite, D.; Hsu, K.; Joyce, R.; Kidd, C.; Nelkin, E.J.; Sorooshian, S.; Tan, J. Algorithm Theoretical Basis Document (ATBD) Version 06. In NASA Global Precipitation Measurement (GPM) Integrated Multi-satellitE Retrievals for GPM (IMERG). 2019. Available online: https://gpm.nasa.gov/sites/default/files/document_files/IMERG_ATBD_V06_0.pdf (accessed on 5 January 2024).
  42. Tang, G.; Clark, M.P.; Papalexiou, S.M.; Ma, Z.; Hong, Y. Have satellite precipitation products improved over last two decades? A comprehensive comparison of GPM IMERG with nine satellite and reanalysis datasets. Remote Sens. Environ. 2020, 240, 111697. [Google Scholar] [CrossRef]
  43. Mahmoud, M.T.; Al-Zahrani, M.A.; Sharif, H.O. Assessment of global precipitation measurement satellite products over Saudi Arabia. J. Hydrol. 2018, 559, 1–12. [Google Scholar] [CrossRef]
  44. Beritelli, F.; Capizzi, G.; Lo Sciuto, G.; Napoli, C.; Scaglione, F. Rainfall Estimation Based on the Intensity of the Received Signal in a LTE/4G Mobile Terminal by Using a Probabilistic Neural Network. IEEE Access 2018, 6, 30865–30873. [Google Scholar] [CrossRef]
  45. Mukherjee, S.; Ballav, S.; Soni, S.; Kumar, K.; Kumar De, U. Investigation of dominant modes of monsoon ISO in the northwest and eastern Himalayan region. Theor. Appl. Climatol. 2016, 125, 489–498. [Google Scholar] [CrossRef]
  46. Sweeney, J.; Albanito, F.; Brereton, A.; Caffarra, A.; Charlton, R.; Donnelly, A.; Fealy, R.; Fitzgerald, J.; Holden, N. CLIMATE CHANGE—Refining the Impacts for Ireland; Environmental Protection Agency: Washington, DC, USA, 2007; ISBN 9781840952971. [Google Scholar]
  47. Chen, T.; Li, J.; Zhang, Y.; Chen, H.; Li, P.; Che, H. Evaluation of Hourly Precipitation Characteristics from a Global Reanalysis and Variable-Resolution Global Model over the Tibetan Plateau by Using a Satellite-Gauge Merged Rainfall Product. Remote Sens. 2023, 15, 1013. [Google Scholar] [CrossRef]
  48. Su, J.; Wang, X.; Ren, W.; Liu, W. Decomposing precipitation biases into frequency and intensity components: Comparative analysis of IMERG and ERA5-Land over the Tibetan Plateau. Atmos. Res. 2025, 326, 108320. [Google Scholar] [CrossRef]
  49. Bandhauer, M.; Isotta, F.; Lakatos, M.; Lussana, C.; Båserud, L.; Izsák, B.; Szentes, O.; Tveito, O.E.; Frei, C. Evaluation of daily precipitation analyses in E-OBS (v19.0e) and ERA5 by comparison to regional high-resolution datasets in European regions. Int. J. Climatol. 2022, 42, 727–747. [Google Scholar] [CrossRef]
  50. Zhang, W.; Di, Z.; Liu, J.; Zhang, S.; Liu, Z.; Wang, X.; Sun, H. Evaluation of Five Satellite-Based Precipitation Products for Extreme Rainfall Estimations over the Qinghai-Tibet Plateau. Remote Sens. 2023, 15, 5379. [Google Scholar] [CrossRef]
  51. Derin, Y.; Kirstetter, P.-E.; Brauer, N.; Gourley, J.J.; Wang, J. Evaluation of IMERG Satellite Precipitation over the Land–Coast–Ocean Continuum. Part II: Quantification. J. Hydrometeorol. 2022, 23, 1297–1314. [Google Scholar] [CrossRef]
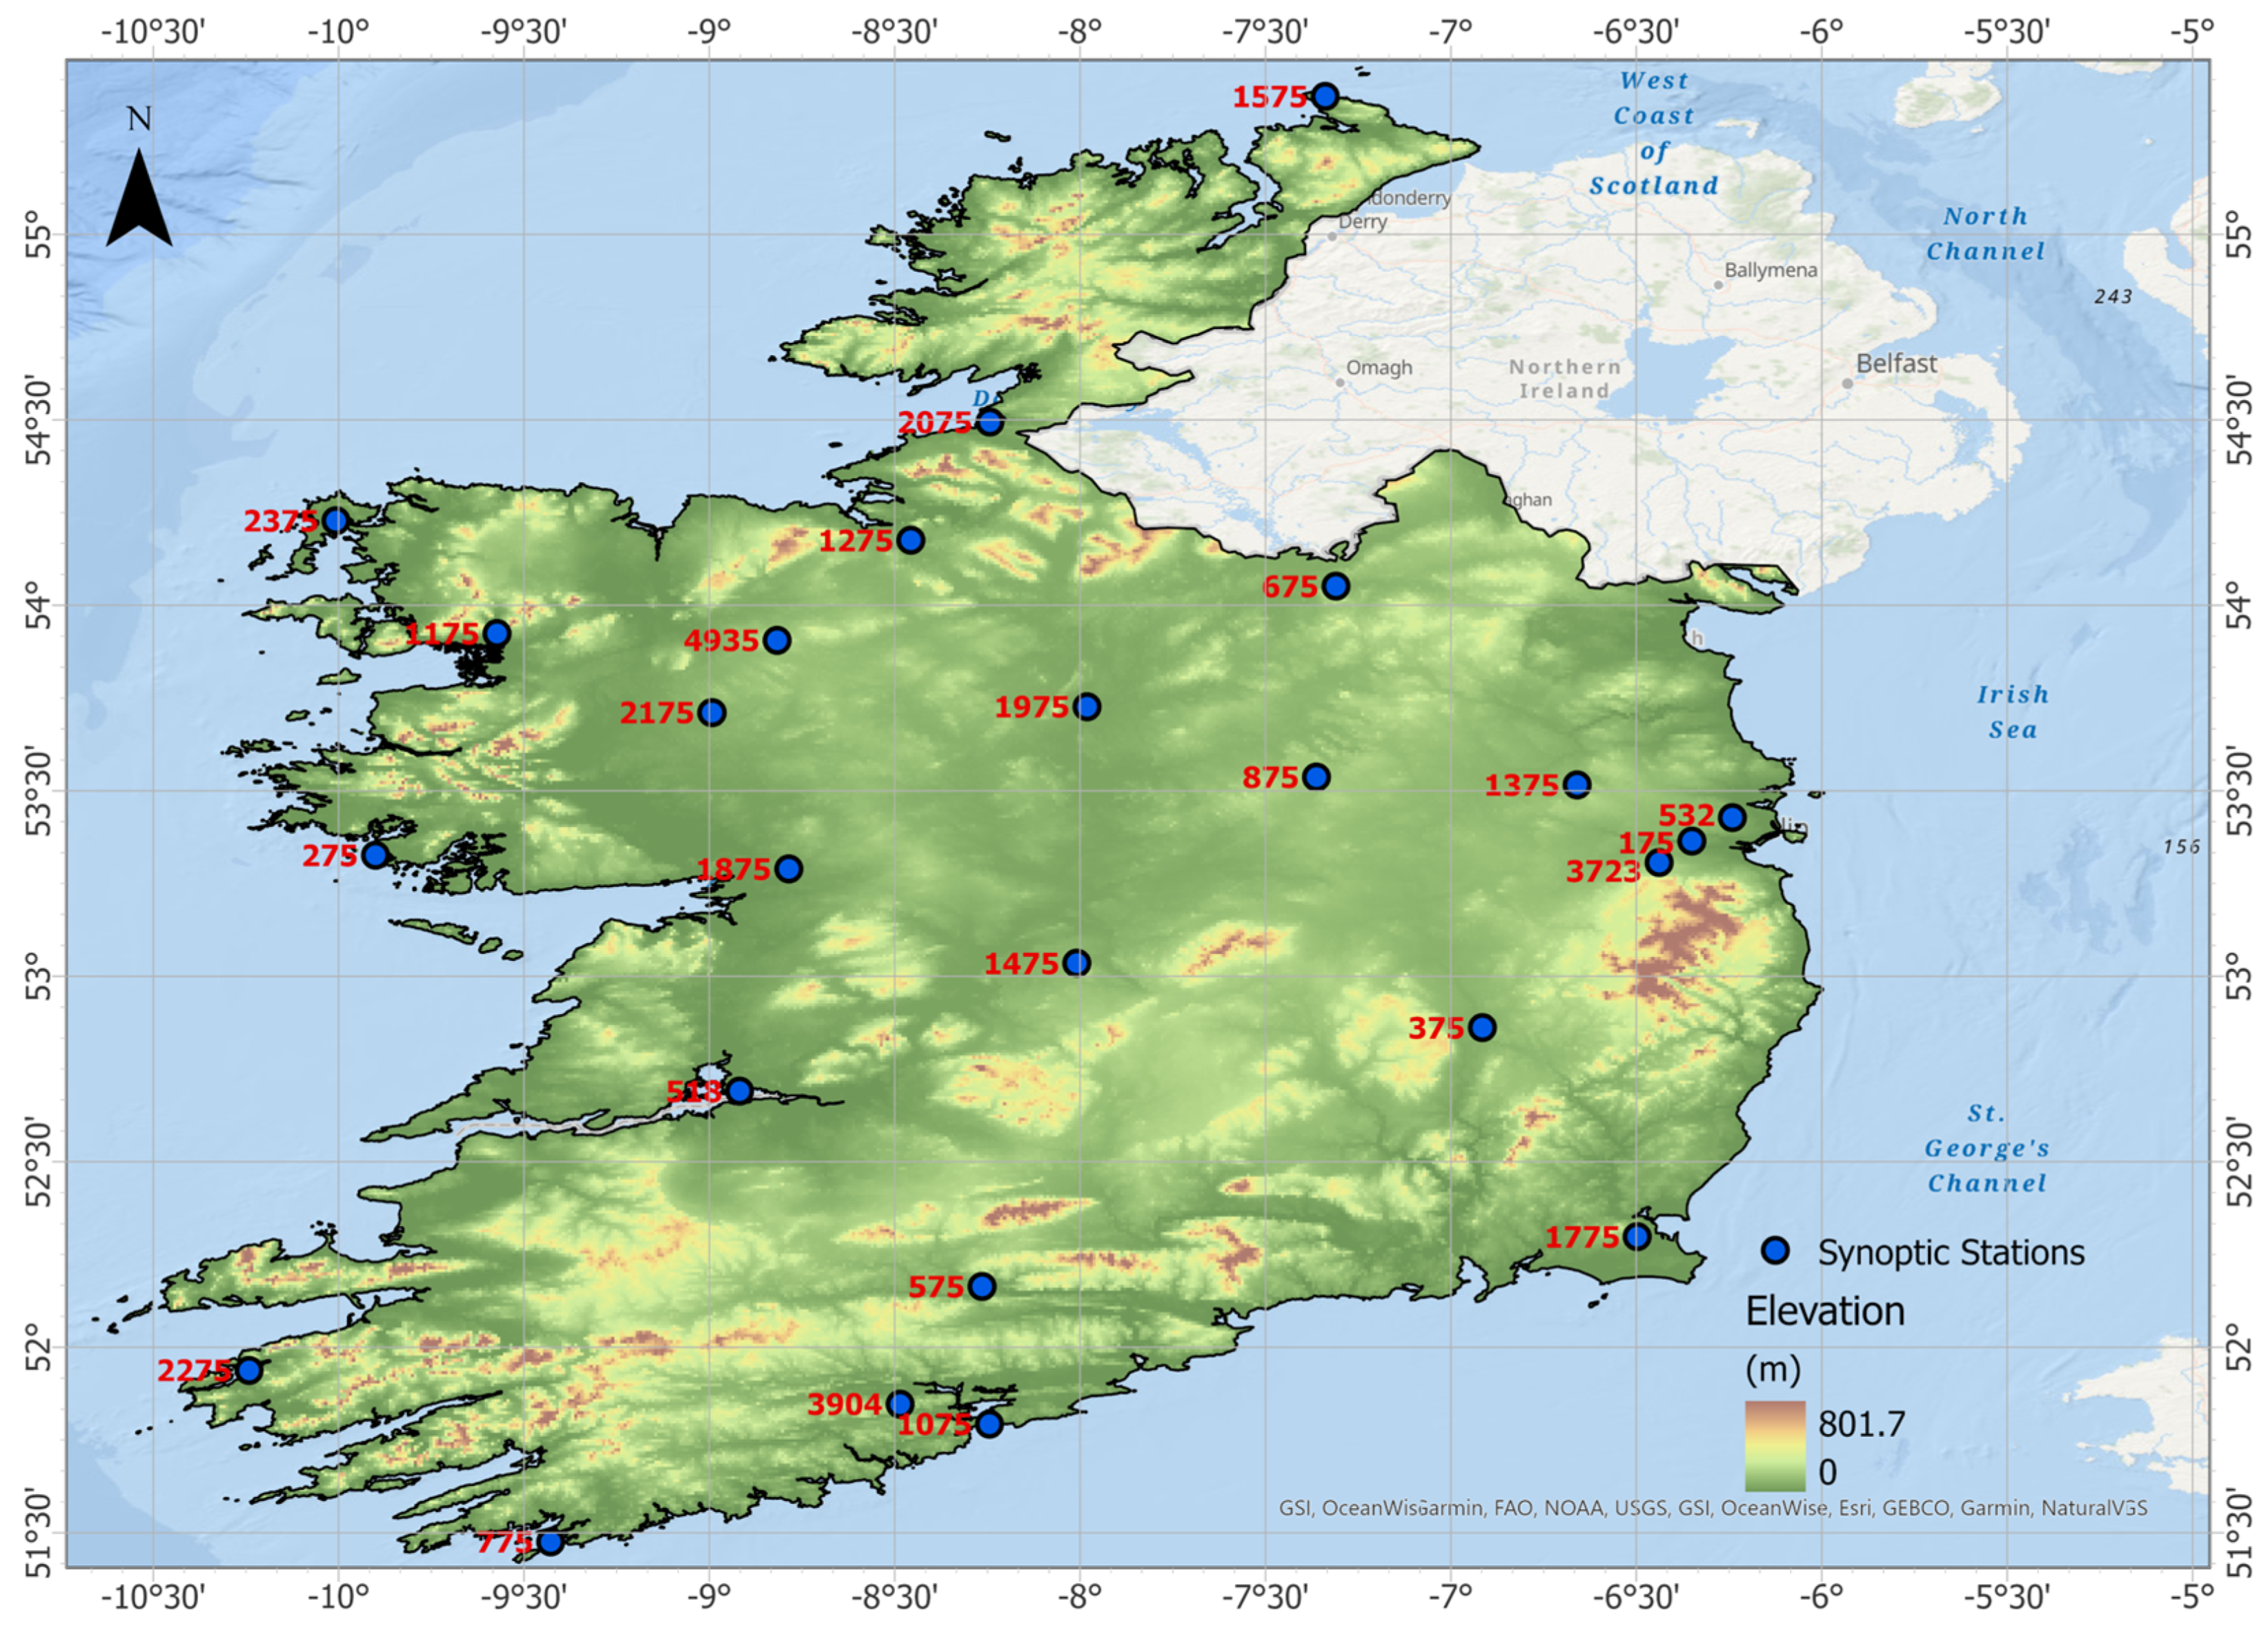
Figure 1. Topographical map demonstrating the geographic position of Ireland and location of the 25 synoptic stations.
Remotesensing 17 03154 g001
Figure 2. Spatial distribution of detection performance metrics for IMERG-Early, IMERG-Late, IMERG-Final, and ERA5 precipitation products (displayed from left to right) over 25 synoptic stations in Ireland for the period 2014–2021. The first two rows show POD at hourly and daily scales; the third and fourth rows show CSI; and the fifth and sixth rows display FAR. Colors follow a traffic-light scale, with green denoting optimal and red worst performance.
Remotesensing 17 03154 g002
Figure 3. Box-and-whisker plots of MAE, RMSE, and BIAS for IMERG-Early, IMERG-Late, IMERG-Final, and ERA5 precipitation products at (a) hourly (top row) and (b) daily (bottom row) temporal resolutions over the period 2014–2021. Each plot displays the median, interquartile range (25th–75th percentiles), and whiskers extending to 1.5 times the interquartile range. Red crosses represent statistical outliers beyond this range, based on data from 25 stations across Ireland.
Remotesensing 17 03154 g003
Figure 4. Scatter plots comparing observed precipitation with estimates from IMERG-Early, IMERG-Late, IMERG-Final, and ERA5 products at hourly (ae) and daily (fj) resolutions. Results shown are for five representative stations across Ireland: (a,f) Mace Head, (b,g) Oak Park, (c,h) Casement, and (d,i) Cork Airport, and (e,j) Knock Airport. Each subplot includes regression lines and correlation coefficients (CC) for each precipitation product.
Remotesensing 17 03154 g004
Figure 5. Seasonal boxplots of MAE, RMSE, BIAS, and CC for IMERG and ERA5 precipitation products across 25 stations in Ireland (2014–2021). Columns represent evaluation metrics.
Remotesensing 17 03154 g005
Figure 6. Spatial distribution of seasonal average daily precipitation (mm/day) across 25 synoptic stations in Ireland for the period 2014–2021. From left to right, each column displays Observations, IMERG-Early, IMERG-Late, IMERG-Final, and ERA5.
Remotesensing 17 03154 g006
Figure 7. Spatial distribution of detection accuracy metrics (POD and CSI) for Light Rain events across 25 synoptic stations in Ireland during 2014–2021. Each metric is presented in two rows, corresponding to hourly (top) and daily (bottom) resolutions. Columns represent precipitation products: IMERG-Early, IMERG-Late, IMERG-Final, and ERA5.
Remotesensing 17 03154 g007
Figure 8. Spatial distribution of detection accuracy metrics (POD and CSI) for Very heavy rain events across 25 synoptic stations in Ireland during 2014–2021. Each metric is presented in two rows, corresponding to hourly (top) and daily (bottom) resolutions. Columns represent precipitation products: IMERG-Early, IMERG-Late, IMERG-Final, and ERA5.
Remotesensing 17 03154 g008
Figure 9. Radar plots of MAE, RMSE, BIAS, and CC for IMERG-Early, IMERG-Late, IMERG-Final and ERA5 across four rainfall intensities classes (Light, Moderate, Heavy, Very Heavy) at hourly (top row) and daily (bottom row) temporal resolutions.
Remotesensing 17 03154 g009
Figure 10. Time series of daily rainfall at Mullingar Station (ID:875) from 29 July to 11 August 2021, comparing observed data with estimates from ERA5 and IMERG V06B products (Early, Late, Final). The peak rainfall event occurred on 5 August 2021 (Event Day).
Remotesensing 17 03154 g010
Figure 11. Time series of daily rainfall at Dublin Airport Station 532 from 27 July to 9 August 2014, comparing observed data with estimates from ERA5 and IMERG V06B products (Early, Late, Final). The peak rainfall event occurred on 2 August 2014 (Event Day).
Remotesensing 17 03154 g011
Figure 12. Time series of daily rainfall at Malin Head Station (ID:1575) from 15 to 29 August 2017, comparing observed data with estimates from ERA5 and IMERG V06B products (Early, Late, Final). The peak rainfall event on 22 August 2017 (Event Day).
Remotesensing 17 03154 g012
Table 1. Statistical analysis of the daily rainfall measured by the synoptic stations for the study period *.
Station IDStation NameLocation TypeHeightMeanMedianStd DevDaily MaxAnnual Maxima
175Phoenix ParkInland482.10.34.2745.232.74
275Mace headCoastal213.0814.9255.238.15
375Oak ParkInland622.360.34.4179.639.97
518Shannon AirportInland152.960.84.6948.433.68
532Dublin AirportInland712.120.24.4745.433.11
575Moore ParkInland462.970.65.246.333.00
675BallyhaiseInland782.860.74.7649.932.98
775Sherkin IslandCoastal213.140.75.4451.734.40
875MullingarInland1012.830.64.8857.138.41
1075Roches PointCoastal402.940.45.488249.14
1175NewportCoastal224.842.16.850.440.49
1275MarkreeInland343.551.45.1770.837.81
1375DunsanyInland832.390.44.4862.542.66
1475GurteenInland752.60.74.3772.938.53
1575Malin HeadCoastal203.251.34.9647.430.31
1775Johnstown CastleInland622.90.35.283.843.69
1875AthenryInland403.491.155.2644.133.99
1975Mt DillonInland393.020.84.7739.733.09
2075FinnerCoastal333.481.35.3245.831.66
2175ClaremorrisInland683.691.45.5342.632.66
2275Valentia ObservatoryCoastal244.611.97105.753.59
2375BelmulletCoastal93.611.65.0560.939.04
3723CasementInland912.150.34.2655.234.50
3904Cork AirportInland1553.540.76.2381.839.28
4935Knock AirportInland2013.951.65.655.741.16
* Note: The minimum rainfall adopted in this study is 0.1 mm/day, Height is in meters above mean sea level and All units of precipitation statistics are in mm/day.
Table 2. Rainfall intensity classification.
Rainfall ClassLight RainfallModerate RainfallHeavy RainfallVery Heavy Rainfall
1 h Rainfall (mm)0.01 < R ≤ 2.52.5 < R ≤ 55 < R ≤ 10>10
24 h Rainfall (mm)0.01< R ≤ 10.010 < R ≤ 35.535.5 < R ≤ 64.4>64.4
Table 3. Performance measures.
Performance MetricMeasureEquation
Contingency of Satellite EstimatesProbability of Detection (POD) R S G R S G + R G (1)
Critical Success Index (CSI) R S G R S G + R S + R G (2)
False Alarm Ratio (FAR) R S R S + R S G (3)
Bias and error of Satellite EstimatesMean Absolute Error (MAE) 1 n i = 1 n S i G i (4)
Root Mean Squared Error (RMSE) 1 n i = 1 n ( S i G i ) 2 (5)
Relative Bias (BIAS) 1 n i = 1 n ( S i G i ) i = 1 n G i × 100 % (6)
Consistency between the Rain-Gauge and Satellite EstimatesCorrelation Coefficient (CC) 1 n i = 1 n ( S i S ¯ ) ( G i G ¯ ) σ s σ g (7)
n: number of measurements; Si: satellite estimates; S ¯ : average of satellite estimates; G i : gauge measurements; G ¯ : average of gauge measurements; σ s : standard deviation for satellite data; σ g : standard deviation for gauge data; R S G : the number of data points of the satellite and gauge when both detected precipitation; R S : number of data points where the SPPs detected precipitation and gauges did not; and R G : number of data points when the rain gauges observed precipitation while the satellite did not.
Table 4. Seasonal averages (±standard deviation) of POD, CSI, and FAR for ERA5 and IMERG precipitation products (Early, Late, and Final) across 25 synoptic stations in Ireland over the period 2014–2021. The metrics are based on daily precipitation detection. Bold values indicate the best-performing product per season for each metric.
SeasonProductPODCSIFAR
Mean ± StdMean ± StdMean ± Std
SpringIMERG-Early0.86 ± 0.040.67 ± 0.030.24 ± 0.04
IMERG-Late0.89 ± 0.040.67 ± 0.040.27 ± 0.05
IMERG-Final0.89 ± 0.040.68 ± 0.030.26 ± 0.05
ERA51.00 ± 0.000.67 ± 0.020.37 ± 0.00
SummerIMERG-Early0.85 ± 0.060.67 ± 0.060.24 ± 0.07
IMERG-Late0.89 ± 0.050.66 ± 0.050.27 ± 0.07
IMERG-Final0.89 ± 0.060.68 ± 0.050.25 ± 0.08
ERA51.00 ± 0.000.63 ± 0.050.34 ± 0.07
AutumnIMERG-Early0.85 ± 0.060.72 ± 0.050.18 ± 0.05
IMERG-Late0.85 ± 0.060.71 ± 0.050.19 ± 0.06
IMERG-Final0.88 ± 0.050.73 ± 0.050.18 ± 0.05
ERA51.00 ± 0.000.73 ± 0.070.29 ± 0.04
WinterIMERG-Early0.81 ± 0.060.69 ± 0.080.19 ± 0.06
IMERG-Late0.82 ± 0.060.70 ± 0.080.18 ± 0.06
IMERG-Final0.83 ± 0.060.70 ± 0.090.19 ± 0.07
ERA51.00 ± 0.000.88 ± 0.000.13 ± 0.05
Disclaimer/Publisher’s Note: The statements, opinions and data contained in all publications are solely those of the individual author(s) and contributor(s) and not of MDPI and/or the editor(s). MDPI and/or the editor(s) disclaim responsibility for any injury to people or property resulting from any ideas, methods, instructions or products referred to in the content.