Article

An Integrated Method for Dynamic Height Error Correction in GNSS-IR Sea Level Retrievals

1
College of Geological Engineering and Geomatics, Chang’an University, Xi’an 710054, China
2
State Key Laboratory of Loess Science, Chang’an University, Xi’an 710054, China
3
Key Laboratory of Ecological Geology and Disaster Prevention, Ministry of Natural Resources, Xi’an 710054, China
4
Key Laboratory of Western China’s Mineral Resources and Geological Engineering, Ministry of Education, Xi’an 710054, China
*
Author to whom correspondence should be addressed.
Remote Sens. 2025, 17(17), 3076; https://doi.org/10.3390/rs17173076
Submission received: 7 July 2025 / Revised: 1 September 2025 / Accepted: 1 September 2025 / Published: 4 September 2025

Abstract

Sea level is an important variable for studying water cycle and coastal hazards under global warming. Global Navigation Satellite System Interferometric Reflectometry (GNSS-IR) has emerged as a relatively new technique for monitoring sea level variations, leveraging signals from GNSS constellations. However, dynamic height errors, primarily caused by non-stationary sea surfaces, compromise the precision of GNSS-IR sea level retrievals and necessitate robust correction. In this study, we propose a new method to correct the dynamic height error by integrating the commonly used tidal analysis method and the cubic spline fitting method. The proposed method is applied to the GNSS-IR sea level retrievals from multiple systems and multiple frequency bands at two coastal GNSS stations, MAYG and HKQT. At MAYG, the results show that our method significantly reduces the Root Mean Square Error (RMSE) of the GNSS-IR sea level retrievals by 42.1% (11.4 cm) to 15.7 cm, performing better than the single tidal analysis method (16.5 cm) and the cubic spline fitting method (21.4 cm). At HKQT, our method improves the accuracy by 21.5% (3.1 cm) to 10.3 cm, which is still better than that of the tidal analysis method (11.3 cm) and the cubic spline fitting method (12.4 cm). Compared to the tidal analysis method and the cubic spline fitting method, our method maintains high retrieval retention while enhancing precision. The effectiveness of our method is further validated in the two storm surge events caused by Typhoon Hato and Typhoon Mangkhut in Hong Kong.

1. Introduction

Sea level serves as a critical indicator for preventing marine disasters, addressing climate change, and safeguarding lives and properties in coastal areas. Tide gauge is the traditional method for sea level monitoring with high temporal resolution (normally a few minutes), and satellite altimetry is the remote sensing technique for sea level monitoring over large scales [1,2,3]. In the past decade, advances in the Global Navigation Satellite System (GNSS) have driven the emergence of GNSS Interferometric Reflectometry (GNSS-IR) as an effective supplementary method for sea level monitoring [4,5]. GNSS-IR uses the interference of the direct GNSS signal and the reflected GNSS signal, which is quantified as the Signal to Noise Ratio (SNR), to infer the properties of the reflector surface, such as snow depth [6,7,8], soil moisture [9,10,11], frozen ground movements [12,13,14], and sea level changes [4,5,15].
In 2013, Larson et al. [4] first applied GNSS-IR to the SNR data from a single geodetic GPS receiver to retrieve the sea level measurements, demonstrating the feasibility of GNSS-IR for sea level monitoring. In the same year, Larson et al. [5] revealed that GNSS-IR sea level retrievals are affected by a significant dynamic height error induced by sea level variability and proposed a derivative-based correction method. This method, however, suffered from noise and instability due to outliers in the initial retrievals. To overcome these limitations, subsequent studies introduced various correction methods, including the tide analysis method [16,17], the least squares method [18,19,20], and the curve fitting method [21,22]. Given the dominance of diurnal and semi-diurnal tides in sea level changes under normal conditions, Löfgren et al. [16] and Larson et al. [23] used tidal analysis to estimate the sea level change rate and correct the dynamic height error. The least squares method was first applied in a sliding-window framework [18], later extended through integration with wavelet analysis to improve arc-scale corrections [24]. Wang et al. [25] further considered tidal characteristics in the least squares method, and their results showed that the precision was improved by 20% to 70% compared to traditional methods. Curve fitting approaches, such as spline modeling, have also been shown to effectively reduce dynamic height errors [21].
In our previous study [26], we found that the tidal analysis method, the cubic spline fitting method, and the least squares method can all effectively correct dynamic height errors for the sea surface under normal conditions. However, the tidal analysis method is ineffective for correcting dynamic height errors during storm surges, whereas cubic spline fitting and least squares methods rely heavily on GNSS-IR sea level retrieval density. Thus, in this paper, we propose to combine cubic spline fitting and tidal analysis to correct the dynamic height error in GNSS-IR sea level retrievals. The proposed method is applied to the GNSS-IR sea level measurements retrieved from the multi-system and multi-frequency SNR data at two coastal GNSS stations. The corrected sea level retrievals are validated with the in situ measurements from nearby tide gauge stations and compared to the results from the tidal analysis method and the cubic spline fitting method. Moreover, the performances of the proposed method in two storm surge events are discussed.

2. Data and Methods

2.1. GNSS Sites and Data Description

Two coastal GNSS stations with an open view of the sea surface were used in this study. Both stations record observations from multiple GNSS (GPS, GLONASS, Galileo, and BDS). The locations are shown in Figure 1, and the signal information is presented in Table 1.
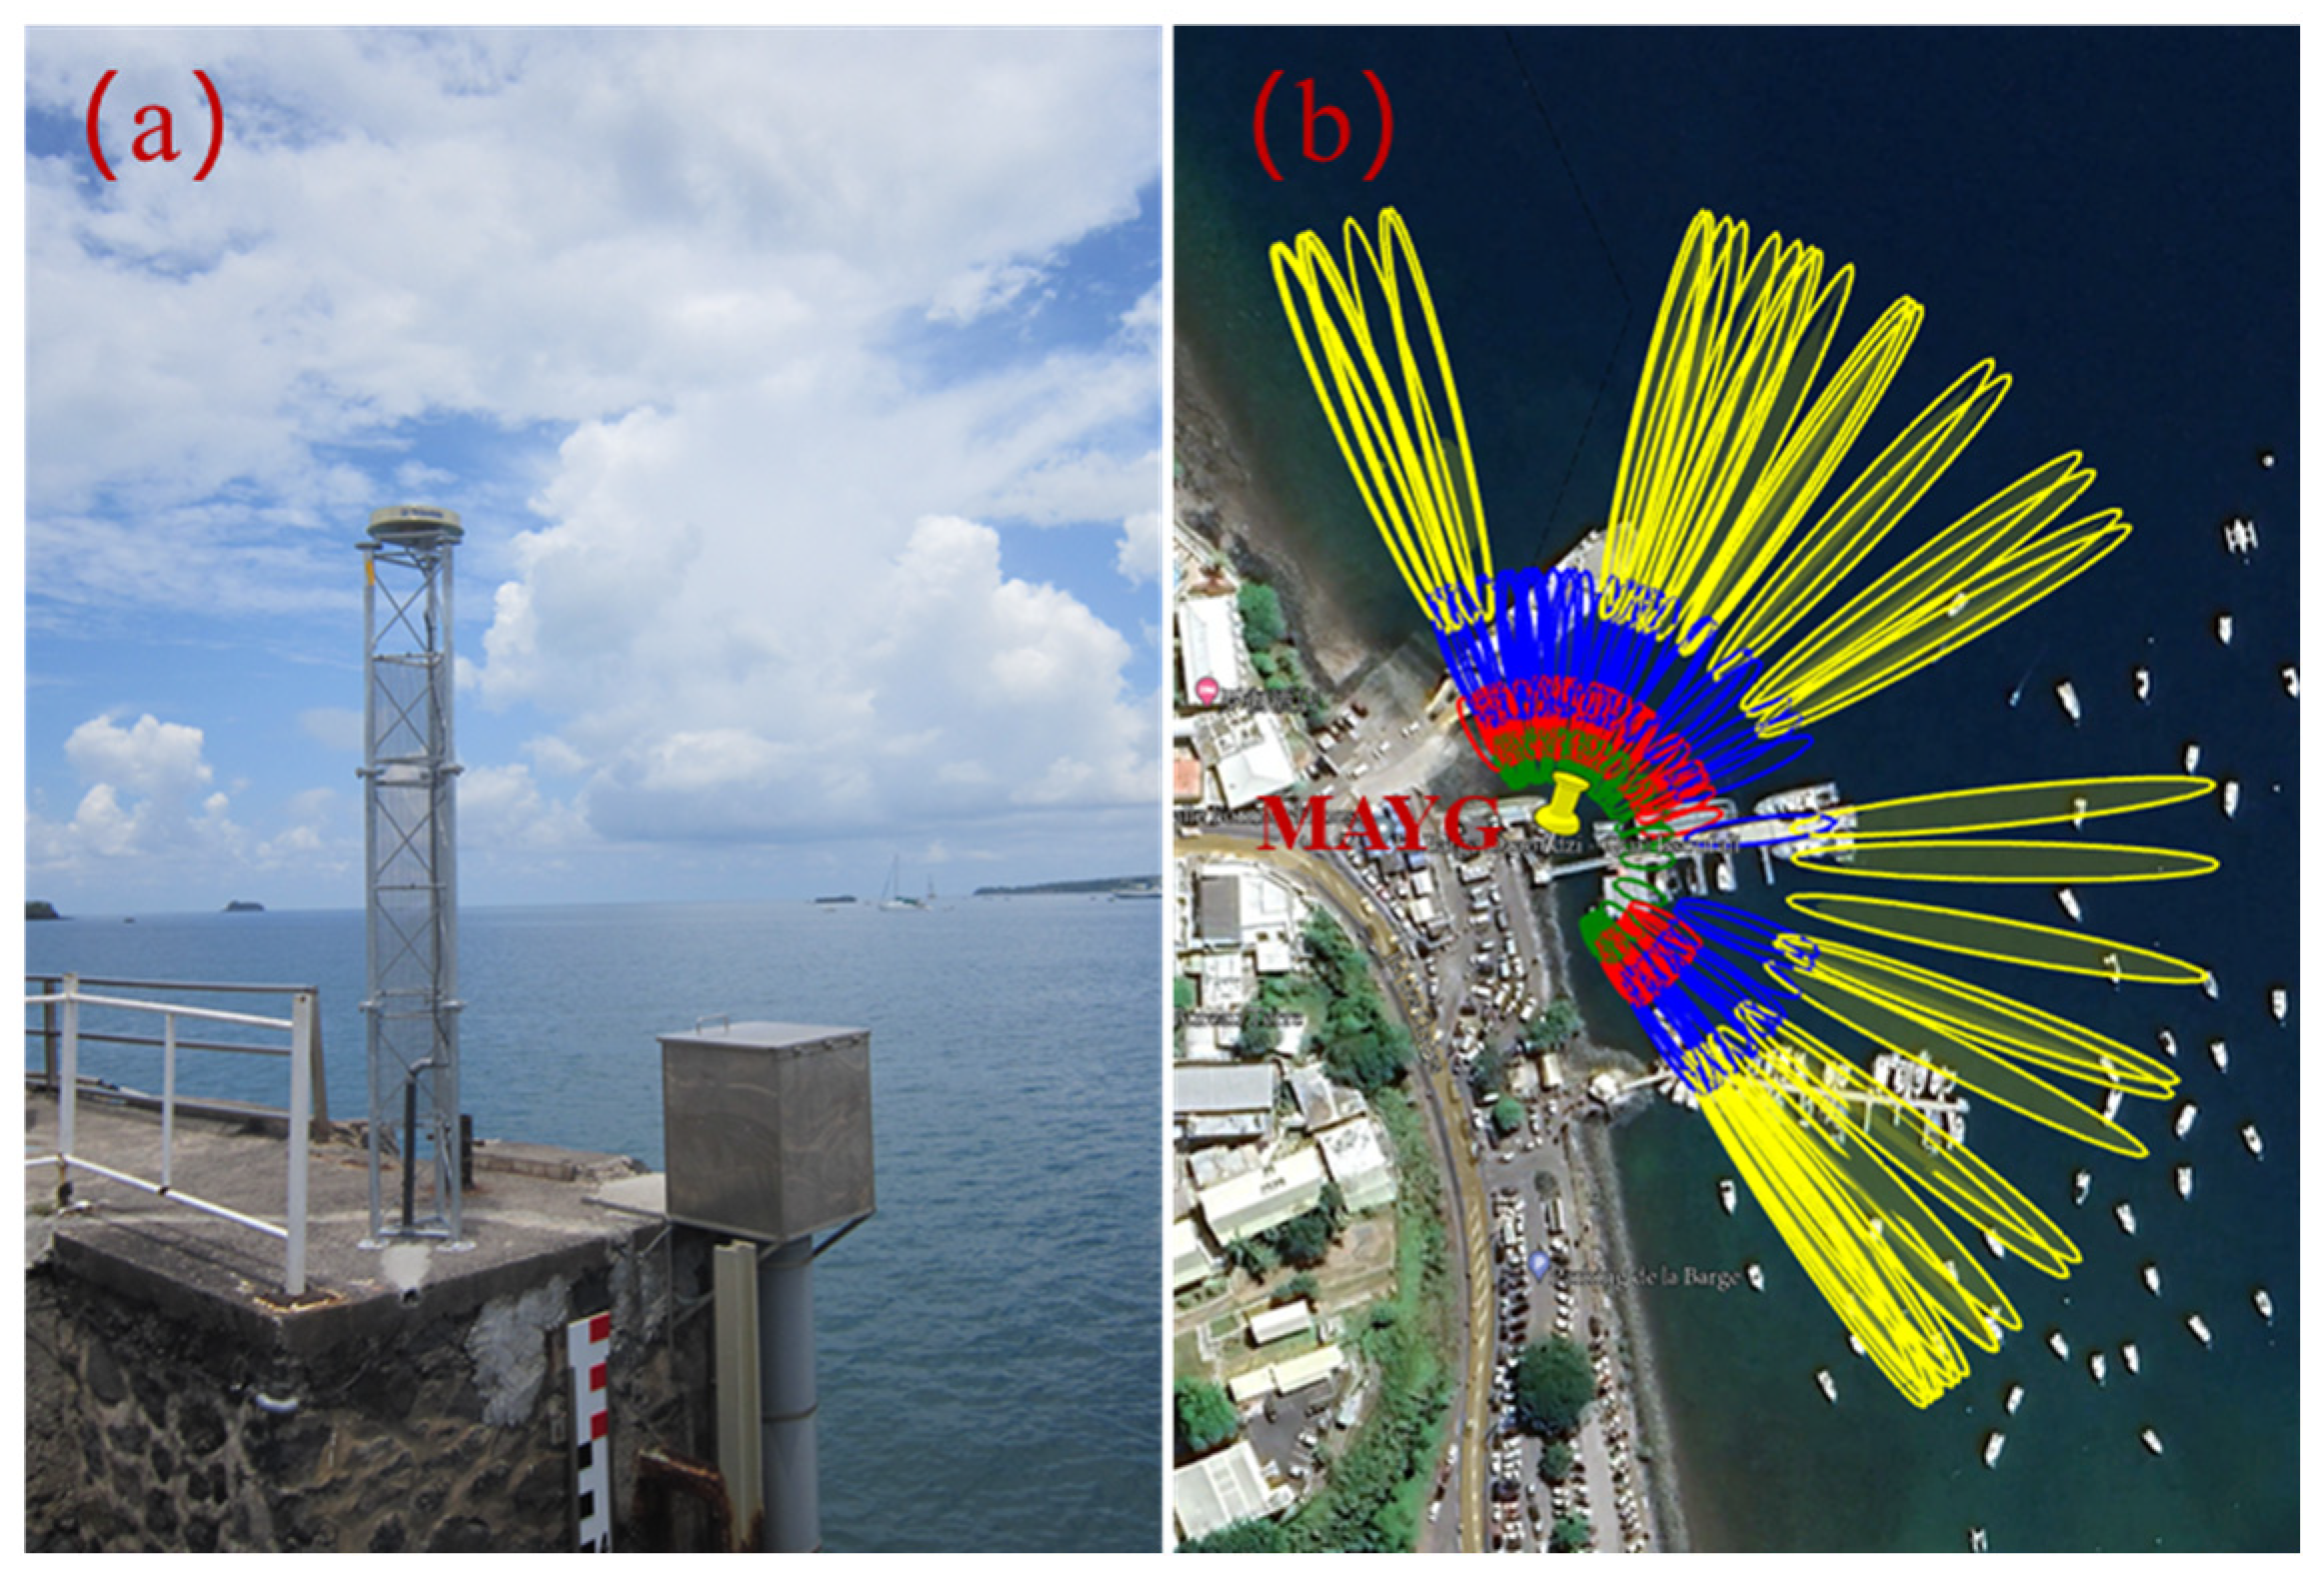
The MAYG station (12.782°S, 45.258°E) is located on Mayotte Island in the northwestern Indian Ocean. The station is operated by the French National Institute of Geographic and Forest Information (IGN) and the National Center for Space Studies (CNES). The receiver and the antenna equipped at MAYG are Trimble NETR9 and TRM59800.00, respectively. It receives multiple GNSS observations at a temporal interval of 30 s. The Dzaoudzi tide gauge station is approximately 2 m away from the MAYG station, which records sea levels every minute. To avoid the obstructions around the MAYG station, we set the azimuth range to [−30°, 180°] and the elevation angle range to [5°, 20°] for the GNSS-IR experiment. Figure 2 shows the view of the MAYG station and the first Fresnel reflection zone (i.e., the sensing zone) for GPS L1. In this study, the three-year (2018–2020) long SNR data collected by the MAYG station are selected for GNSS-IR sea level monitoring.
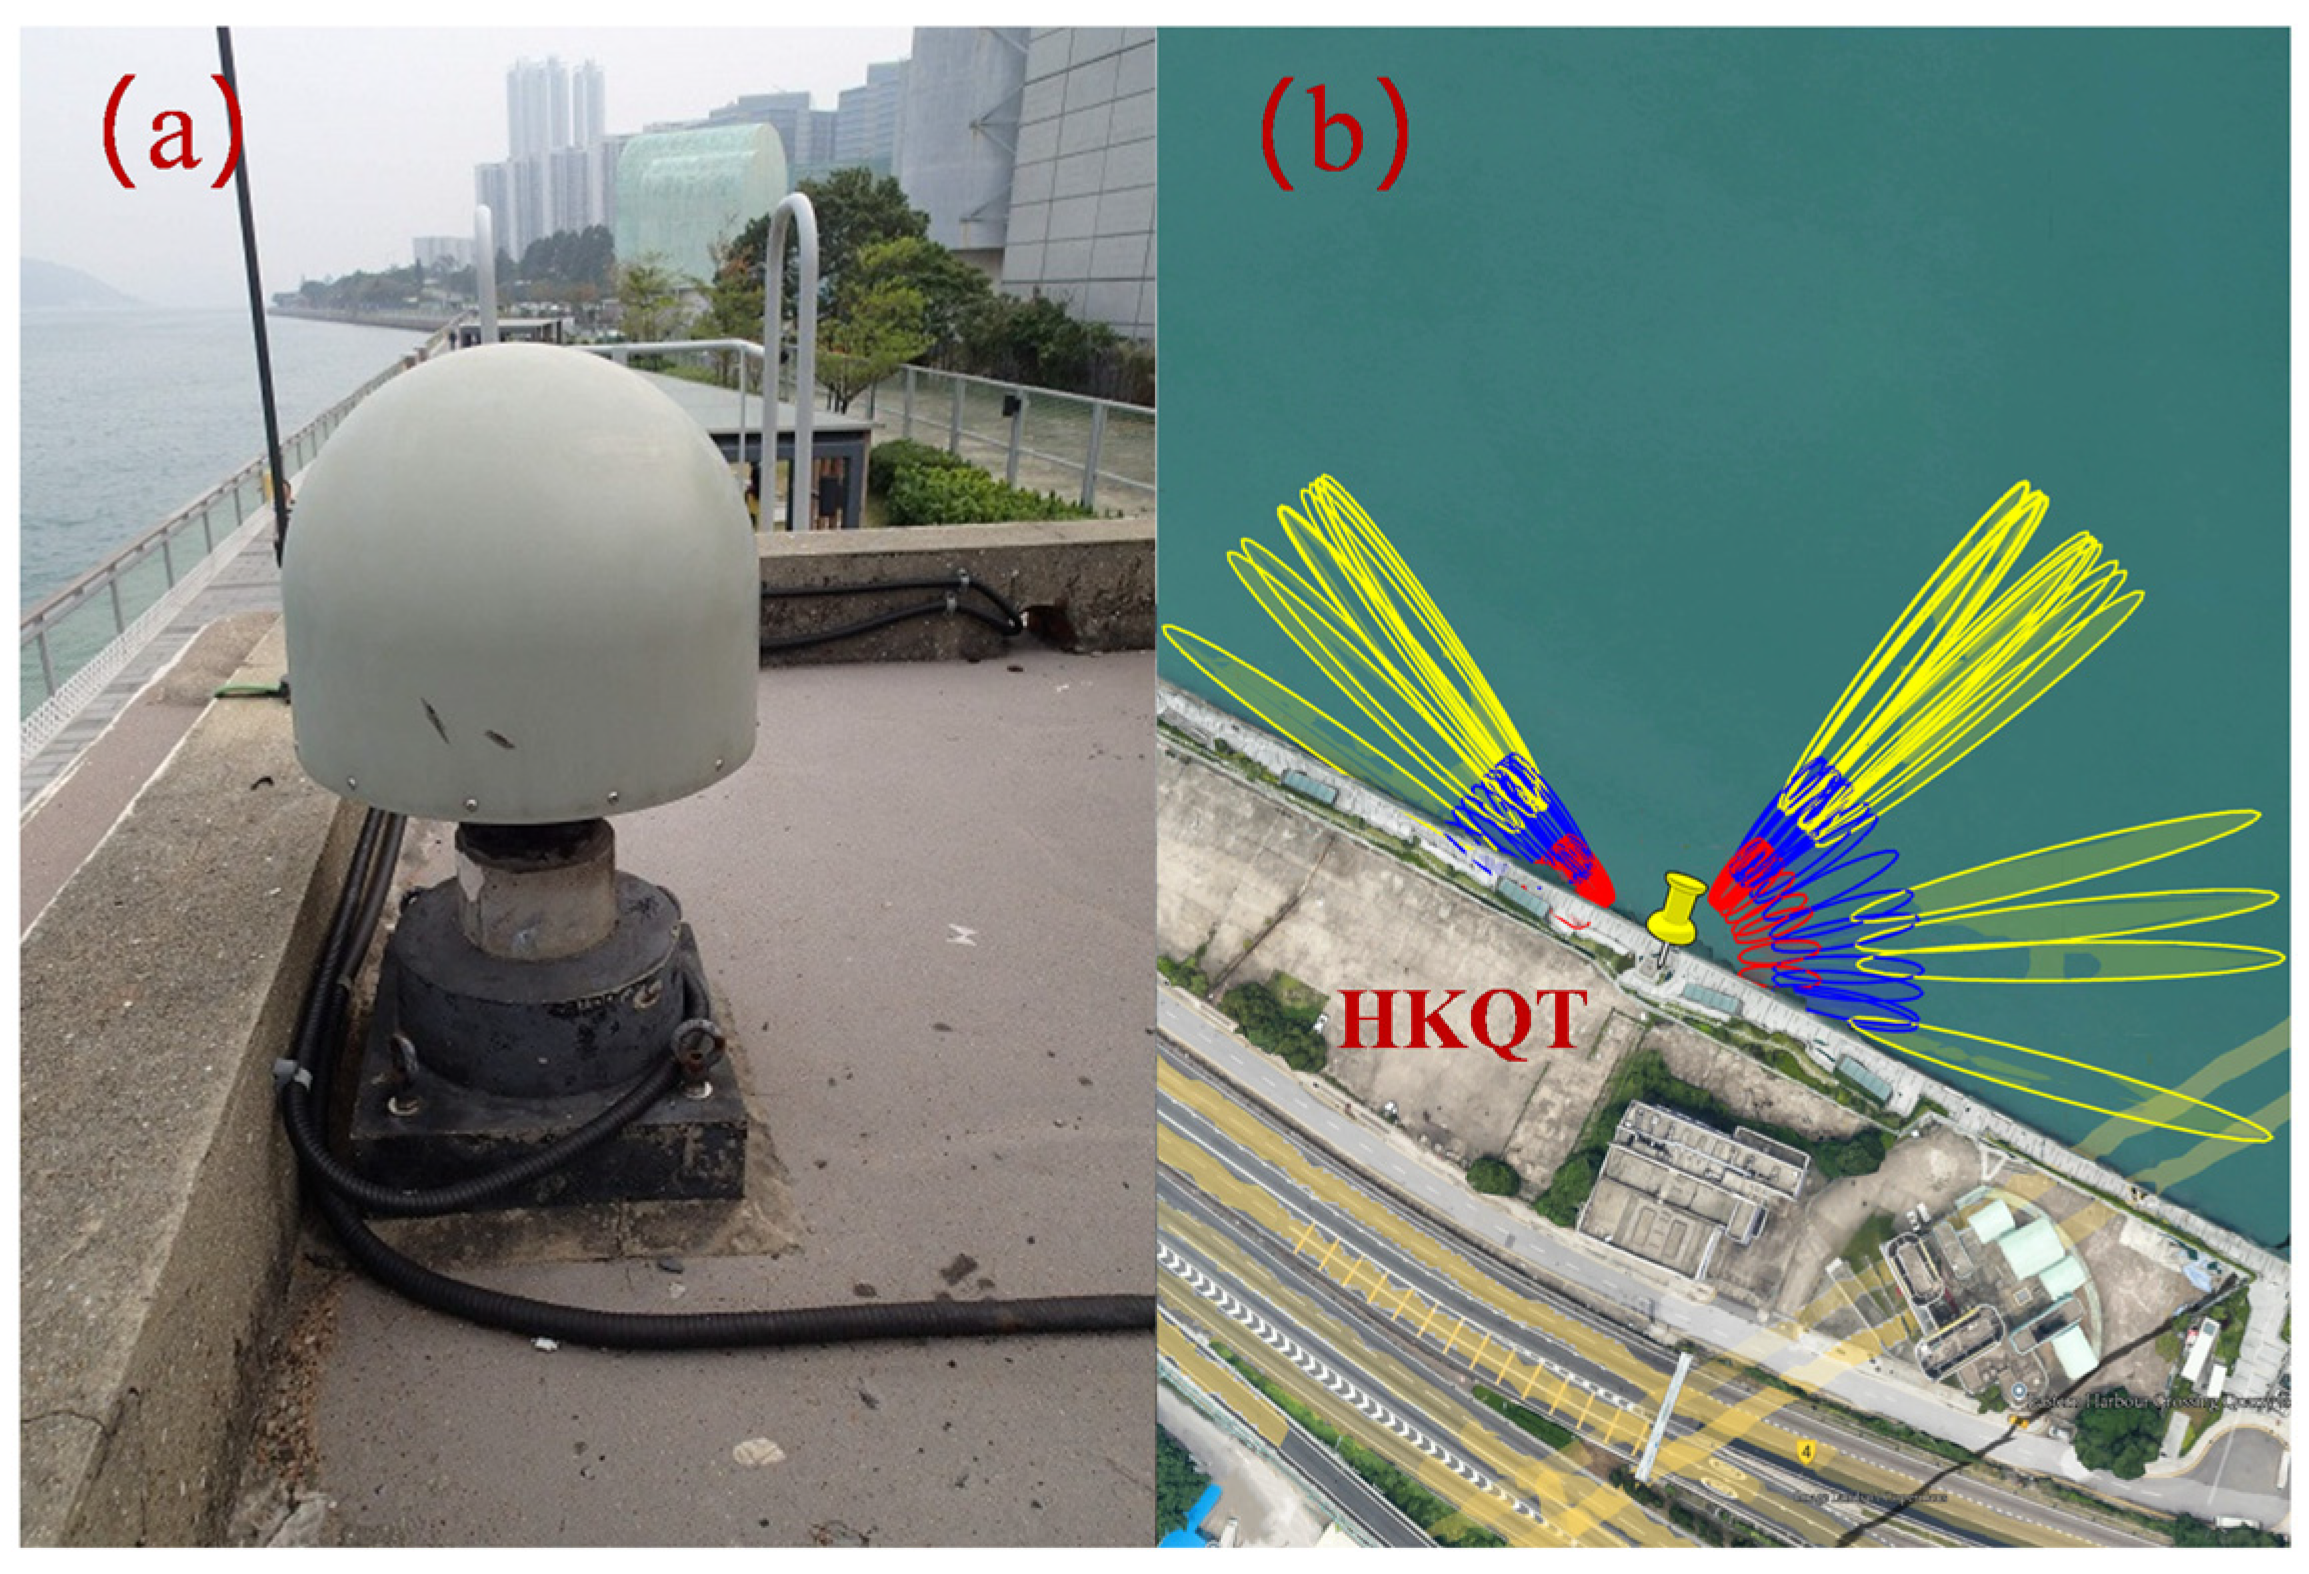
The HKQT station (22.291°N, 114.213°E) is located in Hong Kong, China, and belongs to the Hong Kong Satellite Positioning Reference Station Network (SatRef). It is equipped with a receiver of Trimble NETR5 and an antenna of TRM59800.00. This station collects observations from multiple GNSS with a temporal interval of 30 s. It should be noted that the HKQT station does not receive the BDS signals at the B3 frequency band. Figure 3 shows the view of the GNSS station HKQT and the first Fresnel reflection zone at GPS L1 frequency. We used an elevation angle musk of [5°, 15°] and an azimuth angle musk of [−60°, 105°] to ensure an open view of the sea’s surface. The Quarry Bay tide gauge station is established approximately 2 m from the HKQT station, recording sea levels at a temporal resolution of 1 min. The sea area experienced Typhoon Hato in 2017 and Typhoon Mangkhut in 2018. The SNR data recorded by the HKQT spanning from 2017 to 2018 are selected for GNSS-IR study. Moreover, this study will discuss the applicability of our method during these two storm events.

2.2. GNSS-IR

For typical positioning and navigation, the receivers receive the GNSS signals directly from the GNSS satellites. However, some signals are reflected by the Earth’s surface and also recorded by the GNSS receivers. The reflected signals would interfere with direct GNSS signals and are quantified as the Signal to Noise Ratio (SNR) in the GNSS observations. The direct signal contributes to the trend of the SNR, while the reflected signal contributes to the oscillation with respect to the elevation angle. With removal of the direct components through a low-order polynomial, the dedrended SNR can be expressed as [27]
S N R = A cos 4 π h r λ sin e + φ
where A is the amplitude in volts/volts; e is the elevation angle in degrees; φ is the phase shift in degrees; λ is the wavelength of the GNSS signal in meters; and h r is the reflector height denoting the vertical distance from the antenna phase center to the reflector’s surface. Applying the Lomb–Scargle periodgram (LSP) to the SNR [28], we could obtain the dominant frequency f and simply convert it to the reflector height by
h r = λ f 2
The reflected GNSS signals are subject to tropospheric effects along their propagation path, which result in bending of the elevation angle. Following previous studies, the Bennet model was used to estimate this bending and to correct the tropospheric effect on SNR [29,30]. In addition, in the LSP analysis, retrievals with a peak-to-noise ratio greater than 3 were retained to ensure peak reliability, where the ratio is defined as spectral peak power divided by mean spectral noise power.
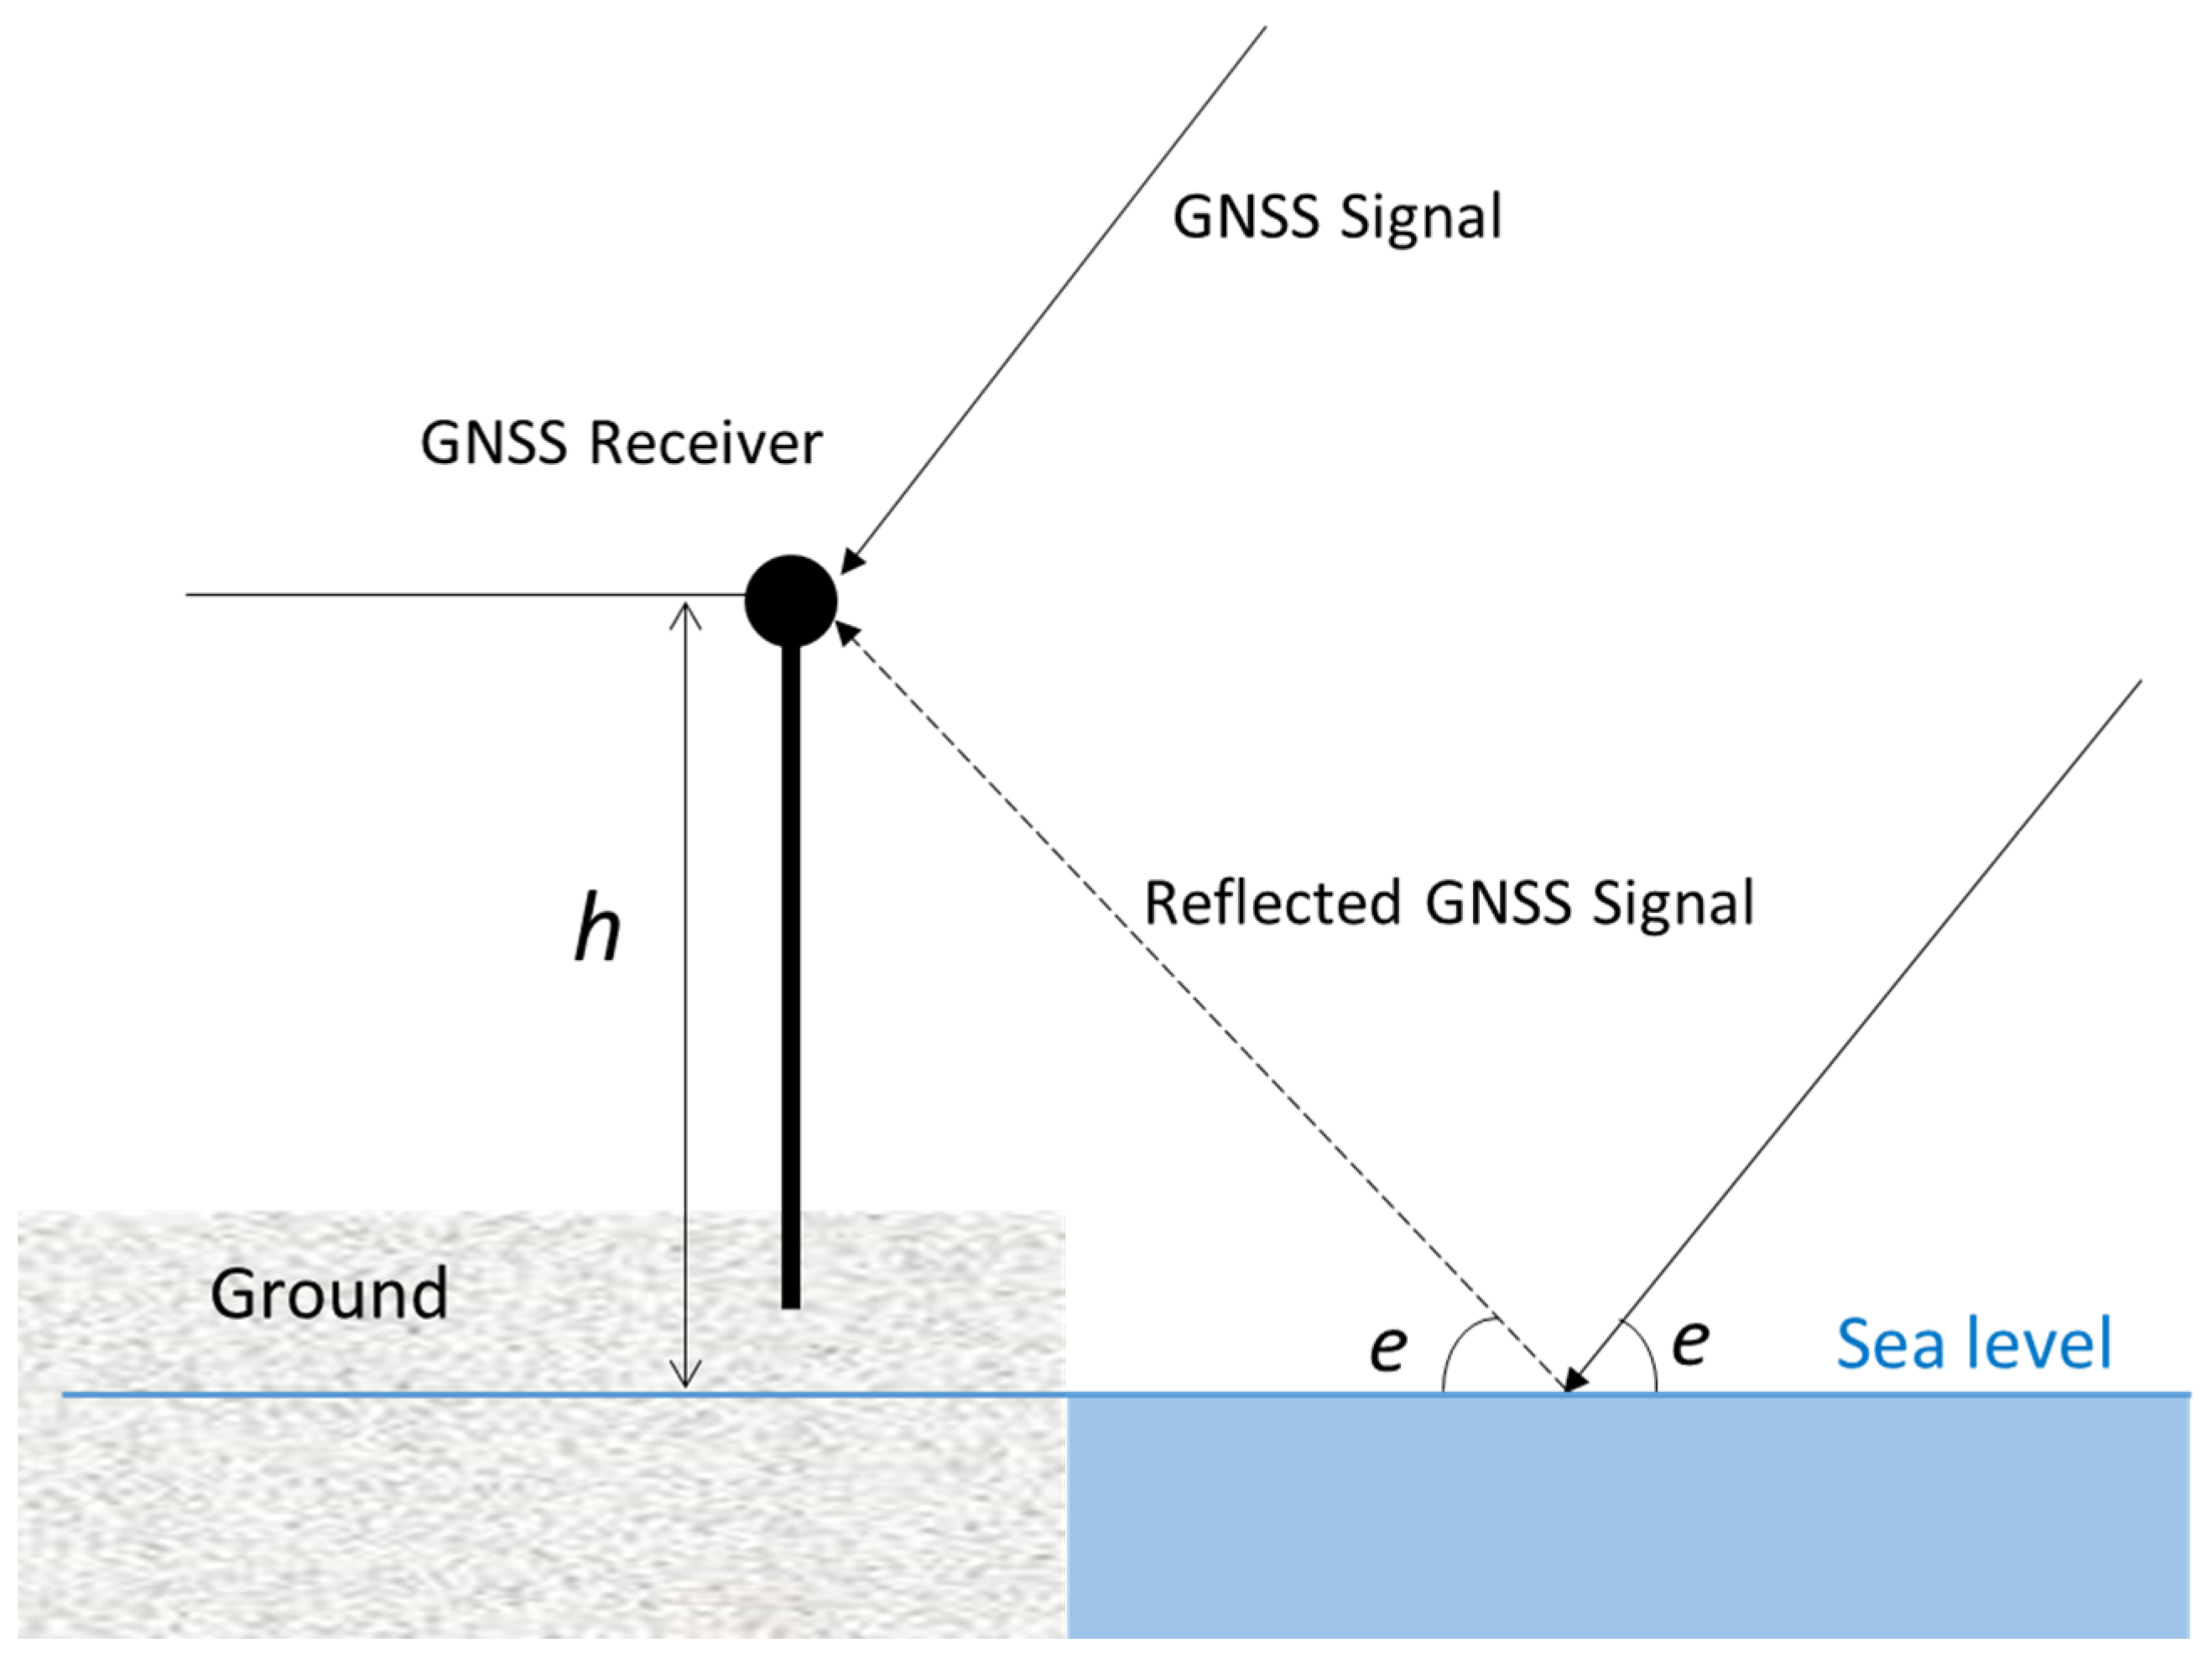
As for sea level monitoring, the reflector is the sea surface (Figure 4). The high tide will result in short reflector height and vice versa; thus, the sea level variations could be retrieved with the changes in reflector height. However, the retrieval of the reflector height with LSP is based on the assumption that the reflector surface is static during the satellite pass (normally 20 to 40 min). This assumption becomes invalid for non-stationary sea surfaces, inducing dynamic height errors in GNSS-IR sea level retrievals. Considering the dynamic sea surface, the retrieved reflector height (Equation (2)) can be expressed as [5]
h r = tan e e ˙ h ˙ + h
where h is the actual reflector height; h ˙ is the rate of the sea surface; and e ˙ is the rate of the elevation angle. For precise sea level monitoring with GNSS-IR, the correction for dynamic height error is essential. Tidal analysis and cubic spline fitting are the two commonly used methods for dynamic height error correction in GNSS-IR sea level retrievals, which are described in the following section.

2.3. Tidal Analysis and Cubic Spline Fitting Methods for Dynamic Height Error Correction

In normal conditions, sea level changes are dominated by periodic tide components. Tidal analysis is the method used to characterize the sea level with the combination of individual tidal constituents with fixed periods, which could be used to further predict the sea level changes. In tidal analysis, the sea level is expressed as [31]
h ( t ) = h 0 + n = 1 n A n cos 2 π T n t + φ n
where h is the sea level in meters; h 0 is the mean sea level in meters; n is the number of tidal constituents; A n is the amplitude of tidal constituents in meters; T n is the period of tidal constituents in hours; and φ n is the phase of the tidal constituents in degrees. Among tidal constituents, diurnal and semi-diurnal tides are the most prominent and contribute the most to sea level variations. Therefore, we included four diurnal tides (i.e., O1, K1, P1, and Q1) and four semi-diurnal tides (i.e., M2, S2, N2, and K2) in our tidal analysis, as in our previous study [26]. By fitting the Equation (4) to the GNSS-IR sea level retrievals, we could obtain the tidal coefficients. With the fitted tidal coefficients, we could further calculate the height rate and then correct the dynamic height error through Equation (3). The corrected GNSS-IR sea level retrievals are compared to the sea levels constructed through tidal analysis, and the outliers are defined as the difference exceeding three times standard deviation. Then, the outliers are removed, and the tidal analysis fitting and correction steps above are iteratively repeated until no outliers remain.
Assuming that the temporal variations of sea surface height are smooth, one can approximate the sea level change with an analytic function, such as the cubic spline. In this study, we set a three-hour window for fitting the cubic spline function to the GNSS-IR sea level retrievals. The three-hour window length used in our previous study has been demonstrated to be effective in cubic spline fitting for correcting dynamic height errors [26]. Then, the sea level dynamic variation rate could be obtained by taking the time derivative of the fitted spline. Normally, the GNSS-IR sea level retrievals are compared to the fitted spline to calculate the standard deviation. The outliers exceeding three standard deviations from the fitted spline are identified and removed.

2.4. An Integrated Method for Dynamic Height Error Correction

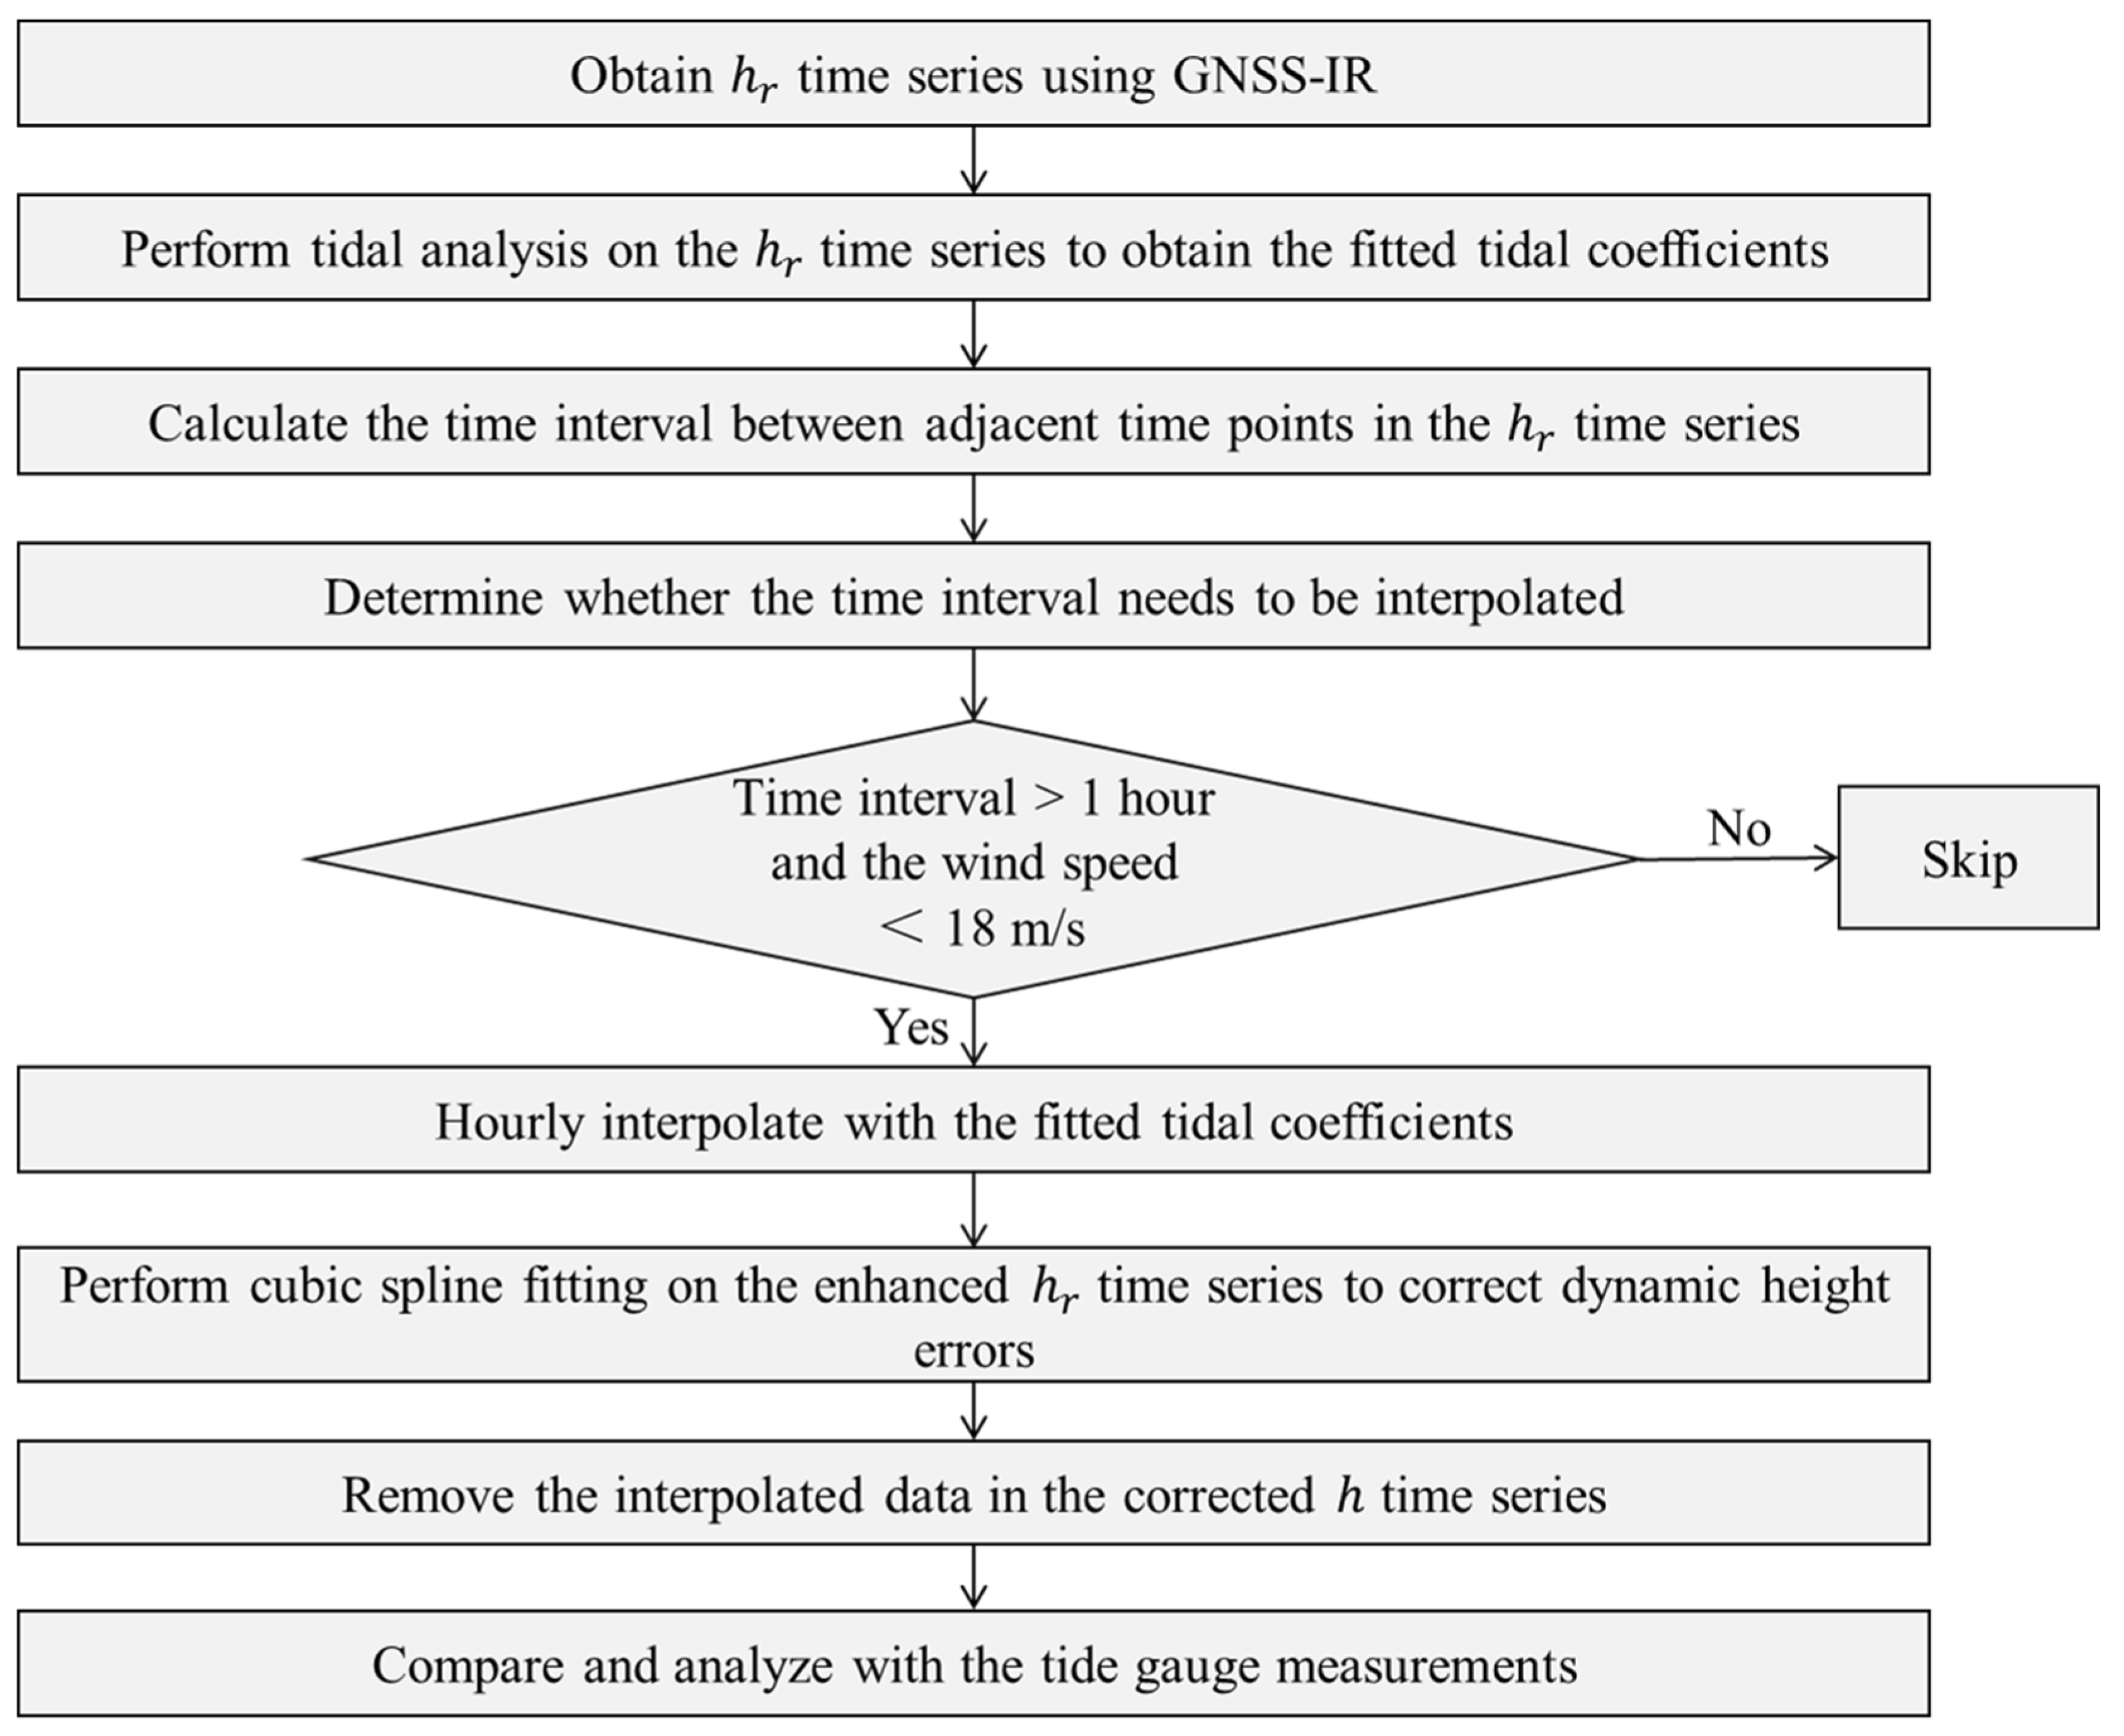
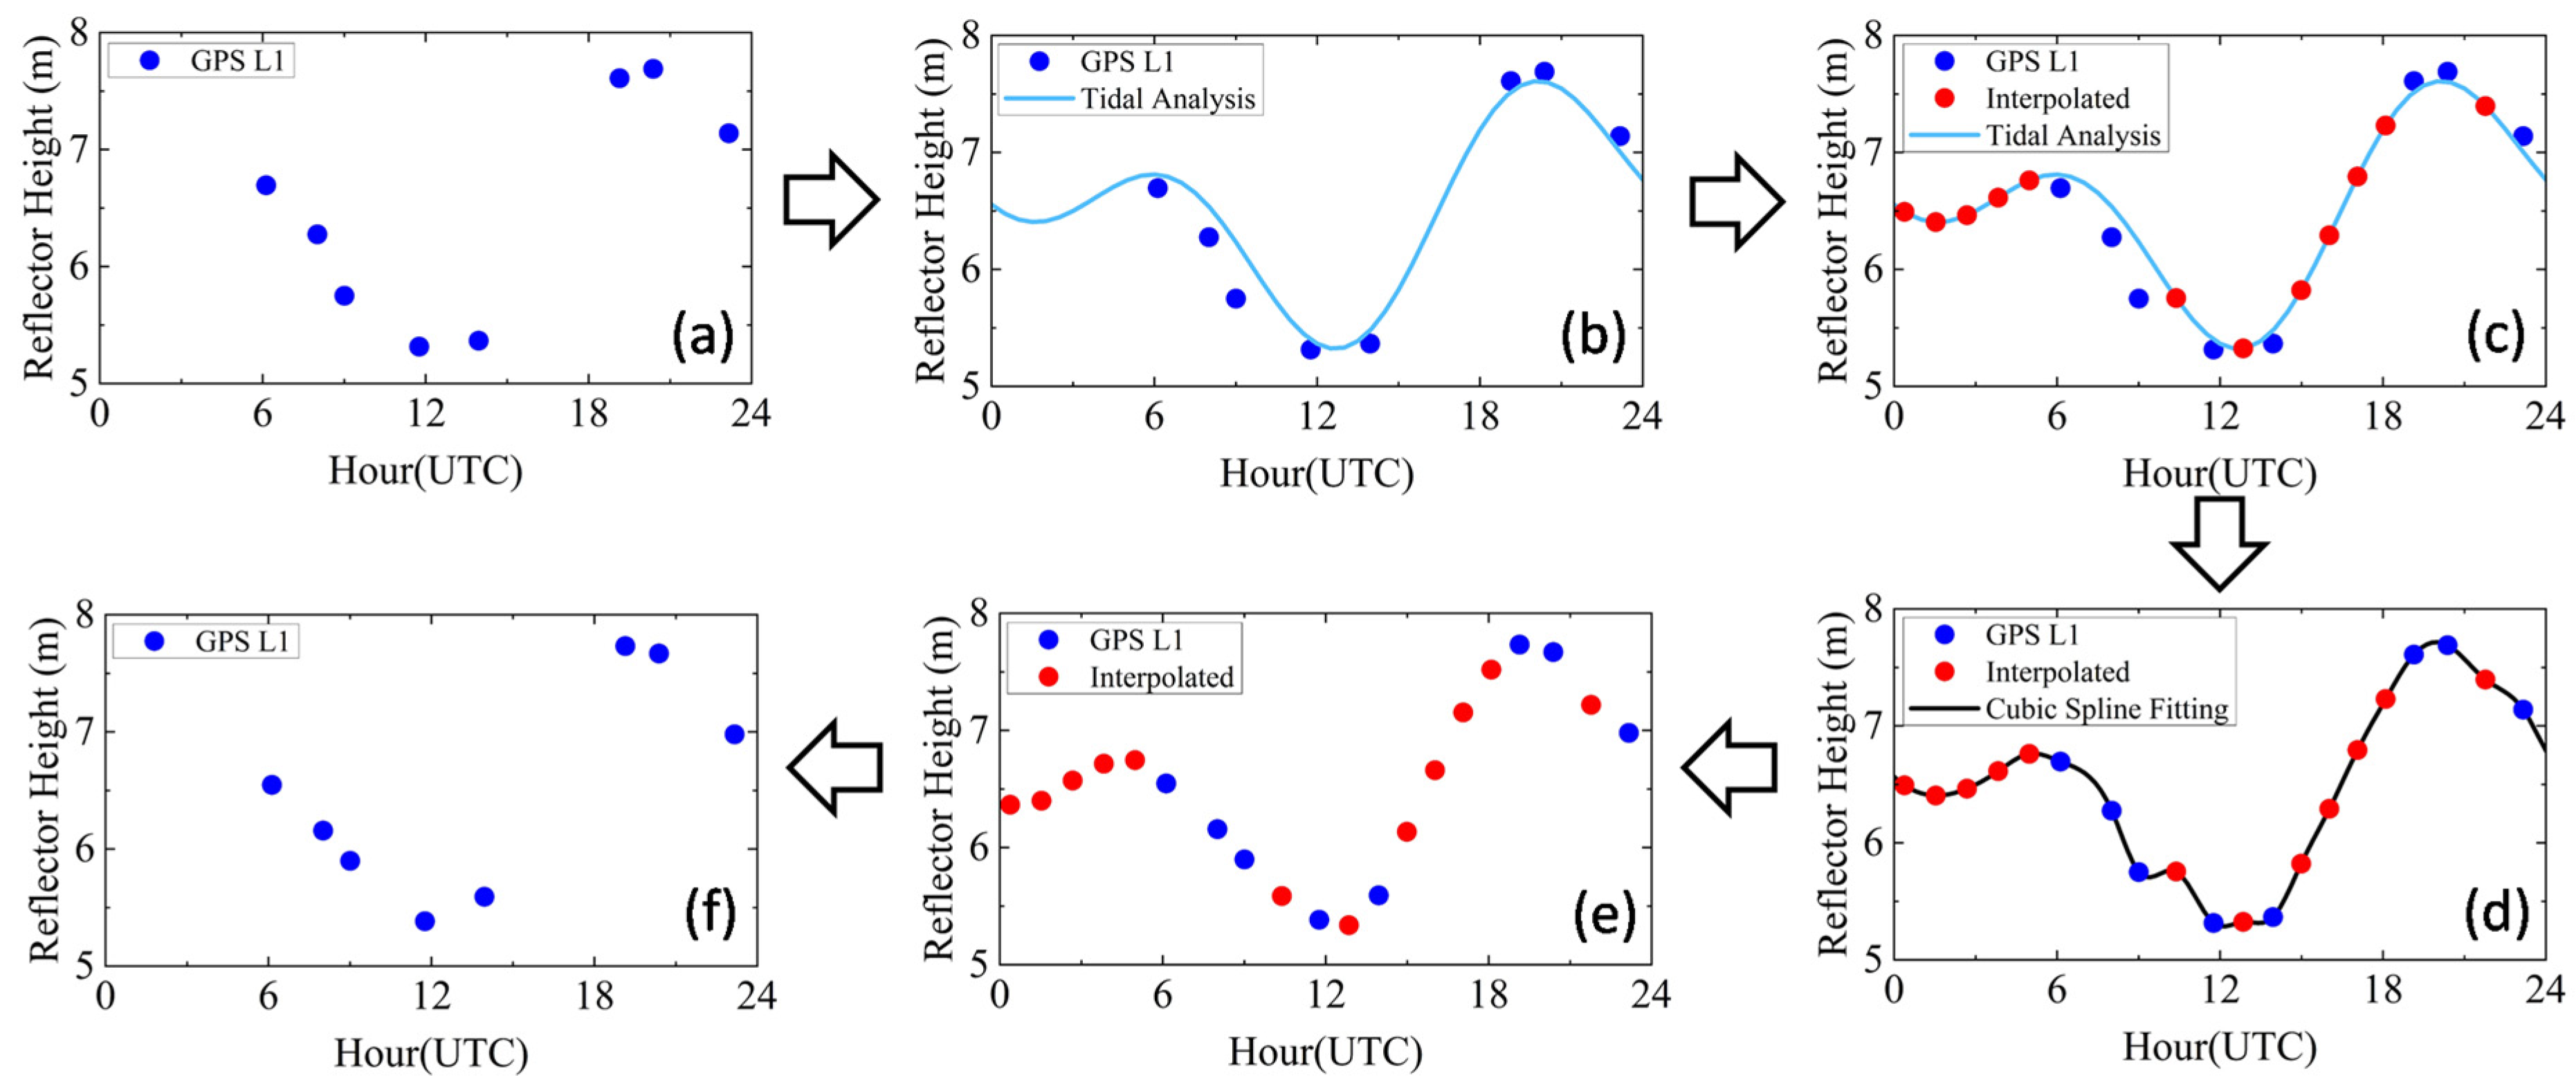
While tidal analysis effectively models sea level dynamics under normal conditions, it may erroneously exclude GNSS-IR retrievals during storm events due to anomalous sea level behavior. Conversely, cubic spline fitting robustly approximates sea level changes regardless of weather conditions but degrades with sparse retrievals. To address these limitations, we propose a new method integrating tidal analysis and cubic spline fitting for dynamic height error correction (Figure 5). The core idea of this method is to fill data gaps in original GNSS-IR sea level retrievals through tidal analysis, enhancing their continuity and constraining subsequent cubic spline fitting. As shown in Figure 5, the implementation steps of this method are as follows. First, tidal analysis is applied to the GNSS-IR sea level time series to derive fitted tidal coefficients. Next, intervals between adjacent data points in the original retrievals are calculated. If an interval exceeds one hour, the tidal-analysis-reconstructed sea level is interpolated hourly between the points to ensure continuity. Considering the fact that the sea level would abnormally change in high-speed conditions, significantly deviating from the sea level reconstructed using tidal analysis, we set a threshold of 18 m/s for wind speed to conduct the interpolation with tidal analysis [16]. When the wind speed exceeds 18 m/s, the interpolation in this time interval is skipped. Wind speed data can be obtained from the National Climatic Data Center (NCDC). Next, the enhanced time series of GNSS-IR sea level retrievals are fitted to the cubic spline to correct the dynamic height error. After correction, all interpolated data points are removed from the time series, retaining only the retrievals corrected from the original GNSS-IR sea levels. Finally, the corrected GNSS-IR sea level retrievals are validated through comparative analysis with tide gauge measurements. Taking the GPS L1 data from 1 January 2018 at HKQT as an example, Figure 6 illustrates the step-by-step implementation of our method.

3. Results

3.1. Correction Performance at MAYG

We applied the GNSS-IR to the multiple SNR data collected by MAYG from 2018 to 2020. Then, the retrieved GNSS-IR sea levels were corrected using our method and compared to the nearby tide gauge measurements. As for comparison, we also corrected the dynamic height error with the tidal analysis method and the cubic spline fitting method, respectively. Table 2 summarizes the precision statistics for multiple GNSS-IR sea level retrievals at MAYG.
From Table 2, we can see that our new method and the other two methods significantly improve the accuracy of GNSS-IR sea level retrievals by 3.8 cm~12.3 cm. Applied with our method, the RMSE of sea level retrievals for each frequency has been reduced by an average of 11.4 cm (42.1%). The performances are superior to the cubic spline fitting method in all frequencies, with improvements ranging from 10% to 30%. Specifically, the improvement is more significant for the frequency with less retrievals. Taking the BDS B1 as example, with dynamic height error corrected by the cubic spline fitting method, the retrievals decrease from 734 to 445, while the RMSE is only reduced by 1.1 cm. This indicates that the correction performance of the cubic spline fitting method is limited, and it would eliminate the useful retrievals. As for our method, the RMSE decreases by 7.2 cm to 15.5 cm while the retrievals remain, indicating that our method could achieve good correction performance without retrieval loss. For individual frequency bands, our method outperforms the tidal analysis method in six frequency bands: GPS L5, Galileo E5a, Galileo E5b, Galileo E5, BDS B2, and BDS B3. Although both methods achieve identical RMSE values of 15.6 cm in the GPS L2C band, our method removed less retrievals compared to tidal analysis, thereby providing more usable measurements. For GPS L1, GLONASS G1, GLONASS G2, Galileo E1, and BDS B1, our method is comparable to the tidal analysis method but still keeps more retrievals after dynamic height error corrections.
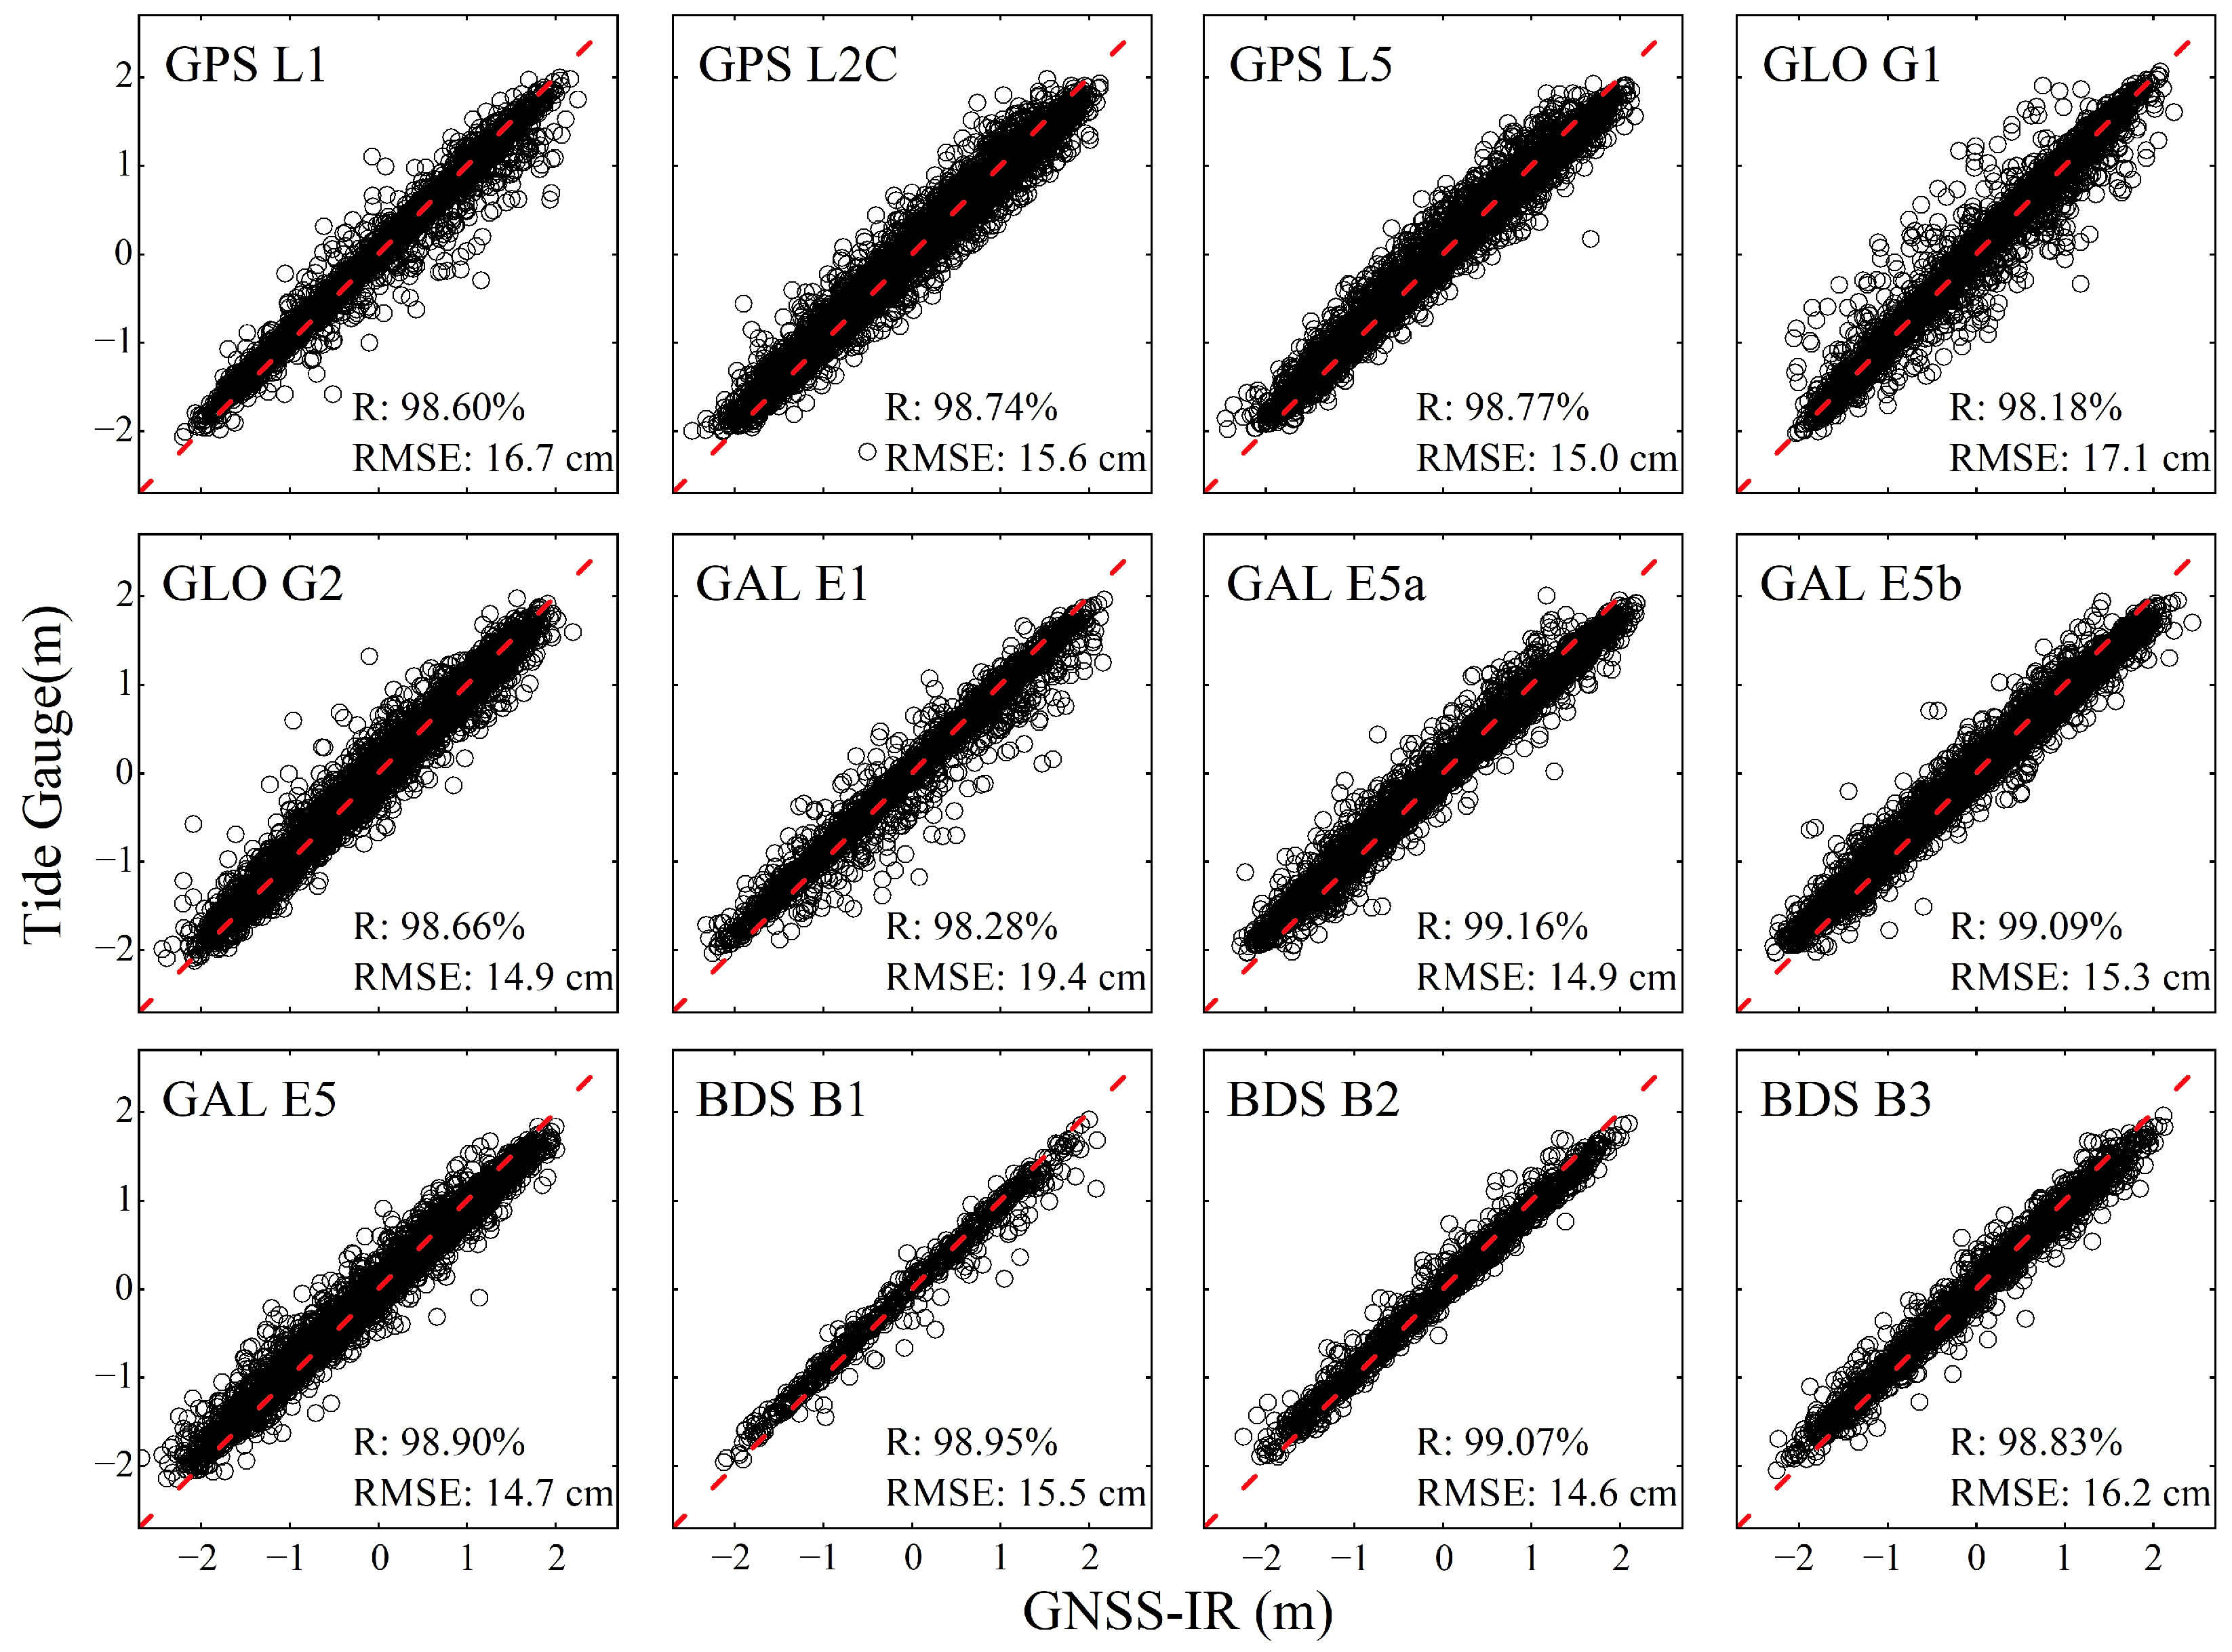
Figure 7 shows the comparison of GNSS-IR sea level retrievals corrected by our method and tide gauge measurements at the MAYG station. For brevity, the abbreviations GLO and GAL are used to denote GLONASS and Galileo, respectively, in Figure 7 and all subsequent figures. Figure 7 demonstrates strong agreement between the GNSS-IR sea level retrievals corrected by our method and tide gauge measurements across all frequency bands, with correlation coefficients consistently exceeding 98%. This indicates the effective correction capability of our method. Across systems, GPS achieves an average correlation of 98.7% and an RMSE of 15.8 cm, comparable to GLONASS (98.4%, 16.0 cm), Galileo (98.8%, 16.1 cm), and BDS (98.9%, 15.4 cm), while the lowest frequency in each constellation (GPS L5, GLONASS G2, Galileo E5, and BDS B2) consistently yields the smallest RMSE.
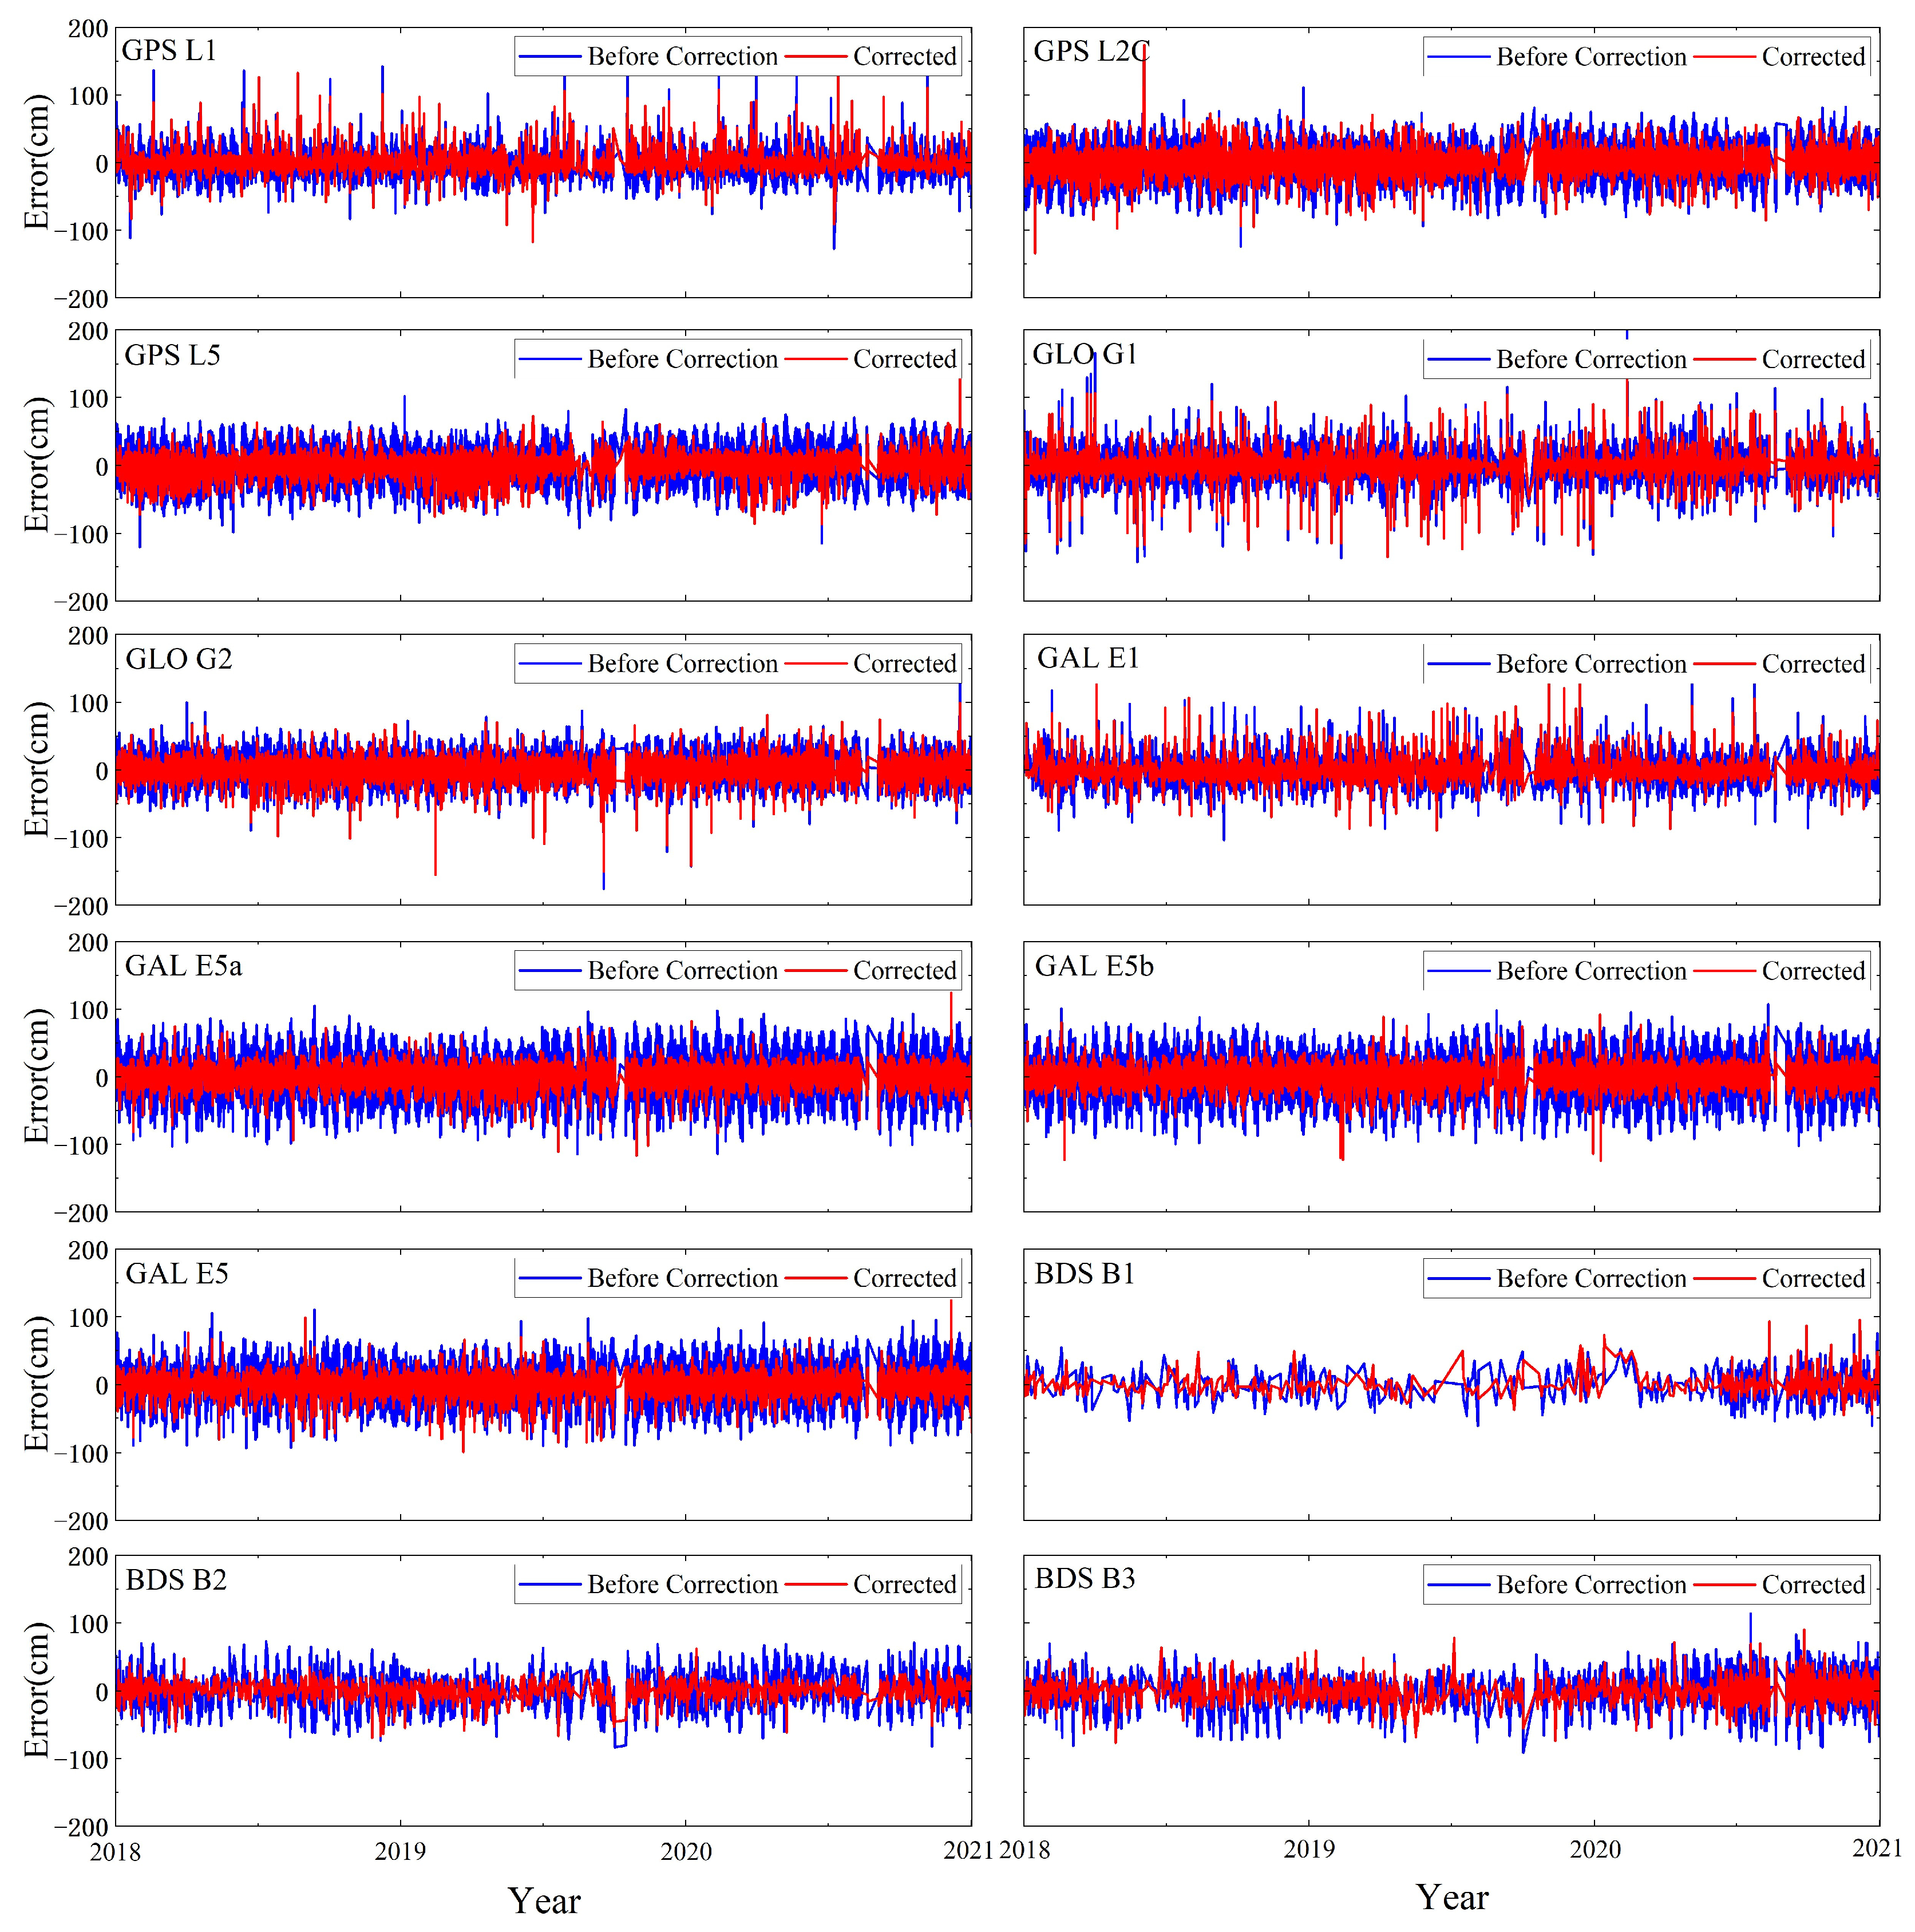
Figure 8 presents the time series of errors of GNSS-IR sea level retrievals at MAYG. It clearly shows that after correction via our method, the distribution of biases across all frequency bands becomes notably more concentrated compared to the uncorrected retrievals, with a significant reduction in overall biases. Particularly on the Galileo E5a, E5b, and E5 frequency bands, with dynamic height error correction using our method, the RMSE values for these three bands decrease by 16.8 cm, 15.3 cm, and 13.5 cm, respectively. Although some larger biases still exist in certain frequency bands after dynamic height error correction, the overall distribution of discrepancies is visibly more clustered than that without corrections. This indicates an improved agreement between the GNSS-IR sea level retrievals and the tide gauge measurements. These results further validate the effectiveness of our method in enhancing the accuracy of GNSS-IR sea level retrievals.

3.2. Correction Performance at HKQT

Table 3 summarizes precision statistics for multiple GNSS-IR sea level retrievals at the HKQT station. Without correction, the average RMSE across all frequency bands is 14.4 cm. The average RMSE for retrievals corrected with the tidal analysis method and the cubic spline fitting method decreases to 11.3 cm and 12.4 cm, respectively. For our method, the RMSE further decreases to 10.3 cm, indicating an improvement of 21.5% (3.1 cm) over that of the uncorrected GNSS-IR sea level retrievals. For individual frequency bands, our method outperforms cubic spline fitting across all bands. Although the RMSEs for GPS L1 and GLONASS G1 corrected with our method are 2 mm higher than those from tidal analysis, RMSE values for the remaining nine frequency bands are consistently lower. Among all frequency bands corrected with our method, the Galileo E5a has the smallest RMSE of 9.0 cm, decreasing by 34.3% (4.7 cm) compared to the RMSE (13.7 cm) of the uncorrected retrievals. The GPS L1 shows the largest RMSE of 12.4 cm, still achieving a 23.9% improvement compared to the RMSE (16.3 cm) of uncorrected retrievals. In summary, our method demonstrates robust performance in dynamic height error correction for GNSS-IR sea level retrievals across all frequency bands at HKQT. Figure 9 shows the comparison of GNSS-IR sea level retrievals corrected using our method and tide gauge measurements at HKQT. It can be seen that after correction with our method, all frequency bands exhibit correlation coefficients above 97%, demonstrating effective elimination of dynamic elevation errors and improved accuracy in GNSS-IR sea level retrievals. For GPS, the mean correlation coefficient and RMSE across frequencies reach 97.7% and 10.8 cm, respectively, comparable to BDS (97.7%, 10.8 cm) but slightly worse than GLONASS (97.8%, 9.8 cm) and Galileo (97.9%, 9.9 cm). Within each constellation, and consistent with the findings at MAYG, the lowest frequency (GPS L5, GLONASS G2, Galileo E5, BDS B2) consistently provides the smallest RMSE, indicating the frequency-dependent correction capability of our method.
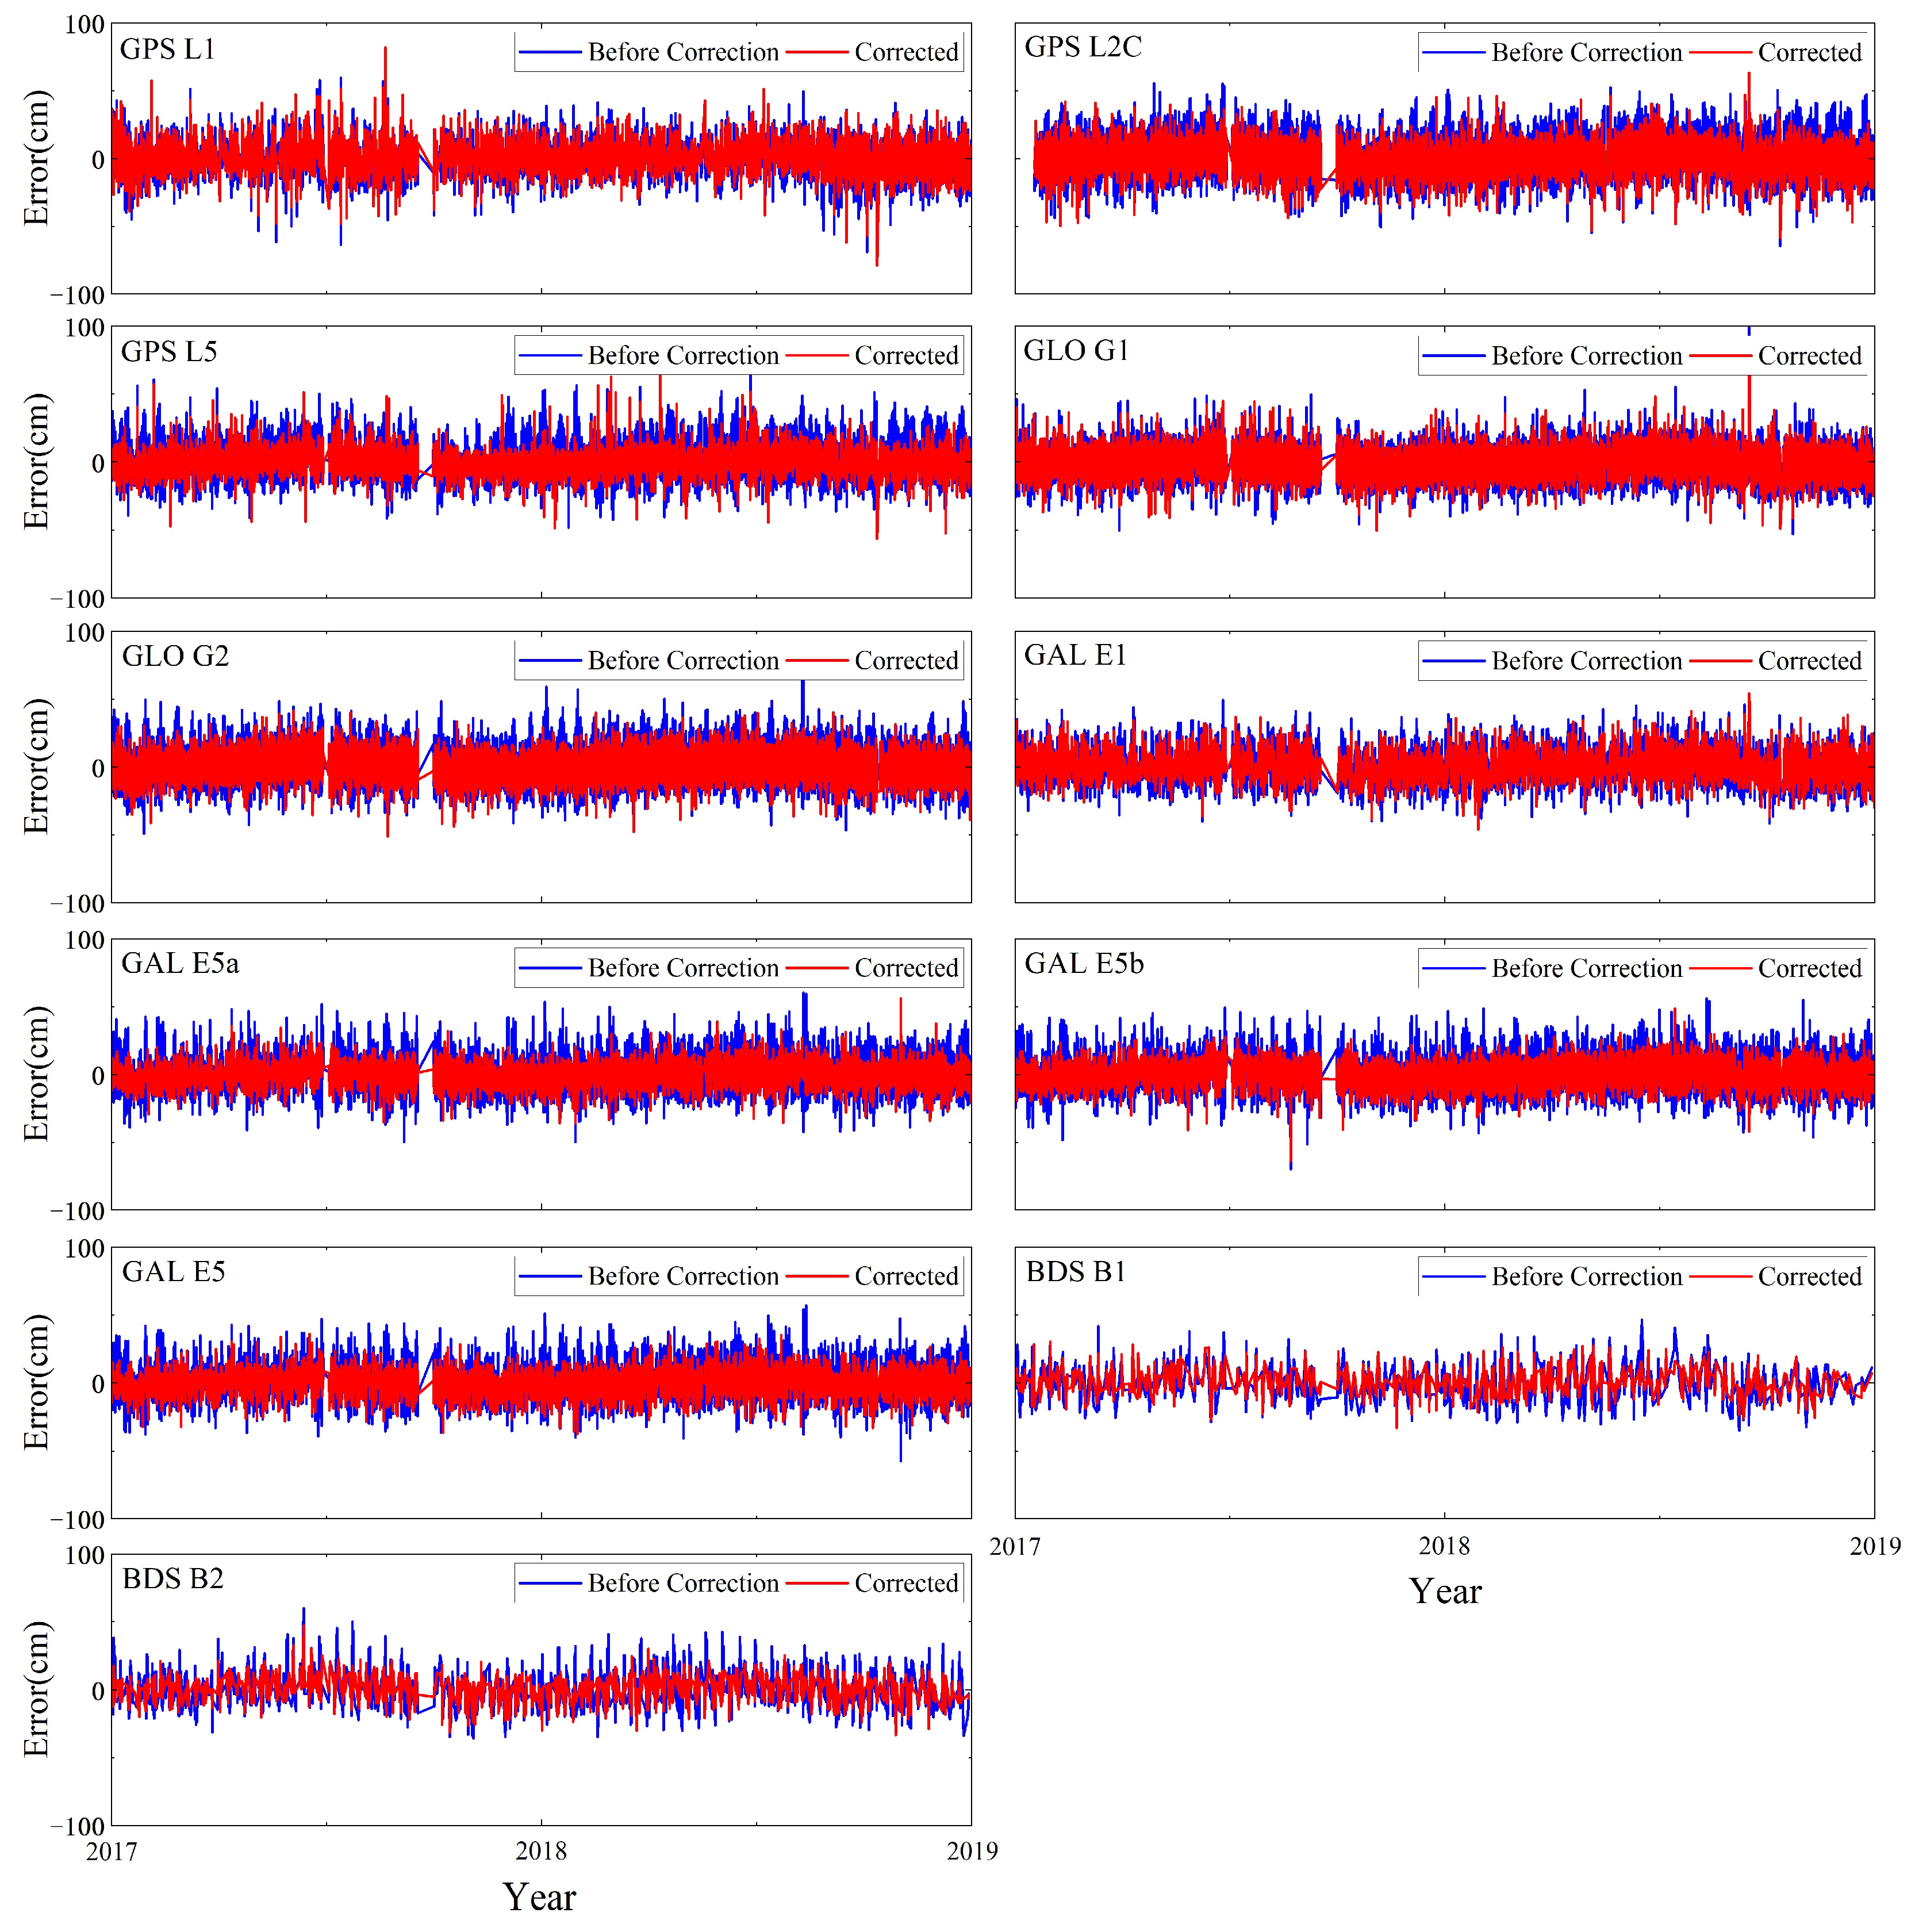
Figure 10 presents the time series of errors of GNSS-IR sea level retrievals at HKQT. As shown in Figure 10, after correction with our method, the discrepancies between the GNSS-IR sea level retrievals and the tide gauge measurements are generally reduced and more concentrated, highlighting our method’s effectiveness in improving overall accuracy. Comparing the results with that at MAYG, we found that the accuracy of GNSS-IR sea level retrievals corrected with our method is higher at HKQT than at MAYG, which may be attributed to the number of available retrievals. For instance, for GLONASS G2, the RMSE is 14.9 cm with an average of 7.4 daily retrievals at MAYG, whereas at HKQT it decreases to 9.7 cm with 18.1 daily retrievals. The denser retrievals at HKQT enhanced both the tidal analysis and cubic spline fitting, thereby yielding better accuracy.
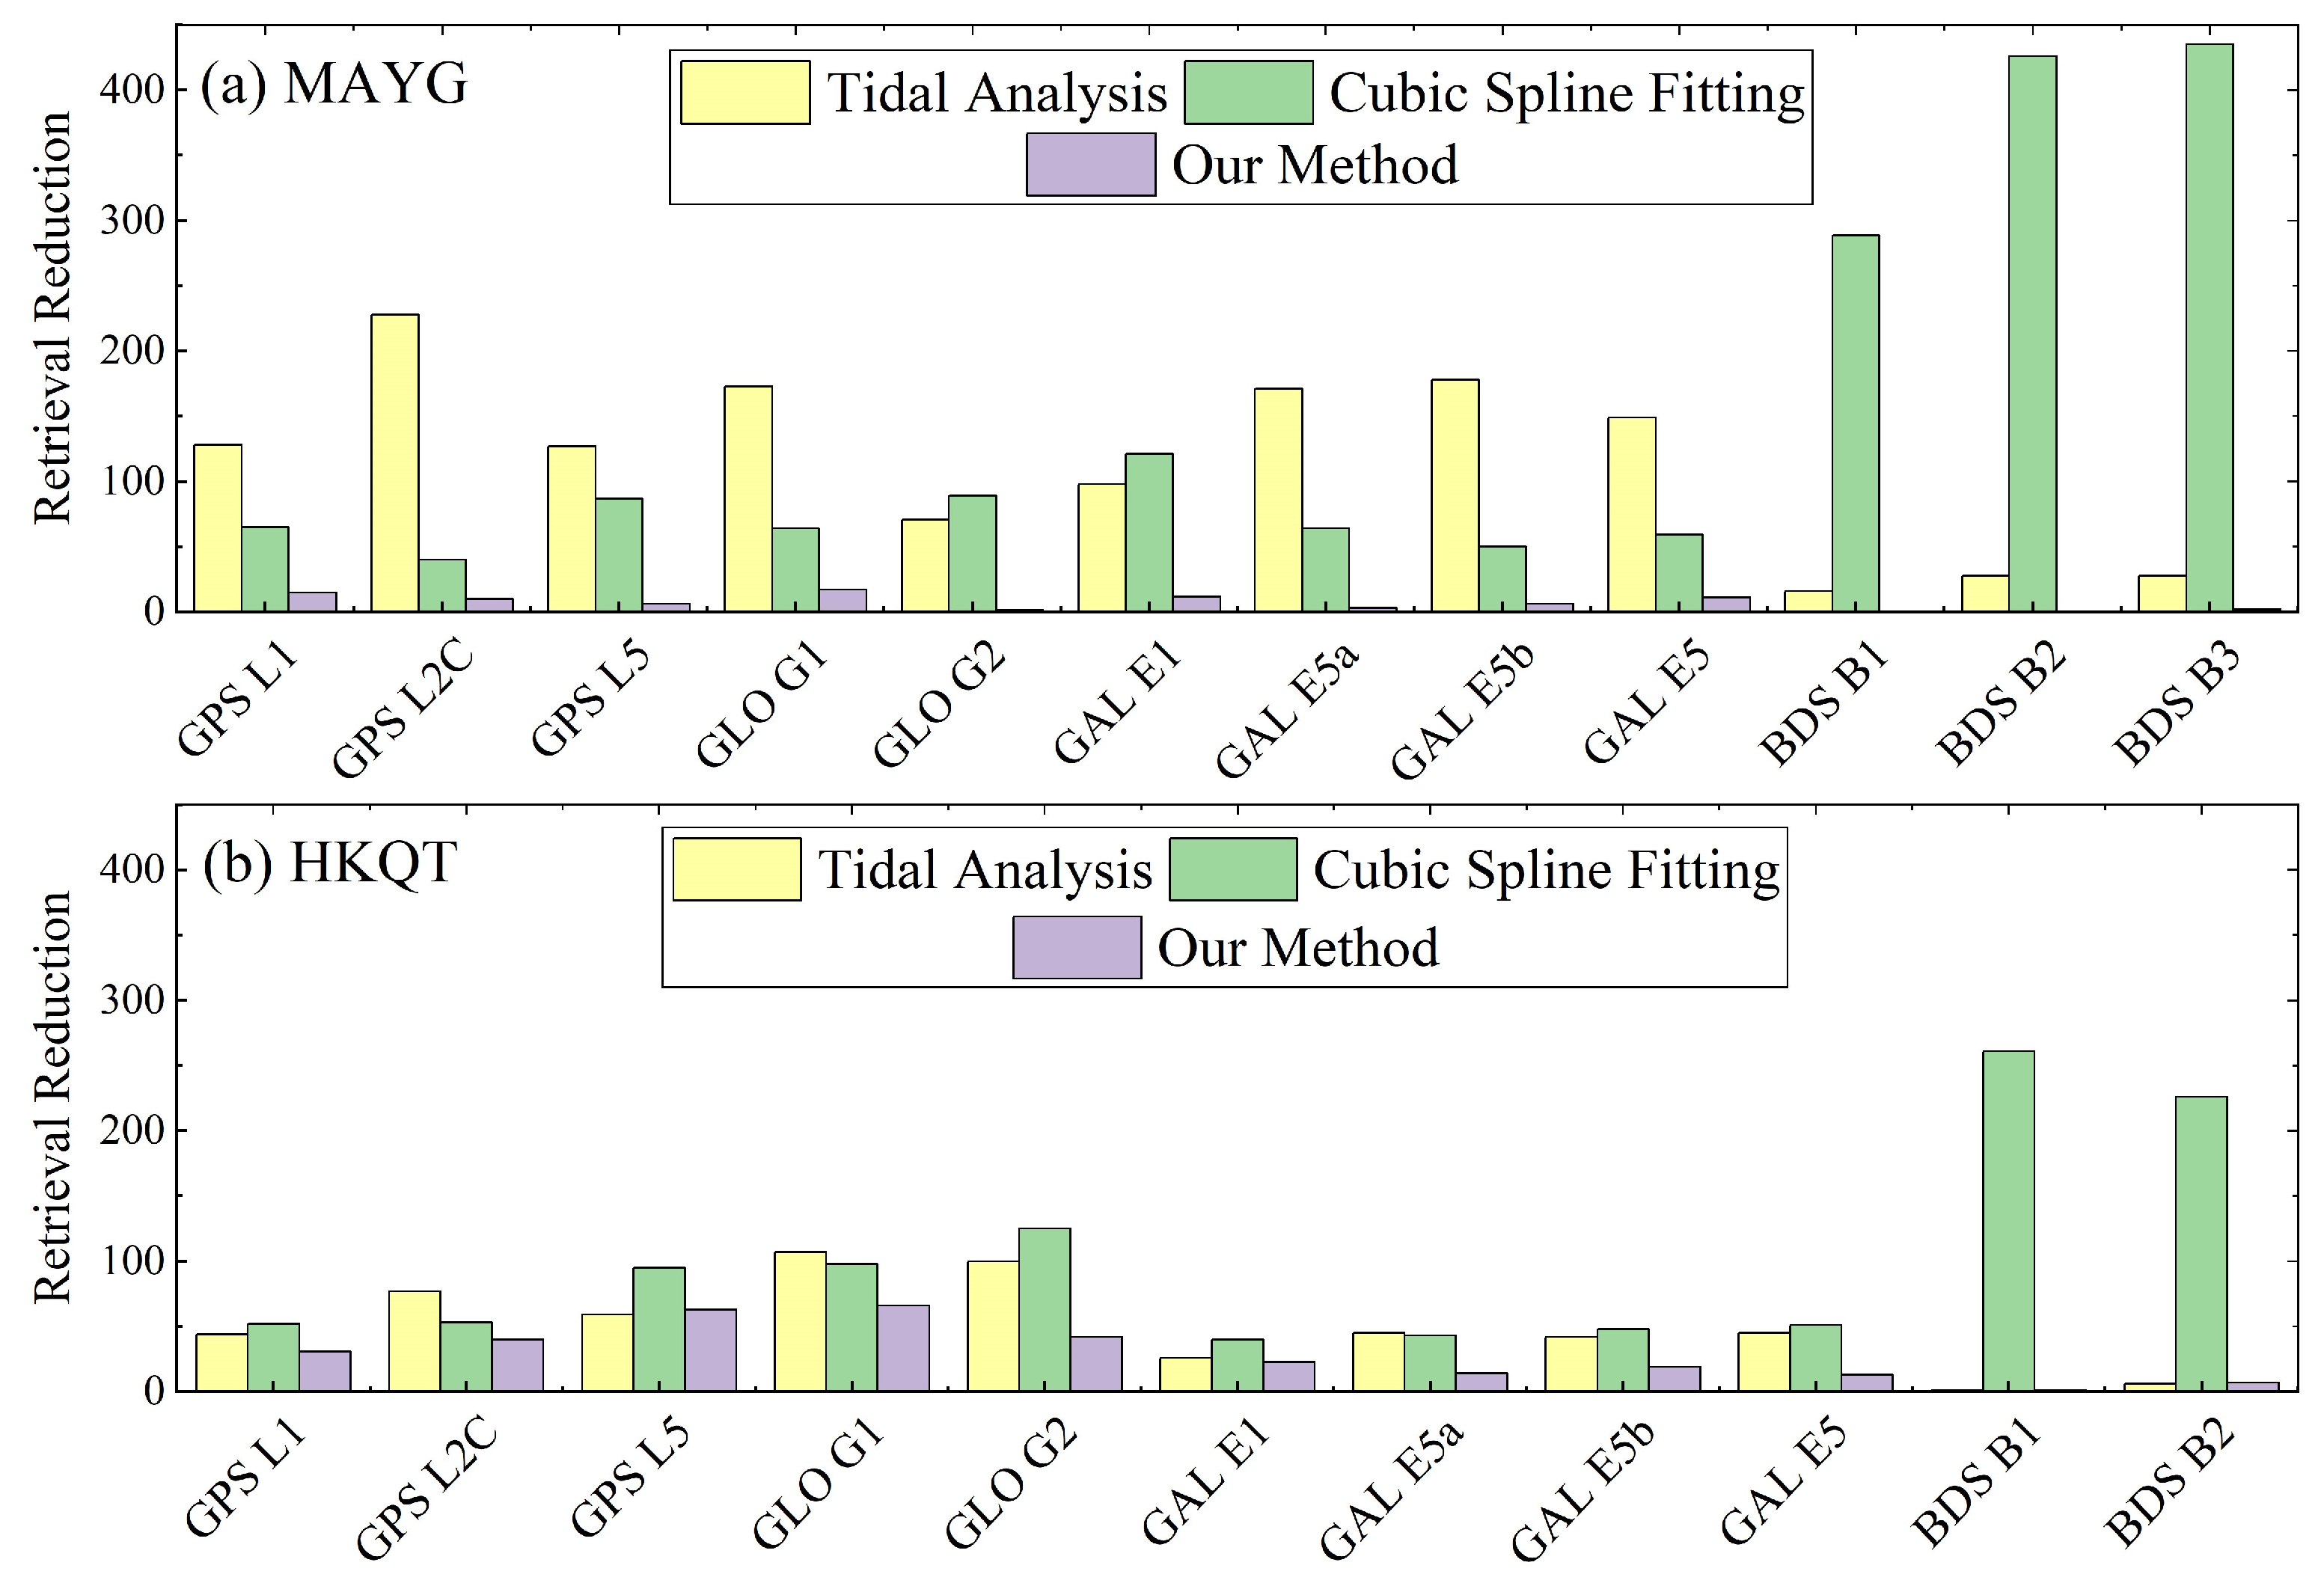
Figure 11 presents histograms of the data loss after corrections via different methods. It demonstrates that our method has the smallest data loss across all frequency bands at MAYG and HKQT, robustly confirming its capability of higher data utilization. Notably, at MAYG, significant data loss occurs at BDS B1, B2, and B3 frequency bands with the cubic spline fitting method. This method requires denser and more continuous time series, while the number of retrievals at BDS bands is relatively few, resulting in mistakenly identified outliers. Similar patterns are observed in the BDS B1 and B2 frequency bands at HKQT. In summary, our method outperforms both tidal analysis and cubic spline fitting methods in minimizing data loss for most frequency bands. This comparative analysis of data loss during the dynamic height error correction conclusively highlights our method’s superior data utilization efficiency.

4. Discussion

Storm surge is a phenomenon of abnormal seawater level rise caused by intense meteorological disturbances, such as tropical cyclones, posing a serious threat to the lives and property of coastal residents. In 2017 and 2018, Hong Kong experienced two major storm surge events triggered by Typhoon Hato and Typhoon Mangkhut, respectively. Typhoon Mangkhut and Typhoon Hato are the second- and third-strongest typhoons to make landfall in Hong Kong since 1954. Tide gauge records show that Mangkhut generated a maximum sea level of 4.7 m and a storm surge of 3.4 m, whereas Hato produced a maximum sea level of 4.6 m and a storm surge of 2.4 m. During storm surges with wind speeds exceeding 18 m/s, sea levels vary dramatically, which can no longer be explained by tidal analysis, as in normal sea states. Evaluating the correction performance under storm surge conditions provides a comprehensive assessment of the effectiveness of our method. In this section, we discuss the correction effectiveness of our method at HKQT in the storm surges caused by these two typhoons.
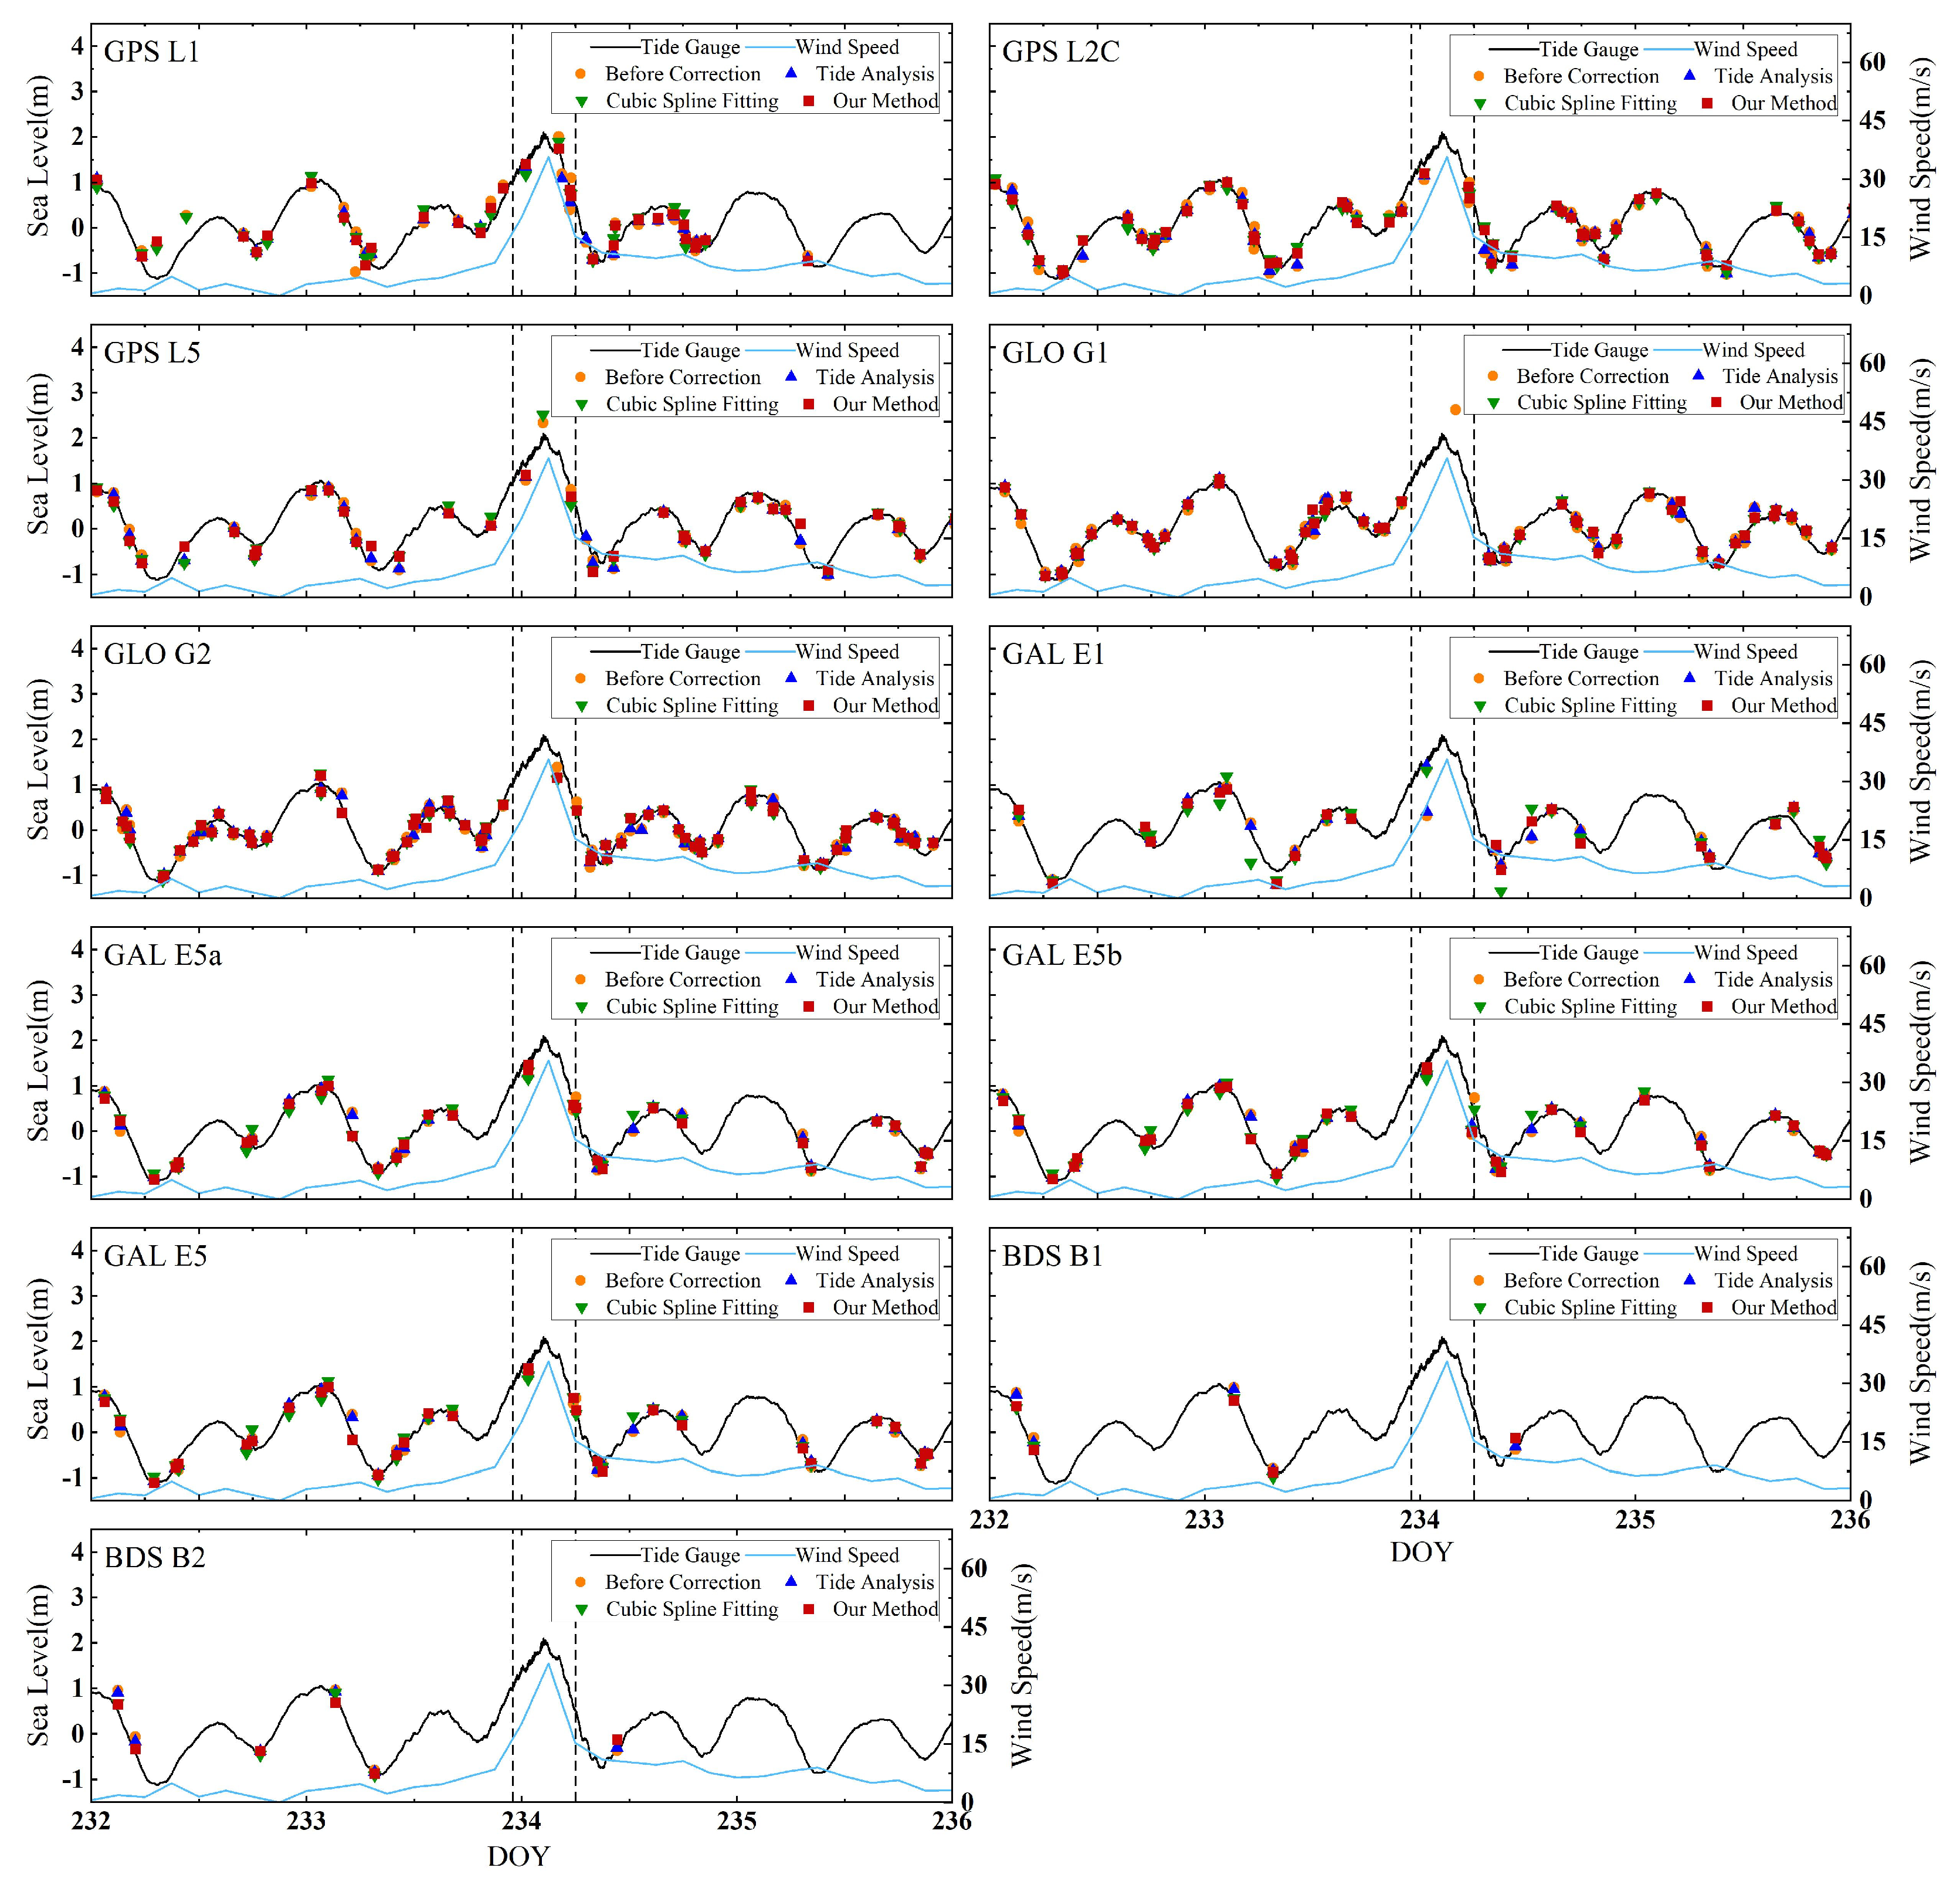
On 23 August 2017, Typhoon Hato struck Hong Kong, triggering a storm surge in coastal areas that lasted about 7 h. The sea level began to rise sharply at 23:00 UTC on 22 August, peaked at 02:27 UTC on 23 August, and gradually returned to normal by 06:00 UTC. We conduct a statistical analysis of GNSS-IR sea level retrievals over four days encompassing the storm surge event. Table 4 summarizes the accuracy of the GNSS-IR sea level retrievals at HKQT from 21 to 24 August 2017. Before dynamic height error corrections, the RMSEs of the GNSS-IR sea level retrievals across all frequency bands range from 15.7 cm to 28.8 cm, with an average RMSE of 20.6 cm, indicating significant deviations from the tide gauge measurements. Our method, the tidal analysis method, and the cubic spline fitting method all effectively improve accuracy by reducing RMSE in GNSS-IR sea level retrievals. Specifically, when using tidal analysis alone, the average RMSE across frequency bands decreases by 24.8% to 15.5 cm. The GLONASS G1 performs best, achieving an RMSE of 11.1 cm. As for cubic spline fitting, the average RMSE drops to 15.8 cm, with the BDS B1 band showing the smallest RMSE of 9.4 cm. Our method further reduces the average RMSE to 12.5 cm, outperforming the other two methods. Notably, the RMSE values for the Galileo E5a, Galileo E5, and BDS B1 decrease to a centimeter-level of 9.2 cm, 9.1 cm, and 9.3 cm, respectively, demonstrating significant accuracy improvements. Additionally, our method remains more valid for GNSS-IR sea level retrievals across most frequency bands, enhancing data utility while maintaining high accuracy.
Figure 12 shows the GNSS-IR sea level retrievals time series at the HKQT station and tide gauge measurements during Typhoon Hato, including original GNSS-IR sea level retrievals and those corrected using the tidal analysis method, the cubic spline fitting method, and our method. It is evident that after correction via tidal analysis, some normal GNSS-IR sea level retrievals during the storm surge are mistakenly flagged as outliers and removed. The reason is that tidal analysis primarily relies on the periodic characteristics of tides, while in extreme events like storm surges, sea level variations are influenced by non-periodic factors, rendering tidal analysis ineffective in capturing these abrupt changes. When cubic spline fitting is applied independently, it captures local variations in sea level better; however, in cases where the GNSS-IR sea level retrievals are sparse, many valid retrievals may be misclassified as outliers and removed, leading to reduced data availability. For example, the number of retrievals at GPS L5 and GLONASS G2 bands decreases by four and six, respectively, indicating potential over-removal under sparse data conditions. In contrast, with our method, the removed retrievals are limited to two and one at GPS L5 and GLONASS G2, respectively. Our method not only effectively reduces dynamic elevation errors but also retains a higher volume of valid data.
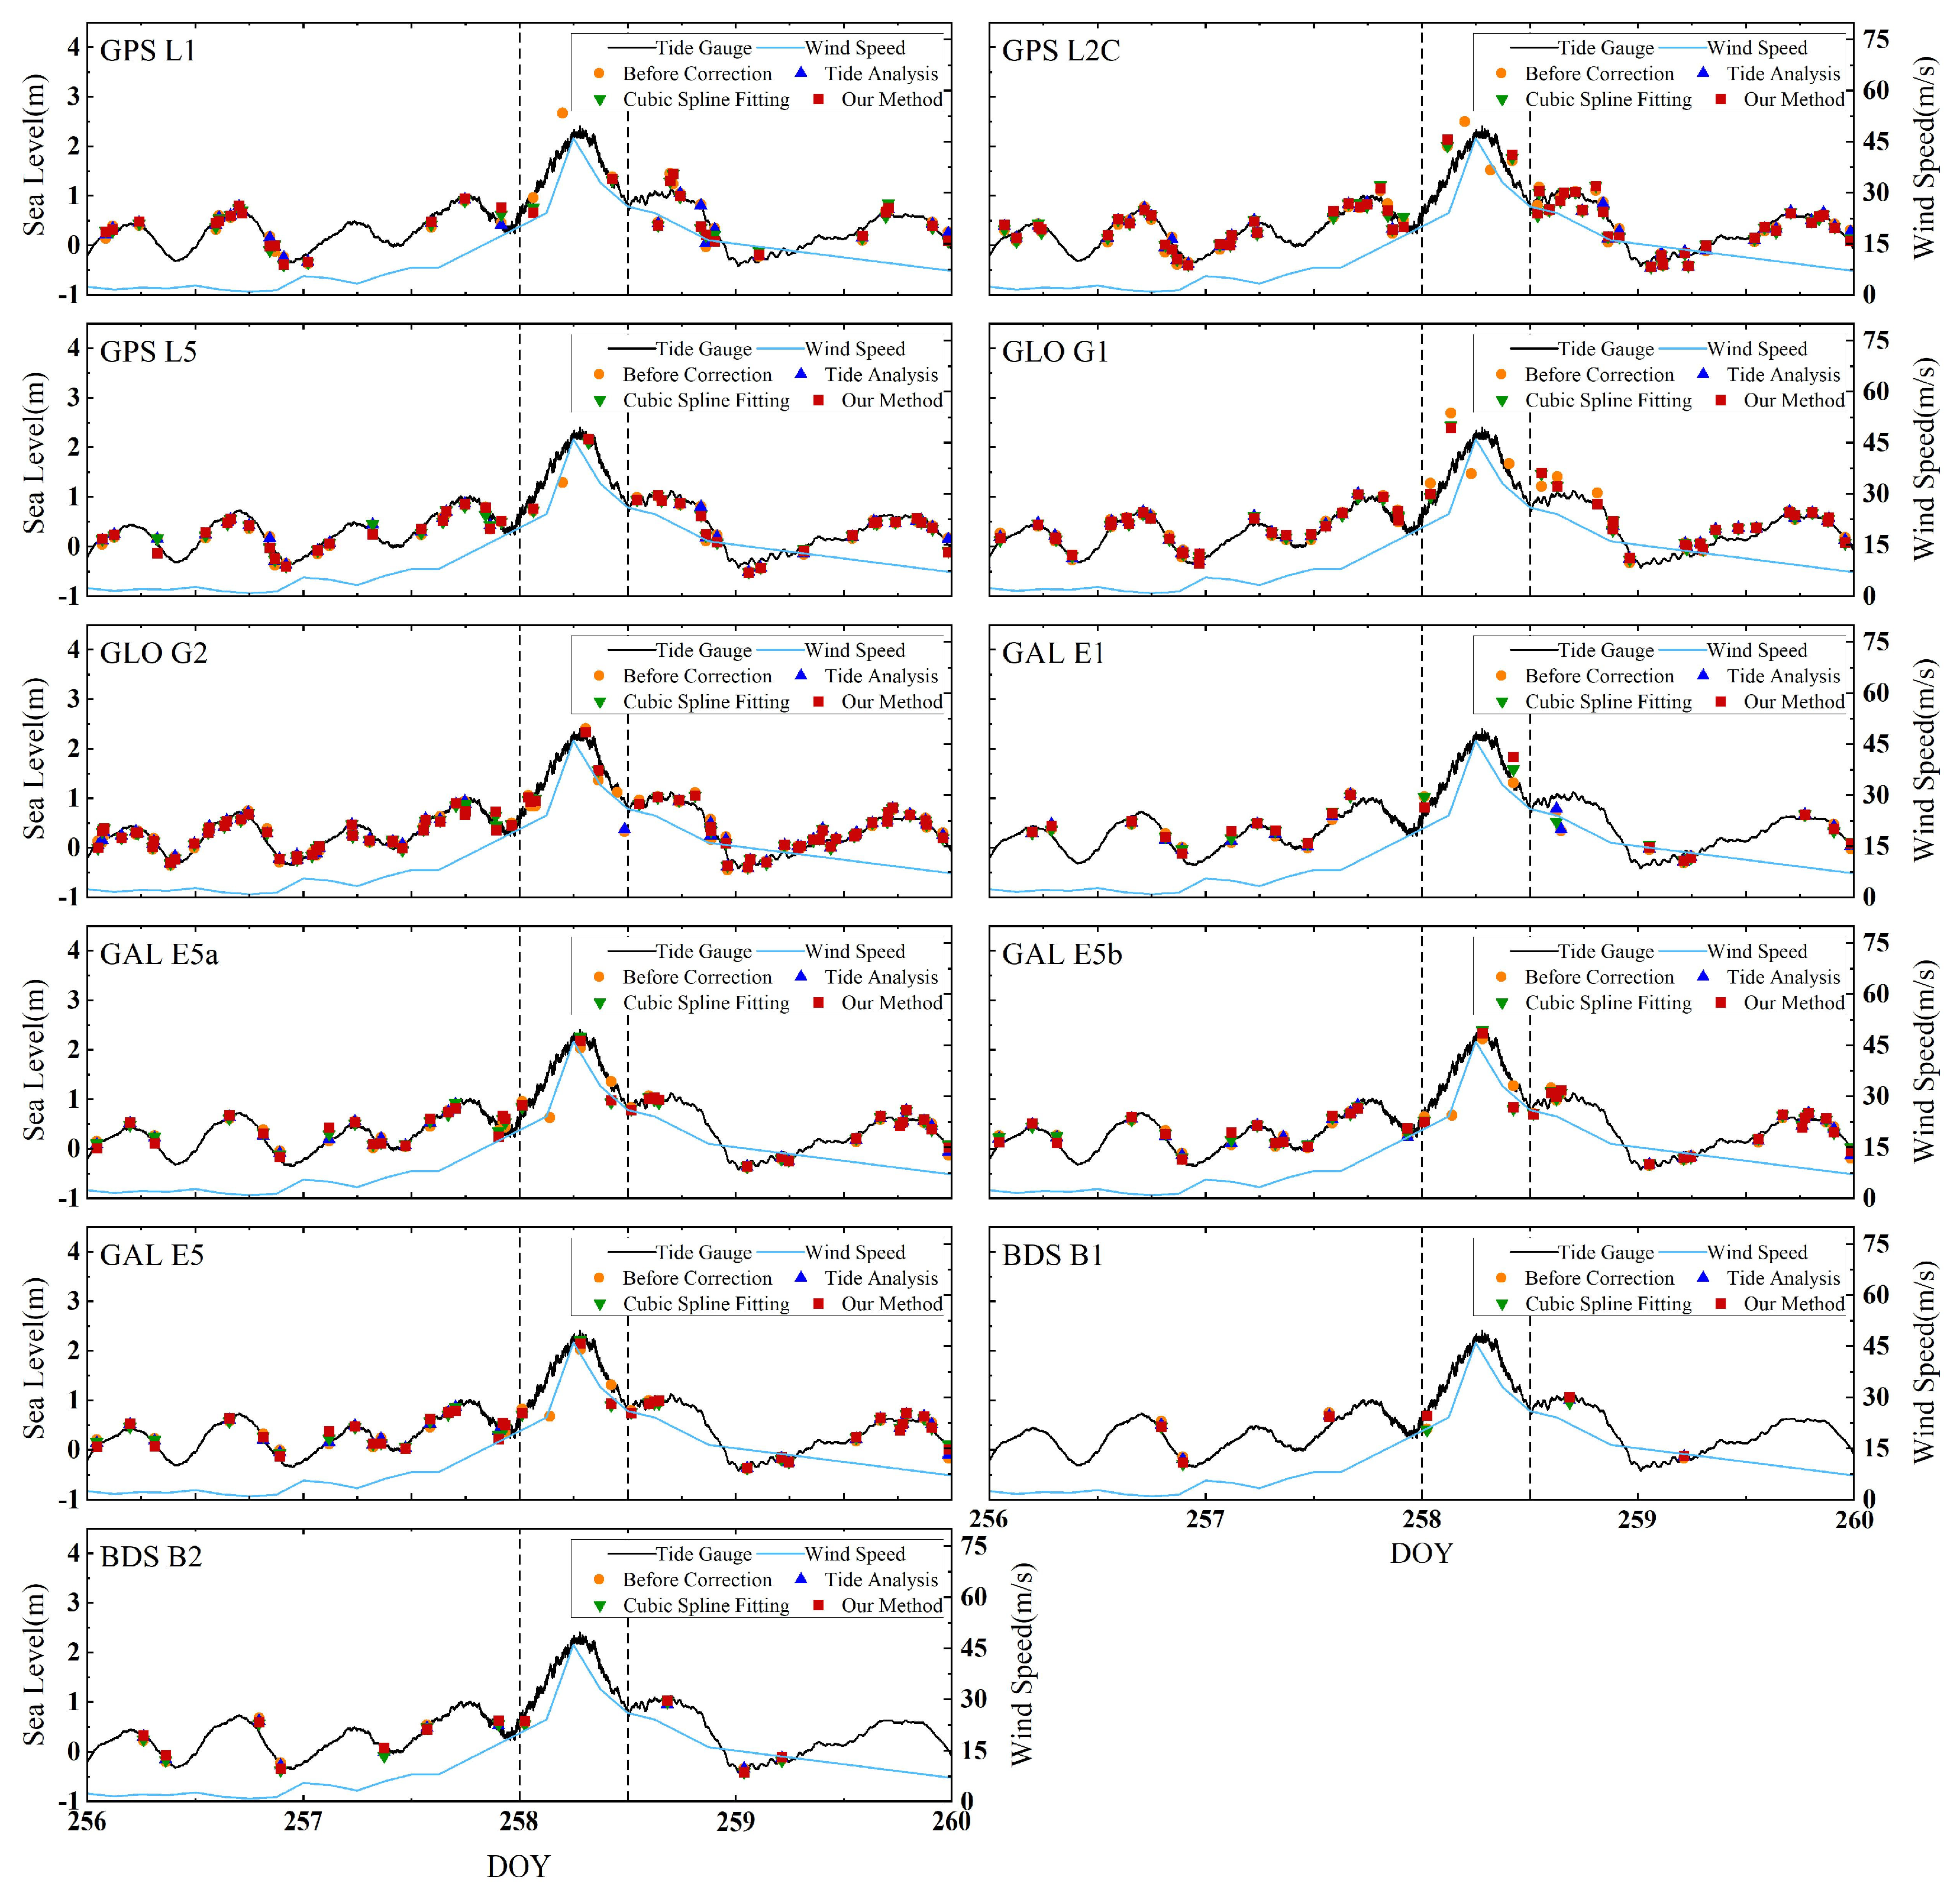
On 16 September 2018, Typhoon Mangkhut made landfall in Hong Kong. The storm surge induced by Typhoon Mangkhut persisted for 12 continuous hours. According to records from the Quarry Bay tide gauge station, the sea level began abnormal ascent at 00:10 UTC on 16 September 2018, peaked at 6:42 UTC, and returned to normal levels by 12:00 UTC. We compared the GNSS-IR sea level retrievals to the Quarry Bay tide gauge measurements and summarized the precision results. Table 5 summarizes the accuracy of the GNSS-IR sea level retrievals at HKQT from 14 to 17 September 2018. The RMSE averaged from the uncorrected GNSS-IR sea level retrievals across all frequency bands is 18.6 cm. After the dynamic height error corrections with the tidal analysis method, the cubic spline fitting method, and our method, the average RMSEs decrease to 11.1 cm, 13.5 cm, and 13.0 cm, respectively. This indicates that the tidal analysis method has the most significant error correction, performing a little better than our method and the cubic spline fitting method. However, the tidal analysis method substantially reduces the number of retrievals, likely due to misclassification of valid retrievals as outliers during storm surge event, resulting in notable data loss. In contrast, both our method and the cubic spline method show only a little data loss after the corrections. Compared to the cubic spline fitting method, our method has a marginally better performance (0.5 cm) in dynamic height error correction during the storm surge.
Figure 13 shows the time series of GNSS-IR sea level retrievals at HKQT station and tide gauge measurements during Typhoon Mangkhut. From Figure 12, it is clear that the tidal analysis method leads to substantial data loss during the storm surge. For instance, at the GLONASS G2 frequency, five valid GNSS-IR sea level retrievals are discarded after correction with the tidal analysis method, whereas only one valid retrieval is removed when applying either our method or the cubic spline fitting method. This demonstrates that the tidal analysis method erroneously classifies valid GNSS-IR sea level retrievals during the storm surge as outliers. This is similar to the results in Typhoon Hato, which further underscores the limitations of the tidal analysis method in storm surge events. In contrast, both our method and cubic spline fitting achieve error reduction while preserving more retrievals. Although our method performs less effectively at certain frequencies (e.g., Galileo E5a and E5b), it achieves good accuracy and retains more retrievals at other frequencies. The reduced performance at specific frequencies is likely due to the sparse distribution of retrievals during storm surges, which may bias cubic spline fitting.
As demonstrated in this study, all three methods—tidal analysis, cubic spline fitting, and our proposed approach—can improve the accuracy of GNSS-IR retrievals by correcting dynamic height errors. The tidal analysis method performs well under normal sea states but tends to discard retrievals as outliers during storm surges, limiting its applicability. Cubic spline fitting can smoothly approximate continuous sea level variations, yet its correction performance deteriorates when applied to sparse GNSS-IR time series, such as the BDS B1 and B2, in our case. Our method integrates the strengths of both tidal analysis and cubic spline fitting, achieving robust performance under both normal and extreme sea states. Nevertheless, its effectiveness is also reduced for sparse GNSS-IR time series under storm surges. This limitation could be mitigated by combining multi-system and multi-frequency GNSS data, but challenges remain in accurately estimating and removing inter-system and inter-frequency biases.

5. Conclusions

In this study, we proposed a method combining tidal analysis and cubic spline fitting to correct the dynamic height error in GNSS-IR sea level retrievals. The GNSS-IR is applied to multiple GNSS data collected at MAYG and HKQT stations to obtain the GNSS-IR sea level retrievals for multiple years. At the MAYG station, GNSS-IR sea level retrievals corrected with our method achieve an average all-band RMSE of 15.7 cm, demonstrating a 42.1% (11.4 cm) precision improvement over uncorrected retrievals. The results are better than the GNSS-IR sea level retrievals corrected with the tidal analysis method (RMSE = 16.5 cm) and the cubic spline fitting method (RMSE = 21.4 cm). At the HKQT station, GNSS-IR sea level retrievals corrected with our method achieve an all-band average RMSE of 10.3 cm, demonstrating a 21.5% (3.1 cm) accuracy improvement over uncorrected retrievals while outperforming the tidal analysis method (11.3 cm) and the cubic spline method (12.4 cm). During correction, tidal analysis and cubic spline fitting exhibit excessive outlier rejection, while our method retains more valid retrievals. In two typhoon-induced storm surges in Hong Kong, our method maintains balanced data retention and accuracy, demonstrating efficacy for dynamic height error correction in both normal and extreme sea conditions. Future work will focus on integrating multi-system and multi-frequency data to address sparse retrievals during storm surges and strengthen retrieval accuracy, thereby improving the reliability of GNSS-IR for coastal sea level monitoring.

Author Contributions

Conceptualization, Y.H.; methodology and software, Y.H. and Z.Z.; validation and formal analysis, Y.H. and Z.Z.; data curation, Z.Z. and X.L.; writing—original draft preparation, Y.H. and Z.Z.; writing—review and editing, Y.H. and Z.Z.; visualization, Z.Z. and X.L.; supervision, Y.H.; funding acquisition, Y.H. All authors have read and agreed to the published version of the manuscript.

Funding

This research was funded by the National Natural Science Foundation of China, grant number 42041006; the Natural Science Research Project of Shaanxi Province, grant number 2024JC-YBMS-197; and the Fundamental Research Funds for the Central Universities, CHD, grant number 300102263203.

Informed Consent Statement

Not applicable. The study used publicly available data and did not involve human participants.

Data Availability Statement

Tide gauge records are publicly available here: https://www.ioc-sealevelmonitoring.org/. GNSS data are publicly available here: https://cddis.nasa.gov/ and https://www.geodetic.gov.hk/tc/satref/satref.htm. Wind speed data are publicly available here: https://www.ncei.noaa.gov/cdo-web/.

Conflicts of Interest

The authors declare no conflicts of interest.

References

  1. Schöne, T.; Schön, N.; Thaller, D. IGS tide gauge benchmark monitoring pilot project (TIGA): Scientific benefits. J. Geod. 2009, 83, 249–261. [Google Scholar] [CrossRef]
  2. Chepurin, G.A.; Carton, J.A.; Leuliette, E. Sea level in ocean reanalyses and tide gauges. J. Geophys. Res. Ocean 2014, 119, 147–155. [Google Scholar] [CrossRef]
  3. Cazenave, A.; Palanisamy, H.; Ablain, M. Contemporary sea level changes from satellite altimetry: What have we learned? What are the new challenges? Adv. Space Res. 2018, 62, 1639–1653. [Google Scholar] [CrossRef]
  4. Larson, K.M.; Löfgren, J.S.; Haas, R. Coastal sea level measurements using a single geodetic GPS receiver. Adv. Space Res. 2013, 51, 1301–1310. [Google Scholar] [CrossRef]
  5. Larson, K.M.; Ray, R.D.; Nievinski, F.G.; Freymueller, J.T. The accidental tide gauge: A GPS reflection case study from Kachemak Bay, Alaska. IEEE Geosci. Remote Sens. Lett. 2013, 10, 1200–1204. [Google Scholar] [CrossRef]
  6. Larson, K.M.; Gutmann, E.D.; Zavorotny, V.U.; Braun, J.J.; Williams, M.W.; Nievinski, F.G. Can we measure snow depth with GPS receivers? Geophys. Res. Lett. 2009, 36, 41–52. [Google Scholar] [CrossRef]
  7. Larson, K.M.; Nievinski, F.G. GPS snow sensing: Results from the EarthScope plate boundary observatory. GPS Solut. 2013, 17, 41–52. [Google Scholar] [CrossRef]
  8. McCreight, J.L.; Small, E.E.; Larson, K.M. Snow depth, density, and SWE estimates derived from GPS reflection data: Validation in the western US. Water Resour. Res. 2014, 50, 6892–6909. [Google Scholar] [CrossRef]
  9. Larson, K.M.; Small, E.E.; Gutmann, E.D.; Bilich, A.L.; Braun, J.J.; Zavorotny, V.U. Use of GPS receivers as a soil moisture network for water cycle studies. Geophys. Res. Lett. 2008, 35, L24405. [Google Scholar] [CrossRef]
  10. Chew, C.; Small, E.E.; Larson, K.M. An algorithm for soil moisture estimation using GPS-interferometric reflectometry for bare and vegetated soil. GPS Solut. 2016, 20, 525–537. [Google Scholar] [CrossRef]
  11. Jiang, Y.; Zhang, R.; Sun, B.; Wang, T.; Zhang, B.; Tu, J.; Nie, S.; Jiang, H.; Chen, K. GNSS-IR Soil Moisture Retrieval Using Multi-Satellite Data Fusion Based on Random Forest. Remote Sens. 2024, 16, 3428. [Google Scholar] [CrossRef]
  12. Liu, L.; Larson, K.M. Decadal changes of surface elevation over permafrost area estimated using reflected GPS signals. Cryosphere. 2018, 12, 477–489. [Google Scholar] [CrossRef]
  13. Hu, Y.; Liu, L.; Larson, K.M.; Schaefer, K.M.; Zhang, J.; Yao, Y. GPS interferometric reflectometry reveals cyclic elevation changes in thaw and freezing seasons in a permafrost area (Barrow, Alaska). Geophys. Res. Lett. 2018, 45, 5581–5589. [Google Scholar] [CrossRef]
  14. Hu, Y.; Wang, J.; Li, Z.; Peng, J. Ground surface elevation changes over permafrost areas revealed by multiple GNSS interferometric reflectometry. J. Geod. 2022, 96, 56. [Google Scholar] [CrossRef]
  15. Xu, T.; Wang, N.; He, Y.; Li, Y.; Meng, X.; Gao, F.; Lopez-Baeza, E. GNSS Reflectometry-Based Ocean Altimetry: State of the Art and Future Trends. Remote Sens. 2024, 16, 1754. [Google Scholar] [CrossRef]
  16. Löfgren, J.S.; Haas, R.; Scherneck, H.-G. Sea level time series and ocean tide analysis from multipath signals at five GPS sites in different parts of the world. J. Geodyn. 2014, 80, 66–80. [Google Scholar] [CrossRef]
  17. Löfgren, J.S.; Haas, R. Sea level measurements using multi-frequency GPS and GLONASS observations. EURASIP J. Adv. Signal Process. 2014, 2014, 50. [Google Scholar] [CrossRef]
  18. Roussel, N.; Ramillien, G.; Frappart, F.; Darrozes, J.; Gay, A.; Biancale, R.; Striebig, N.; Hanquiez, V.; Bertin, X.; Allain, D. Sea level monitoring and sea state estimate using a single geodetic receiver. Remote Sens. Environ. 2015, 171, 261–277. [Google Scholar] [CrossRef]
  19. Wang, X.; He, X.; Zhang, Q. Evaluation and combination of quad-constellation multi-GNSS multipath reflectometry applied to sea level retrieval. Remote Sens. Environ. 2019, 231, 111229. [Google Scholar] [CrossRef]
  20. Wang, J.; He, X.; Wang, X.; Song, M. Comparative analysis of dynamic correction method in tidal monitoring by GNSS-R. J. Geod. Geodyn. 2020, 40, 811–817. [Google Scholar]
  21. Strandberg, J.; Hobiger, T.; Haas, R. Improving GNSS-R sea level determination through inverse modeling of SNR data. Radio Sci. 2016, 51, 1286–1296. [Google Scholar] [CrossRef]
  22. Strandberg, J.; Hobiger, T.; Haas, R. Real-time sea-level monitoring using Kalman filtering of GNSS-R data. GPS Solut. 2019, 23, 61. [Google Scholar] [CrossRef]
  23. Larson, K.M.; Ray, R.D.; Williams, S.D. A 10-year comparison of water levels measured with a geodetic GPS receiver versus a conventional tide gauge. J. Atmos. Ocean. Technol. 2017, 34, 295–307. [Google Scholar] [CrossRef]
  24. Wang, X.; Niu, Z.; Chen, S.; He, X. A Correction Method of Height Variation Error Based on One SNR Arc Applied in GNSS–IR Sea-Level Retrieval. Remote Sens. 2022, 14, 11. [Google Scholar] [CrossRef]
  25. Wang, X.; Nan, Y.; He, X.; Song, M. GNSS-IR retrieval method with consideration of tidal periodicity of sea level. Acta Geod. Cartogr. Sin. 2024, 53, 482–492. [Google Scholar]
  26. Zhang, Z.; Hu, Y.; Gong, J.; Luo, Z.; Liu, X. Comparison and Analysis of Three Methods for Dynamic Height Error Correction in GNSS-IR Sea Level Retrievals. Remote Sens. 2024, 16, 3599. [Google Scholar] [CrossRef]
  27. Larson, K.M. GPS interferometric reflectometry: Applications to surface soil moisture, snow depth, and vegetation water content in the western United States. WIREs Water. 2016, 3, 775–787. [Google Scholar] [CrossRef]
  28. Lomb, N.R. Least-squares frequency analysis of unequally spaced data. Astrophys. Space Sci. 1976, 39, 447–462. [Google Scholar] [CrossRef]
  29. Bennett, G. The calculation of astronomical refraction in marine navigation. J. Navig. 1982, 35, 255–259. [Google Scholar] [CrossRef]
  30. Böhm, J.; Möller, G.; Schindelegger, M.; Pain, G.; Weber, R. Development of an improved empirical model for slant delays in 560 the troposphere (GPT2w). GPS Solut. 2015, 19, 433–441. [Google Scholar] [CrossRef]
  31. Stephenson, A. Harmonic Analysis of Tides Using TideHarmonics. 2016. Available online: https://CRAN.R-project.org/package=TideHarmonics (accessed on 30 June 2025).
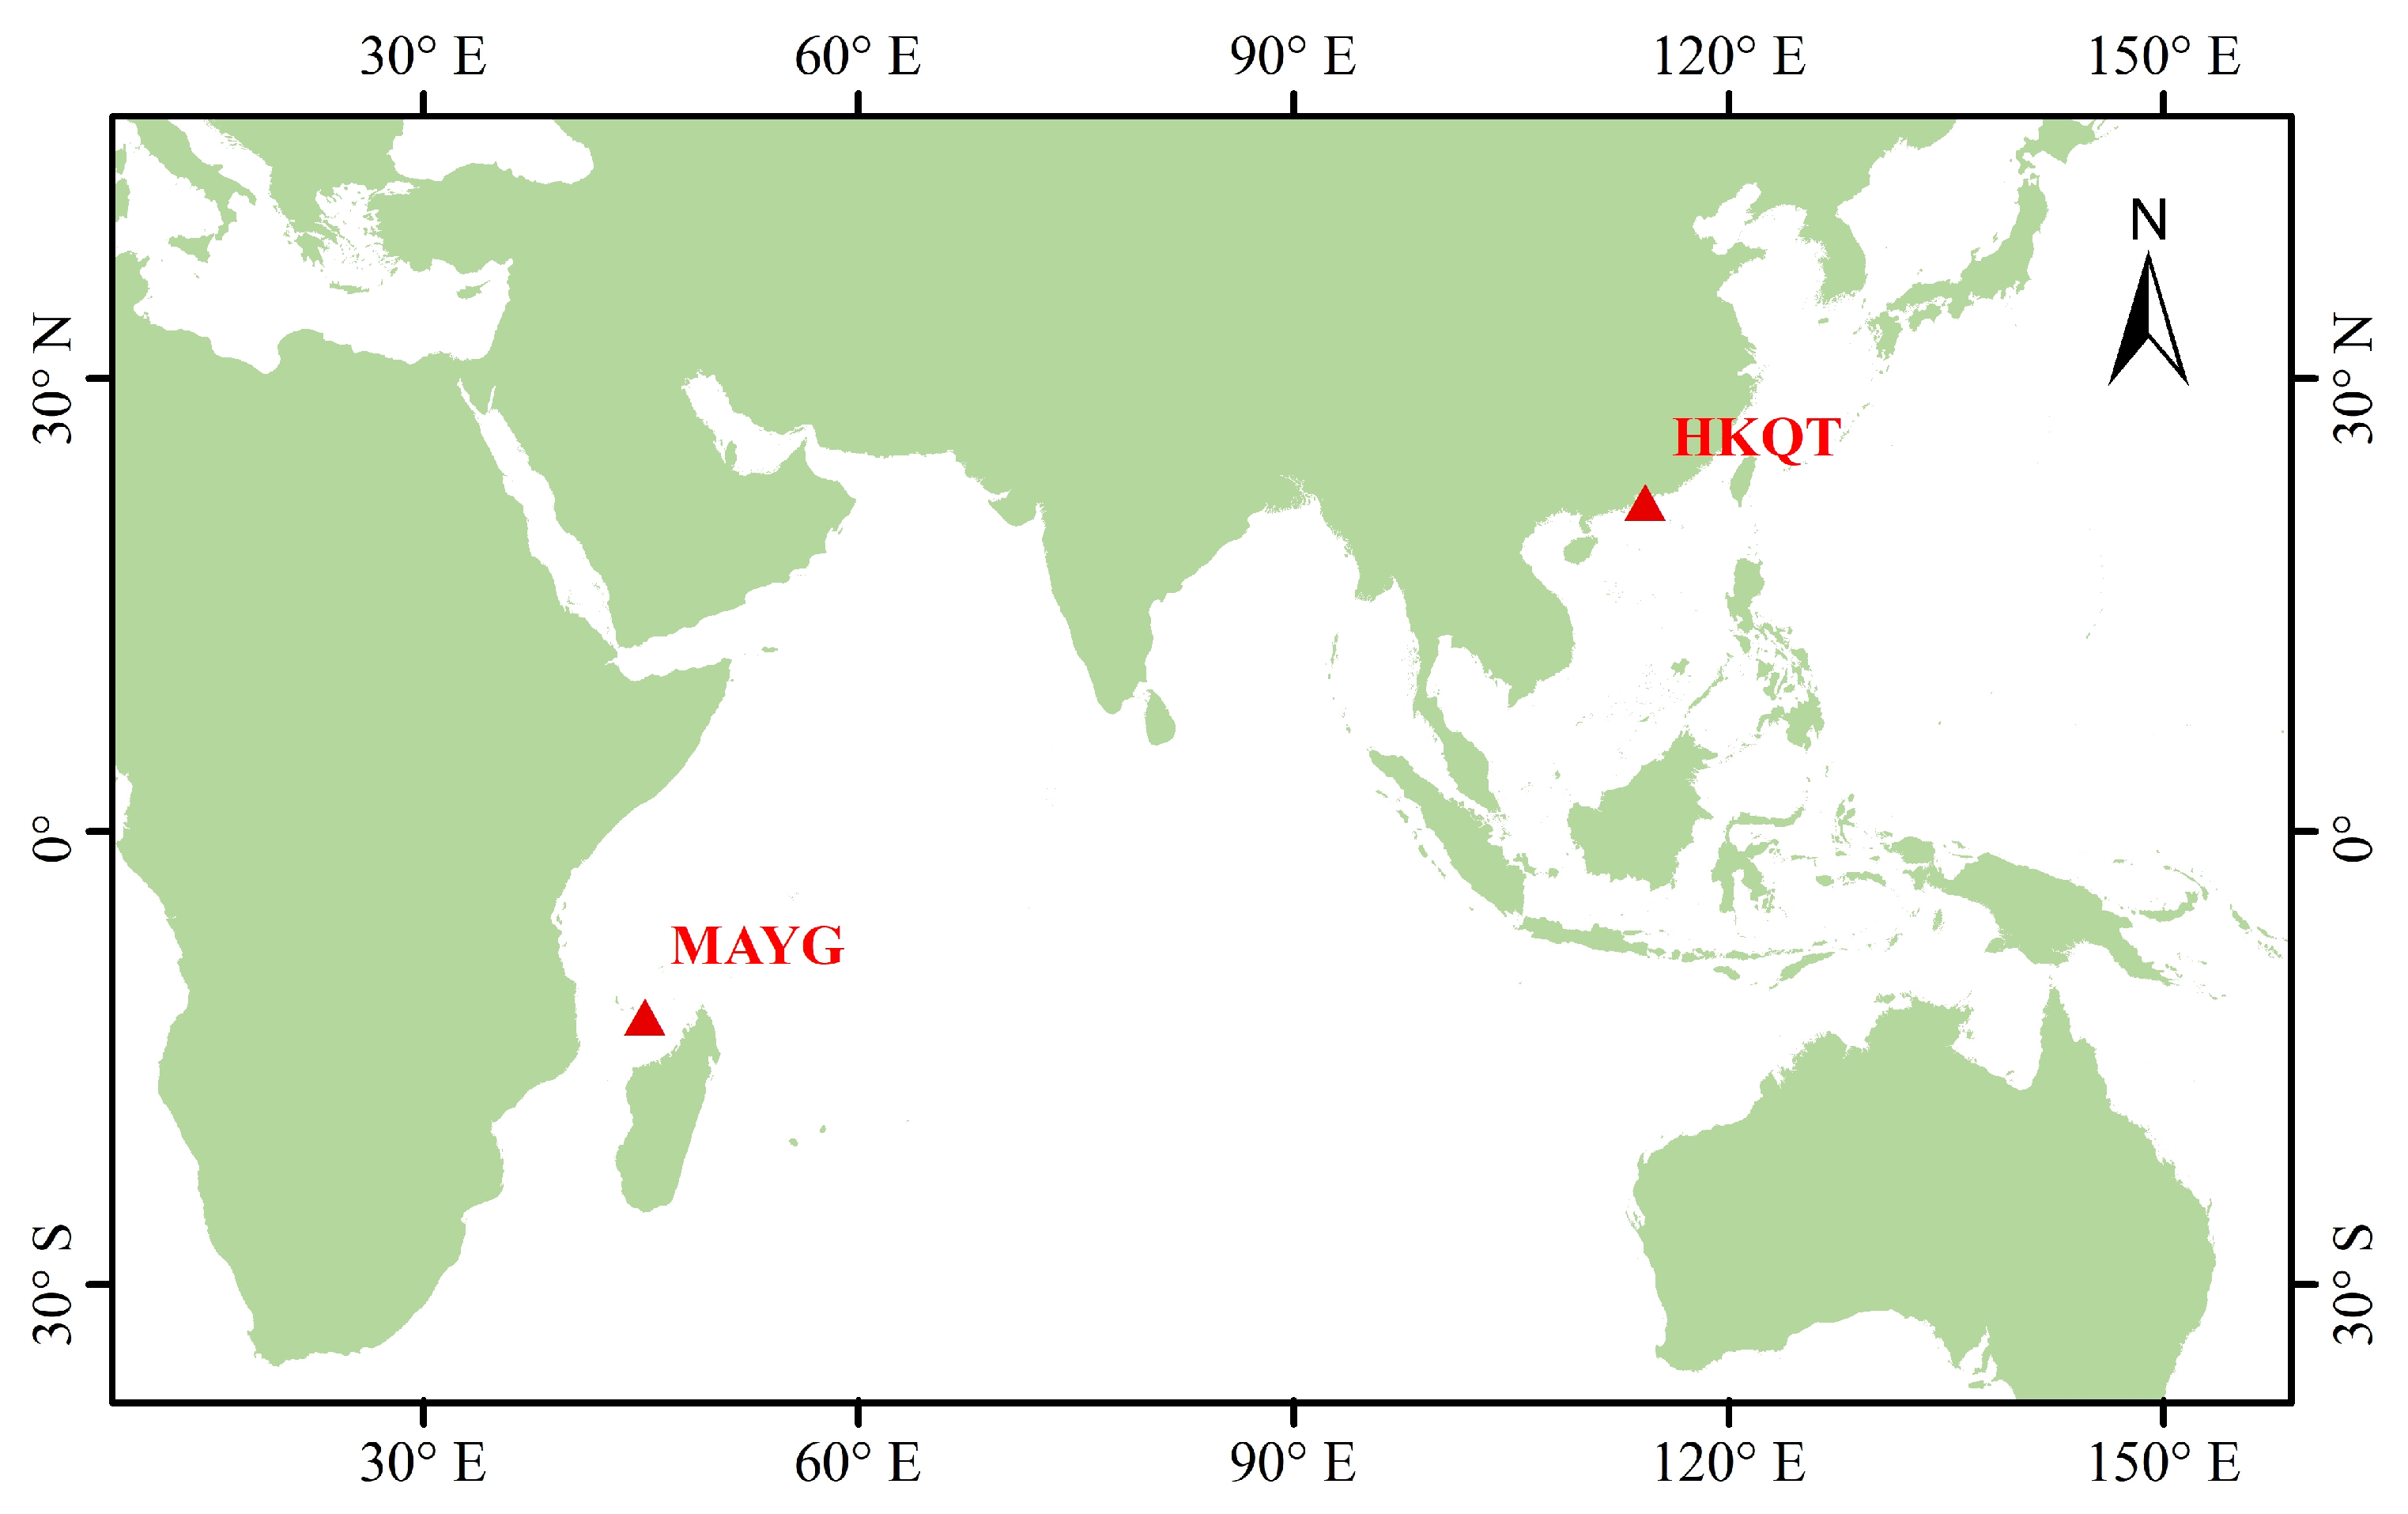
Figure 1. Location map of GNSS stations MAYG and HKQT.
Remotesensing 17 03076 g001
Figure 2. (a) GNSS receiver of the MAYG station; (b) the first Fresnel reflection zones for GPS L1 at MAYG. Ellipses in yellow, blue, and red denote the first Fresnel zones at 5°, 10°, and 15° elevation angles.
Remotesensing 17 03076 g002
Figure 3. (a) GNSS receiver of the HKQT station; (b) the first Fresnel reflection zones for GPS L1 at HKQT. Ellipses in yellow, blue, and red denote the first Fresnel zones at 5°, 10°, and 15° elevation angles.
Remotesensing 17 03076 g003
Figure 4. Sketch of the GNSS-IR for measuring sea level.
Remotesensing 17 03076 g004
Figure 5. Flowchart of the proposed integrated method.
Remotesensing 17 03076 g005
Figure 6. Example of the step-by-step implementation of the proposed method, demonstrated using GPS L1 data from HKQT on 1 January 2018. (a) Preliminary GPS sea level retrievals. (b) Tidal analysis of the sea level retrievals. (c) Interpolation of data gaps based on tidal analysis. (d) Cubic spline fitted to the enhanced sea level retrievals. (e) Dynamic height errors corrected with cubic spline fitting. (f) Corrected sea level retrievals after removing interpolated data.
Remotesensing 17 03076 g006
Figure 7. Comparison of sea levels retrieved by GNSS-IR for each system and frequency at MAYG and Dzaoudzi tide gauge station. The dynamic height error in GNSS-IR sea level retrievals has been corrected using our method.
Remotesensing 17 03076 g007
Figure 8. GNSS-IR sea level retrieval errors at MAYG. Red lines represent the biases of GNSS-IR sea level retrievals corrected with our method, while blue lines represent the biases of original GNSS-IR sea level retrievals.
Remotesensing 17 03076 g008
Figure 9. Comparison of sea levels retrieved by GNSS-IR for each system and frequency at HKQT and Quarry Bay tide gauge station. The dynamic height error in GNSS-IR sea level retrievals has been corrected using our method.
Remotesensing 17 03076 g009
Figure 10. GNSS-IR sea level retrieval errors at HKQT. Red lines represent the biases of GNSS-IR sea level retrievals corrected with our method, while blue lines represent the biases of original GNSS-IR sea level retrievals.
Remotesensing 17 03076 g010
Figure 11. The comparisons of data loss during the dynamic height error correction for different methods at MAYG station and HKQT station.
Remotesensing 17 03076 g011
Figure 12. Time series of the GNSS-IR sea level retrievals at HKQT and tide gauge measurements during Typhoon Hato. The black dashed lines mark the storm surge period from 23:00 UTC on 22 August 2017 to 06:00 UTC on 23 August 2017.
Remotesensing 17 03076 g012
Figure 13. Time series of the GNSS-IR sea level retrievals at HKQT and tide gauge measurements during Typhoon Mangkhut. The black dashed lines mark the storm surge period from 00:00 UTC to 06:00 UTC on 16 September 2018.
Remotesensing 17 03076 g013
Table 1. Information on the systems and the frequency bands.
Satellite SystemFrequency BandFrequency (MHz)Wavelength (m)
GPSL11575.420.190
L2C1227.60.244
L51176.450.255
GLONASSG1~1602~0.187
G2~1246~0.241
GalileoE11575.420.190
E5a1176.450.255
E5b1297.1400.248
E5 (E5a + E5b)1191.7950.252
BDSB11561.0980.192
B21207.140.248
B31268.520.236
Table 2. Accuracy statistics of the GNSS-IR sea level retrievals at MAYG station.
Satellite SystemFrequency BandUncorrectedTidal AnalysisCubic Spline FittingOur Method
Number of RetrievalsRMSE (cm)Number of RetrievalsRMSE (cm)Number of RetrievalsRMSE (cm)Number of RetrievalsRMSE (cm)
GPSL1395825.5383013.4389321.7394316.7
L2C10,00726.8977915.6996719.3999715.6
L5858727.9846017.0850020.3858115.0
GLONASSG1613927.4596612.9607523.2612217.1
G2807422.2800313.3798518.3807314.9
GalileoE1314827.4305016.9302725.9313619.4
E5a999431.7982321.4993019.4999114.9
E5b915630.6897820.7910620.4915015.3
E5801528.2786618.4795619.0800414.7
BDSB173422.771813.044521.673415.5
B2143429.0140618.4100824.1143414.6
B3236726.8233917.5193223.0236516.2
Table 3. Accuracy statistics of GNSS-IR sea level retrievals at HKQT station.
Satellite SystemFrequency BandUncorrectedTidal AnalysisCubic Spline FittingOur Method
Number of RetrievalsRMSE (cm)Number of RetrievalsRMSE (cm)Number of RetrievalsRMSE (cm)Number of RetrievalsRMSE (cm)
GPSL1411316.3406912.2406115.3408212.4
L2C885414.9877712.0880112.2881410.8
L5715514.0709611.0706010.170929.2
GLONASSG110,33114.910,2249.810,23312.010,26510.0
G213,19912.613,09910.513,0749.913,1579.7
GalileoE1329715.1327112.5325714.5327411.8
E5a532513.7528010.8528211.953119.0
E5b535414.2531211.2530612.353359.7
E5530313.3525810.5525211.652909.2
BDSB171714.571612.045613.571611.1
B2120014.5119412.297413.0119310.5
Table 4. Accuracy statistics of GNSS-IR sea level retrievals at HKQT station from 21 to 24 August 2017.
Satellite SystemFrequency BandUncorrectedTidal AnalysisCubic Spline FittingOur Method
Number of RetrievalsRMSE (cm)Number of RetrievalsRMSE (cm)Number of RetrievalsRMSE (cm)Number of RetrievalsRMSE (cm)
GPSL13728.82914.42922.43320.4
L2C5120.14815.95112.75111.7
L53617.93413.53215.63414.5
GLONASSG15618.85411.1539.85510.5
G27115.76812.86513.87012.8
GalileoE12628.32626.82426.02316.5
E5a3220.52916.83216.8319.2
E5b3320.83115.63317.63113.3
E53219.03015.23117.7319.1
BDSB1516.7512.849.459.3
B2619.7615.9411.7610.5
Table 5. Accuracy statistics of GNSS-IR sea level retrievals from 14 to 17 September 2018 at HKQT station.
Satellite SystemFrequency BandUncorrectedTidal AnalysisCubic Spline FittingOur Method
Number of RetrievalsRMSE (cm)Number of RetrievalsRMSE (cm)Number of RetrievalsRMSE (cm)Number of RetrievalsRMSE (cm)
GPSL13122.52616.73019.23019.3
L2C5621.34213.85418.25418.9
L54115.43310.5409.1408.2
GLONASSG14921.5397.84616.34715.8
G27514.76312.37210.97311.6
GalileoE12122.11921.62020.31917.4
E5a3620.3257.33510.33512.0
E5b3419.9267.83311.93312.1
E53619.1267.9359.83511.1
BDSB1617.058.4412.667.6
B21111.2108.0119.6119.3
Disclaimer/Publisher’s Note: The statements, opinions and data contained in all publications are solely those of the individual author(s) and contributor(s) and not of MDPI and/or the editor(s). MDPI and/or the editor(s) disclaim responsibility for any injury to people or property resulting from any ideas, methods, instructions or products referred to in the content.