1. Introduction
Midnight collapse is a significant phenomenon observed in the F-region of the ionosphere, characterized by a pronounced reduction in the F-region peak height (HmF2) around midnight. Since its initial observation, this phenomenon has attracted considerable attention from the scientific community. Over the past few decades, researchers have studied midnight collapse using various observational techniques, including incoherent scatter radar (ISR) [
1,
2,
3,
4,
5,
6,
7,
8,
9,
10,
11,
12,
13], airglow observations [
14,
15,
16,
17,
18], and ionosonde measurements [
19,
20,
21,
22,
23,
24,
25,
26], as well as theoretical and empirical modeling [
27,
28,
29].
Nelson and Cogger [
1] reported midnight collapse based on 130 nights of ISR observations conducted between October 1965 and June 1969 at Arecibo, Puerto Rico (18.3°N). Their results indicated that on 85% of the nights, the F-region peak height began to decline around midnight, with height reductions typically ranging between 50 km and 100 km. Subsequent studies by Behnke and Harper [
2], MacPherson et al. [
6], and Vlasov et al. [
15] revealed that the observed midnight collapse is primarily caused by the weakening and subsequent reversal of equatorward-directed meridional winds, which induce a rapid downward motion of ions. Further investigations linked this meridional wind reversal to a rapid increase in the F-region temperature around midnight [
7,
30,
31,
32,
33,
34,
35]. Crary and Forbes [
27], through numerical simulations, and Harper [
3], based on two nights of ISR observations at Arecibo, attributed the meridional wind reversal before and after midnight to shear effects induced by upward-propagating semidiurnal tidal waves. Using ISR measurements from Arecibo, Gong et al. [
8] highlighted the role of tidal waves in meridional wind, electric fields, and ambipolar diffusion in driving midnight collapse. Dandenault and Richards [
20] examined the midnight collapse phenomenon using ionosonde data from Townsville, Australia (19.6°S), combined with the Field Line Interhemispheric Plasma (FLIP) model. Their findings demonstrated that 24 h, 12 h, and 8 h tidal components in meridional wind, as derived from the FLIP model, play a dominant role in the occurrence of midnight collapse. Similarly, Lei et al. [
28], utilizing numerical models and ISR observations from Millstone Hill, USA (42.6°N), investigated midnight collapse during the September 1998 geomagnetic storm, concluding that meridional winds were the primary driver of the collapse. In a more recent study, Zhou et al. [
36] discussed that the nearly 45° dip angle at Arecibo is most conducive to the occurrence of traveling ionosphere disturbances and midnight collapse.
Despite these advancements, several key aspects of midnight collapse remain underexplored. In particular, statistical analyses of its occurrence and characteristics are lacking. Furthermore, an intriguing yet less-studied phenomenon is the occurrence of a secondary collapse immediately following the primary midnight collapse. To address these gaps, this study conducts a comprehensive statistical analysis of midnight collapse using nearly all available Arecibo “world-day” data. Additionally, we investigate the occurrence and characteristics of secondary collapses at Arecibo—an aspect that has received limited attention in previous research. Finally, we discuss the mechanisms responsible for these collapses. The structure of this paper is as follows:
Section 2 describes the Arecibo ISR dataset and the methodology employed in this study.
Section 3 presents the results and discussion, followed by conclusions in
Section 4.
2. Data and Methodology
This study analyzes data collected between 1971 and 2019 at the Arecibo Observatory in Puerto Rico (18.3°N, 66.7°W). The Arecibo ISR operated from its establishment in 1963 until its collapse on December 1, 2020. Throughout its operational period, the radar functioned for approximately 40 days each year, with 20 of these days dedicated to “world-day” observations—an internationally coordinated operational mode for incoherent scatter radars [
37]. While “world-day” data are generally made available in public online databases, the actual volume and format of uploaded data vary each year due to different control measures. In this study, we utilize 396 nights of Arecibo ISR measurements from 1971 to 2019, representing all available “world-day” data retrieved from the database.
ISR radar employs multiple techniques to investigate the ionosphere, deriving electron density and line-of-sight (LOS) velocity from ion line power spectra [
38,
39,
40]. To obtain LOS ion drift measurements in different directions, data from the rotating Gregorian feeds of the Arecibo radar are primarily used [
41,
42]. Sulzer et al. [
42] introduced a linear regression method to derive high-resolution ion vector velocities from LOS measurements at Arecibo. In this approach, LOS velocities can be decomposed into the following three components: one parallel to the geomagnetic field (
) and two perpendicular to the geomagnetic field (
, northward, and
, eastward). The vertical ion drift can be considered a projection of
and
[
8,
42]. The coded long pulse (CLP) technique provides a temporal resolution of 1 min and a spatial resolution of 3 km, while the multi-radar autocorrelation function (MRACF) technique offers a temporal resolution of 90 s and a height resolution of 38.4 km [
43]. Consequently, the dataset used in this study comprises spatial resolutions ranging from 3 km to 38.4 km and temporal resolutions from 1 to 3 min. For datasets with a lower spatial resolution, interpolation is applied to enhance data precision. Although both data types are widely used at Arecibo [
8], the CEDAR Madrigal database contains mostly MRACF data. To ensure data reliability, we exclude nights with missing nighttime observations, including cases where data are absent or key variables are not measured. As a result, we obtain valid nighttime data for 224 nights, which are categorized by season. The four seasons are defined as follows: spring (March–May), summer (June–August), autumn (September–November), and winter (December–February). The distribution of valid observation nights across the seasons is as follows: 39 nights in spring, 48 in summer, 68 in autumn, and 69 in winter.
Midnight collapse refers to a rapid decrease in the peak height of electron density around midnight, though no precise definition exists regarding its timing, altitude range, or other characteristics. For statistical analysis in this study, we define midnight collapse as occurring between 20:00 LT and 4:00 LT, with a peak electron density height (HmF2) reduction of more than 50 km. Multiple collapses of HmF2 can occur around midnight. While the second collapse is rarely reported, it is included here in our statistical analysis. To distinguish between the first and second collapses, we use “midnight collapse” to refer to the first occurrence, whether a single or double event, while “second collapse” specifically denotes the second midnight collapse when present.
Figure 1 illustrates the height–time variations in electron density, along with temporal changes in peak electron density (NmF2) and HmF2, from 16 to 17 August 2011.
Figure 1a presents the electron density variations obtained from the Arecibo ISR measurements. Based on
Figure 1a, HmF2 and NmF2 are extracted, which are shown in
Figure 1b. As shown in
Figure 1b, HmF2 reached 466 km at 21:30 LT on 16 August 2011, before rapidly decreasing to 254 km by 23:00 LT—an abrupt drop of 212 km within 1.5 h. This sharp decline confirms the occurrence of a midnight collapse. Additionally, HmF2 rose to 418 km at 00:50 LT on 17 August before undergoing another rapid decrease to 265 km by 03:00 LT, marking a 153 km drop over 2 h and 10 min. This second sharp decline confirms the occurrence of a second collapse.
It is worth noting that HmF2 also showed two decreases starting before 20:00 LT. However, in this study, decreases in HmF2 occurring before 20:00 LT are excluded. As previously mentioned, only collapses occurring between 20:00 LT and 04:00 LT are recognized as midnight collapses in this study.
3. Results
Several statistical studies have investigated midnight collapse. However, limited research has focused on the second collapse. In this study, we not only analyze the occurrence and variation of midnight collapse, but also examine the occurrence and variation of the second collapse.
Our statistical analysis shows that 94.6% of the 224 observed nights experienced at least one collapse, which is larger than the percentage of 85% reported by Nelson and Cogger [
1]. The probability of midnight collapse was 97.4% in spring, 91.7% in summer, 92.6% in autumn, and 97.1% in winter. Meanwhile, the probability of a second collapse occurring across these 224 nights was 10.2% in spring, 16.7% in summer, 10.3% in autumn, and 33.3% in winter, with the highest occurrence rate observed in winter.
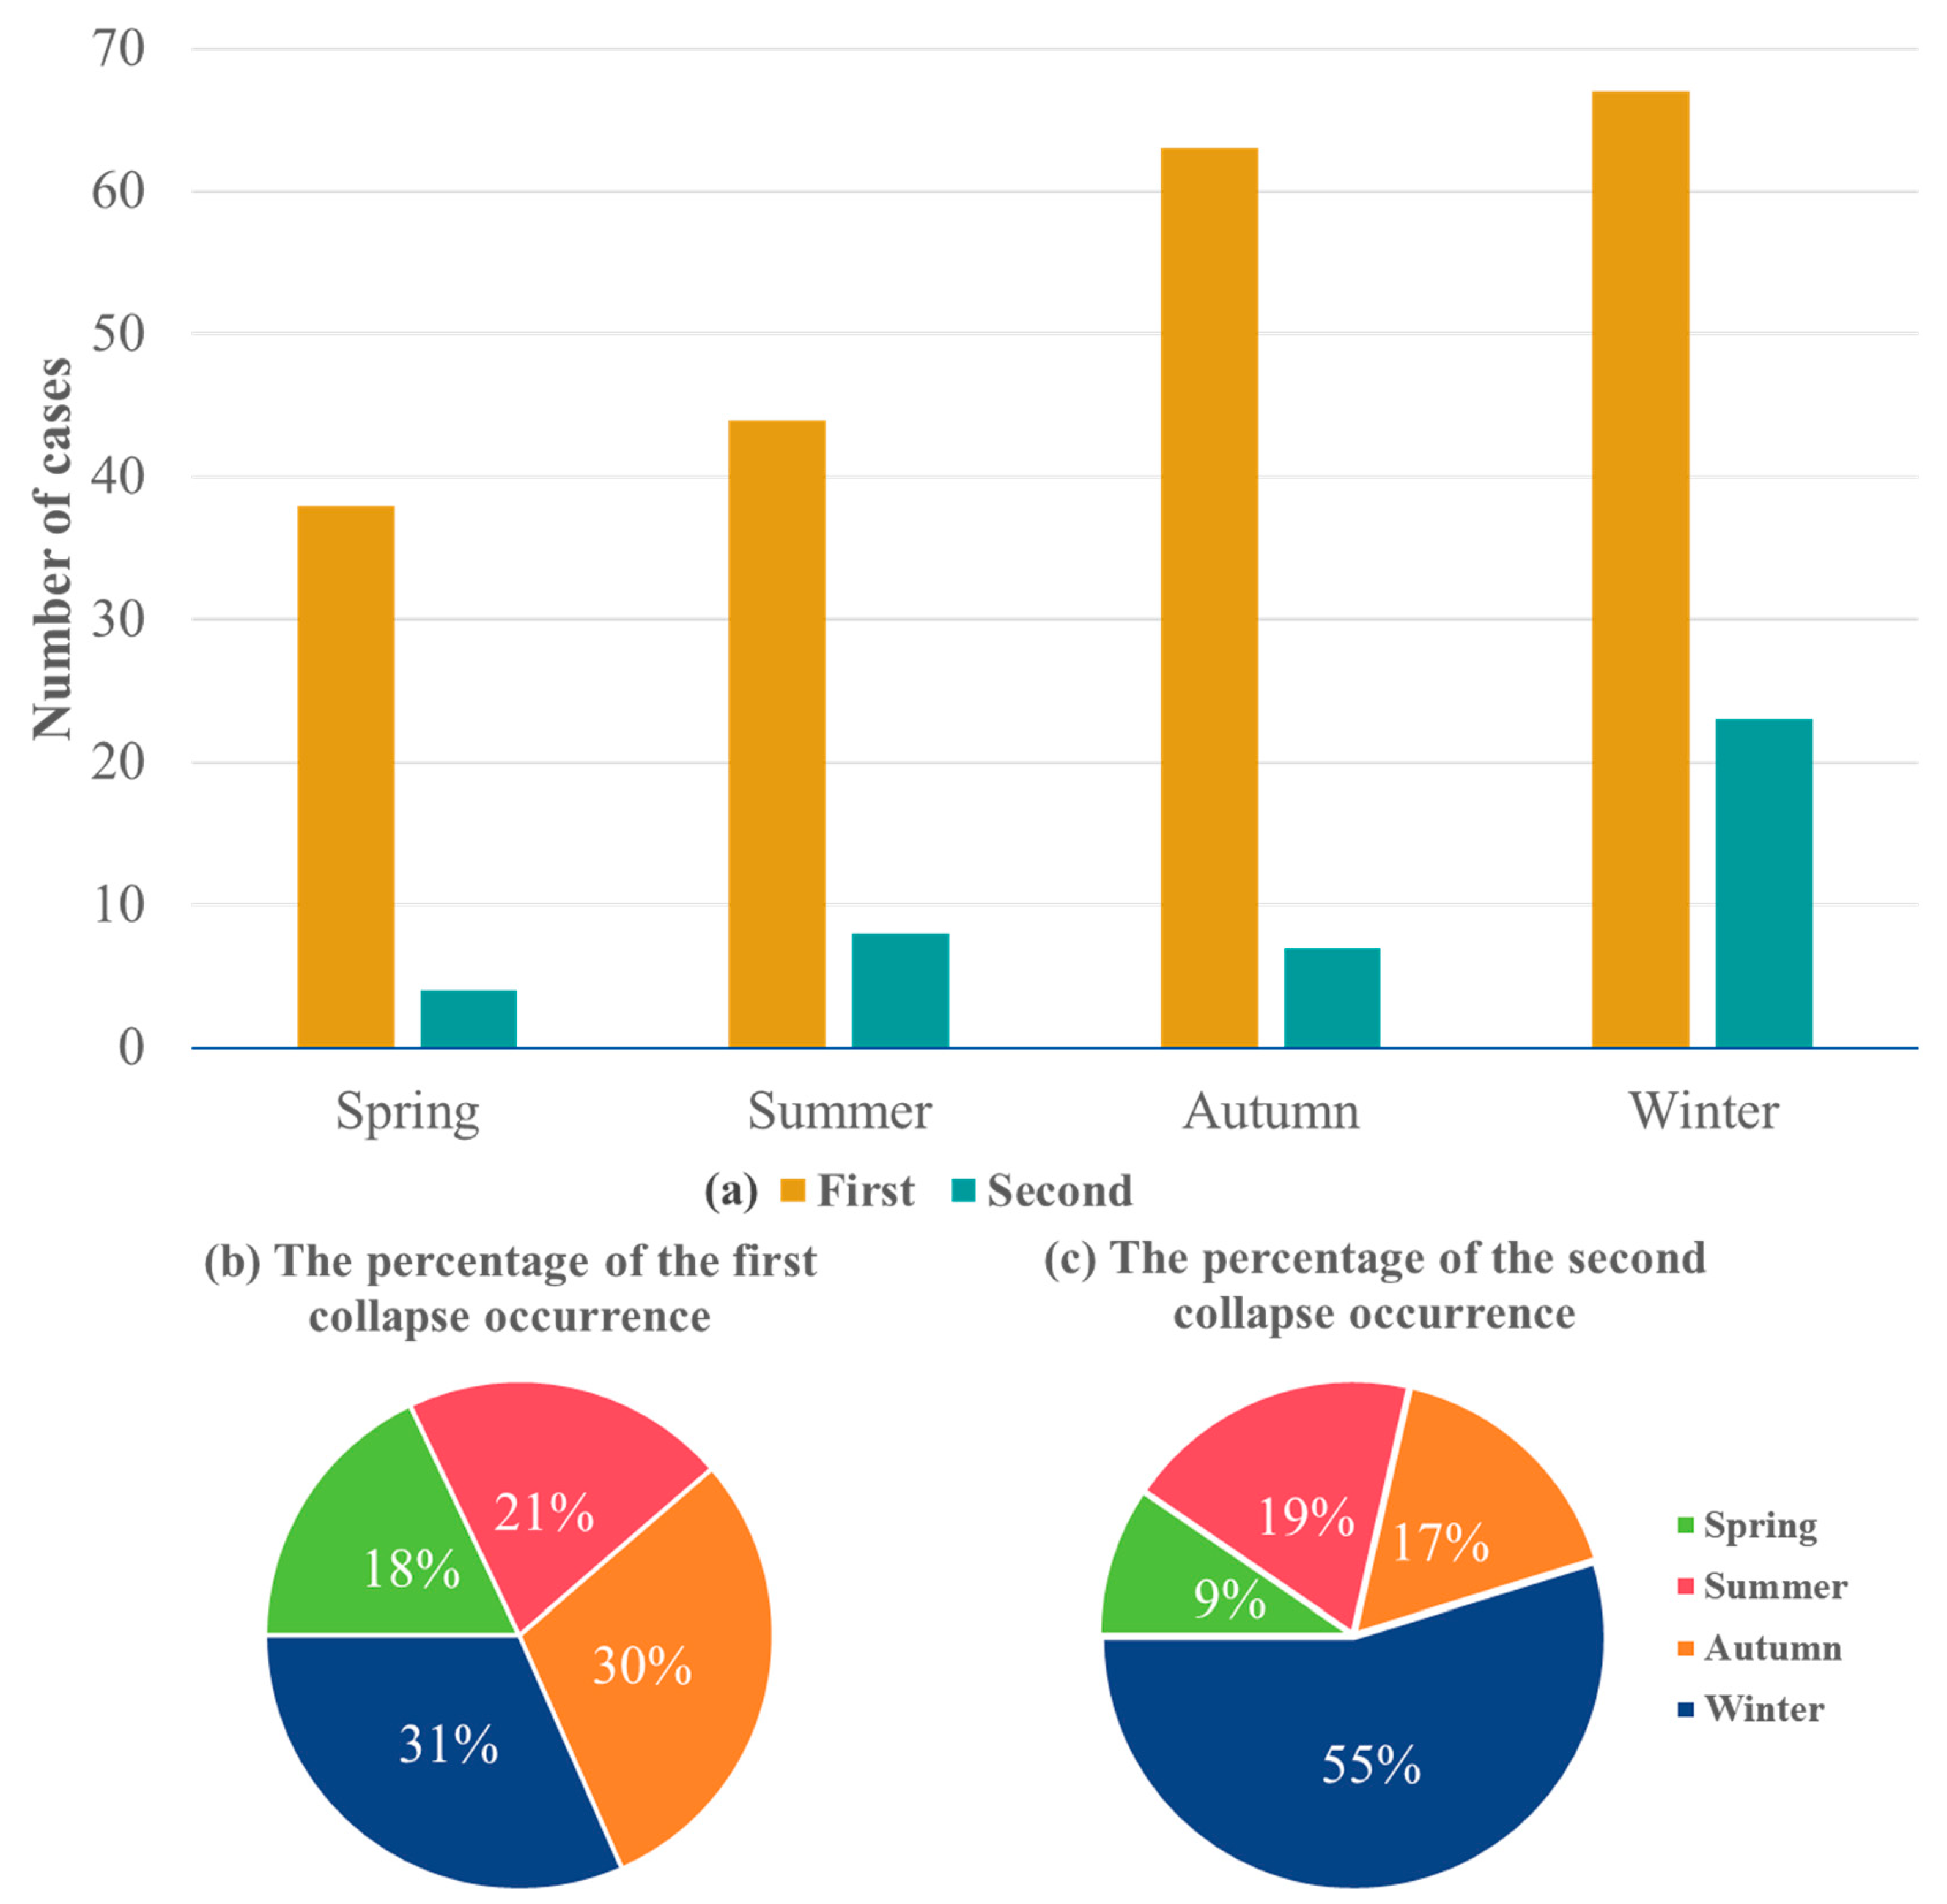
Figure 2 illustrates both the number and seasonal distribution of first and second midnight collapses. As shown in
Figure 2, there were 38 midnight collapses in spring (18% of all midnight collapses), 44 in summer (21%), 63 in autumn (30%), and 67 in winter (31%). Similarly, the distribution of second midnight collapses was as follows: 4 in spring (9% of all second collapses), 8 in summer (19%), 7 in autumn (17%), and 23 in winter (55%). These results indicate that while midnight collapses were relatively evenly distributed across seasons, second collapses occurred most frequently in winter.
3.1. The First Midnight Collapse
Figure 3 presents a statistical analysis of midnight collapse across all observed nights, detailing its onset time (a), duration (b), initial altitude (c), and collapse magnitude (d). The onset time and initial altitude of the collapse are defined as the point at which HmF2 begins a rapid and sustained descent. Descents with a rate of less than 10 km per hour are not classified as midnight collapses. The end time is defined as the moment when the descent rate significantly decreases, and HmF2 transitions to a slower variation or starts to rise.
Figure 3a illustrates the onset time of midnight collapse, which generally corresponds to the peak HmF2 altitude before the collapse begins. The results show that most midnight collapses occurred before 01:00 LT, particularly between 21:00 LT and 00:00 LT, with fewer occurrences after 01:00 LT.
Figure 3b depicts the duration of midnight collapse, representing the time required for HmF2 to decrease from peak to trough. The data indicate that collapse durations typically ranged from 1 to 4 h, with the highest frequency occurring within the 2–3 h range.
Figure 3c shows the initial altitude of the collapse, corresponding to the peak HmF2 value before the decline. The results suggest that the initial height was primarily concentrated between 350 and 400 km.
Figure 3d provides statistics on collapse magnitude, which is defined as the difference between the peak and trough values of HmF2 during the midnight collapse. The data reveal that most collapse magnitudes fell within the 50–150 km range. This distribution may be influenced by our selection of 50 km as the lower threshold for defining a collapse event.
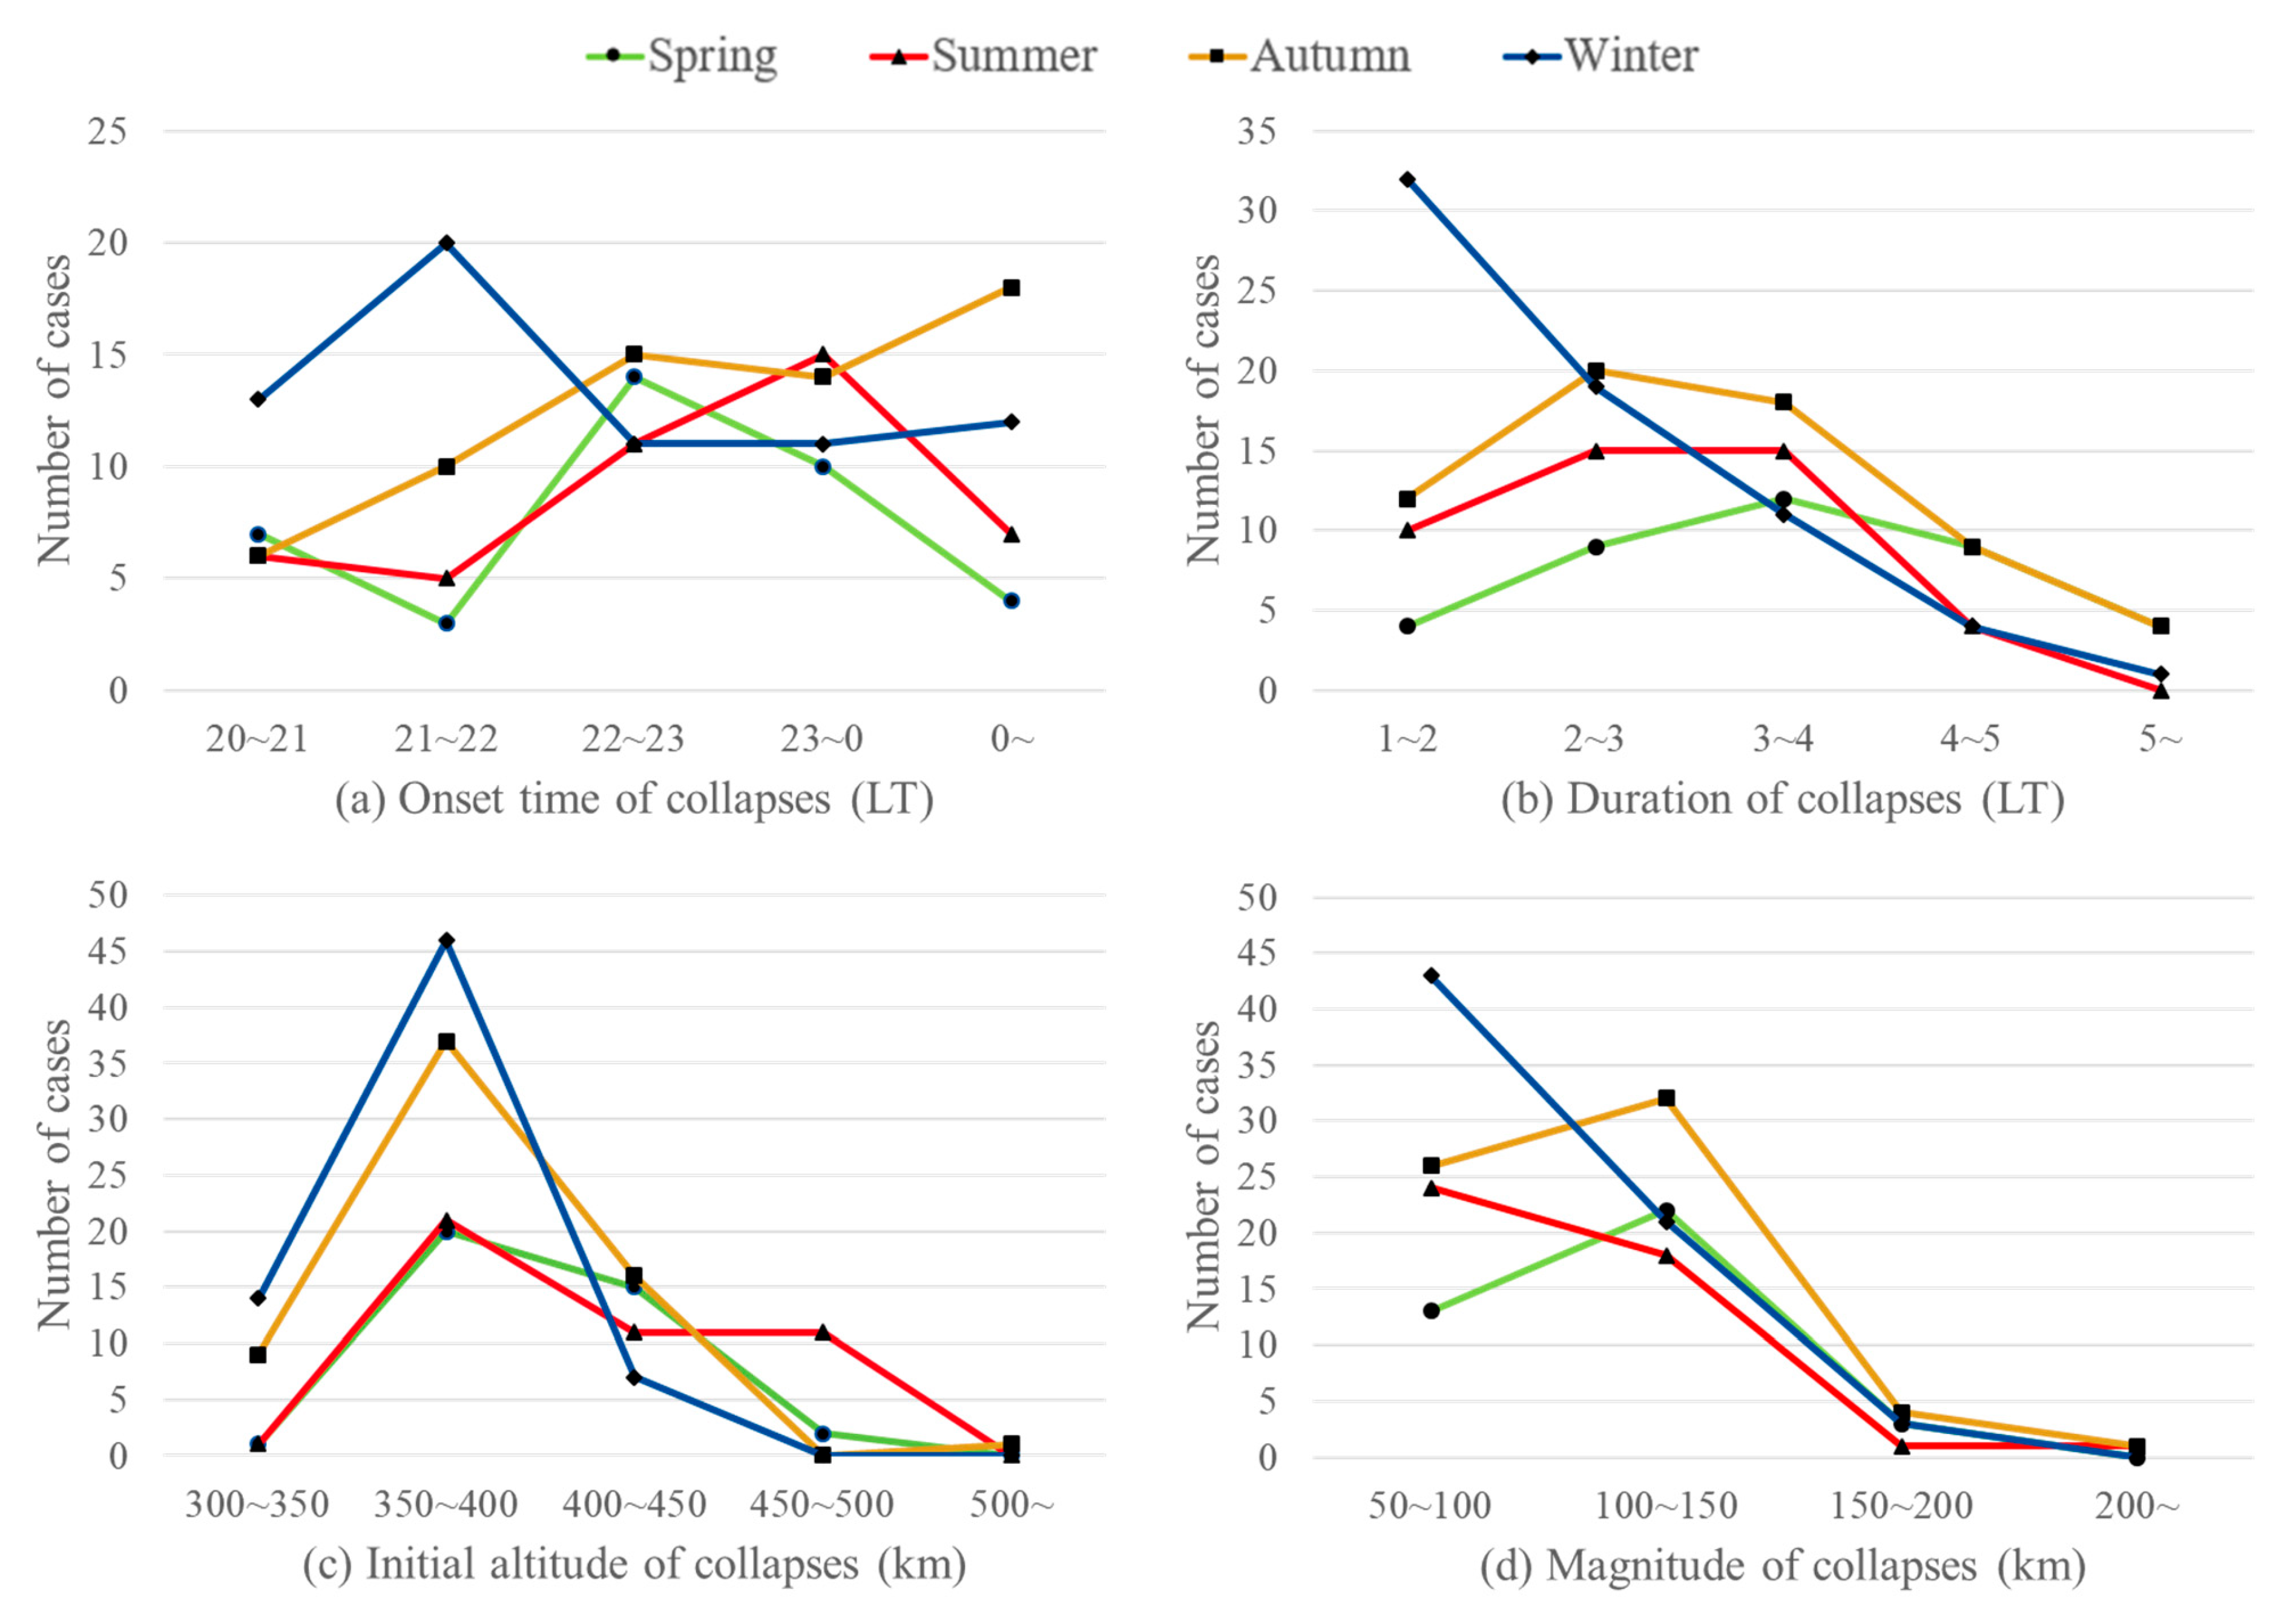
Figure 4 presents a statistical analysis of the onset time (a), duration (b), initial altitude (c), and magnitude (d) of midnight collapses across different seasons. In spring (green), summer (red), and autumn (orange), more than half of all midnight collapses occurred after 22:00 LT. In contrast, winter (blue) exhibited the highest proportion of collapses occurring before 22:00 LT, accounting for nearly 50% of cases. Unlike other seasons, midnight collapses in winter tended to be shorter in duration, often lasting less than 2 h. The initial altitude of midnight collapses remained fairly consistent across all seasons, primarily concentrated between 350 and 400 km. In terms of collapse magnitude, all seasons showed a concentration in the range of 50 to 150 km. However, in spring and autumn, a higher proportion of collapses fell within the range of 100 to 150 km, whereas in summer and winter, the range of 50 to 100 km was more dominant.
In spring, 38 midnight collapses were observed across 39 nights. The onset time was primarily before midnight, with the majority occurring between 22:00 LT and 24:00 LT (totaling 24). Only four collapses occurred after 24:00 LT, and none were observed beyond 01:00 LT. The duration of collapses varied from 1 to 5 h, with most lasting 3–4 h (12 instances). The majority of collapses initiated between 350 and 450 km, with only one occurring below 350 km and two above 450 km. The collapse magnitude was predominantly within the 100–150 km range.
In summer, 44 midnight collapses were recorded across 48 nights. The timing distribution was similar to that of spring, with only one collapse occurring after 01:00 LT. However, the number of collapses initiating between 23:00 and 00:00 LT was slightly higher compared to spring. The duration distribution resembled the overall pattern in
Figure 2, with most collapses lasting from 1 to 5 h, peaking at 2 to 4 h (30 instances). The majority (33 collapses) started between 350 and 450 km, showing a slightly more concentrated distribution than in spring. Only one collapse occurred at a lower altitude of 300 to 350 km. Unlike spring, the collapse magnitudes in summer were more concentrated in the 50 to 100 km range, with only one case exceeding 200 km.
In autumn, 63 midnight collapses were observed across 68 nights, approximately 1.5 times the number recorded in spring. Most collapses occurred after 21:00 LT, with a slightly higher proportion taking place after 24:00 LT compared to other seasons—primarily due to 18 collapses occurring past midnight. Collapse durations were mainly between 1 and 5 h, with a notable proportion lasting over 5 h, similar to the pattern in spring. The collapse magnitude distribution in autumn also closely resembled that of spring, with the 100 to 150 km range being the most common, followed by the range of 50 to 100 km.
In winter, 67 midnight collapses were recorded across 69 nights. The onset time was concentrated before 22:00 LT, with 33 collapses occurring between 20:00 and 22:00 LT. Collapse durations were generally shorter than those in other seasons, typically lasting 1 to 2 h. No collapse was observed with an initial altitude above 450 km. The magnitude distribution was similar to that of summer, with 43 collapses falling within the 50 to 100 km range, followed by 21 collapses within the 100 to 150 km range.
3.2. The Second Midnight Collapse
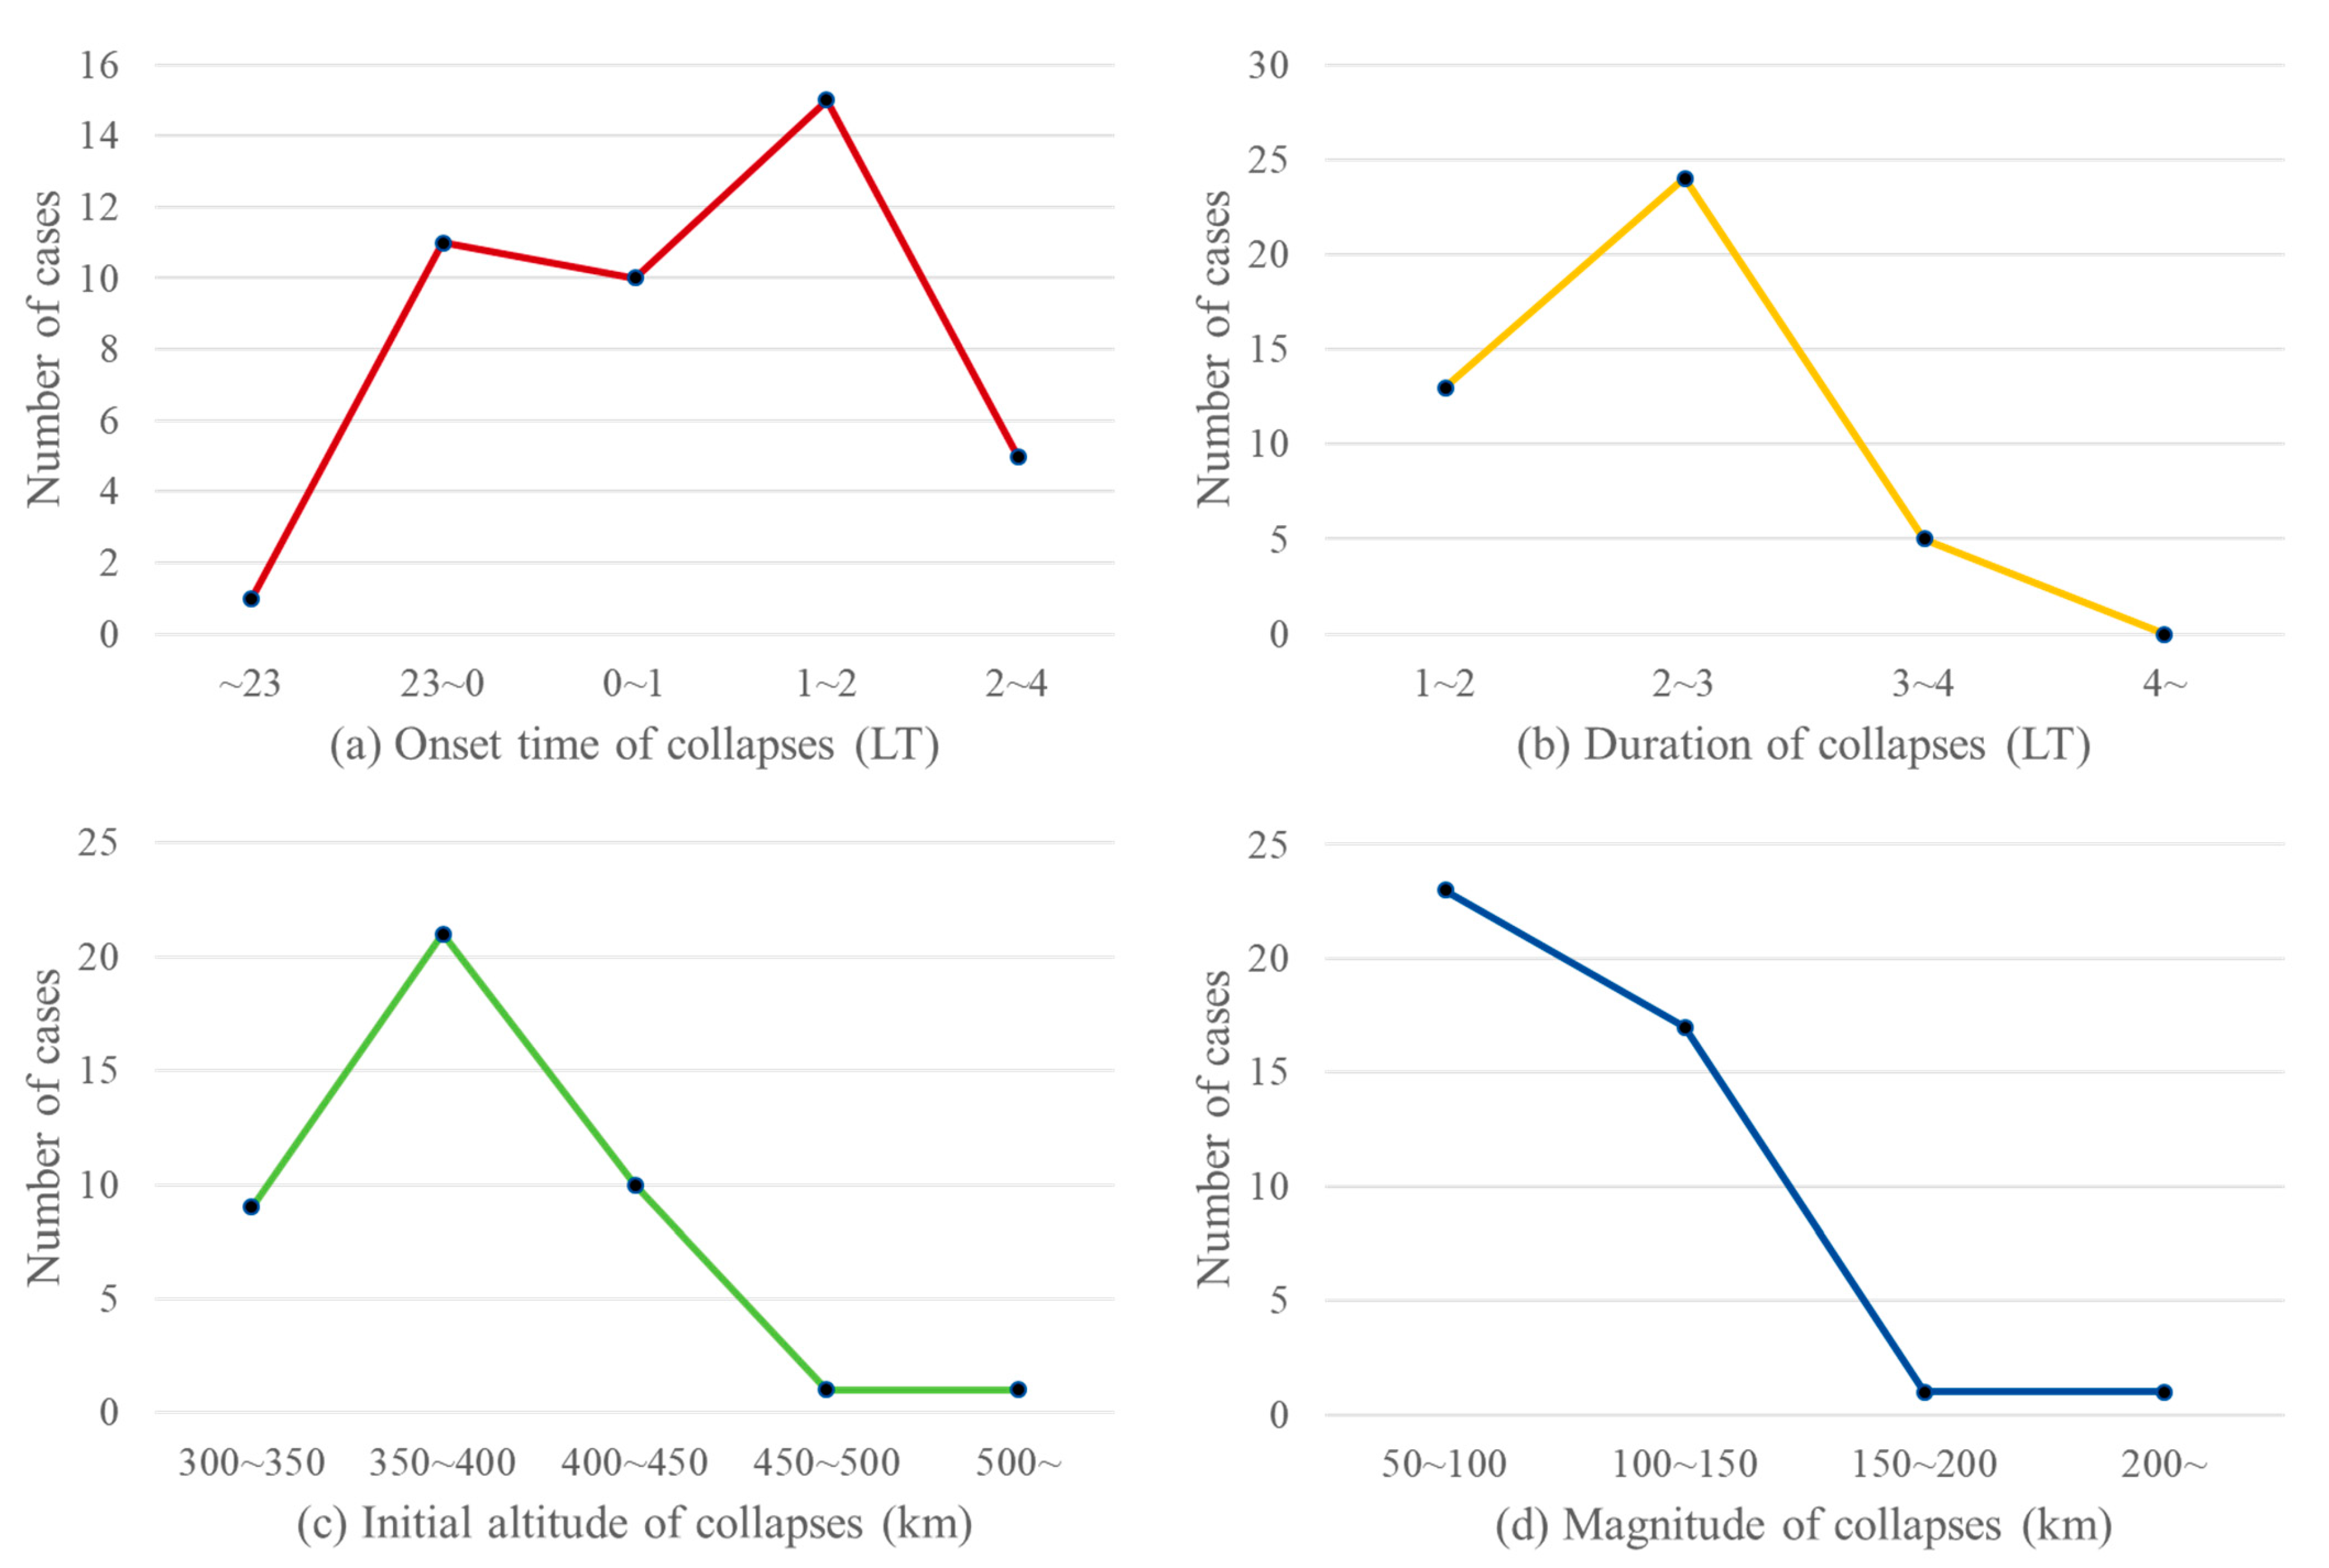
Figure 5 presents statistical data on second midnight collapses, including their onset time (a), duration (b), initial altitude (c), and collapse magnitude (d).
Figure 5a illustrates the onset time of second midnight collapses. They typically occurred after 23:00 LT, with a notable concentration between 23:00 LT and 02:00 LT, where they were observed 36 times.
Figure 5b depicts the duration of second collapses, showing that they generally lasted between 1 and 3 h, with the most common duration being 2 to 3 h (24 occurrences).
Figure 5c displays the initial altitude of second midnight collapses. The data indicate that most second collapses began at altitudes between 300 and 450 km, with only two instances starting above 450 km.
Figure 5d presents the collapse magnitude, showing that the sustained height difference after a second collapse was primarily within the 50 to 150 km range, with just two instances exceeding 150 km.
According to
Figure 2,
Figure 4, and
Figure 5, the duration distribution of first and second collapses was similar, but the initial altitude of the second collapse more frequently fell within the range of 300 to 350 km, whereas the first collapse typically started between 350 and 400 km. Interestingly, samples with initial heights between 300 and 350 km were almost exclusively observed in winter, indicating that the initial altitudes of second collapses during winter were generally lower than those in other seasons. Despite this difference, the magnitude distribution remained consistent, with both types of collapses predominantly falling within the range of 50 to 150 km.
Figure 6 presents seasonal statistics for second midnight collapses, including their onset time (a), duration (b), initial altitude (c), and collapse magnitude (d). Across all seasons, second midnight collapses predominantly occurred after 23:00 LT. In general, collapses lasted between 1 and 3 h, with longer durations being relatively rare, except in autumn and winter (blue). Winter exhibited a distinctive initial altitude distribution, with most collapses occurring below 400 km, whereas in other seasons, they were primarily above 350 km. Despite these variations, collapse magnitudes remained consistent across all seasons, mainly concentrated in the 50 to 150 km range.
In spring, second midnight collapses occurred exclusively before 00:00 LT and after 01:00 LT. The duration was typically between 1 and 3 h, and the initial altitude was largely concentrated between 350 and 450 km. The collapse magnitude was primarily in the range of 50 to 150 km, with no instances exceeding 150 km.
In summer, collapse onset times were more evenly distributed, with occurrences spread across all time periods after 23:00 LT. Most collapses lasted between 1 and 3 h, with no case extending beyond 4 h. Notably, the initial altitudes in summer ranged between 350 and 450 km, with some exceeding 450 km. The collapse magnitude remained largely concentrated within 50 to 150 km, with no instances surpassing 200 km.
In autumn, second midnight collapses mainly occurred after 00:00 LT. Their durations were mostly between 1 and 4 h, similar to summer, with no case lasting beyond 4 h. The initial altitudes largely ranged from 300 to 400 km, with the majority falling within the 350–400 km range. Except for one case with an initial altitude above 500 km, all others were below this threshold. The collapse magnitude remained concentrated within 50 to 150 km, with one instance of larger collapse.
In winter, second midnight collapses predominantly began after 23:00 LT, with durations primarily between 2 and 3 h, aligning with the general trend observed across all collapses. The initial altitudes were mainly concentrated between 350 and 400 km, with fewer collapses occurring at higher altitudes. The magnitude distribution was consistent with other seasons, largely within the range of 50 to 150 km.
4. Discussion
Previous studies [
8] have indicated that the ionospheric midnight collapse over Arecibo is primarily driven by vertical transport processes, suggesting that vertical ion drift (
) plays a dominant role in the formation of such collapses. According to our results, the higher frequency of second midnight collapses in winter may be related to seasonal variations in
and the timing of the first midnight collapse.
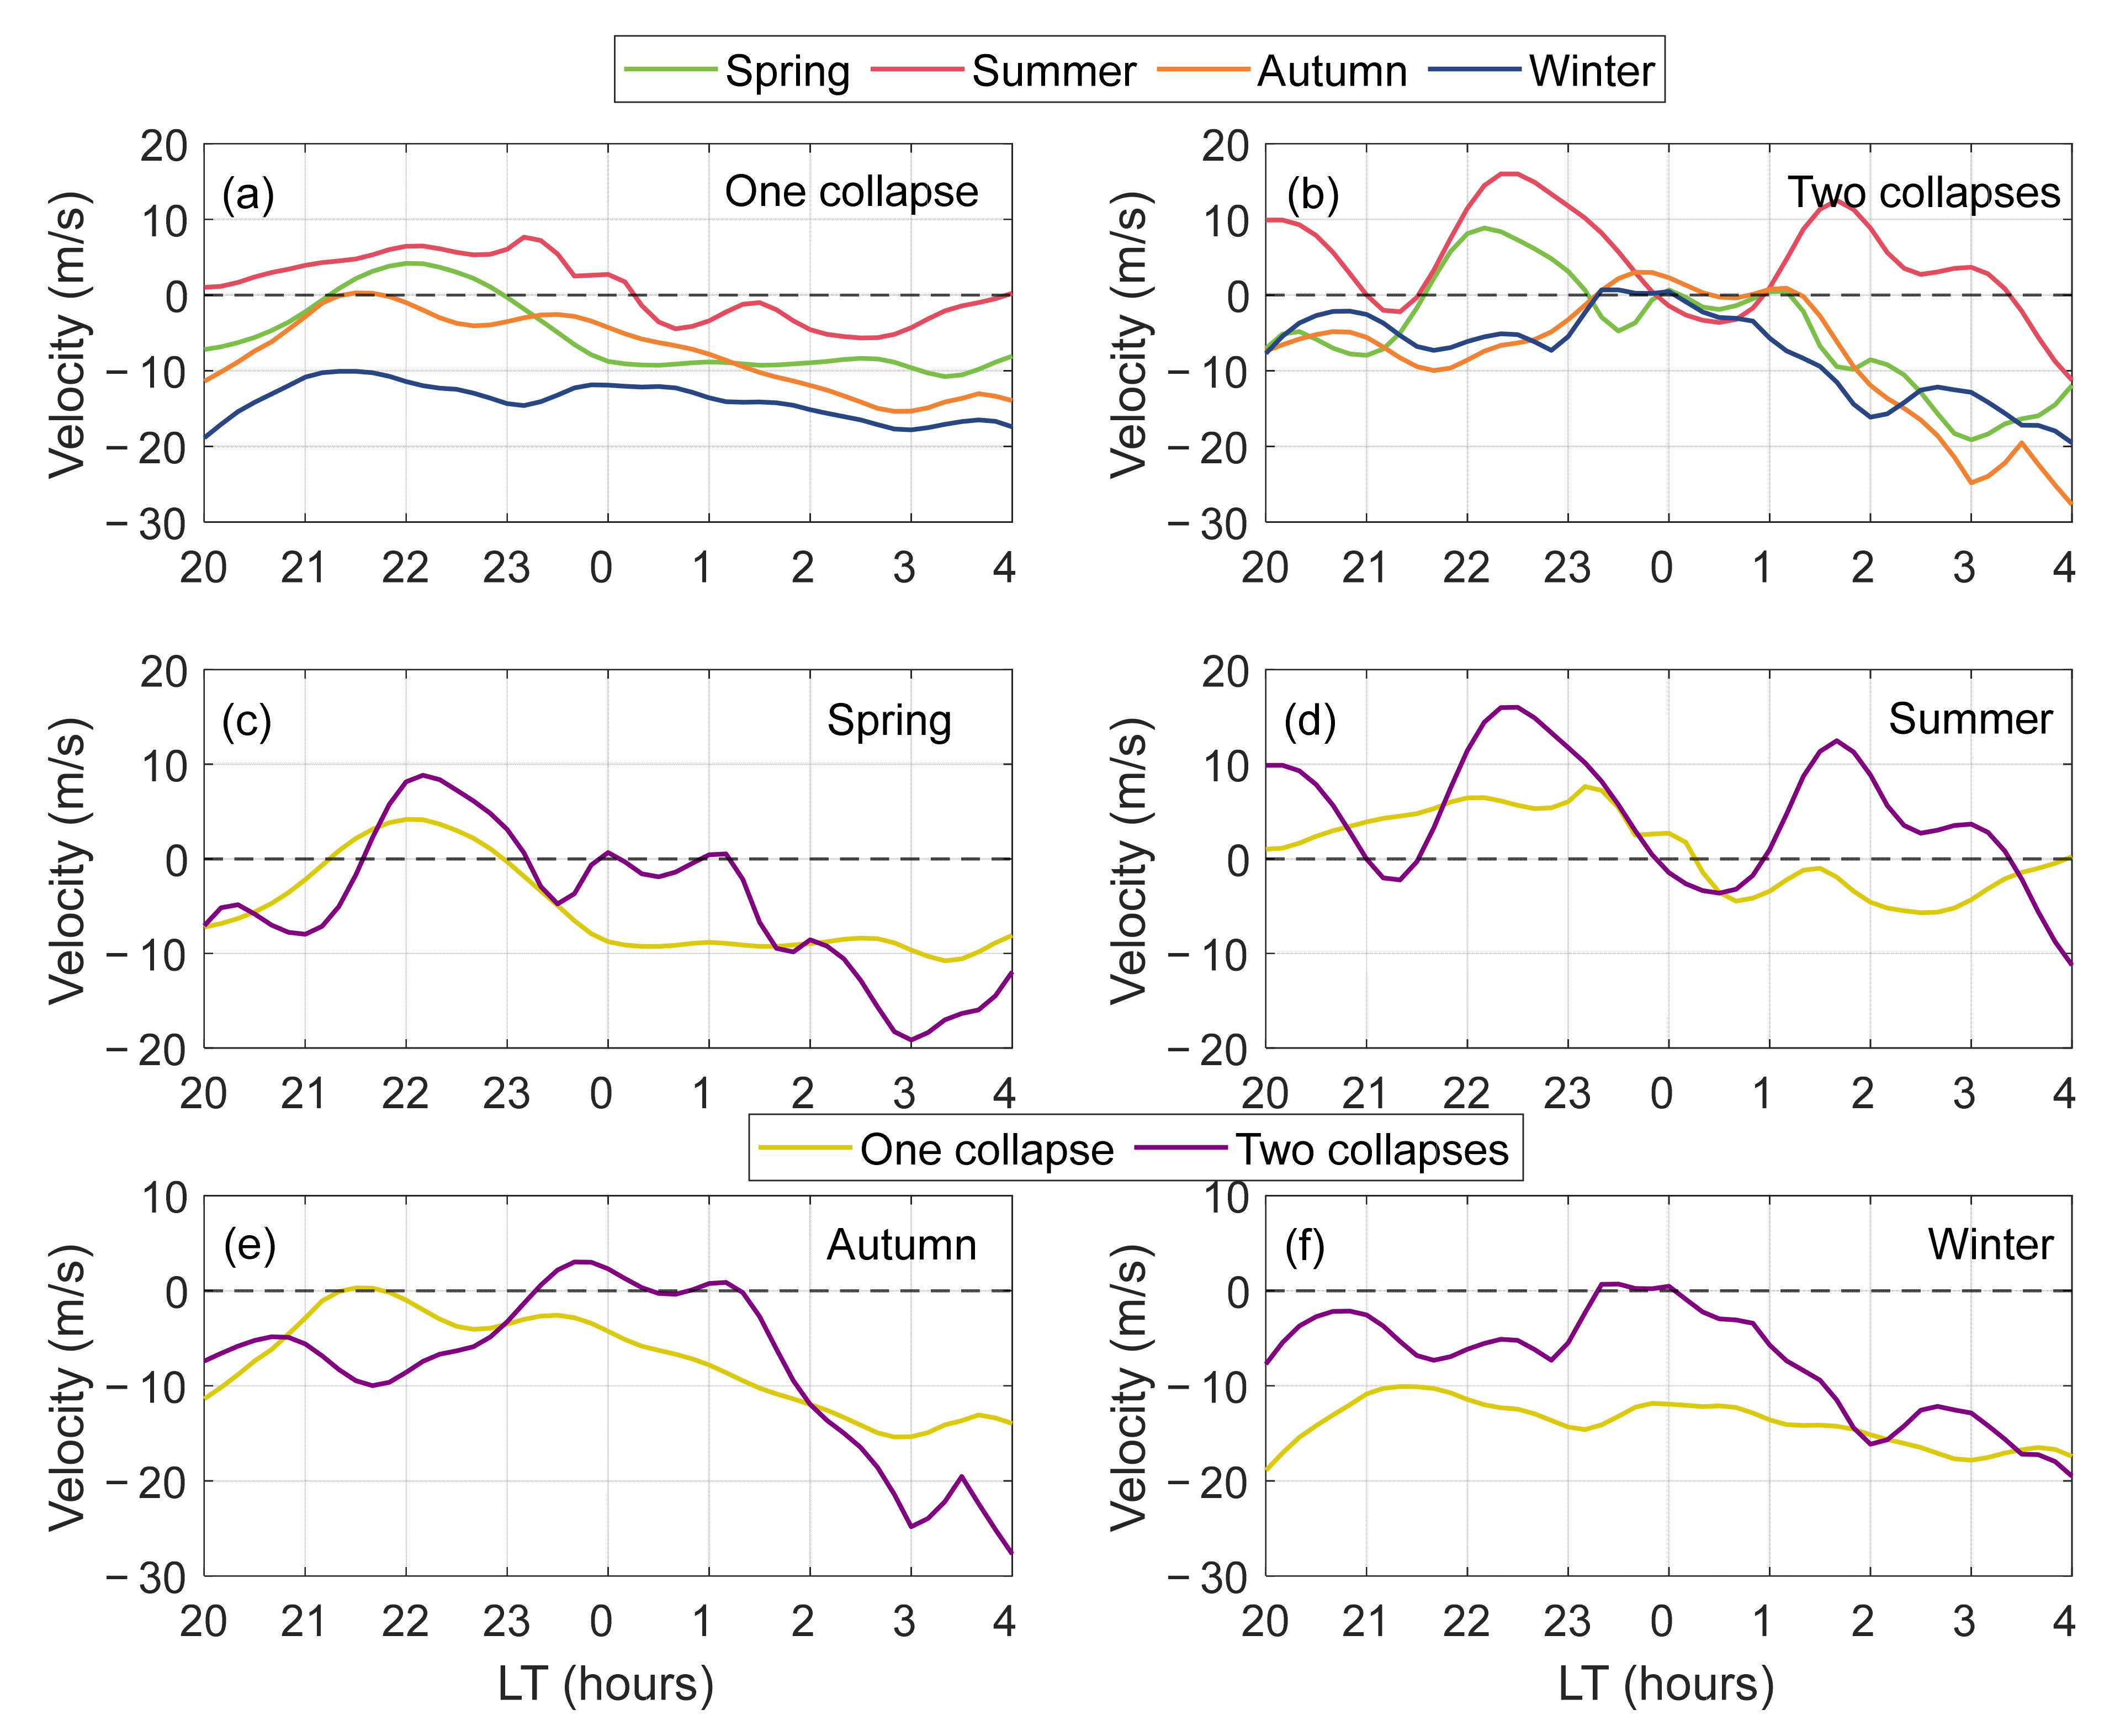
Figure 7 illustrates the diurnal variation in nighttime
across different seasons, where
represents the average value within the 250–400 km altitude range from 20:00 LT to 04:00 LT. The seasonal color scheme in
Figure 7 is consistent with that used in
Figure 6. The time–altitude variation in
for the spring and winter equinox conditions was previously reported by Isham et al. [
44]. Here, we analyze seasonal variations according to the number of collapses per night.
Figure 7a shows cases in which only one midnight collapse occurred, whereas
Figure 7b corresponds to cases with two collapses occurring on the same night. As shown in
Figure 7a, during summer,
is directed upward prior to approximately 00:10 LT, with amplitudes fluctuating around 5 m/s. Afterward,
reverses direction, becoming downward, with peak amplitudes reaching up to 8 m/s. In spring,
transitions from a downward peak to an upward peak between 20:00 LT and 22:00 LT. This is followed by a reduction in amplitude, and by around 23:00 LT,
reverses direction again to become downward, maintaining this direction for the remainder of the night and reaching a maximum amplitude of 10 m/s. In autumn, the pattern is similar to that in spring, but the upward
component is limited to a brief period between 21:10 LT and 22:00 LT and exhibits much smaller amplitudes. The zero-cross time of
(i.e., the time turning from positive to negative) defines the onset times of collapse. For spring and autumn, this time is around 22:00–23:00 LT, which explains why the highest-frequency onset time occurs in this time period in
Figure 4. Similarly, the zero-cross time of
in summer occuring shortly after midnight is consistent with the onset time of this season shown in
Figure 4. Further, the larger overall negative velocity in spring and autumn corresponds to the larger overall magnitude for these two seasons compared to the two other seasons. While the overall variations in
in spring, summer, and autumn are similar, winter displays a markedly different behavior. During the nighttime period,
remains consistently downward. This all-night downward phenomenon in winter was first noted by [
44]. Between 21:00 LT and 01:00 LT, the amplitude hovers around −10 m/s, after which the velocity becomes more negative, reaching approximately −18 m/s at 04:00 LT. Compared to
Figure 7a,
Figure 7b shows that nights with two collapses are generally associated with more oscillations in
. As the change in HmF2 is primarily dictated by vertical transport, more oscillations in
lead to more collapses. To further emphasize the seasonal differences in
behavior between single- and double-collapse nights,
Figure 7c–f illustrate the temporal evolution of
during spring, summer, autumn, and winter, respectively. In each panel, the yellow curve represents nights with a single midnight collapse, while the purple curve corresponds to nights with two collapses. These comparisons offer clearer insight into how
evolves across seasons and how such variations may contribute to the occurrence of the second collapses.
In spring, as shown in
Figure 7c,
on double-collapse nights differs markedly from that on single-collapse nights. After 23:30 LT,
undergoes an additional sequence of directional reversals—first transitioning from a downward maximum to an upward peak near 01:10 LT, followed by another reversal and a gradual increase in amplitude. This pattern suggests that second collapses in spring typically occur after 01:00 LT, which aligns with the statistical results shown in
Figure 6a. In summer,
exhibits an oscillatory structure throughout the night. The first peak and trough pair appears between 20:00 LT and 21:30 LT, while the second occurs between 22:00 LT and 01:00 LT. After 01:00 LT,
becomes predominantly upward. This temporal evolution indicates that in summer, second collapses most frequently occur between 23:00 LT and 01:00 LT. In autumn, as seen from
Figure 7e, during the period from 20:00 LT to 00:00 LT, the temporal variations in
between single- and double-collapse nights are anti-corrected. On double-collapse nights,
is directed upward from approximately 23:10 LT to 01:00 LT, then reverses direction and rapidly increases in amplitude. This behavior accounts for the tendency of second collapses in autumn to occur after 01:00 LT, as indicated in
Figure 6a. In winter, the general trend of
is similar between single- and double-collapse nights. However, on nights with two collapses,
tends to have a lower amplitude and briefly turns upward after 23:00 LT before reverting downward. This brief upward phase may explain the higher frequency of second collapses observed after 23:00 LT in winter. Across
Figure 7c–f, a consistent feature emerges: on nights with two collapses,
turns upward after 00:00 LT in spring, after 21:30 LT in summer, after 23:10 LT in autumn, and after 23:10 LT in winter. In each case, the upward motion is followed by a reversal to downward drift with a gradually increasing amplitude. This recurring pattern may represent a common dynamical mechanism responsible for triggering second midnight collapses.
The vertical ion velocity consists of the following two components: one perpendicular to the geomagnetic field (
) and the other parallel to it (
), as described by Gong et al. [
8]. These components are related through the following equation:
At Arecibo, the dip angle
I is approximately 43.6° [
45], which is close to 45°, implying that the parallel (
) and perpendicular (
) components contribute nearly equally to the vertical ion velocity. As a result, the component with the larger magnitude will have a stronger influence on
. To further investigate the characteristics of
, we examined the seasonal variations in
and
, as well as their differences between nights with a single midnight collapse and those with two collapses. The results are illustrated in
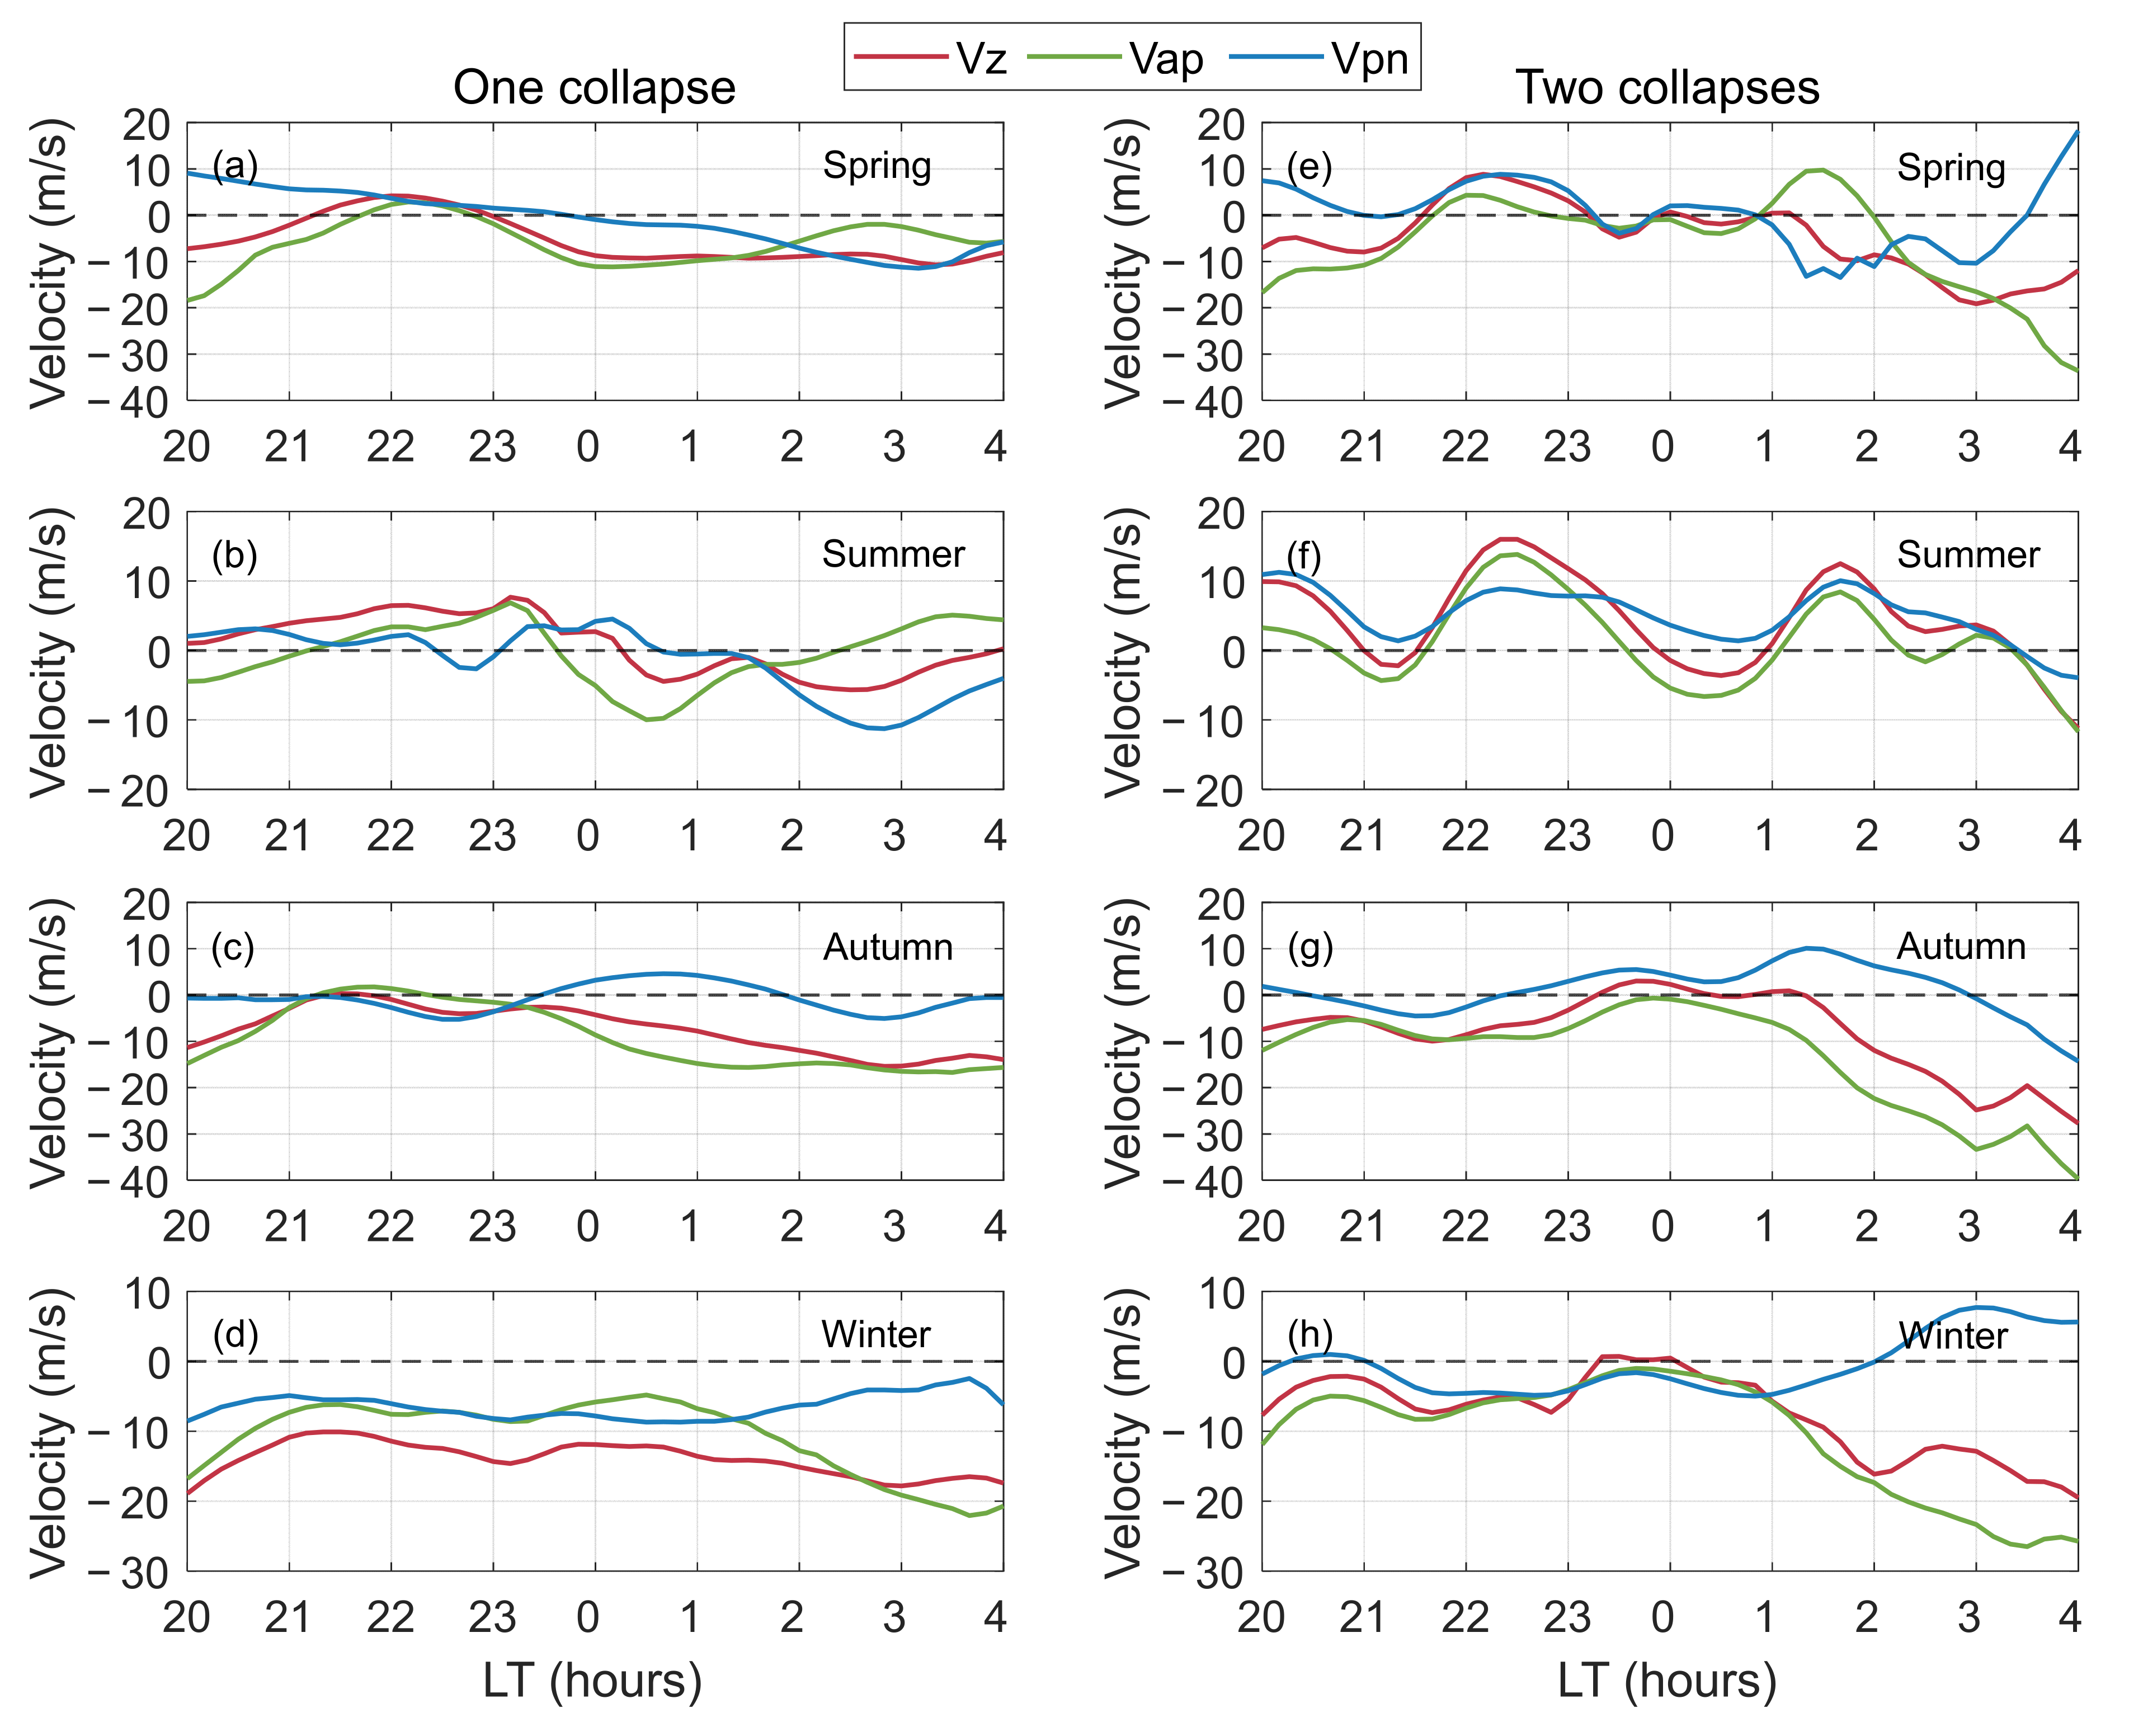
Figure 8, where
(red),
(green), and
(blue) are plotted for spring (top row), summer (second row), autumn (third row), and winter (bottom row). Note that the velocities presented in
Figure 8 are also averaged over the altitude range of 250–400 km. The left column corresponds to nights with a single collapse, while the right column represents nights with two collapses. A general feature of
and
is that they are often anti-correlated. A second feature is that
is typically larger than
, especially during the winter time [
39]. Because of the larger amplitude of
,
often follows the variation in
.
On single-collapse nights (left column of
Figure 8),
exhibits a consistent pattern across all four seasons: its downward amplitude first decreases and then increases. In spring, summer, and autumn,
briefly reverses direction and becomes upward during a small part of the night. In contrast,
remains consistently downward throughout the night in winter. In spring and summer,
generally shows an upward trend with a gradual decrease in amplitude, followed by a reversal to downward flow and an increasing amplitude. This pattern suggests that
gradually drives the ionosphere downward during the night. In autumn,
fluctuates around zero, indicating that
is mainly governed by
. In winter,
remains downward throughout the night with amplitudes near 8 m/s. As previously noted, at Arecibo, the dominant contributor to
is the component (
or
) with the larger amplitude. For single-collapse nights,
contributes more than
in spring and summer, is clearly dominant in autumn, and shares a similar influence to
in winter.
On nights with two collapses (right column of
Figure 8), both
and
exhibit more pronounced perturbations. In spring, variations in
appear to result from the combined effects of
and
. However, during summer, autumn, and winter, the temporal evolution of
is predominantly controlled by
. The key feature observed in
Figure 7, a transition from upward to downward drift followed by an increasing amplitude, can primarily be attributed to changes in
. Therefore, our analysis suggests that fluctuations in the field-aligned component
are the primary driver of ionospheric midnight collapses over Arecibo.
is largely controlled by meridional wind (
) via the following:
where
is the diffusion velocity, whose derivation is described in Gong et al. [
8]. To further investigate the influence of
on
, we analyzed the temporal variations in
across different seasons, as well as during nights with single- and double-collapse events.
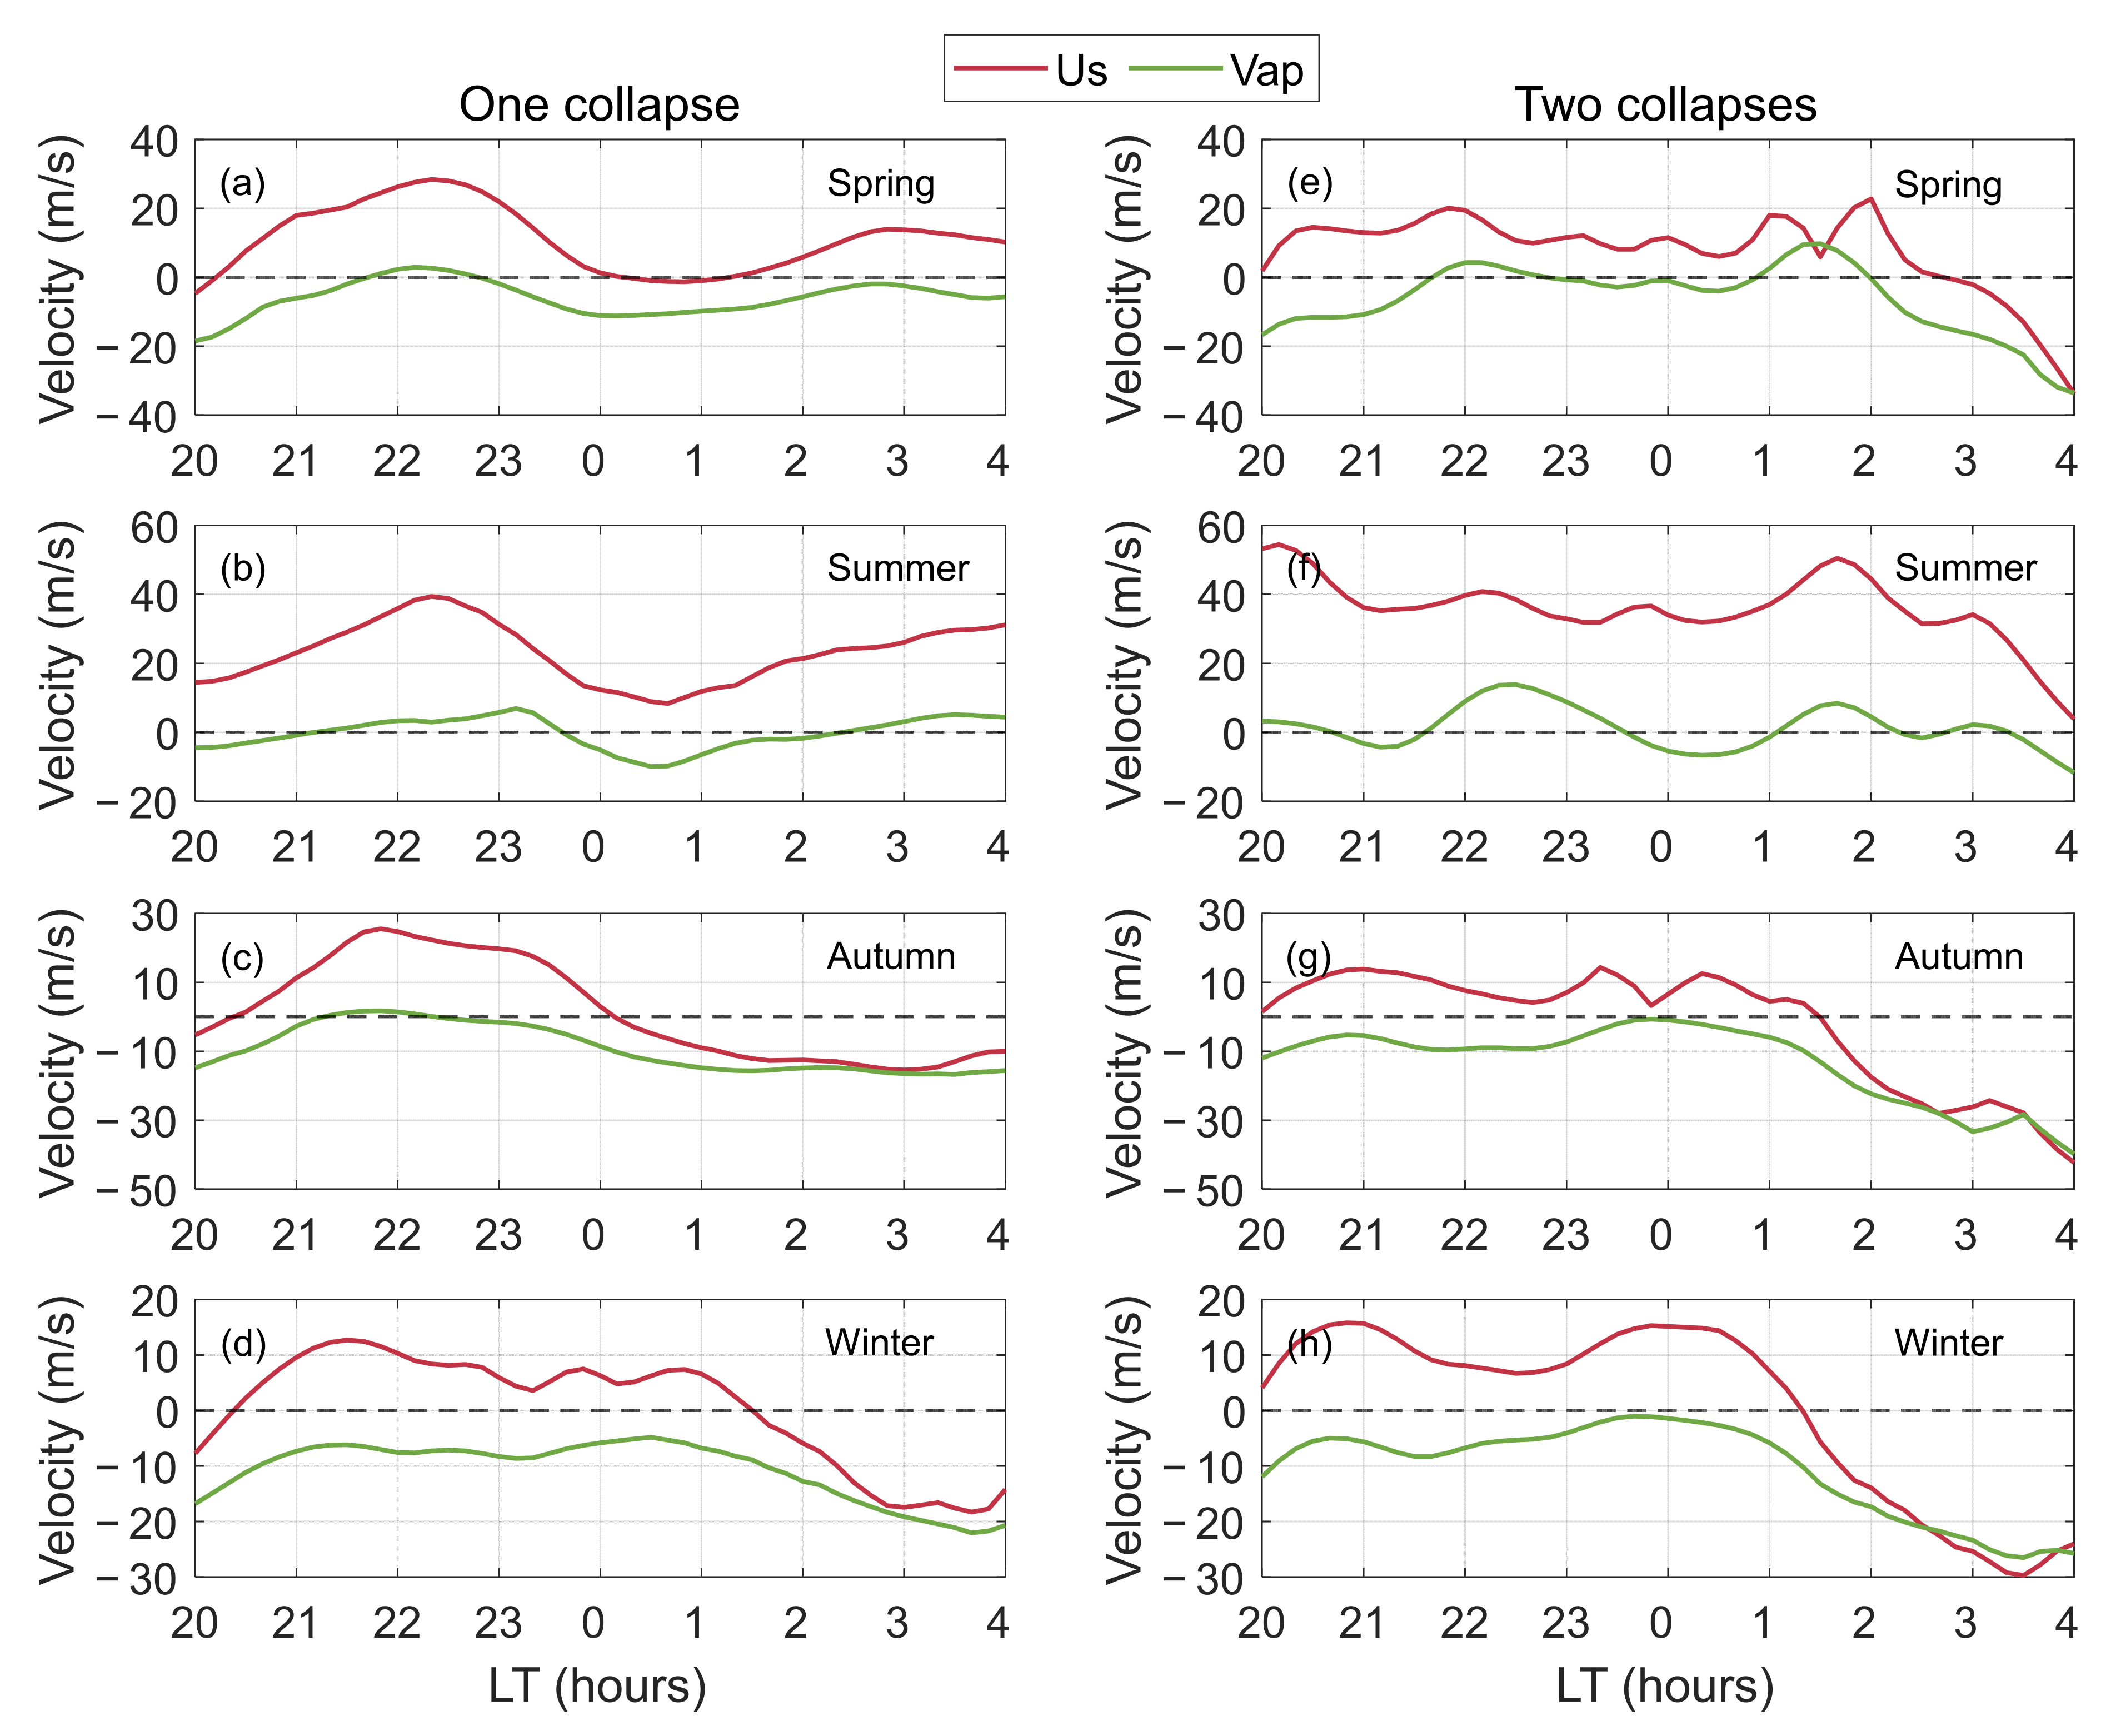
Figure 9 presents the variations in
(red) and
(green) for spring (top row), summer (second row), autumn (third row), and winter (bottom row). The left column shows single-collapse cases, and the right column shows double-collapse cases. As in
Figure 7 and
Figure 8, the results in
Figure 9 are averaged between 250 and 400 km. As shown from
Figure 9,
and
generally exhibit similar temporal patterns. During single-collapse events, meridional wind tends to lift the ionosphere before ~22:00 LT, after which its magnitude gradually decreases. In spring and autumn,
reverses direction around 00:00 LT. In summer,
decreases after ~22:30 LT but does not reverse. In winter,
decreases slowly between 21:00 LT and 01:00 LT, then drops rapidly and reverses at ~01:30 LT. On nights with two collapses,
shows more fluctuations, and the rapid decrease starts later. In spring and summer, the decrease begins around 02:00 LT; in spring, reversal occurs at ~02:30 LT, while in summer, no reversal is observed (similar to single-collapse nights). In autumn,
reverses after 01:30 LT and then drops rapidly. In winter, the rapid decrease begins at 00:30 LT, with reversal around 01:30 LT. Overall, at Arecibo, the nighttime variation in
is strongly governed by
. Future investigations will focus on quantifying the contributions of tidal components in meridional wind to these variations.
At Arecibo, the midnight temperature maximum (MTM) is another widely recognized phenomenon that typically occurs near local midnight [
7,
46,
47]. MTM is a well-documented low-latitude thermospheric feature characterized by nighttime increases in neutral temperature by approximately 50–200 K [
30,
31,
32,
33,
34,
35,
47,
48,
49,
50,
51,
52]. This thermal enhancement is generally associated with a weakening or reversal of equatorward meridional wind, leading to poleward wind surges [
31]. These winds can drive plasma downward along geomagnetic field lines, potentially contributing to the occurrence of midnight collapses [
2]. This downward motion may also enhance 630.0 nm airglow emissions due to increased recombination in the lower F region [
31]. Simulations using the Thermosphere–Ionosphere General Circulation Model (TIGCM) and the Whole Atmosphere Model (WAM) suggest that MTM is mainly driven by upward-propagating tidal modes [
13]. Gong et al. [
46] presented the first observational evidence of a terdiurnal tide associated with the MTM at Arecibo. While MTM is primarily driven by tidal and wind effects, midnight collapses may also be modulated by electric fields and ambipolar diffusion. The main focus of this study is to statistically examine the seasonal variations in midnight collapses using long-term ISR observations at Arecibo and, for the first time, to report the occurrence and characteristics of secondary collapses. Further investigation of the excitation mechanisms of midnight collapses and their relationship with MTM and 630.0 nm airglow is planned for future work.
5. Summary and Conclusions
In this study, we performed a comprehensive statistical analysis of ionospheric midnight collapse events over Arecibo, utilizing incoherent scatter radar (ISR) observations spanning from 1971 to 2019. A total of 224 nights with valid nighttime measurements were selected to systematically investigate the occurrence, characteristics, and seasonal dependence of midnight collapses, with particular emphasis on the rarely examined secondary collapse events.
Our results show that midnight collapses are a frequent phenomenon at Arecibo, occurring on 94.6% of the observed nights. The highest incidence was recorded during spring, followed by winter, autumn, and summer. The first collapse typically initiated between 22:00 and 00:00 LT, with durations predominantly ranging from 1 to 4 h. Initial collapse altitudes were concentrated between 350 and 400 km, and the collapse magnitudes generally fell within the 50–150 km range. These findings are consistent with previous observations, but provide more detailed statistical distributions across seasons. Notably, second midnight collapses, though less common (18.8% of all nights), exhibited a strong seasonal bias, with nearly half occurring during winter months. These events typically occurred between 23:00 and 02:00 LT, at slightly lower initial altitudes compared to the first collapse, and were associated with faster collapse speeds. This suggests different dynamical processes or cumulative effects leading to a second collapse, distinguishing it from the first.
Further investigation into vertical ion drift () patterns highlighted its pivotal role in the formation and modulation of midnight collapses. Seasonal analysis indicated that during winter nights, remained persistently downward, whereas in other seasons, exhibited more complex oscillatory behavior, with multiple reversals in direction near midnight. Decomposition of into its perpendicular () and field-aligned () components revealed that generally dominated the vertical ion motion, particularly on nights featuring two collapses. The behavior of , characterized by brief upward excursions followed by strong downward acceleration, closely aligns with the onset and intensification of both first and second collapses. Temporal variations in meridional wind were also examined, showing that it largely controls nighttime variations. These results suggest that variations in the field-aligned ion drift, likely driven by meridional wind variations associated with seasonal thermospheric dynamics, play a key role in triggering midnight collapse events at low latitudes.
Future work should integrate ISR observations with comprehensive modeling to examine the combined effects of atmospheric tides in meridional wind, electric fields, ambipolar diffusion, and geomagnetic storm activity, thereby further elucidating the coupling mechanisms between the thermosphere and ionosphere during midnight collapse events.

