Abstract
Accurately assessing the spatiotemporal dynamics and influencing factors of ecosystem stability in arid desert regions (ADR) is crucial for ecological conservation and the achievement of high-quality regional development. However, existing assessment frameworks generally fail to adapt to the extremely fragile ecological conditions of ADR. Therefore, the Alxa Desert, a typical region, was selected as the research region, and an ecosystem stability assessment framework tailored to regional characteristics (perturbation–resilience–function) was constructed. Perturbation represents external pressure, resilience reflects the capacity for recovery and adaptation, and function serves as the supporting foundation. The three dimensions are dynamically coupled and jointly determine the stability status of the ecosystem in the Alxa Desert. Methodologically, this study innovatively introduces the Cloud Model–Analytic Hierarchy Process (CM-AHP) to calculate indicator weights, which more effectively addressed the widespread fuzziness and uncertainty inherent in ecosystem assessments compared to traditional methods. In addition, spatial autocorrelation methods was applied to reveal the spatial and temporal evolution characteristics of ecosystem stability from 2000 to 2020. Furthermore, the optimal parameters geographical detector model (OPGDM) was applied to analyze the effects of natural and human factors on the spatial differentiation of ecosystem stability in Alxa Desert. In addition, the Markov–FLUS model was employed to simulate the future trends of ecosystem stability over the next two decades. The results indicate that ecosystem stability in Alxa Desert from 2000 to 2020 was primarily characterized by vulnerable and moderate levels, with the area classified as extremely vulnerable decreasing significantly by 10% relative to its extent in 2000. Spatially, higher stability was observed in oasis regions and southeastern mountainous regions, while lower stability was concentrated in the desert hinterlands. Overall, ecosystem stability shifted from vulnerable toward moderate levels, reflecting a trend of gradual improvement. From 2000 to 2020, the Moran’s I varied between 0.78 and 0.81, showing strong spatial clustering. Surfce Soil moisture content (SSMC), Soil organic carbon (SOC), and enhanced vegetation index (EVI) were the primary factors influencing the spatial differentiation of ecosystem stability in Alxa Desert. The interaction between these factors further enhanced their explanatory power. Future forecasting results indicate that ecosystem stability will further improve by 2030 and 2040, particularly in the northern and southern areas of Alxa Left Banner and Alxa Right Banner. The findings can offer a theoretical foundation for future ecological conservation and environmental management in ADR.
1. Introduction
Ecosystem stability stands for the ability of an ecosystem to resist or deviate in response to disturbances, as well as its ability to recover after the disturbances are removed [1]. It is regarded as a critical indicator for assessing regional sustainable development and identifying the current state and future trends of the ecological environment. Arid desert regions (ADR) are key ecological zones and strategic barriers within the national ecological security system [2]. For a long time, ecosystems in this region have faced multiple environmental challenges, including water scarcity, intense wind erosion, and land desertification [3]. These factors have directly or indirectly disrupted the internal balance and stability of the ecosystem [4,5]. Since 2000, ecological conditions in ADR have significantly improved, driven by the continuous implementation of national ecological projects and rising environmental awareness [6]. Therefore, a thorough understanding of the spatiotemporal dynamics of ecosystem stability in ADR, as well as the projection of future trends, provides a theoretical foundation for ecological conservation and sustainable development.
As a typical ADR in China, the Alxa Desert constitutes a critical component of the ecological security barrier in northern China. It also serves as a vital ecological corridor for mitigating sandstorms and adapting to climate change in China [7]. The region has been persistently affected by external environmental factors, including limited precipitation, severe wind-sand erosion, land desertification, and topsoil salinization resulting from insufficient leaching [8,9,10]. These long-term and compound perturbations have significantly disrupted the internal balance of the ecosystem, severely constraining its self-recovery capacity. In addition, oases and vegetation patches within the region perform irreplaceable ecological functions, including sand stabilization, carbon sequestration, and biodiversity conservation [11]. Under complex environmental conditions, the Alxa Desert ecosystem is subjected to multi-level and multi-type impacts [8,10], highlighting the urgent need to assess ecosystem stability by accounting for the typicality and representativeness of the Alxa Desert.
Since MacArthur first introduced the term “community stability” into ecology [12], research on ecosystem stability has progressively deepened. At present, the research on ecosystem stability primarily focuses on relatively stable ecosystem types, such as farmland [13], cropland [14], and grassland [5]. However, the ecosystem stability research on the typical fragile ecosystem of ADR is still not systematic. Meanwhile, assessment approaches have become increasingly diversified in their development. Existing studies can be broadly classified into two categories. One category involves quantitative assessments based on single indicators. Researchers typically begin with key ecological attributes and select representative ecological indicators to evaluate ecosystem stability, such as species diversity [15], soil microbial community structure [16], net primary productivity [17], and leaf area index [18]. The other category involves constructing multidimensional frameworks that integrate remote sensing and multi-source data to conduct systematic assessments. For example, existing frameworks include the nature–resource availability–topography–vegetation framework [19], the resistance–resilience model [8], the pressure–buffer–response framework [20], and the perturbation–resistance–response model [13]. Given that the ecosystem stability of the Alxa Desert is a complex system driven by multiple hierarchical processes and coupled by numerous factors, the Cloud Model (CM) offers a robust approach for transforming the ambiguity and randomness inherent in such systems into quantitative results [21]. This method has been widely applied in ecosystem studies [22,23].
Ecosystem stability is affected by the integrated influences of multiple natural and human factors [20]. Various regression approaches have been widely employed in previous studies to analyze the factors influencing ecosystem stability. For example, Lv et al. [19] applied structural equation modeling (SEM) to examine the relationships between ecosystem stability in the Hexi Corridor and factors including soil wind erosion, the remote sensing ecological index, soil salinization, and vegetation net primary productivity. Li et al. [5] used multiple and univariate regression analyses to identify the factors influencing of tidal flat stability, and found that human development was the dominant factor. Although these studies provide a basis for the identification of factors influencing ecosystem stability, most of the methods rely on linear assumptions between variables [24]. Moreover, natural and human factors are often treated as independent, overlooking their interactive effects on ecosystem stability, which may lead to biased interpretations of influencing mechanisms.
In summary, research on ecosystem stability in the Alxa Desert still faces three critical challenges: First, some studies lack a comprehensive consideration of ecosystem services function and fail to incorporate them into the ecosystem stability assessment indicator system. Second, some integrated frameworks lack targeted applicability, limiting their effectiveness under the extreme environmental conditions characteristic of the Alxa Desert. Third, traditional linear analytical approaches remain insufficient for identifying the drivers of spatial heterogeneity in ecosystem stability.
Based on the above issues, this study aims to answer the following scientific questions: (1) What are the spatiotemporal evolution characteristics of ecosystem stability in the Alxa Desert during 2000–2020? (2) What factors dominate the spatial heterogeneity of ecosystem stability? (3) What trends in ecosystem stability are likely to occur in the Alxa Desert over the next two decades? Therefore, this study takes the Alxa Desert as a representative region. Based on the Google Earth Engine (GEE) cloud platform, it integrates multi-source baseline data using the InVEST and RWEQ models. Building upon existing analyses of ecosystem perturbation, resilience, and response, ecosystem service functions are incorporated into the stability assessment framework, leading to the construction of a three-dimensional perturbation-resilience-function evaluation framework. The CM and spatial autocorrelation analysis were applied to investigate the spatiotemporal evolution of ecosystem stability from 2000 to 2020. The optimal parameters geographical detector model (OPGDM) was further employed to explore the effects of influencing factors on the spatial differentiation of ecosystem stability in the Alxa Desert. And the Markov–FLUS model was also employed to simulate future changes in ecosystem stability in the Alxa Desert for the years 2030 and 2040. The findings of this study can provide scientific evidence and data support for ecological protection policymaking and ecological civilization construction in ADR.
2. Materials and Methods
2.1. Study Area
The Alxa Desert spans roughly 270,000 km2 and is situated between 97°10′–106°53′E and 37°24′–42°47′N (Figure 1). It borders Mongolia to the north, the Helan Mountains to the east, the Mazong Mountains to the west, and the Tengger Desert to the south. The terrain slopes from south to north, characterized by alternating deserts and gobi landscapes. With a desert area of 94,700 km2, this region ranks among the most severely affected by desertification in China [18,25]. The Alxa region experiences distinct seasonal patterns, with precipitation decreasing from southeast to northwest. Mean annual precipitation in the region varies from 40 mm to 210 mm, while the mean annual temperature ranges between 7.7 °C and 12 °C [25]. The zonal vegetation is dominated by xerophytic and extremely xerophytic shrubs such as Sarcozygium xanthoxylon, Reaumuria songarica, and Nitraria sphaerocarpa [7]. Population density in the Alxa League is generally low and exhibits a highly uneven spatial distribution, with higher concentrations in the southeast and sparse settlements in the west [26]. The establishment of desert geoparks and national nature reserves, coupled with the region’s unique psammophyte resources and improved transportation infrastructure, has accelerated the development of local tourism resources [11].
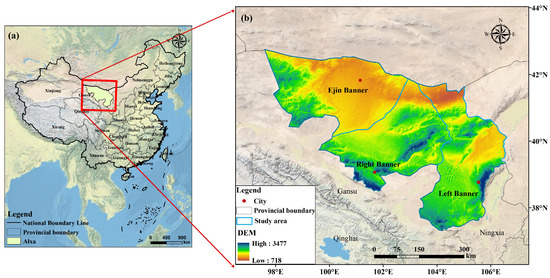
Figure 1.
Location and topography of the study area: (a) The location of the Alxa Desert in China; (b) The topographic map of the Alxa Desert.
2.2. Data Collection
The multi-source data employed in this study include meteorological, terrain, soil, land use, management factor, and remote sensing data (Table 1). Remote sensing imagery was acquired and processed on the GEE cloud platform, including radiometric correction and mosaic integration. Subsequently, several remote sensing indicators were calculated, including the desertification difference index (DDI), enhanced vegetation index (EVI), soil salinization index (SRSI), and the remote sensing ecological index (RSEI). The DDI, RSEI, and EVI were derived from the surface reflectance data of Landsat 5 TM and Landsat 8 OLI, while the SRSI was calculated based on the MOD09A1 dataset. All the above remote sensing indicators were computed for the vegetation growing season (April to September) during the period from 2000 to 2020. To ensure spatial consistency, all datasets were resampled using ArcMap 10.8 to a uniform spatial resolution of 250 m.

Table 1.
Data types and sources.
2.3. Methodology
Figure 2 displays the technology roadmap for this study:
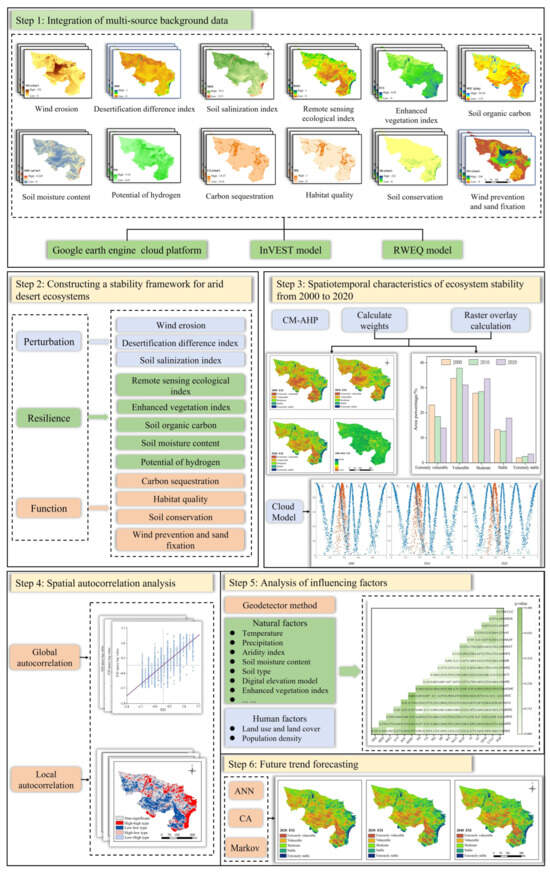
Figure 2.
Technology roadmap for ecosystem stabilization in the Alxa Desert.
Step 1: Remote sensing indicators including the DDI, SRSI, Remote Sensing RSEI), and EVI were collected using the GEE cloud platform. The InVEST model was employed to calculate carbon sequestration, habitat quality, and soil retention functions, while the RWEQ model was employed to estimate the wind prevention and sand fixation function. These, together with other multi-source datasets, were integrated to construct the baseline database for ecosystem stability assessment.
Step 2: Ecosystem service functions were incorporated into the indicator system to construct an ecosystem stability framework for the Alxa Desert based on the perturbation–resilience–function model.
Step 3: The CM-AHP model was applied to quantify the weights of each indicator layer, and raster overlay techniques were used to integrate 12 indicators for analyzing the spatiotemporal variation in ecosystem stability. In addition, the CM was employed to assess the overall dynamic changes in ecosystem stability from 2000 to 2020.
Step 4: ArcGIS 10.8 and GeoDa 1.20 software were used to conduct global and local spatial autocorrelation analyses of ecosystem stability in the Alxa Desert.
Step 5: The OPGDM was applied to analyze how natural and human factors influence ecosystem stability.
Step 6: The Markov–FLUS model was applied to forecast spatial and temporal changes in ecosystem stability in 2030 and 2040.
2.3.1. Ecosystem Stability Assessment Framework
To assess ecosystem stability in the the Alxa Desert, this study developed a framework based on three dimensions: perturbation, resilience, and function (Table 2 and Figure 3). Perturbation refers to any external pressure that can cause changes in the structure, composition, or function of an ecosystem [13]. The Alxa Desert experiences persistently limited precipitation and intense evaporation, where arid climatic conditions and strong winds jointly contribute to compound environmental disturbances. In addition, historical unsustainable land use and overgrazing have exacerbated wind erosion and intensified land desertification, becoming key factors that threaten regional ecosystem stability [8,9]. Moreover, due to the lack of precipitation leaching, salts accumulate and harden on the soil surface, making soil salinization an increasingly prominent issue [27]. Therefore, this study adopts WE, DDI, and SRSI as representative indicators for the perturbation dimension.

Table 2.
Assessment framework for ecosystem stability in the Alxa Desert.
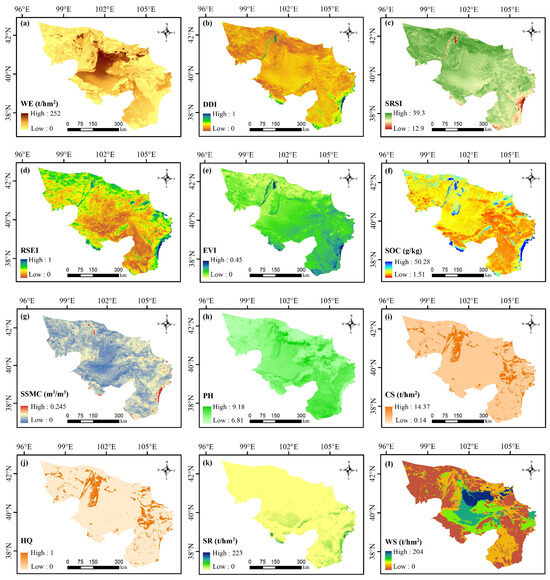
Figure 3.
Spatial distribution of ecosystem stability indicators in the Alxa Desert. Note: (a) Wind erosion; (b) Desertification difference index; (c) Soil salinization index; (d) Remote sensing ecological index; (e) Enhanced vegetation index; (f) Soil organic carbon; (g) Surface soil moisture content; (h) Potential of Hydrogen; (i) Carbon sequestration; (j) Habitat quality; (k) Soil retention; (l) Wind prevention and sand fixation.
Resilience describes the capacity of an ecosystem to sustain dynamic balance by reorganizing its components and optimizing functions in response to or recovery from external disturbances [27]. The RSEI effectively characterizes regional eco-environmental quality and serves as a reliable indicator of ecological restoration potential [28]. The EVI reflects surface vegetation growth status [29]. SOC, SSMC, and pH provide essential nutrients, water, and suitable conditions for plant growth and microbial activity, directly influencing the ecosystem’s recovery capacity [24].
Ecosystem service functions reflect the complexity of ecological processes and serve as the foundation for maintaining ecosystem stability [30]. The CS function reflects the capacity of regional ecosystems to capture and store carbon, thereby contributing to carbon balance regulation. HQ indicates the ecosystem’s ability to support biodiversity, which is closely related to its structural integrity and adaptive capacity [11]. SR reflects the ecosystem’s ability to prevent water and soil loss, which is particularly relevant in the Alxa Desert due to its windy conditions and loose surface substrates [11]. WS is one of the most essential ecosystem services in the Alxa Desert, effectively reducing wind erosion frequency and safeguarding land-use security [31].
The formulas for the specific indicators are provided in Table S1 of the supplementary material.
2.3.2. Cloud Model (CM)
According to the cloud model (CM), three numerical characteristics–expectation (Ex), entropy (En), and hyper-entropy (He)–describe the transformation from a qualitative concept to its quantitative representation [22,32]. Ex represents the most typical quantitative value of a qualitative concept. En indicates the degree of extent of cloud drops and characterizes the fuzziness and randomness of the qualitative concept. He measures the fuzziness and randomness of the entropy itself [33].
where Ex is the expectation, is the mean value, and Xi represents the ecosystem stability indicator, with i denoting the indicator factors corresponding to perturbation, resilience, and response.
where En represents the entropy, and D denotes the first-order absolute central moment of the sample.
where He represents the hyper-entropy, and S2 denotes the sample variance.
To analyze the changes in ecosystem stability in the Alxa Desert, it is necessary to calculate the weights of the three layers of factors: perturbation, resilience, and function. The CM-AHP method is employed in this study to effectively address the fuzziness and randomness inherent in real-world conditions [33]. By constructing the evaluation scale criteria for ecosystem stability based on the CM (Table 3) and calculating the weights Wi (Exi, Eni, Hei), a scientific basis was provided for the assessment.

Table 3.
CM scaling criteria for ecosystem stability factors.
Ecosystem stability is classified into five levels: extremely vulnerable, vulnerable, moderate, stable, and extremely stable. Table 4 presents the evaluation values of the five cloud feature spaces, while the standard evaluation clouds representing ecosystem stability are depicted in Figure 4.

Table 4.
Numerical parameters of the CM for ecosystem stability.
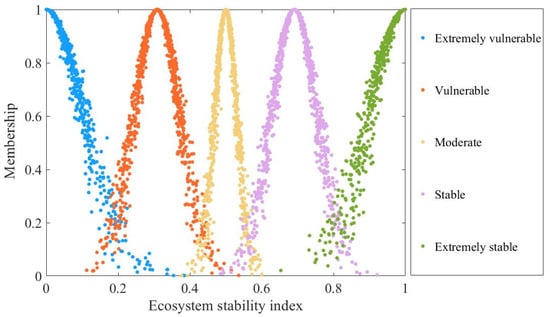
Figure 4.
Standard evaluation cloud map.
2.3.3. Ecological Stability Evaluation
The ecosystem stability index (ESI) is used to represent the degree of ecosystem stability. A lower ESI value indicates lower ecosystem stability and greater ecosystem vulnerability [34]. The calculation method for the ESI is as follows [35]:
where n is the number of indicators, Wi represents the weight of the i-th indicator factor, and Ci denotes the corresponding indicator value. Based on the actual conditions of the Alxa Desert and previous studies [36], ecosystem stability is classified into five levels: 0–0.23 (extremely vulnerable), 0.23–0.33 (vulnerable), 0.33–0.43 (moderate), 0.43–0.63 (stable), and 0.63–1 (very stable).
2.3.4. Spatial Autocorrelation Analysis
Spatial autocorrelation refers to a statistical approach for evaluating the correlation of attribute values among neighboring spatial units, enabling the identification of spatial patterns, the revelation of spatial dependence, and the enhancement of model explanatory power [37]. It can be classified into global and local forms. Global spatial autocorrelation assesses the presence of overall clustering patterns across the entire study region, whereas local spatial autocorrelation identifies the extent of clustering within individual spatial units [38].
where n is the number of spatial units; xi and xj are the observed values of regions i and j, respectively; is the mean value; S2 is the sample variance; and wij represents the spatial weight matrix.
2.3.5. Optimal Parameters Geographical Detector Model (OPGDM)
The dynamics of ecosystem stability in the Alxa Desert are shaped by the combined effects of various interacting natural and human factors, exhibiting significant spatial heterogeneity. Compared with the traditional geographical detector, the OPGDM can optimize the discretization method and spatial scale of spatial data, determine the best parameter combination, and thus improve the accuracy and reliability of spatial analysis results [38,39,40]. Based on this, nine influencing factors were selected as independent variables from both natural and human dimensions, including mean annual temperature (MAT), mean annual precipitation (MAP), aridity index (AI), surface soil moisture content (SSMC), soil type (ST), digital elevation model (DEM), enhanced vegetation index (EVI), land use and land cover (LULC), and population density (POP). A quantitative analysis was conducted to examine the influence of these factors on the dependent variable (ecosystem stability).
2.3.6. Future Forecasting Based on Markov-FLUS Modeling
The Markov model is a forecasting method in long-term according to the current state of events and their transition probabilities [22]. The FLUS model is developed within the traditional cellular automata (CA) principle and integrates an artificial neural network (ANN) algorithm to simulate and forecast land use pattern evolution the combined effected of natural and human factors [41]. Given that ecosystem stability also exhibits strong spatial autocorrelation, the benefits of the Markov model in long-term trend and quantity forecasting are coupled with the FLUS model to enable quantitative future forecasting of ecosystem stability in the Alxa Desert.
The methodology involves the following steps:
- (1)
- Suitability probability estimation: Given that ecosystem stability is influenced by a wide range of natural and human factors, twelve influencing factors were selected based on prior research [42,43], local environmental characteristics, data availability, and measurability. These variables include climatic factors (MAT, MAP, AI and SSMC), topographic factors (DEM, slope and aspect), soil factors (SOC and ST), vegetation factor (EVI), and anthropogenic factors (LULC and POP). An ANN model was employed to generate suitability probability maps for different levels of ecosystem stability. In this study, the ANN model was configured with 12 hidden layers, 300 training iterations, and a learning rate of 0.01.
- (2)
- Neighborhood Weight Parameter: The neighborhood weight parameter represents the expansion intensity of each level of ecosystem stability, with a threshold range from 0 to 1. A value closer to 1 indicates a stronger expansion capability of the corresponding stability type [42].
- (3)
- Transition Cost Matrix: The transition cost matrix defines the transformation rules between different levels of ecosystem stability, where a value of 0 indicates that transformation is not allowed, and a value of 1 indicates that it is permitted [43]. Based on the actual conditions of the Alxa Desert, this study assumes that transitions between all levels of ecosystem stability are unrestricted. The transition cost matrix used in this study is presented in Table 5.
 Table 5. Transition Cost Matrix.
- (4)
- Simulation Accuracy Verification: In this study, the simulated ecosystem stability data for the year 2020 were compared with the actual ecosystem stability data of the same year. Overall Accuracy (OA) and the Kappa coefficient were used to evaluate the overall classification performance, while Producer’s Accuracy (PA) and User’s Accuracy (UA) were adopted to assess the classification performance of individual categories. The corresponding formulas are as follows [44]:where Xii is the number of pixels correctly classified into class i; is the total number of reference pixels in class i; is the total number of pixels classified into class i; is the total number of correctly classified pixels; N is the total number of samples; r is the number of rows; Xi+ and X+i are the row and column sums of row i and column i, respectively.
3. Results
3.1. Spatiotemporal Characteristics of Ecosystem Stability
The CM-AHP model was utilized to calculate the weights of the indicators in the ecosystem disturbance, resilience and response layers to identify their relative significance to ecosystem stability. As Table 6 presented, the key factors influencing ecosystem stability in the Alxa Desert include RSEI, EVI, SSMC, WS, and DDI.

Table 6.
Indicator weights.
Based on the attributes of 12 ecosystem stability indicators, spatial data were overlaid using raster analysis in ArcGIS. In terms of spatial distribution (Figure 5), ecosystem stability in the Alxa Desert is higher in the southeastern mountainous and oasis areas, and lower in the desert hinterlands. Areas with extremely stable are mainly concentrated in the Longshou Mountains, the Helan Mountains, and the Ejin Oasis in the lower reaches of the Heihe River. Areas of extremely vulnerable are widely distributed across the Badain Jaran Desert and the Tengger Desert. Areas with moderate and stable ecosystem stability are primarily located in the northern part of Alxa Left Banner, which is mainly due to relatively abundant vegetation and substantial investment in artificial vegetation construction, resulting in greater ecosystem stability.
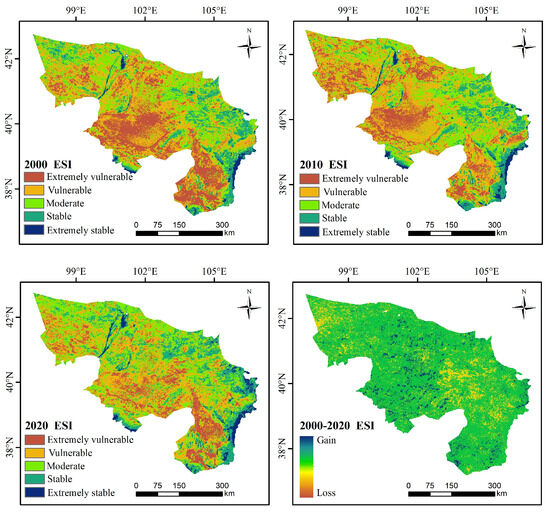
Figure 5.
Spatiotemporal variation in ecosystem stability.
From a temporal perspective (Figure 6), ecosystem stability during 2000–2020 was predominantly at the vulnerable and moderate levels, constituting for more than half of the total area. The areas classified as moderate, stable, and extremely stable showed an increasing trend, with their proportions rising from 27%, 13%, and 1.9% in 2000 to 34%, 18%, and 3.5% in 2020, respectively. In contrast, the area classified as extremely vulnerable decreased from 23% to 13%. The proportion of vulnerable areas increased from 2000 to 2010, but decreased from 2010 to 2020, resulting in an overall decline of 2%. From the perspective of changes in ecosystem stability levels between 2000 and 2020 (Figure 7), significant transitions were observed among the extremely vulnerable, vulnerable, moderate, and stable categories. Notably, 10% of the area shifted from extremely vulnerable to vulnerable, 12.5% from vulnerable to moderate, 7.5% from moderate to stable, and 1.5% from stable to extremely stable. These transitions indicate that ecosystem stability in the study area is gradually improving.
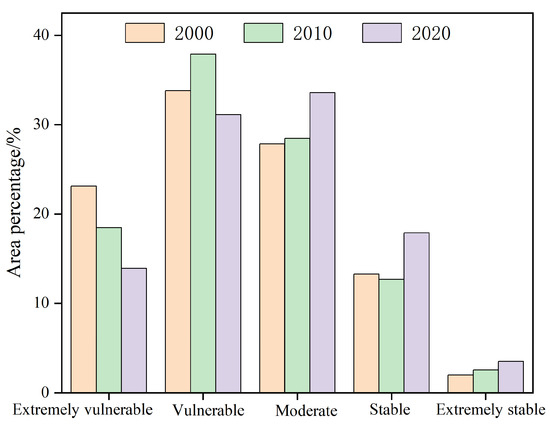
Figure 6.
Proportions of ecosystem stability levels.
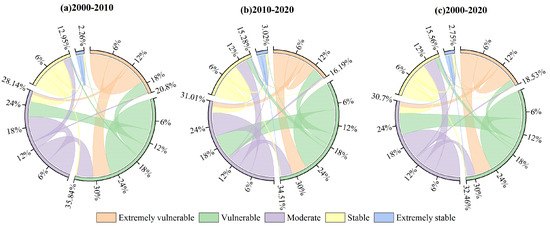
Figure 7.
Transitions among different ecosystem stability levels during (a) 2000–2010, (b) 2010–2020, and (c) 2000–2020.
Based on the CM and extracted raster data, MATLAB R2020a was used to visualize ecosystem stability in the Alxa Desert from 2000 to 2020 through cloud maps, which are presented within the standard evaluation cloud diagram (Figure 8). The comprehensive cloud characteristic values of ecosystem stability in 2000, 2010, and 2020 were C2000com (0.3696, 0.0336, 0.0185), C2010com (0.3774, 0.0331, 0.0185), and C2010com (0.3880, 0.0377, 0.0131), respectively.
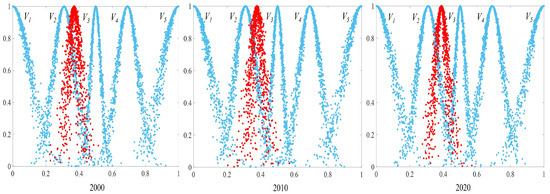
Figure 8.
Comprehensive evaluation cloud maps of ecosystem stability from 2000 to 2020. Note: Symbols V1, V2, V3, V4 and V5 represent extremely vulnerable, vulnerable, moderate, stable, and extremely stable levels, respectively. The x-axis indicates the evaluation values, and the y-axis represents the degree of membership.
3.2. Analysis of Spatial Clustering Characteristics of Ecosystem Stability
From 2000 to 2020, the global Moran’s I was approximately 0.80, with p-values all below 0.01, indicating a clear spatial clustering pattern and significant positive spatial autocorrelation of ecosystem stability at the 99% confidence level (Figure 9). The number of L-L and H-H type scatter points in the figure exceeds that of H-L and L-H types, indicating a tendency toward both high-value and low-value clustering in ecosystem stability. Among the three years, the Moran’s I value was highest in 2010, indicating the strongest spatial clustering of ecosystem stability in the Alxa Desert during that year, followed by a slight decline over time.
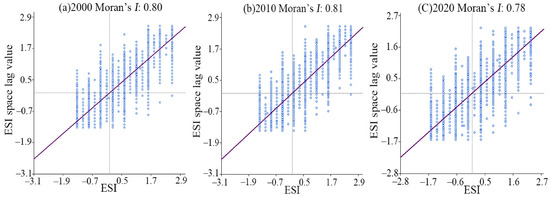
Figure 9.
Global spatial autocorrelation Moran scatter plots of ecosystem stability.
To further explore the spatial clustering patterns of ecosystem stability, a local autocorrelation analysis was performed, and the corresponding LISA cluster map was produced (Figure 10). In terms of spatial distribution, the ecosystem stability of the the Alxa Desert from 2000 to 2020 was mainly dominated by H-H and L-L types of clustering. The H-H clusters were predominantly located in the oasis core region along the lower reaches of the Heihe River, as well as in the Longshou and Helan Mountains, and the northern area of Alxa Left Banner. In contrast, L-L clusters were mostly concentrated in the Tengger and Badain Jaran Deserts, as well as the western region of Ejin Banner. Overall, the H-H clusters were mainly distributed in areas with favorable ecological conditions, such as grasslands and woodlands. The L-L clusters were primarily distributed in desert areas, where the ecological environment tends to be more vulnerable.

Figure 10.
Local spatial autocorrelation LISA map of ecosystem stability.
3.3. Analysis of Factors Influencing Ecosystem Stability
According to the results of the factor detector (Table 7), the p-values for the years 2000, 2010, and 2020 were all 0, indicating that the selected influencing factors had a significant impact on the spatial differentiation of ecosystem stability in the study area. Among the factors, SSMC, SOC and EVI exhibited the strongest explanatory power for the spatial differentiation of ecosystem stability, with average q-values of 0.298, 0.275 and 0.215 from 2000 to 2020, respectively. In addition, DDI, SRSI POP, AI, MAP, LULC, ST, and DEM also contributed to the spatial differentiation of ecosystem stability, with average q-values of 0.213, 0.198, 0.156, 0.152, 0.147, 0.146, 0.145, and 0.126, respectively. PH had the weakest explanatory power, with an average q-value of only 0.017.

Table 7.
Factor detector results for ecosystem stability.
The results of the interaction detector (Figure 11) indicate that the effects of influencing factors on ecosystem stability are synergistic rather than acting independently. SSMC and SOC had the strongest explanatory power in 2000 (q = 0.438), followed by SSMC and DDI (q = 0.401), and HQ and CS had the weakest explanatory power (q = 0.105). 2010 had the strongest explanatory power for SSMC and SRSI (q = 0.495), and the weakest explanatory power for HQ and CS (q = 0.102). 2020 had the strongest explanatory power for SSMCand SOC (q = 0.443); WS and SR had the weakest explanatory power (q = 0.096). Meanwhile, SSMC and interaction with other influences also had strong explanatory power for spatial variability in ecosystem stability.
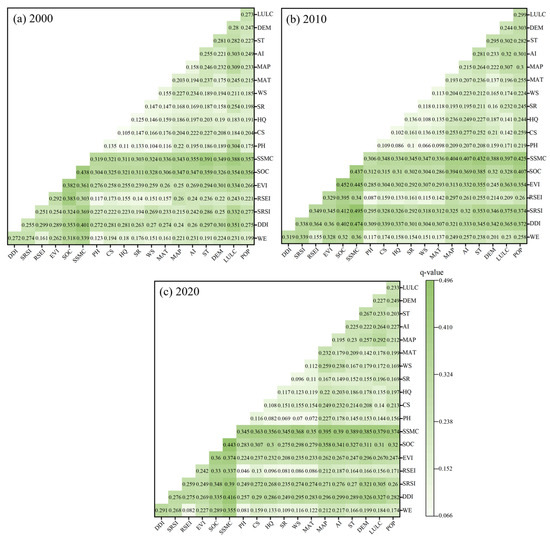
Figure 11.
Interaction detector results for ecosystem stability.
3.4. Future Forecasting and Analysis of Ecosystem Stability
Firstly, GeoSOS-FLUS V2.4 was used to simulate and forecast the spatial distribution of ecosystem stability in 2020, based on the classified data from 2000 and 2010 in the Alxa Desert. The transition rules were determined by integrating the Markov and ANN models to simulate and predict the spatial distribution of ecosystem stability in 2020. To compare the simulated results with the actual ecosystem stability data for 2020, this study calculated the OA, PA, UA, and Kappa coefficient (Table 8). The results show that the Kappa coefficient reached 0.93, and the OA was 0.95. The PA values for all ecosystem stability levels exceeded 92%, and the UA values were all above 90%. The high simulation accuracy indicates that the FLUS model demonstrates good reliability and accuracy in this study and can be used to further predict the trends of ecosystem stability changes in arid desert regions in 2030 and 2040. According to Figure 12 and Figure 13, the area classified as vulnerable is projected to decrease by 7.55% and 9.85% in 2030 and 2040, respectively, compared to 2020, while the area classified as stable is expected to increase by 3.61% and 6.19%, respectively. According to Figure 14, approximately 3.98% of the area is projected to exhibit an increasing trend in ecosystem stability during 2020–2030, while about 0.84% of the area is expected to show a decreasing trend. For the period 2030–2040, regions with increasing ecosystem stability account for 2.90%, whereas those with decreasing stability represent 1.81%. This indicates that ecosystem stability in the Alxa Desert is projected to improve continuously over the next two decades, with the most notable improvements occurring in the northern and southern areas of Alxa Left Banner and Alxa Right Banner.

Table 8.
Simulation Accuracy Metrics.

Figure 12.
Future trends in ecosystem stability in the Alxa Desert.
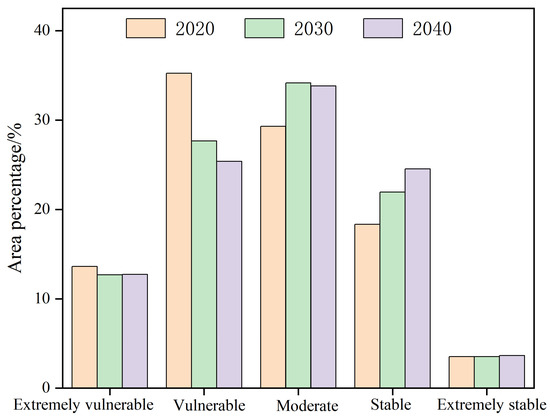
Figure 13.
Area proportions of future trends in ecosystem stability.
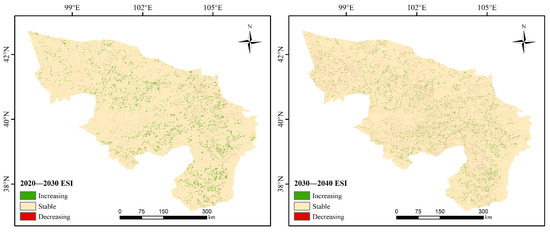
Figure 14.
The future spatial variation in ecosystem stability.
4. Discussion
4.1. Spatiotemporal Variation in Ecosystem Stability
The findings demonstrate that, during the period from 2000 to 2020, ecosystem stability in the Alxa Desert was primarily characterized by vulnerable and moderate levels. A continuous decline in the area classified as extremely vulnerable was observed, whereas the areas identified as moderate and extremely stable exhibited an overall increasing trend. This change is primarily attributed to the strategic role of Alxa as a key ecological barrier in northwest China [45], where the implementation of the Three-North Shelterbelt Program (TNSP) has led to a series of significant achievements. For example, desertification in Alxa League has been effectively mitigated, with a reduction of 585.9 km2 in desertified land area [6]. In addition, afforestation has significantly increased the contents of SOC and SIC [46]. Afforestation can also alleviate soil moisture loss and enhance SSMC by improving soil structure and increasing litter cover [47]. Moreover, the evaluation results derived from the ecosystem stability cloud map indicate a progressive shift toward the moderate threshold over the last two decades, implying continued improvement (Figure 8). This finding is consistent with the results of Li et al. [7], who also reported a gradual improvement in ecological quality in the Alxa Left Banner.
In terms of spatial patterns, areas classified as extremely stable were mainly situated in the Longshou Mountains, the Helan Mountains, and the Ejin Oasis. The main reason is that the Longshou and Helan Mountains have relatively high elevations, pronounced vertical zonation, and diverse plant communities. In particular, the Helan Mountains are influenced by the northwesterly monsoon, resulting in relatively abundant precipitation, which provides favorable conditions for ecosystem stability [48]. The Ejin Oasis relies on water supply from the Heihe River, with ecological water diversion projects (EWDP) ensuring sustained water availability, thereby supporting the stability of ecosystems within the oasis [49]. In contrast, areas classified as extremely vulnerable were commonly distributed in the Badain Jaran Desert and the Tengger Desert. This is mainly due to severe wind-blown sand erosion and limited precipitation, which leads to water scarcity and makes the ecosystem fragile [8]. Nevertheless, certain limitations remain. In Figure 5, the area classified as “extremely vulnerable” in the Badain Jaran Desert has significantly decreased. On the one hand, this reflects the positive outcomes of ecological restoration projects implemented in recent years. On the other hand, it is important to note that this trend may also be influenced by the raster-based overlay method used in this study for assessing ecosystem stability levels. Such methods are subject to spatial scale effects, which may obscure local ecological heterogeneity and result in an apparent but potentially overestimated improvement in desert areas [50]. These outcomes are aligned with spatial clustering patterns of ecosystem stability. H-H clusters are mainly distributed in areas with relatively favorable ecological conditions in the Alxa Desert, while L-L clusters are primarily located in areas classified as extremely vulnerable and vulnerable. Compared with 2000 and 2010, the L-L clustering areas expanded outward in 2020 (Figure 10), mainly due to the high difficulty of restoring extremely vulnerable regions and the uneven distribution of restoration resources. As a result, although the extent of low-value areas decreased, they became more spatially concentrated, thereby enhancing spatial clustering [51].
4.2. Influencing Factors of Ecosystem Stability
This study employed the OPGDM to effectively reveal the primary influencing factors of spatial differentiation in ecosystem stability and their interaction mechanisms. In addition, the automatic optimization of parameter settings reduced the subjective bias associated with manual classification, thereby enhancing the scientific rigor and reliability of the analysis results [40,52]. The results indicate that ecosystem stability in the Alxa Desert is jointly determined by influencing factors, along with the complex interactions within each. Among them, SSMC, SOC and EVI were the dominant factors influencing the spatial differentiation of ecosystem stability, with average explanatory powers of 29.8%, 27.5% and 21.5%, respectively. SSMC is a key variable in hydrological processes in the Alxa Desert [53]. It not only affects the physicochemical properties of soil and plant growth conditions, but also regulates plant transpiration and photosynthesis, thereby influencing the cycling and flow of water, energy, and materials within ecosystems [54,55]. In this study, ecosystem stability increases with rising SSMC, and the ecosystem remains in a relatively stable state when the SSMC ranges from 0.166 to 0.242 m3/m3. SOC serves as the primary carbon source for soil microorganisms. High SOC content helps maintain greater microbial diversity and activity, thereby promoting nutrient mineralization and cycling, enhancing the ecosystem’s self-regulation and disturbance resistance, and ultimately strengthening its stability [56,57,58]. This study found that the ecosystem tends to be relatively stable when the SOC reaches approximately 14.2 g/kg. Particularly in the years 2000 and 2020, the interaction between SSMC and SOC exhibited the strongest explanatory power for ecosystem stability, indicating that the synergistic effect between water and nutrients plays a critical role in regional ecological stability [59]. Since 2000, various ecological measures have been undertaken in the Helan Mountains and nearby areas, such as grazing prohibition and reforestation, ecological resettlement, and integrated management of the lower reaches of the Heihe River. In addition, shelterbelt forest construction has gradually been carried out along the edges of the three major deserts. These ecological protection measures have effectively increased regional vegetation cover, curbed land degradation, significantly improved ecological conditions in the Alxa region, and enhanced the stability of regional ecosystems [6,60]. Therefore, ecosystem stability increases with rising EVI. When the EVI reaches 0.27, the ecosystem tends to reach a stable state.
Desertification is a destructive biogeographical process that typically leads to a decline in species diversity, loss of soil nutrients, and even degradation of the region’s ecological carrying capacity [61]. By 2024, nearly 6.67 million hectares of sand prevention and control projects had been completed in the Alxa Desert region, playing a significant role in enhancing regional ecosystem stability. Soil salinization can induce osmotic stress and ion toxicity in plant roots, leading to vegetation degradation or even dieback. This, in turn, exacerbates surface deterioration and triggers a negative feedback loop, ultimately making the ecosystem more vulnerable [10]. In addition, POP also has a significant influence (q = 0.157). In the Alxa region, the population is largely located in regions with relatively favorable ecological conditions for development, where activities such as overgrazing and agricultural expansion have affected ecosystem stability [62]. The AI and MAP reflect the regional climatic dryness and wetness, and are key environmental variables constraining ecosystem productivity and structural stability in arid regions. Li et al. [3] found that increasing precipitation, driven by warming and humidification trends in northwest China, has positively influenced the ecological environmental quality in Alxa Left Banner. Changes in precipitation significantly affect surface SSMC, which in turn is tightly linked to vegetation growth, soil and water conservation, and biodiversity within biological communities [63].
The impact of LULC on ecosystem stability is also non-negligible (q = 0.147), which may be attributed to the spatial heterogeneity of land use types. Ecosystem stability tends to be higher in forested and grassland areas [37]. Changes in land use or environmental conditions can directly or indirectly influence plant growth and distribution patterns by altering biotic and abiotic soil properties, thereby driving shifts in ecosystem stability through plant–soil feedback mechanisms [64]. In addition, ST and DEM also affect regional ecosystem stability. In the Alxa region, soil types generally transition from gypsum-based grey desert soils in the west to calcic soils in the east. These different soil types exhibit significant differences in nutrient supply and biodiversity support, thereby influencing ecosystem stability [46]. At higher elevations, regional ecosystems experience less human disturbance, exhibit greater biodiversity, and tend to have higher ecosystem stability. In contrast, lower elevations, characterized by flatter terrain and more accessible transportation, are subject to intensified urban development and human interference, resulting in lower ecosystem stability. Therefore, in this study, ecosystem stability increases with elevation, and the ecosystem exhibits higher stability when the elevation ranges between 1990 and 3360 m. PH exhibited the weakest explanatory power for the spatial differentiation of ecosystem stability. However, its interactions with other natural and human factors have gradually enhanced its overall influence.
4.3. Future Changes in Ecosystem Stability
The prediction results in this study are not simple linear extrapolations of past ecosystem stability values, but rather an integrated assessment based on two key components: (1) the transition probabilities between different levels of ecosystem stability estimated using the Markov model; (2) the ecological suitability analysis evaluated using an ANN [42,43]. During the model training process, twelve multidimensional influencing factors were incorporated, including key variables such as climatic conditions and human activities, which significantly enhanced the model’s contextual adaptability and its ability to interpret complex ecological processes. The model was trained using data from 2000 and 2010 and applied to simulate the spatial distribution of ecosystem stability in 2020. The simulation achieved high accuracy, with a Kappa coefficient of 0.93 and an OA of 0.95. The PA for all stability levels exceeded 92%, and the UA was above 90%. These validation results further confirm the model’s reliability for future scenario prediction. It is important to emphasize that, given the uncertainties associated with future extreme climate events, the prediction results in this study should be interpreted as simulations of possible trends under predefined assumptions, rather than definitive forecasts.
Drawing on the historical evolution of ecosystem stability, this study forecast the trends of ecosystem stability in the Alxa Desert over the next two decades. The results show that the region remains predominantly classified as vulnerable. However, the area under the vulnerable category is projected to decrease by 7.55% and 9.85% in 2030 and 2040, respectively, compared to 2020 (Figure 13), indicating a continued improvement in overall ecosystem stability. In recent years, various ecological projects have been actively implemented across the the Alxa Desert, including grazing prohibition and grassland restoration, the construction of TNSP, and desertification control. It has significantly contributed to the restoration of regional ecosystem structure and improvement of functions, providing strong support for the improvement of ecosystem stability in arid desert areas [65]. The future change trends in this region are compared with research findings from other regions. Using the CA-Markov model, Zhao et al. [66] forecasted that by 2025, the ecological vulnerability of the Central Plains urban agglomeration would be reduced, the ecological environment would be improved, and the stability of the ecosystem would continue to increase. Xu and Wang [67] forecasted, using a coupled GMOP and PLUS model, that under an ecological protection scenario, the ecosystem health of the Yellow River Basin will improve significantly by 2030. Wang et al. [68] conducted a forecasting analysis using a grey forecasting model and found that by 2030, the ecological carrying capacity in the Inner Mongolia Autonomous Region will gradually increase, leading to enhanced ecosystem stability. These studies suggest that under sustained ecological governance and policy interventions, various ecological regions generally exhibit a positive evolutionary trend characterized by improved ecosystem structure, enhanced functions, and increased stability. This trend is highly consistent with the patterns observed in the study region. Although the overall trend of ecosystem stability is improving, the results also reveal persistent ecological vulnerability in the southern part of Ejin Banner, the Badain Jaran Desert, and the Tengger Desert. These areas exhibit localized fluctuations or declining trends in ecosystem stability. This phenomenon is mainly attributed to frequent sandstorms, pest and rodent infestations, herbivory by animals, and urban development activities [8,9]. This suggests that despite the overall improvement in ecosystem stability, local ecosystems remain highly susceptible to external perturbations. It suggests that the Alxa Desert may still face significant degradation and ecological stress in the future.
Based on the findings of ecosystem stability in the Alxa Desert, several management and conservation recommendations are proposed. First, it is needed to systematically monitor ecological changes in critical regions. Desert regions should be prioritized, with long-term and continuous monitoring of environmental indicators such as climate, soil, and biodiversity. Second, region-specific protection strategies should be implemented. In the eastern areas, where ecological conditions are relatively stable, ecological measures should focus on natural restoration, supplemented by artificial interventions. In contrast, desert areas are generally classified as vulnerable or extremely vulnerable. These areas require active measures such as engineering-based sand stabilization, photovoltaic-based desertification control, and the construction of windbreak forest and grass belts. Overall, integrating natural restoration with human intervention can progressively enhance the self-regulation and recovery capacity of ecosystems. This approach offers a solid basis for promoting long-term ecosystem stability and sustainable development in ADR.
5. Conclusions
This study established a perturbation–resilience–function framework to systematically assess ecosystem stability in the Alxa Desert. It revealed the spatiotemporal evolution characteristics and analyzed the spatial clustering patterns of ecosystem stability. Additionally, the study examined the influences of natural and human factors and conducted future forecasting of ecosystem stability over the next two decades. The main conclusions are as follows:
- (1)
- From 2000 to 2020, ecosystem stability in the Alxa Desert was predominantly characterized by vulnerable and moderate levels. During this period, the area classified as extremely vulnerable decreased significantly by 10%, while the areas classified as moderate, stable, and extremely stable increased by 7%, 5%, and 1.6%, respectively. Spatially, higher ecosystem stability was observed in the southeastern mountainous areas and oasis regions, while lower stability was found in the desert hinterlands. The cloud model evaluation further indicated a shift in ecosystem stability from vulnerable toward moderate levels, reflecting an overall improving trend.
- (2)
- The global Moran’s I for 2000, 2010, and 2020 were 0.80, 0.81, and 0.78, respectively, indicating a significant positive spatial autocorrelation in ecosystem stability across the arid desert region. H-H clustering areas were primarily concentrated in the core oasis region of the lower Heihe River, Longshou Mountain, Helan Mountain, and the northern part of Alxa Left Banner. In contrast, L-L clustering areas were mainly distributed in the Tengger Desert, the Badain Jaran Desert, and the western part of Ejin Banner.
- (3)
- SSMC, SOC and EVI are the primary factors influencing the spatial differentiation of ecosystem stability in the Alxa Desert. The explanatory power of each factor increased after interaction, indicating that the spatial differentiation of ecosystem stability in the Alxa Desert is influenced by the combined effects of multiple factors.
- (4)
- Future forecasting results indicate that the area classified as vulnerable will decrease by 7.55% and 9.85% in 2030 and 2040, respectively, compared to 2020, while the area classified as stable will increase by 3.61% and 6.19%, respectively. This trend suggests that ecosystem stability in the Alxa Desert will continue to improve over the next two decades, particularly in the northern and southern areas of Alxa Left Banner and Alxa Right Banner.
Supplementary Materials
The following supporting information can be downloaded at: https://www.mdpi.com/article/10.3390/rs17162871/s1, Table S1: Assessment methods. References [3,8,10,30,69,70,71,72] are cited in the supplementary materials.
Author Contributions
B.W.: Writing—original draft, Visualization, Software, Resources, Methodology, Data curation, Conceptualization. J.S.: Resources, Funding acquisition, Conceptualization. B.J.: Conceptualization, Methodology. D.Z.: Writing—review & editing, Supervision. Z.L.: Resources, Methodology, Software. B.N.: Writing—review & editing. X.B.: Writing—review & editing. Y.Y.: Writing—review & editing. L.Y.: Writing—review & editing. All authors have read and agreed to the published version of the manuscript.
Funding
This research was funded by the Science and Technology Department Project of Inner Mongolia Autonomous Region (No. 2024JBGS0003-2); The Youth Science and Technology Foundation of Gansu Province (No. 24JRRA105); The National Natural Science Foundation of China (No. 52379029); The Natural Science Foundation of Gansu Province (No. 23JRRA611); The Science and Technology Major Project of Inner Mongolia Autonomous Region (No. 2024JBGS0009); Alxa League Forestry and Grassland Bureau Project (No. AMZCS-G-F-240019); The Taolai River Basin Water Resource Utilization Center Project of Gansu Provincial Department of Water Resources (No. 24GSLK063); Development and Utilization of Sand-Adapted Plant Resources in Alxa and the Integration of Sand Industry Development Models (No. AMKJ2023-13). Inner Mongolia Autonomous Region Science and Technology Program (No. 2025KJHZ0035).
Data Availability Statement
The source of relevant data acquisition has been described in the text.
Conflicts of Interest
The authors declare no conflicts of interest.
References
- May, R.M. Will a large complex system be stable? Nature 1972, 238, 413–414. [Google Scholar] [CrossRef]
- Chen, Y.N.; Chen, Y.P.; Zhu, C.G.; Li, W.H. The concept and mode of ecosystem sustainable management in arid desert areas in northwest China. Acta Ecol. Sin. 2019, 39, 7410–7417. [Google Scholar] [CrossRef]
- Li, Q.; Dang, G.F.; Yu, T.F.; Zhang, L.; Chen, W.Y. Spatial-temporal variation and driving forces analysis of ecological environment quality in arid counties based on GEE: A case study of Alxa Left Banner. Arid Zone Res. 2025, 42, 360–371. [Google Scholar] [CrossRef]
- Boakes, E.H.; Dalin, C.; Etard, A.; Newbold, T. Impacts of the global food system on terrestrial biodiversity from land use and climate change. Nat. Commun. 2024, 15, 5750. [Google Scholar] [CrossRef]
- Li, L.J.; Fu, M.C.; Zhu, Y.X.; Kang, H.Y.; Wen, H.Y. The current situation and trend of land ecological security evaluation from the perspective of global change. Ecol. Indic. 2024, 167, 112608. [Google Scholar] [CrossRef]
- Xie, J.L.; Lu, Z.X.; Xiao, S.C.; Yan, C.Z. The latest desertification process and its driving force in Alxa League from 2000 to 2020. Remote Sens. 2023, 15, 4867. [Google Scholar] [CrossRef]
- Li, W.J.; Kang, J.W.; Wang, Y. Exploring the interactions and driving factors among typical ecological risks based on ecosystem services: A case study in the Sichuan-Yunnan ecological barrier area. Ecol. Indic. 2025, 170, 113000. [Google Scholar] [CrossRef]
- Dai, L.W.; Tang, H.P.; Pan, Y.L.; Zhang, L.H. Assessment of ecosystem stability in the agro-pastoral transitional zone for local sustainable management: A case study in Duolun County, northern China. Ecol. Indic. 2024, 162, 112018. [Google Scholar] [CrossRef]
- Ma, X.; Xiao, J.; Yao, Z.; Wei, M.; Wu, Q.; Hong, X. Spatio-temporal evolution of wind erosion climatic erosivity in the Alxa Plateau during 1960–2017. Sci. Geogr. Sin. 2021, 41, 1096–1104. [Google Scholar] [CrossRef]
- Zhao, X.Y.; Xi, H.Y.; Zhao, J.; Ma, K.H.; Cheng, W.J.; Chen, Y.Q. Inversion and spatial distribution characteristics of soil salinity in Alxa area, China. J. Desert Res. 2023, 43, 27–36. [Google Scholar] [CrossRef]
- Xie, J.; Lu, Z.; Xiao, S.; Yan, C. Driving force and ecosystem service values estimation in the extreme arid region from 1975 to 2015: A case study of Alxa League, China. Chin. Geogr. Sci. 2021, 31, 1097–1107. [Google Scholar] [CrossRef]
- MacArthur, R. Fluctuations of animal populations and a measure of community stability. Ecology 1955, 36, 533–536. [Google Scholar] [CrossRef]
- Lv, W.; Yang, L.; Xu, Z.; Zhang, Q. Spatiotemporal evolution of farmland ecosystem stability in the Fenhe River Basin China based on perturbation-resistance-response framework. Ecol. Inform. 2025, 86, 102977. [Google Scholar] [CrossRef]
- Lv, W.; Xu, Z.; Yang, L.; Qi, Q.; Yue, X.; Li, Z. Evaluation of the cultivated land ecosystem stability based on multi-source remote sensing data—A case study of Fenhe River Basin. China Environ. Sci. 2024, 44, 2937–2947. [Google Scholar] [CrossRef]
- Delsol, R.; Loreau, M.; Haegeman, B. The relationship between the spatial scaling of biodiversity and ecosystem stability. Glob. Ecol. Biogeogr. 2018, 27, 439–449. [Google Scholar] [CrossRef]
- Yang, G.W.; Wagg, C.; Veresoglou, S.D.; Hempel, S.; Rillig, M.C. How soil biota drive ecosystem stability. Trends Plant Sci. 2018, 23, 1057–1067. [Google Scholar] [CrossRef] [PubMed]
- Kang, W.P.; Liu, S.L.; Chen, X.; Feng, K.; Guo, Z.C.; Wang, T. Evaluation of ecosystem stability against climate changes via satellite data in the eastern sandy area of northern China. J. Environ. Manag. 2022, 308, 114596. [Google Scholar] [CrossRef] [PubMed]
- Sun, N.; Liu, N.J.; Zhao, X.; Zhao, J.C.; Wang, H.Y.; Wu, D.H. Evaluation of spatiotemporal resilience and resistance of global vegetation responses to climate change. Remote Sens. 2022, 14, 4332. [Google Scholar] [CrossRef]
- Lv, D.; Lv, Y.H.; Gao, G.Y.; Sun, S.Q.; Wang, Y.; Fu, B.J. A landscape persistence-based methodological framework for assessing ecological stability. Environ. Sci. Ecotechnol. 2024, 17, 100300. [Google Scholar] [CrossRef]
- Yan, Y.; Guan, Q.Y.; Shao, W.Y.; Wang, Q.Z.; Yang, X.Y.; Luo, H.P. Spatiotemporal dynamics and driving mechanism of arable ecosystem stability in arid and semi-arid areas based on Pressure-Buffer-Response process. J. Clean. Prod. 2023, 421, 138553. [Google Scholar] [CrossRef]
- Xu, C.; Hu, X.; Wang, X.; Liu, Z.; Tian, J.; Ren, Z. Spatiotemporal variations of eco-environmental vulnerability in Shiyang River Basin, China. Ecol. Indic. 2024, 158, 111327. [Google Scholar] [CrossRef]
- Zhang, H.; Sun, Y.; Zhang, W.; Song, Z.; Ding, Z.; Zhang, X. Comprehensive evaluation of the eco-environmental vulnerability in the Yellow River Delta wetland. Ecol. Indic. 2021, 125, 107514. [Google Scholar] [CrossRef]
- Liu, Z.; Si, J.; Jia, B.; He, X.; Zhou, D.; Wang, C.; Zhu, X.; Qin, J.; Ndayambaza, B.; Bai, X. The dominant influencing factors of desertification and ecological risk changes in Qinghai Area of Qilian Mountains National Park: Climate change or human activity? J. Environ. Manag. 2024, 362, 121335. [Google Scholar] [CrossRef]
- Donohue, I.; Petchey, O.L.; Montoya, J.M.; Jackson, A.L.; McNally, L.; Viana, M.; Healy, K.; Lurgi, M.; O’Connor, N.E.; Emmerson, M.C. On the dimensionality of ecological stability. Ecol. Lett. 2013, 16, 421–429. [Google Scholar] [CrossRef]
- Guo, Y.J.; Cheng, L.R.; Ding, A.Z.; Yuan, Y.M.; Li, Z.Y.; Hou, Y.Z.; Ren, L.S.; Zhang, S.R. Geodetector model-based quantitative analysis of vegetation change characteristics and driving forces: A case study in the Yongding River basin in China. Int. J. Appl. Earth Obs. Geoinf. 2024, 132, 104027. [Google Scholar] [CrossRef]
- Yin, J.; Chai, Z.; Wang, D.; Bai, R. Spatial pattern evolution and causes of rural settlements in Alxa League, Inner Mongolia. Areal Res. Dev. 2024, 43, 137–143. [Google Scholar] [CrossRef]
- Liu, J.; Gao, J.; Ma, S.; Wang, W.; Zou, C. Comprehensive evaluation of ecological environment sensitivity in Inner Mongolia. China Environ. Sci. 2015, 35, 591–598. [Google Scholar]
- Sánchez-Pinillos, M.; Dakos, V.; Kéfi, S. Ecological dynamic regimes: A key concept for assessing ecological resilience. Biol. Conserv. 2024, 289, 110409. [Google Scholar] [CrossRef]
- Xiong, Y.; Xu, W.; Lu, N.; Huang, S.; Wu, C.; Wang, L.; Dai, F.; Kou, W. Assessment of spatial–temporal changes of ecological environment quality based on RSEI and GEE: A case study in Erhai Lake Basin, Yunnan Province, China. Ecol. Indic. 2021, 125, 107518. [Google Scholar] [CrossRef]
- Zhao, Y.B.; Chang, C.C.; Zhou, X.L.; Zhang, G.L.; Wang, J. Land use significantly improved grassland degradation and desertification states in China over the last two decades. J. Environ. Manag. 2024, 349, 119419. [Google Scholar] [CrossRef]
- Wang, Q.X.; Cao, W.; Huang, L. Evolution characteristics of ecosystem functional stability and ecosystem functional zoning on the Qinghai-Tibet Plateau. J. Geogr. Sci. 2023, 33, 2193–2210. [Google Scholar] [CrossRef]
- Yang, H.; Liang, H.; Liu, X.; Li, M. Assessing the Relationship between Ecological Water Demand of Haloxlon ammodendron and Its Wind Erosion Prevention Effect. Water 2023, 15, 2854. [Google Scholar] [CrossRef]
- Liu, Z.J.; Si, J.H.; He, X.H.; Jia, B.; Zhou, D.M.; Wang, C.L.; Zhu, X.L.; Qin, J.; Ndayambaza, B.; Bai, X. The impact of desertification on soil health stability in semi-arid alpine regions: A case study of the Qilian Mountains in the northeastern Tibetan Plateau, China. Ecol. Indic. 2024, 163, 112098. [Google Scholar] [CrossRef]
- Liu, H.; Hao, H.G.; Sun, L.H.; Fan, Y.; Zhang, Z.; Zhou, T.T.; Liu, P.; Li, Y.Y. Evaluation and driving mechanism analysis of regional ecosystem stability in China based on biodiversity–stability relationships. Environ. Technol. Innov. 2024, 36, 103905. [Google Scholar] [CrossRef]
- Li, H.F.; Li, L.F.; Su, F.L.; Wang, T.L.; Gao, P. Ecological stability evaluation of tidal flat in coastal estuary: A case study of Liaohe estuary wetland, China. Ecol. Indic. 2021, 130, 108032. [Google Scholar] [CrossRef]
- Li, W.L.; Liu, C.L.; Su, W.L.; Ma, X.L.; Zhou, H.K.; Wang, W.Y.; Zhu, G.F. Spatiotemporal evaluation of alpine pastoral ecosystem health by using the Basic-Pressure-State-Response Framework: A case study of the Gannan region, northwest China. Ecol. Indic. 2021, 129, 108000. [Google Scholar] [CrossRef]
- Wang, L.; Chang, J.X.; He, B.; Guo, A.J.; Wang, Y.M. Analysis of oasis land ecological security and influencing factors in arid areas. Land Degrad. Dev. 2023, 34, 3550–3567. [Google Scholar] [CrossRef]
- Yu, C.Z.; Yu, H.; Xiang, Q.; Hu, W.K.; Yan, D.M. Spatio-temporal differentiation and its driving mechanism of ecological vulnerability in Sichuan Province. Environ. Sci. 2024, 45, 6922–6934. [Google Scholar] [CrossRef]
- Wang, J.F.; Li, X.H.; Christakos, G.; Liao, Y.L.; Zhang, T.; Gu, X.; Zheng, X.Y. Geographical detectors-based health risk assessment and its application in the neural tube defects study of the Heshun Region, China. Int. J. Geogr. Inf. Sci. 2010, 24, 107–127. [Google Scholar] [CrossRef]
- Song, Y.Z.; Wang, J.F.; Ge, Y.; Xu, C.D. An optimal parameters-based geographical detector model enhances geographic characteristics of explanatory variables for spatial heterogeneity analysis: Cases with different types of spatial data. GISci. Remote Sens. 2020, 57, 593–610. [Google Scholar] [CrossRef]
- Wang, B.Y.; Si, J.H.; Jia, B.; He, X.H.; Zhou, D.M.; Zhu, X.L.; Liu, Z.J.; Ndayambaza, B.; Bai, X. Monitoring spatial-temporal variability of vegetation coverage and its influencing factors in the Yellow River source region from 2000 to 2020. Remote Sens. 2024, 16, 4772. [Google Scholar] [CrossRef]
- Liu, P.; Hu, Y.; Jia, W. Land use optimization research based on FLUS model and ecosystem services: A case study of Jinan City. Urban Clim. 2021, 40, 100984. [Google Scholar] [CrossRef]
- Zhang, Y.; Yu, P.; Tian, Y.; Chen, H.; Chen, Y. Exploring the impact of integrated spatial function zones on land use dynamics and ecosystem services trade-offs based on a future land use simulation (FLUS) model. Ecol. Indic. 2023, 150, 110246. [Google Scholar] [CrossRef]
- Ye, J.; Meng, F.; Bai, W.; Zhang, B.; Zheng, J. A comparative study on the classification of GF-1 remote sensing images for Zhoukou urban under the four identical conditions. J. Geo-Inf. Sci. 2020, 22, 2088–2097. [Google Scholar] [CrossRef]
- Ma, W.Y.; He, L.; Zhao, C.Y. Desertification dynamics in Alxa League over the period of 2000–2012. J. Lanzhou Univ. 2015, 51, 55–60+71. [Google Scholar] [CrossRef]
- Zhu, X.L.; Si, J.H.; He, X.H.; Jia, B.; Zhou, D.M.; Wang, C.L.; Qin, J.; Liu, Z.J. Effects of long-term afforestation on soil water and carbon in the Alxa plateau. Front. Plant Sci. 2024, 14, 1273108. [Google Scholar] [CrossRef]
- Peng, Y.; Gan, L.; Ma, R.; Zhang, J.; Tao, H.; Zhang, Z. Spatial variability of soil water content under different vegetation cover in Guilin, Guangxi. Fujian J. Agric. Sci. 2016, 31, 497–502. [Google Scholar] [CrossRef]
- Lin, Y.M.; Li, W.H.; Nan, X.X.; Zhang, J.-H.; Hu, Z.-R.; Ni, X.-L.; Wang, F. Spatial-temporal differentiation and driving factors of vegetation coverage in Ningxia Helan Mountain based on geographical detector. Chin. J. Appl. Ecol. 2022, 33, 3321–3327. [Google Scholar] [CrossRef]
- Xiao, S.C.; Xiao, H.L. Water balance assessment and the lower reaches water regime processes in Heihe River Basin in the last 2000 years. J. Glaciol. Geocryol. 2008, 5, 733–739. [Google Scholar]
- Bi, X.; Shi, K.L.; Fu, Y.Y.; Zhou, W.Y.; Zhao, R.N.; Bao, H.J. Influence mechanism of natural factors and human socio-economic activities on ecosystem health in arid regions of Central Asia: A case study of Fuyun area, northwest China. Ecol. Indic. 2025, 173, 113356. [Google Scholar] [CrossRef]
- Cai, Z.C.; Zhang, Z.; Zhao, F.; Guo, X.H.; Zhao, J.B.; Xu, Y.Y.; Liu, X.P. Assessment of eco-environmental quality changes and spatial heterogeneity in the Yellow River Delta based on the remote sensing ecological index and geo-detector model. Ecol. Inform. 2023, 77, 102203. [Google Scholar] [CrossRef]
- White, H.J.; Gaul, W.; Sadykova, D.; León-Sánchez, L.; Caplat, P.; Emmerson, M.C.; Yearsley, J.M. Quantifying large-scale ecosystem stability with remote sensing data. Remote Sens. Ecol. Conserv. 2020, 6, 354–365. [Google Scholar] [CrossRef] [PubMed]
- Li, D.F.; Shao, M.G.; Zhang, S.P.; Zhang, K. The dynamics of soil moisture balance components and their relations with the productivity of natural vegetation in an arid region of northwestern China. Ecol. Eng. 2020, 143, 105672. [Google Scholar] [CrossRef]
- Wu, G.L.; Liu, Z.H.; Zhang, L.; Chen, J.M.; Hu, T.M. Long-term fencing improved soil properties and soil organic carbon storage in an alpine swamp meadow of Western China. Plant Soil 2010, 332, 331–337. [Google Scholar] [CrossRef]
- Huang, Y.Y.; Qiu, K.Y.; Zhu, Y.C.; Xie, Y.Z.; Liu, W.S.; Yang, Y.; Wang, S.Y.; Cui, L.Y.; Bao, P.A. Correlation between vegetation biomass and soil fractal characteristics and soil moisture at different elevations in the Helan Mountains. Acta Pratacult. Sin. 2023, 32, 24–35. [Google Scholar] [CrossRef]
- Shi, J.; Deng, L.; Wu, J.; Bai, E.; Chen, J.; Shangguan, Z.; Kuzyakov, Y. Soil organic carbon increases with decreasing microbial carbon use efficiency during vegetation restoration. Glob. Change Biol. 2024, 30, e17616. [Google Scholar] [CrossRef] [PubMed]
- Zheng, F.; Wu, X.; Zhang, M.; Liu, X.; Song, X.; Lu, J.; Wang, B.; van Groenigen, K.J.; Li, S. Linking soil microbial community traits and organic carbon accumulation rate under long-term conservation tillage practices. Soil Tillage Res. 2022, 220, 105360. [Google Scholar] [CrossRef]
- Lan, J.; Wang, S.; Wang, J.; Qi, X.; Long, Q.; Huang, M. The shift of soil bacterial community after afforestation influences soil organic carbon and aggregate stability in karst region. Front. Microbiol. 2022, 13, 901126. [Google Scholar] [CrossRef]
- Ren, L.; Huo, J.; Xiang, X.; Pan, Y.; Li, Y.; Wang, Y.; Meng, D.; Yu, C.; Chen, Y.; Xu, Z.; et al. Environmental conditions are the dominant factor influencing stability of terrestrial ecosystems on the Tibetan Plateau. Commun. Earth Environ. 2023, 4, 196. [Google Scholar] [CrossRef]
- Zhou, J.X.; Gu, Y.; Da, L.; Liu, Z. Monitoring of desertification and sandification status and dynamic change with remote sensing for Alashan. Arid Land Resour. Environ. 2014, 28, 126–130. [Google Scholar] [CrossRef]
- Min, Y.; Zhang, Y.; Kang, J.; Feng, K. Study on spatial–temporal dynamic monitoring of degree of desertification in CPEC based on MODIS image. Remote Sens. Technol. Appl. 2021, 36, 827–837. [Google Scholar]
- Wang, Y.S. Quantitative assessment and trend prediction of impacts of climate change and human activities on vegetation NPP in Inner Mongolia. Inn. Mong. Agric. Univ. 2024, 5, 1–75. [Google Scholar] [CrossRef]
- Wang, L.C.; Jiao, L.; Lai, F.B.; Zhang, N.M. Evaluation of ecological changes based on a remote sensing ecological index in a Manas Lake wetland, Xinjiang. Acta Ecol. Sin. 2019, 39, 2963–2972. [Google Scholar] [CrossRef]
- Zhu, Y.; Zhang, Y.; Zhu, Q.K.; Lu, L. Spatial distribution patterns of vegetations on natural grassland in Loess Plateau interfluve. Chin. J. Ecol. 2011, 30, 1063–1069. [Google Scholar] [CrossRef]
- Lu, Z.Y.F.; Xu, D.Y.; Zhang, X.J.; Zhao, Z.R.; Zhang, X.Y. Impact of land use change on ecosystem services in arid desert region of Alxa. Res. Soil Water Conserv. 2019, 26, 296–302. [Google Scholar] [CrossRef]
- Zhao, Z.Z.; Ma, Q.; Wang, Y.; Ma, C.; Wang, H.T. Analysis and prediction of ecological vulnerability of the Central Plains urban agglomeration based on the SRP model. Environ. Sci. 2025, 46, 1621–1632. [Google Scholar] [CrossRef]
- Xu, J.; Wang, D.R. Assessment and prediction of ecosystem health in the Yellow River Basin based on the VORS model. Ecol. Environ. Sci. 2024, 33, 1612–1623. [Google Scholar] [CrossRef]
- Wang, L.; Bai, J.J.; Zheng, C.L. Historical evolution and prediction of ecological carrying capacity in Inner Mongolia Autonomous Region. Ecol. Sci. 2021, 40, 155–163. [Google Scholar] [CrossRef]
- Ma, H.W.; Wang, Y.F.; Guo, E.L. Remote sensing monitoring of aeolian desertification in Ongniud Banner based on GEE. Arid Zone Res. 2023, 40, 504–516. [Google Scholar] [CrossRef]
- Giardina, C.P.; Ryan, M.G. Evidence that decomposition rates of organic carbon in mineral soil do not vary with temperature. Nature 2000, 404, 858–861. [Google Scholar] [CrossRef]
- Xie, Z.; Huang, Y. Ecological risk assessment of Yunnan province by coupling land use change and ecosystem services. J. Soil Water Conserv. 2025, 39. [Google Scholar] [CrossRef]
- Huang, M.D.; Xiao, Y.; Qin, K.Y.; Gan, S.; Xie, G.D.; Liu, J.Y.; Wang, Y.; Niu, Y.N.; Liu, J. Spatiotemporal dynamics and drivers of wind erosion prevention service in Otindag from 1980 to 2018. Acta Ecol. Sin. 2022, 42, 7612–7629. [Google Scholar] [CrossRef]
Disclaimer/Publisher’s Note: The statements, opinions and data contained in all publications are solely those of the individual author(s) and contributor(s) and not of MDPI and/or the editor(s). MDPI and/or the editor(s) disclaim responsibility for any injury to people or property resulting from any ideas, methods, instructions or products referred to in the content. |
© 2025 by the authors. Licensee MDPI, Basel, Switzerland. This article is an open access article distributed under the terms and conditions of the Creative Commons Attribution (CC BY) license (https://creativecommons.org/licenses/by/4.0/).