Article

Retrieval of Wave Parameters from GNSS Buoy Measurements Using Spectrum Analysis: A Case Study in the Huanghai Sea

1
College of Geodesy and Geomatics, Shandong University of Science and Technology, Qingdao 266590, China
2
Chinese Academy of Surveying and Mapping, Beijing 100830, China
3
College of Ocean Science and Engineering, Shandong University of Science and Technology, Qingdao 266590, China
*
Author to whom correspondence should be addressed.
Remote Sens. 2025, 17(16), 2869; https://doi.org/10.3390/rs17162869
Submission received: 25 June 2025 / Revised: 5 August 2025 / Accepted: 13 August 2025 / Published: 18 August 2025
(This article belongs to the Special Issue Advances in Multi-GNSS Technology and Applications)

Abstract

Global Navigation Satellite System (GNSS) buoys are widely used to retrieve wave parameters such as significant wave heights (SWHs) and dominant wave periods. In addition to the statistical methods employed to estimate wave parameters, spectral-analysis-based approaches are also frequently utilized to analyze them. This study presents statistical and spectral methods for retrieving wave parameters at GNSS buoy positioning resolution in the Huanghai Sea area. To verify the method’s effectiveness, the zero-crossing method and three spectral analysis techniques (periodogram, autocorrelation function, and autoregressive model methods) were used to estimate wave height and period for comparison. The vertical positioning resolution was decomposed into low-frequency ocean-tide level information and high-frequency wave height and period information with the Complete Ensemble Empirical Mode Decomposition (CEEMD) method and moving average filtering. The horizontal positioning results and velocity parameters were used to determine the wave direction using directional spectrum analysis. The results show that the three spectral methods yield consistent effective wave heights, with a maximum difference of 0.02 s in the wave period. Compared with the zero-crossing method results, the wave height and period obtained through spectral analysis differ by 0.05 m and 0.79 s, respectively, while the average wave height and period differ by 0.09 m and 0.08 s, respectively. The GNSS-derived wave heights also closely match tidal gauge observations, confirming the method’s validity. Directional spectrum analysis indicates that wave energy is concentrated in the 0.2–0.25 Hz frequency band and within a directional range of 0° ± 30°, with a dominant northward propagation trend. These findings demonstrate that the proposed approach can provide high accuracy and physical consistency for GNSS-based wave monitoring under complex sea conditions.

1. Introduction

Ocean waves, primarily driven by wind and tidal forces, are dynamic surface phenomena with significant variability across time and space scales. They play a crucial role in shaping marine ecosystems and designing coastal infrastructure, and they hold vast potential for renewable energy [1,2,3]. Accurate wave measurement and analysis are essential for ensuring maritime safety and supporting ocean energy exploitation [4].
Various techniques are used for wave measurement, each with distinct advantages and limitations. A wave staff, a straightforward tool fixed vertically to the seabed or platform, measures wave height via calibrated markings but is limited to stationary point measurements [5]. Pressure sensors, which determine wave height by measuring seabed pressure variations, are suitable for deep-water zones but exhibit reduced accuracy in shallow waters [6]. Acoustic wave gauges utilize sound wave reflections, making them suitable for various water depths, but they are costly and sensitive to changes in water temperature and salinity [7]. Optical wave measurement systems employ lasers or cameras to capture spatial wave profiles and require appropriate lighting conditions [8]. Shipborne wave measurement systems estimate wave parameters by analyzing vessel motion, allowing for real-time observations during navigation, though they are less accurate [9]. Radar systems provide all-weather, large-area wave monitoring capabilities but involve expensive equipment and complex data processing [10]. Satellite remote sensing provides global wave data coverage, but its temporal resolution is limited [11]. Currently, no single method achieves an optimal balance between high accuracy, low cost, and real-time measurement capabilities for comprehensive wave monitoring.
Wave buoys enable real-time measurement of key wave parameters, such as wave height, period, and direction, and are widely used for ocean wave monitoring. The first generation of laboratory wave buoys was developed in 1953 by the UK National Oceanography Centre to measure wave height and period [12]. In the 1970s, Datawell Corporation introduced the Waverider series of wave buoys, which provided high precision, real-time data transmission, and multi-parameter measurements, fulfilling diverse scientific research needs in ocean wave studies [13,14]. With continuous technological advancements, wave buoys have evolved from single-parameter measurement devices to multifunctional instruments capable of simultaneously determining wave direction, spectral characteristics, and marine environmental parameters [15]. In addition to high measurement accuracy, these buoys offer operational flexibility, allowing for their deployment in both open ocean and coastal areas and thus providing continuous wave data records [16].
In recent years, GNSS-equipped wave buoys have gained significant attention as cost-effective and accurate tools for ocean wave monitoring [17]. By integrating GNSS receivers into buoy systems, three-dimensional position and velocity data can be acquired through Precise Point Positioning (PPP) or Real-Time Kinematic (RTK) techniques, enabling effective wave inversion [18,19]. GNSS buoys offer advantages such as low cost, high precision, all-weather capability, and ease of deployment, making them particularly suitable for large-scale ocean surface wave monitoring [20]. Lutsenko et al. employed GNSS signals for wave monitoring and analyzed the feasibility of monitoring surface disturbances [21]. Yang et al. evaluated the feasibility and accuracy of using the single-frequency time-differential carrier phase (TDCP) to determine wave height and period, achieving high-precision and low-cost wave monitoring [22]. Using GNSS technology for wave measurement and directional wave spectrum analysis, Gu et al. demonstrated that GNSS buoys, through carrier phase and Doppler frequency shift data, can accurately extract parameters such as wave height, period, and direction, generating high-resolution directional spectra [23]. Liang et al. deployed and tested GNSS buoys in the open ocean; the results verified the ability of GNSS buoys to continuously measure sea level and waves in the open ocean [24].
In addition to their standalone capabilities, GNSS buoys have been increasingly integrated with complementary technologies to enhance measurement accuracy, spatial resolution, and functionality in ocean wave monitoring. GNSS Reflectometry (GNSS-R), which analyzes signals reflected from the sea surface, has proven effective in retrieving wave height and wavelength [25,26]; Ruffini et al. further demonstrated its centimeter-level accuracy in low-altitude aerial experiments [27]. GNSS–acoustic positioning combines GNSS signals with underwater acoustics for high-precision monitoring of seabed displacement and wave dynamics [28], with Tomita et al. improving vertical accuracy by addressing uncertainties in sound speed profiles [29]. Shore-based GNSS reference networks, which deploy high-precision GNSS receivers along coastlines, are widely applied in marine observation and deformation monitoring [30,31]. Virtual Base Station Real-Time Kinematic (VBS-RTK) technology, which uses virtual reference stations derived from surrounding continuously operating GNSS stations to achieve precise real-time positioning, was validated by Lin et al. in the Su’ao waters of Taiwan—demonstrating agreement with both tide gauge data and ATC (accelerometer–inclinometer–compass) sensor results [32]. Shipborne GNSS platforms provide flexible real-time observation solutions for complex sea states; for example, Wang et al. successfully applied shipborne GNSS-R during Antarctic expeditions to invert wave height and wind speed from reflected signals [33,34]. Through the integration of these technologies, GNSS buoys have evolved into more comprehensive and versatile observation platforms for high-resolution, multi-parameter ocean wave monitoring under diverse conditions.
Accurate inversion of ocean wave parameters is essential for understanding sea state dynamics, supporting marine engineering, and ensuring navigational safety. With the growing availability of high-resolution measurement platforms such as GNSS buoys, robust and precise wave inversion algorithms have become a research focus. These algorithms typically extract and interpret wave signals using two primary analytical frameworks: statistical techniques and spectral analysis [35]. Statistical methods describe wave motion characteristics under simplified conditions but are limited to time and spatial domains [36,37]. Waves can be modeled as the superposition of cosine components with different amplitudes, frequencies, orientations, and phases, with the wave energy distribution depending deterministically on wave frequencies [38,39]. Wave spectrum analysis and directional spectrum analysis are widely applied to overcome the limitations of statistical methods [40,41]. Spectral analysis decomposes waves into frequency components and provides wave energy distribution versus frequency, enabling derivation of statistical parameters such as wave height and period via spectral moments [42]. Besides the commonly used Fast Fourier Transform (FFT) and Welch method, other techniques, such as the periodogram (a direct Fourier-based method), autocorrelation function (based on signal correlation), and autoregressive (AR) model (a parametric method using linear prediction), have also been applied to wave analysis [43,44,45]. While spectral shapes may vary depending on the method, the derived statistical features are generally consistent [46]. Directional spectrum analysis extends this method by estimating wave energy distribution in terms of both frequency and direction, offering insights into wave propagation [47]. Key approaches include the direct Fourier transform, parametric modeling, maximum likelihood and entropy methods, wavelet-based techniques, Bayesian estimation, and extended eigenvector methods [48,49].
This study proposes a multi-parameter wave inversion framework based on GNSS buoys that integrates time-domain statistical and frequency-domain spectral techniques to extract key wave parameters—including height, period, and direction—and characterize the two-dimensional wave energy distribution. GNSS buoys effectively combine accuracy and cost efficiency: by acquiring the absolute position and velocity of the buoy in real time, they avoid introducing systematic bias during wave measurement. As GNSS receiver technology becomes more affordable, such buoys enable low-cost, high-density deployments over wide marine areas, significantly expanding observational coverage and improving monitoring efficiency. Field tests in the Yellow Sea demonstrate the method’s stability and reliability for large-scale, real-time monitoring. The results show the enhanced accuracy of wave parameter inversion, offering reliable data support for applications such as marine disaster mitigation and resource development.
In this study, a 10 m GNSS buoy—originally developed for long-term marine meteorological observation and satellite altimetry calibration—was used as the experimental platform. Given its proven operational stability and deployment history, the platform provides a practical basis for validating the proposed GNSS-based wave monitoring approach. Rather than conducting simulation-based assessments of the buoy’s wave-following characteristics, we focused on evaluating its real-world measurement performance under actual sea conditions. This design reflects the study’s emphasis on feasibility verification under actual field constraints.

2. Methods and Principles

2.1. Statistical Inversion of Wave Period and Wave Height

Statistical analysis is used to characterize and examine the statistical properties of ocean waves. These methods provide quantitative representations of wave data, facilitating a deeper understanding of wave variability and temporal patterns. The zero-crossing method is a statistical approach commonly employed in wave analysis, primarily to derive wave periods and heights from time series data. This technique relies on zero-crossing points within wave signals to capture wave periodicity and height characteristics [35].
First, the wave signal is analyzed to detect zero-crossing points, which occur when the signal transitions from negative to positive, indicating the start or end of a wave cycle. By measuring the time interval between consecutive zero-crossing points, the wave period can be determined. The duration between two successive zero-crossings represents one complete wave period, and averaging multiple periods offers insights into the wave’s periodic characteristics. Subsequently, wave height is estimated using the zero-crossing method. After identifying the wave’s crests (highest points) and troughs (lowest points), the vertical distance between them is calculated to represent the wave height. This method effectively determines wave height by analyzing the amplitude variations between successive crests and troughs.
To obtain the wave height sequence H i ( i = 1 , 2 , , N ) , the wave heights are arranged in descending order, which represents the ranking of wave height magnitudes. Correspondingly, the wave period sequence H i ( i = 1 , 2 , , N ) can be derived, though it should be noted that the wave period sequence is not ordered by period magnitude but rather follows the ranking obtained for the wave height sequence. Table 1 provides the commonly used characteristic values in wave statistical analysis [36].
The highest one-third wave height ( H 1 / 3 ) and highest one-third wave period ( T 1 / 3 ) are commonly referred to as the significant wave height ( H s ) and significant wave period ( T s ), respectively, serving as generalized representations of sea state characteristics.

2.2. Wave Period and Wave Height Inversion Based on Spectral Analysis

Wave spectrum analysis is used to investigate the frequency composition of ocean waves, specifically how wave energy is distributed across different frequencies. Through spectral analysis, it is possible to identify the dominant frequency components within a wave signal and characterize the periodic nature of the waves. The wave spectrum not only provides the energy distribution as a function of frequency but also enables the derivation of various first-order statistical wave parameters, such as wave height and wave period, from the spectral moments [38].

2.2.1. Theoretical Basis of Wave Spectrum Analysis

Wave spectrum analysis is based on random wave theory, the core of which is the treatment of sea surface fluctuations as a random process composed of simple harmonic waves of different frequencies, amplitudes, and phases. According to Longuet-Higgins’ linear wave theory, the vertical displacement of the sea surface can be expressed as follows:
ζ ( t ) = n = 1 a n cos ( ω n t + ε n )
where a n represents the wave amplitude, ω n denotes the angular frequency, and ε n is defined as a uniformly distributed random phase. According to random wave theory, the total energy of a wave in the frequency interval ( ω , ω + Δ ω ) is as follows:
ω ω + Δ ω 1 2 a n 2 = S ( ω ) Δ ω
where S(ω) is the wave power spectral density, which characterizes the distribution of wave energy in different frequency components [42].
This theoretical framework lays a solid foundation for wave spectrum analysis and provides a theoretical basis for subsequent spectral estimation methods.

2.2.2. Wave Spectrum Estimation Method

The process of deriving wave spectra from measured wave data using various estimation techniques is referred to as wave spectrum estimation. The wave spectrum primarily characterizes the relationship between wave energy and frequency. The corresponding spectral estimation methods can be categorized into classical spectral estimation and modern spectral estimation.
Classical spectral estimation methods are based on the Fourier transform and are suitable for analyzing stationary random processes. These methods obtain the power spectral density by calculating the autocorrelation function and subsequently performing a Fourier transform. Commonly used classical spectral estimation methods include the autocorrelation function, periodogram, Bartlett, and Welch methods [43,50].
Modern spectral estimation methods, on the other hand, introduce parametric models to describe the signal generation process and obtain the power spectral density by estimating the model parameters. These methods are typically applied to process short data records and non-stationary signals. In modern spectral estimation, the most commonly used models include the AR (Autoregressive) model, MA (Moving Average) model, and ARMA (Autoregressive Moving Average) model. Among these, the AR model is particularly effective in providing high-resolution spectrum estimates with relatively simple computational implementation, making it suitable for rapid application and analysis, especially for wave data with short time series [45].
(1)
Classical Spectral Estimation Methods
Classical spectral estimation methods are based on the Fourier transform. These methods feature straightforward computation and clear physical interpretation. Commonly used classical spectral estimation techniques include the autocorrelation function and periodogram methods.
  • Autocorrelation Function Method
The autocorrelation function method uses indirect processing. First, the wavefront time series is processed to obtain its autocorrelation function. Then, the autocorrelation function is processed using the Fourier transform to obtain the estimated value of the coarse spectrum, and finally, the obtained coarse spectrum is smoothed. The formula of the autocorrelation function is as follows:
R ( τ ) = 1 N v n = 1 N v ζ ( t n ) ζ ( t n + τ ) , v = 1 , 2 , , m
where N represents the number of samples, τ denotes the time delay at which the autocorrelation is computed, ν is an auxiliary variable that adjusts the summation range to ensure that t n + τ does not exceed the signal length N , and m is the maximum lag order, which defines the upper limit of v and τ .
S ( ω ) = 2 π 0 R ( τ ) cos ( ω τ ) d τ
The spectral value can be obtained by substituting Equation (3) into the above equation and integrating the corresponding values, with L n used to represent the rough spectral estimate at frequency f n . The trapezoidal formula is used in the numerical integration, and the spectral value is as follows:
L n = 2 π 1 2 R ( 0 ) + v = 1 m 1 R ( v Δ t ) cos ( 2 π f n v Δ t ) + 1 2 R ( m Δ t ) cos ( 2 π f n m Δ t ) n = 0 , 1 , 2 , , m
The frequency interval used in the above expression is as follows:
Δ f = f N / m = 1 2 m Δ t f n = n Δ f = n m 1 2 Δ t
Substituting the above equation into Equation (5) yields the following:
L n = 2 Δ t π 1 2 R ( 0 ) + v = 1 m 1 R ( v Δ t ) cos π v n m + 1 2 R ( m Δ t ) cos π n n = 0 , 1 , 2 , , m
The spectral values obtained from the above estimation may exhibit local fluctuations due to the finite sample length and numerical effects. To suppress these variations and enhance spectral smoothness, a three-point weighted moving average filter is applied. The weights used are 0.23, 0.54, and 0.23, assigned to the current point and its two immediate neighbors.
This specific set of weights is not arbitrary; it is chosen to satisfy the following desirable properties: (1) symmetry, which ensures zero phase distortion; (2) normalization, preserving the amplitude scale of the spectrum; (3) a larger central weight that emphasizes the main frequency component while still smoothing out local fluctuations.
Among possible choices that meet these criteria, the values {0.23, 0.54, 0.23} represent a practical and balanced solution and are widely adopted in engineering practice for smoothing tasks [51,52]. The smoothing operation is expressed as follows:
S ( f n ) = 0.23 L N 1 + 0.54 L N + 0.23 L N + 1
2.
Periodogram Method
The periodogram method, also known as the direct method, is a classical spectral estimation technique. The basic idea is to directly apply the Fourier transform to the wave surface displacement sequence to obtain the spectral density. Specifically, this method first calculates the autocorrelation function of the wave surface displacement and then applies the Fourier transform to obtain the spectrum. During this process, the periodogram method effectively estimates the spectral distribution of the signal [43].
Assuming that the waves are a stationary process with statistical stationarity, observing the waves allows for the acquisition of a wave surface height sequence ζ t . The spectral energy density function of this sequence can be expressed as follows:
S ^ ω = lim T 1 2 π T X ( ω ) 2
where ω is the angular frequency, S ^ ω is the spectral density, T is the total observation period, and X ω is the Fourier transform of ζ t . For the discrete value of ζ t , the following formula is obtained:
X ω = n = 1 N ζ n e j n ω Δ t Δ t
where ζ n represents the sample values of ζ t for n = 1 , 2 , , N ; Δ t is the sampling interval; j is the imaginary unit; and T = N Δ t . Substituting Equation (10) into Equation (9) yields the following formula:
S ^ ( ω ) = Δ t 2 π N n = 1 N ζ n e j n ω 2 , ω < π / Δ t
When Δ t = 1 , the above formula can be changed to the following formula:
S ^ 1 ( ω ) = 1 2 π N n = 1 N ζ n e j n ω 2 , ω < π
where ζ n is the wavefront height obtained by sampling per unit time. The above two formulas can be used to obtain the following formula:
S ^ ( ω ) = Δ t S ^ 1 ( ω Δ t )
Under the condition of Δ t 1 , the initial computation may be performed using Equation (12), with subsequent conversion to S ^ 1 ( ω ) via Equation (13). To enable discrete-value computation, the following formula is introduced:
ω r = 2 π r / N
where r is an integer, and 0 r N 2 . Thus, the equation becomes the following:
S ^ 1 ( 2 π r N ) = = 1 2 π N n = 1 N ζ n e j 2 π r N ( n 1 ) e j 2 π N 2 = 1 2 π N n = 1 N ζ n e j 2 π r N ( n 1 ) 2
To align with the functional formulation of the Fourier transform, we adjust the index of ξ n by defining ξ n = ξ n 1 , yielding the following:
S ^ 1 ( 2 π r N ) = 1 2 π N n = 1 N ζ n 1 e j 2 π r N ( n 1 ) 2 = 1 2 π N A r 2 , r = 0 , 1 , 2 , , N / 2
The expanded form of A r is A r = k = 1 N ζ k e j 2 π r N k ; the spectrum of the above formula is the value of ω ( 0 , π / Δ t ) , and the value of ω ( π / Δ t , 0 ) can be obtained from the symmetry.
Consequently, the problem of power spectral estimation reduces to the computation of A r . As with the autocorrelation function method, the raw spectrum obtained using this approach may exhibit local fluctuations due to numerical artifacts. To mitigate these effects and improve spectral continuity, a three-point weighted moving average filter is applied to smooth the spectrum. This post-processing step enhances the stability and accuracy of the spectral estimates.
(2)
Modern Spectral Estimation Methods
Modern spectral estimation methods are based on stochastic process modeling, where sampled data are used to construct parametric models that provide improved spectral resolution. Common models include the Autoregressive (AR), Moving Average (MA), and Autoregressive Moving Average (ARMA) models. For power spectral estimation, the MA model generally provides lower resolution, while the ARMA model involves more complex and cumbersome parameter estimation. Therefore, the AR model is typically preferred in modern spectral analysis due to its computational efficiency and relatively simple implementation [45].
In the AR parametric method, the input sequence u ( n ) is assumed to be a white noise series with zero mean and variance σ 2 . This sequence drives a linear system with the transfer function H ( z ) , producing the output sequence x ( n ) . The system parameters can be estimated from either x ( n ) or its autocorrelation function r x ( m ) , enabling power spectral estimation. The input–output relationship is as follows:
ζ n = k = 1 p a k ζ ( n k ) + k = 0 q b k u ( n k ) , b 0 = 1
The transfer function and power spectrum of the AR model are as follows:
ζ n = k = 1 p a k ζ ( n k ) + u ( n )
In the above equation, the white noise sequence u ( n ) has a zero mean and a variance of σ 2 , where p denotes the model order, and a k represents the model parameters. The transfer function and power spectrum of this model are, respectively, given by
H ( z ) = 1 1 + k = 1 p a k e j 2 π f k Δ t 2
P x ( f ) = σ 2 Δ t 1 + k = 1 p a k e j 2 π f k Δ t 2
The autocorrelation function r x ( m ) and AR coefficients a k satisfy the following:
r x ( m ) = k = 1 p a k r x ( m k )         m 1 k = 1 p a k r x ( k ) + σ 2       m = 0
which can be expressed in matrix form (using the even symmetry of r x ( m ) as follows:
r x ( 0 ) r x ( 1 ) r x ( 2 ) r x ( 0 ) r x ( 1 ) r x ( 0 ) r x ( 1 ) r x ( p 1 ) r x ( 2 ) r x ( 0 ) r x ( 0 ) r x ( p 2 ) r x ( p ) r x ( p 1 ) r x ( p 2 ) r x ( 0 ) 1 a 1 a 2 0 = σ 2 0 0 0
This is the Yule–Walker equation, the cornerstone of AR parameter estimation.
In practical AR spectral estimation, the model order p is a critical parameter influencing the accuracy and stability of the spectral results. In this study, the AR model order was empirically determined using the Burg algorithm, with a relatively high order (order = 100) adopted. Sensitivity analyses were conducted by comparing spectral estimations with AR orders ranging from 10 to 100. These analyses indicated that the spectral shapes and derived wave parameters stabilized for AR orders above approximately 50, while orders below 20 produced noticeable spectral distortions. Therefore, an order of 100 was selected as a practical trade-off between spectral resolution and computational complexity.

2.2.3. Calculation of Wave Characteristic Elements

The wave spectrum not only describes the distribution of wave energy in different frequencies but also enables the derivation of first-order statistical wave parameters through its spectral moments [22,23]. The relationships between these statistical parameters and the spectral moments m n are as follows:
H ¯ = 2 π m 0 H s = H 1 / 3 = 4 m 0 T ¯ = 1.2 T 0 , 2 = 2.4 π m 0 / m 2 T s = T H 1 / 3 = 0.937 T p
where H ¯ is the mean wave height, H s is the significant wave height, T ¯ is the mean wave period, T s is the significant wave period, T p is the peak period (corresponding to maximum spectral density), and T 0 , 2 is the mean period calculated from the zeroth and second spectral moments [37] as follows:
T 0 , 2 = 2 π m 0 / m 2
where m n ( n = 0 , 1 , 2 ) is the n-th-order spectral moment of the wave spectrum S ( ω ) , and its expression is as follows:
m n = 0 ω n S ( ω ) d ω
where ω n represents the n-th power of angular frequency ω , and other symbols maintain their previously defined meanings.

2.3. Wave Direction Analysis Based on Directional Spectrum

Wave spectrum analysis provides the one-dimensional distribution of wave energy with respect to frequency. However, to obtain the two-dimensional distribution of wave energy in terms of both frequency and direction, directional spectrum analysis must be employed. Observing and analyzing directional spectra typically require synchronous measurements of wave characteristics from multiple observation points, making the process significantly more complex than frequency spectrum analysis, with considerably higher observation costs. When the wave frequency spectrum is already known, the directional spectrum can be estimated by utilizing the relationship between the one-dimensional frequency spectrum and the two-dimensional directional spectrum [16].
The directional spectrum can be expressed in terms of the wave frequency spectrum S ( f ) and the directional spreading function G ( f , θ ) as follows:
S ( f , θ ) = S ( f ) G ( f , θ )
π π G ( f , θ ) d θ = 1
where S ( f ) is the spectrum; G ( f , θ ) is the directional distribution function, which cannot be negative, and the integral from π to π is 1; and the variables f and θ correspond to wave frequency and direction, respectively. It is evident that once S ( f ) is determined, G ( f , θ ) becomes the key to solving for the directional spectrum.
The directional spreading function G ( f , θ ) can be obtained through cross-spectral analysis of the wave displacement time series measured in two horizontal directions. The function may be expressed as follows:
G ( f , θ ) = 1 π 1 2 + a 1 cos ( θ ) + b 1 sin ( θ ) + a 2 cos ( 2 θ ) + b 2 sin ( 2 θ ) +
This formulation can be derived from wave cross-spectra.
Wave cross-spectra represent frequency-domain characteristics of wave signals. In wave analysis, cross-spectra not only reveal frequency coherence between two time series but also indicate the directional distribution of wave energy, making them essential tools for directional spectral estimation.
The cross-spectrum between any two wave signals is given by the following [23]:
S p , q ( f ) = 1 T F ¯ p ( f ) F q ( f ) = C p q ( f ) i Q p q ( f ) p , q = 1 , 2 , 3 ,
where S p , q ( f ) denotes the cross-spectrum between wave measurements p and q . Here, F q ( f ) is the Fourier transform of signal q , while F ¯ p ( f ) represents the complex conjugate of the Fourier transform of signal p . The terms C p q ( f ) and Q p q ( f ) correspond to the co-spectrum and quadrature spectrum, respectively.
The wave surface elevation sequence and the displacement time series ( u , w , n ) in the east–west and north–south directions are Fourier transformed to obtain the real and imaginary parts of their frequency-domain Fourier coefficients as follows:
F u f = α u f + i β u f , F w f = α w f + i β w f , F n f = α n f + i β n f
The isotropic spectrum C p q ( f ) and anisotropic spectrum Q p q ( f ) can be derived as follows:
C n u = A ¯ n f × A ¯ u f = α n f α u f + β n f β u f Q n u = A ¯ n f × A ¯ u f = α n f α u f β n f β u f
From the definition of the anisotropic spectrum, we know that Q u u = Q w w = Q n n = 0 , and from the physical properties of waves, we know that Q n w = Q w n = 0 ; thus, we can obtain the 3 × 3 matrices of isotropic and anisotropic spectra as follows:
C w w C w n C w u C n w C n n C n u C u w C u n C u u   and   0 0 Q w u 0 0 Q n u Q u w Q u n 0
Based on the joint analysis of isotropic and anisotropic spectra, the directional distribution characteristics of wave energy are determined by substituting the calculated Fourier coefficients a 1 , a 2 , b 1 , and b 2 into the directional distribution function (28). The peak direction of the directional distribution function G ( f , θ ) is the dominant propagation direction of the frequency component.

3. Wave Data Acquisition and Signal Extraction

3.1. GNSS-Buoy-Based Data Collection and Processing

The experimental data used in this study were acquired from a GNSS buoy deployed in the coastal waters of Qingdao, China, on 27 April 2023. The location of the field experiment is illustrated in Figure 1.
The experiment employed a large GNSS buoy (10 m buoy body) deployed 3 km from the reference station. The buoy was equipped with a Hi-Target Vnet8 receiver (Hi-Target, Shenzhen, China) as the GNSS module and a high-precision HZZACF-S808 GNSS antenna (Hi-Target, Shenzhen, China), with data sampled at 1 Hz. To validate the effectiveness of the proposed wave measurement method, wave monitoring results obtained from other sensors installed on the buoy were used as reference data.
The GNSS buoy data were processed using Real-Time Kinematic (RTK) technology to derive coordinate time series. Data were processed using RTKLIB (version 2.4.3), an open-source GNSS positioning software developed by the Tokyo University of Marine Science and Technology. Key parameter settings used for data processing are summarized in Table 2 (unlisted parameters retained their default values).
The raw GNSS buoy observations were processed using RTK positioning to obtain displacement time series in the North–East–Up coordinate system, as shown in Figure 2. Through position differencing and coordinate transformation, velocity information in the NEU directions was derived. Subsequent integration of these velocity components, followed by Complete Ensemble Empirical Mode Decomposition (CEEMD) filtering—a data-driven signal decomposition technique effective for extracting non-stationary and nonlinear wave components—and moving average filtering, yielded the final wave surface displacement measurements from the GNSS buoy.
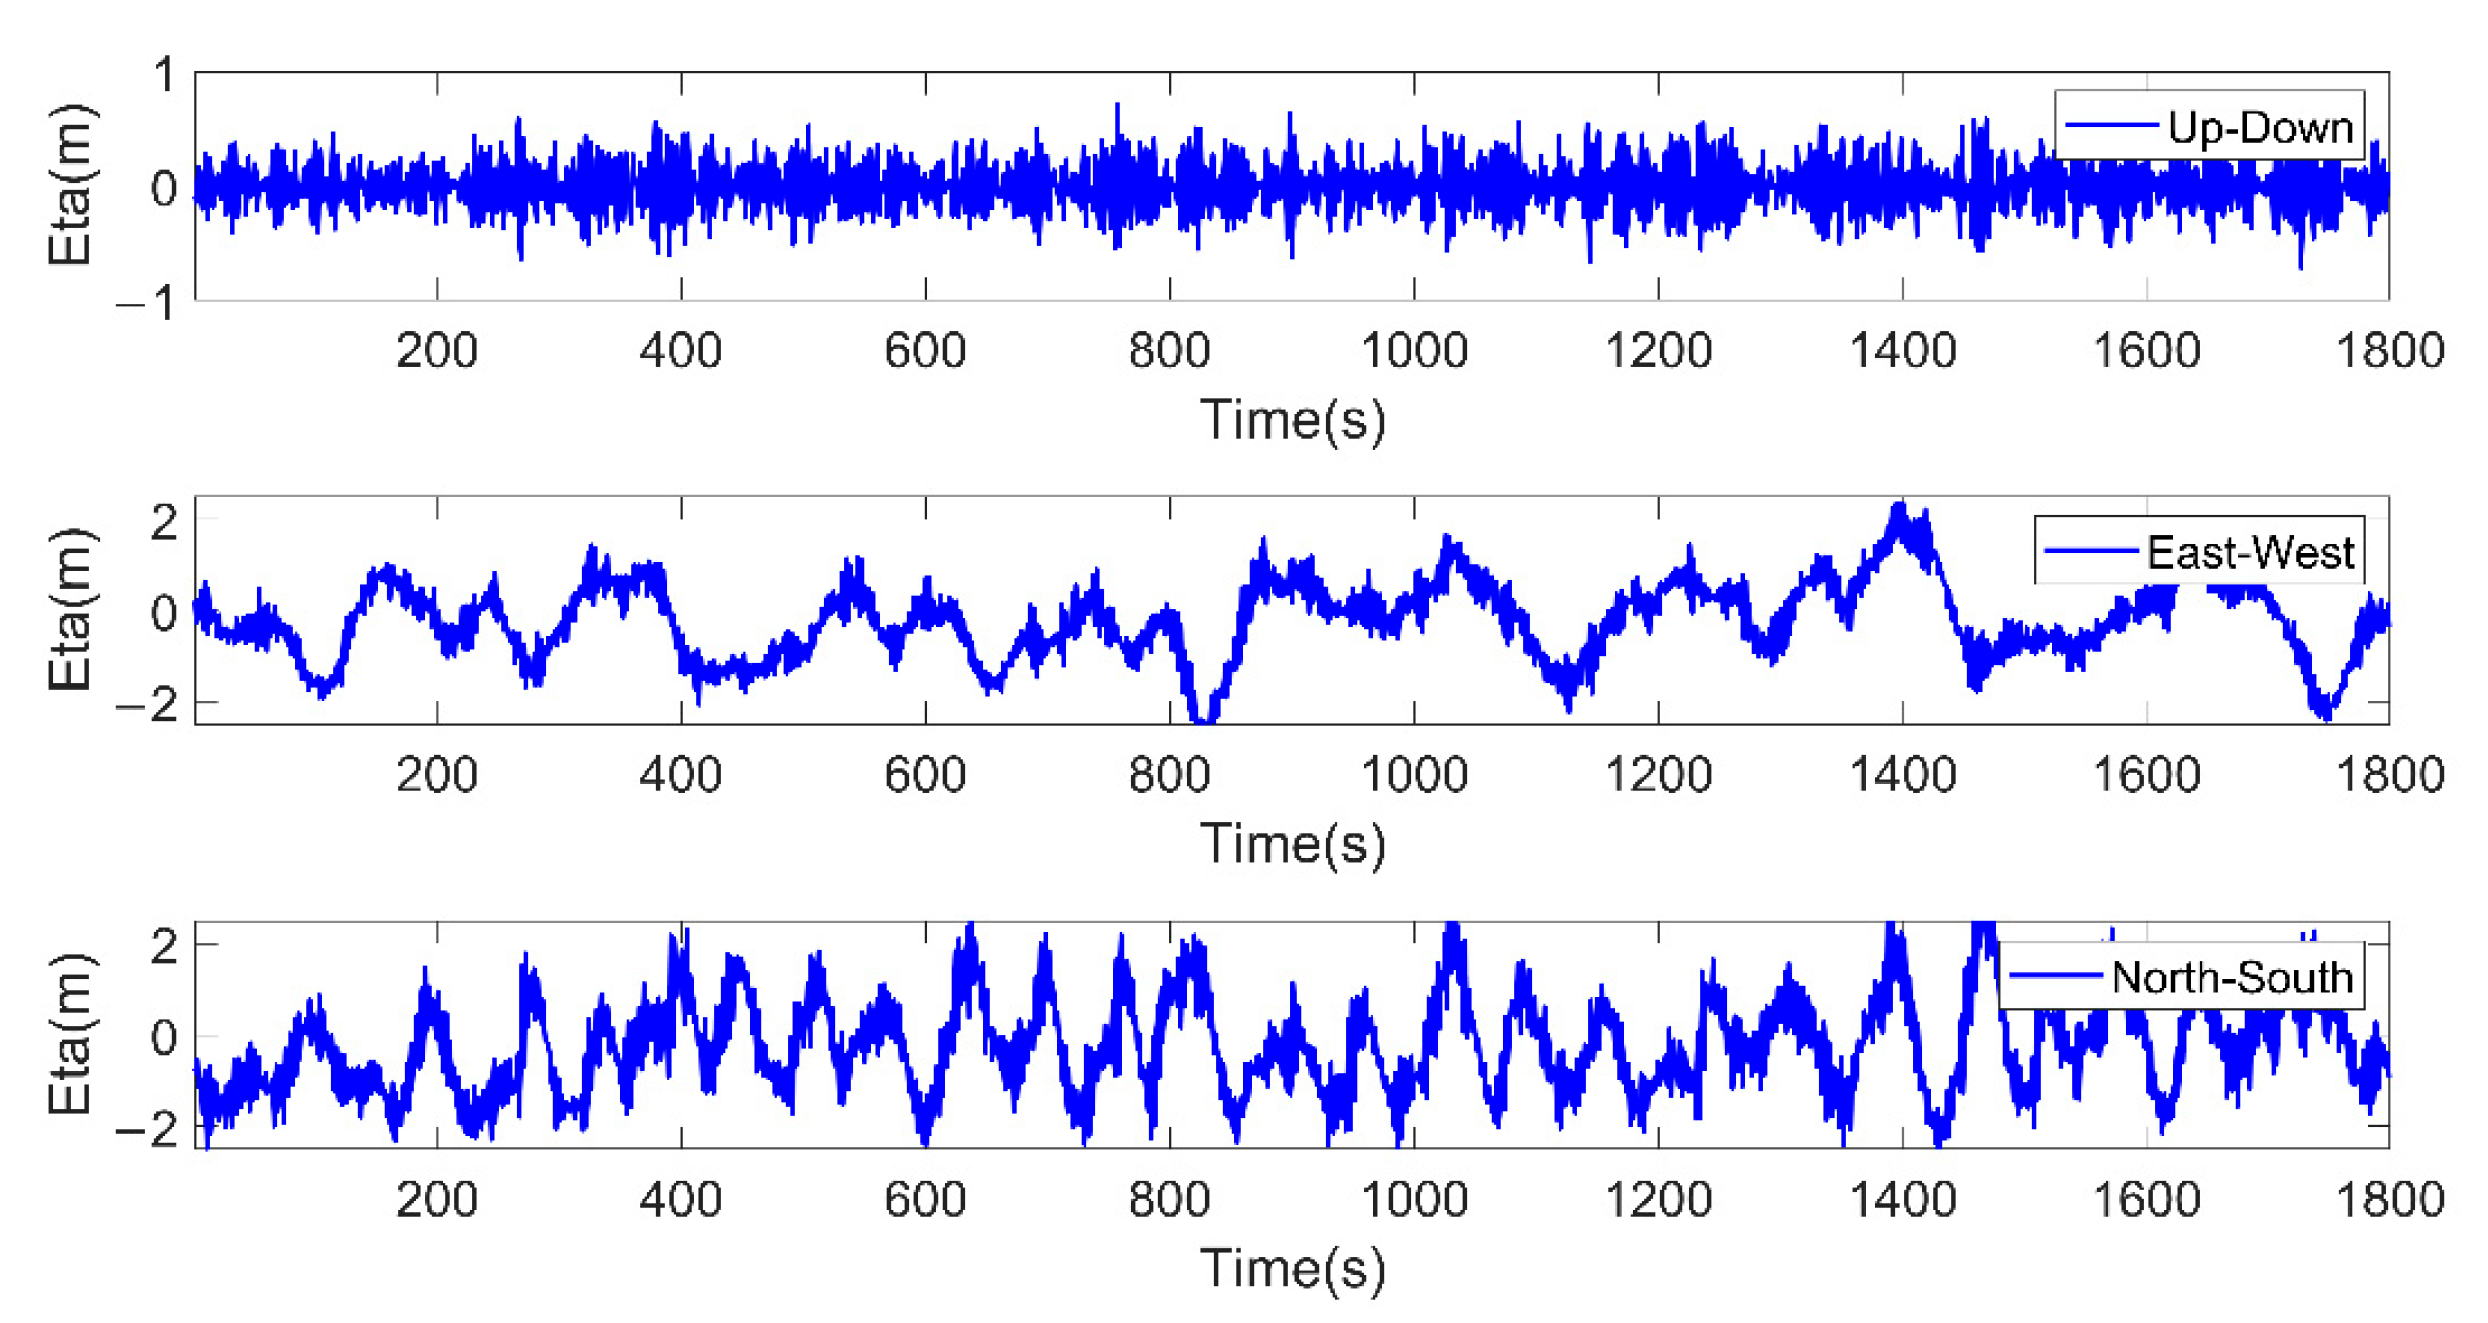
The three-dimensional wave surface displacement time series of the GNSS buoy were obtained by integrating the velocity components in the NEU (North–East–Up) directions, as shown in Figure 3.
Spectral analysis of the vertical (U-direction) displacement time series yields key wave parameters, including wave height and period. By applying Fourier transforms to both vertical and horizontal displacement components, cross-spectral analysis can be performed to derive the directional spreading function. Combined with the frequency spectrum results, this function enables the determination of directional wave spectrum characteristics.

3.2. GNSS-Based Ocean Wave Signal Data Processing

3.2.1. Ocean Wave Signal Separation and Extraction

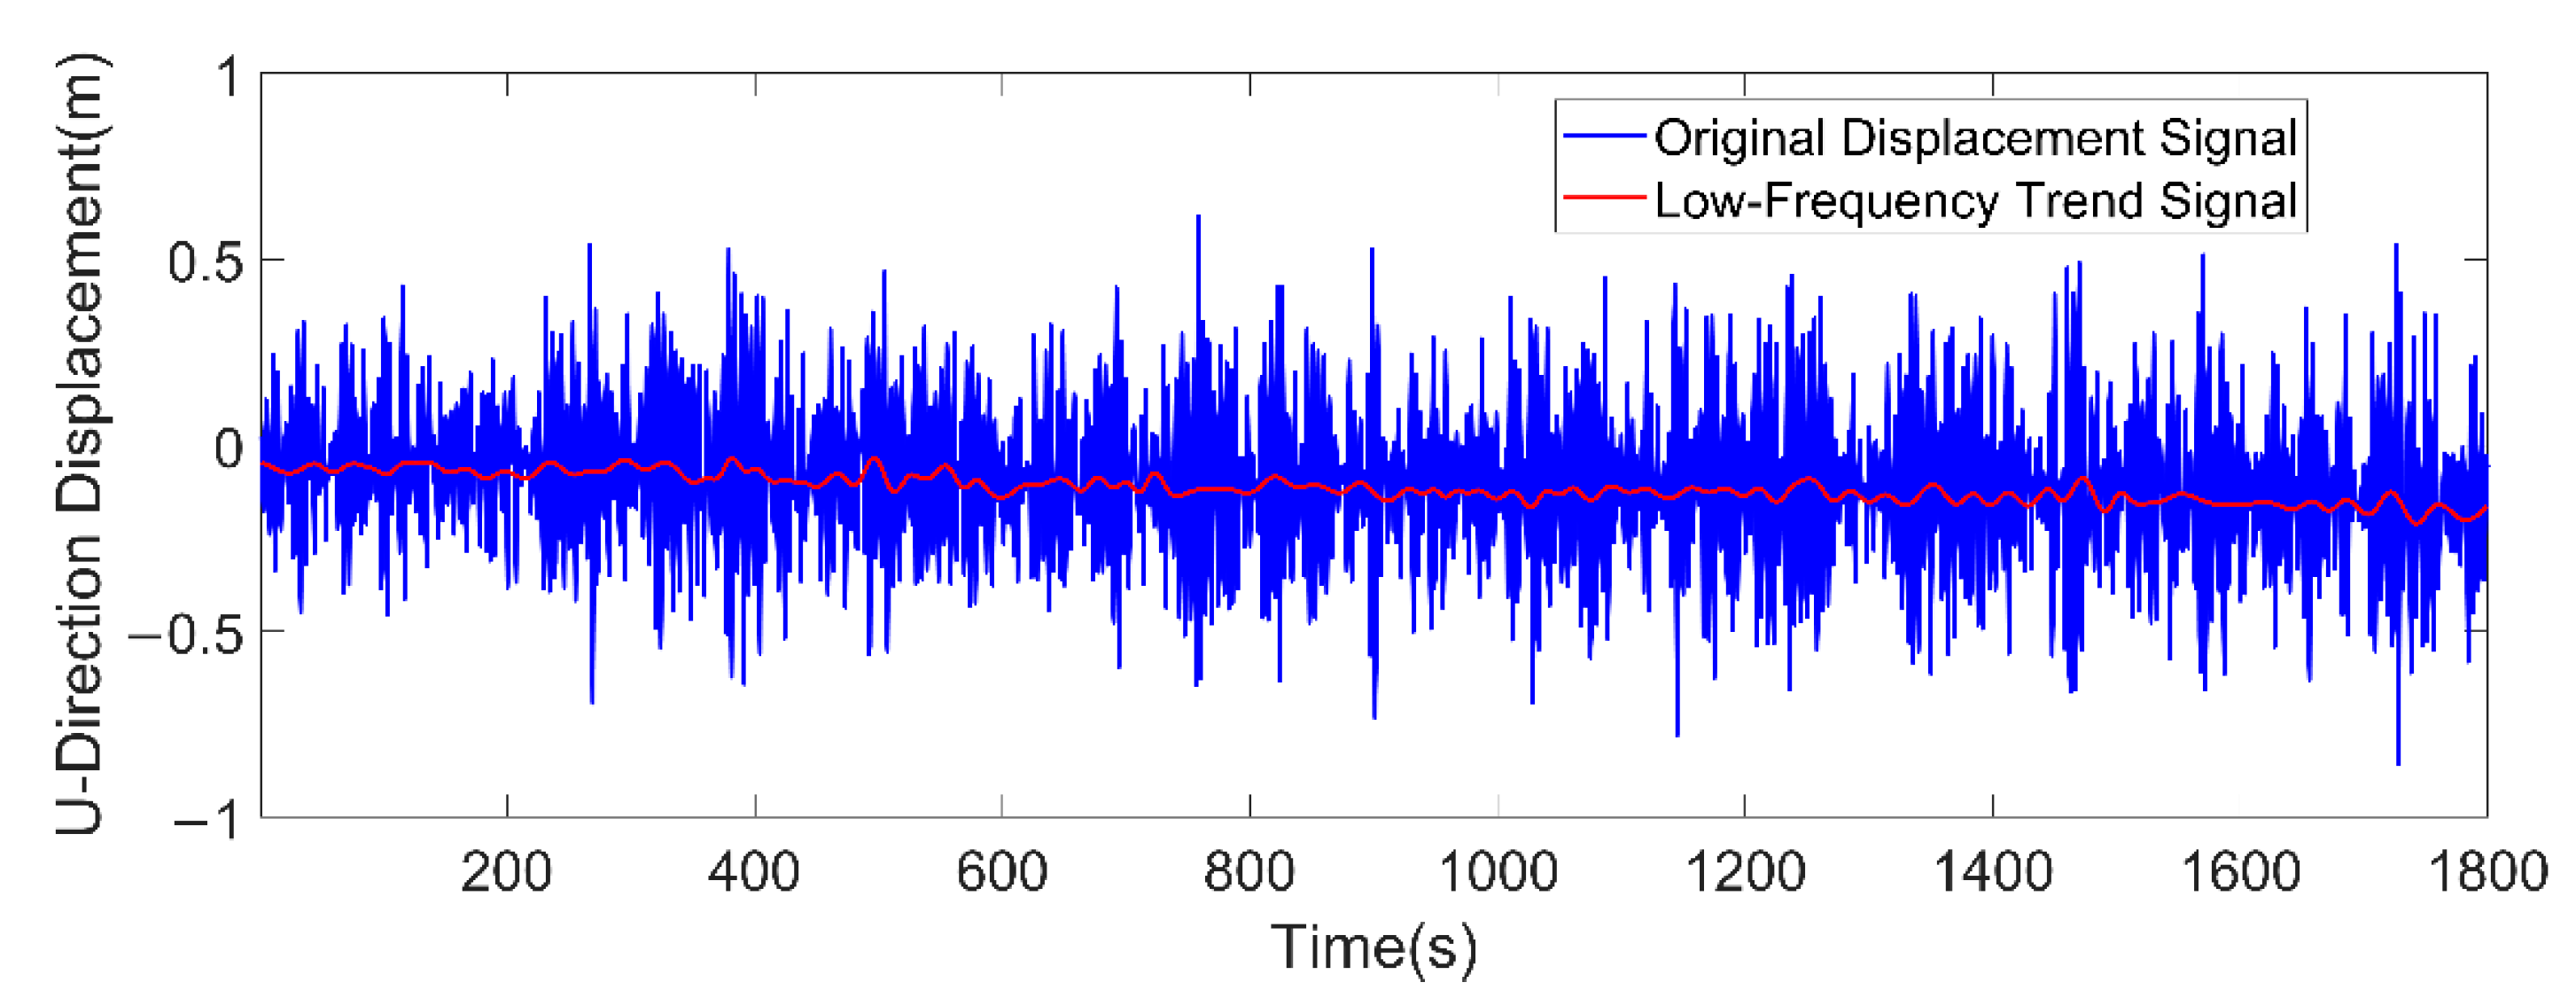
By isolating the vertical (U-direction) displacement time series, sea surface fluctuations can be obtained. Figure 4 presents a 30 min U-direction wave surface displacement sequence from 11:30 to 12:00 UTC on 27 April 2023. The time series exhibits distinct low-frequency components, primarily attributable to tidal signals. Wave and tidal signals differ in their periodicities, so appropriate filtering methods are used to effectively separate these components. Commonly employed approaches include time-domain filtering and spatial filtering techniques.
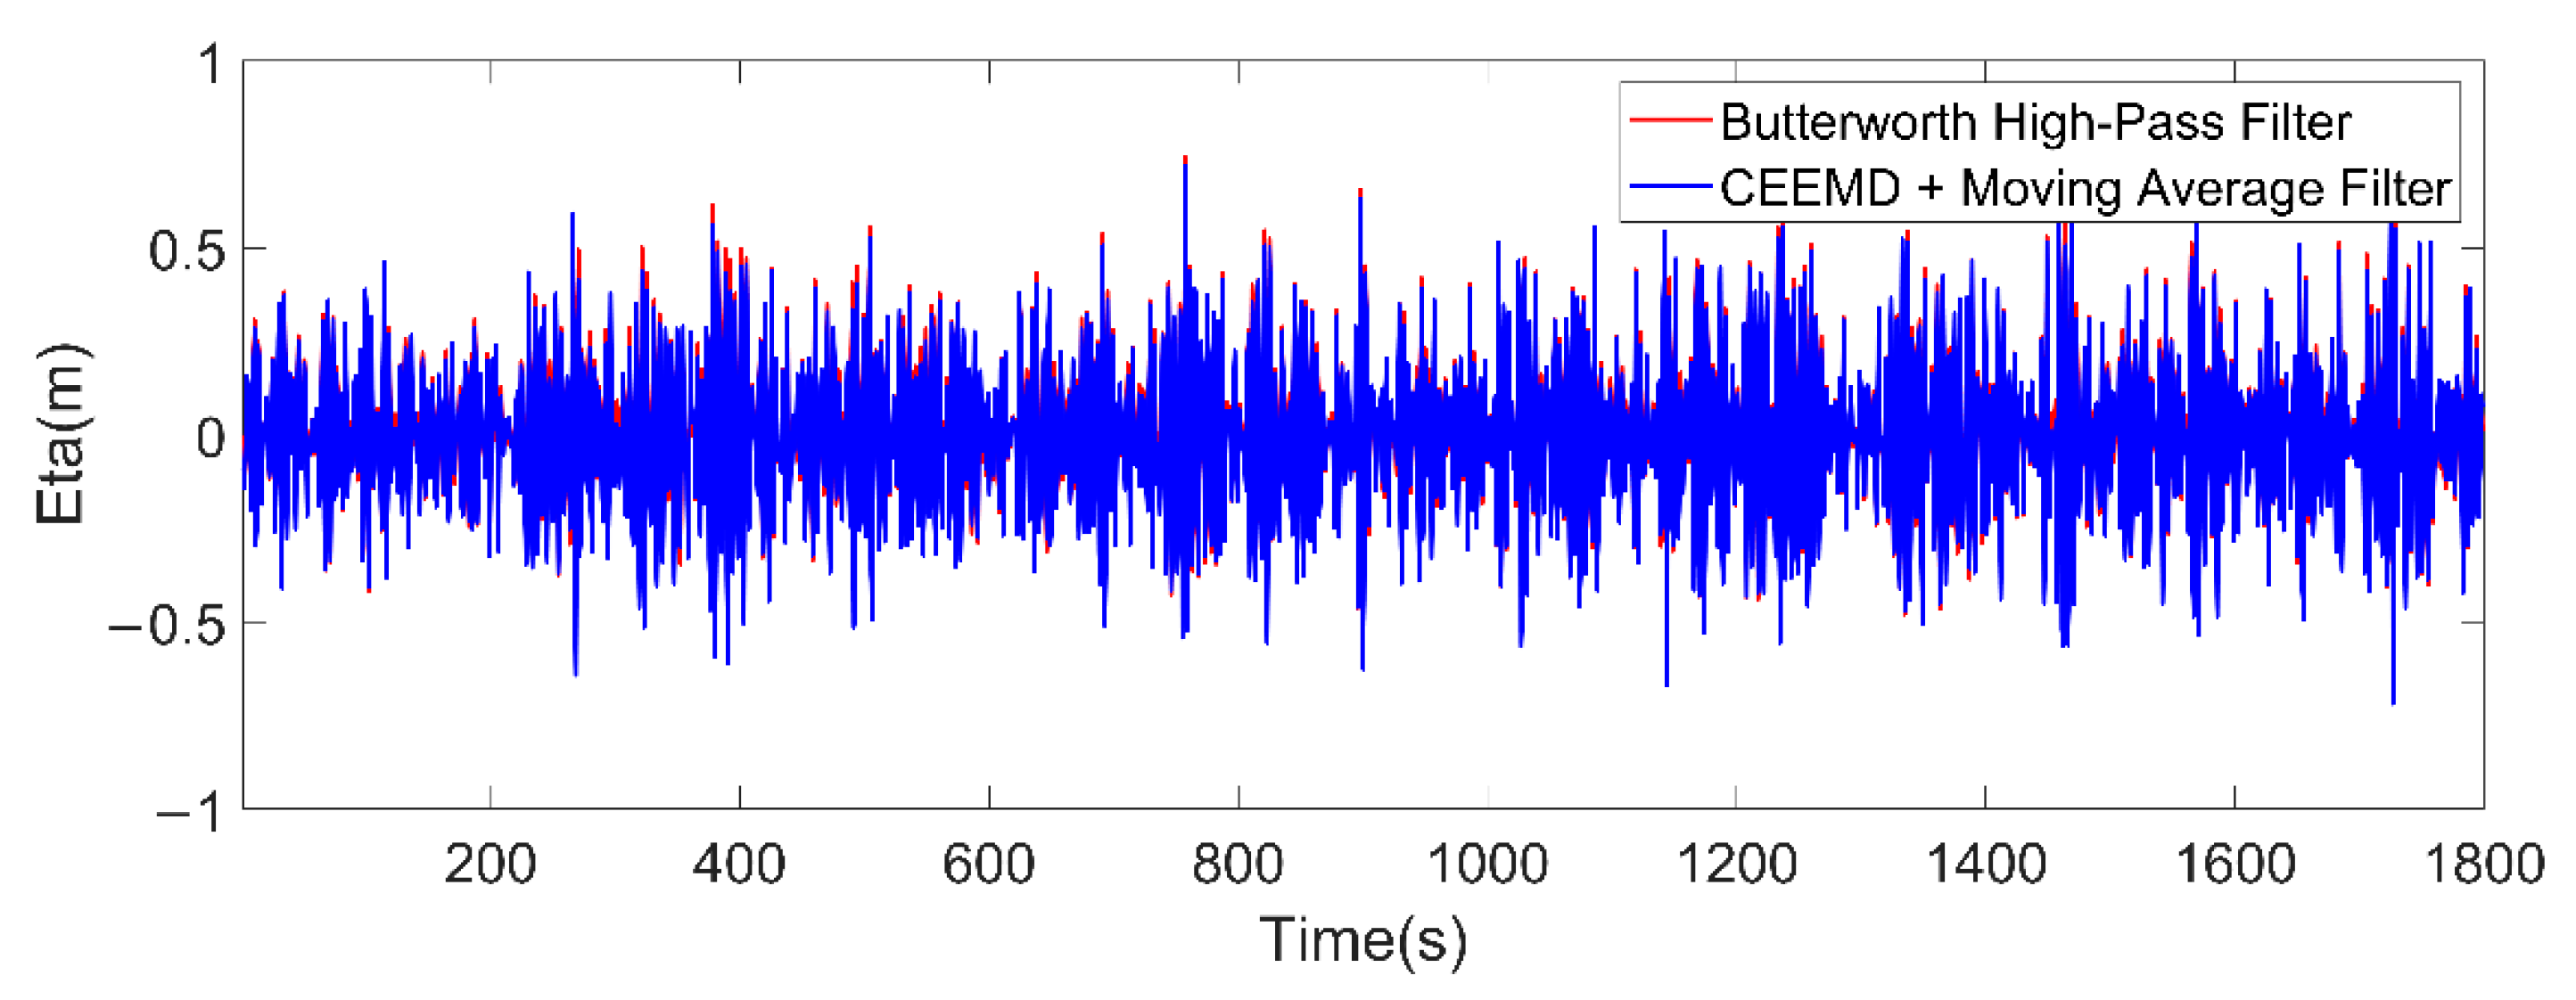
Figure 5 demonstrates the filtering results of the original wave surface displacement using two methods: CEEMD filtering combined with moving average filtering (time domain) and Butterworth high-pass filtering (frequency domain). Both approaches effectively extract the wave-induced fluctuations from the original signal.
The combination of CEEMD and the moving average filtering method leverages the adaptive decomposition capability of CEEMD and the smoothing effect of moving average filtering, enabling precise analysis of trend and periodic characteristics in the signal. This approach achieves effective separation of wave and tidal signals, and subsequent wave analysis will be based on the wave–tide separation results obtained through this combined filtering method.

3.2.2. Correction of Directional Spreading Function

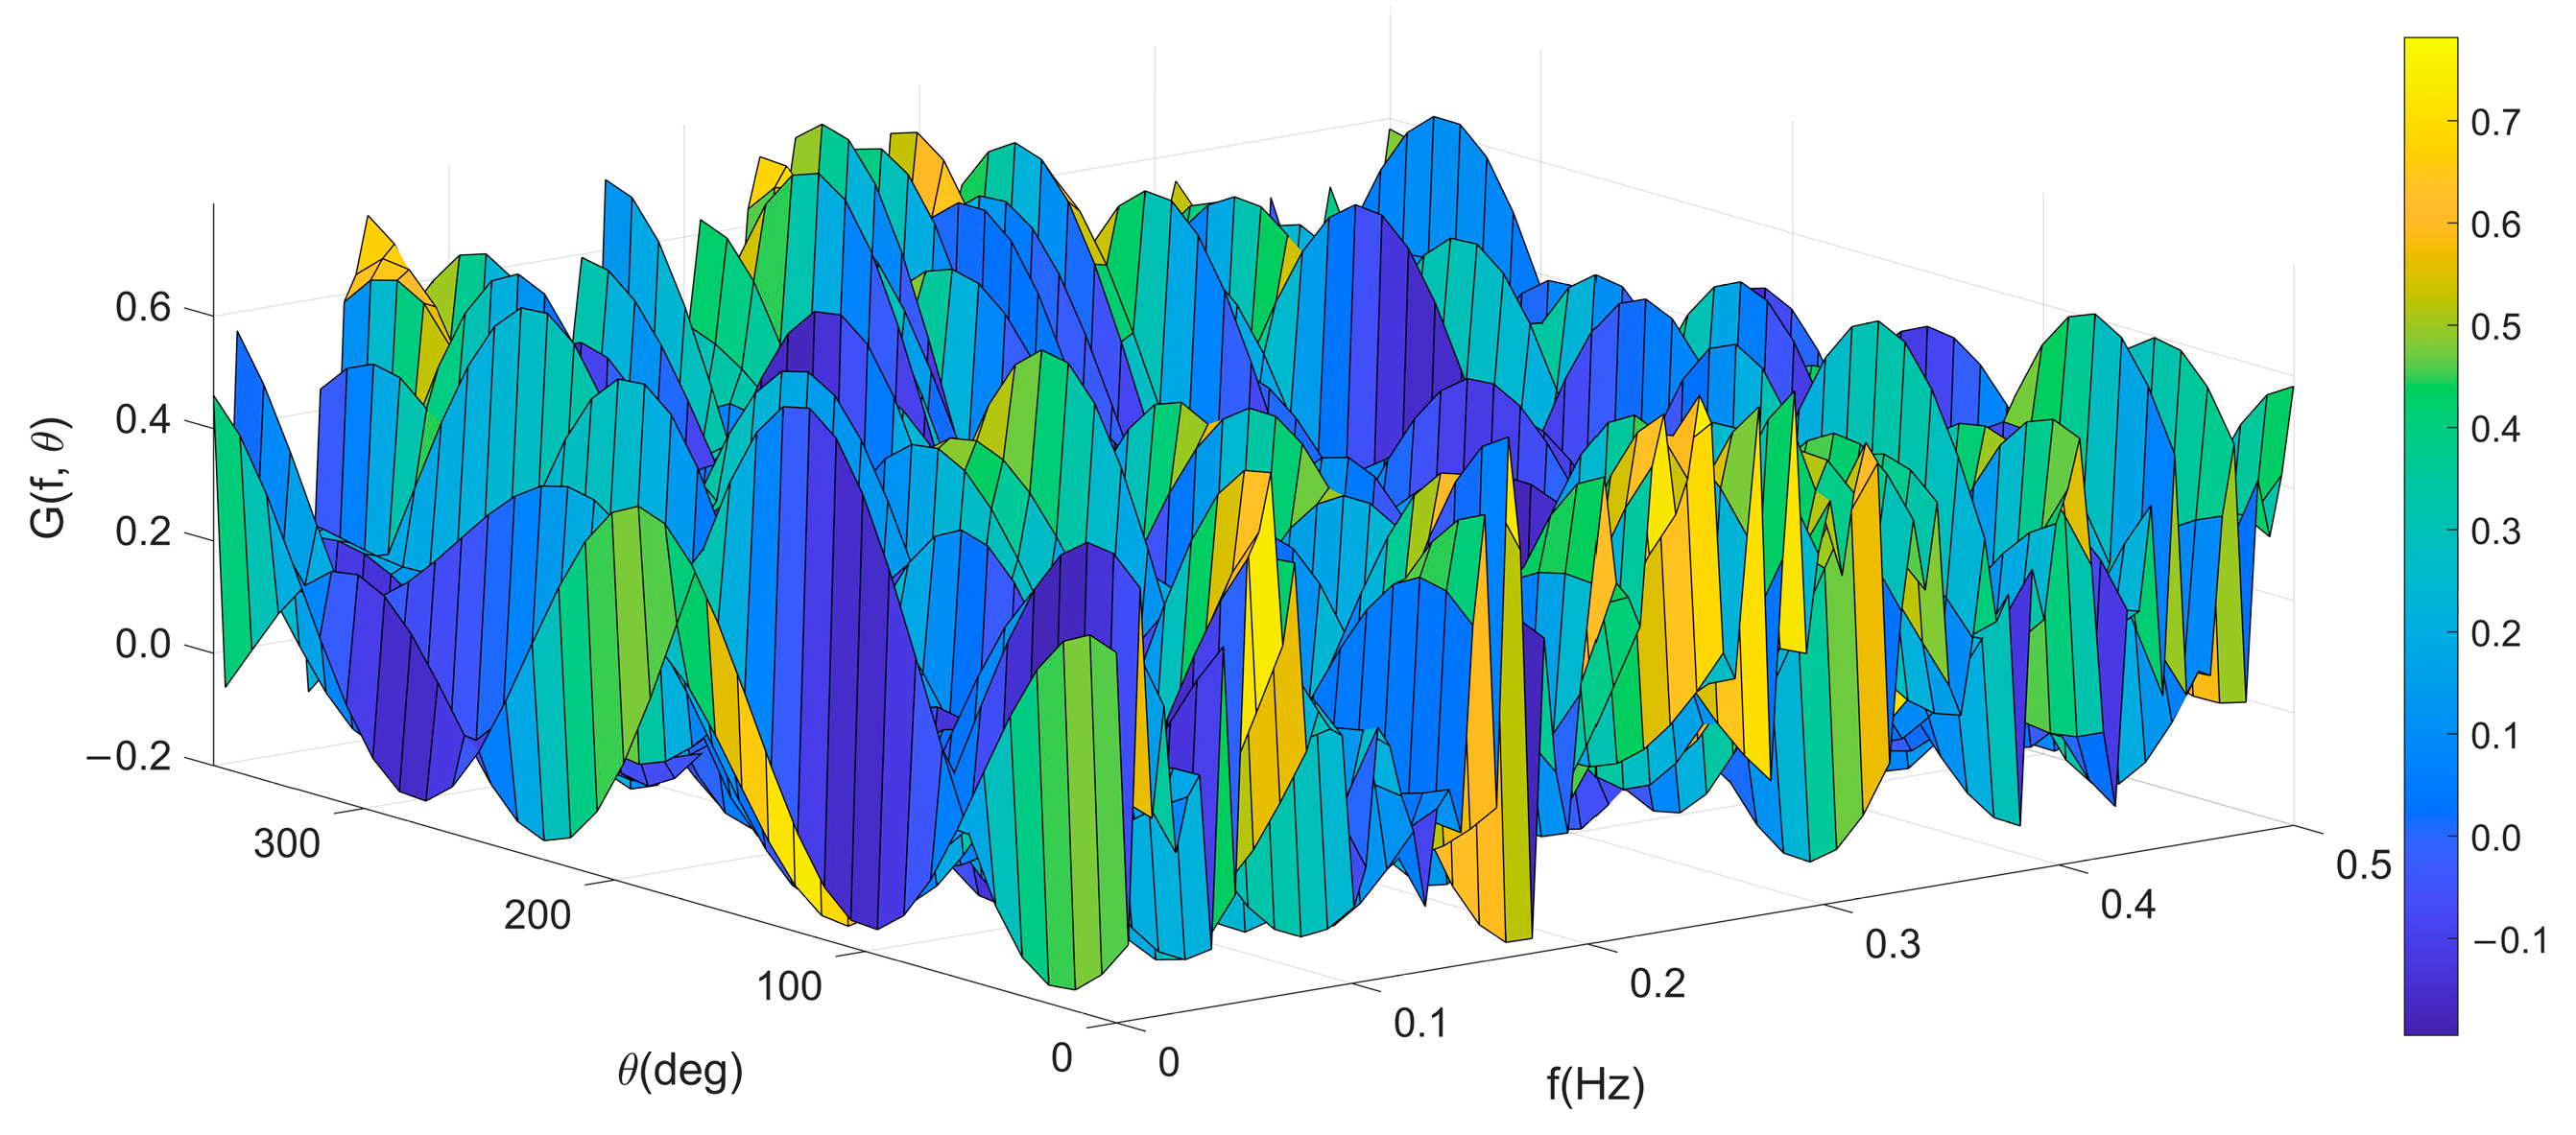
The cross-spectra obtained through direct Fourier transform yield preliminary estimates, resulting in inaccuracies in the calculated parameters ( a 1 , a 2 , b 1 , and b 2 ) and, consequently, an imprecise directional spreading function. Therefore, necessary corrections must be applied to the directional spreading function.
As shown in Figure 6, small negative values appear in the estimated directional spreading function due to numerical artifacts introduced during spectral estimation. These negative values are non-physical, as the directional spreading function is theoretically non-negative and must integrate to unity. To correct this while minimizing the impact on directional accuracy, we apply the following procedure [23]:
(1)
Set all negative values in the directional spreading function to zero.
(2)
Redistribute the integrated area of the negative-valued portions to the positive-valued regions proportionally based on their respective weights.
(3)
Verify that the corrected directional spreading function satisfies the normalization condition (integral equals unity).
The corrected directional spreading function, as shown in Figure 7, now ensures both non-negativity and normalization properties, making it suitable as input for ocean wave directional spectrum calculations.

4. Analysis of Measured Wave Results

4.1. Wave Parameter Retrieval Based on Statistical Analysis

Ocean wave statistical analysis primarily employs statistical and spectral methods. Statistical approaches characterize wave properties through quantitative descriptors, elucidating wave variability and trends. The zero-upcrossing method, a statistical technique for wave analysis, estimates wave periods and heights by detecting zero-crossing points in time series data [50].

Wave Period and Height Estimation via Zero-Upcrossing Method

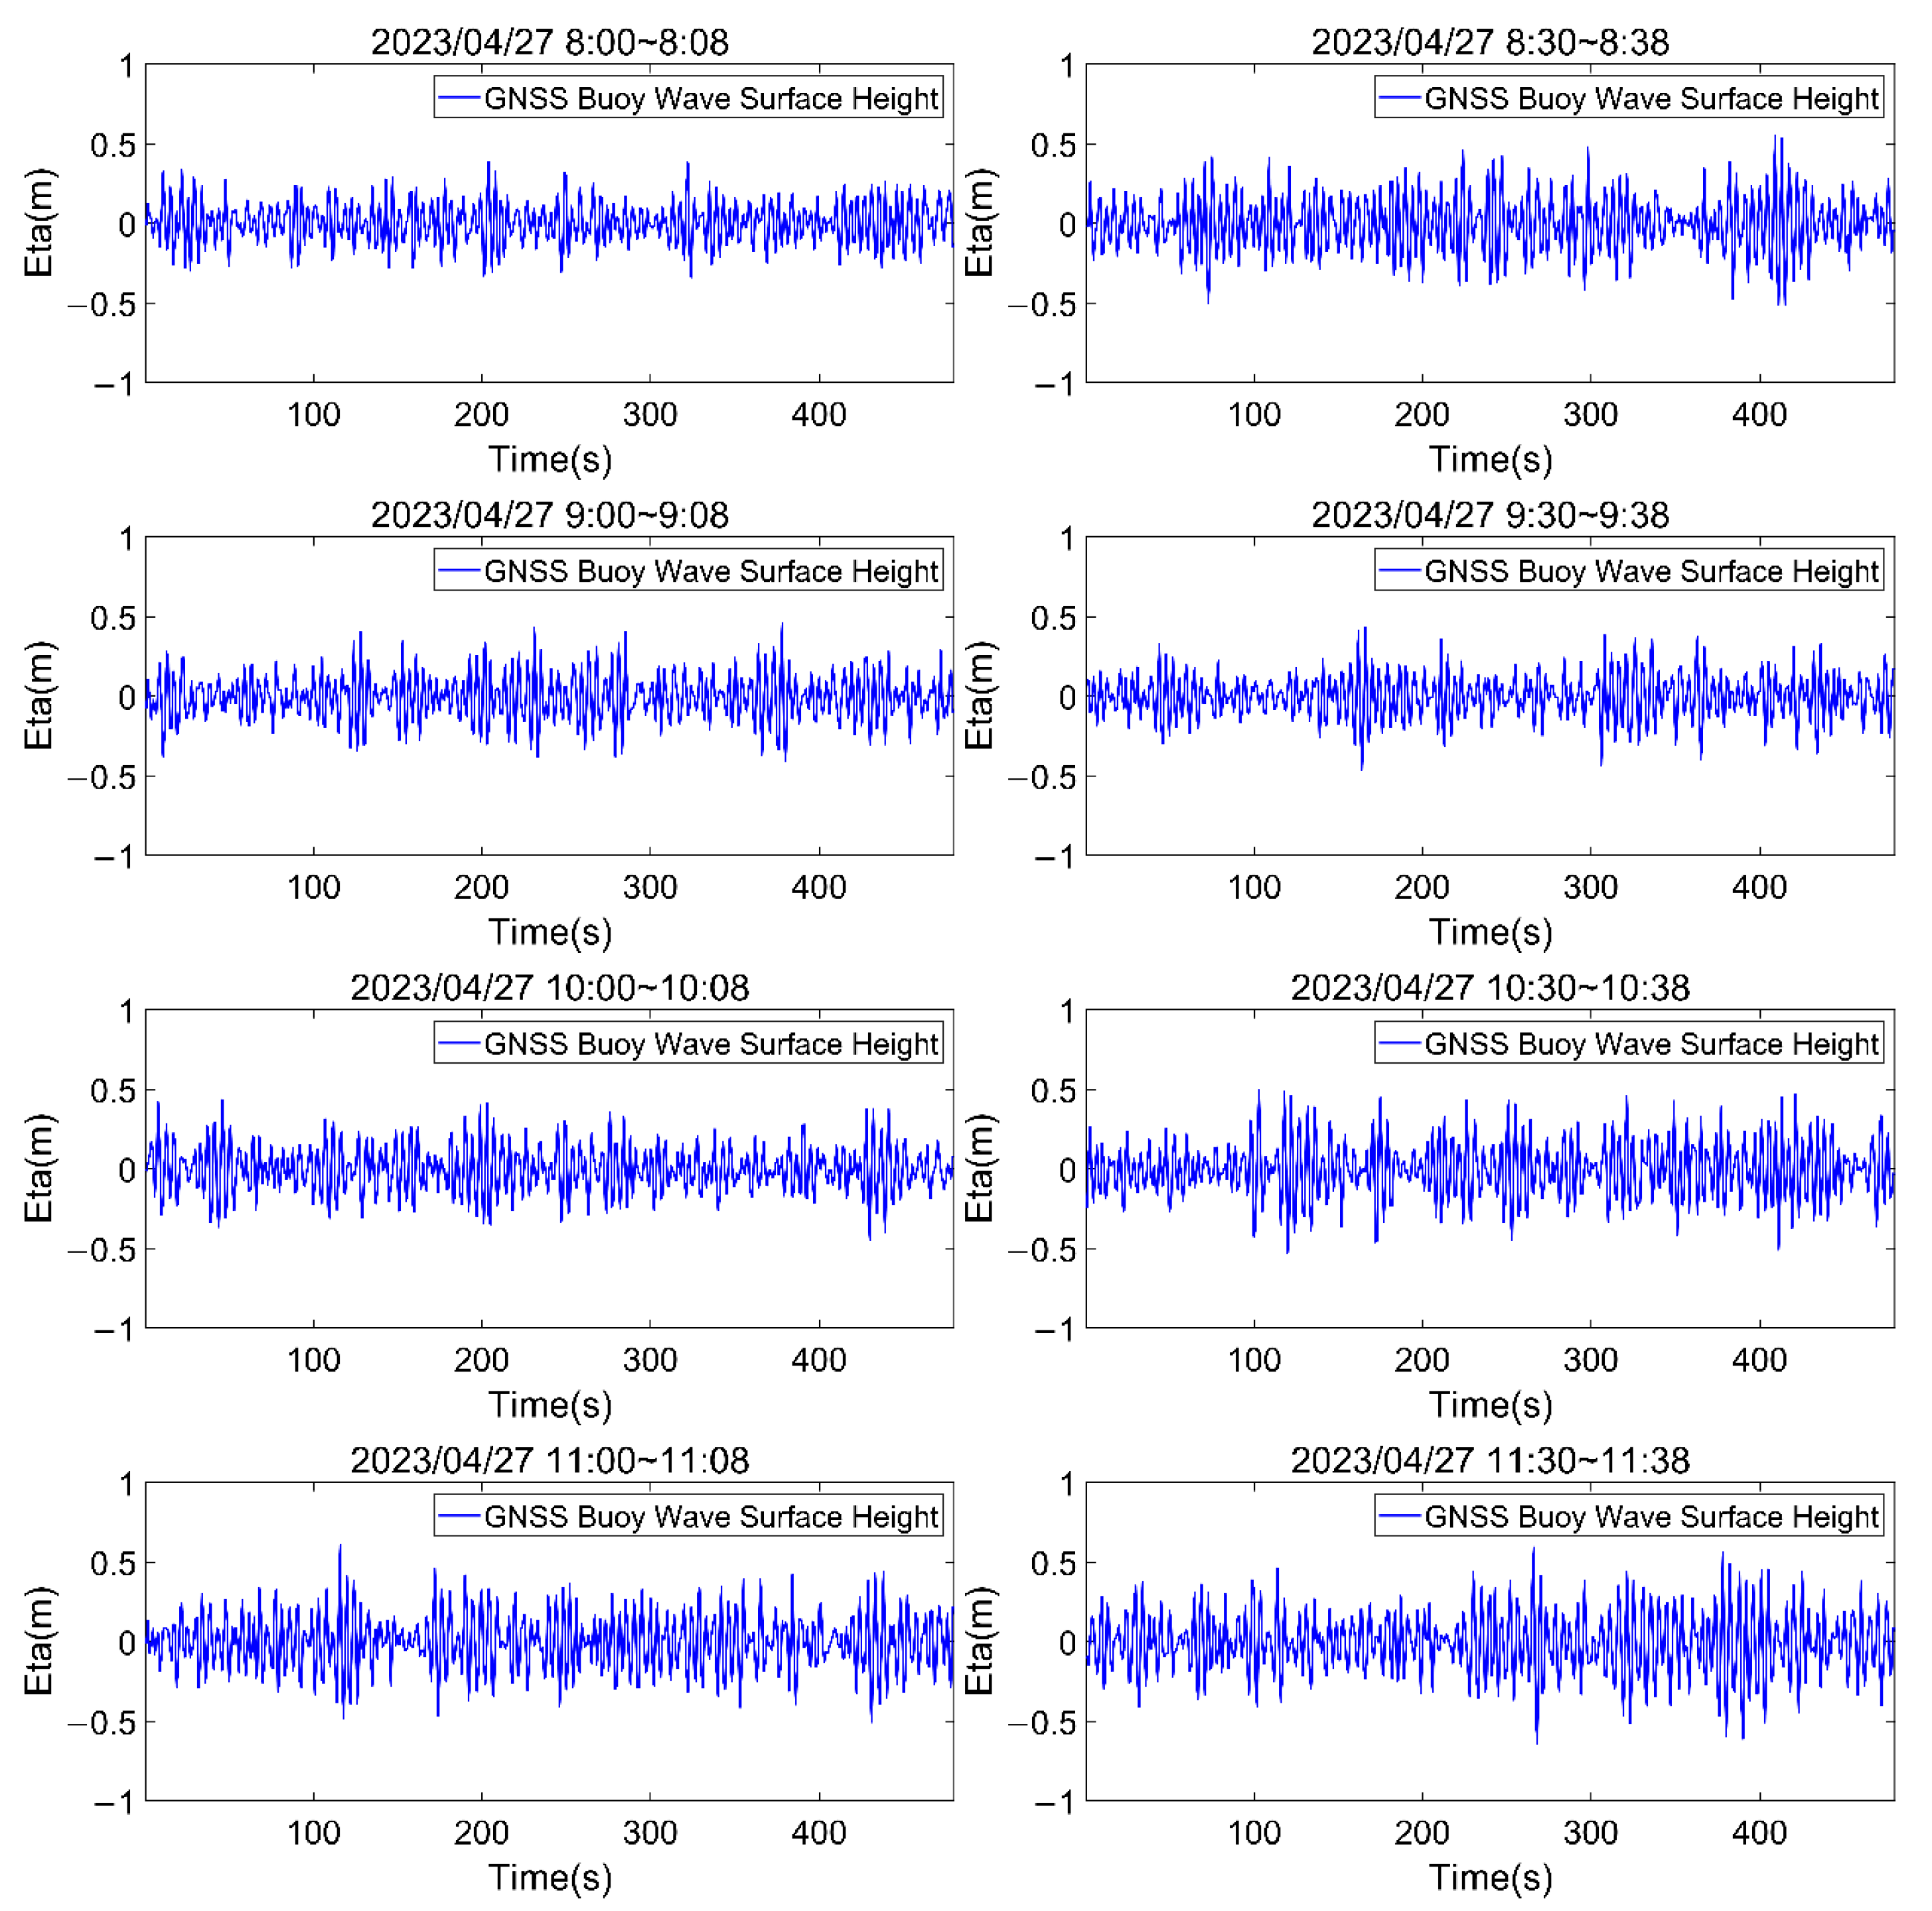
To evaluate the feasibility of retrieving wave parameters from GNSS buoy data, measurements were conducted from 08:00 to 12:00 on 27 April 2023, divided into eight 30 min intervals. Figure 8 displays the first 8 min of wave surface elevation data for each interval, demonstrating clear wave height variations recorded by the GNSS buoy. Throughout the observation period, the buoy data exhibited high stability.
For each time interval, wave statistical analysis was conducted using approximately 100 consecutive waves as a standard sample. The following figure (Figure 9), which consists of eight subplots labeled a to h, presents the wave statistical results obtained from the GNSS buoy in the eight different time periods. Each subplot for the time interval consists of three parts: the first part shows the crest and trough heights of each wave arranged chronologically; the second part displays the wave height distribution, with all waves sorted in descending order, highlighting the top one-third of the wave sequence using a pink dashed line to represent the significant waves; and the third part, based on the sorting in the second part, presents the corresponding wave periods using asterisks to denote all individual periods, while the significant wave period is explicitly identified in the legend.
Based on the statistical wave characteristics presented in the figure above, the characteristic wave heights and corresponding wave periods were calculated for each dataset.
For each data segment, wave sequences were statistically analyzed using the zero-upcrossing method. The maximum wave height represents the absolute crest value within the sequence, while the highest one-tenth wave height denotes the average of the top 10% largest waves—both exhibiting relatively strong randomness. In contrast, the significant wave height (highest one-third of the waves’ average) and mean wave height (average of all waves) better reflect the statistical characteristics of the wave field [23]. The mean wave parameters particularly demonstrate a more stable representation of the prevailing sea state.
Theoretical analysis indicates that shorter wave samples tend to yield larger mean wave heights and periods. For instance, the 09:00–09:08 segment containing 105 waves showed greater mean values compared to the 111-wave (08:30–09:08) and 110-wave (09:30–09:38) segments. These results confirm that GNSS buoys can effectively capture wave height and period parameters through zero-upcrossing analysis and reliably record oceanic wave details.
It is worth noting that the 10 m GNSS buoy used in this study, while offering excellent attitude stability and robustness for GNSS positioning, is not specifically optimized for wave-following performance, especially in low-sea-state conditions. This inherent design characteristic may reduce its sensitivity to small-amplitude wave fluctuations, leading to limited correlation between significant wave height and significant wave period, as observed in Table 3 and Table 4. This phenomenon is consistent with the expected behavior of large-diameter buoys and reflects a trade-off between positional accuracy and wave-tracking responsiveness. Therefore, the results discussed here should be interpreted within the context of the buoy’s physical limitations. This highlights the need for further comparative studies involving different buoy configurations and sea conditions.

4.2. Wave Period and Height Retrieval Based on Spectral Analysis

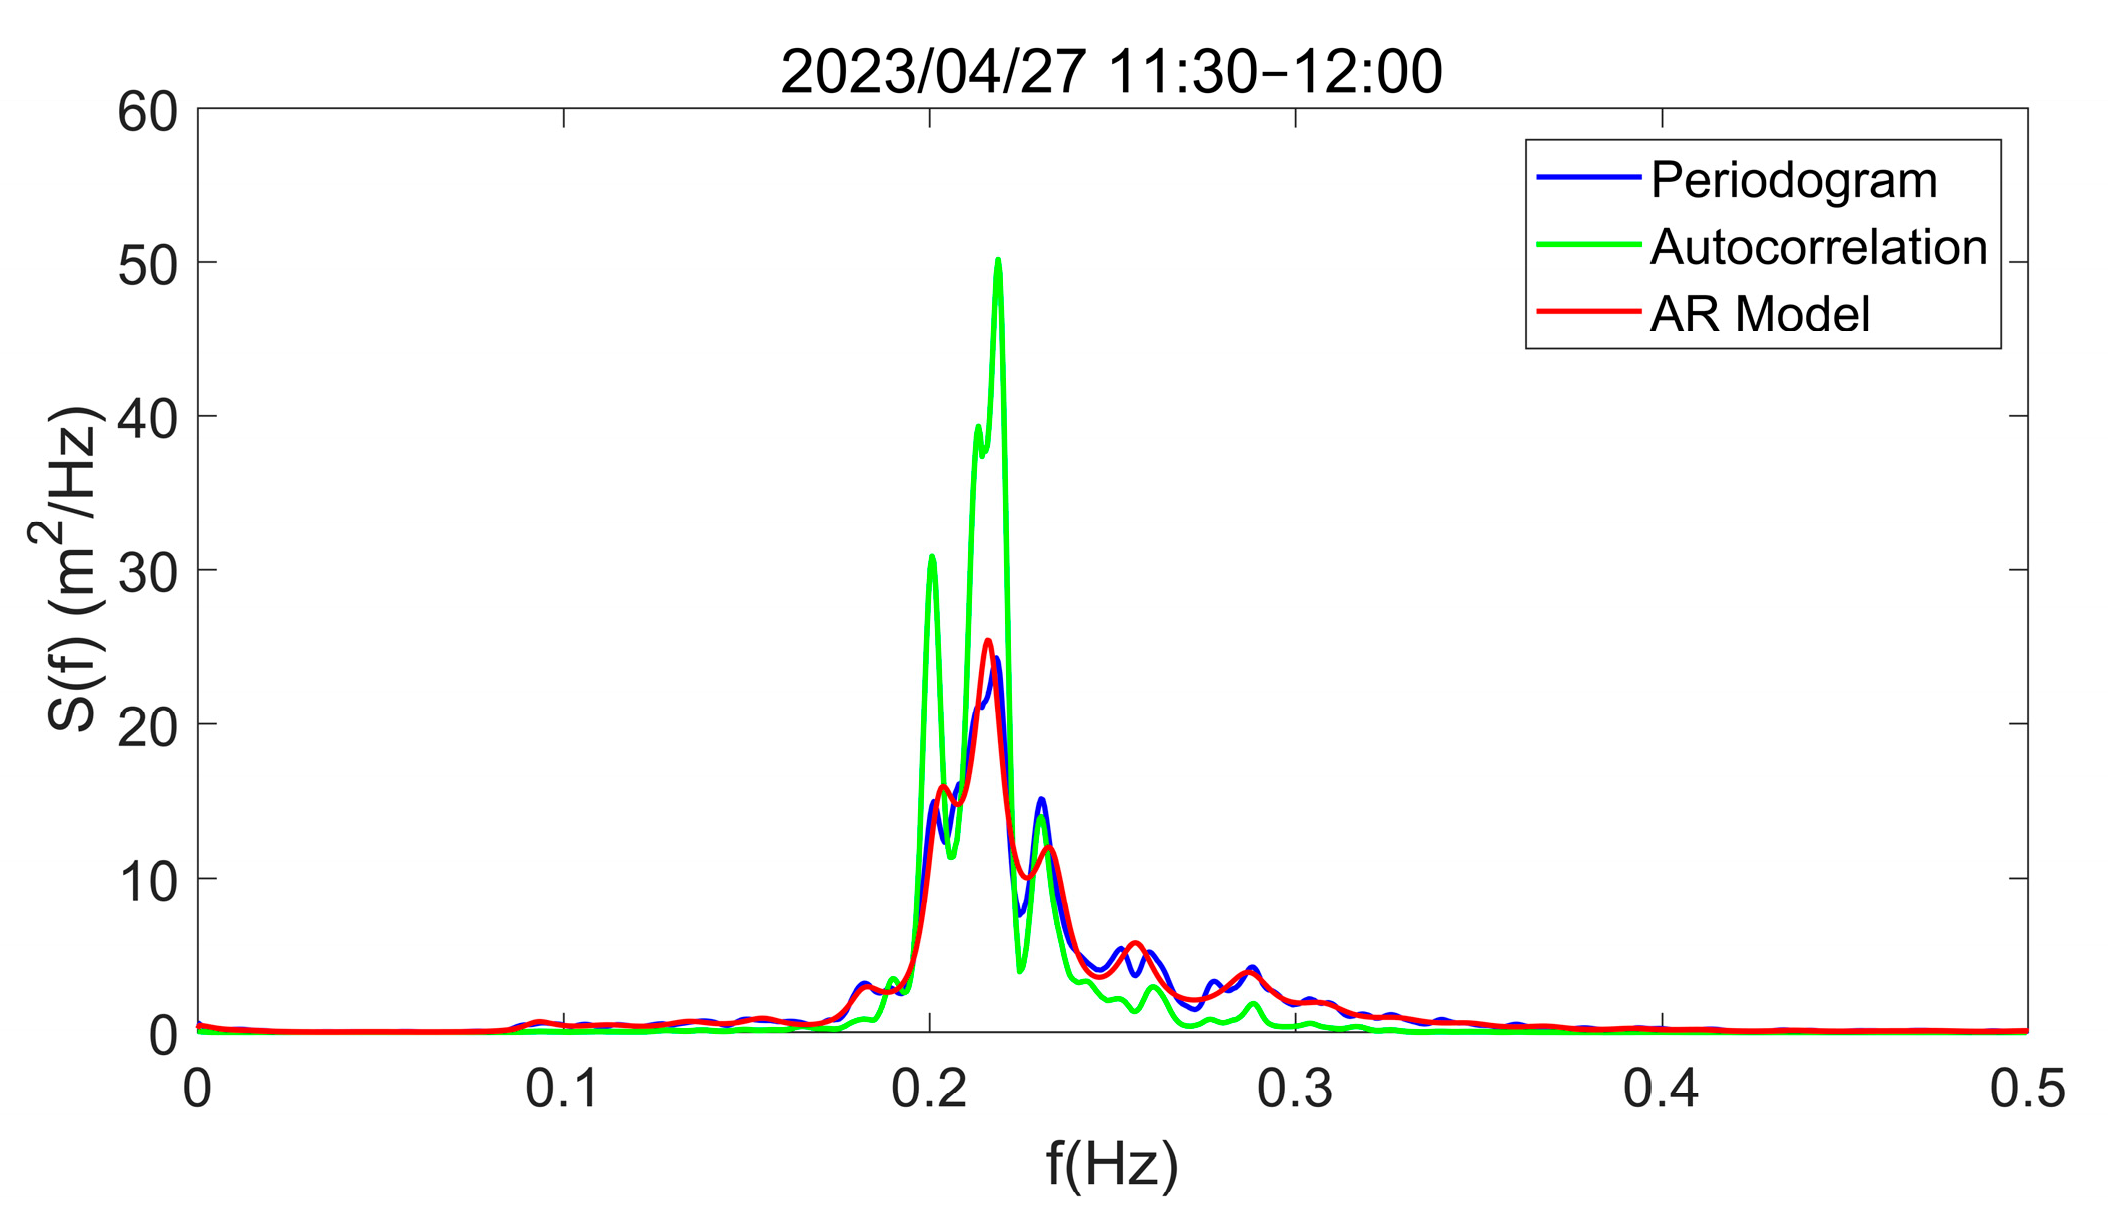
Section 4.1 analyzed GNSS buoy measurements from 08:00 to 12:00 on 27 April 2023, using the zero-upcrossing method. This section focuses on the 11:30–12:00 dataset, employing spectral analysis to calculate and examine wave parameters. The following presents spectral analysis results of U-direction displacement time series obtained through three methods: the periodogram, autocorrelation function, and AR model approaches, as shown in Figure 10.
To better visualize the differences and similarities between the three spectral estimation methods, we normalized the power spectral densities to eliminate amplitude variations, enabling direct comparison on a unified scale. The normalized spectra clearly show the frequency-domain characteristics of each method, facilitating identification of their respective strengths and limitations. By plotting the spectral results from all three methods together, we can intuitively compare their spectral shapes and distribution patterns, thoroughly analyzing their performance in different frequency bands and potential biases, as shown in Figure 11.
Comparison of the power spectral density obtained using the periodogram, autocorrelation function, and AR model methods reveals nearly identical spectral shapes. While minor differences exist in certain areas due to variations in wave data processing methods, they do not affect the calculation of first-order wave characteristics. Table 5 presents wave parameters obtained from the three spectral analysis methods, showing identical values for significant and mean wave heights across methods, with only minor differences in wave periods: 0.02 s for the significant period and 0.01 s for the mean period. Compared to parameters obtained using the zero-upcrossing method, the spectral analysis results show differences of 0.05 m in significant wave height, 0.79 s in significant wave period, 0.09 m in mean wave height, and 0.08 s in mean wave period.
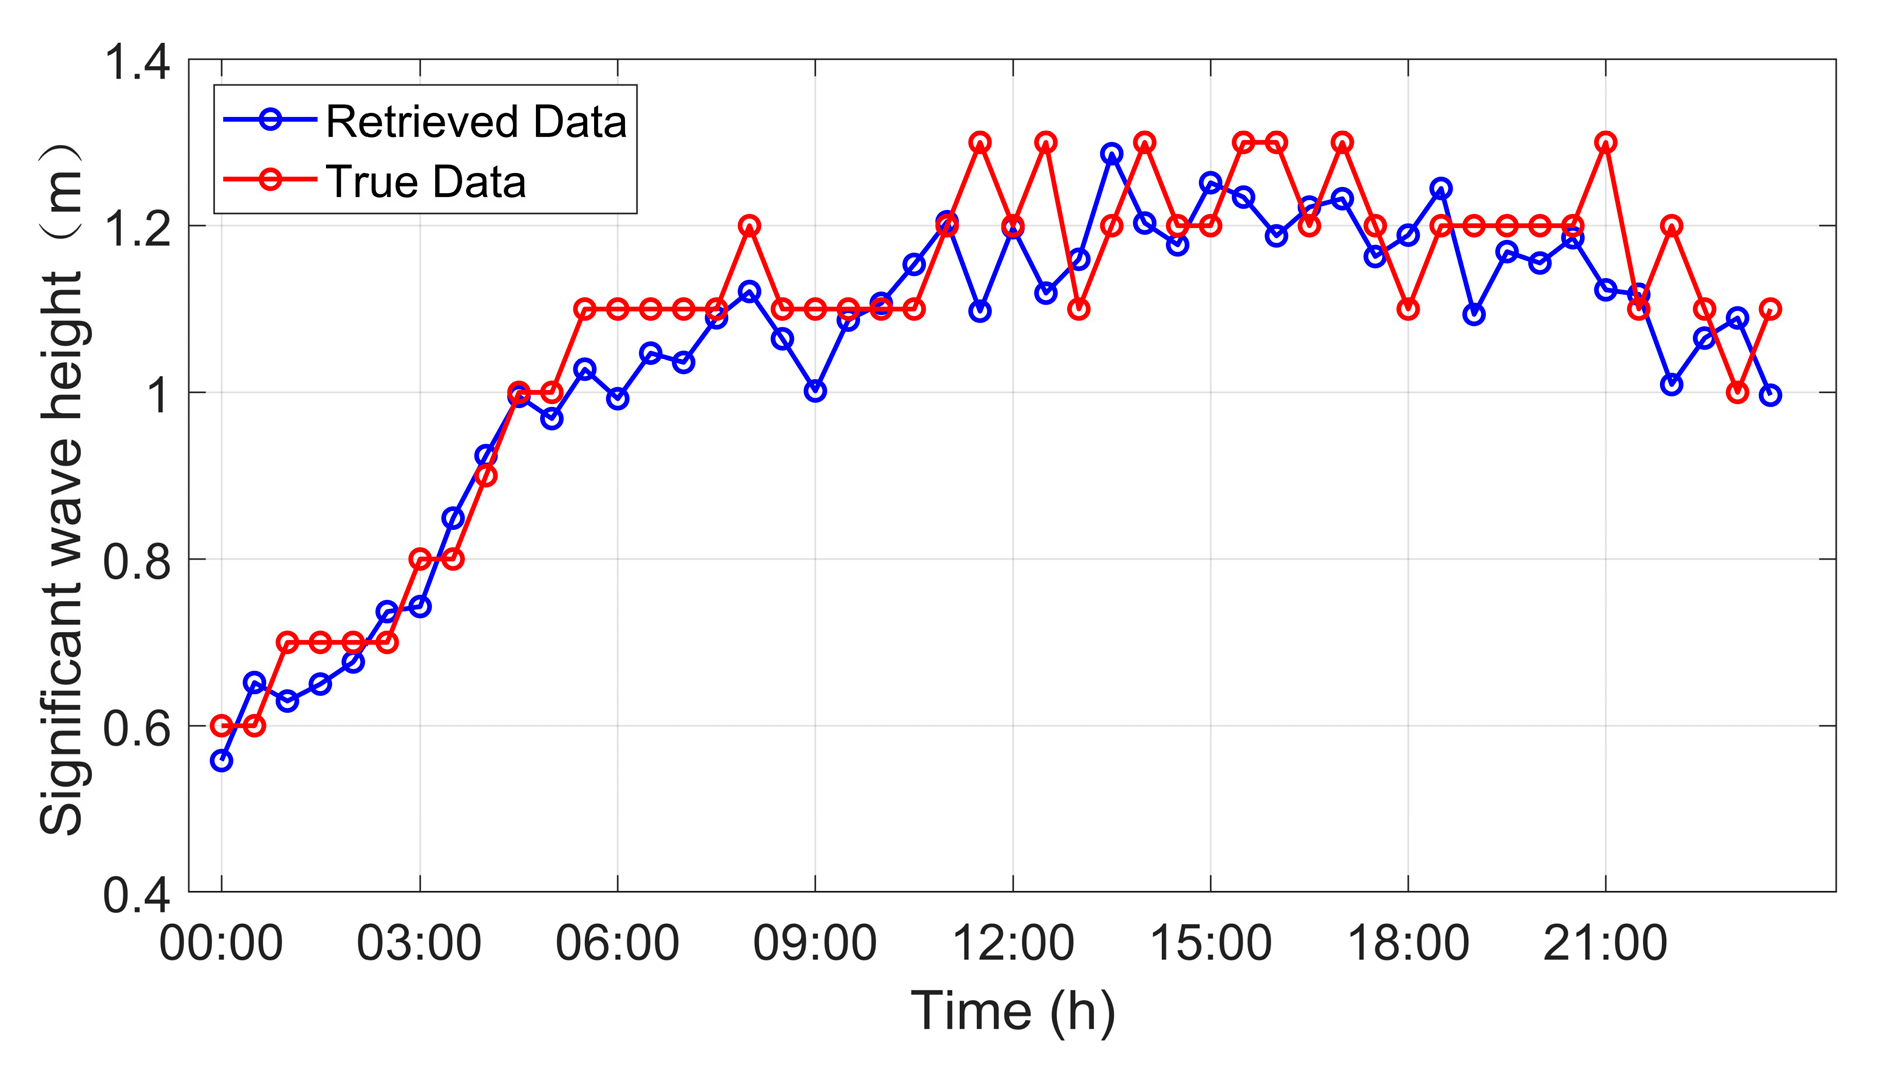
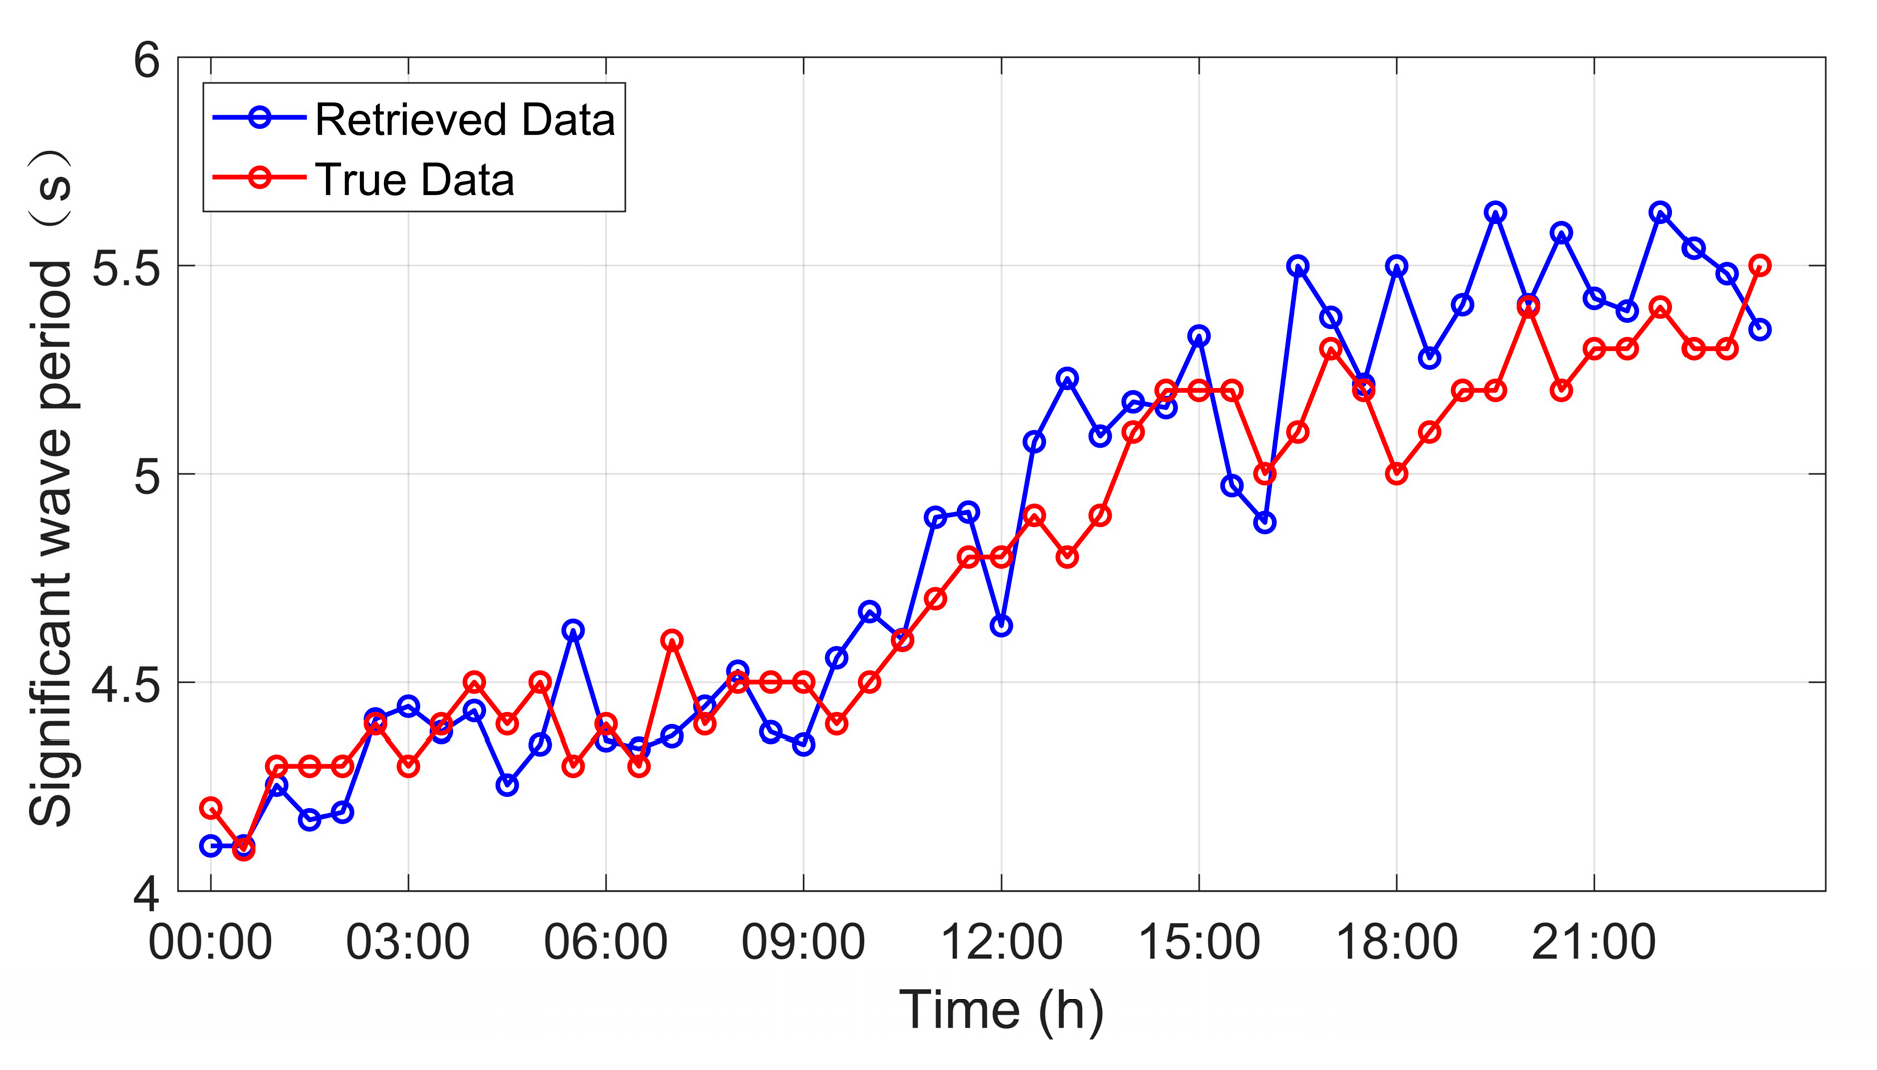
The comparison between the reference significant wave height and GNSS-buoy-derived wave heights is shown in Figure 12 and Figure 13.
To quantitatively assess agreement between GNSS-derived results and the reference measurements, we calculated the Root Mean Square Error (RMSE) and Pearson correlation coefficient. For significant wave height, the RMSE was 0.0788 m with a correlation of 0.9298. For significant wave period, the RMSE was 0.1926 s with a correlation of 0.9381. These metrics confirm that the GNSS-based inversion method yields reliable and accurate wave parameters [23].
Comprehensive statistical and spectral analyses of the same GNSS buoy data further demonstrate consistency across methods, fully validating the effectiveness and applicability of the proposed inversion framework.

4.3. Wave Direction Retrieval Based on Directional Spectrum Analysis

Directional spectrum analysis provides the two-dimensional distribution of wave energy with respect to both frequency and direction, offering deeper insight into wave propagation characteristics. In this study, we applied cross-spectral analysis using the horizontal displacement time series of the GNSS buoy to estimate the directional spreading function. This enabled the construction of the directional wave spectrum and the identification of dominant propagation trends under actual sea conditions.

4.3.1. Three-Dimensional Wave Directional Spectrum Analysis

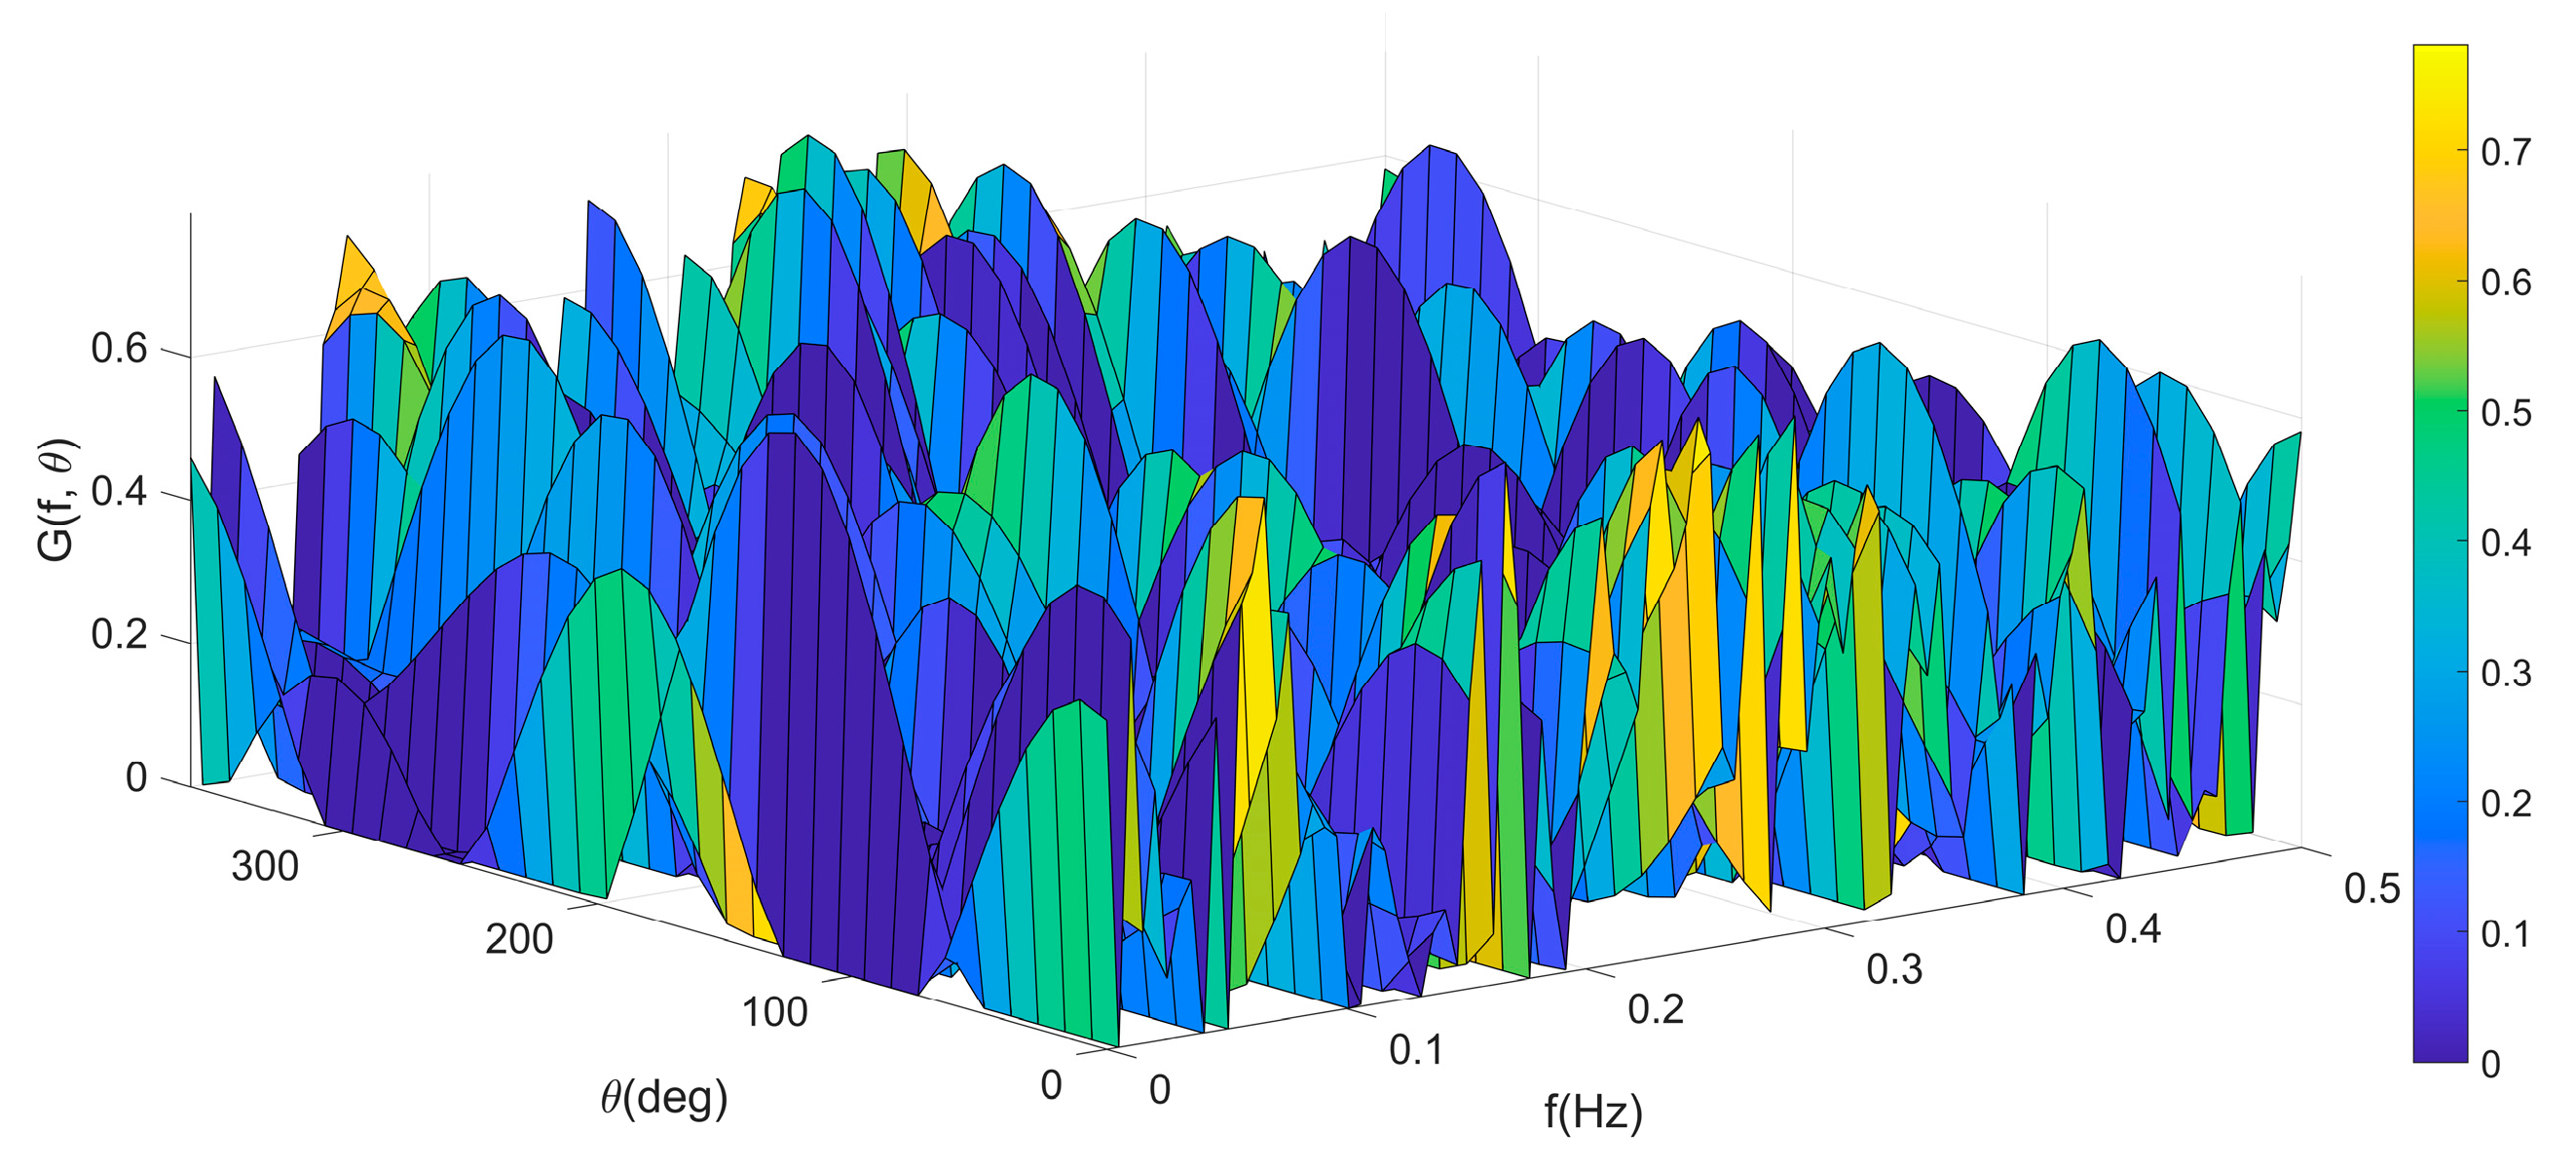
Based on the wave frequency spectrum and directional spreading function, the directional wave spectrum for the corresponding time period is presented below, as shown in Figure 14.
During the test, the wind speed and direction were stable, and the overall wave changes were not significant in the short term. The wave direction in the figure is given in the form of wave direction azimuth (0° to the north and clockwise to the positive direction).
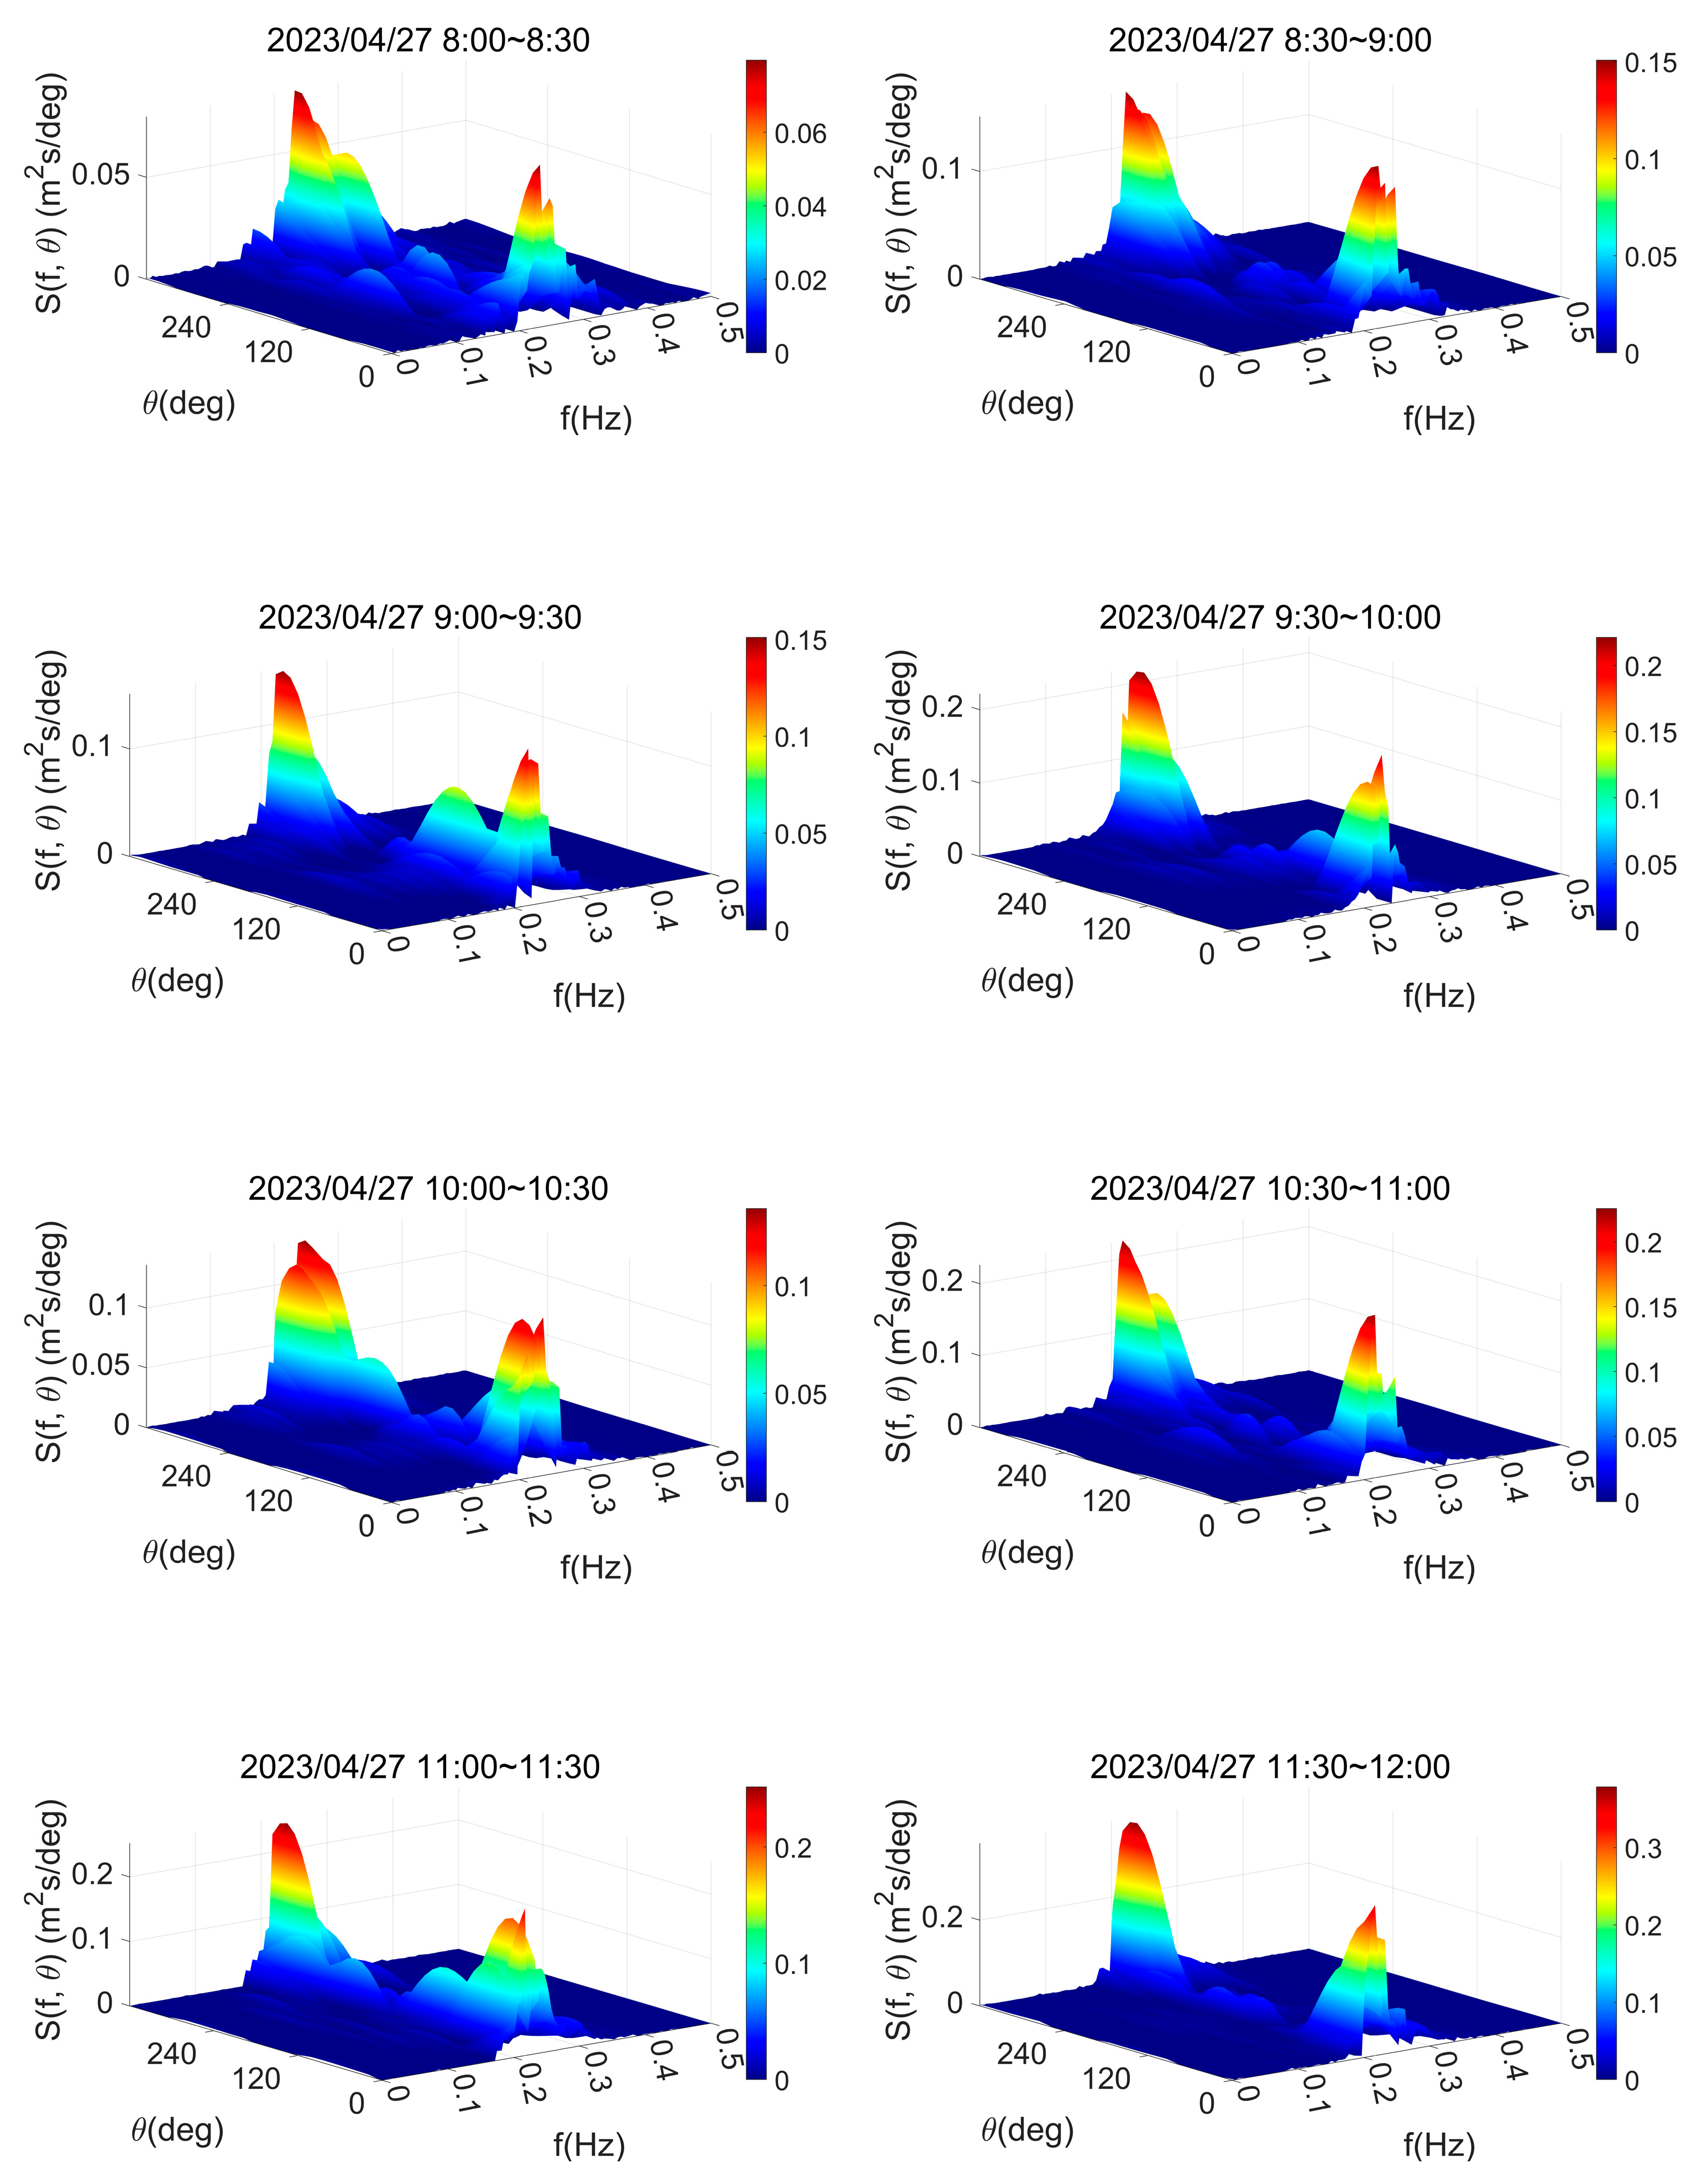
The following is a three-dimensional diagram of the directional spectrum from 8:00 to 12:00 on 27 April, with the directional spectrum given every half hour, as shown in Figure 15.
The horizontal axis in the figure is frequency, ranging from 0 Hz to 0.5 Hz, indicating the frequency distribution of waves; the vertical axis is direction, ranging from 0° to 360°, indicating the propagation direction of waves; and the vertical axis is spectral density, indicating the wave energy density.
In the figure, the peak of the spectral density is mainly concentrated in the frequency range of 0.2 Hz to 0.25 Hz, and the direction ranges from 0° to 60° and 300° to 360°, which indicates the frequency band where the wave energy is mainly concentrated; the main propagation direction of the wave is northward. In addition to the dominant spectral density peak, a secondary peak with lower amplitude is also consistently present. The main peak is generally caused by the main wind direction in the sea area, while the secondary peak is generally the result of the combined effect of the main wind direction of the sea area and the long-distance swell [53].

4.3.2. Analysis of Wave Direction–Height Relationship

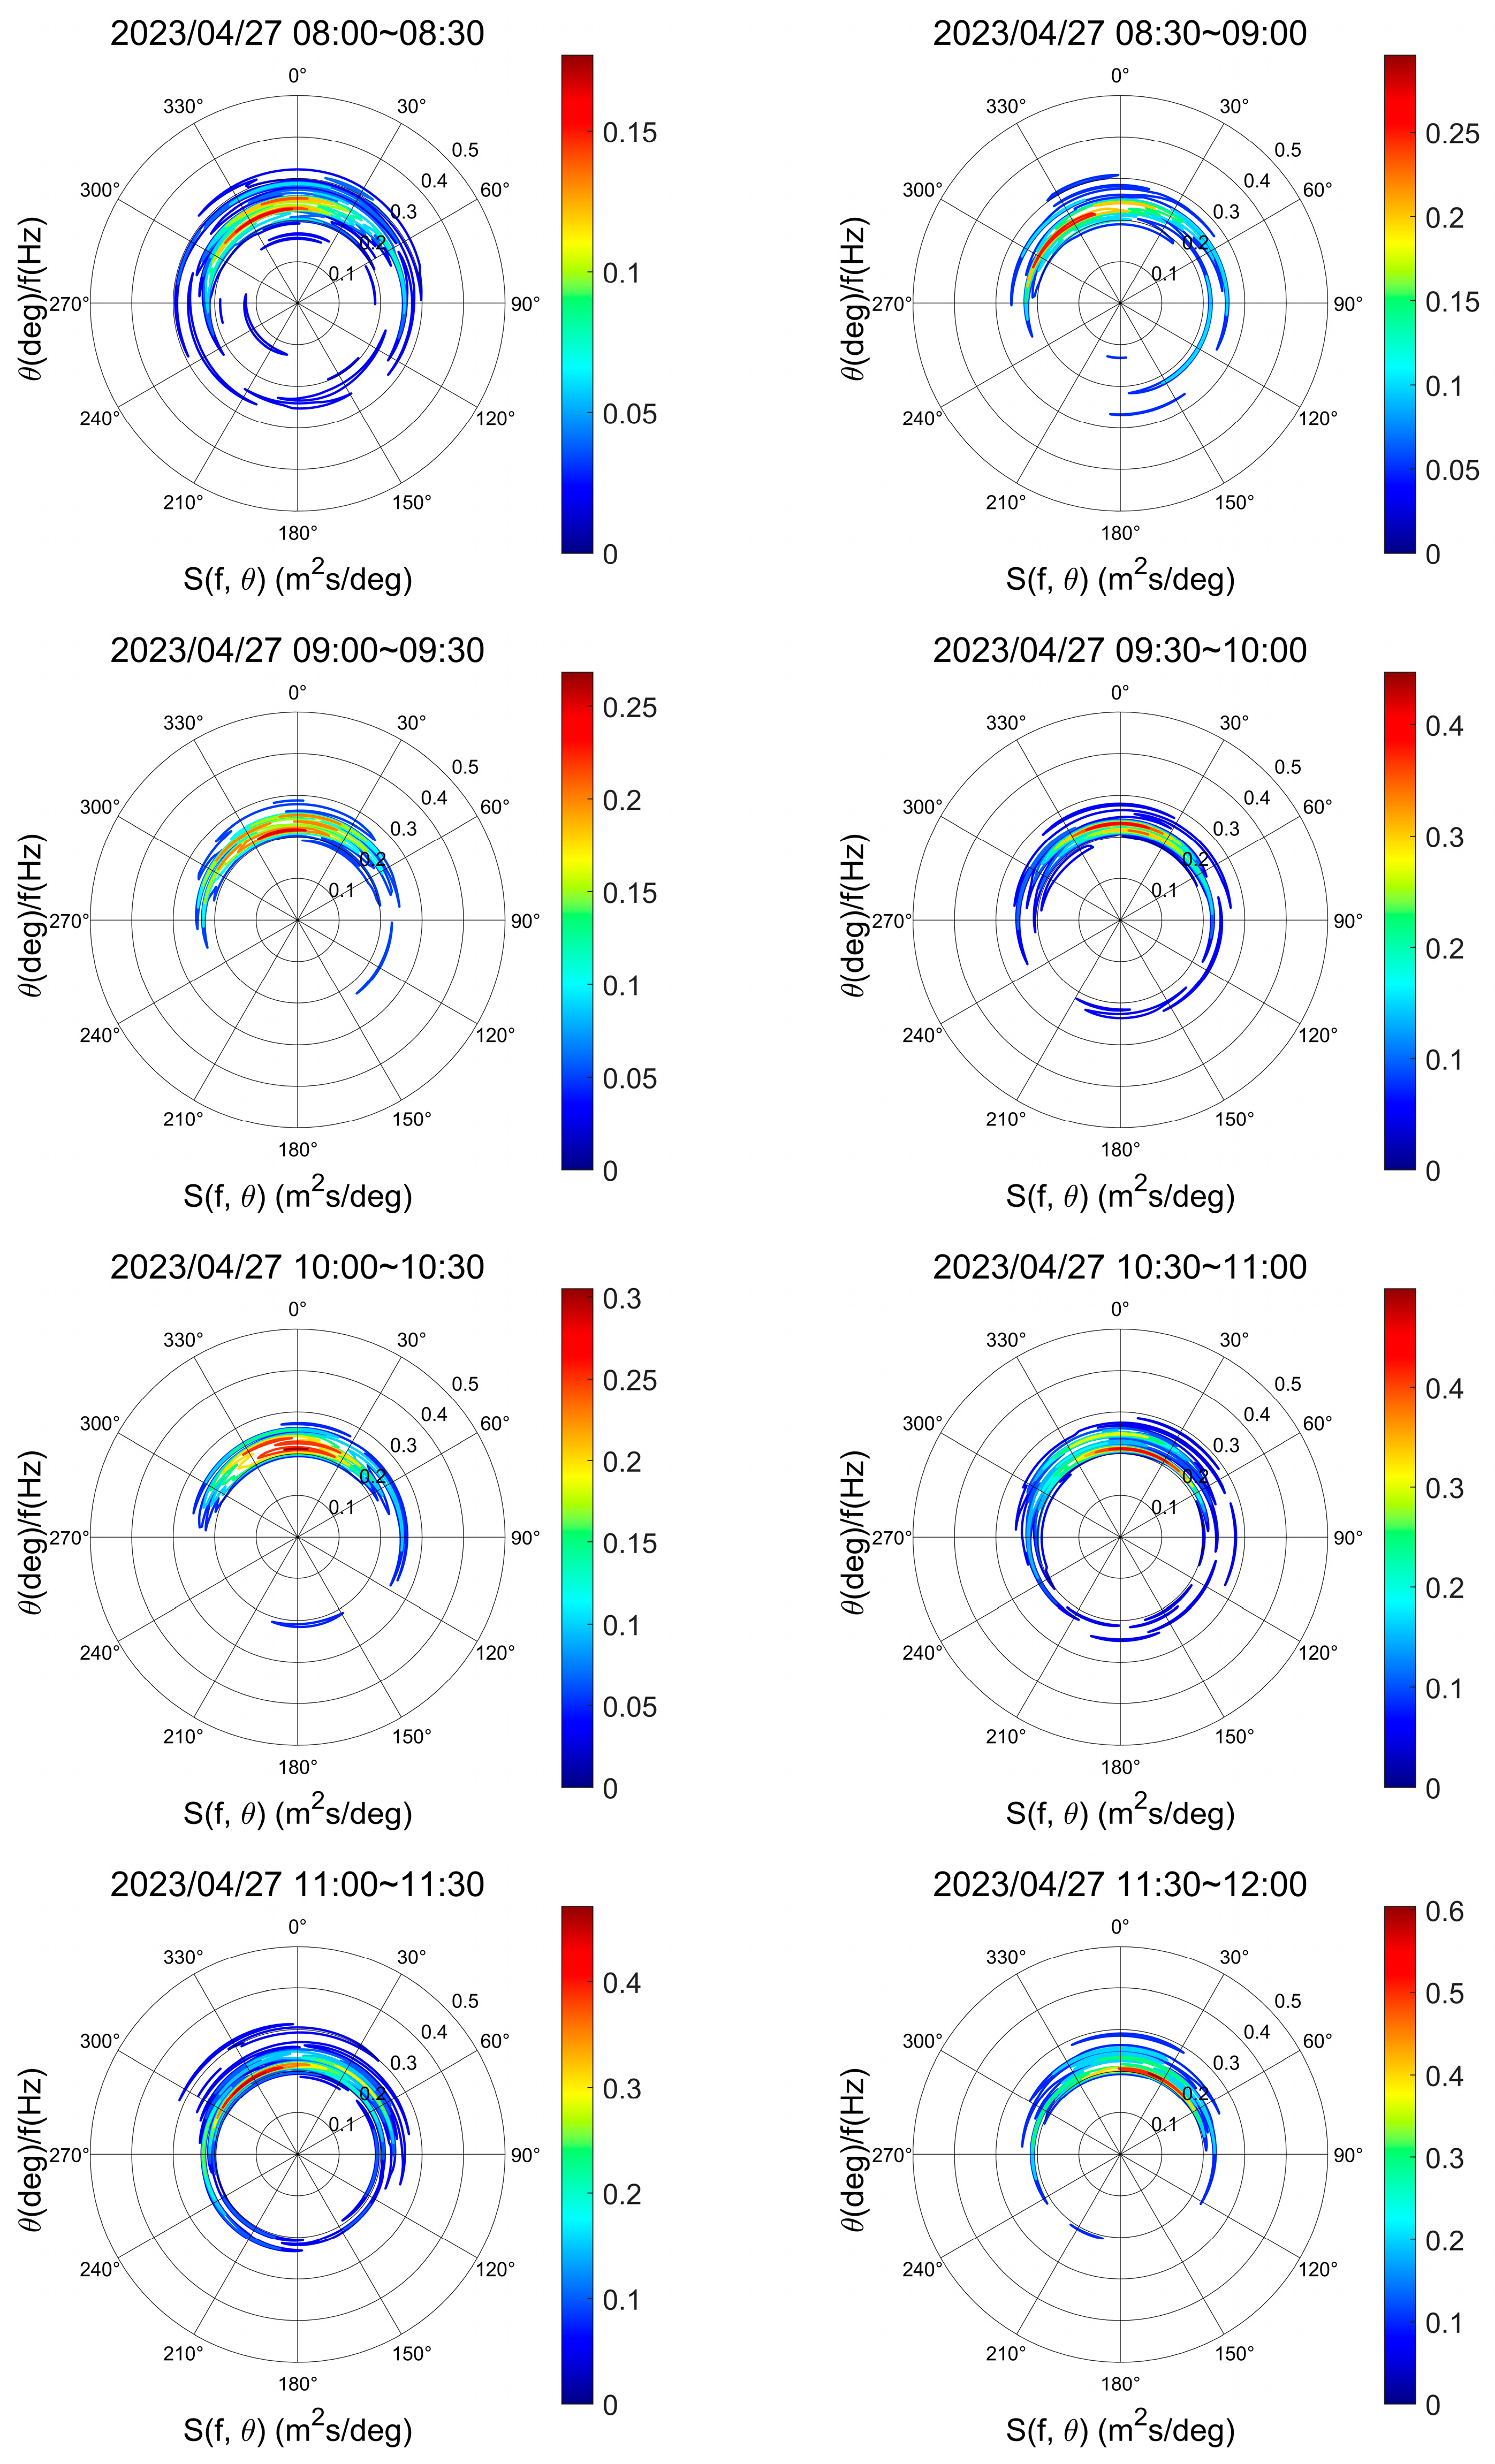
The three-dimensional graph intuitively illustrates the spatial distribution of wave energy; however, limitations in resolution and viewing angle may affect the clarity and interpretability of the visualization. The polar coordinate graph can simply and clearly display multi-dimensional information, making it easier to extract and analyze key information. The following is the corresponding polar coordinate graph of the directional spectrum, as shown in Figure 16.
The figure illustrates the directional distribution of waves over a 24 h period, showing predominant wave directions clustered near 0° (true north). This indicates that wave energy was primarily concentrated in northerly directions throughout the day. Notably, wave heights at 0° were both significantly larger and more concentrated, further confirming the strong directional focusing of wave energy toward the north.

5. Conclusions

GNSS buoy technology, leveraging high-precision satellite positioning and advanced spectral analysis, provides an effective and reliable solution for real-time ocean wave monitoring. This study proposes a comprehensive GNSS-based wave inversion framework and demonstrates its effectiveness using field data collected in the Huanghai Sea. The approach integrates multiple spectral estimation methods and directional spectrum analysis to extract key wave parameters—height, period, and propagation direction—with high accuracy and consistency. Notably, the directional spectrum analysis successfully captured the concentration of energy in specific frequency bands and revealed a predominantly northward wave propagation trend, validating the method’s applicability under real sea conditions.
As an observational platform, the GNSS buoy continuously records three-dimensional motion trajectories. Compared to traditional wave gauges and radar-based instruments, GNSS buoys offer advantages such as low cost, easy deployment, and long-term stability, making them highly suitable for long-duration and wide-area marine monitoring.
To overcome limitations in traditional wave signal processing and directional spectral estimation, this study employed a combination of statistical and spectral approaches. The zero-crossing method and three spectral techniques—the periodogram, autocorrelation function, and autoregressive model—were applied to estimate wave height and period, providing a robust cross-validation framework. Horizontal displacement and velocity data were used to retrieve wave propagation characteristics in two dimensions for directional spectral estimation.
Analysis of data collected on 27 April 2023 confirmed the stability and performance of the proposed method. The three spectral approaches produced wave period estimates with a maximum discrepancy of only 0.02 s. Compared with the zero-crossing method, the spectral analysis results show differences of 0.05 m and 0.79 s in significant wave height and period, respectively, with average differences of 0.09 m and 0.08 s. These results demonstrate strong internal consistency and validate the accuracy of the GNSS-based approach. Directional spectrum analysis showed that energy was concentrated in the 0.2–0.25 Hz frequency band and within a directional range of 0° ± 30°, reflecting a clear northward propagation pattern, consistent across all observation periods.
Taken together, the results demonstrate that the proposed GNSS-buoy-based wave inversion framework is accurate, consistent, and robust under complex sea conditions. This study highlights the practical potential of GNSS buoys as cost-effective tools for real-time ocean wave monitoring, with broad applications in marine engineering, disaster prevention, and oceanographic research.
Nevertheless, several limitations should be acknowledged. The large size (10 m) of the buoy reduces its wave-following sensitivity, especially for low sea states, potentially affecting accuracy. In rough sea conditions, multipath interference, buoy instability, and antenna tilt may further degrade GNSS positioning. Additional stabilizing structures or more rigid antenna mountings may be required to ensure reliable operation. Moreover, the reliance on uninterrupted GNSS signals and post-processing may limit real-time performance in extreme environments.
Future research will focus on enhancing signal robustness under variable sea conditions, improving hardware stability, and extending validation across diverse platforms and environmental scenarios. These efforts aim to support the development of a scalable, all-weather GNSS-based wave monitoring solution.

Author Contributions

Methodology, J.W.; software, X.C.; validation, J.W., X.C., S.Y. and S.W.; formal analysis, R.T.; investigation, J.W. and S.W.; resources, J.W. and R.T.; data curation, J.W.; writing—original draft preparation, J.W. and R.T.; writing—review and editing, R.T. and P.Z.; supervision, J.W.; and funding acquisition, J.W. All authors have read and agreed to the published version of the manuscript.

Funding

This work was supported by the National Natural Science Foundation of China (No. 42204032, 42274019, 41931076, and 42474014), Laoshan Laboratory (LSKJ202205100 and LSKJ202205105), the Shandong Province Science Foundation for Youths (No. ZR2022QD015), the Hainan Provincial Key Research and Development Project (No. ZDYF2024GXJS289), the National Key Research and Development Program of China (No. 2025YFE0104000), and the Excellent Youth Foundation of Shandong Scientific Committee (No. ZR2024JQ024).

Data Availability Statement

The data presented in this study are available on request from the corresponding author.

Acknowledgments

The authors would like to express their gratitude to the editors and the reviewers for their substantive and valuable comments for the improvement of this paper. We would like to thank the Tokyo University of Marine Science and Technology for providing the open-source GNSS software RTKLIB.

Conflicts of Interest

The authors declare no conflicts of interest.

References

  1. Holthuijsen, L.H. Waves in Oceanic and Coastal Waters; Cambridge University Press: Cambridge, UK, 2010; ISBN 978-1-139-46252-5. [Google Scholar]
  2. Kinsman, B. Wind Waves: Their Generation and Propagation on the Ocean Surface; Courier Corporation: North Chelmsford, MA, USA, 1984; ISBN 0-486-64652-1. [Google Scholar]
  3. Massel, S.R. Ocean Surface Waves: Their Physics and Prediction; World Scientific: Singapore, 2017; Volume 45, ISBN 981-322-839-3. [Google Scholar]
  4. He, Q.; Silliman, B.R. Climate Change, Human Impacts, and Coastal Ecosystems in the Anthropocene. Curr. Biol. 2019, 29, R1021–R1035. [Google Scholar] [CrossRef]
  5. Hasselmann, K.; Barnett, T.P.; Bouws, E.; Carlson, H.; Cartwright, D.E.; Enke, K.; Ewing, J.A.; Gienapp, A.; Hasselmann, D.E.; Kruseman, P. Measurements of Wind-Wave Growth and Swell Decay during the Joint North Sea Wave Project (JONSWAP). Ergaenzungsheft Dtsch. Hydrogr. Z. Reihe A 1973, 8, 1–15. [Google Scholar]
  6. Marques, O.B.; Feddersen, F.; MacMahan, J. An Effective Water Depth Correction for Pressure-Based Wave Statistics on Rough Bathymetry. J. Atmos. Ocean. Technol. 2024, 41, 1047–1062. [Google Scholar] [CrossRef]
  7. Mercier, P.; Thiébaut, M.; Guillou, S.; Maisondieu, C.; Poizot, E.; Pieterse, A.; Thiébot, J.; Filipot, J.-F.; Grondeau, M. Turbulence Measurements: An Assessment of Acoustic Doppler Current Profiler Accuracy in Rough Environment. Ocean Eng. 2021, 226, 108819. [Google Scholar] [CrossRef]
  8. Bruno, F.; Bianco, G.; Muzzupappa, M.; Barone, S.; Razionale, A.V. Experimentation of Structured Light and Stereo Vision for Underwater 3D Reconstruction. ISPRS J. Photogramm. Remote Sens. 2011, 66, 508–518. [Google Scholar] [CrossRef]
  9. Tannuri, E.A.; Simos, A.N.; Sparano, J.V.; Matos, V.L. Motion-Based Wave Estimation: Small-Scale Tests with a Crane-Barge Model. Mar. Struct. 2012, 28, 67–85. [Google Scholar] [CrossRef]
  10. Wyatt, L.R.; Thompson, S.P.; Burton, R.R. Evaluation of High Frequency Radar Wave Measurement. Coast. Eng. 1999, 37, 259–282. [Google Scholar] [CrossRef]
  11. Ma, C.; Pan, L.; Qiu, Z.; Liang, D.; Chen, G.; Yu, F.; Sun, H.; Sun, D.; Wu, W. Ocean Wave Inversion Based on a Ku/Ka Dual-Band Airborne Interferometric Imaging Radar Altimeter. Remote Sens. 2022, 14, 3578. [Google Scholar] [CrossRef]
  12. Tucker, M.J. Waves in Ocean Engineering: Measurement, Analysis, Interpretation; E. Horwood: New York, NY, USA, 1991; pp. 109–111. [Google Scholar]
  13. De Vries, J.J.; Waldron, J.; Cunningham, V. Field Tests of the New Datawell DWR-G GPA Wave Buoy. Sea Technol. 2003, 44, 50–55. [Google Scholar]
  14. Behrens, J.; Terrill, E.; Thomas, J.O. CDIP Wave Observations during Hurricanes Irma, Jose, and Maria, and a nor’easter. Shore Beach 2018, 86, 14–20. [Google Scholar]
  15. Bidlot, J.-R.; Holmes, D.J.; Wittmann, P.A.; Lalbeharry, R.; Chen, H.S. Intercomparison of the Performance of Operational Ocean Wave Forecasting Systems with Buoy Data. Weather Forecast. 2002, 17, 287–310. [Google Scholar] [CrossRef]
  16. Gorman, R.M. Estimation of Directional Spectra from Wave Buoys for Model Validation. Procedia Iutam 2018, 26, 81–91. [Google Scholar] [CrossRef]
  17. Fund, F.; Perosanz, F.; Testut, L.; Loyer, S. An Integer Precise Point Positioning Technique for Sea Surface Observations Using a GPS Buoy. Adv. Space Res. 2013, 51, 1311–1322. [Google Scholar] [CrossRef]
  18. Dawidowicz, K. Sea Level Changes Monitoring Using GNSS Technology—A Review of Recent Efforts. Acta Adriat. 2014, 55, 145–162. [Google Scholar]
  19. Zhu, L.; Yang, L.; Xu, Y.; Yang, F.; Zhou, X. Retrieving Wave Parameters from GNSS Buoy Measurements Using the PPP Mode. IEEE Geosci. Remote Sens. Lett. 2020, 19, 1–5. [Google Scholar] [CrossRef]
  20. Kato, T.; Terada, Y.; Tadokoro, K.; Kinugasa, N.; Futamura, A.; Toyoshima, M.; Yamamoto, S.; Ishii, M.; Tsugawa, T.; Nishioka, M. Development of GNSS Buoy for a Synthetic Geohazard Monitoring System. J. Disaster Res. 2018, 13, 460–471. [Google Scholar] [CrossRef]
  21. Lutsenko, V.I.; Lutsenko, I.V.; Popov, I.V.; Luo, Y.; Anh, N.X.; Guo, Q.; Zheng, Y. GNSS Signal Use for Sea Waves Monitoring. In Proceedings of the 2020 IEEE Ukrainian Microwave Week (UkrMW), Kharkiv, Ukraine, 21–25 September 2020; pp. 768–771. [Google Scholar]
  22. Yang, L.; Xu, Y.; Jiang, Y.; Mertikas, S.P.; Wang, Z.; Zhu, L.; Liu, N.; Lin, L. Retrieval of Ocean Wave Characteristics via Single-Frequency Time-Differenced Carrier Phases From GNSS Buoys. IEEE Trans. Geosci. Remote Sens. 2024, 62, 4204512. [Google Scholar] [CrossRef]
  23. Gu, H.; Zhu, X.; Shan, R.; Zang, J.; Qian, L.; Lin, P. Evaluation of a GNSS for Wave Measurement and Directional Wave Spectrum Analysis. Ocean Eng. 2023, 270, 113683. [Google Scholar] [CrossRef]
  24. Liang, G.; Li, S.; Bao, K.; Wang, G.; Teng, F.; Zhang, F.; Wang, Y.; Guan, S.; Wei, Z. Development of GNSS Buoy for Sea Surface Elevation Observation of Offshore Wind Farm. Remote Sens. 2023, 15, 5323. [Google Scholar] [CrossRef]
  25. Shum, C.K.; Lee, H.; Abusali, P.A.M.; Braun, A.; de Carufel, G.; Fotopoulos, G.; Komjathy, A.; Kuo, C. Prospects of Global Navigation Satellite System (GNSS) Reflectometry for Geodynamic Studies. Adv. Space Res. 2011, 47, 1814–1822. [Google Scholar] [CrossRef]
  26. Jing, C.; Niu, X.; Duan, C.; Lu, F.; Di, G.; Yang, X. Sea Surface Wind Speed Retrieval from the First Chinese GNSS-R Mission: Technique and Preliminary Results. Remote Sens. 2019, 11, 3013. [Google Scholar] [CrossRef]
  27. Ruffini, G.; Soulat, F.; Caparrini, M.; Germain, O.; Martín-Neira, M. The Eddy Experiment: Accurate GNSS-R Ocean Altimetry from Low Altitude Aircraft. Geophys. Res. Lett. 2004, 31, L12306. [Google Scholar] [CrossRef]
  28. Guerra, M.; Hay, A.E.; Karsten, R.; Trowse, G.; Cheel, R.A. Turbulent Flow Mapping in a High-Flow Tidal Channel Using Mobile Acoustic Doppler Current Profilers. Renew. Energy 2021, 177, 759–772. [Google Scholar] [CrossRef]
  29. Tomita, F.; Kido, M.; Iinuma, T.; Ohta, Y. GNSS-Acoustic Positioning Error in the Vertical Component Considering the Uncertainty of a Reference Sound Speed Profile. Mar. Geophys. Res. 2025, 46, 3. [Google Scholar] [CrossRef]
  30. Pérez Gómez, B.; Vilibić, I.; Šepić, J.; Međugorac, I.; Ličer, M.; Testut, L.; Fraboul, C.; Marcos, M.; Abdellaoui, H.; Álvarez Fanjul, E. Coastal Sea Level Monitoring in the Mediterranean and Black Seas. Ocean Sci. 2022, 18, 997–1053. [Google Scholar] [CrossRef]
  31. Lin, Y.-P.; Huang, C.-J.; Chen, S.-H. Variations in Directional Wave Parameters Obtained from Data Measured Using a GNSS Buoy. Ocean Eng. 2020, 209, 107513. [Google Scholar] [CrossRef]
  32. Lin, Y.-P.; Huang, C.-J.; Chen, S.-H.; Doong, D.-J.; Kao, C.C. Development of a GNSS Buoy for Monitoring Water Surface Elevations in Estuaries and Coastal Areas. Sensors 2017, 17, 172. [Google Scholar] [CrossRef]
  33. Lei, J.; Li, F.; Zhang, S.; Xiao, C.; Xie, S.; Ke, H.; Zhang, Q.; Li, W. Ocean Tides Observed from A GPS Receiver on Floating Sea Ice near Chinese Zhongshan Station, Antarctica. Mar. Geod. 2018, 41, 353–367. [Google Scholar] [CrossRef]
  34. Wang, F.; Yang, D.; Wang, J.; Xing, J.; Yu, Y. Shipborne GNSS Reflectometry for Monitoring Along-Track Significant Wave Height and Wind Speed. Ocean Eng. 2023, 281, 114935. [Google Scholar] [CrossRef]
  35. Rychlik, I.; Johannesson, P.; Leadbetter, M.R. Modelling and Statistical Analysis of Ocean-Wave Data Using Transformed Gaussian Processes. Mar. Struct. 1997, 10, 13–47. [Google Scholar] [CrossRef]
  36. Zhang, J.; Ma, Y.; Benoit, M. Statistical Distributions of Free Surface Elevation and Wave Height for Out-of-Equilibrium Sea-States Provoked by Strong Depth Variations. Ocean Eng. 2024, 293, 116645. [Google Scholar] [CrossRef]
  37. Gryazin, D.G.; Belova, O.O.; Gleb, K.A.; Kovchin, M.I. Study of the Characteristics of Wave Buoys by Comparison Measurements. Oceanology 2018, 58, 742–748. [Google Scholar] [CrossRef]
  38. Dehghan, Y.; Sadrinasab, M.; Chegini, V.; Akhyani, M. Wave Spectrum Analysis for Southern Caspian Sea. Ocean Eng. 2023, 272, 113490. [Google Scholar] [CrossRef]
  39. Krogstad, H.E. Maximum Likelihood Estimation of Ocean Wave Spectra from General Arrays of Wave Gauges. Model. Identif. Control. 1988, 9, 81–97. [Google Scholar] [CrossRef]
  40. Liu, P.C. Wavelet Spectrum Analysis and Ocean Wind Waves. In Wavelet Analysis and Its Applications; Elsevier: Amsterdam, The Netherlands, 1994; Volume 4, pp. 151–166. ISBN 1874-608X. [Google Scholar]
  41. Joodaki, G.; Nahavandchi, H.; Cheng, K. Ocean Wave Measurement Using GPS Buoys. J. Geod. Sci. 2013, 3, 163–172. [Google Scholar] [CrossRef]
  42. Hashimoto, N. Analysis of the Directional Wave Spectrum from Field Data. Adv. Coast. Ocean Eng. 1997, 3, 103–144. [Google Scholar]
  43. Torabi, M.; Shahidi, R.; Gill, E.W. Ocean Surface Wave Parameter Estimation Using Periodogram Method. In Proceedings of the XXXVth URSI General Assembly and Scientific Symposium (URSI GASS), Sapporo, Hokkaido, Japan, 19–26 August 2023. [Google Scholar]
  44. Rasool, S.; Muttaqi, K.M.M.K.M. Modeling Ocean Waves and Investigation of Oceanic Wave Spectra for Wave-to-Wire System. J. Eng. Res. 2022, 10, 1–17. [Google Scholar] [CrossRef]
  45. Valipour, M.; Banihabib, M.E.; Behbahani, S.M.R. Parameters Estimate of Autoregressive Moving Average and Autoregressive Integrated Moving Average Models and Compare Their Ability for Inflow Forecasting. J. Math. Stat. 2012, 8, 330–338. [Google Scholar] [CrossRef]
  46. Gryazin, D.; Gleb, K. A New Method to Determine Directional Spectrum of Sea Waves and Its Application to Wave Buoys. J. Ocean Eng. Mar. Energy 2022, 8, 269–283. [Google Scholar] [CrossRef]
  47. Krogstad, H.E.; Magnusson, A.K.; Donelan, M.A. Wavelet and Local Directional Analysis of Ocean Waves. In Proceedings of the ISOPE International Ocean and Polar Engineering Conference, San Francisco, CA, USA, 28 May–2 June 2006; ISOPE: Mountain View, CA, USA, 2006; p. ISOPE-I-06-204. [Google Scholar]
  48. Donelan, M.; Babanin, A.; Sanina, E.; Chalikov, D. A Comparison of Methods for Estimating Directional Spectra of Surface Waves. J. Geophys. Res. Ocean. 2015, 120, 5040–5053. [Google Scholar] [CrossRef]
  49. Chang, Z.; Han, F.; Sun, Z.; Gao, Z.; Wang, L. Three-Dimensional Dynamic Sea Surface Modeling Based on Ocean Wave Spectrum. Acta Oceanol. Sin. 2021, 40, 38–48. [Google Scholar] [CrossRef]
  50. Yu, Y.; Liu, S. Random Wave and Its Applications to Engineering, 4th ed.; Dalian University of Technology Press: Dalian, China, 2011; ISBN 978-7-5611-0466-8. [Google Scholar]
  51. Smith, S.W. The Scientist and Engineer’s Guide to Digital Signal Processing; California Technical Pub: Brisbane, CA, USA, 1997. [Google Scholar]
  52. Lyons, R.G. Understanding Digital Signal Processing, 3/E; Pearson Education India: Chennai, India, 1997; ISBN 81-317-6436-2. [Google Scholar]
  53. Panahi, R.; Shafieefar, M. Development of a Bi-Modal Directional Wave Spectrum. Ocean Eng. 2015, 105, 104–111. [Google Scholar] [CrossRef]
Figure 1. Experimental site and setup. (a) GNSS buoy test area; (b) GNSS buoy.
Remotesensing 17 02869 g001
Figure 2. Diagram of ocean wave measurement process using GNSS buoy.
Remotesensing 17 02869 g002
Figure 3. Three-dimensional wavefront displacement time series from GNSS buoy.
Remotesensing 17 02869 g003
Figure 4. U-direction wavefront displacement sequence (sampling rate 1 Hz).
Remotesensing 17 02869 g004
Figure 5. Wavefront displacement sequence filtering (time domain and frequency domain).
Remotesensing 17 02869 g005
Figure 6. Direction distribution function before correction.
Remotesensing 17 02869 g006
Figure 7. Revised directional distribution function.
Remotesensing 17 02869 g007
Figure 8. GNSS buoy wavefront height variation (data duration: 8 min).
Remotesensing 17 02869 g008
Figure 9. GNSS buoy wave crest, trough, height, and period statistics. (a) 27 April 2023 8:00~8:08; (b) 27 April 2023 8:30~8:38; (c) 27 April 2023 9:00~9:08; (d) 27 April 2023 9:30~9:38; (e) 27 April 2023 10:00~10:08; (f) 27 April 2023 10:30~10:38; (g) 27 April 2023 11:00~11:08; (h) 27 April 2023 11:30~11:38. The asterisks (*) in figure represent the sorted wave periods (in seconds) corresponding to wave heights arranged in descending order.
Remotesensing 17 02869 g009aRemotesensing 17 02869 g009b
Figure 10. Spectral estimation diagram of measured data.
Remotesensing 17 02869 g010
Figure 11. Comparative analysis of power spectral density using periodogram, autocorrelation function, and AR model methods.
Remotesensing 17 02869 g011
Figure 12. Comparison chart of inverted sea surface wave height and true sea surface wave height.
Remotesensing 17 02869 g012
Figure 13. Comparison chart of inverted period and real period.
Remotesensing 17 02869 g013
Figure 14. Directional spectrum: 3D and plan views (27 April 2023 11:30–12:00).
Remotesensing 17 02869 g014
Figure 15. Three-dimensional wave directional spectrum.
Remotesensing 17 02869 g015
Figure 16. Polar coordinate diagram of wave direction spectrum.
Remotesensing 17 02869 g016
Table 1. Commonly used characteristic values in wave statistical analysis.
Characteristic ValueCalculation FormulaCharacteristic ValueCalculation Formula
Maximum wave height H max = H 1 Maximum wave period T max = T 1
Highest one-tenth wave height H 1 / 10 = 10 N i = 1 10 N H i Mean period of the highest one-tenth waves T 1 / 10 = 10 N i = 1 10 N T i
Significant wave height H 1 / 3 = 3 N i = 1 3 N H i Significant wave period T 1 / 3 = 3 N i = 1 3 N T i
Mean wave height H ¯ = 1 N i = 1 N H i Mean wave period T ¯ = 1 N i = 1 N T i
Table 2. Parameter configuration.
ParameterConfiguration
Position ModeKinematic
FrequenciesL1
Solution TypeForward
Elevation Mask15.0 deg
Ephemeris DataBroadcast
Navigation SystemsGPS/GLONASS/Galileo/BDS
Ambiguity ResolutionInstantaneous
Integer Validation Threshold3.0
Table 3. Statistical values of characteristic wave height and number of waves.
Data PeriodStatistical Wave Height Parameters (m)Number of Waves
H max H 1 / 10 H 1 / 3 H m e a n
08:00–08:080.720.570.480.32112
08:30–08:381.060.820.660.44111
09:00–09:080.870.700.570.38105
09:30–09:380.870.680.530.35110
10:00–10:080.820.720.570.37111
10:30–10:381.010.840.680.44113
11:00–11:081.090.820.660.45113
11:30–11:381.230.980.840.54106
Table 4. Statistical value of characteristic wave period.
Data PeriodStatistical Wave Period Parameters (s)
T max T 1 / 10 T 1 / 3 T m e a n
08:00–08:088.006.005.324.19
08:30–08:387.005.835.264.22
09:00–09:088.006.735.664.52
09:30–09:388.006.365.544.34
10:00–10:087.006.335.434.30
10:30–10:388.006.255.374.22
11:00–11:088.006.005.324.22
11:30–11:387.006.185.084.33
Table 5. Comparison of wave characteristic element results using periodogram, autocorrelation function, and AR model methods.
Wave ParametersPeriodogramAutocorrelationAR ModelZero-Crossing
Significant Wave Height (m)0.890.890.890.84
Significant Wave Period (s)4.274.274.295.08
Mean Wave Height (m)0.560.560.560.54
Mean Wave Period (s)4.254.244.254.33
Disclaimer/Publisher’s Note: The statements, opinions and data contained in all publications are solely those of the individual author(s) and contributor(s) and not of MDPI and/or the editor(s). MDPI and/or the editor(s) disclaim responsibility for any injury to people or property resulting from any ideas, methods, instructions or products referred to in the content.