Abstract
The accurate classification of staple crops is of great significance for scientifically promoting food production. Crop classification methods based on deep learning models or medium/low-resolution images have been applied in plain areas. However, existing methods perform poorly in complex mountainous scenes with rugged terrain, diverse planting structures, and fragmented farmland. This study introduces the Complex Scene Crop Classification U-Net+ (CSCCU+), designed to improve staple crop classification accuracy in intricate landscapes by integrating supplementary spectral information through an additional branch input. CSCCU+ employs a multi-branch architecture comprising three distinct pathways: the primary branch, auxiliary branch, and supplementary branch. The model utilizes a multi-level feature fusion architecture, including layered integration via the Shallow Feature Fusion (SFF) and Deep Feature Fusion (DFF) modules, alongside a balance parameter for adaptive feature importance calibration. This design optimizes feature learning and enhances model performance. Experimental validation using GaoFen-2 (GF-2) imagery in Xifeng County, Guizhou Province, China, involved a dataset of 2000 image patches (256 × 256 pixels) spanning seven categories. The method achieved corn and rice classification accuracies of 89.16% and 88.32%, respectively, with a mean intersection over union (mIoU) of 87.04%, outperforming comparative models (U-Net, DeeplabV3+, and CSCCU). This research paves the way for staple crop classification in complex land surfaces using high-resolution imagery, enabling accurate crop mapping and providing robust data support for smart agricultural applications.
1. Introduction
Against the backdrop of rapid global population growth, pressures from economic development, and climate/environmental changes, the issue of global food security has been increasingly exacerbated [1]. As a core technology in smart agriculture, the precise classification of staple food crops (rice, wheat, corn, etc.) holds indispensable significance for scientifically promoting food production [2]. Accurate acquisition of regional land use and crop classification information facilitates modern agricultural production management, efficient water resource utilization, ecological environmental protection, and agricultural yield estimation [3].
China, as a country with complex and diverse terrain, has approximately 65% of its terrestrial land area covered by mountainous regions. The southwestern mountainous areas constitute a critical grain-producing region in China, with Guizhou Province serving as a typical representative of mountainous areas in Southwestern China, characterized by complex agricultural planting scenarios. Agriculture in this region is predominantly based on smallholder farming [4], where production activities are primarily oriented toward meeting the daily livelihood needs and economic requirements of households. As a result, smallholder farmers are highly sensitive to the impacts of economic benefits and land-use policies, exhibiting significant arbitrariness in farming practices [5]. This uncertainty and arbitrariness in land use have led to delays in acquiring spatial distribution information of cultivated land and crops in mountainous areas, often preventing relevant government departments from timely obtaining and monitoring the category, area, and dynamic change information of the existing agricultural land. This not only hinders the formulation of relevant agricultural policies but also significantly impedes the improvement of agricultural production efficiency and the development of modern precision agriculture [4].
Early agricultural information was primarily collected and aggregated through on-the-ground data collection. This approach not only resulted in heterogeneous data quality but also entailed extremely high time and material costs for large-scale agricultural surveys, with outcomes suffering from significant lag and greatly reducing their utility value. With the continuous advancement of modern agriculture, there is an urgent need for new technologies and methods to enhance the level of cropland information acquisition. As the unique means for large-scale, rapid acquisition of earth surface information, remote sensing technology has emerged as a more reliable and cost-effective approach for agricultural monitoring, serving as an effective pathway to timely access agricultural information [6,7,8]. Currently, remote sensing has become a critical tool for identifying and acquiring spatial distribution information of cropland and crops [9].
In recent investigations, several scholars have harnessed medium- to low-resolution satellite imagery for large-scale cropland mapping initiatives [10,11,12,13]. Additionally, in some remote sensing-based land-use/land-cover (LULC) products covering all categories, cropland is often treated as one or several extremely important classes [14,15,16,17]. However, these products are primarily derived from medium- to low-resolution remote sensing imagery (e.g., AVHRR, Landsat, and MODIS), suffering from shortcomings such as low spatial resolution, spectral mixing, and inadequate classification accuracy. Particularly in mountainous agricultural regions with complex topography, diverse planting structures, and fragmented farmland, these cropland information products fail to accurately extract and delineate cultivated plots and crop information at the plot scale. The lack of plot-level detail leads to high uncertainty in the obtained spatial distribution of cropland and crops, significantly limiting their applicability [18]. Conversely, ultra-high resolution multispectral images possess the unique capability to capture and integrate intricate spatial details [19].
In addition to detailed information in the spatial dimension, the temporal dimension can also provide crucial discriminative information. Notable progress has been made in integrating time series with deep architectures. Recurrent Neural Networks (RNNs), especially Long Short-Term Memory (LSTM) blocks, can leverage temporal variations in spectral features to enhance ground object recognition, with numerous applications in the agricultural sector [20,21,22]. For instance, a combination of CNNs and RNNs has been used to predict the spatial distribution of tea plantations [23] or perform multi-class crop classification [24]. Meanwhile, attention-based mechanisms [25,26,27] have also emerged as powerful tools for adaptively weighting spatial–spectral–temporal features. Some scholars have utilized convolutional attention and temporal attention based on multi-temporal data for the identification of corn, wheat, and soybean [28]; some scholars have conducted crop recognition across multiple datasets by combining global temporal attention and local temporal attention based on multi-temporal data [29]; and some scholars have incorporated ACmix attention into the ResNet50 architecture to achieve the recognition of four crop types [30]. However, in complex scenes where temporal data are difficult to obtain periodically, the applicability of these methods has been significantly weakened.
The rise of deep learning has propelled remote sensing classification into an era of automatic feature extraction, where single-branch convolutional neural networks (CNNs) achieve high accuracy in crop classification for plain areas [31,32,33,34,35]. However, complex scenes in mountainous regions pose specific challenges to model performance. Firstly, the problem of multi-dimensional feature coupling arises: Crop classification relies on simultaneous integration of spectral, spatial, and other feature information. The serial processing pattern of single-branch networks struggles to achieve efficient collaboration among heterogeneous features, often leading to the loss of critical information. Secondly, insufficient robustness against complex interferences is evident: Issues such as mixed pixels, topographic shadows, and cloudy noise cause traditional CNNs to suffer accuracy degradation in complex scenes. The nonlinear superposition of multiple interference factors exacerbates feature ambiguity, making pure data-driven models difficult to generalize. Thirdly, the contradiction between lightweight design and generalization ability becomes prominent: Mountainous area monitoring relies on edge devices like UAVs, but mainstream models typically require high computational resources, failing to meet real-time inference demands. Meanwhile, in small-sample scenarios common in fragmented mountain plots, models often exhibit insufficient generalization due to limited training data, resulting in poor adaptability to intra-class variations.
The multi-branch structure refers to a network design where multiple parallel branches operate concurrently within the framework. This structural design enables the integration of diverse advantageous strategies through independent processing of each branch, including combinations of different backbone networks, multi-scale feature fusion, or integration of heterogeneous modal data. Although recent studies [36,37,38,39,40,41] have explored multi-branch structures in semantic segmentation tasks, their application in fine-grained crop classification using GF-2 images within complex scenes remains limited. Specifically, the multi-branch network paradigm has not been widely adopted for classifying crops in fragmented landscapes or diverse topographical conditions, presenting an underexplored research direction in agricultural remote sensing.
Motivated by the discussions above, we enhanced the Complex Scene Crop Classification U-Net (CSCCU) [42] and proposed the CSCCU+. Aiming to overcome the difficulties posed by complex scenes, we extended the CSCCU architecture with a novel multi-branch design. Through the Shallow Feature Fusion (SFF) module containing two Squeeze and Excitation (SE) blocks [43], it integrates the shallow features extracted from the convolutional layers of each branch, capturing fine-grained details and local contexts. At the bottom of the encoder, by means of the Deep Feature Fusion (DFF) module with an attention module [25], it aggregates the deep semantic features of each branch to fuse global contexts. Meanwhile, a balance parameter is introduced to adjust the weight proportion of features from different branches, ensuring the optimal contribution of features from each branch.
This research makes two significant contributions, outlined below:
- (1)
- Development of CSCCU+ for Complex Scenes. We introduce the CSCCU+ framework, a novel multi-level hierarchical fusion approach tailored to complex environments. Leveraging a multi-branch architecture, CSCCU+ enhances the discriminative power of branch-specific data via dedicated feature fusion modules. The multi-level hierarchical fusion mechanism strengthens inter-branch feature interactions, facilitating the extraction of hierarchical semantic information. This design not only promotes comprehensive learning of multi-scale features but also significantly improves the semantic segmentation accuracy of remote sensing imagery, addressing the challenges posed by intricate landscapes.
- (2)
- Precision Mapping of Staple Crops in Xifeng County. By implementing the proposed CSCCU+ method, we successfully generated a high-resolution classification map for staple crops in Xifeng County. This detailed mapping delineates crop distributions with enhanced precision, providing valuable insights into agricultural patterns within the region. The resulting map serves as a reliable data source for applications such as crop yield estimation, resource management, and sustainable farming practices, demonstrating the practical utility of our approach in real-world agricultural remote sensing scenarios.
2. Study Area
The study area is located in Xifeng County, situated in Guiyang City, Guizhou Province, as shown in Figure 1. Xifeng County exhibits distinct characteristics in terms of geographical location and natural environment. Situated in the northern part of Guiyang City, Xifeng County spans geographical coordinates from 106°27′ to 106°53′ Eastern Longitude and 26°57′ to 27°19′ Northern Latitude, with a total area of 1036 square kilometers. The county is predominantly characterized by karst topography, with a terrain that is higher in the south and lower in the north, featuring elevations ranging from 609 m to 1749 m. It experiences a mild and humid subtropical monsoon climate, with an average annual temperature of 14.5 °C and approximately 1100 mm of annual precipitation. Due to significant topographic elevation differences, it forms a vertical climate feature where “one mountain has four seasons.”
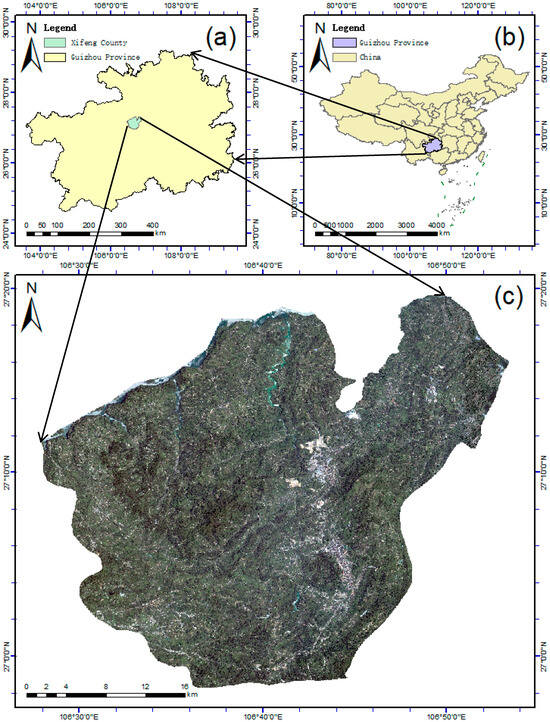
Figure 1.
A comprehensive overview of the study area: (a) the situation of Guizhou Province within China’s geographical map; (b) the specific position of Xifeng County within Guizhou; (c) true-color composite image of Xifeng County (spatial resolution: 0.8 m).
Geomorphologically, Xifeng County belongs to the central Guizhou mountainous and hilly region, with extensive distribution of carbonate rocks and typically well-developed karst landforms. The county displays complex geomorphic combinations, including mid-low mountains, hills, basins, and other landform types.
Climatically, Xifeng County is characterized by mild winters, cool summers, and a frost-free period of approximately 270 days, making it suitable for growing a variety of crops. Such unique geographical environments and climatic conditions provide an ideal study area for agricultural remote sensing research under complex scenarios.
3. Methods
3.1. Dataset
For the purposes of model training and validation, a classification dataset was constructed specifically for Xifeng County. This dataset integrates sampling data, optical spectral bands, and spectral features collected from various locations across the region. High-resolution (0.8 m) remote sensing images were sampled based on ultrahigh-resolution UAV imagery (with a resolution of <0.1 m) and ground-based sampling data (shown in Figure 2).
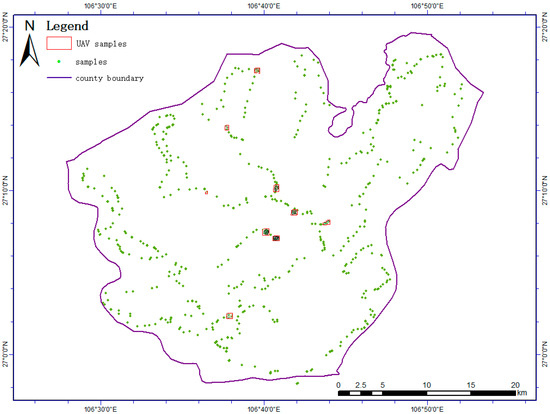
Figure 2.
The spatial arrangement of samples within the research region.
The high-resolution remote sensing data used in this study are GF-2 satellite images, acquired on 17 July 2023. The data were obtained from the China Centre for Resources Satellite Data and Application (https://data.cresda.cn) accessed on 30 September 2023. During the preprocessing, geometric correction was performed to eliminate spatial distortions and ensure the accurate location of ground objects; atmospheric correction was conducted to remove interference from non-ground object factors and enhance spectral discriminability; panchromatic–multispectral fusion was carried out to integrate multi-dimensional features and improve the distinguishability of ground objects; and image mosaic and image clipping were performed to obtain complete high-resolution images of Xifeng County. Meanwhile, images at corresponding locations were extracted based on sampling areas, and manual annotation was conducted to prepare the dataset.
GF-2 satellite data consist of 4 multispectral bands (red, green, blue, and near-infrared) and 1 panchromatic band. The spatial resolution of the fused images reaches 0.8 m. These RGB bands correspond to specific wavelength ranges: 630–690 nm for the red band, 520–590 nm for the green band, and 450–520 nm for the blue band. Additionally, the near-infrared (NIR) band was extracted separately from the GF-2 imagery (shown in Figure 3). Two key spectral indices were derived: the normalized difference vegetation index (NDVI), calculated as (NIR − Red)/(NIR + Red) [44], and the normalized difference water index (NDWI), computed as (Green − NIR)/(Green + NIR) [45].
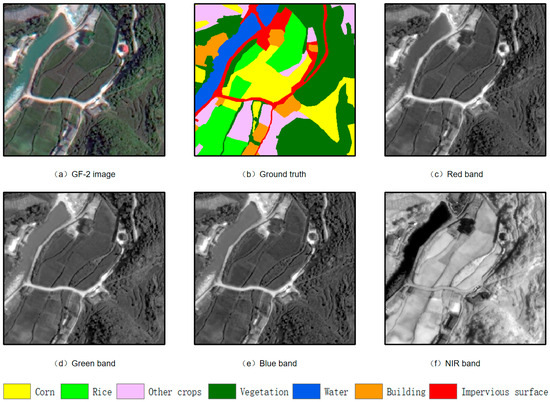
Figure 3.
Display of true-color composite image and 4-band multispectral images of ground objects.
In the model’s input configuration, the RGB bands served as the main branch input, capturing visible-spectrum information. The NIR band and NDVI were employed as auxiliary inputs, and the NDWI was incorporated as a supplementary input, enhancing the model’s sensitivity to vegetation characteristics.
3.2. The Architecture of Complex Scene Crop Classification U-Net + (CSCCU+)
The architectural design of CSCCU+ is illustrated in Figure 4. Building upon the U-Net framework, CSCCU+ employs a multi-branch strategy to leverage complementary spectral information. The model consists of three parallel branches: the main branch uses RGB bands as input, the auxiliary branch employs near-infrared (NIR) bands and normalized difference vegetation index (NDVI) data as input, and the supplementary branch utilizes normalized difference water index (NDWI) data as input. CSCCU+ achieves superior recognition performance by balancing the feature importance across branches.
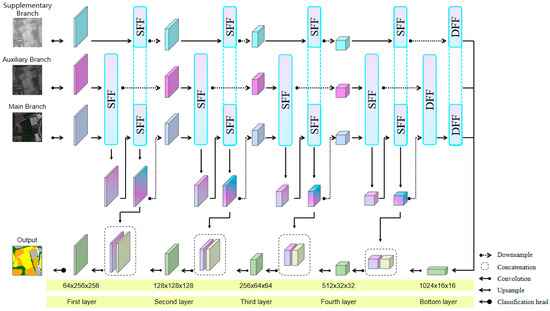
Figure 4.
An architectural overview of the proposed CSCCU+. All branch encoders are constructed using CNN blocks, each comprising two depthwise separable convolutional layers. In the initial four layers of these CNN blocks, the SFF module is utilized to integrate features. At the bottom layer of the encoder, the DFF module is applied to perform attention-based feature aggregation. On the decoding side, a cascaded upsampling approach is adopted.
Within the encoder architecture, hierarchical feature fusion is orchestrated through two specialized modules: the Shallow Feature Fusion (SFF) module, which operates in the lower convolutional layers, and the Deep Feature Fusion (DFF) module, positioned at the encoder’s bottom. This two-tier fusion strategy enables CSCCU+ to synergistically integrate multi-branch features across different abstraction levels. Specifically, the main branch and auxiliary branch features are first fused, and the resulting features are treated as the main branch’s features for subsequent fusion with the supplementary branch. The twice-fused features act as the main branch input for the subsequent network layer. At the encoder’s bottom stage, a DFF layer is utilized to combine features from all three branches, mirroring the sequence adopted during the shallow fusion phase. Through the DFF module’s attention allocation, deeper semantic features are aggregated, significantly enriching the contextual representation. Upon completion of the deep fusion process, the output from the DFF attention layer is passed to a cascaded upsampling decoder. This decoder is tasked with restoring the spatial dimensions of the feature maps, crucial for accurate pixel-level classification. A distinctive aspect of CSCCU+ is the inclusion of a balance parameter. This parameter serves to regulate the contribution of each branch, ensuring that the model optimally leverages the unique information provided by different data streams.
The subsequent sections provide an in-depth exploration of the critical feature fusion modules and the balance parameter within the CSCCU+ framework.
3.2.1. SFF Module
In this research, the input data for the main, auxiliary, and supplementary branches are denoted as X ∈ RH×W×C, Y ∈ RH×W×C, and Z ∈ RH×W×C, respectively. Here, H, W, and C represent the height, width, and number of channels of the input tensors. Notably, the main branch comprises three channels, the auxiliary branch contains two channels, and the supplementary branch has a single channel, as illustrated in Figure 4.
The CSCCU+ architecture features a multi-branch encoder design, which is responsible for extracting discriminative features from each input stream. The encoder’s initial four layers leverage the Shallow Feature Fusion (SFF) module. This module enables hierarchical feature integration across branches, facilitating the extraction of fine-grained details and local context from the input data at different levels.
Following each convolutional operation, the spatial dimensions of the downsampled feature maps are reduced by half. Specifically, both the height (H) and width (W) of the feature maps are halved relative to the previous layer’s dimensions. Significantly, the integrated output of each layer’s features directly feeds into the main branch of the subsequent layer. This process involves fusing the features extracted by the auxiliary and supplementary branches into the main branch, thereby enriching its feature representation. In contrast, the auxiliary and supplementary branches pass only their self-extracted features from the preceding layer to the next layer. Regarding the skip connection mechanism, the SFF module-generated fused outputs function as encoder feature maps. These maps are then connected to corresponding decoder layers, which play a crucial role in reconstructing spatial and contextual information. This design ensures that low-level details from the encoder are effectively utilized during the upsampling process, enhancing the model’s ability to capture fine-grained scene characteristics.
The architecture depicted in Figure 5. This module processes inputs from two branches concurrently. Initially, it applies global average pooling to the input data, effectively aggregating global context information. Subsequently, the SE operation is carried out twice, utilizing depthwise separable convolutions. During these operations, the ReLU and Sigmoid activation functions are sequentially employed. In the final step, the features from the main branch and the other branches undergo a weighted combination on an element-by-element basis, thus achieving Shallow Feature Fusion. The SE mechanism comprises two key components: the squeeze operation, which encodes global information by compressing spatial dimensions, and the excitation operation, which recalibrates channel-wise dependencies to emphasize relevant features. This two-step process enables the SFF module to enhance feature representation and capture hierarchical relationships within the input data.
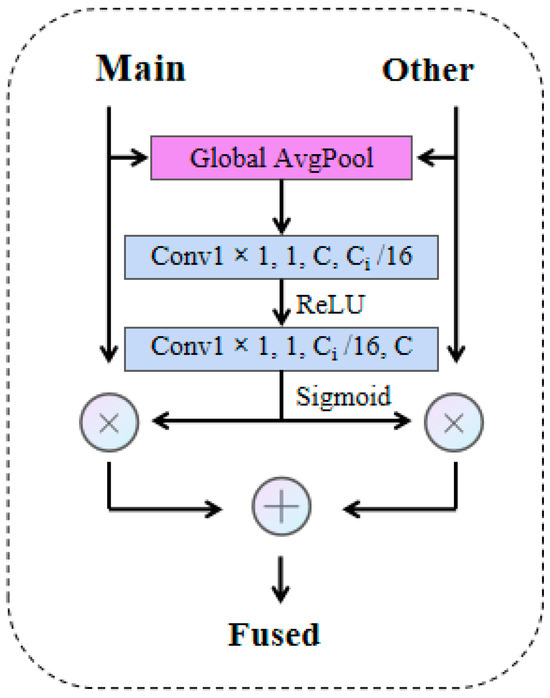
Figure 5.
The internal structure of the SFF module. SFF takes as input the feature maps from two separate branches. The processing commences with a channel prioritization step, and then it proceeds to merge the features from both branches by performing element-wise addition operations (The parameters in the figure represent kernel size, stride, number of input channels, and number of output channels.).
The average pooling function is defined as
In the equation, Fsq represents the global average pooling for the channel, H and W denote the height and width of each feature map, respectively, c indicates the corresponding number of channels, and xc(i,j) represents the pixel value at the position (i,j) of the feature map.
The mathematical expression of the ReLU activation function is as follows:
The mathematical expression of the Sigmoid function is as follows:
Taking channel c as an example, the calculation method is as follows:
In the equations, Fex represents the channel importance coefficient obtained from the Fsq operation, which weights the feature map of each channel. δ denotes the ReLU operation, w0 and w1 represent the weights of the fully connected layers, and σ indicates the Sigmoid function.
During feature fusion, the weight parameter γ is used to adjust the importance of features from each branch. The specific expression is as follows:
3.2.2. DFF Module
The attention mechanism was initially developed in 2014 for natural language processing applications [46]. Like other neural network-based methods, it processes data by imitating the way the human brain handles visual information, with the core idea being to assign different weights to different types of information [47]. With the proposal of the Transformer model based on the self-attention mechanism [48], its excellent performance has led to a renewed recognition of the potential of the attention mechanism.
Inspired by a series of classic attention mechanisms [25,26,27], the DFF module incorporates an attention-based design (as shown in Figure 6). Its architecture comprises two key components: channel attention and spatial attention, which work in tandem to enhance feature representation.
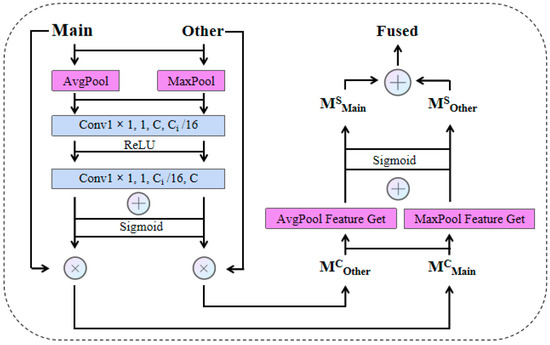
Figure 6.
The proposed DFF module is positioned at the bottom of the model architecture. The module employs a dual-pooling approach, leveraging both average pooling and max pooling operations. These pooling techniques are applied across two dimensions: the channel and spatial axes. After the pooling operations extract and transform the features, the resulting outputs are combined through element-wise addition (The parameters in the figure represent kernel size, stride, number of input channels, and number of output channels.).
The channel attention unit functions by analyzing inter-channel dependencies, treating each channel as an independent feature extractor. To efficiently capture channel-level attention, average pooling (AvgPool) is utilized to compress the spatial dimensions of the input data. Recognizing that max pooling (MaxPool) can provide complementary information for refining channel attention, a dual-pooling approach is adopted.
In the channel attention process, AvgPool and MaxPool operations are first applied to each branch separately, aggregating spatial information within the feature maps to obtain FAVG and FMAX, respectively. These pooled features are then fed into a shared network—a multi-layer perceptron with a single hidden layer. By setting a reduction ratio r, the hidden layer size is configured as C/r×1×1. After processing through this network, the resulting feature vectors are combined via element-wise addition to generate the channel attention map M ∈ RC×1×1. The calculation formulas of the activation functions are shown in Formulas (2) and (3).
All convolution blocks within the DFF module utilize depthwise separable convolutions, a widely adopted technique that decomposes traditional convolution into two sequential steps: depthwise convolution and pointwise convolution. This approach significantly reduces computational cost and parameter count while maintaining model accuracy, thereby decreasing overall complexity. Popular architectures like Xception and MobileNet [49] have successfully employed depthwise separable convolutions to optimize parameter efficiency and boost computational speed.
For spatial attention, the mechanism focuses on capturing spatial relationships among input features. While channel attention emphasizes the importance of feature content, spatial attention localizes regions of interest within the feature maps. To compute the spatial attention map, AvgPool and MaxPool operations are performed along the channel axis for each branch. The pooled results are concatenated to form a combined feature, leveraging the ability of channel-axis pooling to highlight key information areas [33]. A subsequent convolutional operation on this combined feature generates the final spatial attention map M ∈ RH×W, which selectively enhances or suppresses regions based on their informational significance.
During the output stage of feature fusion, the weighting scheme defined in Equation (7) is implemented. This mechanism dynamically adjusts the contribution of each branch, ensuring a balanced representation of multi-branch features.
3.2.3. The Cascaded Decoder
As illustrated in Figure 4, the cascaded decoder architecture utilizes a sequential arrangement of upsampling modules to reconstruct the fused hidden features. Initially, the decoder takes the output from the DFF module at the network’s lowest level and applies an upsampling operation, scaling it to match the dimensionality of the corresponding encoder layer. Following upsampling, the feature maps are concatenated with the feature representations retrieved from the symmetric layer of the encoder. This concatenation mechanism, also known as skip connection, effectively transfers low-level details from the encoder to the decoder.
The upsampling and concatenation process is iteratively repeated until the feature maps regain the spatial resolution of the original input, denoted as H × W. Each decoder block within this pipeline consists of an upsampling step, which increases the spatial dimensions of the feature maps, and a convolutional operation, which refines the feature representations. Once the final decoder block processes the features, the classification head receives the output and generates the final classification predictions, determining the category labels for each pixel in the input image.
3.3. Performance Evaluation Criteria
This research focuses on the segmentation and classification of diverse land cover types, including bare cultivated areas (specifically corn, rice, and other crops), vegetation, buildings, impervious surfaces, and water. To quantitatively assess the model’s effectiveness, we adopt two primary metrics: the mean intersection over union (mIoU) and the overall accuracy (OA). These metrics are widely recognized in remote sensing image analysis for evaluating the performance of semantic segmentation models.
The OA metric measures the proportion of correctly classified pixels across all land cover categories. It provides a general indication of the model’s pixel-wise classification accuracy. In contrast, the mIoU metric calculates the average overlap between the predicted and ground truth segmentation masks for each individual class. It is particularly sensitive to class imbalance and provides a more nuanced assessment of the model’s performance across different land cover types. The mathematical formulations for these metrics are as follows:
where C represents the number of categories, and Xk denotes the accuracy of the k-th category.
4. Results
4.1. The Computational Setting
The input data was divided into patches of 256 × 256 pixels. A total of 2000 patches were generated from the study area, which were then partitioned into training and testing subsets at an 8:2 ratio. Specifically, 1600 patches (80%) were allocated for model training, while the remaining 400 patches (20%) were reserved for independent testing. This dataset partitioning strategy ensured a comprehensive evaluation of the model’s generalization capabilities across diverse landscapes. The detailed experimental setup is outlined in Table 1.

Table 1.
The computational settings.
In our experimental design, we did not utilize pre-trained backbone networks like U-Net or DeeplabV3+. Instead, all models were initialized with random weights and trained from scratch to ensure fair comparative analysis. This approach avoids potential biases from pre-existing feature representations and allows for an unbiased evaluation of the proposed method’s performance. The CSCCU + training process is shown in Figure 7.
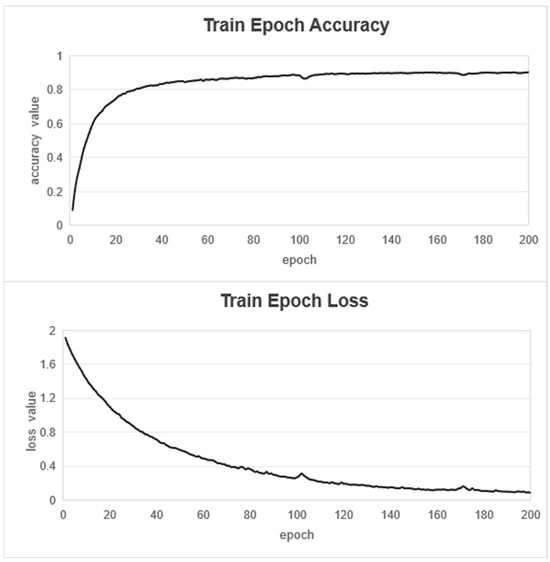
Figure 7.
Train epoch loss and train epoch accuracy.
4.2. Comparisons of CSCCU Among Different Methods
This section evaluates the performance of the proposed approach against established semantic segmentation architectures, namely U-Net [50], DeeplabV3+ [51], and the previously developed CSCCU [42]. To comprehensively assess the model’s effectiveness, we conduct a head-to-head comparison, focusing on key metrics such as overall accuracy, class-specific precision, and recall. The comparative results, summarized in Table 2, offer a detailed analysis of how the new method fares against other methods in the context of complex scene crop classification.
Table 2.
Comparison of results between different methods.
The U-Net, based on the encoder–decoder symmetric architecture, has significantly improved performance in semantic segmentation tasks by introducing a cross-layer feature fusion mechanism. However, when processing target edges with high heterogeneity, this model still suffers from edge ambiguity issues.
The DeeplabV3+ framework enhances multi-scale feature capture capability through the collaborative design of atrous convolution and spatial pyramid pooling modules, but its receptive field expansion strategy is restricted by the linear combination pattern of dilation rates (e.g., four-level sampling at 1, 6, 12, and 18), leading to a technical bottleneck of inadequate feature fusion when facing multi-scale target recognition requirements. Additionally, it exhibits a high omission rate for small-scale plots.
CSCCU employs a dual-branch structure, and by introducing attention into the U-Net framework, it achieves improved block recognition and boundary capture capabilities. However, the model adopts an average fusion approach in the feature fusion stage across branches, which struggles to balance the importance of features from each branch.
The experimental results highlight the superiority of the proposed approach. CSCCU+ achieves a mean intersection over union (mIoU) of 87.04%, surpassing U-Net (79.29%), DeepLabv3+ (70.11%), and the previous CSCCU model (86.63%) by 7.75, 16.93, and 0.41 percentage points, respectively. In the classification of staple crops, CSCCU+ exhibits significant advantages. For corn, its classification accuracy exceeds other methods by 0.90–6.16%; for rice, the improvement ranges from 1.19 to 15.76%; and for other crops, the margin is 0.05–9.67% (Table 2).
To further evaluate the model’s adaptability, we analyzed its performance under diverse conditions, including varying crop distributions, farmland sizes, and terrain types. As illustrated in Figure 8, CSCCU+ demonstrates robust classification capabilities in complex scenes. The model leverages hierarchical feature fusion to capture cross-branch correlations more effectively. For instance, it capitalizes on the spatial relationship between water bodies and rice paddies to enhance rice identification accuracy.
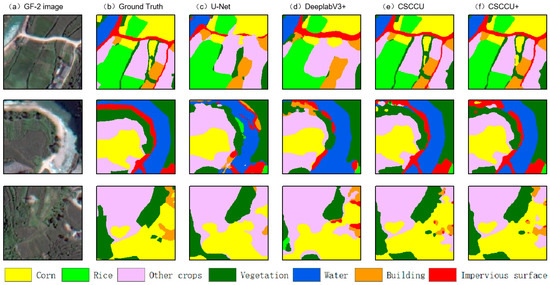
Figure 8.
A comparative visualization of feature identification across three representative scenes. (a) GF-2 image (RGB,0.8 m), (b) ground truth, (c) U-Net result, (d) DeeplabV3+ result, (e) CSCCU result, (f) CSCCU+ result.
Collectively, the multiple sets of experimental analysis validate the effectiveness of CSCCU+ in addressing the complexities of staple crop classification in challenging environments. The integration of the DFF module for feature enhancement and balance parameters for inter-branch optimization outperforms traditional classification approaches, providing a more accurate and reliable solution for agricultural remote sensing applications.
4.3. Results Under Different Input Data
The classification across multiple models, each utilizing distinct input datasets. Analyzing these findings uncovers several key observations:
- (1)
- Among all evaluated models, the CSCCU+ architecture consistently demonstrated the highest accuracy in classifying staple crops. Specifically, when RGB, NIR, NDVI, and NDWI were used, CSCCU+’s mIoU is 87.04%, which is 7.75%, 16.93% and 0.41% higher than that of U-Net, DeeplabV3 +, and CSCCU, respectively. Furthermore, CSCCU+ achieved an overall accuracy (OA) of 88.63%, surpassing U-Net, DeeplabV3 +, and the original CSCCU by 3.14%, 10.22%, and 1.08%, respectively. Additionally, CSCCU+ outperformed all competing models in terms of the intersection over union (IoU) metric.
- (2)
- The integration of NIR, NDVI, and NDWI significantly enhanced model performance. As shown in Table 3, models utilizing multi-modal inputs (RGB, NIR, NDVI, and NDWI) consistently outperformed those relying solely on RGB data. For instance, when using RGB inputs only, the OAs of U-Net, DeeplabV3+, and CSCCU+ were 77.85%, 77.09% and 76.12%, respectively. However, with the addition of NIR, NDVI, and NDWI, these accuracies increased to 85.49% (U-Net), 78.41% (DeeplabV3+), 87.55% (CSCCU), and 88.63% (CSCCU+). Compared to RGB-only inputs, the accuracy improvements were 7.64%, 1.32%, 11.43%, and 12.51% for U-Net, DeeplabV3+, CSCCU, and CSCCU+, respectively. This indicates that multi-modal inputs notably boost classification accuracy across all models, with CSCCU+ achieving the highest performance when leveraging the combined RGB, NIR, NDVI, and NDWI data.
Table 3. Results under different input features between different methods.
4.4. Ablation Experiment
Two distinct sets of ablation experiments were carried out to assess the efficacy of CSCCU+’s multi-branch network architecture and its balance parameter.
In the first experiment, to gauge the benefits of the multi-branch design, we executed a series of simulations. In these tests, we deactivated individual branches by redirecting their input data to the main branch. The resulting performance metrics were then contrasted with those of the full multi-branch configuration, as presented in Table 4. The experimental outcomes clearly illustrated the superiority of the multi-branch approach. When compared to the scenario using only the main branch input, the multi-branch architecture led to substantial accuracy improvements: a 7.11% increase in corn classification accuracy, a 10.22% rise in rice classification accuracy, and a 7.76% enhancement in overall accuracy. These findings strongly suggest that the multi-branch structure plays a pivotal role in boosting the model’s classification performance.
Table 4.
The effectiveness of different branch structures.
In the second experiment, we evaluated the impact of different balance parameters on the network (Table 5). When the balance parameter is 0, it means the main branch no longer operates, and according to the fusion order, the supplementary branch finally serves as the main branch for output. When the balance parameter is 1, it indicates that other branches do not function, and only the main branch performs output. When the balance parameter is between 0 and 1, the optimal accuracy is achieved at 0.6, with the accuracies of corn, rice, and the overall accuracy reaching 89.16%, 88.32%, and 88.63%, respectively.
Table 5.
Quantitative results under different balance parameters.
Collectively, the ablation underscores the effectiveness of the proposed multi-branch network, which capitalizes on a hierarchical feature fusion strategy. This design excels at extracting and integrating diverse multimodal data streams, leading to enhanced model performance. Specifically, it enables the network to achieve more accurate and detailed classification of staple crops in complex scenarios, outperforming architectures lacking such a comprehensive fusion mechanism.
4.5. Mapping Results in Xifeng County
Figure 9 illustrates the outcomes of applying the CSCCU+ methodology for high-resolution classification of staple crops in Xifeng County, Guizhou Province, in 2023. With a spatial resolution of 0.8 m, the model successfully categorized various crops, such as maize, paddy rice, and other agricultural categories. The classification process leveraged the model’s advanced feature fusion and multi-branch architecture to accurately delineate different crop types within the study area.
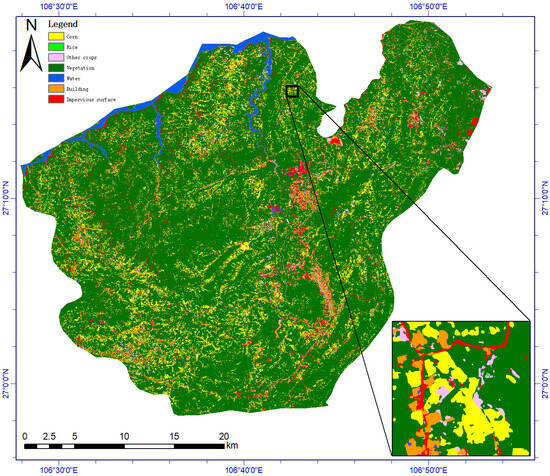
Figure 9.
The mapping outputs derived from GF-2 satellite imagery in Xifeng County, Guizhou Province, China (based on 0.8 m resolution GF-2 image). These results were generated through the application of the novel CSCCU+ approach.
5. Discussion
5.1. Structural Advantages for Complex Scene Applications
This research introduces the CSCCU+ neural network, specifically designed to address the challenges of accurate staple crop mapping in complex environments. The study area, Xifeng County in Guiyang City, Guizhou Province, Southwestern China, is emblematic of regions with rugged mountainous terrain. Here, the intricate topography, diverse climatic conditions, and inconsistent crop cultivation patterns pose substantial hurdles to effective staple crop classification.
Previous efforts in applying remote sensing for crop mapping have taken varied approaches. Some studies sought to boost mapping precision by augmenting data volume and diversity, employing large-scale training datasets or integrating time-series images. However, in complex terrains like Xifeng County, collecting extensive datasets is often impractical. High-resolution imagery, in particular, struggles to maintain temporal consistency. Other research has predominantly focused on areas with simpler planting conditions, such as flatlands or large, uniform fields. Such regions lack the land fragmentation and variable cultivation scenarios typical of complex landscapes, rendering many existing methods less effective when applied to real-world, challenging environments.
To surmount these challenges in complex-scene staple crop classification, the CSCCU+ model adopts a multi-branch architecture, incorporating the NIR band, NDVI, and NDWI as inputs. By integrating spectral features into deep learning via DFF attention mechanisms, this design significantly enhances classification accuracy. Comparative evaluations against established models, including U-Net, DeeplabV3 +, and CSCCU, demonstrate that CSCCU+ outperforms its counterparts in classification and mapping tasks for Xifeng County (Table 2), particularly excelling in categorizing staple crops like corn and rice. When benchmarked against other crop classification studies (Table 4), CSCCU+ achieves comparable or higher prediction accuracy with reduced input data, showcasing its efficiency in complex scenarios.
5.2. The Performance Advantages of CSCCU+
The CSCCU+ model presented in this study features a multi-branch architecture. Through shallow and deep hierarchical feature-level fusion, it effectively integrates the spectral information of each branch, significantly enhancing classification performance. As evidenced by the data in Table 2 and Table 3, the multi-branch design enables the model to extract discriminative features from diverse branches. Comparative analysis against U-Net, DeeplabV3 +, and CSCCU clearly validates this advantage. Specifically, the hierarchical feature fusion mechanism of CSCCU+ is crucial for improving staple crop classification accuracy in complex scenarios. When benchmarked against U-Net, DeeplabV3 +, and CSCCU, CSCCU+ demonstrates an overall accuracy improvement ranging from 1.08% to 10.22%. This superiority can be primarily attributed to its unique structural design.
CSCCU+ employs a two-stage feature fusion strategy: Starting with the SFF module, it conducts shallow feature integration at each layer, combining texture and edge details from different branches and passing them to subsequent layers. Subsequently, the DFF module performs Deep Feature Fusion at the final layer, aggregating abstract information via attention mechanisms. This approach fully exploits the input data’s rich information content.
As shown in Table 2, CSCCU+ achieves recognition accuracies of 89.16% for corn and 88.32% for rice, outperforming competing models. However, its performance gains in classifying other crops and water bodies are relatively modest. This outcome is predictable, given the model’s reliance on the NDVI and NDWI as spectral inputs. The NDVI, designed to analyze vegetation health, differentiates vegetated areas from non-vegetated regions based on plant light absorption and reflection properties. Meanwhile, the NDWI’s high sensitivity to water aids in accurate water body identification. These indices contribute to improved recognition of vegetation and water categories across all models. The multi-branch structure of CSCCU+ further amplifies its ability to extract relevant information, boosting classification accuracy for these specific classes. Moving forward, incorporating category-specific auxiliary data is expected to enhance CSCCU+’s performance for other classes.
5.3. Limitations of CSCCU+
Considering the research objective of staple crop classification in complex scenes, this study mainly employs the near-infrared (NIR) band, along with the NDVI and NDWI as auxiliary data. Notably, apart from the NDVI and NDWI, a multitude of remote sensing indices exist that could potentially facilitate staple crop classification and complex scene identification. Additionally, texture features and spatial structural information play critical roles in improving classification effectiveness. Some researchers have incorporated SAR data, characterized by its insensitivity to light intensity, weather conditions, other environmental factors, and excellent temporal continuity, into models by integrating time-series analysis, thereby enhancing the models’ recognition capabilities.
Regarding the study area, this research focuses on Guizhou Province in China. Characterized by complex topographies, the region predominantly features plateaus and mountainous landscapes, and falls under the influence of a subtropical monsoon climate from a macro-geographical perspective. Such environmental conditions render it an ideal setting for evaluating models in challenging scenarios. To further validate the model’s versatility, subsequent research may explore a wider range of regions with varying geographical and climatic profiles, and incorporate more sampling sites to comprehensively assess the model’s performance across diverse contexts.
With the continuous enhancement of the model’s accuracy and versatility for various data types, it is expected to demonstrate significant practical utility in agricultural information retrieval. This advancement will play a pivotal role in facilitating the growth of smart agriculture, enabling more efficient decision-making processes, optimized resource management, and enhanced monitoring of crop health and yield.
6. Conclusions
In this study, the CSCCU+ was developed as an advanced variant of the Complex Scene Crop Classification U-Net. The new model was engineered to harness supplementary spectral information introduced through an additional branch, thereby enhancing the precision of staple crop classification in intricate landscapes. By virtue of its multi-branch architecture, CSCCU+ deploys an attention-based mechanism that adeptly captures the inherent and spectral attributes of input data across all branches. Employing a hierarchical feature fusion strategy, the model integrates the three branches in a structured manner. Additionally, balance parameters are utilized to fine-tune the significance of features, ultimately optimizing the overall performance of the model.
Empirical evidence from Xifeng County, Guizhou Province, China, underscores the superiority of CSCCU+. The model outperformed U-Net, DeeplabV3 +, and the original CSCCU, achieving peak values in both OA and mIoU. The successful incorporation of spectral features into the deep learning framework significantly improves the accuracy of staple crop mapping in complex scenarios. As such, CSCCU+ offers a robust technical blueprint for precise crop mapping in challenging terrains and enriches the existing body of work on land-cover and land-use classification methodologies.
Author Contributions
Methodology development and data analysis were led by L.Z. and J.Z. undertook the coding tasks and were responsible for manuscript composition. H.Y., C.X. and Y.W. provided research supervision, refined the methodology and analytical approaches, and finalized the manuscript through comprehensive editing. All authors have read and agreed to the published version of the manuscript.
Funding
This study was supported by the National Key R&D Program of China (Grant No. 2021YFB3900505).
Data Availability Statement
The utilized remote sensing datasets, including GF-2 images (2023.7.17), were sourced from the website https://data.cresda.cn, accessed on 30 September 2023.
Conflicts of Interest
The authors confirm that no conflicts of interest exist.
References
- Godfray, H.C.J.; Beddington, J.R.; Crute, I.R.; Haddad, L.; Lawrence, D.; Muir, J.F.; Pretty, J.; Robinson, S.; Thomas, S.M.; Toulmin, C. Food Security: The Challenge of Feeding 9 Billion People. Science 2010, 327, 812–818. [Google Scholar] [CrossRef]
- Restrepo-Arias, J.F.; Branch-Bedoya, J.W.; Awad, G. Image Classification on Smart Agriculture Platforms: Systematic Literature Review. Artif. Intell. Agric. 2024, 13, 1–17. [Google Scholar] [CrossRef]
- Liakos, K.G.; Busato, P.; Moshou, D.; Pearson, S.; Bochtis, D. Machine Learning in Agriculture: A Review. Sensors 2018, 18, 2674. [Google Scholar] [CrossRef]
- Persello, C.; Tolpekin, V.A.; Bergado, J.R.; de By, R.A. Delineation of Agricultural Fields in Smallholder Farms from Satellite Images Using Fully Convolutional Networks and Combinatorial Grouping. Remote Sens. Environ. 2019, 231, 111253. [Google Scholar] [CrossRef] [PubMed]
- Burke, M.; Lobell, D.B. Satellite-Based Assessment of Yield Variation and Its Determinants in Smallholder African Systems. Proc. Natl. Acad. Sci. USA 2017, 114, 2189–2194. [Google Scholar] [CrossRef] [PubMed]
- Liu, X.; Zhu, X.; Pan, Y.; Li, S.; Liu, Y.; Ma, Y. Agricultural Drought Monitoring: Progress, Challenges, and Prospects. J. Geogr. Sci. 2016, 26, 750–767. [Google Scholar] [CrossRef]
- Wang, J.; Zhang, S.; Lizaga, I.; Zhang, Y.; Ge, X.; Zhang, Z.; Zhang, W.; Huang, Q.; Hu, Z. UAS-Based Remote Sensing for Agricultural Monitoring: Current Status and Perspectives. Comput. Electron. Agric. 2024, 227, 109501. [Google Scholar] [CrossRef]
- Qin, Q.; Wu, Z.; Zhang, T.; Sagan, V.; Zhang, Z.; Zhang, Y.; Zhang, C.; Ren, H.; Sun, Y.; Xu, W.; et al. Optical and Thermal Remote Sensing for Monitoring Agricultural Drought. Remote Sens. 2021, 13, 5092. [Google Scholar] [CrossRef]
- Nabil, M.; Zhang, M.; Bofana, J.; Wu, B.; Stein, A.; Dong, T.; Zeng, H.; Shang, J. Assessing Factors Impacting the Spatial Discrepancy of Remote Sensing Based Cropland Products: A Case Study in Africa. Int. J. Appl. Earth Obs. Geoinf. 2020, 85, 102010. [Google Scholar] [CrossRef]
- Waldner, F.; Canto, G.S.; Defourny, P. Automated Annual Cropland Mapping Using Knowledge-Based Temporal Features. ISPRS-J. Photogramm. Remote Sens. 2015, 110, 1–13. [Google Scholar] [CrossRef]
- Yu, L.; Wang, J.; Clinton, N.; Xin, Q.; Zhong, L.; Chen, Y.; Gong, P. FROM-GC: 30 m Global Cropland Extent Derived through Multisource Data Integration. Int. J. Digit. Earth 2013, 6, 521–533. [Google Scholar] [CrossRef]
- Biradar, C.M.; Thenkabail, P.S.; Noojipady, P.; Li, Y.; Dheeravath, V.; Turral, H.; Velpuri, M.; Gumma, M.K.; Gangalakunta, O.R.P.; Cai, X.L.; et al. A Global Map of Rainfed Cropland Areas (GMRCA) at the End of Last Millennium Using Remote Sensing. Int. J. Appl. Earth Obs. Geoinf. 2009, 11, 114–129. [Google Scholar] [CrossRef]
- Salmon, J.M.; Friedl, M.A.; Frolking, S.; Wisser, D.; Douglas, E.M. Global Rain-Fed, Irrigated, and Paddy Croplands: A New High Resolution Map Derived from Remote Sensing, Crop Inventories and Climate Data. Int. J. Appl. Earth Obs. Geoinf. 2015, 38, 321–334. [Google Scholar] [CrossRef]
- Teluguntla, P.; Thenkabail, P.S.; Oliphant, A.; Xiong, J.; Gumma, M.K.; Congalton, R.G.; Yadav, K.; Huete, A. A 30-m Landsat-Derived Cropland Extent Product of Australia and China Using Random Forest Machine Learning Algorithm on Google Earth Engine Cloud Computing Platform. ISPRS-J. Photogramm. Remote Sens. 2018, 144, 325–340. [Google Scholar] [CrossRef]
- Liang, D.; Zuo, Y.; Huang, L.; Zhao, J.; Teng, L.; Yang, F. Evaluation of the Consistency of MODIS Land Cover Product (MCD12Q1) Based on Chinese 30 m GlobeLand30 Datasets: A Case Study in Anhui Province, China. ISPRS Int. Geo-Inf. 2015, 4, 2519–2541. [Google Scholar] [CrossRef]
- Gong, P.; Wang, J.; Yu, L.; Zhao, Y.; Zhao, Y.; Liang, L.; Niu, Z.; Huang, X.; Fu, H.; Liu, S.; et al. Finer Resolution Observation and Monitoring of Global Land Cover: First Mapping Results with Landsat TM and ETM+ Data. Int. J. Remote Sens. 2013, 34, 2607–2654. [Google Scholar] [CrossRef]
- Thenkabail, P.S.; Wu, Z. An Automated Cropland Classification Algorithm (ACCA) for Tajikistan by Combining Landsat, MODIS, and Secondary Data. Remote Sens. 2012, 4, 2890–2918. [Google Scholar] [CrossRef]
- Zhang, D.; Pan, Y.; Zhang, J.; Hu, T.; Zhao, J.; Li, N.; Chen, Q. A Generalized Approach Based on Convolutional Neural Networks for Large Area Cropland Mapping at Very High Resolution. Remote Sens. Environ. 2020, 247, 111912. [Google Scholar] [CrossRef]
- Saralioglu, E.; Gungor, O. Semantic Segmentation of Land Cover from High Resolution Multispectral Satellite Images by Spectral-Spatial Convolutional Neural Network. Geocarto Int. 2022, 37, 657–677. [Google Scholar] [CrossRef]
- Gill, H.S.; Murugesan, G.; Mehbodniya, A.; Sajja, G.S.; Gupta, G.; Bhatt, A. Fruit Type Classification Using Deep Learning and Feature Fusion. Comput. Electron. Agric. 2023, 211, 107990. [Google Scholar] [CrossRef]
- Nandhini, M.; Kala, K.U.; Thangadarshini, M.; Verma, S.M. Deep Learning Model of Sequential Image Classifier for Crop Disease Detection in Plantain Tree Cultivation. Comput. Electron. Agric. 2022, 197, 106915. [Google Scholar] [CrossRef]
- Xu, L.; Ming, D.; Zhang, L.; Dong, D.; Qing, Y.; Yang, J.; Zhou, C. Parcel Level Staple Crop Type Identification Based on Newly Defined Red-Edge Vegetation Indices and ORNN. Comput. Electron. Agric. 2023, 211, 108012. [Google Scholar] [CrossRef]
- Yao, Z.; Zhu, X.; Zeng, Y.; Qiu, X. Extracting Tea Plantations from Multitemporal Sentinel-2 Images Based on Deep Learning Networks. Agriculture 2023, 13, 10. [Google Scholar] [CrossRef]
- Zhang, F.; Yin, J.; Wu, N.; Hu, X.; Sun, S.; Wang, Y. A Dual-Path Model Merging CNN and RNN with Attention Mechanism for Crop Classification. Eur. J. Agron. 2024, 159, 127273. [Google Scholar] [CrossRef]
- Woo, S.; Park, J.; Lee, J.-Y.; Kweon, I.S. CBAM: Convolutional Block Attention Module. In Proceedings of the European Conference on Computer Vision (ECCV), Munich, Germany, 8–14 September 2018. [Google Scholar]
- Chen, Y.; Kalantidis, Y.; Li, J.; Yan, S.; Feng, J. A2-Nets: Double Attention Networks. In Proceedings of the Advances in Neural Information Processing Systems 31 (NeurIPS 2018), Montréal, QC, Canada, 2–8 December 2018. [Google Scholar]
- Guo, M.-H.; Lu, C.-Z.; Hou, Q.; Liu, Z.; Cheng, M.-M.; Hu, S.-M. SegNeXt: Rethinking Convolutional Attention Design for Semantic Segmentation. In Proceedings of the Advances in Neural Information Processing Systems, New Orleans, LA, USA, 28 November–9 December 2022. [Google Scholar]
- Qu, T.; Wang, H.; Li, X.; Luo, D.; Yang, Y.; Liu, J.; Zhang, Y. A Fine Crop Classification Model Based on Multitemporal Sentinel-2 Images. Int. J. Appl. Earth Obs. Geoinf. 2024, 134, 104172. [Google Scholar] [CrossRef]
- Zhang, Z.; Zhang, W.; Meng, Y.; Zhao, Z.; Tang, P.; Li, H. Satellite Image Time-Series Classification with Inception-Enhanced Temporal Attention Encoder. Remote Sens. 2024, 16, 4579. [Google Scholar] [CrossRef]
- Li, Z.; Xiao, Z.; Zhou, Y.; Bao, T. Typical Crop Classification of Agricultural Multispectral Remote Sensing Images by Fusing Multi-Attention Mechanism ResNet Networks. Sensors 2025, 25, 2237. [Google Scholar] [CrossRef]
- Cai, Z.; Xu, B.; Yu, Q.; Zhang, X.; Yang, J.; Wei, H.; Li, S.; Song, Q.; Xiong, H.; Wu, H.; et al. A Cost-Effective and Robust Mapping Method for Diverse Crop Types Using Weakly Supervised Semantic Segmentation with Sparse Point Samples. ISPRS-J. Photogramm. Remote Sens. 2024, 218, 260–276. [Google Scholar] [CrossRef]
- You, N.; Dong, J.; Huang, J.; Du, G.; Zhang, G.; He, Y.; Yang, T.; Di, Y.; Xiao, X. The 10-m Crop Type Maps in Northeast China during 2017–2019. Sci. Data 2021, 8, 41. [Google Scholar] [CrossRef]
- Zhang, Q.; Wang, G.; Wang, G.; Song, W.; Wei, X.; Hu, Y. Identifying Winter Wheat Using Landsat Data Based on Deep Learning Algorithms in the North China Plain. Remote Sens. 2023, 15, 5121. [Google Scholar] [CrossRef]
- Zhong, L.; Hu, L.; Zhou, H.; Tao, X. Deep Learning Based Winter Wheat Mapping Using Statistical Data as Ground References in Kansas and Northern Texas, US. Remote Sens. Environ. 2019, 233, 111411. [Google Scholar] [CrossRef]
- Zhang, H.; Feng, S.; Wu, D.; Zhao, C.; Liu, X.; Zhou, Y.; Wang, S.; Deng, H.; Zheng, S. Hyperspectral Image Classification on Large-Scale Agricultural Crops: The Heilongjiang Benchmark Dataset, Validation Procedure, and Baseline Results. Remote Sens. 2024, 16, 478. [Google Scholar] [CrossRef]
- Qu, H.; Wang, X.; Wang, Y.; Chen, Y. Multi-Branch Residual Image Semantic Segmentation Combined with Inverse Weight Gated-Control. Image Vis. Comput. 2024, 143, 104932. [Google Scholar] [CrossRef]
- Lei, X.; Guan, H.; Ma, L.; Yu, Y.; Dong, Z.; Gao, K.; Delavar, M.R.; Li, J. WSPointNet: A Multi-Branch Weakly Supervised Learning Network for Semantic Segmentation of Large-Scale Mobile Laser Scanning Point Clouds. Int. J. Appl. Earth Obs. Geoinf. 2022, 115, 103129. [Google Scholar] [CrossRef]
- Zhang, X.; Zong, W.; Jiang, Y. RSM-Optimizer: Branch Optimization for Dual- or Multi-Branch Semantic Segmentation Networks. Electronics 2025, 14, 1109. [Google Scholar] [CrossRef]
- Weng, X.; Yan, Y.; Dong, G.; Shu, C.; Wang, B.; Wang, H.; Zhang, J. Deep Multi-Branch Aggregation Network for Real-Time Semantic Segmentation in Street Scenes. IEEE Trans. Intell. Transp. Syst. 2022, 23, 17224–17240. [Google Scholar] [CrossRef]
- Gu, H.; Gu, G.; Liu, Y.; Lin, H.; Xu, Y. Multi-Branch Attention Fusion Network for Cloud and Cloud Shadow Segmentation. Remote Sens. 2024, 16, 2308. [Google Scholar] [CrossRef]
- Wang, Y.; Zhang, Y.; Zhang, L.; Wan, Y.; Chen, Z.; Xu, Y.; Cao, R.; Zhao, L.; Yang, Y.; Yu, X. A Feature Enhancement Network Based on Image Partitioning in a Multi-Branch Encoder-Decoder Architecture. Knowl.-Based Syst. 2025, 311, 113120. [Google Scholar] [CrossRef]
- Zhang, J.; Zhao, L.; Yang, H. A Dual-Branch U-Net for Staple Crop Classification in Complex Scenes. Remote Sens. 2025, 17, 726. [Google Scholar] [CrossRef]
- Hu, J.; Shen, L.; Sun, G. Squeeze-and-Excitation Networks. In Proceedings of the IEEE Conference on Computer Vision and Pattern Recognition, Salt Lake City, UT, USA, 18–23 June 2018. [Google Scholar]
- Kriegler, F.J.; Malila, W.A.; Nalepka, R.F.; Richardson, W. Preprocessing Transformations and Their Effects on Multispectral Recognition. In Proceedings of the Sixth International Symposium on Remote Sensing of Environment, Ann Arbor, MI, USA, 13–16 October 1969; Volume II, p. 97. [Google Scholar]
- McFEETERS, S.K. The Use of the Normalized Difference Water Index (NDWI) in the Delineation of Open Water Features. Int. J. Remote Sens. 1996, 17, 1425–1432. [Google Scholar] [CrossRef]
- Bahdanau, D.; Cho, K.; Bengio, Y. Neural Machine Translation by Jointly Learning to Align and Translate. arXiv 2014, arXiv:1409.0473. [Google Scholar]
- Ghaffarian, S.; Valente, J.; Van Der Voort, M.; Tekinerdogan, B. Effect of Attention Mechanism in Deep Learning-Based Remote Sensing Image Processing: A Systematic Literature Review. Remote Sens. 2021, 13, 2965. [Google Scholar] [CrossRef]
- Vaswani, A.; Shazeer, N.; Parmar, N.; Uszkoreit, J.; Jones, L.; Gomez, A.N.; Kaiser, L.; Polosukhin, I. Attention Is All You Need. In Proceedings of the Advances in Neural Information Processing Systems, Long Beach, CA, USA, 4–9 December 2017. [Google Scholar]
- Howard, A.G.; Zhu, M.; Chen, B.; Kalenichenko, D.; Wang, W.; Weyand, T.; Andreetto, M.; Adam, H. MobileNets: Efficient Convolutional Neural Networks for Mobile Vision Applications. arXiv 2017, arXiv:1704.04861. [Google Scholar] [CrossRef]
- Ronneberger, O.; Fischer, P.; Brox, T. U-Net: Convolutional Networks for Biomedical Image Segmentation. In Medical Image Computing and Computer-Assisted Intervention—MICCAI 2015, Proceedings of the 18th International Conference, Munich, Germany, 5–9 October 2015; Springer international publishing: Cham, Germany, 2015. [Google Scholar]
- Chen, L.-C.; Zhu, Y.; Papandreou, G.; Schroff, F.; Adam, H. Encoder-Decoder with Atrous Separable Convolution for Semantic Image Segmentation. In Proceedings of the European Conference on Computer Vision (ECCV), Munich, Germany, 8–14 September 2018. [Google Scholar]
Disclaimer/Publisher’s Note: The statements, opinions and data contained in all publications are solely those of the individual author(s) and contributor(s) and not of MDPI and/or the editor(s). MDPI and/or the editor(s) disclaim responsibility for any injury to people or property resulting from any ideas, methods, instructions or products referred to in the content. |
© 2025 by the authors. Licensee MDPI, Basel, Switzerland. This article is an open access article distributed under the terms and conditions of the Creative Commons Attribution (CC BY) license (https://creativecommons.org/licenses/by/4.0/).