Article

From Spaceborne LiDAR to Local Calibration: GEDI’s Role in Forest Biomass Estimation

1
Department of Soil, Plant and Food Sciences (DISSPA), University of Bari, 70199 Bari, Italy
2
State Key Laboratory to Efficient Production of Forest Resources, College of Forestry, Beijing Forestry University, Beijing 100083, China
*
Author to whom correspondence should be addressed.
Remote Sens. 2025, 17(16), 2849; https://doi.org/10.3390/rs17162849
Submission received: 4 June 2025 / Revised: 11 August 2025 / Accepted: 13 August 2025 / Published: 15 August 2025

Abstract

Forest ecosystems act as major carbon sinks, highlighting the need for the accurate estimation of aboveground biomass (AGB). The Global Ecosystem Dynamic Investigation (GEDI), a full-waveform spaceborne LiDAR system developed by NASA, provides detailed global observations of three-dimensional forest structures, playing a critical role in quantifying biomass and carbon storage. However, its performance has not yet been assessed in the Mediterranean forest ecosystems of Southern Italy. Therefore, the objectives of this study were to (i) evaluate the utility of the GEDI L4A gridded aboveground biomass density (AGBD) product in the Apulia region by comparing it with the Apulia AGBD map, and (ii) develop GEDI-derived AGBD models using multiple GEDI metrics. The results indicated that the GEDI L4A gridded product significantly underestimated AGBD, showing large discrepancies from the reference data (RMSE = 40.756 Mg/ha, bias = −30.075 Mg/ha). In contrast, GEDI-derived AGBD models using random forest (RF), geographically weighted regression (GWR), and multiscale geographically weighted regression (MGWR) demonstrated improved accuracy. Among them, the MGWR model emerged as the optimal choice for AGBD estimation, achieving the lowest RMSE (14.059 Mg/ha), near-zero bias (0.032 Mg/ha), and the highest R2 (0.714). Additionally, the MGWR model consistently outperformed other models across four different plant functional types. These findings underscore the importance of local calibration for GEDI data and demonstrate the capability of the MGWR model to capture scale-dependent relationships in heterogeneous landscapes. Overall, this research highlights the potential of the GEDI to estimate AGBD in the Apulia region and its contribution to enhanced forest management strategies.

1. Introduction

Terrestrial ecosystems such as forests, woodlands, shrubs, and grasslands play a crucial role in the global carbon cycle [1,2]. In the Mediterranean region, forests and other wooded lands are composed of diverse vegetation types, conifer and broadleaf trees and sclerophyllous shrubs, and herbaceous species significantly contribute to carbon sequestration [3]. Furthermore, the Mediterranean ecosystem is constantly exposed to climate change, anthropogenic activities, and natural disturbances such as wildfires [4], which can release large amounts of stored carbon into the atmosphere. The accurate estimation of vegetation biomass is essential for understanding terrestrial carbon dynamics and clarifying the role of natural ecosystems in climate change mitigation [5,6].
Vegetation biomass refers to the total dry weight of organic material, including both aboveground and belowground components [7]. Aboveground biomass (AGB) is the sum of the dry weight of all live mass above the ground surface, and belowground biomass (BGB) consists of all living roots and the dead mass of fine and coarse litter associated with the soil [8,9]. Notably, AGB is the most visible and dynamic pool in terrestrial ecosystems, accounting for approximately 30% of the total terrestrial ecosystem carbon stock [10]. Due to its central role in regulating atmospheric carbon fluxes, AGB is of significant scientific interest globally. While conventional field inventories remain well-established and reliable for estimating AGB, they are often labor-intensive and limited in terms of spatial coverage [11]. In contrast, remote sensing technologies can generate spatially explicit information on AGB, enabling broad-scale assessment [12].
Optical remote sensing data with varying spatial and temporal resolutions are freely available and are widely used to estimate AGB [13,14]. Medium-resolution data such as Sentinel-2 and Landsat, and their associated products such as vegetation indices and texture measures, are mainly used to estimate AGB at local and regional scales [15,16,17,18,19]. For example, Huang et al. [20] integrated Landsat 8 OLI and Sentinel 2A images to estimate AGB for different forest types in Yunan Province by using multiple machine learning algorithms. In addition, radar data such as synthetic aperture radar (SAR) and interferometric SAR (InSAR) have also been used to estimate AGB at regional scales with moderate spatial resolutions [21,22,23,24,25,26]. However, optical and radar data generally suffer from signal saturation, which limits their ability to estimate AGB accurately [27,28].
Recently, Light Detection and Ranging (LiDAR) has emerged as a promising technology for AGB estimation as LiDAR can capture three-dimensional vegetation vertical structures related to biomass [29]. An airborne LiDAR scanner (ALS) has been shown to accurately measure forest canopy height and density at high spatial resolution [30,31], which were integrated with field inventory data utilizing model-based approaches to produce accurate and reliable information about the forest AGB [32,33,34,35,36,37]. Spaceborne LiDAR is another platform that enables large-scale AGB estimation in a cost-efficient manner [38]. For example, the Global Ecosystem Dynamic Investigation (GEDI), launched by the National Aeronautics and Space Administration (NASA) to the International Space Station in December 2018, is the first spaceborne LiDAR specially designed to measure vegetation structures and estimate vegetation biomass. The GEDI covers the Earth’s land surface between 51.6°N and 51.6°S, encompassing tropical, temperate, and boreal forests [39]. This multi-beam LiDAR instrument contains three lasers that emit pulses along eight parallel tracks. Each footprint is spaced 60 m along the track and 600 m across the track, with a diameter of 25 m [39,40]. The GEDI includes aboveground biomass density (AGBD) estimates for individual footprints in the GEDI L4A product. To derive these estimates, the L4A algorithm employs GEDI L2A relative height (RH) metrics simulated from airborne LiDAR data collocated with field data from the GEDI Forest Structure and Biomass Database (FSBD) and 13 linear regression models to predict AGBD for individual plant functional type (PFT) across six geographic regions [41]. These geographic regions and PFTs define the prediction strata for L4A models used to estimate AGBD globally [41]. However, despite its global utility, the GEDI L4A product has considerable gaps such as insufficient training data for some regions like the Mediterranean [42]. This introduces uncertainty in applying GEDI L4A AGBD estimates at the regional scale. In addition, Mediterranean forests are characterized by higher spatial fragmentation and heterogeneity. Furthermore, the irregular topography of the Mediterranean region generates steep gradients of ecological variables over short distances [43], which pose significant challenges to the accurate estimation of AGB. Therefore, it is essential to validate and potentially improve the GEDI AGBD estimates in the Mediterranean region. Recent studies have used the structural metrics derived from GEDI L2A and L2B as predictors to develop models for AGBD estimation across diverse forest ecosystems, yielding promising results [44,45,46,47]. For instance, Dorado-Roda et al. [48] developed GEDI-derived models by incorporating GEDI L2A data (rh0, rh10, …, rh90, rh95, rh98, rh99, rh100) and GEDI L2B data including canopy cover, plant area index (PAI), canopy gap probability (pgap), and foliage height diversity index (FHD) to estimate AGB in five different ecosystems in the southwest of Spain, with the RMSE ranging from 14.13 to 32.16 Mg/ha. These studies indicate that the combination of additional GEDI metrics and appropriate modeling strategies can enhance the accuracy of AGBD estimates.
In light of the above, this study aimed to evaluate the GEDI mission’s potential and accuracy for estimating AGBD in Mediterranean forest ecosystems, focusing on Southern Italy where L4A model training data are lacking. The second objective involved developing region-specific AGBD models using structural metrics from GEDI L2A and L2B products as predictor variables. The models included random forest (RF) and two spatial regression models, including geographically weighted regression (GWR) and multiscale geographically weighted regression (MGWR), which are commonly used to capture local variability and spatial heterogeneity [49,50]. Lastly, the third objective was to generate a high-resolution AGBD map of the study area using the best-performing model and to conduct an uncertainty assessment of the resulting predictions.

2. Materials and Methods

2.1. Study Area

The study area is the Apulia region, located in Southern Italy, between 39°50′ and 41°50′N latitude and 15°50′ and 18°50′E longitude. Covering an area of 19,345 square kilometers, the region is divided into six provinces. The region’s orography consists of 53% plain, with hills and low mountains in the northwest, where the highest elevation reaches 1155 m above sea level. The climate is typically Mediterranean, characterized by hot, dry summers and mild, rainy winters. The annual mean rainfall ranges from 450 mm to 650 mm. The mean annual temperature varies from 12 °C in mountainous areas to 19 °C in southern coastal areas [51]. According to the forest typology map of the Apulia region (2021) (https://webapps.sit.puglia.it/freewebapps/CartaTipiForestali/index.html) (accessed on 15 January 2025) (Figure 1), the forest is categorized by four different plant functional types, including deciduous broadleaf trees (DBTs), evergreen broadleaf trees (EBTs), evergreen needleleaf trees (ENTs), and grasses, shrubs, and woodlands (GSWs) [42].

2.2. Data

2.2.1. Reference AGBD Data

To support the study objectives, a 23 m resolution AGBD map (2021) of the Apulia region was used (https://webapps.sit.puglia.it/freewebapps/InventarioForestale/index.html) (accessed on 15 January 2025). The reference map integrates traditional field surveys with advanced remote sensing technologies to improve the accuracy and efficiency of forest monitoring. Field data collection involved measuring tree parameters such as diameter, height, volume, and biomass in 100 sample plots distributed across the Apulia region. To complement the ground-based measurements, remote sensing data were incorporated, including satellite images from the European Space Agency’s Copernicus Sentinel-2 program and LiDAR data. The map was then aggregated into 1 km resolution to match the GEDI AGBD product (see next paragraph). The entire process is shown in the flow chart (Figure S1).

2.2.2. GEDI Data

The primary datasets included GEDI AGBD 1 km gridded product aggregated by GEDI L4A (version 2.1), which derives from individual lidar footprints of approximately 25 m in diameter [52]. The data were quality-filtered from April 2019 to March 2023, covering the full GEDI mission duration. In addition, multiple GEDI gridded metrics from the same period and regions were used for AGBD modeling, including GEDI L2A sensitivity and relative heights (RHs) metrics, as well as GEDI L2B metrics such as the plant area index (PAI), foliage height diversity (FHD), and canopy cover (CC). These metrics capture three-dimensional forest structures, which are solid descriptive parameters of vegetation profile and robust proxies to estimate AGB [53,54]. For the quality filtering, GEDI shots with poor geolocation, high water or urban cover, leaf-off season waveforms, or segments flagged as local outliers were dropped. After that, the surviving L2B and L4A records were merged by shot number and coordinates, and then L2B and L4A quality flags = 1 were selected as good-quality data. Therefore, all these GEDI metrics were quality-filtered and ready for analysis [52]. These data were downloaded from NASA’s Oak Ridge National Laboratory Distributed Active Archive Center (ORNL DAAC) (https://doi.org/10.3334/ORNLDAAC/2339) [52]. The definitions and descriptions of these metrics are listed in Table 1.

2.3. GEDI-Derived AGBD Modeling

This study employed two categories of models to estimate AGBD based on GEDI metrics: a non-parametric model random forest (RF) and spatial regression models including geographically weighted regression (GWR) and multiscale geographically weighted regression (MGWR). All modeling procedures were conducted in the R studio (version 4.4.0) [55].

2.3.1. Random Forest

The non-parametric machine learning model employed in this study was random forest (RF). Several studies have demonstrated that prediction accuracy does not vary significantly across different machine learning algorithms [56,57,58]. Notably, the RF model is widely used to predict biophysical variables, including AGBD, based on remote sensing data [59,60,61]. The RF model effectively handles non-linear relationships between AGBD and various predictors, remains insensitive to multicollinearity, and prevents overfitting [62]. In this study, GEDI L2A metrics (RH50, RH98, and sensitivity) and GEDI L2B metrics (PAI, FHD, and canopy cover) were implemented as predictors in RF models using the train function in the ranger package. Through the grid search for the optical hyperparameter tuning [63], “mtry”, “min node size”, and “number of trees” were finally set to 2, 3, and 500, respectively. We used the ranger implementation of the RF model, and the “trainControl” was set to 10-time-repeated 5-fold cross-validation.

2.3.2. Geographically Weighted Regression

Originally proposed by Brunsdon et al. [64], GWR is a powerful tool for examining spatial heterogeneity and non-stationarity by estimating local parameters at each observation location. This capability makes GWR particularly suitable for remotely sensed biomass modeling [65,66]. Mathematically, GWR constructs a linear regression model by assigning weights to neighboring observations based on geographic distance [4]. The equation of GWR is expressed as follows:
y i = k = 1 p β k ( u i , v i ) x i k + ε i #
where yi is the dependent variable value of observation i; β k ( u i , v i ) is the coefficient of k explanatory variables, indicating a parameter estimate that explains the relationship around location ( u i , v i ) , which varies with the location; x k represents the independent variables of observation i; p is the total number of independent variables; and ε i is the error term that is generally assumed to be explanatory and normally distributed with zero mean and constant variance.
Prior to the GWR modeling, the optimum bandwidth for all the variables was determined by using cross-validation, which minimizes the prediction error through a leave-one-out procedure. Specifically, the bandwidth selection process iteratively assessed model performance across a range of candidate bandwidths and selected the one that yielded the lowest root mean squared prediction error [67]. We used the gwr function from the GWmodel package to implement the GWR analysis. Spatial weighting was applied using a bisquare kernel function, which assigns higher weights to observations closer to the regression point. To account for varying spatial point densities, we adopted an adaptive bandwidth approach, whereby the number of nearest neighbors used in each local regression varies by location.

2.3.3. Multiscale Geographically Weighted Regression

As an optimized version of GWR, the multiscale geographically weighted regression model (MGWR) has been proposed. It transforms GWR’s fixed bandwidth into a flexible bandwidth using backward fitting algorithms, ensuring that each independent variable is operated at its optimal bandwidth [68]. Hence, MGWR extends GWR by capturing spatial heterogeneity, identifying the operational scale of each predictor variable, and determining which variables exhibit fixed or varying effects across a given study area [69]. While GWR constrains local relationships to a uniform spatial scale, MGWR enables conditional relationships between response variables and predictor variables to vary across different spatial scales [70]. The MGWR is expressed as follows:
y i = k = 1 p β b k ( u i , v i ) x i k + ε i #
where yi is the ith observation value of the response variable; x k is the observation value of the kth explanatory variable at location i; β b k represents the regression coefficients and bk represents the jth bandwidth; ( u i , v i ) are the geographic coordinates of the sample point; p represents the number of predictor variables; and ε i is the model regression residual.
The MGWR model was conducted using the gwr.multiscale function from the GWmodel package. The optimal bandwidth for each predictor variable was selected using the corrected Akaike Information Criterion (AICc). A bisquare kernel function was used to define the spatial weights, and an adaptive bandwidth approach was adopted to account for spatial variation in data density.
Because both GWR and MGWR are highly susceptible to multicollinearity [71], multiple GEDI metrics, including PAI, FHD, sensitivity, and canopy cover, and RH metrics were first evaluated for potential inclusion in the GWR and MGWR models. The Variance Inflation Factor (VIF) was calculated for each predictor variable to assess potential correlations with other metrics. We considered VIF values exceeding 10 as indicative of multicollinearity. Finally, only RH50, FHD, and sensitivity were chosen as the predictor variables owing to their low VIF.

2.4. Model Evaluation

To compare the GEDI L4A AGBD with the reference Apulia AGBD at each pixel, as well as to assess the performance of three GEDI-derived AGBD models, several statistical metrics were employed, including the coefficient of determination (R2), the root mean square error (RMSE, Mg/ha), the relative RMSE (%RMSE), bias (Mg/ha), and the rBias (%). The equations for each metric are as follows:
R 2   = 1     i = 1 n y i y i 2 i = 1 n y i ¯ y i 2
RMSE = i = 1 n y i y i 2 n
rRMSE = R M S E y ¯ × 100
Bias = i = 1 n y i y i n
rBias = B i a s y ¯ × 100
where n is the sample size number, yi is the reference Apulia AGBD, y ¯ is the mean observed value of reference Apulia AGBD, and y i is the predicted value of AGBD derived from three different models (RF, GWR, and MGWR).

3. Results

3.1. Validation of GEDI L4A Product

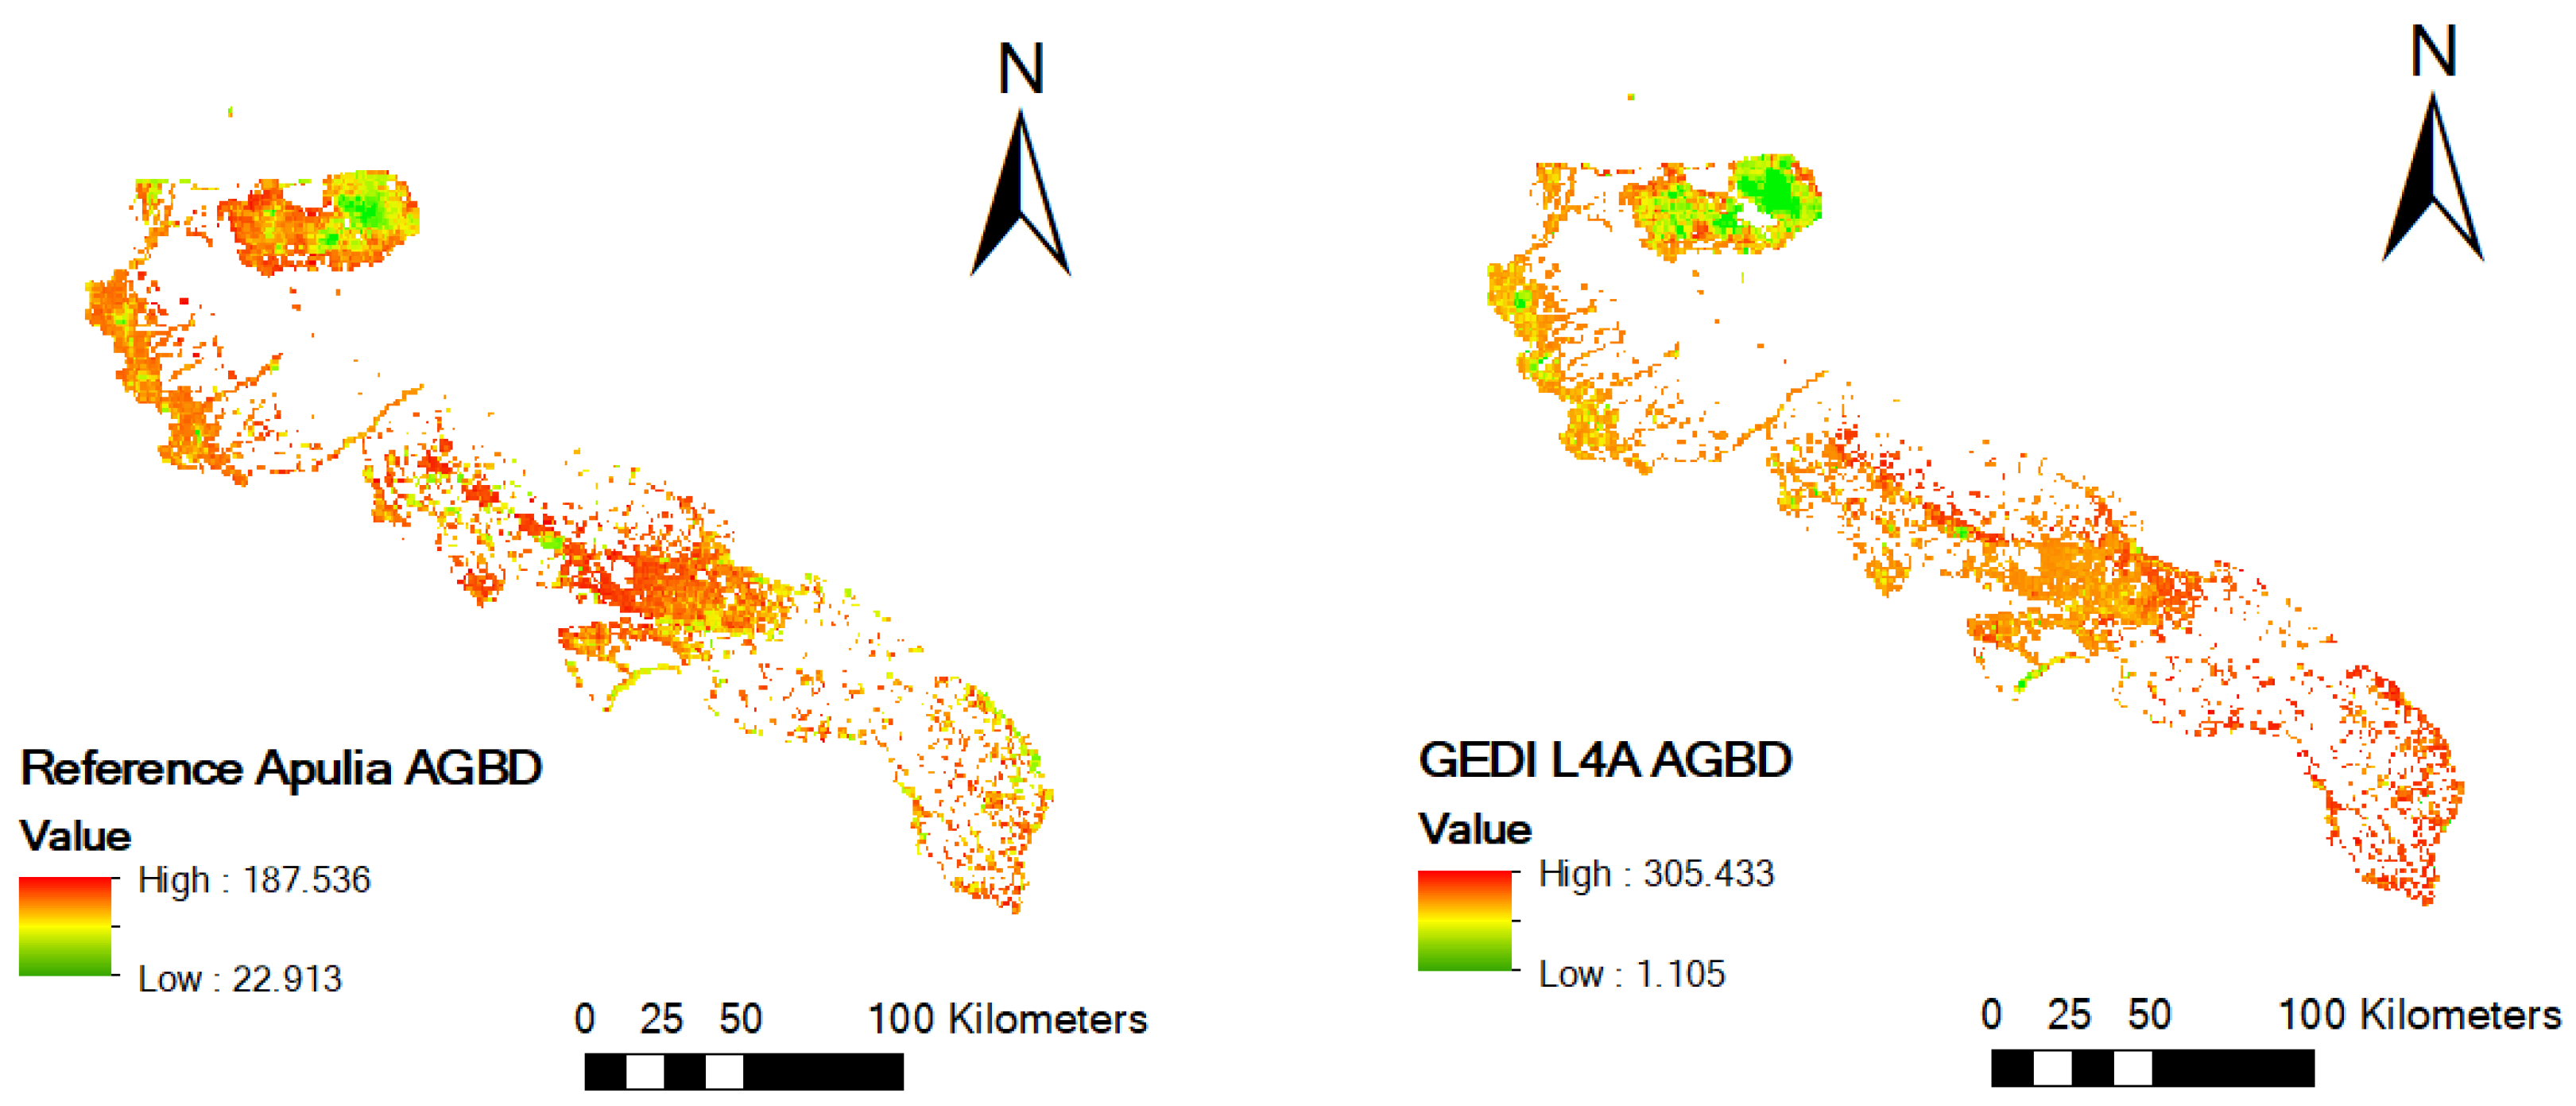
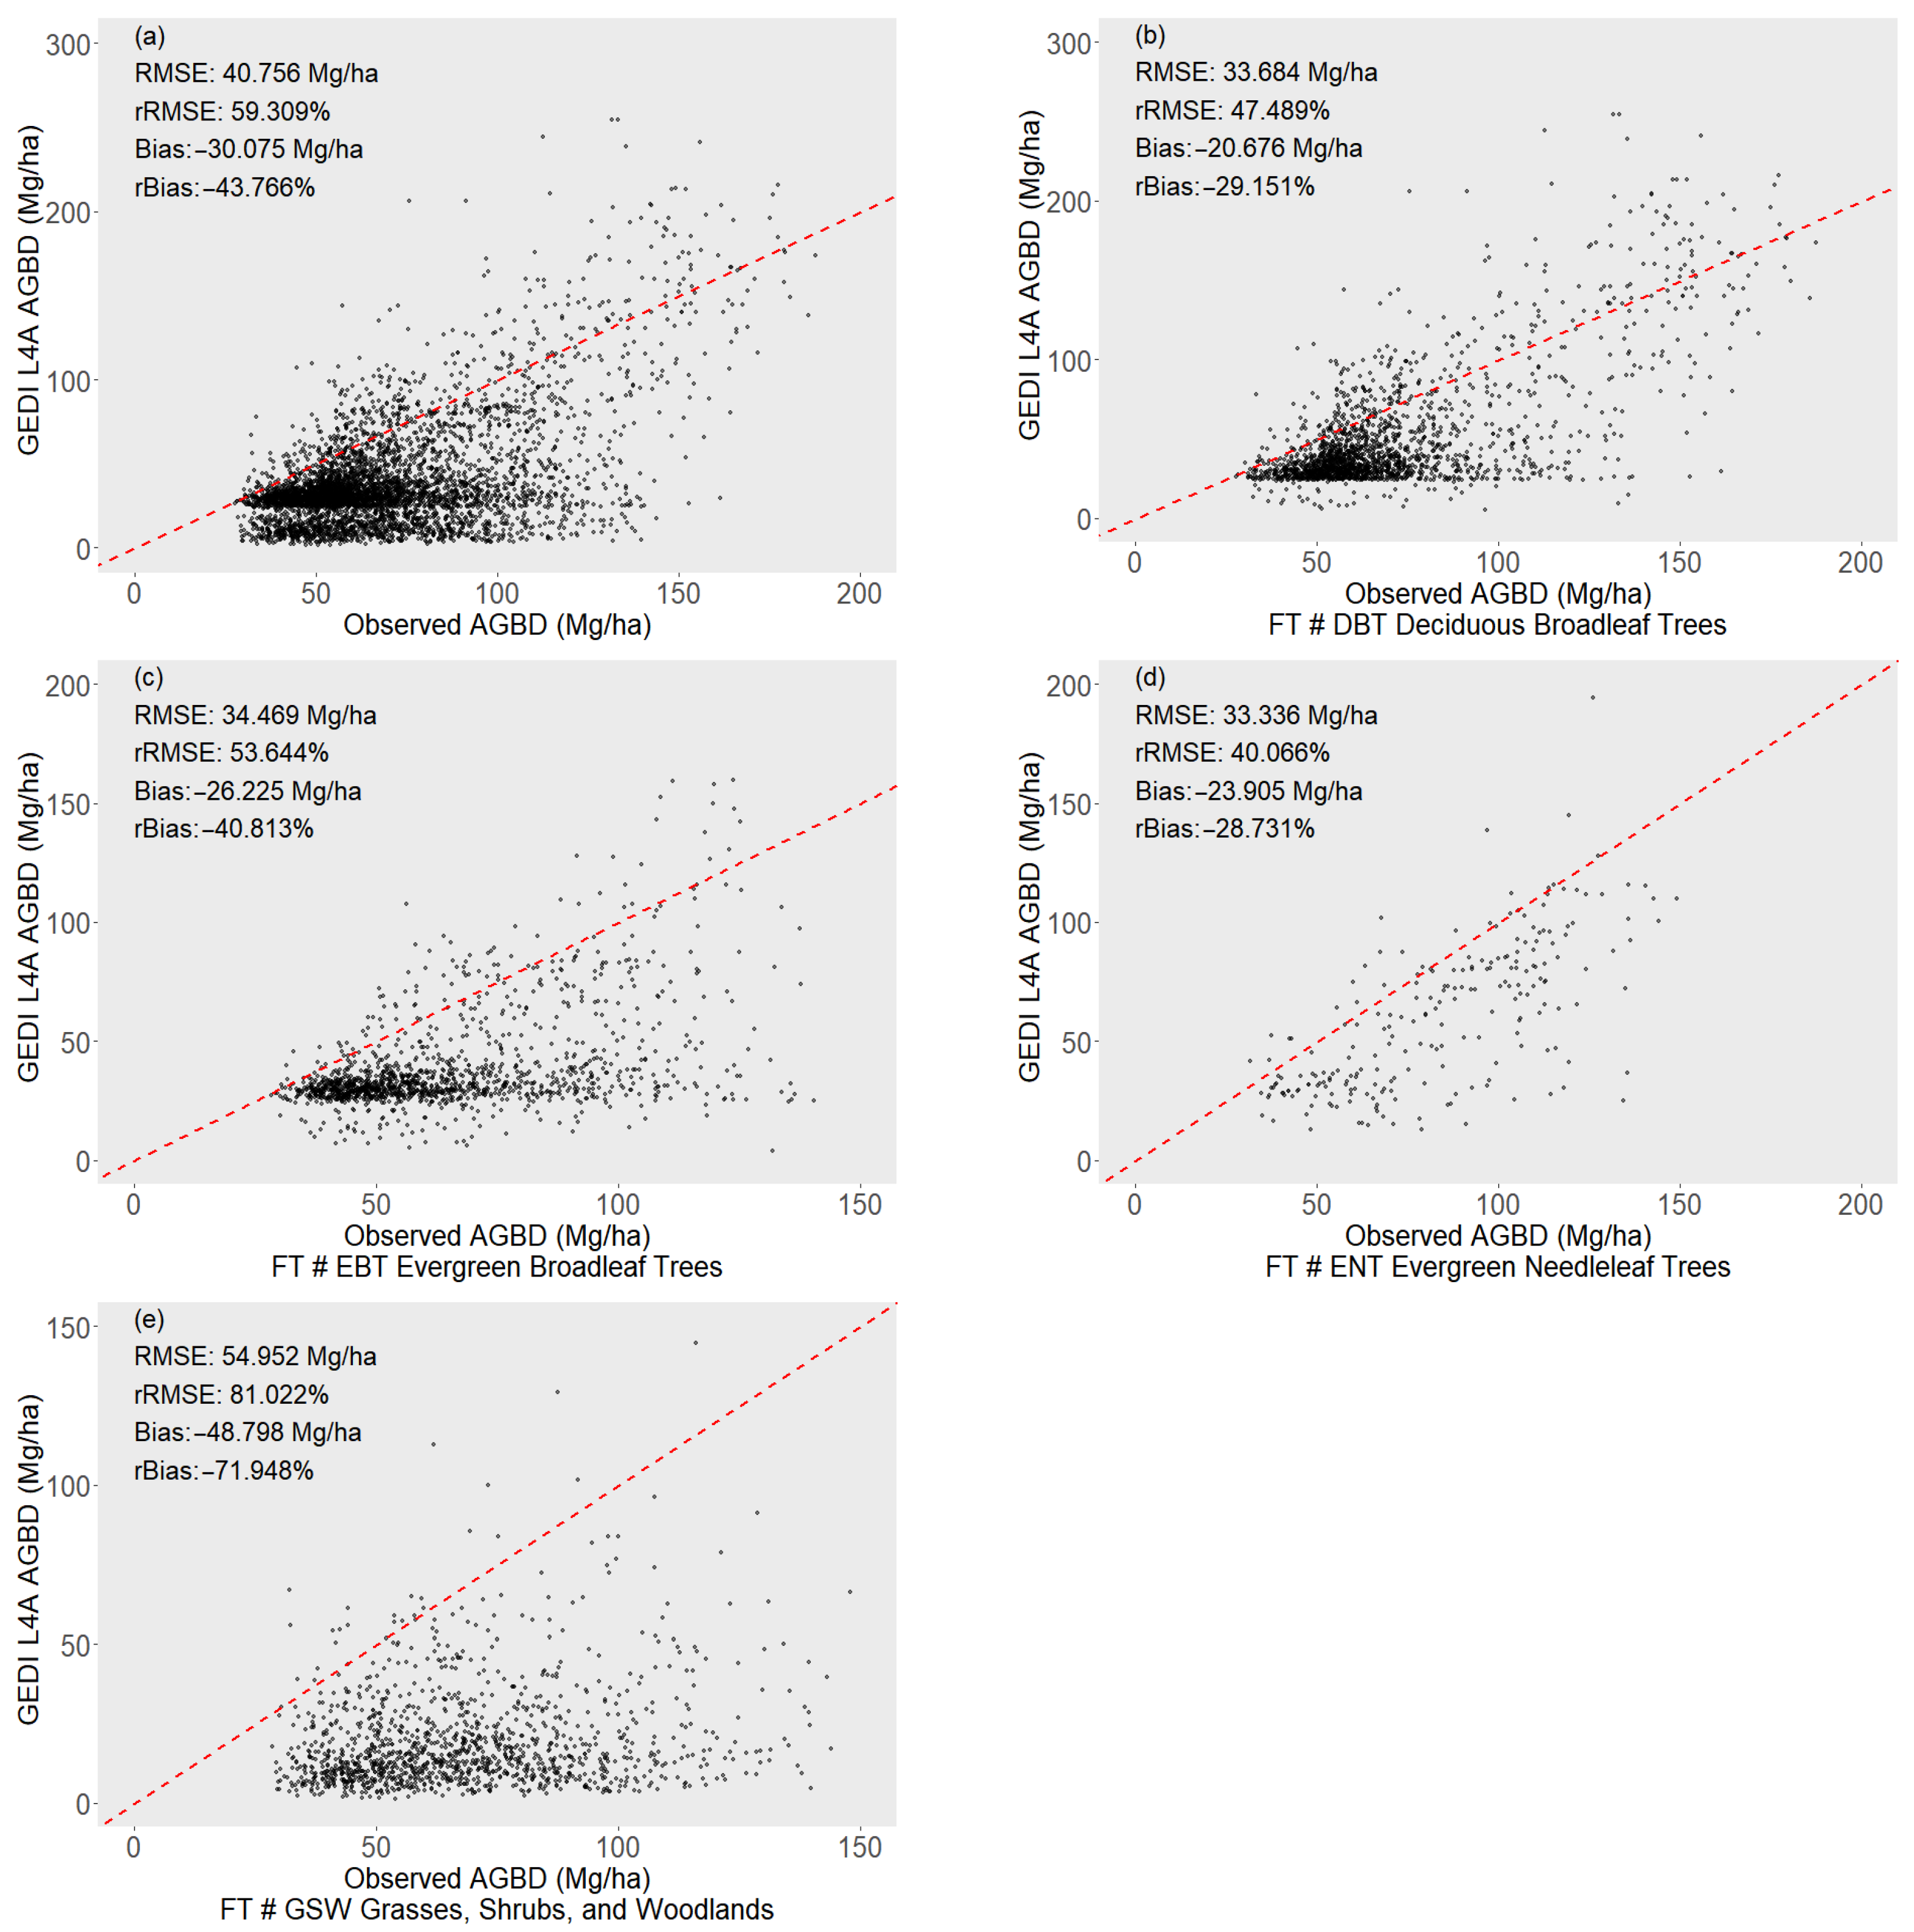
The GEDI L4A gridded AGBD product was compared with the reference Apulia AGBD map (Figure 2). The results showed that the GEDI L4A AGBD product exhibited a substantial discrepancy compared to the reference AGBD (RMSE = 40.756 Mg/ha), with a significant underestimation (bias = −30.075 Mg/ha) (Figure 3). Among different plant functional types (Figure 3), GEDI L4A showed the highest RMSE in GSWs (54.952 Mg/ha), while DBTs, EBTs, and ENTs exhibited similar RMSEs (33.684, 34.469, and 33.336 Mg/ha, respectively). The consistently negative bias values indicated the systematic underestimation of GEDI L4A across all plant functional types, especially in GSWs with a bias of −48.798 Mg/ha. Similar bias values were observed for EBTs (bias = −26.225 Mg/ha), ENTs (bias = −23.905 Mg/ha), and DBTs (bias = −20.676 Mg/ha).

3.2. Performance of GEDI-Derived AGBD Models

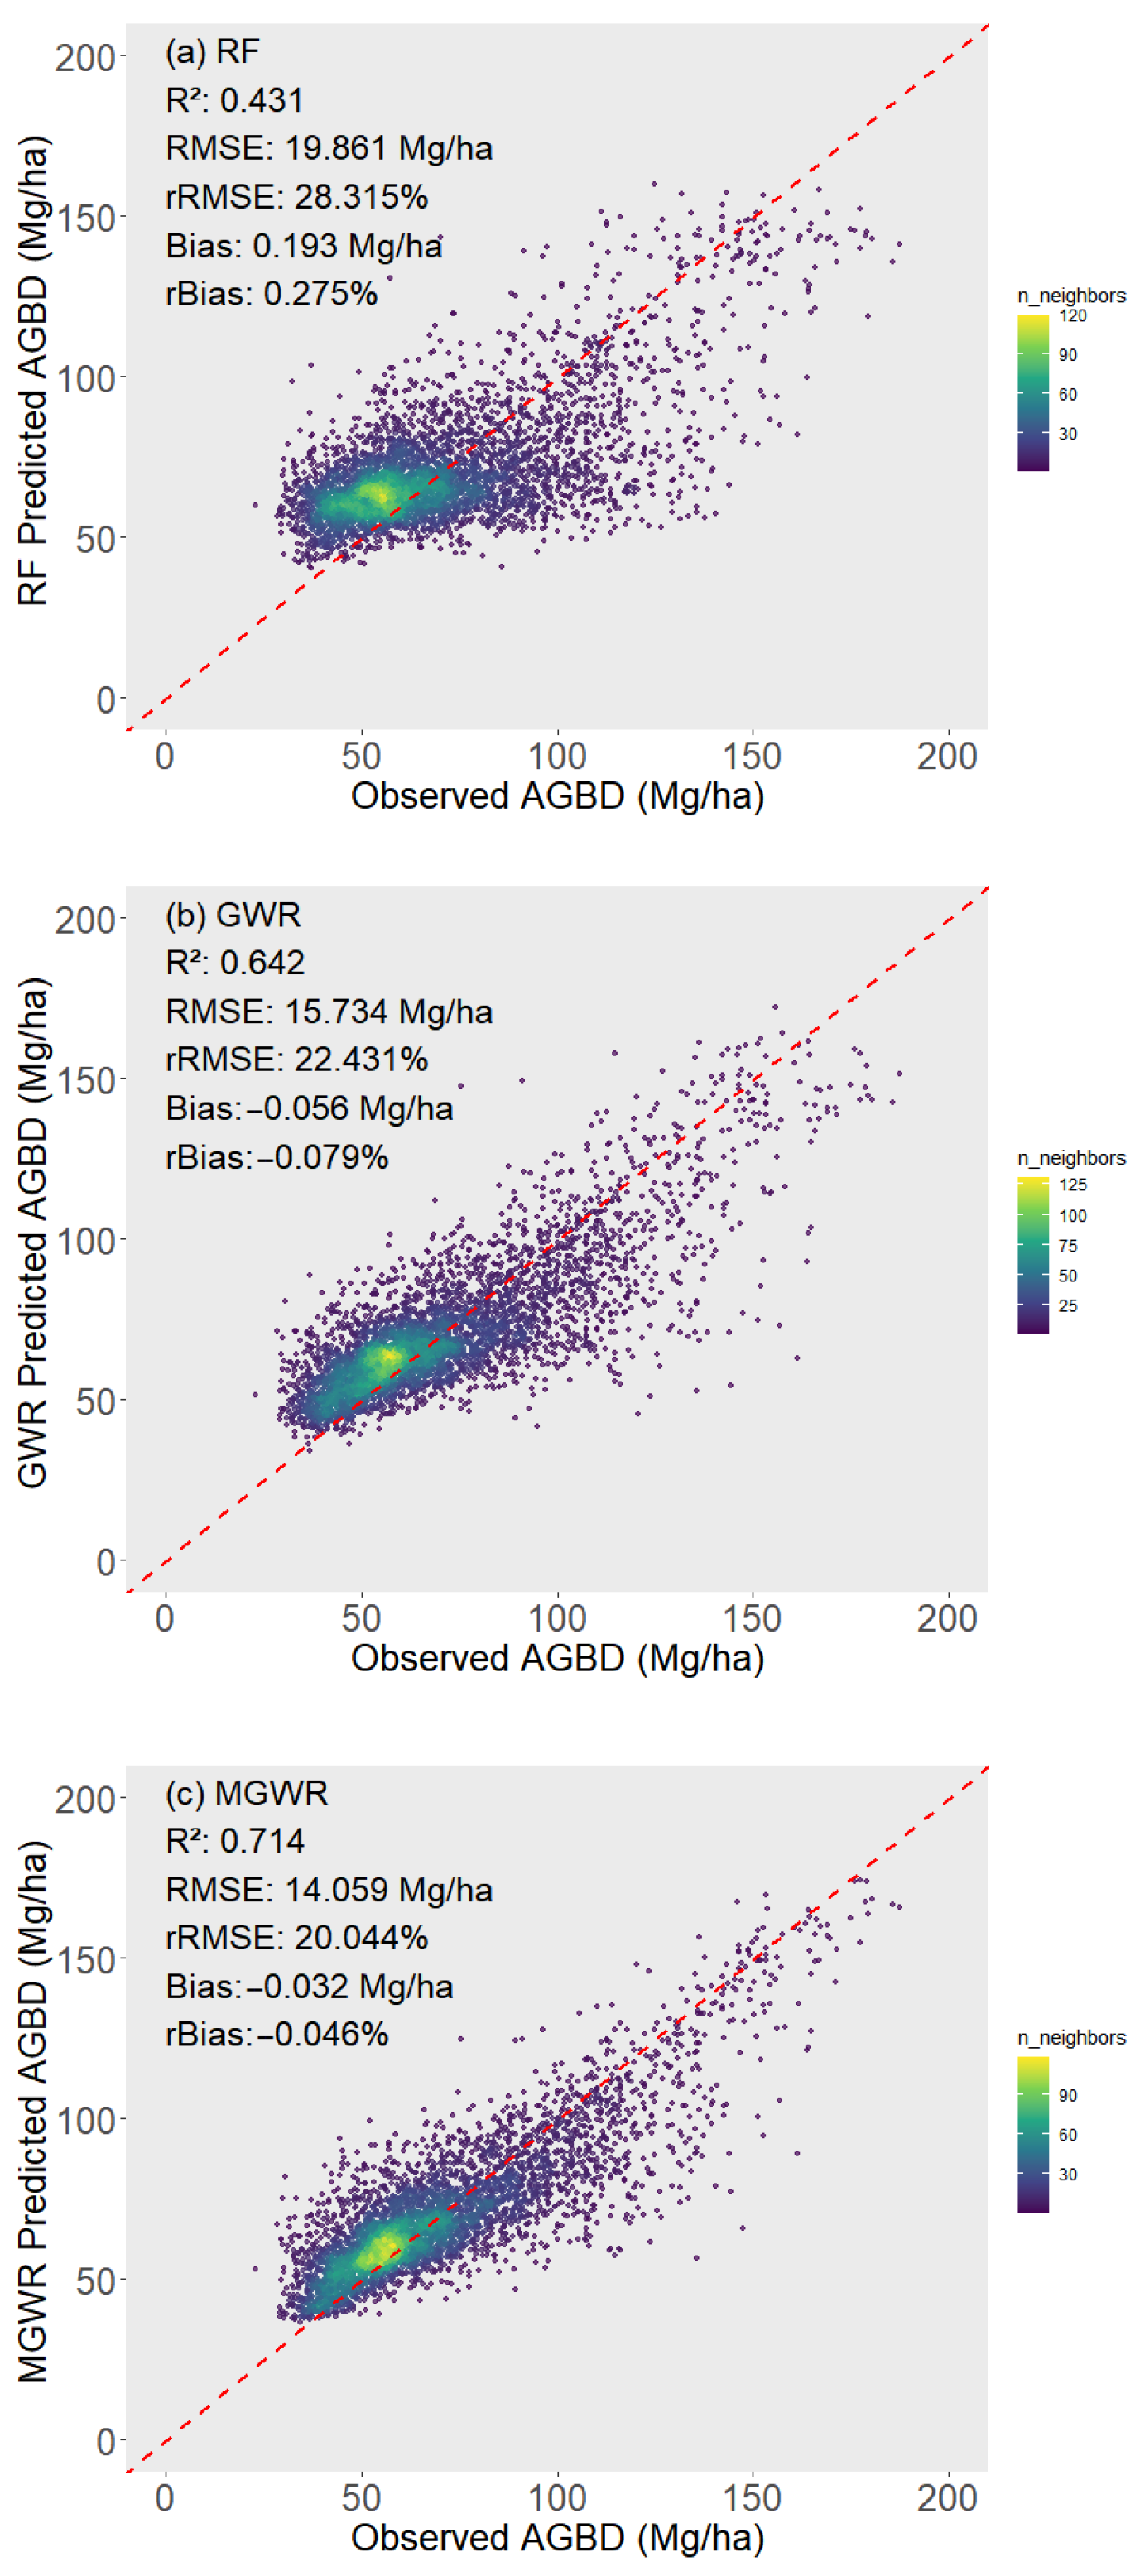
Figure 4 presents the comparison of the performance of three GEDI-derived AGBD models. The spatial regression models (Table 2) showed higher agreement with the reference AGBD, with R2 values ranging from 0.642 (GWR) to 0.714 (MGWR), compared to the RF model (R2 = 0.431). The RMSE values from MGWR (14.059 Mg/ha) and GWR (15.734 Mg/ha) were also lower than those of the RF model (19.861 Mg/ha). In terms of bias, the spatial regression models underestimated the AGBD, with the MGWR model showing the smallest underestimation (bias = −0.032 Mg/ha), whereas the RF model slightly overestimated AGBD (bias = 0.193 Mg/ha). Overall, the MGWR model yielded the lowest RMSE and the closest-to-zero bias, along with the highest R2 value.
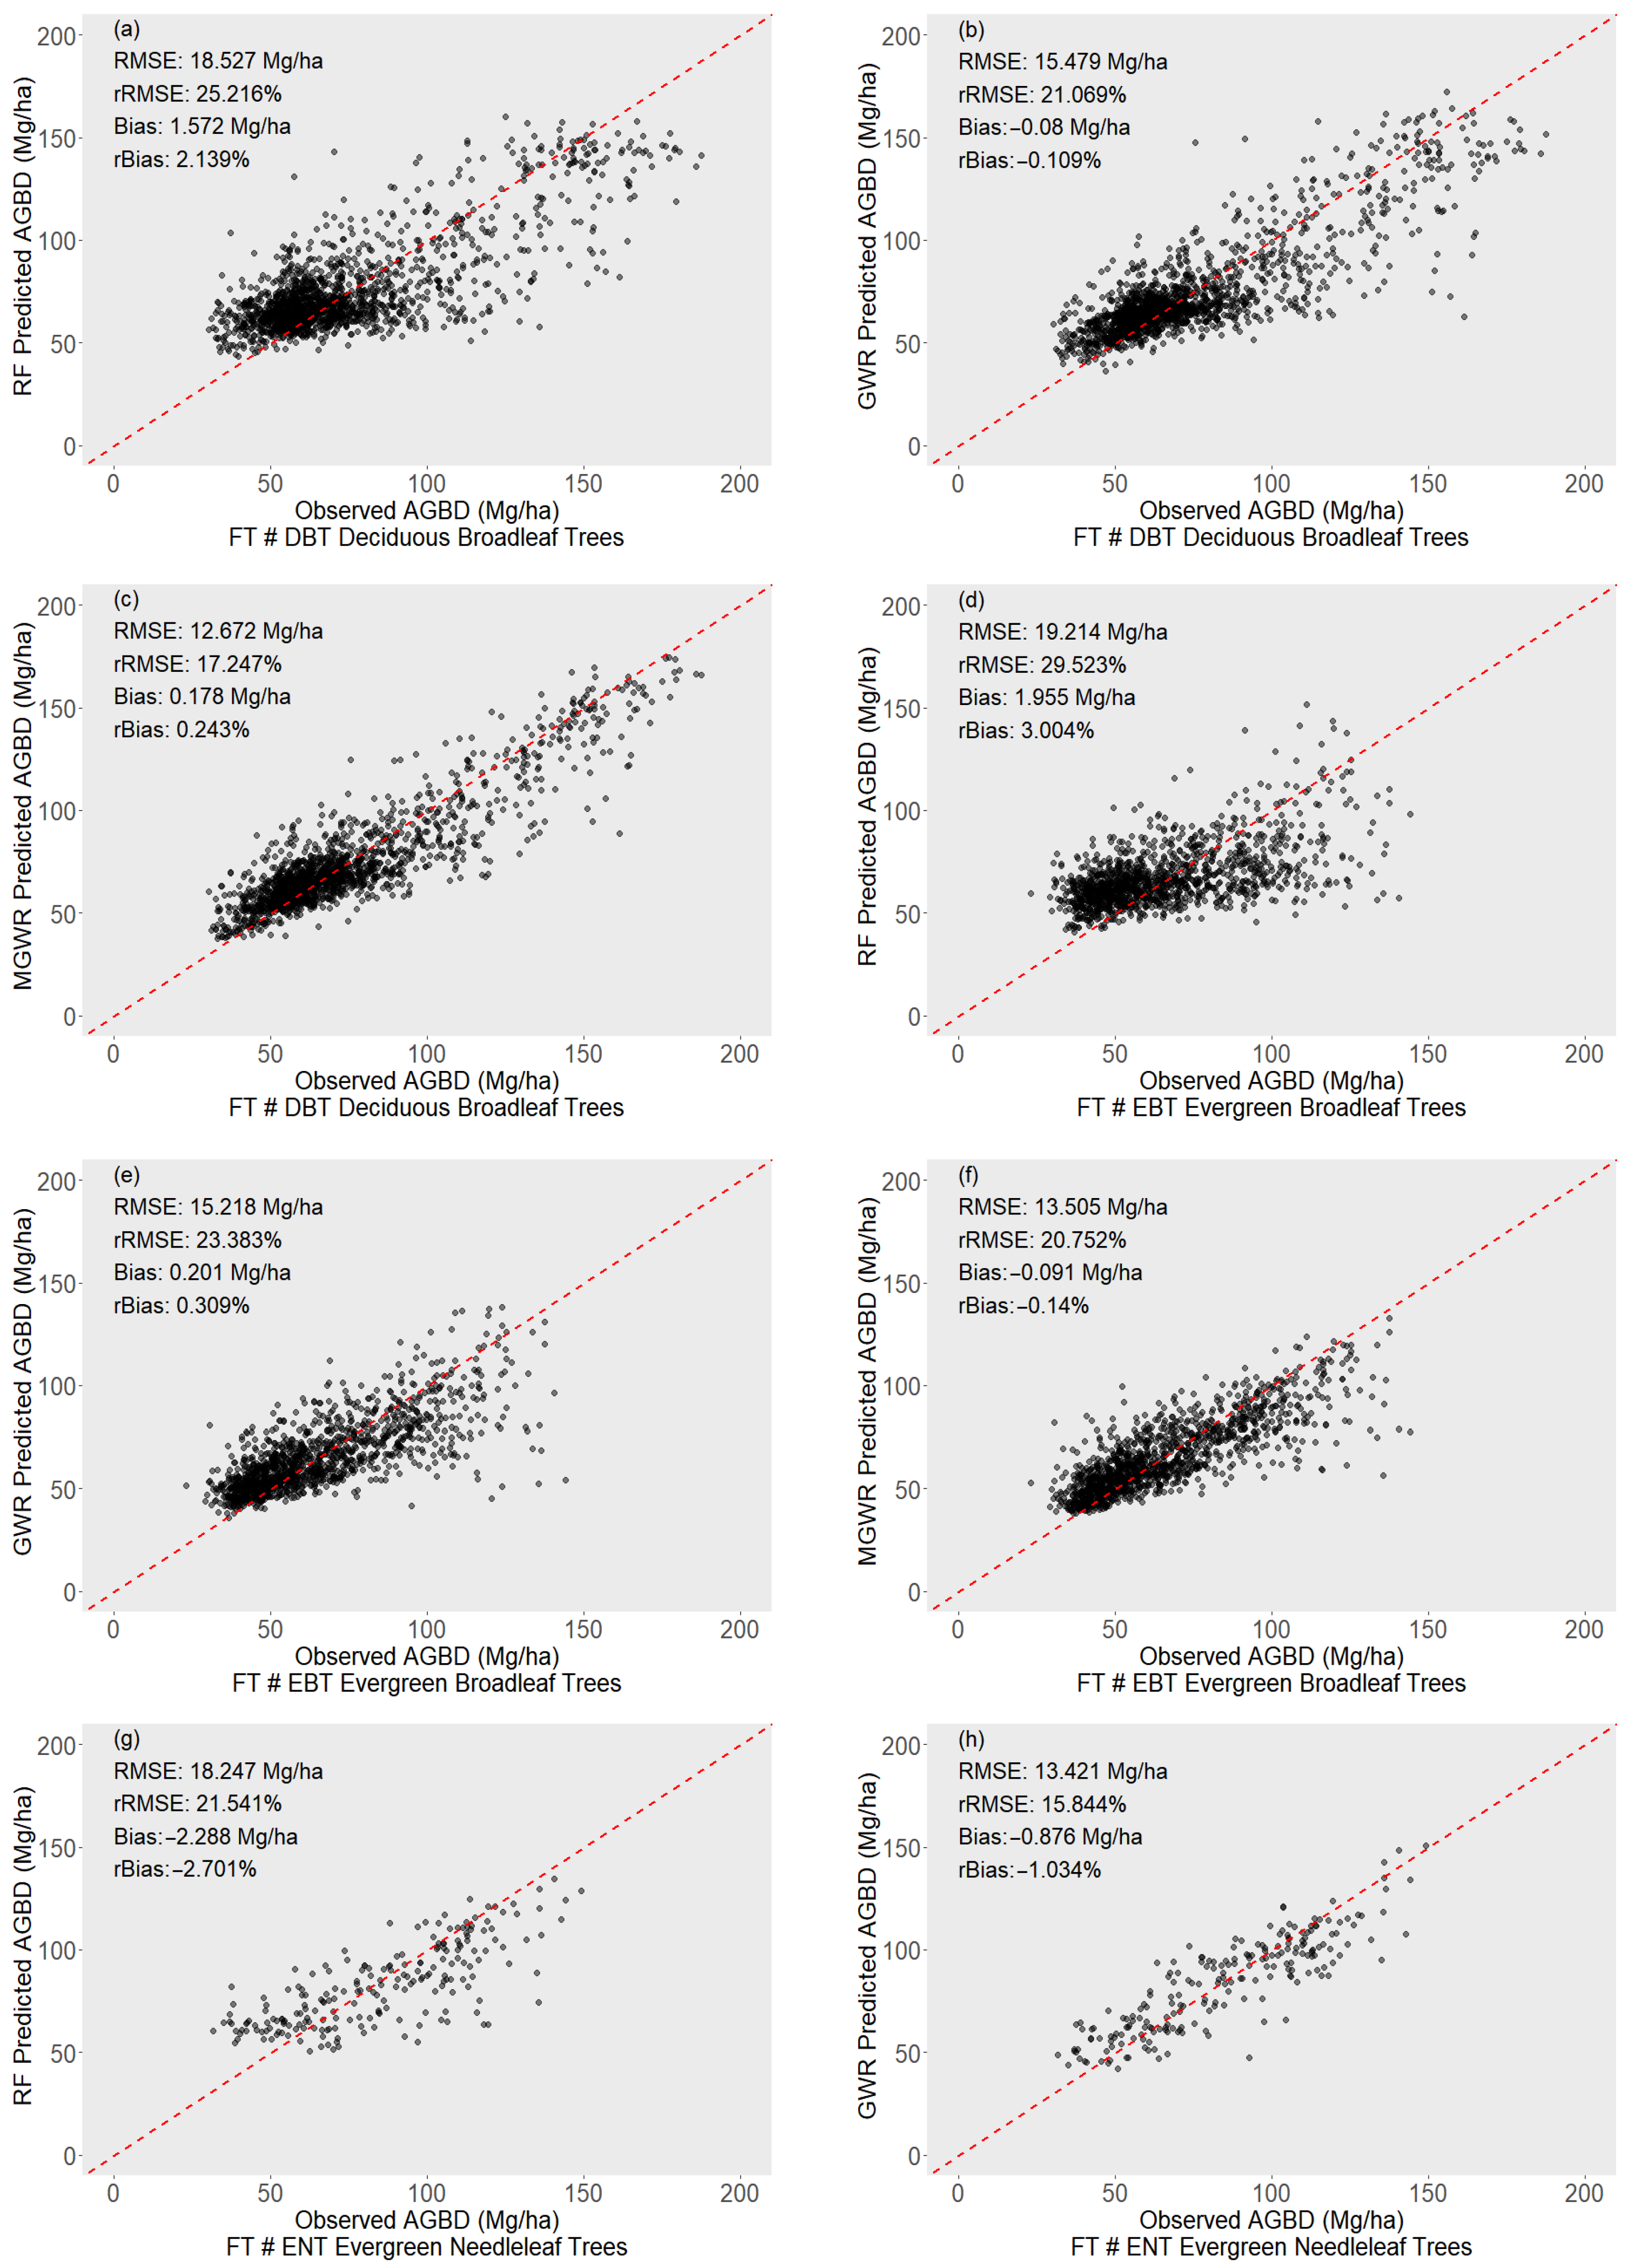
We also compared the performance of three GEDI-derived AGBD models across four plant functional types in the Apulia region (Figure 5). The results exhibited that MGWR consistently outperformed GWR and RF across DBTs, EBTs, ENTs, and GSWs, with RMSE values of 12.672, 13.505, 11.976, and 16.455 Mg/ha, respectively. In addition, the MGWR model also showed smaller bias deviations, with a slight overestimation of DBTs (bias = 0.178 Mg/ha) and underestimation of EBTs, ENTs, and GSWs (bias = −0.091, −0.871, and −0.106 Mg/ha, respectively) (Table 3). Overall, the spatial regression models outperformed the non-parametric model, with the MGWR model being the most effective for estimating AGBD in the Apulia region.

3.3. Mapping of AGBD Estimated from MGWR Model

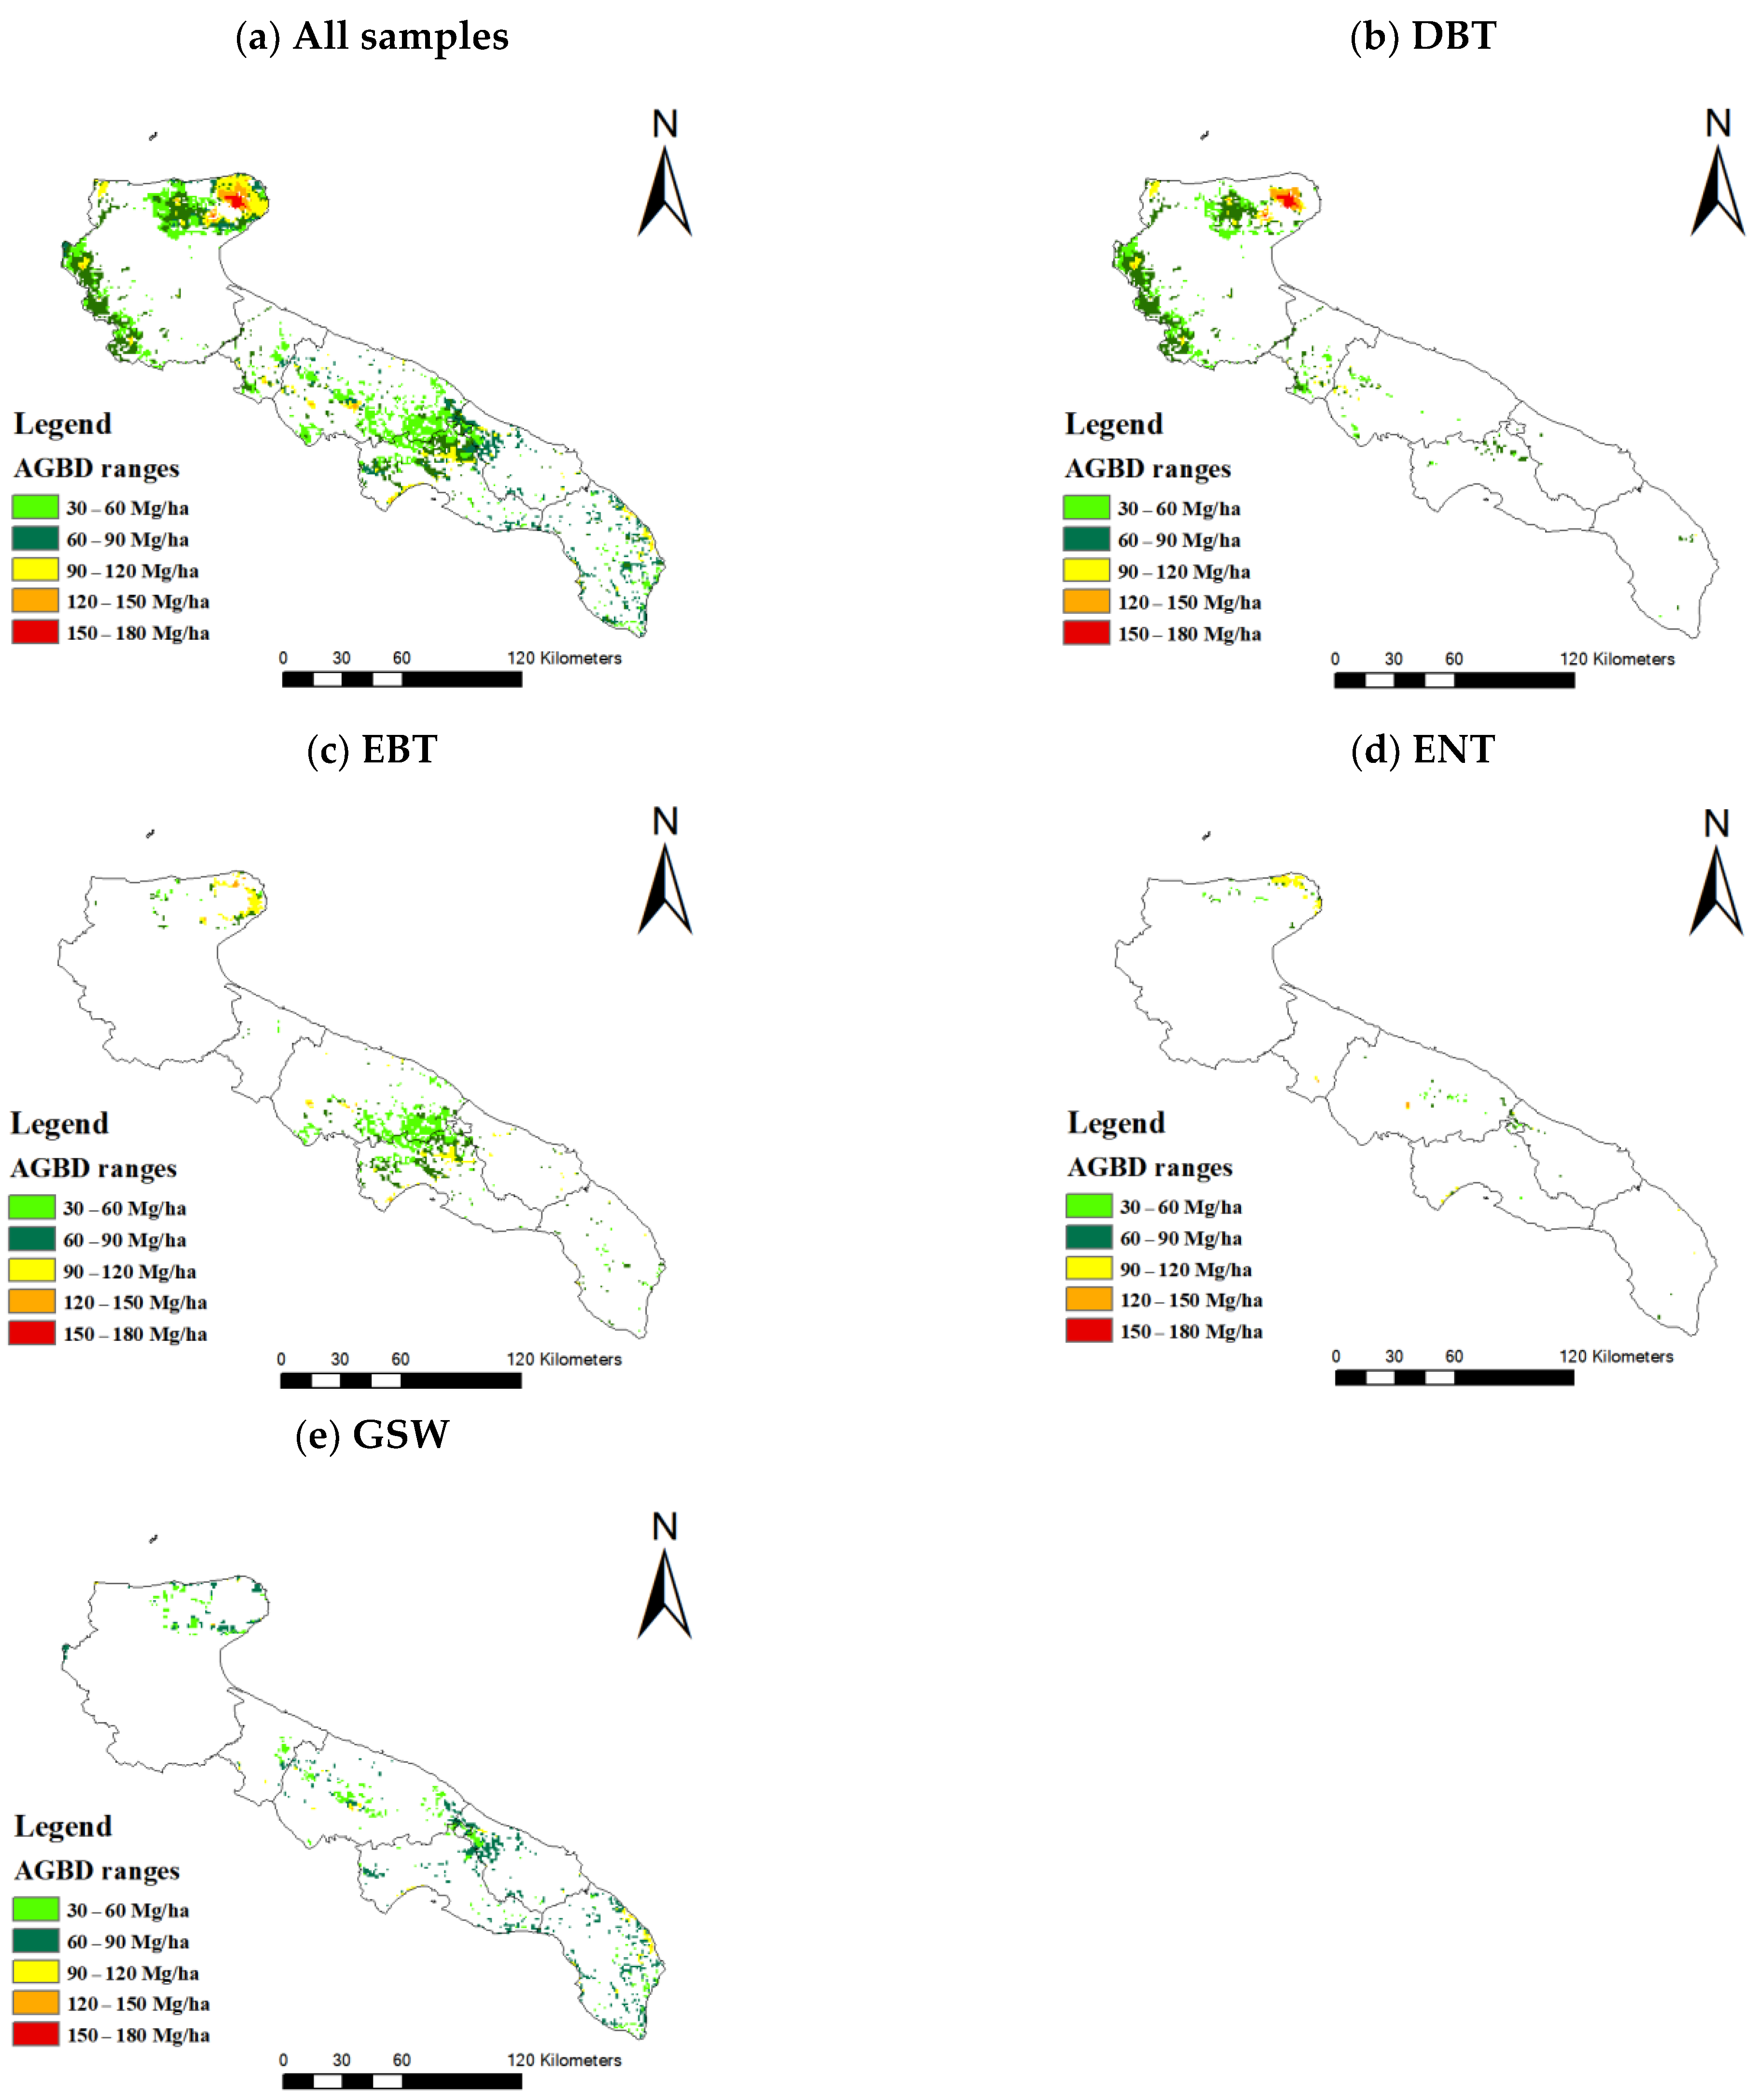
Using the MGWR model that yielded the highest accuracy, we generated maps of predicted AGBD values for the Apulia region (Figure 6). The predicted AGBD ranged from 36.46 to 174.42 Mg/ha. For comparison, AGBD values were categorized into five classes by equal intervals of 30 Mg/ha (Figure 6). High AGBD values (120 to 180 Mg/ha) were primarily located in northern Apulia, while lower AGBD values (30 to 90 Mg/ha) were more evenly distributed throughout the Apulia region. Overall, the Apulia region exhibited relatively low AGBD, with values between 30 and 90 Mg/ha accounting for approximately 86% of the total. We also generated maps for individual plant functional types. DBTs were primarily distributed in northern Apulia. DBTs spanned the entire AGBD range, with 54% falling between 60 and 90 Mg/ha, and it was the only plant functional type with AGBD values between 150 and 180 Mg/ha. EBTs depicted some variation, with 47% of values between 30 and 60 Mg/ha, and 43% between 60 and 90 Mg/ha. For GSWs, the estimated AGBD was relatively homogeneous, with about 60% between 60 and 90 Mg/ha and only around 8% beyond 90 Mg/ha. ENTs were less widespread compared to the other three plant functional types, with 45% of its AGBD values ranging between 90 and 120 Mg/ha, mainly in northern Apulia.

3.4. MGWR Model Bias Distribution Across Different AGBD Ranges

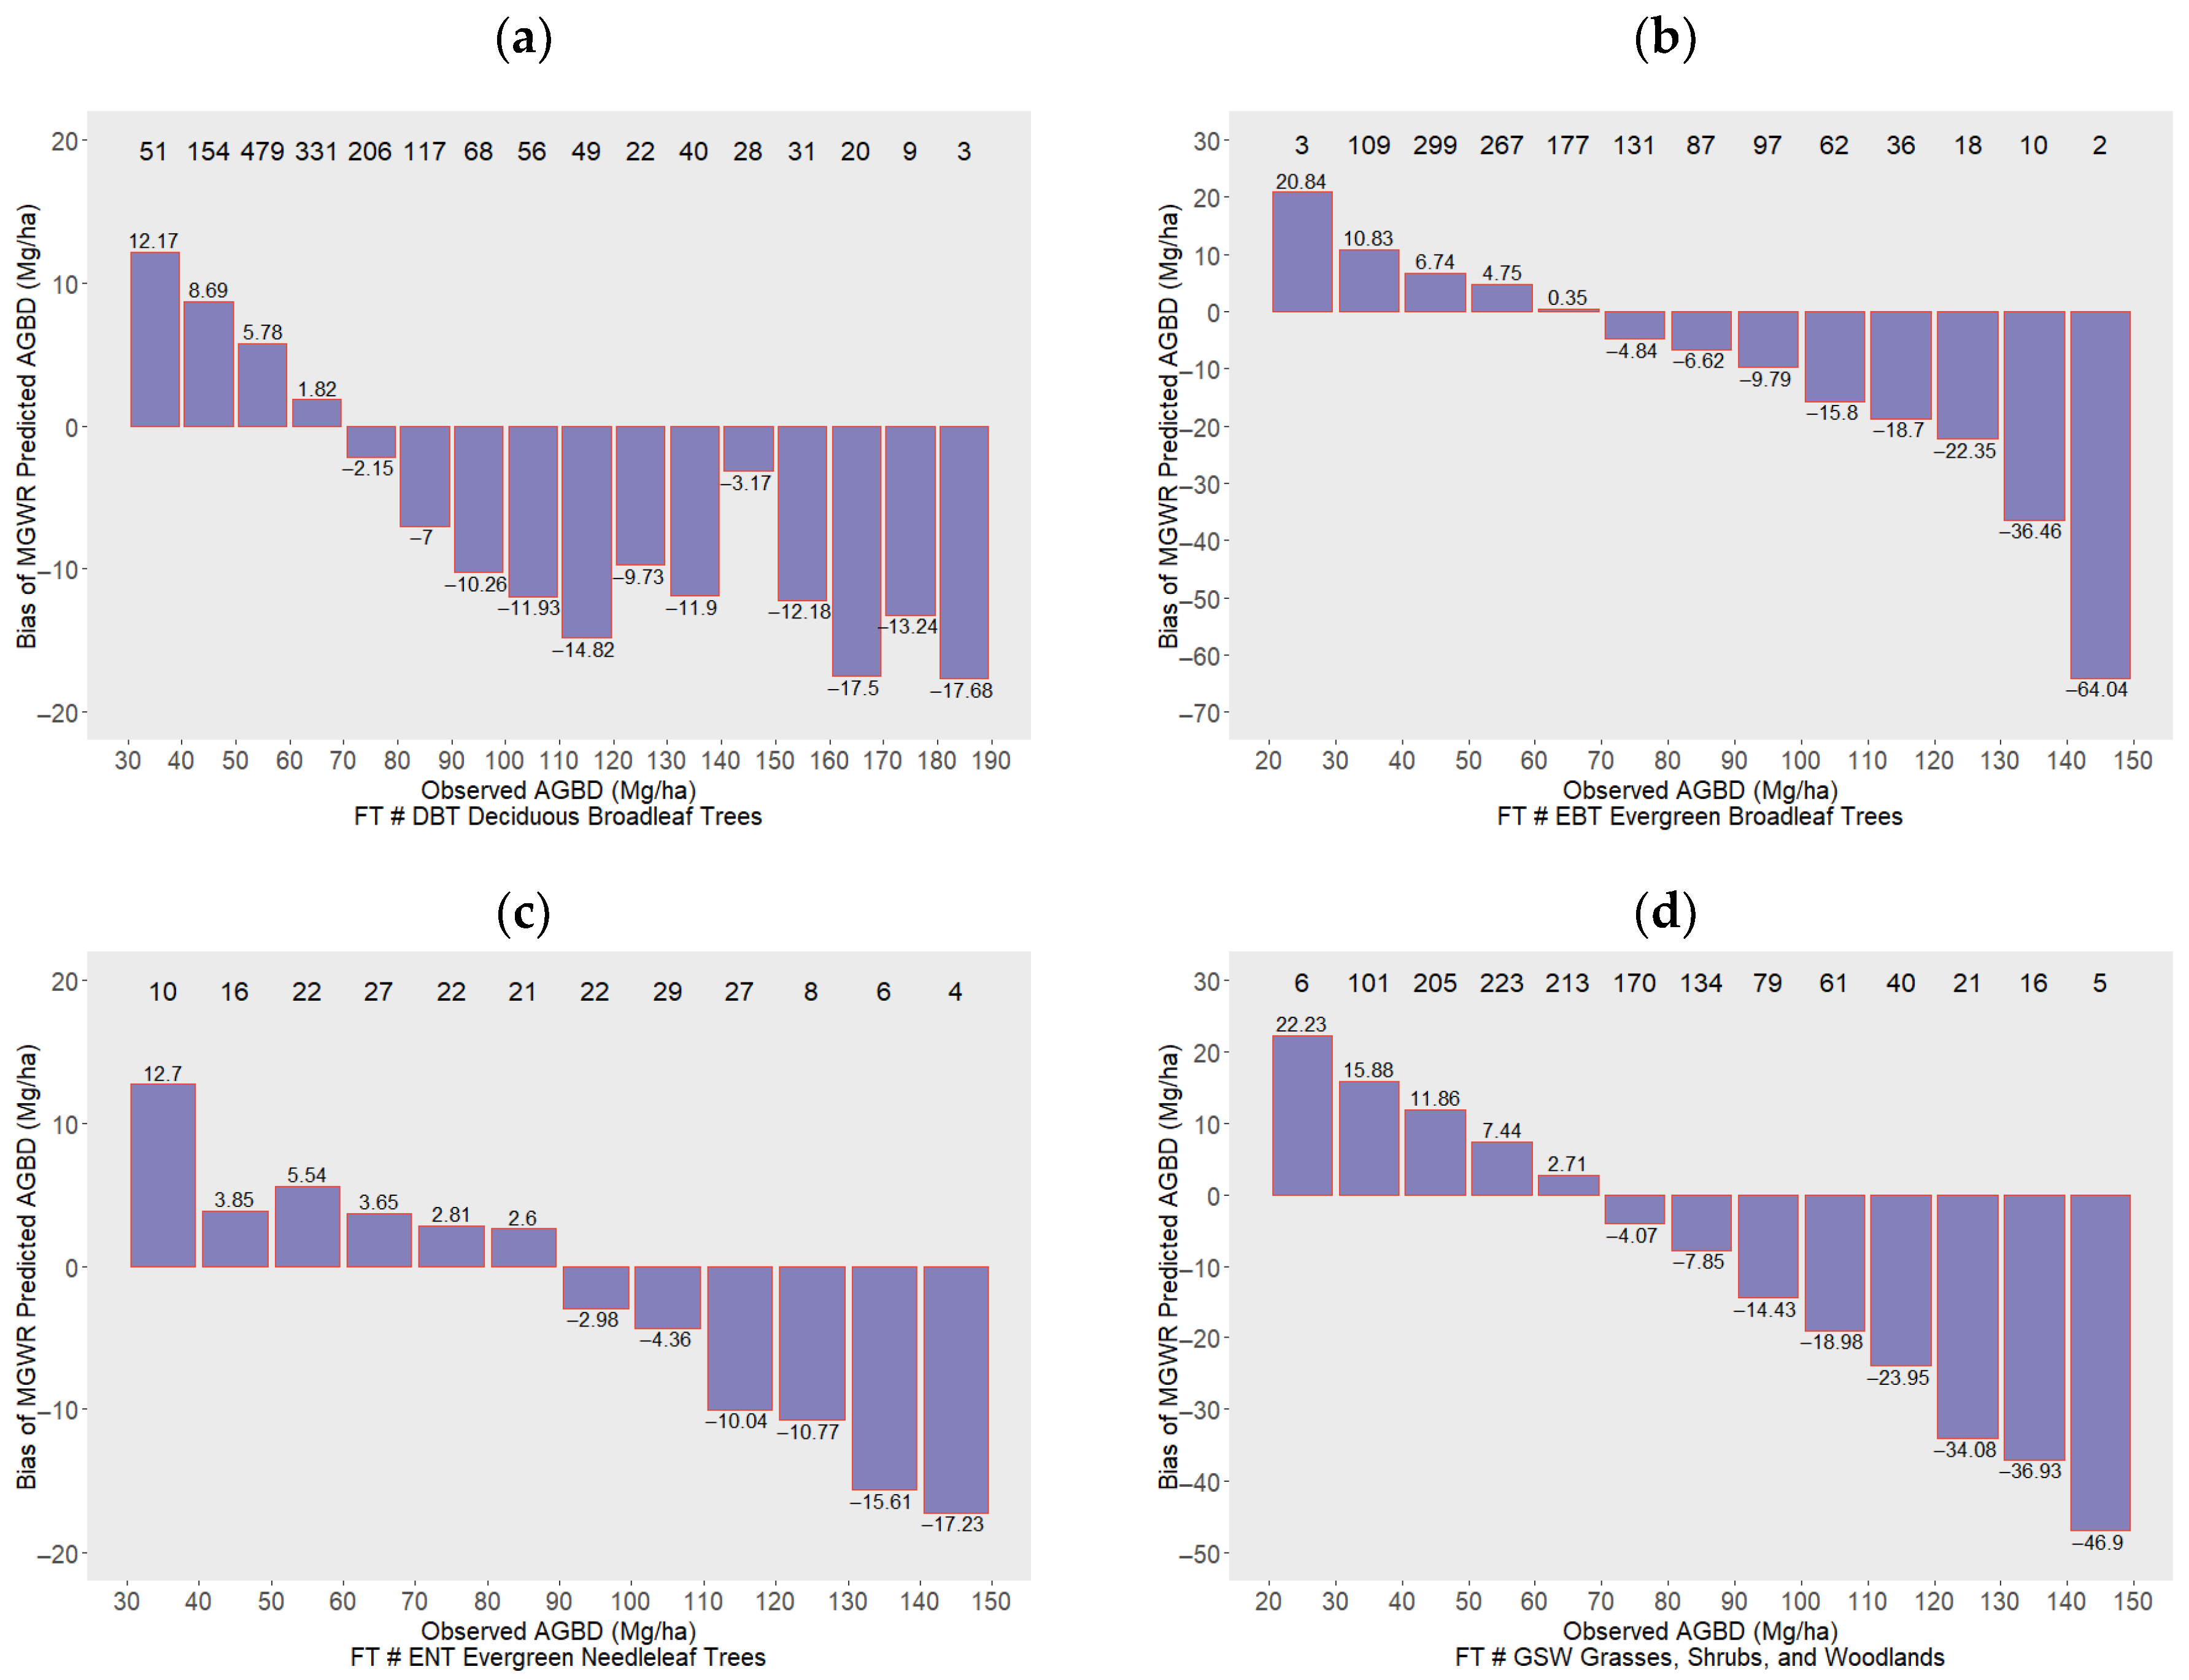
The MGWR model exhibited a consistent pattern of AGBD estimation bias across all plant functional types, characterized by overestimation at low AGBD and underestimation at high AGBD (Figure 7). For DBTs, EBTs, and GSWs, the bias shifted from positive to negative around 60–70 Mg/ha, where the bias reached minimum values of 1.82, 0.35, and 2.71, respectively. For ENTs, the transition occurred around 80–90 Mg/ha, also corresponding to the lowest bias of 2.6 Mg/ha. In terms of bias magnitude, EBTs and GSWs exhibited the most pronounced overestimation and underestimation, particularly in extreme biomass ranges. For example, the model showed the highest positive bias at 20–30 Mg/ha for EBTs (20.84 Mg/ha) and for GSWs (22.23 Mg/ha), which gradually declined to the highest negative bias at 140–150 Mg/ha (−64.04 Mg/ha for EBTs and −46.9 Mg/ha for GSWs). In contrast, DBTs and ENTs showed relatively moderate bias across the AGBD ranges, with the largest positive bias (12.17 Mg/ha for DBTs and 12.7 Mg/ha for ENTs) in the 30–40 Mg/ha range, and the largest negative bias occurred in the 180–190 Mg/ha range for DBTs (−17.68 Mg/ha), and in the 140–150 Mg/ha range for ENTs (−17.23 Mg/ha).

4. Discussion

The Global Ecosystem Dynamics Investigation (GEDI) mission is designed to provide detailed measurements of vegetation structure and improve global estimates of aboveground biomass density (AGBD), enabling large-scale, consistent AGBD estimation across diverse forest ecosystems. This study aimed to evaluate the performance of the GEDI in estimating AGBD across the Apulia region in Southern Italy. The findings of this study provide insights into the utility of the GEDI for estimating AGBD in Mediterranean-type forest ecosystems.
The results indicated that the GEDI L4A AGBD estimates over the study area were substantially mismatched and underestimated (RMSE = 40.756 Mg/ha, bias = −30.075 Mg/ha). This level of error indicated that the current GEDI L4A product may fail to capture the structural complexity of Mediterranean forests, especially in heterogeneous landscape such as Southern Italy. Another reason is that the parametric models generating GEDI L4A AGBD estimates from RH metrics were not locally calibrated and instead relied on models developed for other plant functional types. For example, in the study area, the EBT model was calibrated using DBT data, and the EBT and GSW models were derived from the global model [41]. In this regard, applying the GEDI L4A gridded product in our study area requires substantial refinement. This finding aligns with previous studies that also reported the low accuracy of the GEDI biomass product compared to the reference data in various regions [72,73,74].
The superior performance of GEDI-derived AGBD models over the GEDI L4A product highlights the importance of localized calibration. A number of recent studies have also reported the high accuracy of AGBD models developed using various GEDI metrics across diverse forest ecosystems. For example, X. Li et al. [44] employed generalized linear regression (GLR) and random forest (RF) to build local GEDI AGBD footprint-level models in Southern African Savannas, incorporating multiple GEDI metrics (relative heights, PAI, FHD, canopy cover, and sensitivity) as predictors. The results showed that the RF model had the highest accuracy for estimating AGBD (R2 = 0.712, RMSE = 7.3 Mg/ha). Sun et al. [75] used GEDI percentile height metrics (RH25, RH50, RH75, and RH100) as predictors in the random forest model to estimate AGB over tropical and temperate forests in the United States and Mexico. Their results demonstrated a strong correlation between predicted and observed AGB (R2 = 0.82 and RMSE = 19.14 Mg/ha). Xu et al. [76] used multiple linear regression, support vector regression, and random forest to establish AGB models by integrating multiple GEDI metrics (RH100, PAI, sensitivity, canopy cover, etc.) in Shangri-La City, China, and the RF model produced the highest accuracy (R2 = 0.91, RMSE = 19.8 Mg/ha). Although these studies generally identified the RF model as the most accurate, our results showed that the spatial regression models (GWR and MGWR) outperformed RF. This is possibly because the complex orography of the Mediterranean region is characterized by forests and wooded lands that exhibit pronounced horizontal and vertical heterogeneity [3], and RF has difficulty accounting for the spatial non-stationarity, which means that the relationship between GEDI metrics and AGBD varies with geographical location [77]. In contrast, spatial models allow for per-pixel computations, capturing local variability. Moreover, the MGWR model had higher accuracy than the GWR model, which can be explained by the fact that compared to the GWR model which only operates in single bandwidth, the MGWR model provides an additional advantage by allowing each explanatory variable to vary at an optimal bandwidth, thus better reflecting multiple scale effects.
A common pattern in remote sensing-based biomass estimation, also observed in this study, is the presence of systematic bias, specifically the overestimation of lower AGBD values and underestimation of higher AGBD values, which was consistent across all the plant functional types (Figure 7). This phenomenon has also been documented in other GEDI-based studies [40,44]. Overestimation of lower AGBD values may be attributed to the forest areas with sparse vegetation or mixed land cover types, while underestimation of higher AGBD values could result from the complex forest vertical structure with multi-layer canopies that cannot be fully captured by LiDAR [56,78,79]. Spectral reflectance saturation in dense forests remains challenging for LiDAR. Specifically, spectral saturation occurs when reflectance values become insensitive to the change in biomass, especially when biomass exceeds 130 Mg/ha [80], which is consistent with our results. Notably, the saturation effect is not exclusive to spaceborne LiDAR, as has also been reported in studies using airborne LiDAR [37,81]. Although the saturation problem cannot be fully resolved, it can be mitigated by integrating multiple remote sensing data sources including optical, radar, airborne LiDAR, and spaceborne LiDAR.
Despite the robust performance of the spatially calibrated AGBD models, several limitations should be acknowledged. First is the temporal difference between field measurements and GEDI data. Our field sampling was conducted in 2021, whereas the GEDI data were from 2019 to 2023, potentially introducing temporal uncertainty into the prediction model. For example, in the climate change context, Mediterranean forest ecosystems are prone to several drought and extreme heat events, leading to a change in biomass, which may cause the temporal mismatch between the ground-truth data and LiDAR data. Second, our analysis focused on a single region, representing only a small portion of the broader Mediterranean basin. Extrapolating these findings to other Mediterranean or temperate locations would require additional validation because of the local differences in forest structure and species composition. Third, the same predictor variables were used across all four plant functional types. However, different forest types have different biomass accumulation processes driven by unique environmental and ecological conditions. Therefore, selecting variables tailored to specific forest types may better capture their distinct characteristics and help understand the correlation between forest types and biomass. In addition, the classification of all plant functional types in this study was relatively coarse, which could be improved by refining the classification of vegetation types by specific species. Furthermore, incorporating ancillary data such as the terrain factor, soil, and climate variables could further improve the estimation accuracy of AGBD.

5. Conclusions

This study reveals that while GEDI’s global AGBD product offers a promising avenue for large-scale biomass estimation, its current form falls short in the Mediterranean forests of Southern Italy, particularly due to underestimations stemming from non-local model calibrations. This shortfall highlights the structural complexity and ecological heterogeneity of the Mediterranean landscape, which global models struggle to capture accurately.
However, when GEDI metrics are used in combination with region-specific modeling approaches—especially spatially explicit models like geographically weighted regression (GWR) and its multiscale variant (MGWR)—the accuracy of AGBD predictions improves substantially. The MGWR model, in particular, stands out for its capacity to account for local variations and scale-dependent relationships, outperforming both the standard GEDI L4A product and other modeling techniques like random forest.
A key lesson from this research is the critical importance of local calibration when applying spaceborne remote sensing data in ecologically diverse regions. Even highly advanced platforms like GEDI require contextual adaptation to yield meaningful insights at regional scales. Moreover, the observed bias—overestimation at low biomass levels and underestimation at high ones—is a common limitation in LiDAR-based biomass estimation. This pattern underscores the need to complement LiDAR data with other remote sensing sources and to consider integrating ancillary variables like soil, climate, and topography for more robust models.
Ultimately, this study not only validates GEDI’s potential in Mediterranean contexts but also demonstrates that its true value emerges when paired with tailored, spatially aware modeling strategies, paving the way for more effective forest monitoring and carbon accounting in vulnerable ecosystems.

Supplementary Materials

The following supporting information can be downloaded at: https://www.mdpi.com/article/10.3390/rs17162849/s1, Figure S1: Flowchart of GEDI data processing and analysis.

Author Contributions

D.L.: writing—original draft, investigation, conceptualization, data curation, formal analysis, methodology; M.E.: writing—original draft, writing—review and editing, methodology, conceptualization, supervision; O.C.: writing—review and editing, conceptualization; H.H.: writing—review and editing; R.L.: writing—review and editing; G.S.: writing—review and editing; V.G.: writing—review and editing, conceptualization, supervision. All authors have read and agreed to the published version of the manuscript.

Funding

This study was carried out within the Agritech National Research Center and received funding from the European Union Next- GenerationEU (PIANO NAZIONALE DI RIPRESA E RESILIENZA (PNRR)—MISSIONE 4 COMPONENTE 2, INVESTIMENTO 1.4–D.D. 1032 17/06/2022, CN00000022). Funds were also provided by GRINS—Growing Resilient, INclusive and Sustainable Foundation and received funding from the European Union Next-GenerationEU (NATIONAL RECOVERY AND RESILIENCE PLAN (NRRP), MISSION 4, COMPONENT 2, INVESTMENT 1.3–D.D. 1558 11/10/2022, PE00000018, CUP: H93C22000650001, Spoke 7 Territorial sustainability) and the National Recovery and Resilience Plan (NRRP), Mission 4 Component 2 Investment 1.4—Call for tender No. 3138 of 16 December 2021 of Italian Ministry of University and Research, funded by the European Union—NextGenerationEU; Project code: CN00000013, Concession Decree No. 1031 of 17 February 2022 adopted by the Italian Ministry of University and Research, CUP: H93C22000450007, Project title: National Centre for HPC, Big Data and Quantum Computing.

Conflicts of Interest

This manuscript reflects only the authors’ views and opinions; neither the European Union nor the European Commission can be considered responsible for them. The authors declare no conflicts of interest.

References

  1. Moreno-Fernández, D.; Díaz-Pinés, E.; Barbeito, I.; Sánchez-González, M.; Montes, F.; Rubio, A.; Cañellas, I. Temporal Carbon Dynamics over the Rotation Period of Two Alternative Management Systems in Mediterranean Mountain Scots Pine Forests. For. Ecol. Manag. 2015, 348, 186–195. [Google Scholar] [CrossRef]
  2. Sha, Z.; Bai, Y.; Li, R.; Lan, H.; Zhang, X.; Li, J.; Liu, X.; Chang, S.; Xie, Y. The Global Carbon Sink Potential of Terrestrial Vegetation Can Be Increased Substantially by Optimal Land Management. Commun. Earth Env. 2022, 3, 8. [Google Scholar] [CrossRef]
  3. Galidaki, G.; Zianis, D.; Gitas, I.; Radoglou, K.; Karathanassi, V.; Tsakiri–Strati, M.; Woodhouse, I.; Mallinis, G. Vegetation Biomass Estimation with Remote Sensing: Focus on Forest and Other Wooded Land over the Mediterranean Ecosystem. Int. J. Remote Sens. 2017, 38, 1940–1966. [Google Scholar] [CrossRef]
  4. Chirici, G.; Giannetti, F.; McRoberts, R.E.; Travaglini, D.; Pecchi, M.; Maselli, F.; Chiesi, M.; Corona, P. Wall-to-Wall Spatial Prediction of Growing Stock Volume Based on Italian National Forest Inventory Plots and Remotely Sensed Data. Int. J. Appl. Earth Obs. Geoinf. 2020, 84, 101959. [Google Scholar] [CrossRef]
  5. Hu, T.; Su, Y.; Xue, B.; Liu, J.; Zhao, X.; Fang, J.; Guo, Q. Mapping Global Forest Aboveground Biomass with Spaceborne LiDAR, Optical Imagery, and Forest Inventory Data. Remote Sens. 2016, 8, 565. [Google Scholar] [CrossRef]
  6. Wang, P.; Tan, S.; Zhang, G.; Wang, S.; Wu, X. Remote Sensing Estimation of Forest Aboveground Biomass Based on Lasso-SVR. Forests 2022, 13, 1597. [Google Scholar] [CrossRef]
  7. Luo, S.; Wang, C.; Xi, X.; Pan, F.; Peng, D.; Zou, J.; Nie, S.; Qin, H. Fusion of Airborne LiDAR Data and Hyperspectral Imagery for Aboveground and Belowground Forest Biomass Estimation. Ecol. Indic. 2017, 73, 378–387. [Google Scholar] [CrossRef]
  8. Lu, D.; Chen, Q.; Wang, G.; Liu, L.; Li, G.; Moran, E. A Survey of Remote Sensing-Based Aboveground Biomass Estimation Methods in Forest Ecosystems. Int. J. Digit. Earth 2016, 9, 63–105. [Google Scholar] [CrossRef]
  9. Zhu, X.; Liu, D. Improving Forest Aboveground Biomass Estimation Using Seasonal Landsat NDVI Time-Series. ISPRS J. Photogramm. Remote Sens. 2015, 102, 222–231. [Google Scholar] [CrossRef]
  10. Kumar, L.; Mutanga, O. Remote Sensing of Above-Ground Biomass. Remote Sens. 2017, 9, 935. [Google Scholar] [CrossRef]
  11. Shendryk, Y. Fusing GEDI with Earth Observation Data for Large Area Aboveground Biomass Mapping. Int. J. Appl. Earth Obs. Geoinf. 2022, 115, 103108. [Google Scholar] [CrossRef]
  12. García, M.; Riaño, D.; Chuvieco, E.; Danson, F.M. Estimating Biomass Carbon Stocks for a Mediterranean Forest in Central Spain Using LiDAR Height and Intensity Data. Remote Sens. Environ. 2010, 114, 816–830. [Google Scholar] [CrossRef]
  13. Dang, A.T.N.; Nandy, S.; Srinet, R.; Luong, N.V.; Ghosh, S.; Senthil Kumar, A. Forest Aboveground Biomass Estimation Using Machine Learning Regression Algorithm in Yok Don National Park, Vietnam. Ecol. Inform. 2019, 50, 24–32. [Google Scholar] [CrossRef]
  14. Jiang, F.; Kutia, M.; Ma, K.; Chen, S.; Long, J.; Sun, H. Estimating the Aboveground Biomass of Coniferous Forest in Northeast China Using Spectral Variables, Land Surface Temperature and Soil Moisture. Sci. Total Environ. 2021, 785, 147335. [Google Scholar] [CrossRef]
  15. Li, Y.; Li, M.; Li, C.; Liu, Z. Forest Aboveground Biomass Estimation Using Landsat 8 and Sentinel-1A Data with Machine Learning Algorithms. Sci. Rep. 2020, 10, 9952. [Google Scholar] [CrossRef]
  16. Zhang, Y.; Wang, N.; Wang, Y.; Li, M. A New Strategy for Improving the Accuracy of Forest Aboveground Biomass Estimates in an Alpine Region Based on Multi-Source Remote Sensing. GIScience Remote Sens. 2023, 60, 2163574. [Google Scholar] [CrossRef]
  17. Salazar Villegas, M.H.; Qasim, M.; Csaplovics, E.; González-Martinez, R.; Rodriguez-Buritica, S.; Ramos Abril, L.N.; Salazar Villegas, B. Examining the Potential of Sentinel Imagery and Ensemble Algorithms for Estimating Aboveground Biomass in a Tropical Dry Forest. Remote Sens. 2023, 15, 5086. [Google Scholar] [CrossRef]
  18. Ahmad, N.; Ullah, S.; Zhao, N.; Mumtaz, F.; Ali, A.; Ali, A.; Tariq, A.; Kareem, M.; Imran, A.B.; Khan, I.A.; et al. Comparative Analysis of Remote Sensing and Geo-Statistical Techniques to Quantify Forest Biomass. Forests 2023, 14, 379. [Google Scholar] [CrossRef]
  19. Arévalo, P.; Baccini, A.; Woodcock, C.E.; Olofsson, P.; Walker, W.S. Continuous Mapping of Aboveground Biomass Using Landsat Time Series. Remote Sens. Environ. 2023, 288, 113483. [Google Scholar] [CrossRef]
  20. Huang, T.; Ou, G.; Wu, Y.; Zhang, X.; Liu, Z.; Xu, H.; Xu, X.; Wang, Z.; Xu, C. Estimating the Aboveground Biomass of Various Forest Types with High Heterogeneity at the Provincial Scale Based on Multi-Source Data. Remote Sens. 2023, 15, 3550. [Google Scholar] [CrossRef]
  21. Ho Tong Minh, D.; Ndikumana, E.; Vieilledent, G.; McKey, D.; Baghdadi, N. Potential Value of Combining ALOS PALSAR and Landsat-Derived Tree Cover Data for Forest Biomass Retrieval in Madagascar. Remote Sens. Environ. 2018, 213, 206–214. [Google Scholar] [CrossRef]
  22. Kumar, S.; Garg, R.D.; Govil, H.; Kushwaha, S.P.S. PolSAR-Decomposition-Based Extended Water Cloud Modeling for Forest Aboveground Biomass Estimation. Remote Sens. 2019, 11, 2287. [Google Scholar] [CrossRef]
  23. Sadeghi, Y.; St-Onge, B.; Leblon, B.; Prieur, J.-F.; Simard, M. Mapping Boreal Forest Biomass from a SRTM and TanDEM-X Based on Canopy Height Model and Landsat Spectral Indices. Int. J. Appl. Earth Obs. Geoinf. 2018, 68, 202–213. [Google Scholar] [CrossRef]
  24. Domingues, G.F.; Soares, V.P.; Leite, H.G.; Ferraz, A.S.; Ribeiro, C.A.A.S.; Lorenzon, A.S.; Marcatti, G.E.; Teixeira, T.R.; De Castro, N.L.M.; Mota, P.H.S.; et al. Artificial Neural Networks on Integrated Multispectral and SAR Data for High-Performance Prediction of Eucalyptus Biomass. Comput. Electron. Agric. 2020, 168, 105089. [Google Scholar] [CrossRef]
  25. Bouvet, A.; Mermoz, S.; Le Toan, T.; Villard, L.; Mathieu, R.; Naidoo, L.; Asner, G.P. An Above-Ground Biomass Map of African Savannahs and Woodlands at 25 m Resolution Derived from ALOS PALSAR. Remote Sens. Environ. 2018, 206, 156–173. [Google Scholar] [CrossRef]
  26. Schlund, M.; Davidson, M. Aboveground Forest Biomass Estimation Combining L- and P-Band SAR Acquisitions. Remote Sens. 2018, 10, 1151. [Google Scholar] [CrossRef]
  27. Qian, C.; Qiang, H.; Wang, F.; Li, M. Estimation of Forest Aboveground Biomass in Karst Areas Using Multi-Source Remote Sensing Data and the K-DBN Algorithm. Remote Sens. 2021, 13, 5030. [Google Scholar] [CrossRef]
  28. Zhao, P.; Lu, D.; Wang, G.; Liu, L.; Li, D.; Zhu, J.; Yu, S. Forest Aboveground Biomass Estimation in Zhejiang Province Using the Integration of Landsat TM and ALOS PALSAR Data. Int. J. Appl. Earth Obs. Geoinf. 2016, 53, 1–15. [Google Scholar] [CrossRef]
  29. Yan, Y.; Lei, J.; Huang, Y. Forest Aboveground Biomass Estimation Based on Unmanned Aerial Vehicle–Light Detection and Ranging and Machine Learning. Sensors 2024, 24, 7071. [Google Scholar] [CrossRef]
  30. Brovkina, O.; Novotny, J.; Cienciala, E.; Zemek, F.; Russ, R. Mapping Forest Aboveground Biomass Using Airborne Hyperspectral and LiDAR Data in the Mountainous Conditions of Central Europe. Ecol. Eng. 2017, 100, 219–230. [Google Scholar] [CrossRef]
  31. Ferraz, A.; Saatchi, S.; Mallet, C.; Jacquemoud, S.; Gonçalves, G.; Silva, C.; Soares, P.; Tomé, M.; Pereira, L. Airborne Lidar Estimation of Aboveground Forest Biomass in the Absence of Field Inventory. Remote Sens. 2016, 8, 653. [Google Scholar] [CrossRef]
  32. Ene, L.T.; Næsset, E.; Gobakken, T.; Mauya, E.W.; Bollandsås, O.M.; Gregoire, T.G.; Ståhl, G.; Zahabu, E. Large-Scale Estimation of Aboveground Biomass in Miombo Woodlands Using Airborne Laser Scanning and National Forest Inventory Data. Remote Sens. Environ. 2016, 186, 626–636. [Google Scholar] [CrossRef]
  33. Ene, L.T.; Gobakken, T.; Andersen, H.-E.; Næsset, E.; Cook, B.D.; Morton, D.C.; Babcock, C.; Nelson, R. Large-Area Hybrid Estimation of Aboveground Biomass in Interior Alaska Using Airborne Laser Scanning Data. Remote Sens. Environ. 2018, 204, 741–755. [Google Scholar] [CrossRef]
  34. Chen, Q.; McRoberts, R.E.; Wang, C.; Radtke, P.J. Forest Aboveground Biomass Mapping and Estimation across Multiple Spatial Scales Using Model-Based Inference. Remote Sens. Environ. 2016, 184, 350–360. [Google Scholar] [CrossRef]
  35. Vaglio Laurin, G.; Puletti, N.; Chen, Q.; Corona, P.; Papale, D.; Valentini, R. Above Ground Biomass and Tree Species Richness Estimation with Airborne Lidar in Tropical Ghana Forests. Int. J. Appl. Earth Obs. Geoinf. 2016, 52, 371–379. [Google Scholar] [CrossRef]
  36. Cao, L.; Coops, N.C.; Sun, Y.; Ruan, H.; Wang, G.; Dai, J.; She, G. Estimating Canopy Structure and Biomass in Bamboo Forests Using Airborne LiDAR Data. ISPRS J. Photogramm. Remote Sens. 2019, 148, 114–129. [Google Scholar] [CrossRef]
  37. Almeida, C.T.D.; Galvão, L.S.; Aragão, L.E.D.O.C.E.; Ometto, J.P.H.B.; Jacon, A.D.; Pereira, F.R.D.S.; Sato, L.Y.; Lopes, A.P.; Graça, P.M.L.D.A.; Silva, C.V.D.J.; et al. Combining LiDAR and Hyperspectral Data for Aboveground Biomass Modeling in the Brazilian Amazon Using Different Regression Algorithms. Remote Sens. Environ. 2019, 232, 111323. [Google Scholar] [CrossRef]
  38. Rodríguez-Veiga, P.; Wheeler, J.; Louis, V.; Tansey, K.; Balzter, H. Quantifying Forest Biomass Carbon Stocks from Space. Curr. For. Rep. 2017, 3, 1–18. [Google Scholar] [CrossRef]
  39. Dubayah, R.; Blair, J.B.; Goetz, S.; Fatoyinbo, L.; Hansen, M.; Healey, S.; Hofton, M.; Hurtt, G.; Kellner, J.; Luthcke, S.; et al. The Global Ecosystem Dynamics Investigation: High-Resolution Laser Ranging of the Earth’s Forests and Topography. Sci. Remote Sens. 2020, 1, 100002. [Google Scholar] [CrossRef]
  40. Duncanson, L.; Neuenschwander, A.; Hancock, S.; Thomas, N.; Fatoyinbo, T.; Simard, M.; Silva, C.A.; Armston, J.; Luthcke, S.B.; Hofton, M.; et al. Biomass Estimation from Simulated GEDI, ICESat-2 and NISAR across Environmental Gradients in Sonoma County, California. Remote Sens. Environ. 2020, 242, 111779. [Google Scholar] [CrossRef]
  41. Kellner, J.R.; Armston, J.; Duncanson, L. Algorithm Theoretical Basis Document for GEDI Footprint Aboveground Biomass Density. Earth Space Sci. 2023, 10, e2022EA002516. [Google Scholar] [CrossRef]
  42. Duncanson, L.; Kellner, J.R.; Armston, J.; Dubayah, R.; Minor, D.M.; Hancock, S.; Healey, S.P.; Patterson, P.L.; Saarela, S.; Marselis, S.; et al. Aboveground Biomass Density Models for NASA’s Global Ecosystem Dynamics Investigation (GEDI) Lidar Mission. Remote Sens. Environ. 2022, 270, 112845. [Google Scholar] [CrossRef]
  43. Santi, E.; Paloscia, S.; Pettinato, S.; Fontanelli, G.; Mura, M.; Zolli, C.; Maselli, F.; Chiesi, M.; Bottai, L.; Chirici, G. The Potential of Multifrequency SAR Images for Estimating Forest Biomass in Mediterranean Areas. Remote Sens. Environ. 2017, 200, 63–73. [Google Scholar] [CrossRef]
  44. Li, X.; Wessels, K.; Armston, J.; Duncanson, L.; Urbazaev, M.; Naidoo, L.; Mathieu, R.; Main, R. Evaluation of GEDI Footprint Level Biomass Models in Southern African Savannas Using Airborne LiDAR and Field Measurements. Sci. Remote Sens. 2024, 10, 100161. [Google Scholar] [CrossRef]
  45. Mitsuhashi, R.; Sawada, Y.; Tsutsui, K.; Hirayama, H.; Imai, T.; Sumita, T.; Kajiwara, K.; Honda, Y. Re-Estimating GEDI Ground Elevation Using Deep Learning: Impacts on Canopy Height and Aboveground Biomass. Remote Sens. 2024, 16, 4597. [Google Scholar] [CrossRef]
  46. Wang, Y.; Wang, H.; Wang, C.; Zhang, S.; Wang, R.; Wang, S.; Duan, J. Co-Kriging-Guided Interpolation for Mapping Forest Aboveground Biomass by Integrating Global Ecosystem Dynamics Investigation and Sentinel-2 Data. Remote Sens. 2024, 16, 2913. [Google Scholar] [CrossRef]
  47. Xu, L.; Yu, J.; Shu, Q.; Luo, S.; Zhou, W.; Duan, D. Forest Aboveground Biomass Estimation Based on Spaceborne LiDAR Combining Machine Learning Model and Geostatistical Method. Front. Plant Sci. 2024, 15, 1428268. [Google Scholar] [CrossRef]
  48. Dorado-Roda, I.; Pascual, A.; Godinho, S.; Silva, C.; Botequim, B.; Rodríguez-Gonzálvez, P.; González-Ferreiro, E.; Guerra-Hernández, J. Assessing the Accuracy of GEDI Data for Canopy Height and Aboveground Biomass Estimates in Mediterranean Forests. Remote Sens. 2021, 13, 2279. [Google Scholar] [CrossRef]
  49. Wu, L.; Du, J.; Liu, X.; Li, L.; Zhu, X.; Chen, X.; Gong, Y.; Li, Y. Comparative Analysis of Carbon Density Simulation Methods in Grassland Ecosystems: A Case Study from Gansu Province, China. Remote Sens. 2025, 17, 172. [Google Scholar] [CrossRef]
  50. Wang, J.; Du, H.; Li, X.; Mao, F.; Zhang, M.; Liu, E.; Ji, J.; Kang, F. Remote Sensing Estimation of Bamboo Forest Aboveground Biomass Based on Geographically Weighted Regression. Remote Sens. 2021, 13, 2962. [Google Scholar] [CrossRef]
  51. D’Este, M.; Elia, M.; Giannico, V.; Spano, G.; Lafortezza, R.; Sanesi, G. Machine Learning Techniques for Fine Dead Fuel Load Estimation Using Multi-Source Remote Sensing Data. Remote Sens. 2021, 13, 1658. [Google Scholar] [CrossRef]
  52. Burns, P.; Hakkenberg, C.R.; Goetz, S.J. Multi-Resolution Gridded Maps of Vegetation Structure from GEDI. Sci. Data 2024, 11, 881. [Google Scholar] [CrossRef]
  53. Simmavong, T.; Su, Y.; Deng, Y.; Wang, B.; Yao, Z.; Wu, J.; Sha, L.; Cao, M.; Lin, L. Forest Structure Predicts Aboveground Biomass Better than Community-Weighted Mean of Traits, Functional Diversity, Topography, and Soil in a Tropical Forest across Spatial Scales. For. Ecol. Manag. 2025, 578, 122457. [Google Scholar] [CrossRef]
  54. Fischer, R.; Knapp, N.; Bohn, F.; Shugart, H.H.; Huth, A. The Relevance of Forest Structure for Biomass and Productivity in Temperate Forests: New Perspectives for Remote Sensing. Surv. Geophys. 2019, 40, 709–734. [Google Scholar] [CrossRef]
  55. R Core Team. R: A Language and Environment for Statistical Computing; R Foundation for Statistical Computing: Vienna, Austria, 2021; Available online: https://www.R-project.org (accessed on 20 February 2025).
  56. Gao, Y.; Lu, D.; Li, G.; Wang, G.; Chen, Q.; Liu, L.; Li, D. Comparative Analysis of Modeling Algorithms for Forest Aboveground Biomass Estimation in a Subtropical Region. Remote Sens. 2018, 10, 627. [Google Scholar] [CrossRef]
  57. Spadoni, G.L.; Moris, J.V.; Vacchiano, G.; Elia, M.; Garbarino, M.; Sibona, E.; Ascoli, D. Active governance of agro-pastoral, forest and protected areas mitigates wildfire impacts in Italy. Sci. Total Environ. 2023, 890, 164281. [Google Scholar] [CrossRef]
  58. Zeng, N.; Ren, X.; He, H.; Zhang, L.; Zhao, D.; Ge, R.; Li, P.; Niu, Z. Estimating Grassland Aboveground Biomass on the Tibetan Plateau Using a Random Forest Algorithm. Ecol. Indic. 2019, 102, 479–487. [Google Scholar] [CrossRef]
  59. Chen, Z.; Sun, Z.; Zhang, H.; Zhang, H.; Qiu, H. Aboveground Forest Biomass Estimation Using Tent Mapping Atom Search Optimized Backpropagation Neural Network with Landsat 8 and Sentinel-1A Data. Remote Sens. 2023, 15, 5653. [Google Scholar] [CrossRef]
  60. Li, Y.; Li, C.; Li, M.; Liu, Z. Influence of Variable Selection and Forest Type on Forest Aboveground Biomass Estimation Using Machine Learning Algorithms. Forests 2019, 10, 1073. [Google Scholar] [CrossRef]
  61. Wang, C.; Zhang, W.; Ji, Y.; Marino, A.; Li, C.; Wang, L.; Zhao, H.; Wang, M. Estimation of Aboveground Biomass for Different Forest Types Using Data from Sentinel-1, Sentinel-2, ALOS PALSAR-2, and GEDI. Forests 2024, 15, 215. [Google Scholar] [CrossRef]
  62. Wang, N.; Sun, M.; Ye, J.; Wang, J.; Liu, Q.; Li, M. Spatial Downscaling of Forest Above-Ground Biomass Distribution Patterns Based on Landsat 8 OLI Images and a Multiscale Geographically Weighted Regression Algorithm. Forests 2023, 14, 526. [Google Scholar] [CrossRef]
  63. Giannico, V.; Garofalo, S.P.; Brillante, L.; Sciusco, P.; Elia, M.; Lopriore, G.; Camposeo, S.; Lafortezza, R.; Sanesi, G.; Vivaldi, G.A. Temporal Vine Water Status Modeling Through Machine Learning Ensemble Technique and Sentinel-2 Multispectral Images Under Semi-Arid Conditions. Remote Sens. 2024, 16, 4784. [Google Scholar] [CrossRef]
  64. Brunsdon, C.; Fotheringham, A.S.; Charlton, M.E. Geographically Weighted Regression: A Method for Exploring Spatial Nonstationarity. Geogr. Anal. 1996, 28, 281–298. [Google Scholar] [CrossRef]
  65. Chen, L.; Ren, C.; Zhang, B.; Wang, Z.; Xi, Y. Estimation of Forest Above-Ground Biomass by Geographically Weighted Regression and Machine Learning with Sentinel Imagery. Forests 2018, 9, 582. [Google Scholar] [CrossRef]
  66. Propastin, P. Modifying Geographically Weighted Regression for Estimating Aboveground Biomass in Tropical Rainforests by Multispectral Remote Sensing Data. Int. J. Appl. Earth Obs. Geoinf. 2012, 18, 82–90. [Google Scholar] [CrossRef]
  67. Shabrina, Z.; Buyuklieva, B.; Ng, M.K.M. Short-term rental platform in the urban tourism context: A geographically weighted regression (GWR) and a multiscale GWR (MGWR) approaches. Geogr. Anal. 2020, 53, 686–707. [Google Scholar] [CrossRef]
  68. Fotheringham, A.S.; Yang, W.; Kang, W. Multiscale geographically weighted regression (MGWR). Ann. Am. Assoc. Geogr. 2017, 107, 1247–1265. [Google Scholar] [CrossRef]
  69. Liu, P.; Wu, C.; Chen, M.; Ye, X.; Peng, Y.; Li, S. A Spatiotemporal Analysis of the Effects of Urbanization’s Socio-Economic Factors on Landscape Patterns Considering Operational Scales. Sustainability 2020, 12, 2543. [Google Scholar] [CrossRef]
  70. Li, N.; Wu, H.; Ouyang, X. Localized Downscaling of Urban Land Surface Temperature—A Case Study in Beijing, China. Remote Sens. 2022, 14, 2390. [Google Scholar] [CrossRef]
  71. Wheeler, D.; Tiefelsdorf, M. Multicollinearity and Correlation among Local Regression Coefficients in Geographically Weighted Regression. J. Geogr. Syst. 2005, 7, 161–187. [Google Scholar] [CrossRef]
  72. Pascual, A.; Guerra-Hernández, J.; Armston, J.; Minor, D.M.; Duncanson, L.I.; May, P.B.; Kellner, J.R.; Dubayah, R. Assessing the Performance of NASA’s GEDI L4A Footprint Aboveground Biomass Density Models Using National Forest Inventory and Airborne Laser Scanning Data in Mediterranean Forest Ecosystems. For. Ecol. Manag. 2023, 538, 120975. [Google Scholar] [CrossRef]
  73. Rodda, S.R.; Nidamanuri, R.R.; Fararoda, R.; Mayamanikandan, T.; Rajashekar, G. Evaluation of Height Metrics and Above-Ground Biomass Density from GEDI and ICESat-2 Over Indian Tropical Dry Forests Using Airborne LiDAR Data. J. Indian. Soc. Remote Sens. 2024, 52, 841–856. [Google Scholar] [CrossRef]
  74. Li, H.; Li, X.; Kato, T.; Hayashi, M.; Fu, J.; Hiroshima, T. Accuracy Assessment of GEDI Terrain Elevation, Canopy Height, and Aboveground Biomass Density Estimates in Japanese Artificial Forests. Sci. Remote Sens. 2024, 10, 100144. [Google Scholar] [CrossRef]
  75. Sun, M.; Cui, L.; Park, J.; García, M.; Zhou, Y.; Silva, C.A.; He, L.; Zhang, H.; Zhao, K. Evaluation of NASA’s GEDI Lidar Observations for Estimating Biomass in Temperate and Tropical Forests. Forests 2022, 13, 1686. [Google Scholar] [CrossRef]
  76. Xu, L.; Shu, Q.; Fu, H.; Zhou, W.; Luo, S.; Gao, Y.; Yu, J.; Guo, C.; Yang, Z.; Xiao, J.; et al. Estimation of Quercus Biomass in Shangri-La Based on GEDI Spaceborne Lidar Data. Forests 2023, 14, 876. [Google Scholar] [CrossRef]
  77. Nikparvar, B.; Thill, J.-C. Machine Learning of Spatial Data. IJGI 2021, 10, 600. [Google Scholar] [CrossRef]
  78. Indirabai, I.; Nilsson, M. Estimation of above Ground Biomass in Tropical Heterogeneous Forests in India Using GEDI. Ecol. Inform. 2024, 82, 102712. [Google Scholar] [CrossRef]
  79. Zhao, P.; Lu, D.; Wang, G.; Wu, C.; Huang, Y.; Yu, S. Examining Spectral Reflectance Saturation in Landsat Imagery and Corresponding Solutions to Improve Forest Aboveground Biomass Estimation. Remote Sens. 2016, 8, 469. [Google Scholar] [CrossRef]
  80. Mutanga, O.; Masenyama, A.; Sibanda, M. Spectral Saturation in the Remote Sensing of High-Density Vegetation Traits: A Systematic Review of Progress, Challenges, and Prospects. ISPRS J. Photogramm. Remote Sens. 2023, 198, 297–309. [Google Scholar] [CrossRef]
  81. Du, C.; Fan, W.; Ma, Y.; Jin, H.-I.; Zhen, Z. The Effect of Synergistic Approaches of Features and Ensemble Learning Algorithms on Aboveground Biomass Estimation of Natural Secondary Forests Based on ALS and Landsat 8. Sensors 2021, 21, 5974. [Google Scholar] [CrossRef] [PubMed]
Figure 1. Maps of the forests in the Apulia region, Italy.
Remotesensing 17 02849 g001
Figure 2. Comparison between the GEDI L4A gridded AGBD (1 km) (right) and aggregated reference AGBD (1 km) (left) in the Apulia region.
Remotesensing 17 02849 g002
Figure 3. Scatterplots of GEDI L4A AGBD vs. reference Apulia AGBD for (a) all samples, and for the four plant functional types—(b) DBTs: deciduous broadleaf trees, (c) EBTs: evergreen broadleaf trees, (d) ENTs: evergreen needleleaf trees, and (e) GSWs: grasses, shrubs, and woodlands.
Remotesensing 17 02849 g003
Figure 4. Scatterplot of GEDI-derived AGBD vs. reference Apulia AGBD. (a) Random forest (RF); (b) geographically weighted regression (GWR); (c) multiscale geographically weighted regression (MGWR).
Remotesensing 17 02849 g004
Figure 5. Predicted aboveground biomass density (AGBD) vs. reference Apulia AGBD of four plant functional types: (ac) DBTs: deciduous broadleaf trees, (df) EBTs: evergreen broadleaf trees, (gi) ENTs: evergreen needleleaf trees, and (jl) GSWs: grasses, shrubs, and woodlands using random forest (RF), geographically weighted regression (GWR), and multiscale geographically weighted regression (MGWR) models.
Remotesensing 17 02849 g005aRemotesensing 17 02849 g005b
Figure 6. The spatial distribution of the MGWR-predicted AGBD for (a) all samples and four plant functional types—(b) DBTs: deciduous broadleaf trees, (c) EBTs: evergreen broadleaf trees, (d) ENTs: evergreen needleleaf trees, and (e) GSWs: grasses, shrubs, and woodlands in the Apulia region.
Remotesensing 17 02849 g006
Figure 7. The bias histogram of MGWR-predicted vs. reference AGBD in four plant functional types—(a) DBTs: deciduous broadleaf trees, (b) EBTs: evergreen broadleaf trees, (c) ENTs: evergreen needleleaf trees, and (d) GSWs: grasses, shrubs, and woodlands in the Apulia region. The AGBD values were grouped at 10 Mg/ha increments. The top row of numbers is the count of each AGBD range. The numbers above and below the bar charts represent the bias of the corresponding AGBD range, respectively.
Remotesensing 17 02849 g007
Table 1. The definitions of GEDI metrics aggregated into raster grids at 1 km resolution.
GEDI MetricDescription
RH metrics (meters above the ground) Relative height at percentile of returned energy, including RH50 and RH98. RH98 represents vegetation canopy, and RH50 provides information on the heights of subcanopy strata.
PAI (m2 m−2)GEDI total plant area index that incorporates all canopy structural elements (e.g., branch and trunk) in addition to leaves. It is the indicator of the density of the canopy.
FHD (unitless)Foliage height diversity (FHD), calculated from 1 m vertical bins in the foliage profile, normalized by the total plant area (PAI) index. It is a canopy structural index that describes the vertical heterogeneity of the foliage profile. A high FHD value means a complex forest structure.
Sensitivity (unitless)Maximum canopy cover that can be penetrated all the way to the ground considering the SNR (signal-to-noise ratio) of the waveform. Higher sensitivity allows the laser to penetrate a denser canopy.
Cover (unitless)Total canopy cover, defined as the percentage of the ground covered by the vertical projection of canopy material. It is a biophysical parameter that describes the spatially aggregated geometric properties of vegetation.
Table 2. Summary of the accuracy of GEDI L4A and three GEDI-based models (RF, GWR, and MGWR) for AGBD estimation.
R2RMSErRMSEBiasrBias
GEDI L4A 40.75659.309%−30.075−43.766%
RF0.43119.86128.315%0.1930.275%
GWR0.67415.02421.419%0.0780.111%
MGWR0.71913.93419.866%−0.001−0.002%
Table 3. Summary of GEDI L4A and three GEDI-based models (RF, GWR, and MGWR) for AGBD estimation of deciduous broadleaf trees (DBTs), evergreen broadleaf trees (EBTs), evergreen needleleaf trees (ENTs), and grasses, shrubs, and woodlands (GSWs).
PFT RMSErRMSE (%)BiasrBias (%)
Deciduous Broadleaf Trees
(DBTs)
GEDI L4A33.68447.489%−20.676−29.151%
RF18.86925.683%1.7652.402%
GWR15.47921.069%−0.080−0.109%
MGWR12.67217.247%0.1780.243%
Evergreen Broadleaf Trees
(EBTs)
GEDI L4A34.46953.644%−26.225−40.813%
RF19.49329.951%2.1353.280%
GWR15.21823.383%0.2010.309%
MGWR13.50520.752%−0.091−0.140%
Evergreen Needleleaf Trees
(ENTs)
GEDI L4A33.33640.066%−23.905−28.731%
RF18.79122.183%−2.313−2.730%
GWR13.42115.844%−0.876−1.034%
MGWR11.97614.138%−0.871−1.028%
Grasses, Shrubs, and Woodlands
(GSWs)
GEDI L4A54.95281.022%−48.798−71.948%
RF22.53732.899%−3.171−4.629%
GWR16.89724.666%−0.148−0.216%
MGWR16.45524.021%−0.106−0.155%
Disclaimer/Publisher’s Note: The statements, opinions and data contained in all publications are solely those of the individual author(s) and contributor(s) and not of MDPI and/or the editor(s). MDPI and/or the editor(s) disclaim responsibility for any injury to people or property resulting from any ideas, methods, instructions or products referred to in the content.