Technical Note

Improving Aboveground Biomass Estimation in Beech Forests with 3D Tree Crown Parameters Derived from UAV-LS

1
Consiglio per la Ricerca e l’Analisi dell’Economia Agraria (CREA), Research Centre for Forestry and Wood, 00166 Rome, Italy
2
Forest Biometrics, Remote Sensing, and Artificial Intelligence Laboratory (Silva Lab), School of Forest, Fisheries and Geomatics Sciences, University of Florida, P.O. Box 110410, Gainesville, FL 32611, USA
*
Author to whom correspondence should be addressed.
Remote Sens. 2025, 17(9), 1497; https://doi.org/10.3390/rs17091497
Submission received: 24 February 2025 / Revised: 10 April 2025 / Accepted: 22 April 2025 / Published: 23 April 2025

Abstract

:
Accurate estimates of aboveground biomass (AGB) are essential for forest policies to reduce carbon emissions. Unmanned aerial laser scanning (UAV-LS) offers unprecedented millimetric detail but is underutilized in monitoring broadleaf Mediterranean forests compared to coniferous ones. This study aims to design and evaluate a procedure for AGB estimates based on the predictive power of crown features. In the first step, we manually created Quantitative Structure Models (QSMs) for 320 trees using data from UAV laser scanning (UAV-LS), airborne laser scanning (ALS), and co-registered terrestrial laser scanning (TLS). This provided the most accurate non-destructive estimate of aboveground biomass (AGB) in the absence of destructive measurements. For each reference tree we also measured crown projection and crown volume to build two separated models relating AGB to such crown features. In the second phase, we evaluated the potential of UAV-LS for quantifying AGB in a pure European beech (Fagus sylvatica) forest and compared it with traditional ALS estimates, using fully automatic procedures. The two obtained tree-level AGB models were then tested using three datasets derived from 35 sampling plots over the same study area: (a) 1130 trees manually segmented (phase-2 reference); (b) trees automatically extracted from ALS data; and (c) trees automatically extracted from UAV-LS data. Results demonstrate that detailed UAV-LS data improve model sensitivity compared to ALS data (RMSE = 45.6 Mg ha−1, RMSE% = 13.4%, R2 = 0.65, for the best ALS model; RMSE = 44.0 Mg ha−1, RMSE% = 12.9%, R2 = 0.67, for the best UAV-LS model), allowing for the detection of AGB differences even in quite homogenous forest structures. Overall, this study demonstrates the combined use of both laser scanner data can foster non-destructive and more precise AGB estimation than the use of only one, in forested areas across hectare scales (1 to 100 ha).

1. Introduction

Forests are fundamental natural carbon sinks, actively contributing to mitigating climate change [1]. In recent decades, the demand for accurate methods to estimate aboveground biomass (AGB) in forest ecosystems has grown due to its crucial role in the carbon cycle and in assessing forest health status, habitat quality, forest disturbance and restoration [2]. Carbon stock estimates in forest ecosystems are strictly linked to tree AGB, which varies with eco-physiological, environmental, and management stand-based factors. Individual tree AGB can be estimated using various models, primarily based on the allometric relationship between diameter at breast height (DBH), tree height (TH), and other explanatory variables [3,4]. Recent studies have also highlighted the potential of using crown parameters, such as crown surface area and crown volume, as alternative predictors for estimating tree AGB, offering a viable approach that does not rely on DBH measurements [5]. Developing models tailored to specific local conditions is therefore essential for managers and practitioners to address site-specific management challenges and achieve their objectives [6,7].
General scaling rules for metabolic and structural plant allometry, such as the theory of Euclidean geometric scaling or the metabolic scaling theory (MST [8]), provide valuable insights into biomass patterns at broad scales. However, these theories assume a constant tree crown–volume relation for all the trees of a given species, even though the variability in crown structure, rather than constancy, is crucial for a tree’s success in crowded conditions [9]. Despite the reliability of such allometric models, it is important to account for regional variability in their application, as the training data sources may exhibit spatial and temporal differences [10]. Additionally, frequent recalibration may be necessary due to changes in tree conditions and forest stand characteristics. This is crucial because the accuracy of individual tree AGB estimates directly affects biomass estimations at broader scales. Another limitation affecting local allometric model accuracy stands in the reduced number of calibration samples, which typically require destructive harvesting [11,12]. This process can be costly when used through traditional tools like chainsaws, callipers, and measuring tape, and it often prevents large trees from being harvested [13]. In addition, during the felling phase, the tree crown is subjected to breakages, leading to inaccurate measurements.
Accurately and efficiently measuring crown dimensions remains a challenge due to the complexity and variability of crown structures, which are influenced by factors such as tree species, competition dynamics, topography, and climate [14]. Terrestrial Laser Scanning (TLS) is widely recognized as one of the most accurate and non-destructive methods for estimating individual tree architecture and volume [13,15,16,17,18]. However, its application across large areas faces considerable logistical challenges. TLS campaigns are time-intensive, requiring up to 3–7 days per hectare [19], and demand substantial manual effort for individual tree segmentation, particularly in dense and complex forest canopies. These constraints significantly limit its feasibility for calibrating and validating AGB models over broad and heterogeneous landscapes.
Generating wall-to-wall AGB maps requires the integration of field-surveyed data with metrics obtained from Laser Scanning devices, such as Airborne Laser Scanning (ALS) [20,21]. Although ALS data have been extensively tested in forest ecosystems and are, at present, an integral part of many national-scale environmental monitoring programs [22], challenges remain in their application for AGB assessment. In particular, estimating AGB for deciduous trees is more difficult than for conifers, likely due to differences in growth patterns [23]. For example, Beech (Fagus sylvatica L.) trees, which have deliquescent tree forms, allocate a great amount of biomass into lateral branches, introducing noise into the relationship between height and volume/biomass. Recent studies have demonstrated that ALS data can be profitably used in such stands when forest structure and species mixture have great variability, particularly if specific variables like site productivity are included [21]. Without such ancillary data, ALS models for pure deciduous forests remain inaccurate [24,25,26]. Despite the widespread use of ALS for AGB estimation, its application in deciduous forests, such as pure beech stands, remains challenging due to the unique structural variability of these forests, characterized by deliquescent branching and lateral biomass allocation.
The recent miniaturisation of LiDAR instruments [27] has paved the way to integrate more detailed data above the canopy [15]. Laser scanners mounted on Unmanned Aerial Vehicles (UAV-LS) offer a promising solution to enhance the quality of ALS-based statistical allometric models in temperate and boreal forests [28], particularly in pure-broadleaved forests [15,17,24]. UAV-LS offers several advantages over traditional ALS systems [29,30]. First, it provides a much higher point density (>1000 points m−2), enabling detailed crown reconstruction. Second, UAV-LS is highly flexible, with faster flight planning (10–20 ha h−1) and lower costs, making it suitable for covering large forest areas efficiently.
To address these limitations, this study evaluates how detailed crown metrics derived from UAV-LS can improve the accuracy of AGB estimates in pure beech forests, leveraging precise crown feature measurements and automated individual tree segmentation (ITS). This study aims to assess the potential of UAV-LS in improving AGB estimates in pure beech forests by leveraging precise crown feature measurements. The analysis combines TLS reference data, manually extracted crown metrics, and an automated ITS algorithm to evaluate UAV-LS’s effectiveness compared to ALS-based methods. The experiment was conducted in managed pure beech forests characterized by homogeneous, dense canopy cover and minimal differences in vertical structure, but a wide range of three diameters (i.e., diameter at breast height, DBH, ranging from 4 to 85 cm). TLS data were used as input reference data for variables like tree position, DBH, and tree volume derived from quantitative structure models QSMs [31]. In the first phase, UAV-LS data were manually processed to obtain a precise measure of crown features and tree volume for over 300 trees used as reference. Then, AGB was derived as the product of tree volume, Biomass Expansion Factor (BEF), and Wood Basal Density (WBD). Based on this, an AGB~crown model was developed. In the second phase, the AGB~crown model was applied using crown features derived from an automatic ITS algorithm as predictor. Finally, plot-level products obtained by ALS and UAV-LS point clouds were compared with reference data to assess their performance.

2. Material and Methods

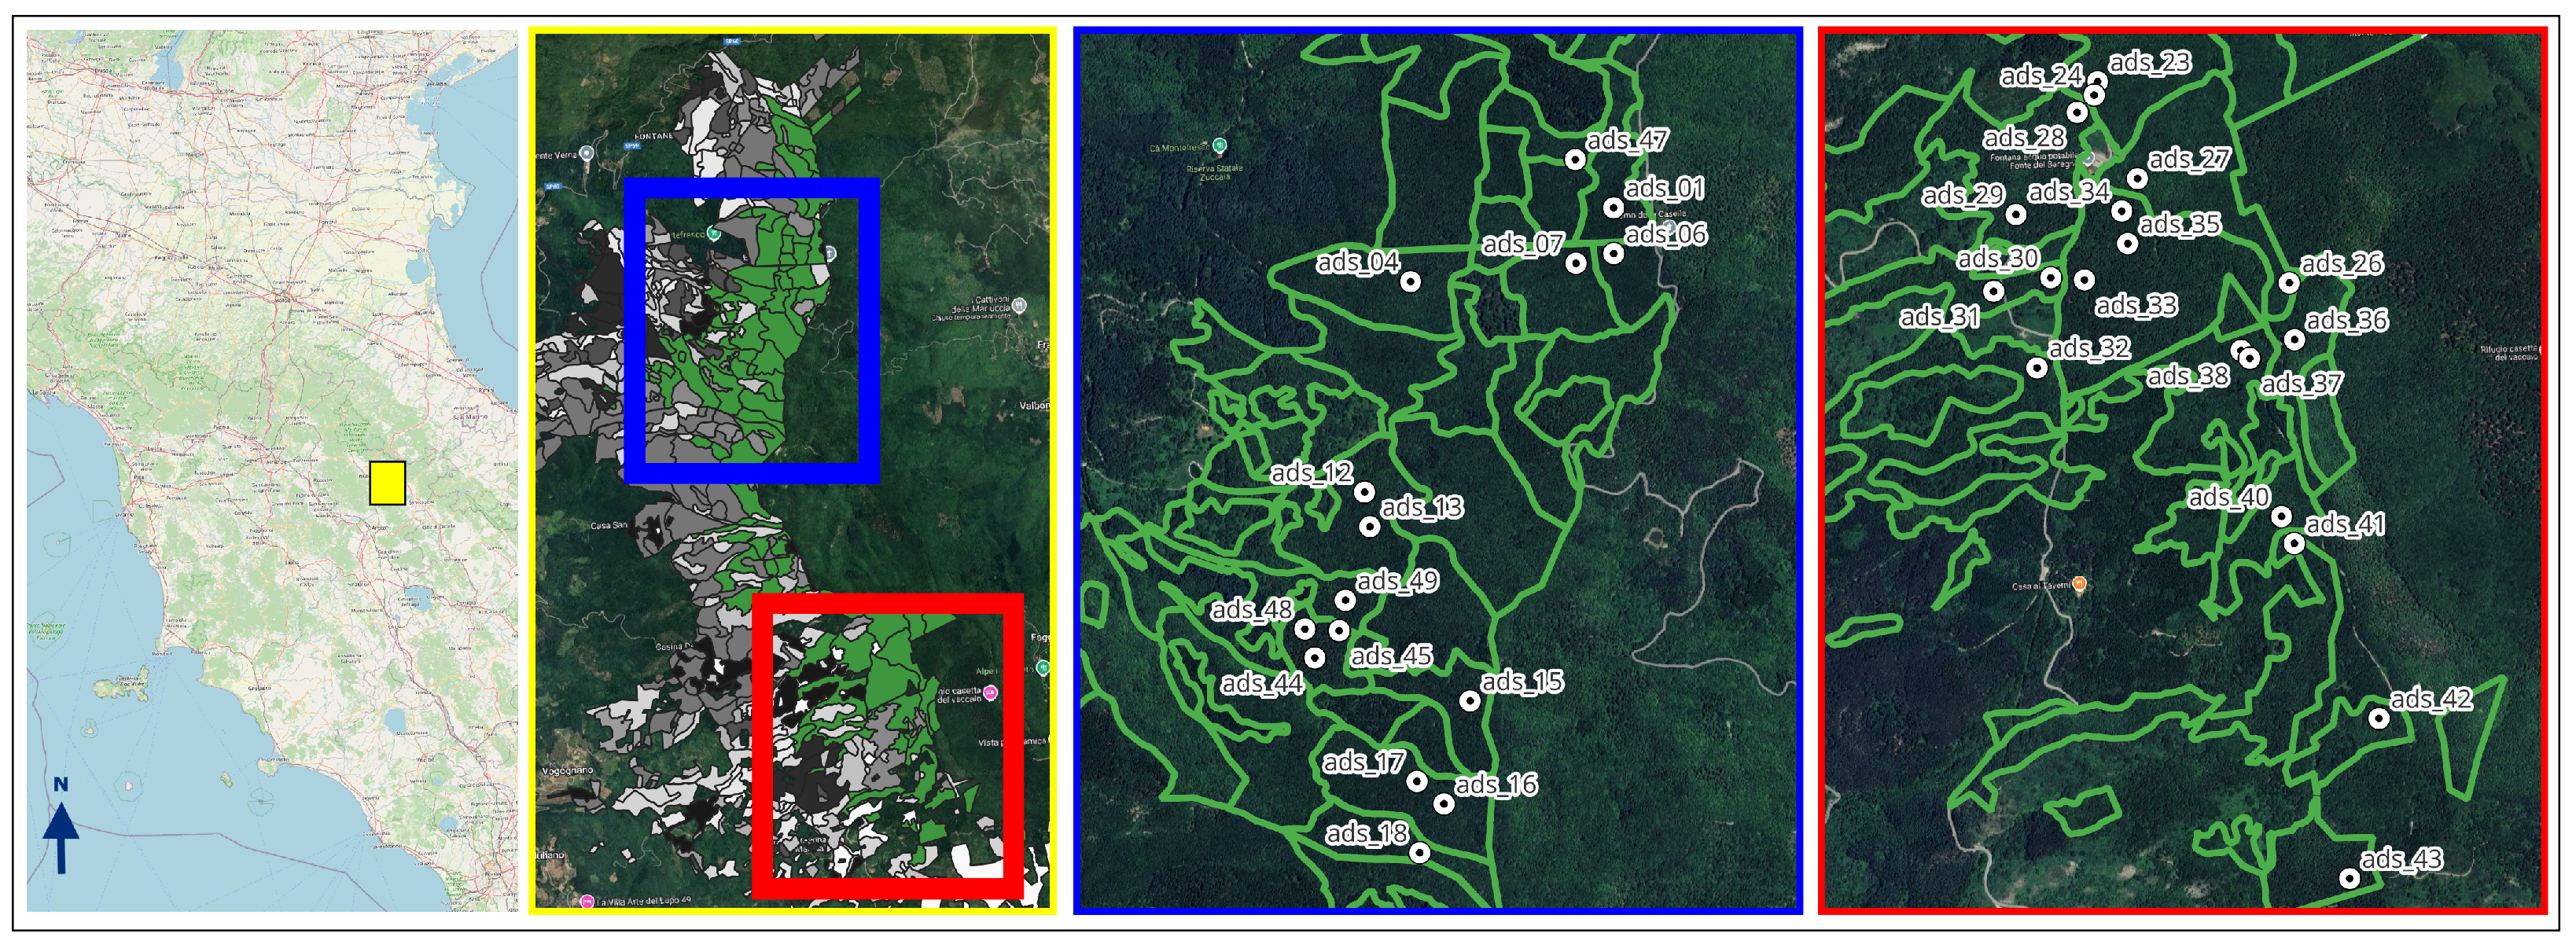
2.1. Study Area and Data Collection

This study was conducted in Alpe di Catenaia, Italy (Figure 1). Terrestrial (TLS) and UAV LiDAR (UAV-LS) data were collected in October–December 2023 across 12 circular sampling plots (15 m radius) in pure beech forest stands with similar climate conditions, soil types, forest structure, and management history [28].
TLS-inventory measurements were conducted by GeoSLAM ZEB-REVO (GeoSLAM Ltd., Ruddington, UK) lightweight mobile laser scanner. It features a rotating 2D scanning device and an inertial measurement unit in the handle body. The system acquires 3D information of the surrounding area using the motion provided by the scanning head on the motor drive, enabling the application of 3D simultaneous location and mapping algorithms [17]. This TLS requires the starting and ending points of the scan process to coincide with some overlaps during the scan path. The centre of each plot was georeferenced using an RTK GPS. Using TLS data, 320 sampling trees were measured following the procedure described in Section 2.2. Forest stand characteristics are summarised in Table 1.
Airborne LiDar data were acquired over a 42 km2 area surrounding the surveyed plots using a Riegl Q680i discrete-return sensor mounted on a Partenavia/Vulcanair P68-Victor aeroplane. The flight, performed on 15 July 2021 at an altitude of 915 m above the ground, used a 400 kHz pulse repetition rate, resulting in an average density of 25 pulses per m2. LiDAR points were first classified into ground and non-ground (vegetation) using the lidR package [32]. A 1 m resolution digital terrain model raster layer was generated by interpolating ground points to normalize the point cloud.
We simultaneously collected UAV-LS data and field measurements over the sampling plots. The UAV-LS LiDAR platform consisted of a DJI Matrice 350 quadcopter integrated with a Zenmuse L1 LiDAR sensor (DJI Inc. in Shenzhen, China), an advanced scanning sensor designed for aerial surveying applications. It integrates a LiDAR module, an RGB camera with a non-full-frame configuration, and an inertial measurement unit (IMU). With a detection range of 450 m under 80% reflectivity conditions, a high point rate of up to 240,000 points per second, and ranging accuracy of 3 cm at a range of 100 m [33,34], the system provides high-quality data. Flights were conducted approximately 55 m above the digital terrain model uploaded to the UAV-LS at a speed of approximately 13 km h−1, resulting in a mean point cloud density of more than 1500 points m−2. Data processing was carried out in Terra® software V4.4.6 which allowed for the drone flight trajectory data to be uploaded, flight paths to be aligned, and for the point cloud to be georeferenced, and then exported in LAS format.
TLS, UAV-LS, and ALS data were aligned by assigning RTK GPS positions to TLS data and using Cloud Compare software (www.cloudcompare.org, version 2.9.1, 2023) [35]. The aligned three-point cloud data (TLS, UAV-LS, ALS) collected over the 12 sampling plots were clipped to the corresponding 15 m radius circles, producing a separate point cloud for each sampling plot. The DBH frequency distribution of the 320 trees sampled from 12 out of the 35 plots is shown in Figure S1 (in red), along with the distribution of the entire tree population from all 35 plots (in black).

2.2. Benchmark: Single Tree QSM to Quantify Volume and AGB

The workflow combines both manual and automatic steps. In the first phase (see Figure 2), Trimble Real Works® software (TRW) version 2024.11 was used for tree segmentation and QSM production. Each segmented tree was then reconstructed through a semi-automatic cylinder-fitting procedure, resembling the traditional approach based on Smalian method for stem volume estimates, using virtual cylinders of about 1 m in length. The total tree volume ( V t r e e , in m3) was computed by summing all the cylinders and then converted to biomass using Equation (1):
A G B t r e e = V t r e e · B E F · W B D
where BEF is the Biomass Expansion Factor, used to expand growing stock volume to the aboveground woody biomass volume, and WBD is the Wood Basal Density, used to convert fresh volume to dry weight (Mg m−3). For beech trees in central Italy BEFBeech = 1.36 and WBDBeech = 0.61 (see Table A2 in [36]).
For each tree, different architectural traits were also measured: (1) total tree height (TH); (2) the surface of the crown at its maximum extension, considered as the crown projection (CrPrj); (3) and the crown volume (CrVol). Such architectural traits were obtained using a set of algorithms developed using functions from ‘lidR’ package [32] following the methodology of Puletti et al. [35], to characterize crown features from the xyz data of each focal tree and its neighbors. First, the original point cloud of each tree was voxelised at a resolution of 25 cm, for a balance between achieving suitable results and minimising computation time. To avoid residual noise in the original point cloud, only voxels containing at least three points were classified as “vegetation” and used to compute single-tree vertical profiles. From the smoothed curve (red-line in Figure 2), the height of the maximum crown projection (Z-peak, in m), crown base height (Z-peak-start, in m) and total tree height (Z-peak-end, in m) were derived. Crown volume (CrVol) was computed as the sum of all vegetation voxels between Z-peak-start and Z-peak-end, while crown projected area (CrPrj) was determined using a 2D convex hull at the maximum crown projection. All these features were identified by analysing the single-tree vertical profile with the findpeaks function from the pracma R-package version: 2.4.4.

2.3. AGB Allometric Modelling Approach

Following a strengthened procedure [38], the general biomass equation for each tree is defined as:
Y = α X β
where Y represents AGB and X is a correlated tree attribute, typically the DBH. In this study, X corresponds to one of the considered crown features (i.e., crown projection or crown volume). To address the heteroscedasticity often present in nonlinear regressions with original scales of measurements [39], the Equation (2) was log transformed:
l n ( Y ) = α 1 + β 1 l n ( X )
AGB of an individual tree was modeled as a function of both crown projected area (CrPrj) and crown volume (CrVol) of the tree, expressed as:
l n ( A G B C r P r j ) = α C r P r j + β C r P r j l n ( C r P r j )
l n ( A G B C r V o l ) = α C r V o l + β C r V o l l n ( C r V o l )
The log-transformation, however, introduced a systematic bias, typically corrected using the following correction factor (CF):
C F = e x p ( S E E 2 / 2 )
where CF is the correction factor, and SEE is the standard error of the estimate, calculated as follows:
S E E = i = 1 n ( l n ( Y i ) l n ( Y i ^ ) ) 2 / ( n 2 )
where n is the number of observations. The final equation for estimating AGB is:
A G B = e α X β C F
where X is either crown projection or crown volume.

2.4. Automatic ITS from ALS and UAV-LS Point Clouds

After the first phase focused on the calibration of AGB modelling using manually measured trees, the second phase tested the performance of automatic algorithms for Individual Tree Segmentation (ITS) in structurally homogeneous broadleaf temperate forests. Cao et al. [26] recently reviewed ITS methods for broadleaf tropical forests with a heterogeneous forest structure, from which the method used by Li et al. [37] was selected for this study. This rule-based ITS algorithm, integrated into the lidR processing packages [32] offers a low cost-benefit ratio in the forest stands measured. Moreover, rather than relying on raster crown height model (CHM), which limits detection to dominant trees, Li et al. [37] analyses point cloud structures and has shown a detection accuracy rate of up to 90% in mixed forests. The same workflow was applied to both UAV-LS and ALS data for comparison (Figure 2). To avoid time-consuming procedures, specific and fixed parameters were established in the ITS algorithm.

2.5. Statistical Analysis

In the first phase (Figure 2), the two previously presented models (Equations (4) and (5)) were evaluated using data from 320 manually segmented beech trees, from the 12 sampling plots (Figure S1). AIC was used as a validation technique to assess model performance with new data. Finally, to evaluate the accuracy of AGB estimates at the plot level, observed and modelled results from the same 12 sampling plots were compared. The model assessment metrics included R2 and RMSE computed using Equation (9) as follows:
R M S E = i = 1 n [ l n ( Y i ) l n ( Y i ) ^ ] 2 n
The second phase (Figure 2) focused on assessing the performance of the selected ITS algorithm [37] for individual tree identification and crown feature extraction aimed at AGB estimation, using ALS and UAV-LS data separately. The tree mapping evaluation was also performed using completeness and correctness. Completeness is a measure of how many of the reference trees were detected by the algorithm, and correctness measures how many of the trees detected by the algorithm were actual reference trees [40]. Finally, the performance of the proposed models was assessed using data extrapolated from the fully automated ITC and crown featuring methods.

3. Results

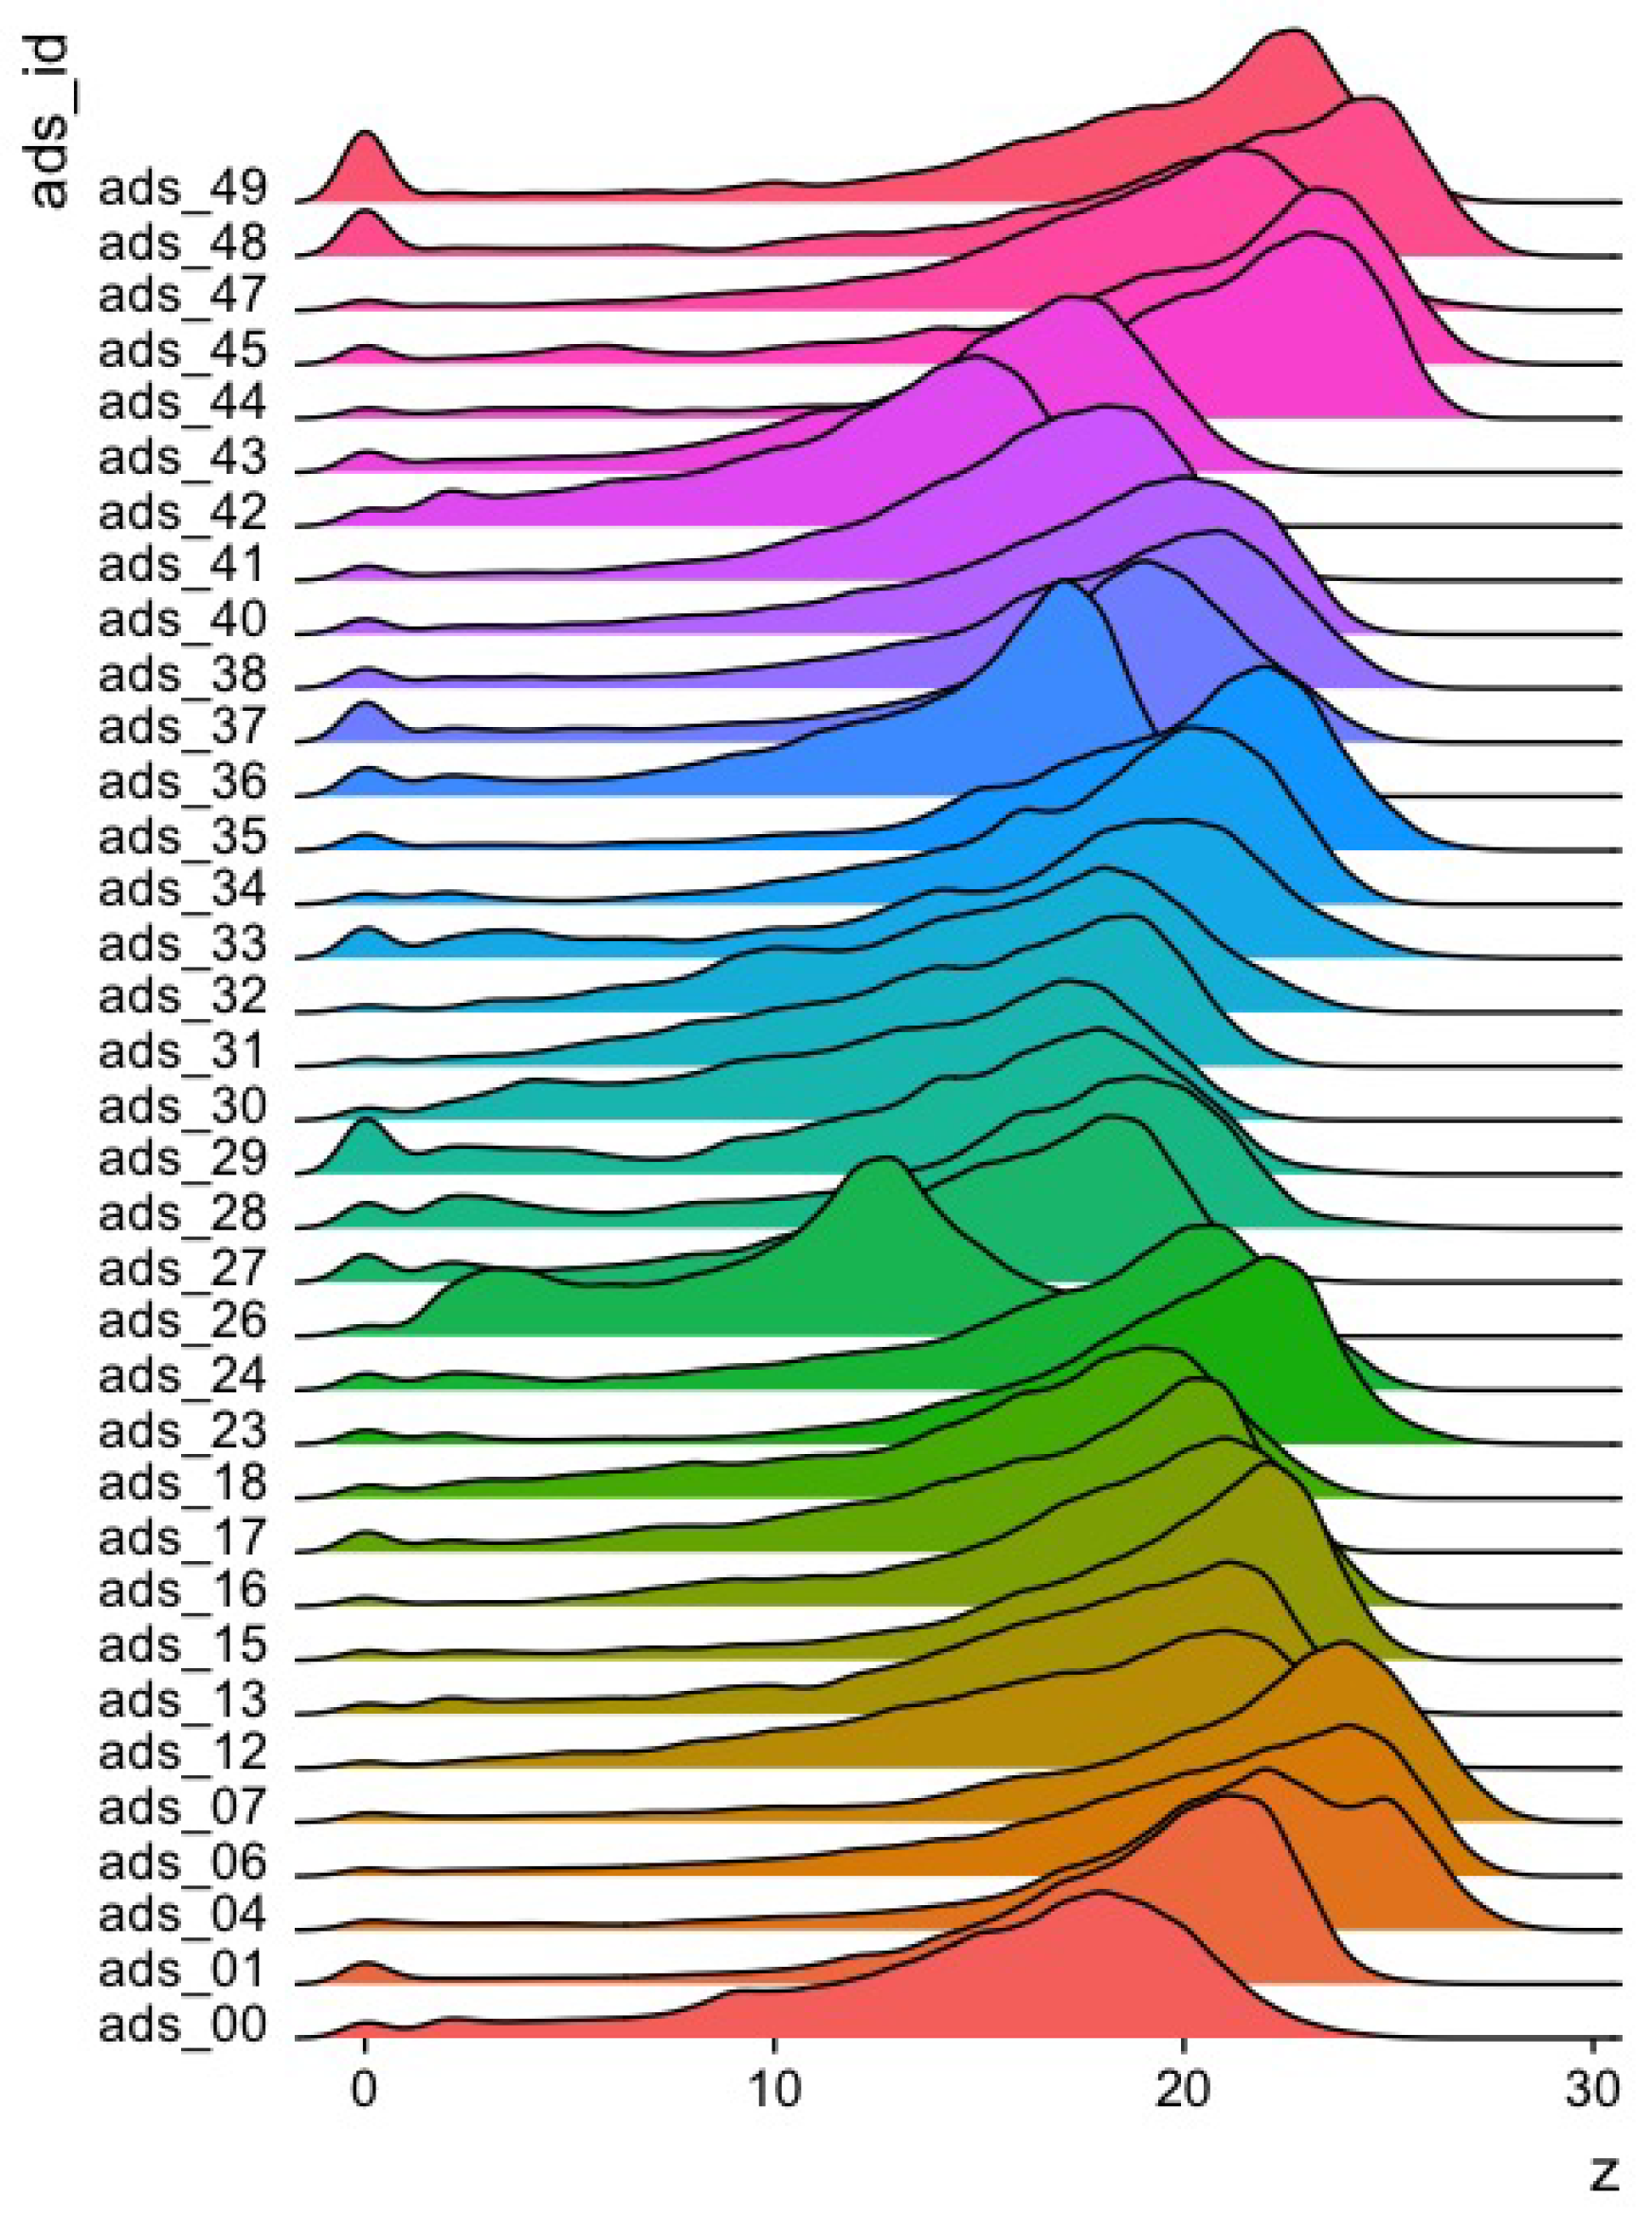
3.1. Phase 1: Crown Features

The process of crown feature extraction (projection and volume) was effective over the 320 manually segmented reference trees. The beta coefficient ( β C r V o l = 0.78 ) obtained from the best model (Equation (5)) representing the metabolic scaling coefficient aligns closely with the theoretical value equal to 0.75.
The 12 sampling plots show significant variability in the crown sizes of the trees. The average crown area is 15.4 m2 (min = 0.2, max = 75.7) with a standard deviation of 13.5 m2, while crown volume has an average of 39.9 m3 (min = 1.8, max = 194.2) with a standard deviation of 36.4 (Figure S2). Pearson correlation coefficients (r) between crown features and traditional tree attributes, such as DBH and total tree height, are consistently below 0.45. However, correlations increase significantly to 0.88 and 0.90 when comparing tree volume with crown projection and crown volume, respectively (Figure 3).

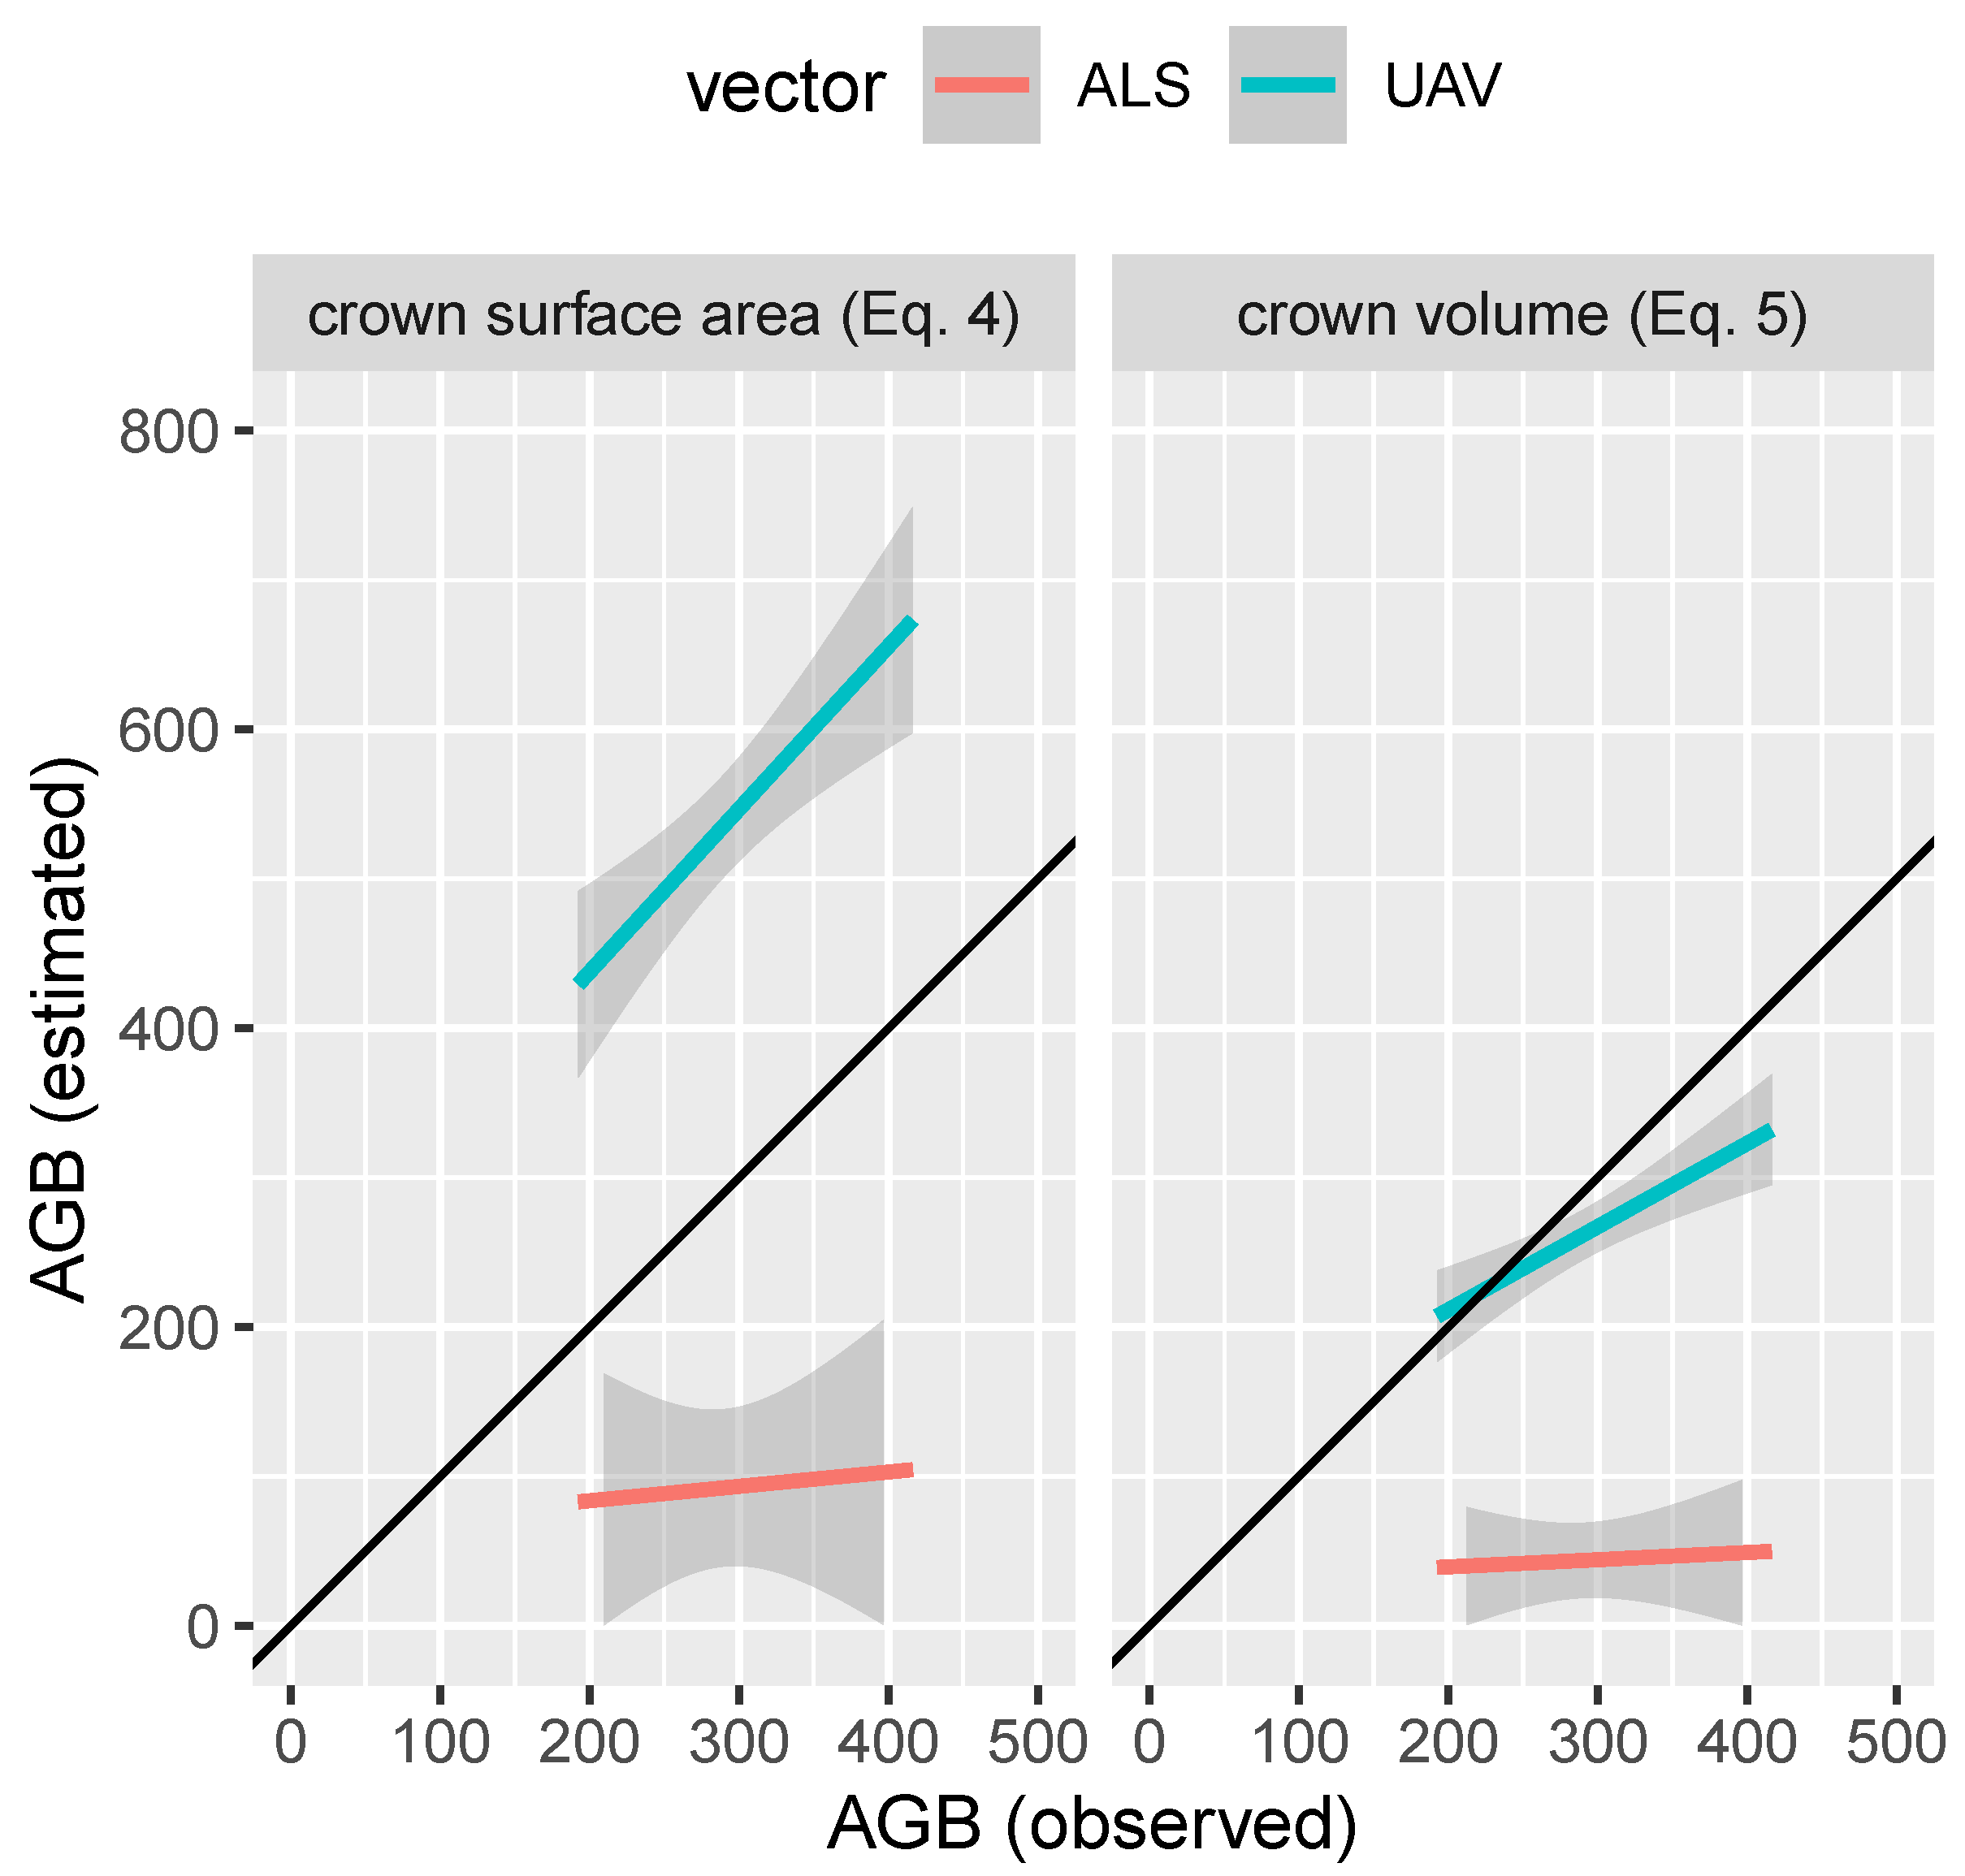
3.2. Phase 1: AGB Model Assessment

The AIC used for tree-level model assessment indicates that the model from Equation (5) (AIC = 364.4) performs slightly better than that from Equation (4) (AIC = 397.9). Although a lower AIC (92.3) can be achieved using both CrPrj and CrVol, the model with CrVol as the only predictor was preferred for simplicity. Using CrVol as the predictor (Equation (5)), we obtained the best result (R2 = 0.74, RMSE = 0.41, RMSE% = 2.9%, Table 2).

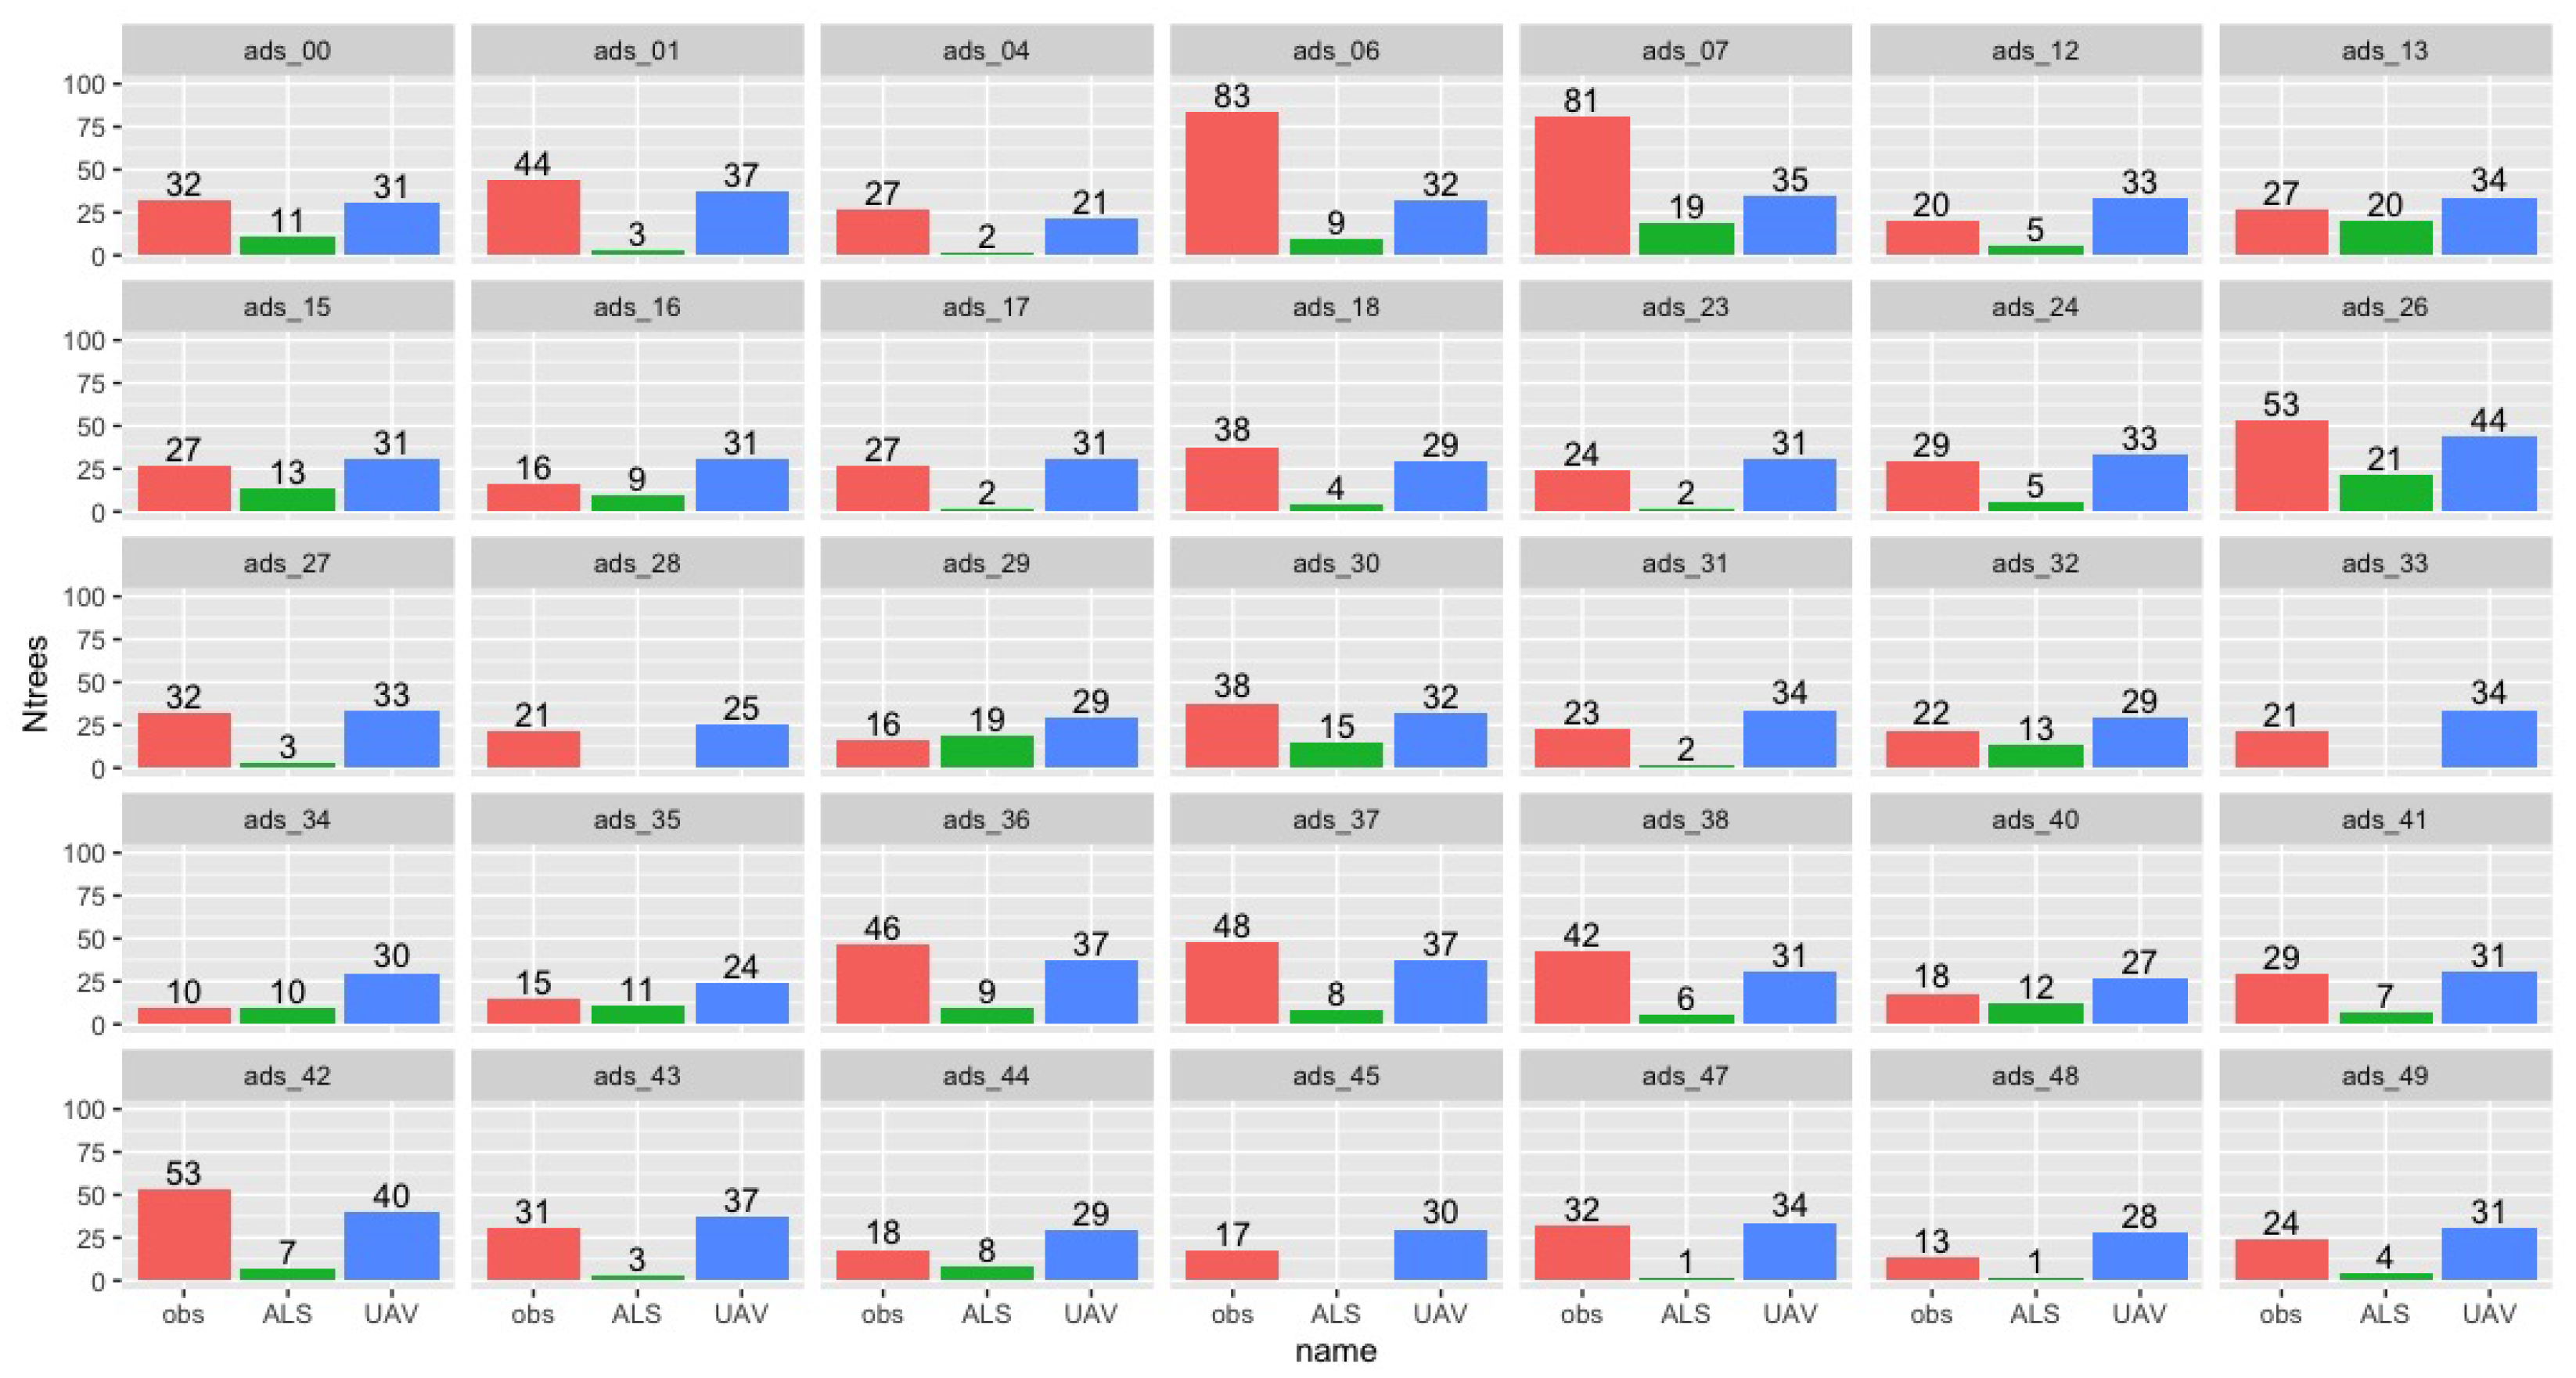
3.3. Phase 2: Individual Tree Detection

Figure 4 (together with Table S1 and Figure S3, see Supplementary Materials) displays results for both ALS and UAV-LS individual tree detection. Under the given conditions, ALS proved to be less effective, consistently performing worse than UAV-LS. ALS fails to detect many trees in several cases (3 out of 35 plots). On the other hand, UAV-LS tends to overestimate tree numbers in less dense forests and underestimate in denser forest conditions (Figure 4). The indices used for ITD assessment (completeness and correctness) exhibit similar patterns, with UAV-LS also showing better performances (Figure 5).

3.4. Phase 2: AGB Estimates from ALS and UAV-LS

Figure 6 shows the results of the fully automatic procedure in estimating AGB under the given conditions. Using the crown surface area and the model from phase 1 (Equation (4)), UAV-LS consistently overestimates AGB with a relatively constant coefficient. On the other hand, ALS always underestimates AGB without Equation (5), ALS results remain less accurate, while UAV-LS data produced more reliable results Figure 6.

4. Discussion

This study demonstrates that tree architectural traits [41] influence the accuracy of AGB estimates from ALS and UAV-LS, regardless of forest mixture or structure, as previously noted in ground-based studies [18,42]. Despite the homogeneous nature of the studied beech forests, we found significant variability in crown sizes among the examined trees, with standard deviations of 13.5 m2; for crown area and 36.4 m3; for crown volume. Reference tree crown dimensions from TLS and UAV-LS are manually defined in CloudCompare, ensuring a realistic representation of 320 standing trees for TLS and 1000 for UAV-LS systems [43]. These segmented trees were modelled using MST allometries [9,37].
When UAV-LS was analysed using the ITS algorithm developed by Li et al. [37] dominated trees were barely detected, achieving only moderate correctness and completeness (~30% for UAV-LS compared to <10% for ALS). For correctly segmented trees, crown height variability is captured by analysing the 3D vertical uniformity distribution (thresholds at the 75th and 95th percentiles) [35]. However, the phenotypic plasticity and deliquescent architecture of beech trees affected the crown-boundary delineation of standing trees in ALS and UAV-LS point clouds, impacting the AGB estimation accuracy Figure 6, as noted in previous studies [44]. Beech trees have relatively wide, spreading crowns that can potentially overestimate biomass, as crown surface area increases with tree age, but the biomass allocation may not always correspond linearly to crown size.
Secondary factors affecting detection include forest stand characteristics (i.e., tree density: maximum 1174 trees ha−1) and competition [35,43]; individual tree architecture (i.e., deliquescent architecture and plasticity in growth forms) [18], and technical aspects such as point cloud occlusion [45,46]. Terrain complexity, particularly in sloped or rugged areas, has been shown to negatively affect the accuracy of single-tree segmentation from airborne LiDAR data [37,47,48,49]. Following previous classifications [44,50], the selected forest sites fall into the moderate-to-difficult complexity forest category (~443 trees ha−1).
High-resolution TLS point clouds enable accurate tree architectural traits reconstruction (CrVol, CrPrj), aligning closely with AGB estimates in the MST-based allometry model (RMSE% = 2.9%). The MST model produced an acceptable beta coefficient for AGB estimates (equal to 0.78) [51]. However, UAV-LS produces more accurate AGB estimates than ALS (Figure 6), likely due to point quality captured by UAV-LS systems, allowing for occlusion handling through penetration and closer proximity to the top canopy [46]. Considering that all forest sites (except ads_26; Figure 7) exhibit mono-layered vertical stratification, the primary factor probably affecting the tree AGB estimation is occlusion caused by large branches overlapping smaller ones, worsened by the incorrect segmentation of nearby crowns.
The incorrect tree segmentation in pure stands is implicit in ITS analysis, especially in the closed-canopy broadleaf stands [26,43]. Previous studies show that ALS-based crown segmentation algorithms achieve accuracies below 30% for Commission I (extra trees detected within crowns) and less than 40% for Commission II (trees detected outside crowns) [44]. Nevertheless, the tree detection method we used [37] achieved an F-score of 0.5 in mixed conifer forests [52] and a 75% detection rate in mixed conifer-broadleaf forests [53], which aligns with our findings. Another challenge in tree detection was the configuration of parameters for 3D forest site analysis, which was time-intensive and site-specific [37].
In this regard, unsupervised algorithms such as DBSCAN (Density-Based Spatial Clustering of Applications with Noise) [45], hierarchical filtering and clustering (HFC) [54], or learning algorithms (i.e., convolutional neural network) [55] could prove more effective in detecting trees. However, the unavailability of these ITC algorithms in R software (https://www.r-project.org/) limits their accessibility for non-expert users. Therefore, developing R packages to integrate these advanced algorithms would be essential for expanding their use in tree detection. AI-based approaches hold promise for future tree detection and segmentation tasks. Once these challenges are addressed, UAV-LS data could enable more frequent, cost-effective updates for AGB monitoring with high resolution [56].
Accurately delineating tree architectural traits can significantly affect the accuracy of AGB estimates from aerial LiDAR systems, especially ALS. As expected, segmenting dominated trees remains a primary challenge in our workflow; however, our findings align closely with those of previous studies [44,50]. Nevertheless, the manually segmented reference trees in Phase 1 provided a robust validation step for the outputs in Phase 2, thanks to the detailed representation of forest plots using point clouds. Integrating aerial with terrestrial LiDAR data may improve detection rates, allowing closer alignment with reference AGB estimates [30]. Implementing the MST to beech trees to capture crown irregularities, regardless of purity [43], requires high-resolution point clouds, which currently limits its application to terrestrial and drone-based LiDAR systems [8,43,57].

5. Conclusions

Quantifying forest aboveground biomass is crucial for climate action and forest management policies. This study confirms that UAV-LS systems, with their high-density point clouds, significantly improve local AGB predictions in homogeneous beech forests compared to ALS. Applying the Metabolic Scaling Theory to beech trees effectively requires high-resolution point clouds, ideally from drone-based LiDAR systems. Although segmenting dominated trees remains challenging, traditional crown measurement methods are time-intensive and prone to errors. Integrating terrestrial and UAV-LiDAR data offers an efficient and promising alternative for accurately capturing tree architecture. These findings underscore the value of UAV-LS data for AGB estimation and demonstrate the potential of precise crown measurements to advance climate and forestry goals. The use of TLS data as reference measurements represents a key advancement for monitoring complex beech forests and improving AGB estimates. Furthermore, when properly aligned with aerial laser scanning data, this integrated approach reduces uncertainties in crown-boundary delineation, particularly in decurrent trees.

Supplementary Materials

The following supporting information can be downloaded at: https://www.mdpi.com/article/10.3390/rs17091497/s1. Table S1: Number of trees detected using automatic segmentation on ALS or UAV-LS (ULS) data. Observed number of trees for each plot were also reported as reference; Figure S1: Distribution of diameters at breast height for the 320 sampled trees (in red) over the entire population; Figure S2: Violin plot of crown volumes distinguished by 12 sampling plots; Figure S3: Number of trees estimated over 35 plots using both ALS and UAV data.

Author Contributions

N.P.: Conceptualization, Project administration, Investigation, Methodology, Formal analysis, Writing—review and editing; S.I.: Data collection, Writing—review and editing; M.G.: Data collection, Writing—review and editing; C.A.: Methodology, Formal analysis, Writing—review and editing; C.F.: Conceptualization, Supervision, Methodology, Formal analysis, Writing—review and editing. All authors have read and agreed to the published version of the manuscript.

Funding

This research was funded with the contribution of the Italian Ministry of Agricultural, Food, and Forestry Policies (MiPAAF) sub-project “Precision Forestry” (AgriDigit program) (DM 36503.7305.2018 of 20 December 2018).

Institutional Review Board Statement

The study was conducted in accordance with the Declaration of Helsinki, and approved by the Ethics Committee of UiT—The Arctic University of Norway (protocol code 14/23 and 7 August 2023).

Informed Consent Statement

Informed consent was obtained from all subjects involved in the study.

Data Availability Statement

The original contributions presented in this study are included in the article/Supplementary Material. Further inquiries can be directed to the corresponding author.

Conflicts of Interest

The authors declare no conflict of interest.

References

  1. Verkerk, P.J.; Fitzgerald, J.B.; Datta, P.; Dees, M.; Hengeveld, G.M.; Lindner, M.; Zudin, S. Spatial distribution of the potential forest biomass availability in Europe. For. Ecosyst. 2019, 6, 5. [Google Scholar] [CrossRef]
  2. Heinrich, V.H.A.; Dalagnol, R.; Cassol, H.L.G.; Rosan, T.M.; De Almeida, C.T.; Silva Junior, C.H.L.; Campanharo, W.A.; House, J.I.; Sitch, S.; Hales, T.C.; et al. Large carbon sink potential of secondary forests in the Brazilian Amazon to mitigate climate change. Nat. Commun. 2021, 12, 1785. [Google Scholar] [CrossRef] [PubMed]
  3. Tabacchi, G.; Di Cosmo, L.; Gasparini, P. Aboveground tree volume and phytomass prediction equations for forest species in Italy. Eur. J. For. Res. 2011, 130, 911–934. [Google Scholar] [CrossRef]
  4. Liu, Z.; Zhang, X.; Wu, Y.; Xu, Y.; Cao, Z.; Yu, Z.; Feng, Z.; Luo, H.; Lu, C.; Wang, W.; et al. LiDAR-based individual tree AGB modeling of Pinus kesiya var. langbianensis by incorporating spatial structure. Ecol. Indic. 2024, 169, 112973. [Google Scholar] [CrossRef]
  5. Song, X.; Li, J.; Zeng, X. Parameterization of height–diameter and crown radius–diameter relationships across the globe. J. Plant Ecol. 2024, 17, rtae005. [Google Scholar] [CrossRef]
  6. Ploton, P.; Mortier, F.; Réjou-Méchain, M.; Barbier, N.; Picard, N.; Rossi, V.; Dormann, C.; Cornu, G.; Viennois, G.; Bayol, N.; et al. Spatial validation reveals poor predictive performance of large-scale ecological mapping models. Nat. Commun. 2020, 11, 4540. [Google Scholar] [CrossRef]
  7. Xu, D.; Wang, H.; Xu, W.; Luan, Z.; Xu, X. LiDAR Applications to Estimate Forest Biomass at Individual Tree Scale: Opportunities, Challenges and Future Perspectives. Forests 2021, 12, 550. [Google Scholar] [CrossRef]
  8. Owen, H.J.F.; Flynn, W.R.M.; Lines, E.R. Competitive drivers of interspecific deviations of crown morphology from theoretical predictions measured with Terrestrial Laser Scanning. J. Ecol. 2021, 109, 2612–2628. [Google Scholar] [CrossRef]
  9. Pretzsch, H.; Dieler, J. Evidence of variant intra- and interspecific scaling of tree crown structure and relevance for allometric theory. Oecologia 2012, 169, 637–649. [Google Scholar] [CrossRef]
  10. Jenkins, J.C.; Chojnacky, D.C.; Heath, L.S.; Birdsey, R.A. National-Scale Biomass Estimators for United States Tree Species. For. Sci. 2003, 49, 12–35. [Google Scholar] [CrossRef]
  11. Picard, N.; Saint-André, L.; Henry, M. Manual for Building Tree Volume and Biomass Allometric Equations: From Field Measurement to Prediction; Food and Agricultural Organization of the United Nations: Rome, Italy; Centre de Coopération Internationale en Recherche Agronomique pour le Développement: Montpellier, France, 2012; 215p. [Google Scholar]
  12. Chave, J.; Réjou-Méchain, M.; Búrquez, A.; Chidumayo, E.; Colgan, M.S.; Delitti, W.B.; Duque, A.; Eid, T.; Fearnside, P.M.; Goodman, R.C.; et al. Improved allometric models to estimate the aboveground biomass of tropical trees. Glob. Change Biol. 2014, 20, 3177–3190. [Google Scholar] [CrossRef]
  13. Calders, K.; Verbeeck, H.; Burt, A.; Origo, N.; Nightingale, J.; Malhi, Y.; Wilkes, P.; Raumonen, P.; Bunce, R.G.H.; Disney, M. Laser scanning reveals potential underestimation of biomass carbon in temperate forest. Ecol. Solut. Evid. 2022, 3, e12197. [Google Scholar] [CrossRef]
  14. Di Salvatore, U.; Marchi, M.; Cantiani, P. Single-tree crown shape and crown volume models for Pinus nigra J. F. Arnold in central Italy. Ann. For. Sci. 2021, 78, 76. [Google Scholar] [CrossRef]
  15. Brede, B.; Calders, K.; Lau, A.; Raumonen, P.; Bartholomeus, H.M.; Herold, M.; Kooistra, L. Non-destructive tree volume estimation through quantitative structure modelling: Comparing UAV laser scanning with terrestrial LIDAR. Remote Sens. Environ. 2019, 233, 111355. [Google Scholar] [CrossRef]
  16. Calders, K.; Newnham, G.; Burt, A.; Murphy, S.; Raumonen, P.; Herold, M.; Culvenor, D.; Avitabile, V.; Disney, M.; Armston, J.; et al. Nondestructive estimates of above-ground biomass using terrestrial laser scanning. Methods Ecol. Evol. 2015, 6, 198–208. [Google Scholar] [CrossRef]
  17. Puletti, N.; Grotti, M.; Ferrara, C.; Chianucci, F. Lidar-based estimates of aboveground biomass through ground, aerial, and satellite observation: A case study in a Mediterranean forest. J. Appl. Remote Sens. 2020, 14, 044501. [Google Scholar] [CrossRef]
  18. Pretzsch, H. Tree growth as affected by stem and crown structure. Trees 2021, 35, 947–960. [Google Scholar] [CrossRef]
  19. Brede, B.; Terryn, L.; Barbier, N.; Bartholomeus, H.M.; Bartolo, R.; Calders, K.; Derroire, G.; Krishna Moorthy, S.M.; Lau, A.; Levick, S.R.; et al. Non-destructive estimation of individual tree biomass: Allometric models, terrestrial and UAV laser scanning. Remote Sens. Environ. 2022, 280, 113180. [Google Scholar] [CrossRef]
  20. Brosofske, K.D.; Froese, R.E.; Falkowski, M.J.; Banskota, A. A Review of Methods for Mapping and Prediction of Inventory Attributes for Operational Forest Management. For. Sci. 2014, 60, 733–756. [Google Scholar] [CrossRef]
  21. Shao, G.; Shao, G.; Gallion, J.; Saunders, M.R.; Frankenberger, J.R.; Fei, S. Improving Lidar-based aboveground biomass estimation of temperate hardwood forests with varying site productivity. Remote Sens. Environ. 2018, 204, 872–882. [Google Scholar] [CrossRef]
  22. Chirici, G.; Giannetti, F.; McRoberts, R.E.; Travaglini, D.; Pecchi, M.; Maselli, F.; Chiesi, M.; Corona, P. Wall-to-wall spatial prediction of growing stock volume based on Italian National Forest Inventory plots and remotely sensed data. Int. J. Appl. Earth Obs. Geoinf. 2020, 84, 101959. [Google Scholar] [CrossRef]
  23. Næsset, E. Practical large-scale forest stand inventory using a small-footprint airborne scanning laser. Scand. J. For. Res. 2004, 19, 164–179. [Google Scholar] [CrossRef]
  24. Shao, J.; Yao, W.; Wan, P.; Luo, L.; Wang, P.; Yang, L.; Lyu, J.; Zhang, W. Efficient co-registration of UAV and ground LiDAR forest point clouds based on canopy shapes. Int. J. Appl. Earth Obs. Geoinf. 2022, 114, 103067. [Google Scholar] [CrossRef]
  25. Shao, G.; Fei, S.; Shao, G. A Robust Stepwise Clustering Approach to Detect Individual Trees in Temperate Hardwood Plantations using Airborne LiDAR Data. Remote Sens. 2023, 15, 1241. [Google Scholar] [CrossRef]
  26. Cao, Y.; Ball, J.G.; Coomes, D.A.; Steinmeier, L.; Knapp, N.; Wilkes, P.; Disney, M.; Calders, K.; Burt, A.; Lin, Y.; et al. Benchmarking airborne laser scanning tree segmentation algorithms in broadleaf forests shows high accuracy only for canopy trees. Int. J. Appl. Earth Obs. Geoinf. 2023, 123, 103490. [Google Scholar] [CrossRef]
  27. Wang, Z.; Menenti, M. Challenges and Opportunities in Lidar Remote Sensing. Front. Remote Sens. 2021, 2, 641723. [Google Scholar] [CrossRef]
  28. Puletti, N.; Innocenti, S.; Guasti, M. A co-registration approach between terrestrial and UAV laser scanning point clouds based on ground and trees features. Ann. Silvic. Res. 2024, 49, 4466. [Google Scholar] [CrossRef]
  29. Torresan, C.; Berton, A.; Carotenuto, F.; Di Gennaro, S.F.; Gioli, B.; Matese, A.; Miglietta, F.; Vagnoli, C.; Zaldei, A.; Wallace, L. Forestry applications of UAVs in Europe: A review. Int. J. Remote Sens. 2017, 38, 2427–2447. [Google Scholar] [CrossRef]
  30. Alvites, C.; Marchetti, M.; Lasserre, B.; Santopuoli, G. LiDAR as a Tool for Assessing Timber Assortments: A Systematic Literature Review. Remote Sens. 2022, 14, 4466. [Google Scholar] [CrossRef]
  31. Georgi, L.; Kunz, M.; Fichtner, A.; Härdtle, W.; Reich, K.F.; Sturm, K.; Welle, T.; Oheimb, G.V. Long-Term Abandonment of Forest Management Has a Strong Impact on Tree Morphology and Wood Volume Allocation Pattern of European Beech (Fagus sylvatica L.). Forests 2018, 9, 704. [Google Scholar] [CrossRef]
  32. Roussel, J.R.; Auty, D.; Coops, N.C.; Tompalski, P.; Goodbody, T.R.; Meador, A.; Bourdon, J.; De Boissieu, F.; Achim, A. lidR: An R package for analysis of Airborne Laser Scanning (ALS) data. Remote Sens. Environ. 2020, 251, 112061. [Google Scholar] [CrossRef]
  33. Diara, F.; Roggero, M. Quality Assessment of DJI Zenmuse L1 and P1 LiDAR and Photogrammetric Systems: Metric and Statistics Analysis with the Integration of Trimble SX10 Data. Geomatics 2022, 2, 254–281. [Google Scholar] [CrossRef]
  34. Štroner, M.; Urban, R.; Línková, L. A New Method for UAV Lidar Precision Testing Used for the Evaluation of an Affordable DJI ZENMUSE L1 Scanner. Remote Sens. 2021, 13, 4811. [Google Scholar] [CrossRef]
  35. Puletti, N.; Guasti, M.; Innocenti, S.; Cesaretti, L.; Chiavetta, U. A Semi-Automatic Approach for Tree Crown Competition Indices Assessment From UAV LiDAR. Remote Sens. 2024, 16, 2576. [Google Scholar] [CrossRef]
  36. Marino, D.; Palmieri, M.; Marucci, A.; Tufano, M. Comparison between Demand and Supply of Some Ecosystem Services in National Parks: A Spatial Analysis Conducted Using Italian Case Studies. Conservation 2021, 1, 36–57. [Google Scholar] [CrossRef]
  37. Li, W.; Guo, Q.; Jakubowski, M.K.; Kelly, M. A New Method for Segmenting Individual Trees from the Lidar Point Cloud. Photogramm. Eng. Remote Sens. 2012, 78, 75–84. [Google Scholar] [CrossRef]
  38. He, H.; Zhang, C.; Zhao, X.; Fousseni, F.; Wang, J.; Dai, H.; Yang, S.; Zuo, Q. Allometric biomass equations for 12 tree species in coniferous and broadleaved mixed forests, Northeastern China. PLoS ONE 2018, 13, e0186226. [Google Scholar] [CrossRef]
  39. Packard, G.C.; Birchard, G.F.; Boardman, T.J. Fitting statistical models in bivariate allometry. Biol. Rev. 2010, 86, 549–563. [Google Scholar] [CrossRef]
  40. Laino, D.; Cabo, C.; Prendes, C.; Janvier, R.; Ordonez, C.; Nikonovas, T.; Doerr, S.; Santin, C. 3DFin: A software for automated 3D forest inventories from terrestrial point clouds. For. Int. J. For. Res. 2024, 97, 479–496. [Google Scholar] [CrossRef]
  41. Dorji, Y.; Annighöfer, P.; Ammer, C.; Seidel, D. Response of Beech (Fagus sylvatica L.) Trees to Competition—New Insights from Using Fractal Analysis. Remote Sens. 2019, 11, 2656. [Google Scholar] [CrossRef]
  42. Penanhoat, A.; Guerrero Ramirez, N.; Aubry-Kientz, M.; Diekmann, L.; Paligi, S.; Audisio, M.; Mrak, K.; Seidel, D. Effect of competition intensity and neighbor identity on architectural traits of Fagus sylvatica. Trees 2024, 38, 1177–1187. [Google Scholar] [CrossRef]
  43. Barbeito, I.; Dassot, M.; Bayer, D.; Collet, C.; Drössler, L.; Löf, M.; Del Rio, M.; Ruiz-Peinado, R.; Forrester, D.I.; Bravo-Oviedo, A.; et al. Terrestrial laser scanning reveals differences in crown structure of Fagus sylvatica in mixed vs. pure European forests. For. Ecol. Manag. 2017, 405, 381–390. [Google Scholar] [CrossRef]
  44. Wang, Y.; Hyyppa, J.; Liang, X.; Kaartinen, H.; Yu, X.; Lindberg, E.; Holmgren, J.; Qin, Y.; Mallet, C.; Ferraz, A.; et al. International Benchmarking of the Individual Tree Detection Methods for Modeling 3-D Canopy Structure for Silviculture and Forest Ecology Using Airborne Laser Scanning. IEEE Trans. Geosci. Remote Sens. 2016, 54, 5011–5027. [Google Scholar] [CrossRef]
  45. Alvites, C.; Santopuoli, G.; Maesano, M.; Chirici, G.; Moresi, F.V.; Tognetti, R.; Marchetti, M.; Lasserre, B. Unsupervised algorithms to detect single trees in a mixed-species and multilayered Mediterranean forest using LiDAR data. Can. J. For. Res. 2021, 51, 1766–1780. [Google Scholar] [CrossRef]
  46. Bruggisser, M.; Hollaus, M.; Kükenbrink, D.; Pfeifer, N. Comparison of forest structure metrics derived from uav lidar and als data. ISPRS Ann. Photogramm. Remote Sens. Spat. Inf. Sci. 2019, 4, 325–332. [Google Scholar] [CrossRef]
  47. Koch, B.; Heyder, U.; Weinacker, H. Detection of Individual Tree Crowns in Airborne Lidar Data. Photogramm. Eng. Remote Sens. 2006, 72, 357–363. [Google Scholar] [CrossRef]
  48. Yao, W.; Krzystek, P.; Heurich, M. Tree species classification and estimation of stem volume and DBH based on single tree extraction by exploiting airborne full-waveform LiDAR data. Remote Sens. Environ. 2012, 123, 368–380. [Google Scholar] [CrossRef]
  49. Zhen, Z.; Quackenbush, L.; Zhang, L. Trends in Automatic Individual Tree Crown Detection and Delineation—Evolution of LiDAR Data. Remote Sens. 2016, 8, 333. [Google Scholar] [CrossRef]
  50. Liang, X.; Hyyppä, J.; Kaartinen, H.; Lehtomäki, M.; Pyörälä, J.; Pfeifer, N.; Holopainen, M.; Brolly, G.; Francesco, P.; Hackenberg, J.; et al. International benchmarking of terrestrial laser scanning approaches for forest inventories. ISPRS J. Photogramm. Remote Sens. 2018, 144, 137–179. [Google Scholar] [CrossRef]
  51. Lin, Y.; Berger, U.; Grimm, V.; Huth, F.; Weiner, J. Plant Interactions Alter the Predictions of Metabolic Scaling Theory. PLoS ONE 2013, 8, e57612. [Google Scholar] [CrossRef]
  52. Pirotti, F.; Paterno, C.; Pividori, M. Application of tree detection methods over lidar data for forest volume estimation. Int. Arch. Photogramm. Remote Sens. Spat. Inf. Sci. 2020, 43, 1055–1060. [Google Scholar] [CrossRef]
  53. Torresan, C.; Carotenuto, F.; Chiavetta, U.; Miglietta, F.; Zaldei, A.; Gioli, B. Individual Tree Crown Segmentation in Two-Layered Dense Mixed Forests from UAV LiDAR Data. Drones 2020, 4, 10. [Google Scholar] [CrossRef]
  54. Zhang, C.; Song, C.; Zaforemska, A.; Zhang, J.; Gaulton, R.; Dai, W.; Xiao, W. Individual tree segmentation from UAS Lidar data based on hierarchical filtering and clustering. Int. J. Digit. Earth 2024, 17, 2356124. [Google Scholar] [CrossRef]
  55. Straker, A.; Puliti, S.; Breidenbach, J.; Kleinn, C.; Pearse, G.; Astrup, R.; Magdon, P. Instance segmentation of individual tree crowns with YOLOv5: A comparison of approaches using the ForInstance benchmark LiDAR dataset. ISPRS Open J. Photogramm. Remote Sens. 2023, 9, 100045. [Google Scholar] [CrossRef]
  56. Fassnacht, F.E.; Mager, C.; Waser, L.T.; Kanjir, U.; Schäfer, J.; Buhvald, A.; Shafeian, E.; Schiefer, F.; Stančič, L.; Immitzer, M.; et al. Forest practitioners’ requirements for remote sensing-based canopy height, wood-volume, tree species, and disturbance products. For. Int. J. For. Res. 2024, 98, 233–252. [Google Scholar] [CrossRef]
  57. Martin-Ducup, O.; Ploton, P.; Barbier, N.; Momo Takoudjou, S.; Mofack, G.; Kamdem, N.G.; Fourcaud, T.; Sonké, B.; Couteron, P.; Pélissier, R. Terrestrial laser scanning reveals convergence of tree architecture with increasingly dominant crown canopy position. Funct. Ecol. 2020, 34, 2442–2452. [Google Scholar] [CrossRef]
Figure 1. Map of the study area showing the location of the sampling sites. The colored squares highlight the two zoomed-in sites: blue for the northern site and red for the southern site.
Remotesensing 17 01497 g001
Figure 2. Processing workflow. In the first phase (upper panel) 12 sampling plots among 35 measured were processed. QSMs for more than 300 trees were obtained from manual segmentation. Vertical Profiles Features (VPFs) were derived from voxelised point clouds of each sampled tree. The outputs of this first phase are: (i) plot-level AGB (used as reference for phase 2), and (ii) AGB based on VPFs model. In the second phase (right panel), two fully automatic procedures were compared using UAV-LS and ALS data from all 35 sampling plots measured over the study area. Single trees were automatically identified and segmented using a well-established approach. AGB was estimated using the AGBṼPFs model created in phase 1. Finally, the estimated values of different procedures were compared for evaluation. Li et al. 2012 in the box refers to [37].
Remotesensing 17 01497 g002
Figure 3. Scatterplot and linear regression results between crown volume and aboveground biomass of the 320 sampled trees.
Remotesensing 17 01497 g003
Figure 4. Number of trees observed over 35 plots and estimated using both ALS and UAV point clouds by automatic segmentation.
Remotesensing 17 01497 g004
Figure 5. Distributions of completeness and correctness over 35 plots from both ALS and UAV data.
Remotesensing 17 01497 g005
Figure 6. Estimated AGB by both equation Equations (4) and (5) and with different LiDAR vectors (ALS (red) and UAV-LS (green)).
Remotesensing 17 01497 g006
Figure 7. Vertical profiles of 35 sampling plots, as derived from UAV-LS point clouds. The x-axis is the height above the ground, y-axis of each sub-plot is the point density at different height. With few exceptions (e.g., ads 26), the distribution is unimodal from the ground to the top of the canopy.
Remotesensing 17 01497 g007
Table 1. Stand characteristics based on trees manually isolated in the Terrestrial Laser Scanning (TLS) point cloud. Volume was derived from Quantitative Structure Models (QSMs). N ha−1 is the number of trees per hectare; DBH is the diameter at breast height; TH is the total tree height.
MeanSt. Dev.MinMax
N ha−1443.4239.1141.51174.2
DBH  (cm)34.96.64.085.0
TH (m)14.14.02.926.4
tree volume (m3)282.190.7152.4474.8
Table 2. Observed and estimated aboveground biomass (Mg ha-1) obtained by the application of the automatic ITD approach [37] using ALS or UAV-LS data, over the 12 sampling plots. The implementation of both Equation (4), with crown surface area (crown prj) as predictor, and Equation (5), with crown volume (crown vol) as predictor, are presented.
Crown prj
(Equation (4))
Crown vol
(Equation (5))
ads idobsALSUAV-LSALSUAV-LS
ads 07416227.0744106.0364
ads 1631680.758537.3285
ads 26192178.045482.5213
ads 29282217.0515102.0250
ads 3128123.350010.9240
ads 3420171.948832.8236
ads 35248130.042961.0208
ads 3736766.066230.3320
ads 4131563.057029.1277
ads 4324619.55238.8251
ads 483564.64972.0241
ads 4926123.648610.6233
Disclaimer/Publisher’s Note: The statements, opinions and data contained in all publications are solely those of the individual author(s) and contributor(s) and not of MDPI and/or the editor(s). MDPI and/or the editor(s) disclaim responsibility for any injury to people or property resulting from any ideas, methods, instructions or products referred to in the content.

