Article

Limitations of Polar-Orbiting Satellite Observations in Capturing the Diurnal Variability of Tropospheric NO2: A Case Study Using TROPOMI, GOME-2C, and Pandora Data

by
Yichen Li
1,2,
Chao Yu
1,*,
Jing Fan
1,2,
Meng Fan
1,
Ying Zhang
1,
Jinhua Tao
1 and
Liangfu Chen
1,2
1
State Key Laboratory of Remote Sensing and Digital Earth, Aerospace Information Research Institute, Chinese Academy of Sciences, Beijing 100101, China
2
University of Chinese Academy of Sciences, Beijing 100049, China
*
Author to whom correspondence should be addressed.
Remote Sens. 2025, 17(16), 2846; https://doi.org/10.3390/rs17162846
Submission received: 3 July 2025 / Revised: 2 August 2025 / Accepted: 13 August 2025 / Published: 15 August 2025

Abstract

Nitrogen dioxide (NO2) plays a crucial role in environmental processes and public health. In recent years, NO2 pollution has been monitored using a combination of in situ measurements and satellite remote sensing, supported by the development of advanced retrieval algorithms. With advancements in satellite technology, large-scale NO2 monitoring is now feasible through instruments such as GOME-2C and TROPOMI. However, the fixed local overpass times of polar-orbiting satellites limit their ability to capture the complete diurnal cycle of NO2, introducing uncertainties in emission estimation and pollution trend analysis. In this study, we evaluated differences in NO2 observations between GOME-2C (morning overpass at ~09:30 LT) and TROPOMI (afternoon overpass at ~13:30 LT) across three representative regions—East Asia, Central Africa, and Europe—that exhibit distinct emission sources and atmospheric conditions. By comparing satellite-derived tropospheric NO2 column densities with ground-based measurements from the Pandora network, we analyzed spatial distribution patterns and seasonal variability in NO2 concentrations. Our results show that East Asia experiences the highest NO2 concentrations in densely populated urban and industrial areas. During winter, lower boundary layer heights and weakened photolysis processes lead to stronger accumulation of NO2 in the morning. In Central Africa, where biomass burning is the dominant emission source, afternoon fire activity is significantly higher, resulting in a substantial difference (1.01 × 10¹⁶ molecules/cm2) between GOME-2C and TROPOMI observations. Over Europe, NO2 pollution is primarily concentrated in Western Europe and along the Mediterranean coast, with seasonal peaks in winter. In high-latitude regions, weaker solar radiation limits the photochemical removal of NO2, causing concentrations to continue rising into the afternoon. These findings demonstrate that differences in polar-orbiting satellite overpass times can significantly affect the interpretation of daily NO2 variability, especially in regions with strong diurnal emissions or meteorological patterns. This study highlights the observational limitations of fixed-time satellites and offers an important reference for the future development of geostationary satellite missions, contributing to improved strategies for NO2 pollution monitoring and control.

1. Introduction

Nitrogen dioxide (NO2) is a key trace gas with significant implications for environmental issues and public health. As a major component of air quality, NO2 contributes to the formation of ozone and secondary aerosols, leading to photochemical pollution, acid rain, and other environmental problems [1,2]. Its presence in the atmosphere is primarily due to anthropogenic sources, such as vehicular emissions, fossil fuel combustion, and industrial activities, although natural sources like lightning and soil emissions also contribute to its variability [3,4]. Most of the NO2 in the atmosphere is generated by the rapid oxidation of NO by O3. Meanwhile, photolysis decomposes NO2 into NO and O atoms, which participate in other complex oxidation reactions and pose a threat to the ecological environment [5,6]. Therefore, accurate monitoring of NO2 is crucial for understanding air quality and evaluating emission control strategies [7].
Both ground-based and satellite remote sensing techniques have been extensively used for NO2 observations. Ground-based methods, such as the Pandora monitoring network, MAX-DOAS, and the Network for the Detection of Atmospheric Composition Change (NDACC), are well-developed, offering high temporal resolution and precise column measurements at fixed locations globally, which cover high pollution and pure areas. Ground-based datasets can also provide confident monitoring data for satellite validation to evaluate the capability of satellite monitoring [8,9,10]. However, their limited locations restrict a wide range of observations.
Instruments aboard polar-orbiting satellites provide extensive spatial coverage, enabling both regional and global monitoring of NO2 distributions. The first sensor capable of monitoring global NO2 was the Global Ozone Monitoring Experiment (GOME), launched in 1995, which featured spatial resolutions of 320 km × 40 km and 40 km × 40 km [11]. Another early instrument, the Scanning Imaging Absorption Spectrometer for Atmospheric Chartography (SCIAMACHY), was launched on board ENVISAT and operated from 2002 to 2012 [12,13]. Currently, operational instruments capable of global gas monitoring include the second instrument in the GOME series (GOME-2) with a resolution of 40 km × 40 km [14,15], the Ozone Monitoring Instrument (OMI) with a resolution of 13 km × 24 km [16], the TROPospheric Ozone Monitoring Instrument (TROPOMI) with a resolution of 3.5 km × 5.5 km [17,18], and the Environmental Trace Gases Monitoring Instrument (EMI) with a resolution of 13 km × 48 km [19,20]. In recent years, geostationary satellites have emerged as complementary tools for atmospheric NO2 monitoring, offering unprecedented temporal resolution through hourly observations over fixed regions. Instruments such as the Geostationary Environmental Monitoring Spectrometer (GEMS) [21], launched in February 2020 over East Asia, the Tropospheric Emissions: Monitoring of Pollution (TEMPO) over North America, and the upcoming Sentinel-4 over Europe are specifically designed for high-frequency air quality observations [22].
Several NO2 products have been retrieved from these instruments, providing valuable observations through continuous algorithm updates [23,24,25]. These products have been widely applied in atmospheric remote sensing studies, including emission estimation, near-surface NO2 calculations, and spatial-temporal analysis. In particular, OMI, TROPOMI, and GOME-2C NO2 observations have been extensively used to monitor NOX emissions in both urban and rural areas, offering valuable insights into anthropogenic sources [26,27,28,29]. These observations have also facilitated trend analysis of tropospheric NO2 [28,30] and have been applied to support epidemiological studies and inform air quality policy decisions [31,32,33,34].
Regionally, various studies have employed satellite NO2 observations to investigate pollution patterns and their driving mechanisms. Long-term monitoring and data fusion techniques have been used to assess ambient NO2 concentrations and associated health effects [31]. Liu et al. analyzed the decline and rebound of NO2 during COVID-19, linking observed variations to changes in human activities [29]. In East Asia, diurnal NO2 patterns in major Asian cities have been revealed by GEMS observations [35,36]. Meanwhile, advanced machine learning techniques have been utilized to estimate ground-level NO2 pollution using satellite and ground-based datasets [37,38]. In Central Africa, satellite data have been used to investigate the sources of high NO2 levels, such as biomass burning [39,40]. Additionally, Europe remains a key focal region due to its dense observation network and unique seasonal NO2 characteristics related to latitude and emission patterns [13,41]. These developments underscore the growing significance of NO2 remote sensing products in environmental monitoring and air quality management.
However, despite the valuable contributions of polar-orbiting instruments in monitoring tropospheric NO2 at regional and global scales, there are inherent limitations when calculating short-term NO2 variations and emissions driven by local anthropogenic activities or meteorological dynamics [40,42]. For instance, sharp NO2 peaks during morning and evening traffic rush hours or rapid changes in wind direction and planetary boundary layer height can cause substantial intra-day variation in NO2 concentrations that may be missed by once-daily satellite overpasses [43,44,45]. These limitations highlight the need for a better understanding of the differences among various NO2 products retrieved from polar-orbiting satellites [46]. In particular, a comparative evaluation of products from morning and afternoon overpass times is essential for improving the accuracy and usability of satellite-based NO2 observations in both research and policy-making. This evaluation should focus on spatial resolution, overpass time, retrieval algorithms, and consistency [47,48].
This work aimed to address the gap in understanding how satellite overpass time influences the characterization of tropospheric NO2. By directly comparing morning (GOME-2C) and afternoon (TROPOMI) satellite products against ground-based Pandora measurements, we evaluated the capability of current polar-orbiting satellites to capture sub-daily NO2 patterns across different pollution regimes. We selected three representative regions with diverse pollution characteristics: East Asia, Central Africa, and Europe. Through comprehensive comparison and regional analysis, we assessed the temporal consistency, regional performance, and potential limitations of satellite NO2 products. The results provide critical insights into how overpass timing and sensor characteristics influence NO2 observations, offering guidance for capturing the diurnal variation of NO2 in the future.

2. Materials and Methods

2.1. Study Areas

Figure 1 illustrates the geographical locations of our selected study areas and the coverage of geostationary satellites. While these satellites can cover most hotspots, they do not provide global coverage. In the future, multi-temporal collaborative observations of polar-orbiting and geostationary satellites will present a new method for understanding air pollution [5,46].
Three regions were chosen for our analysis: East Asia, Central Africa, and Europe. East Asia, which includes eastern China, Korea, and Japan, is characterized by high NO2 concentrations due to dense urbanization, intensive industrial activities, and high vehicular emissions. The region is also frequently affected by meteorological conditions such as stagnant air masses and temperature inversions, which can exacerbate pollution accumulation [35,49]. Central Africa represents a region with moderate anthropogenic emissions but is heavily impacted by seasonal biomass burning, particularly in summer. The NO2 distribution in this area shows elevated levels during specific months, making it a unique case for evaluating satellite performance and differences in satellite overpass times (morning vs. afternoon) [39]. Europe serves as a representative region with well-established air quality monitoring infrastructure, including multiple ground-based stations [41,50]. These three selected study areas exhibit different meteorological conditions and pollution characteristics, representing localized, seasonal NO2 pollution zones.

2.2. Data

2.2.1. TROPOMI Tropospheric NO2 Data

TROPOMI, on board Sentinel-5P, the sixth monitoring satellite of ESA’s Copernicus program, provides daily global coverage with a swath width of 2600 km and a spatial resolution of 3.5 km × 5.5 km, with a 13:30 local time overpass time since 2018 [25,51,52]. Compared to previous satellite sensors such as OMI and GOME-2, TROPOMI offers significantly enhanced spatial resolution and retrieval sensitivity, measuring the radiance and irradiance in the ultraviolet and visible bands under hyperspectral conditions [53]. The precision of tropospheric NO2 VCD in the OFFL product typically ranges from 20% to 40%, depending on pollution levels and cloud conditions, which supports its suitability for global NO2 monitoring [25,50]. With 8 spectral bands and a hyperspectral imaging mode, TROPOMI has generated various datasets for NO2 observations [18]: near-real-time data stream (NRTI), offline data stream (OFFL), and post-processing data stream (RPRO). NRTI data are available within a few hours of acquisition and are suitable for operational applications, while OFFL and RPRO products undergo more rigorous calibration and are intended for scientific analyses [53]. In this study, we utilized the full-year 2024 TROPOMI NO2 L2 datasets (OFFL), obtained from the joint resources of the National Aeronautics and Space Administration (NASA) and the European Space Agency (ESA) (https://disc.gsfc.nasa.gov/, accessed on 12 February 2025).
To ensure data quality, we established a quality assurance threshold by retaining only pixels with a QA value greater than 0.5 for tropospheric NO2 vertical column density (VCD). This criterion excludes retrievals under poor conditions, such as heavy cloud cover or snow/ice contamination, thereby enhancing the reliability and representativeness of the dataset for subsequent analyses [54,55]. All data were first projected onto a uniform 7 × 7 km grid for regional mapping. To enable direct comparison with the coarser-resolution GOME-2C data, the results were then spatially aggregated to a 0.25° × 0.25° grid using area-weighted averaging.

2.2.2. GOME-2C Tropospheric NO2 Data

GOME-2C, the third GOME instrument on board the MetOp-C satellite operated by the European Organization for the Exploitation of Meteorological Satellites (EUMETSAT), has been providing global observations of atmospheric trace gases since its launch in November 2018 [15]. Operating in a sun-synchronous orbit with an overpass time of approximately 09:30 local time, GOME-2C delivers daily coverage with a swath width of 1920 km and a spatial resolution of approximately 40 × 40 km at nadir for NO2 products [56]. Although GOME-2C has a coarser spatial resolution and earlier overpass time, it remains a valuable instrument for long-term atmospheric composition monitoring due to its stable performance and consistent data record. The NO2 Level 2 (L2) products are generated using the GDP 4.9 algorithm, which incorporates updated cloud correction, a priori profiles, and improvements in radiative transfer modeling [14,57].
In this study, we utilized the full-year 2024 GOME-2C NO2 Level 3 (L3) products, which were downloaded from the EUMETSAT Atmospheric Composition SAF (AC SAF) archive (https://acsaf.org/, accessed on 21 May 2025). We selected the tropospheric NO2 VCD from this dataset and spatially resampled it to a consistent 0.25° × 0.25° grid (~25 km) to match the resolution of the regional analyses and facilitate comparisons with other satellite products.

2.2.3. Ground-Based Pandora Data

The Pandora spectrometer system is a ground-based, ultraviolet-visible instrument designed for direct-sun and sky-viewing measurements. It specifically retrieves total and tropospheric VCDs of trace gases such as NO2, ozone (O3), and formaldehyde (HCHO). By measuring solar radiation absorption at specific wavelengths, Pandora facilitates high-frequency daytime observations under clear-sky conditions.
As part of the PGN, the Pandora system provides high-quality, high-temporal-resolution NO2 tropospheric column density data from a wide range of global locations [9]. The uncertainty in the Pandora direct-sun NO2 retrievals has been extensively characterized. Generally, the total column NO2 data exhibit a precision of ~2.7 × 10¹⁴ molecules/cm2 and a systematic uncertainty of ~2.7 × 10¹⁵ molecules/cm2, mainly caused by the calculation of the air mass factor (AMF) [58]. In this study, we utilized Pandora data from 183 sites worldwide (https://www.pandonia-global-network.org/, accessed on 10 May 2025). We selected measurements with L2 data quality flags of 0 (assured high quality) and 10 (not assured high quality) to ensure the reliability of the dataset. To align the overpass times of TROPOMI and GOME-2C, we calculated hourly averaged Pandora NO2 data for periods before and after 9:30 and 13:30 local time. These operations ensured that the data were spatiotemporally matched with satellite observations, enabling confident validation and comparison with NO2 products.

2.3. Methods

To address differences in spatial resolution between the instruments, all satellite products were resampled to a common grid with a spatial resolution of 0.25° × 0.25°. This resampling was performed using area-weighted averaging to accurately map the original satellite pixels to the new, coarser grid cells, ensuring spatial consistency across datasets and enabling direct comparisons of products with varying geometries. Ground-based Pandora observations were assigned to the corresponding grid cells based on their geographic coordinates and validated using the closest spatial match.
Additionally, we validated the satellite-derived NO2 column density using Pandora ground observations at the same location as the reference truth. The tropospheric vertical column density (VCD) of the satellite and Pandora datasets was compared in matched time–position pairs. Statistical metrics, including the correlation coefficient (R), root mean square error (RMSE), and correlation slope, were calculated to quantify the consistency between the two datasets. The same metrics were also applied in the intercomparison of regional products.

3. Results

3.1. Validations Between Satellite Products and Pandora Datasets

3.1.1. Satellite Products Assessment

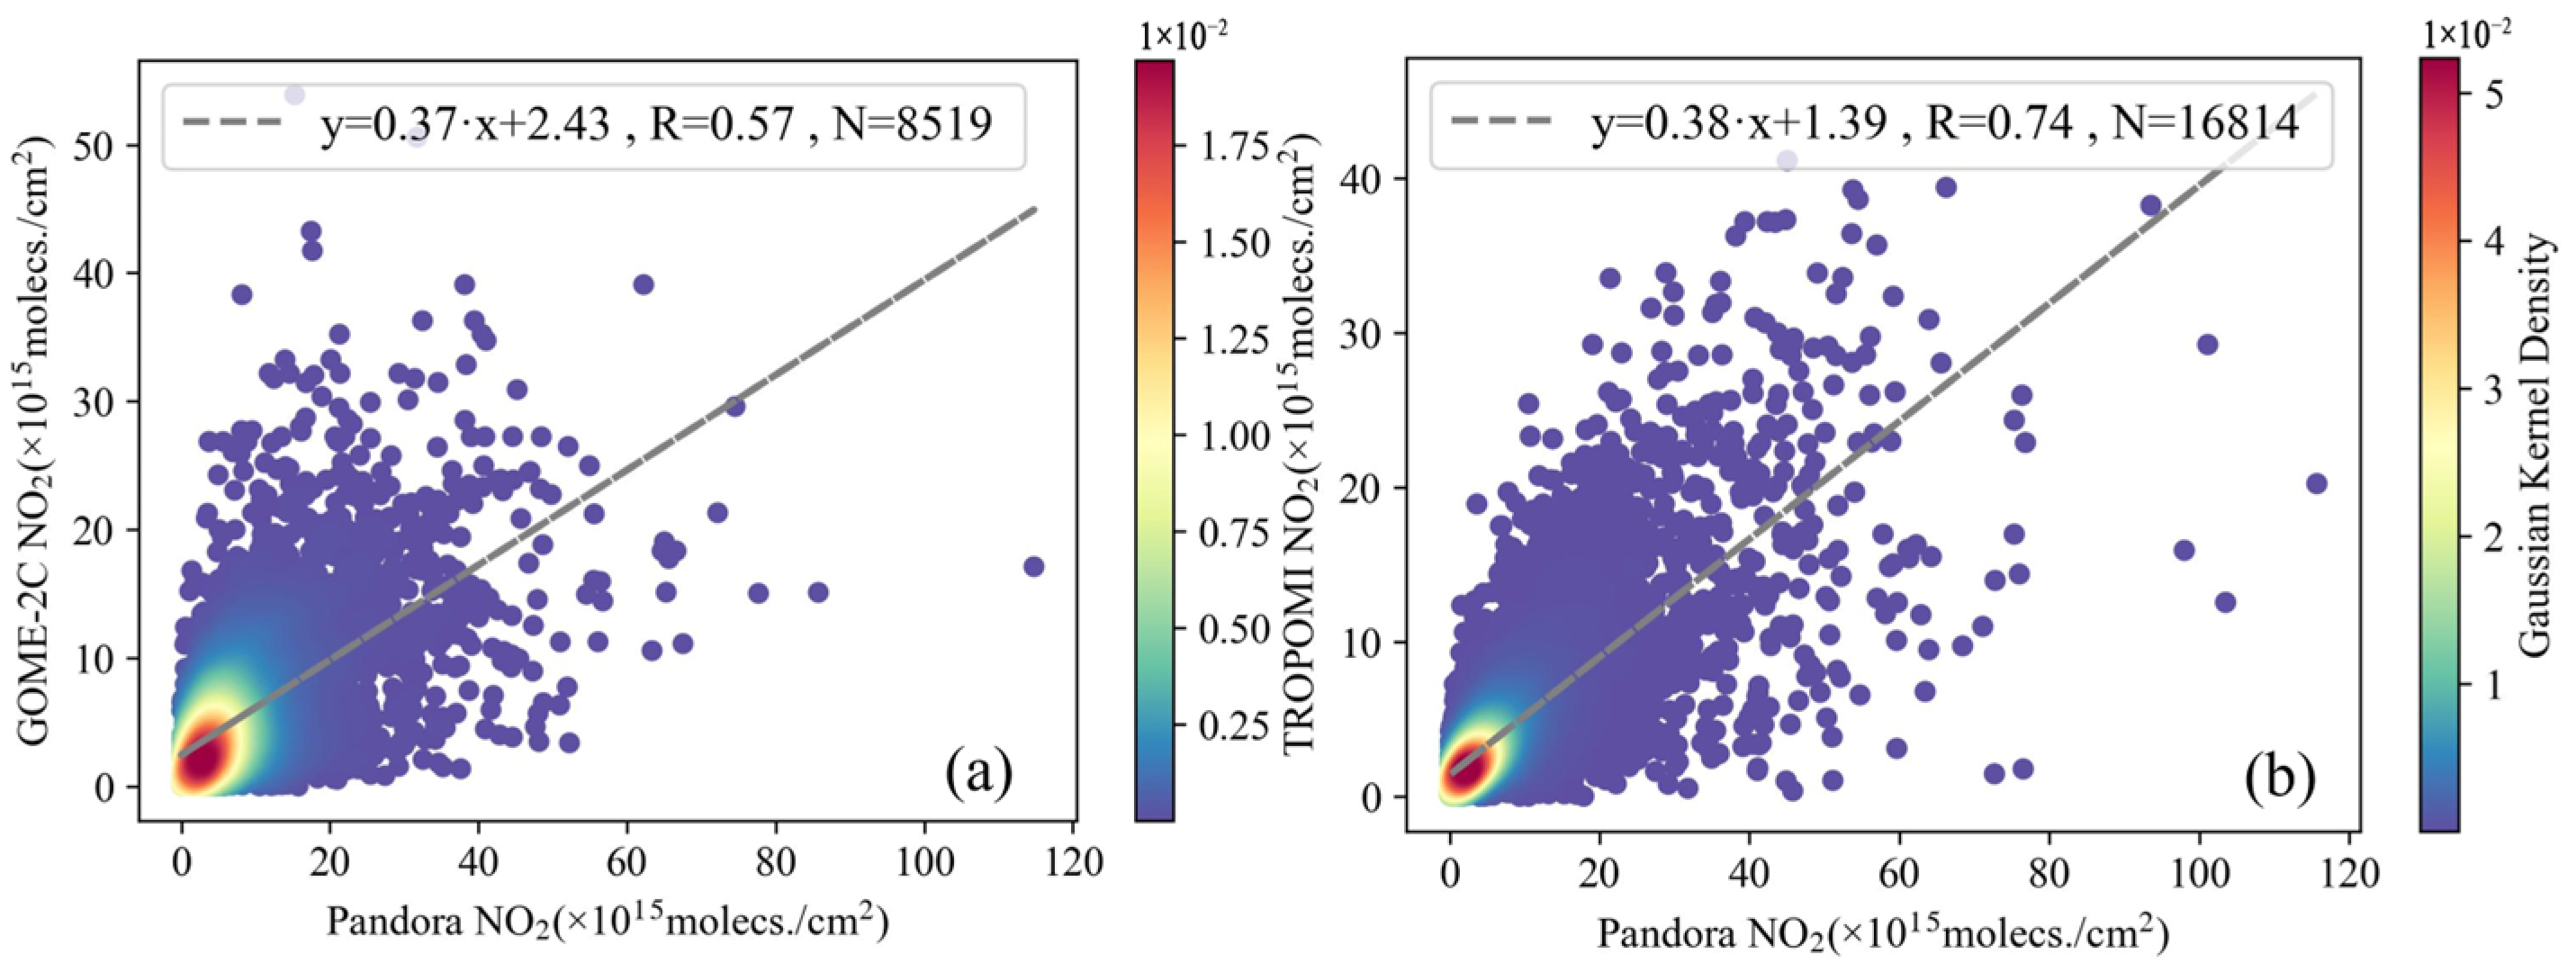
Accurate remote sensing observations are essential for evaluating differences between polar-orbiting satellite products. Before conducting regional comparative analyses, it is necessary to assess the global reliability of the TROPOMI and GOME-2C NO2 datasets to ensure the robustness of the subsequent results. In this study, we performed correlation analyses using data from 2024, as shown in Figure 2. The results indicate that although the satellite-retrieved NO2 column values were generally lower than those obtained from ground-based observations (with regression slopes of 0.37 for GOME-2C and 0.38 for TROPOMI), the global validations still demonstrated a strong relationship between NO2 products and ground-based observations, with correlation coefficients (R) of 0.57 for GOME-2C and 0.74 for TROPOMI. Among the two instruments, TROPOMI exhibited a higher correlation and more matched points with ground-based data compared to GOME-2C. These validation results indicate that both TROPOMI and GOME-2C NO2 products are sufficiently reliable for further investigations, particularly for analyzing diurnal NO2 pollution patterns across diverse geographical regions.
However, it should be noted that Pandora datasets and satellite measurements have systematic bias. The discrepancies are primarily attributed to differences in retrieval algorithms, spectral resolution, spatial coverage, and signal-to-noise characteristics, which are lower [50,59,60]. Nevertheless, such systematic differences are relatively small and consistent across instruments. This study focused primarily on the relative differences in NO2 observations between morning and afternoon overpasses across regions and seasons.

3.1.2. Daily Averaged Variations

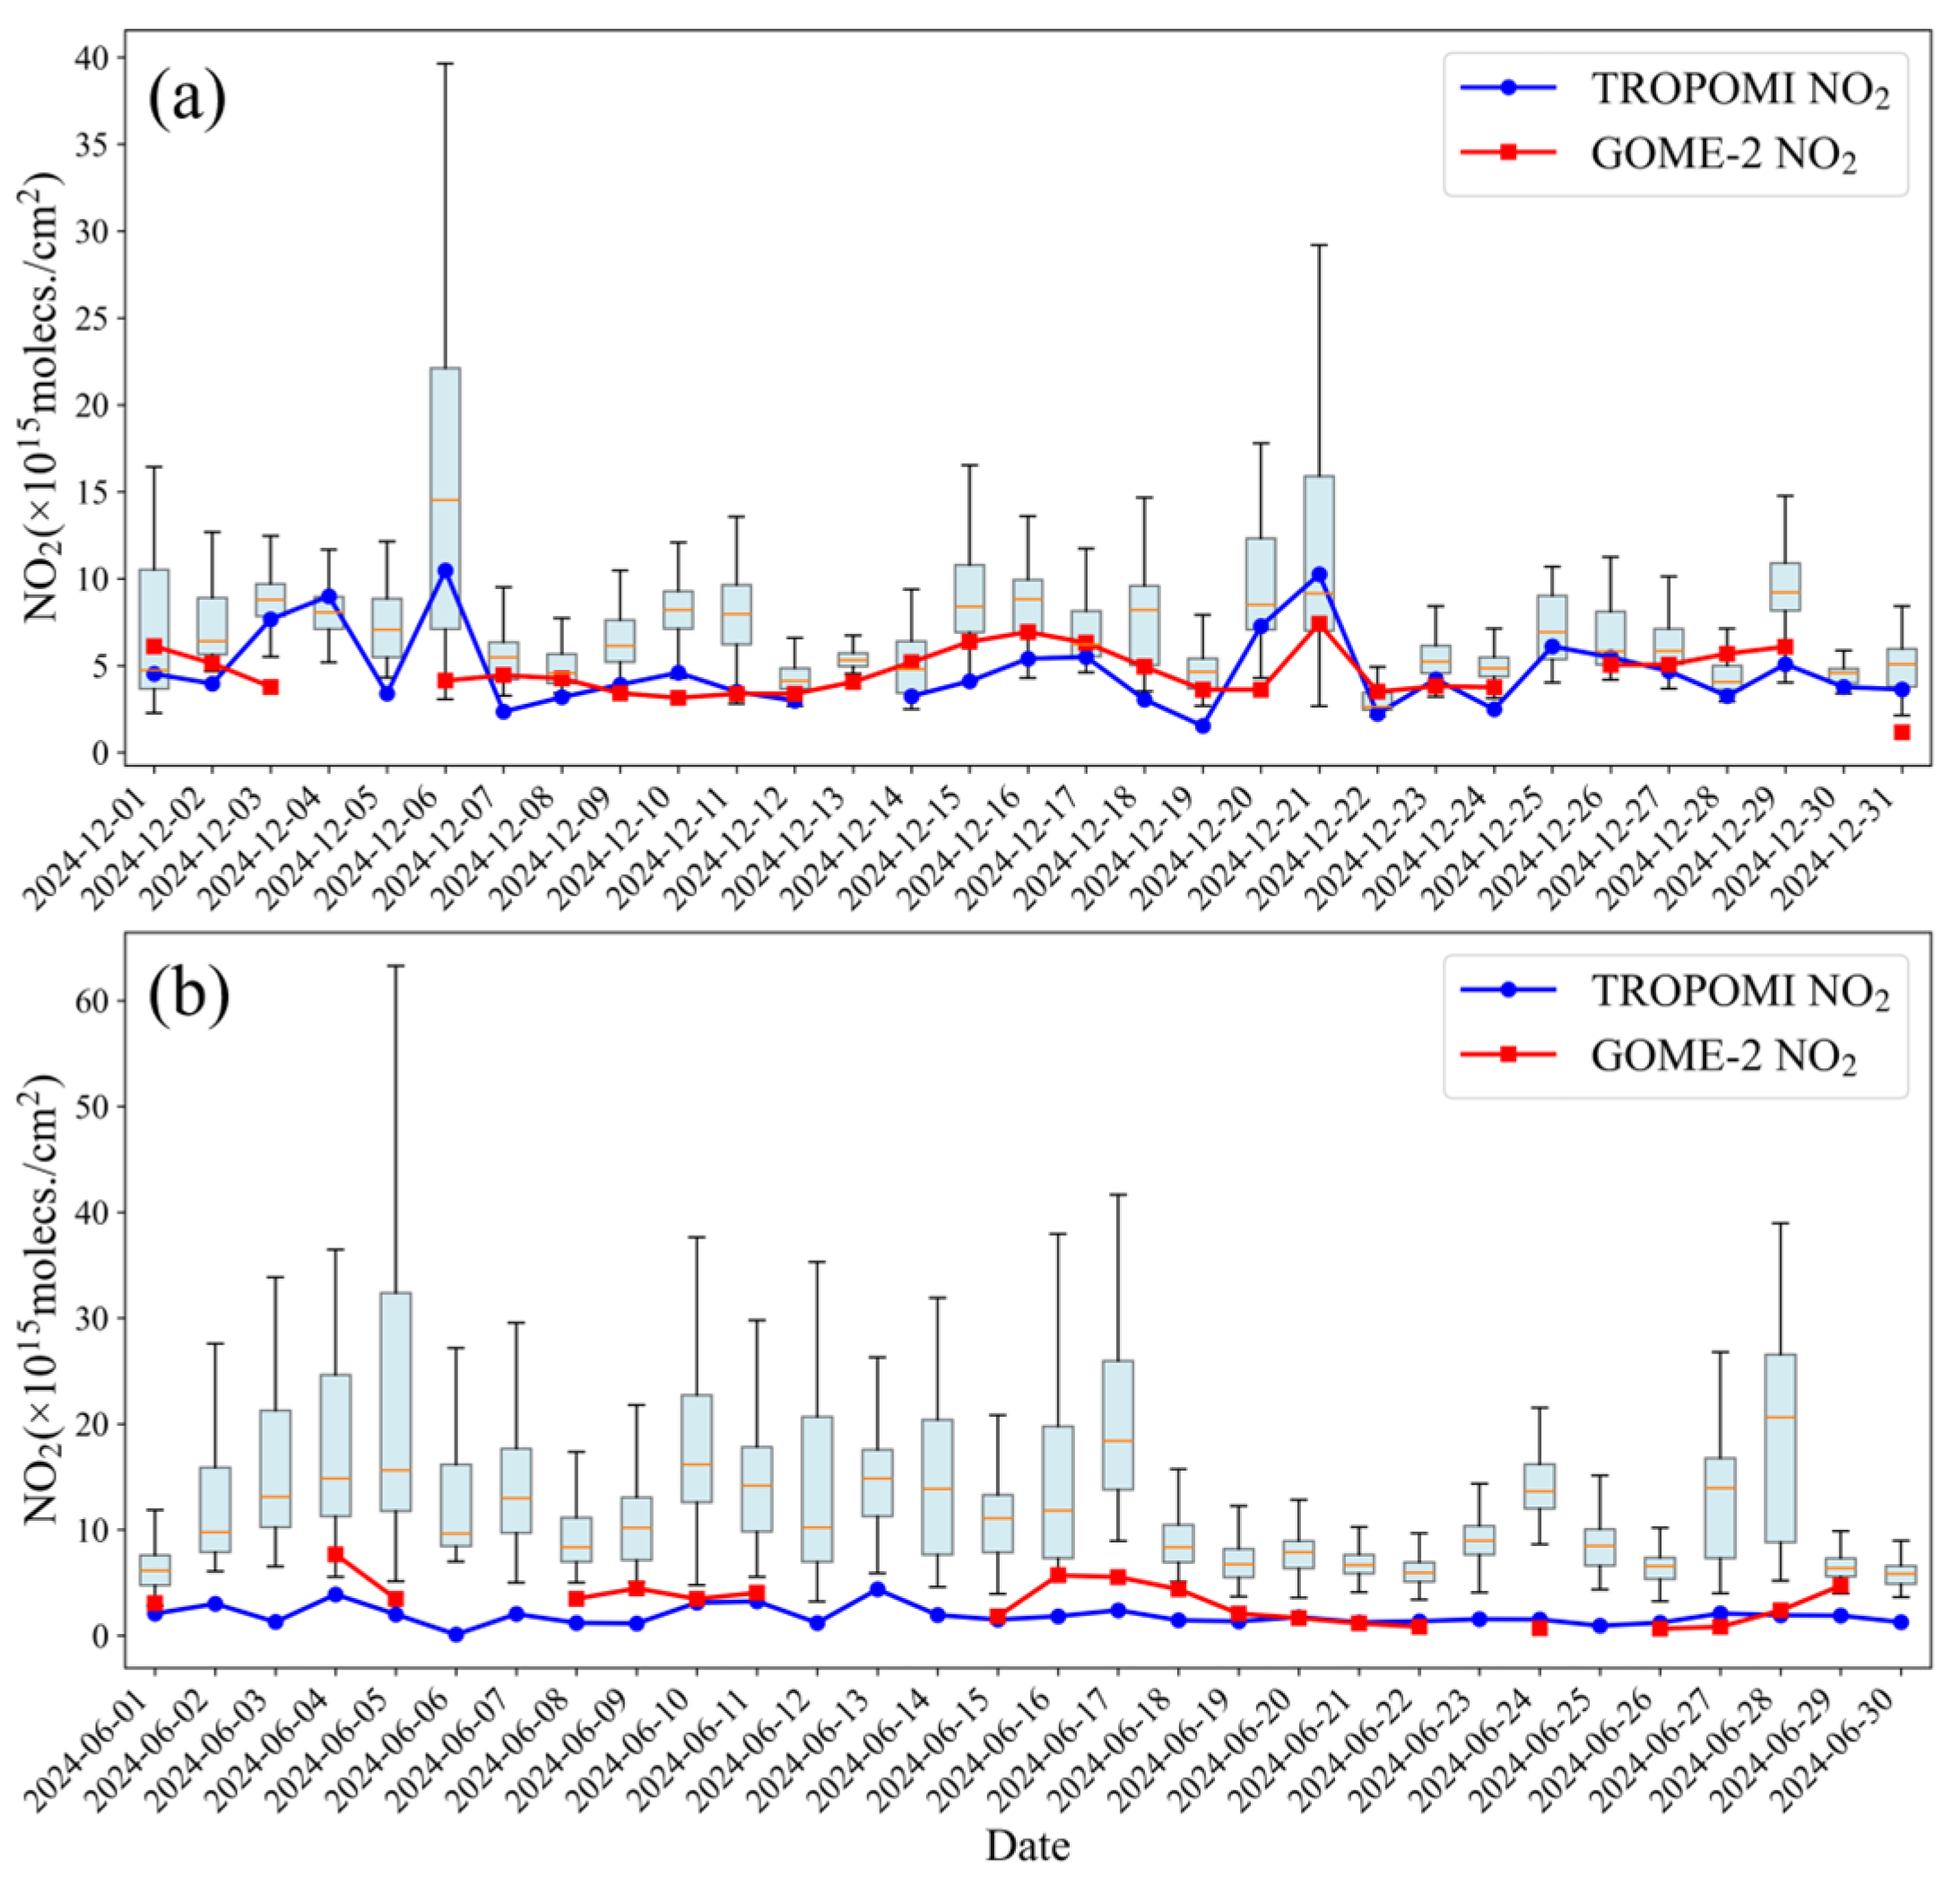
Although satellite-derived NO2 products provide extensive spatial coverage, instantaneous polar-orbiting observations may not fully capture the daily features of NO2 pollution. Figure 3 shows the daily average values from the Tsukuba-NIES Pandora site in December 2024 and the Athens-NOA site in June 2024, along with the time-series variations of TROPOMI and GOME-2C data. The observed differences between Tsukuba and Athens may be partly attributed to their distinct local environments: Tsukuba is a relatively clean, semi-rural site with limited nearby emission sources [61], while Athens is a densely populated urban area with strong local emissions and complex transport patterns [62]. The photochemistry, NO2 emissions, and meteorological factors may be important reasons for the seasonal differences between these two sites [43,44]. As fixed official PGN stations, both instruments adhere to standardized operational protocols and a centralized data processing system, ensuring high data consistency and quality. Moreover, the spatial mismatch between localized emissions and satellite averaging kernels may be amplified under many conditions [63].
Overall, the trends in satellite and ground-based measurements demonstrate reasonable consistency. Representative sites and months capturing distinct seasonal and regional NO2 pollution regimes were carefully selected for detailed examination (e.g., Tsukuba-NIES in December and Athens-NOA in July). In December 2024, at Tsukuba-NIES, satellite-monitored NO2 levels ranged from 0.11 × 10¹⁵ to 10.2 × 10¹⁵ molecules/cm2, while ground-based measurements varied from 0.25 × 10¹⁵ to 40 × 1015 molecules/cm2. On high-pollution days, such as 6 December and 21 December 2024, the daily maximum and minimum values exhibited significant fluctuations. During these periods, the discrepancy between the TROPOMI and GOME-2C values widened, with TROPOMI consistently reporting higher concentrations than GOME-2C. In contrast, at the Athens-NOA site in June 2024, satellite NO2 values showed minimal variation, likely due to intense NO2 photolysis reactions during the summer. However, ground-based data displayed substantial fluctuations, and satellite measurements were notably lower than ground-based concentrations, indicating that they do not accurately reflect the temporal NO2 emission characteristics over time-series variations.
It is important to note that while both TROPOMI and GOME-2C provide tropospheric NO2 column data, their retrieval algorithms differ in several key aspects. For instance, TROPOMI uses a different a priori NO2 profile (e.g., from TM5-MP) and employs distinct cloud detection and treatment algorithms compared to GOME-2C. These differences can lead to systematic biases between the two products, particularly under varying cloud cover or surface conditions [48,52,60]. Meanwhile, due to enhanced photochemical activity around local noon, TROPOMI generally reports lower concentrations than GOME-2C. In addition, diurnal variations in anthropogenic emissions, boundary layer dynamics, and atmospheric transport processes further contribute to the differences in pollution patterns observed between Tsukuba-NIES and Athens-NOA.

3.2. Evaluations in Typical Regions

3.2.1. East Asia

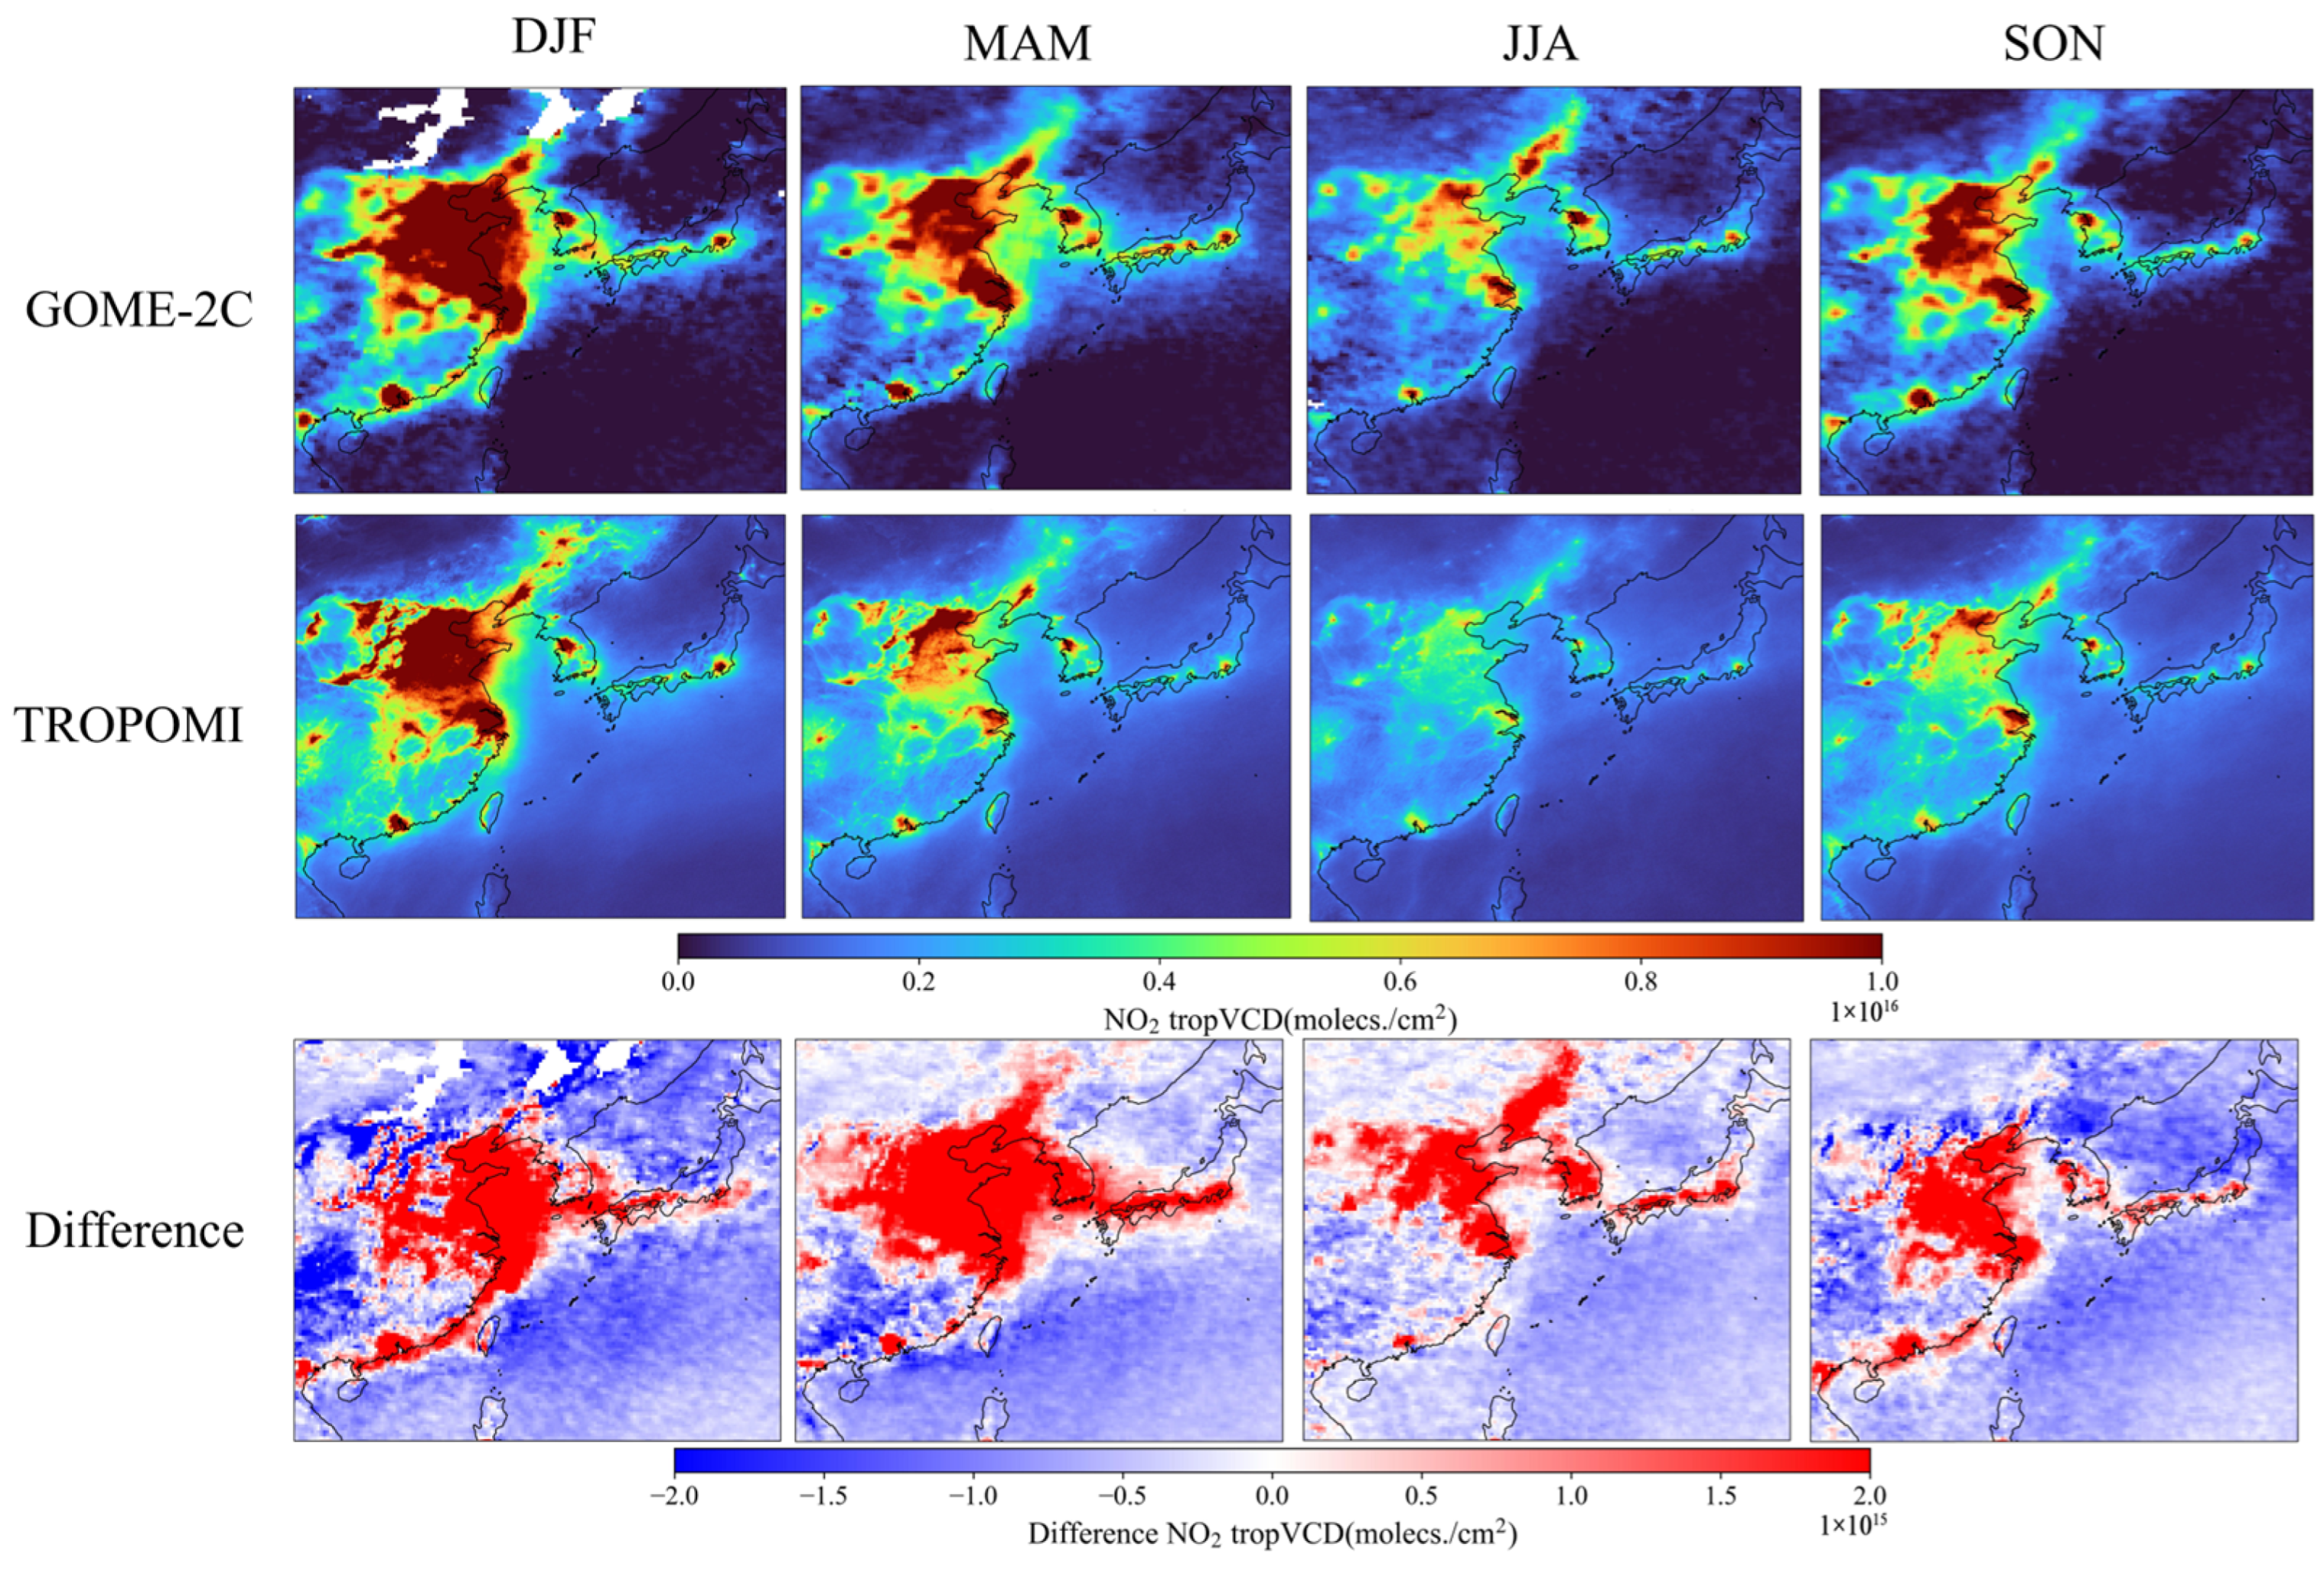
East Asia is a region characterized by high NO2 concentrations, which arise from various sources, including industrial activities, chemical reactions, and meteorological conditions. Figure 4 illustrates the distribution of NO2 concentrations and the differences in TROPOMI and GOME-2C over East Asia across different seasons. These data reveal elevated levels of NO2 pollution primarily concentrated in urban and well-developed areas, such as the North China Plain, the Yangtze River Delta, the Pearl River Delta, Seoul, and Tokyo. The pollution area identified by GOME-2C was larger than that detected by TROPOMI, which can be attributed to daily variations in photochemical reactions in the atmosphere. In the afternoon, strong sunlight enhanced these photochemical processes, resulting in increased photolysis of NO2, leading to relatively lower values observed by TROPOMI. NO2 pollution concentrations were higher in winter and lower in summer, further influenced by atmospheric photolysis effects. Additionally, compared to GOME-2C, TROPOMI demonstrated superior spatial resolution and an enhanced ability to monitor small NO2 plumes, providing more detailed insights into pollution characteristics. The spatial differences between GOME-2C and TROPOMI revealed seasonal patterns. In autumn and winter, GOME-2C tended to report lower NO2 concentrations than TROPOMI in major developed cities such as Beijing and Seoul. In contrast, during spring and summer, GOME-2C generally monitored higher NO2 concentrations across most regions, consistent with higher morning NO2 loading.
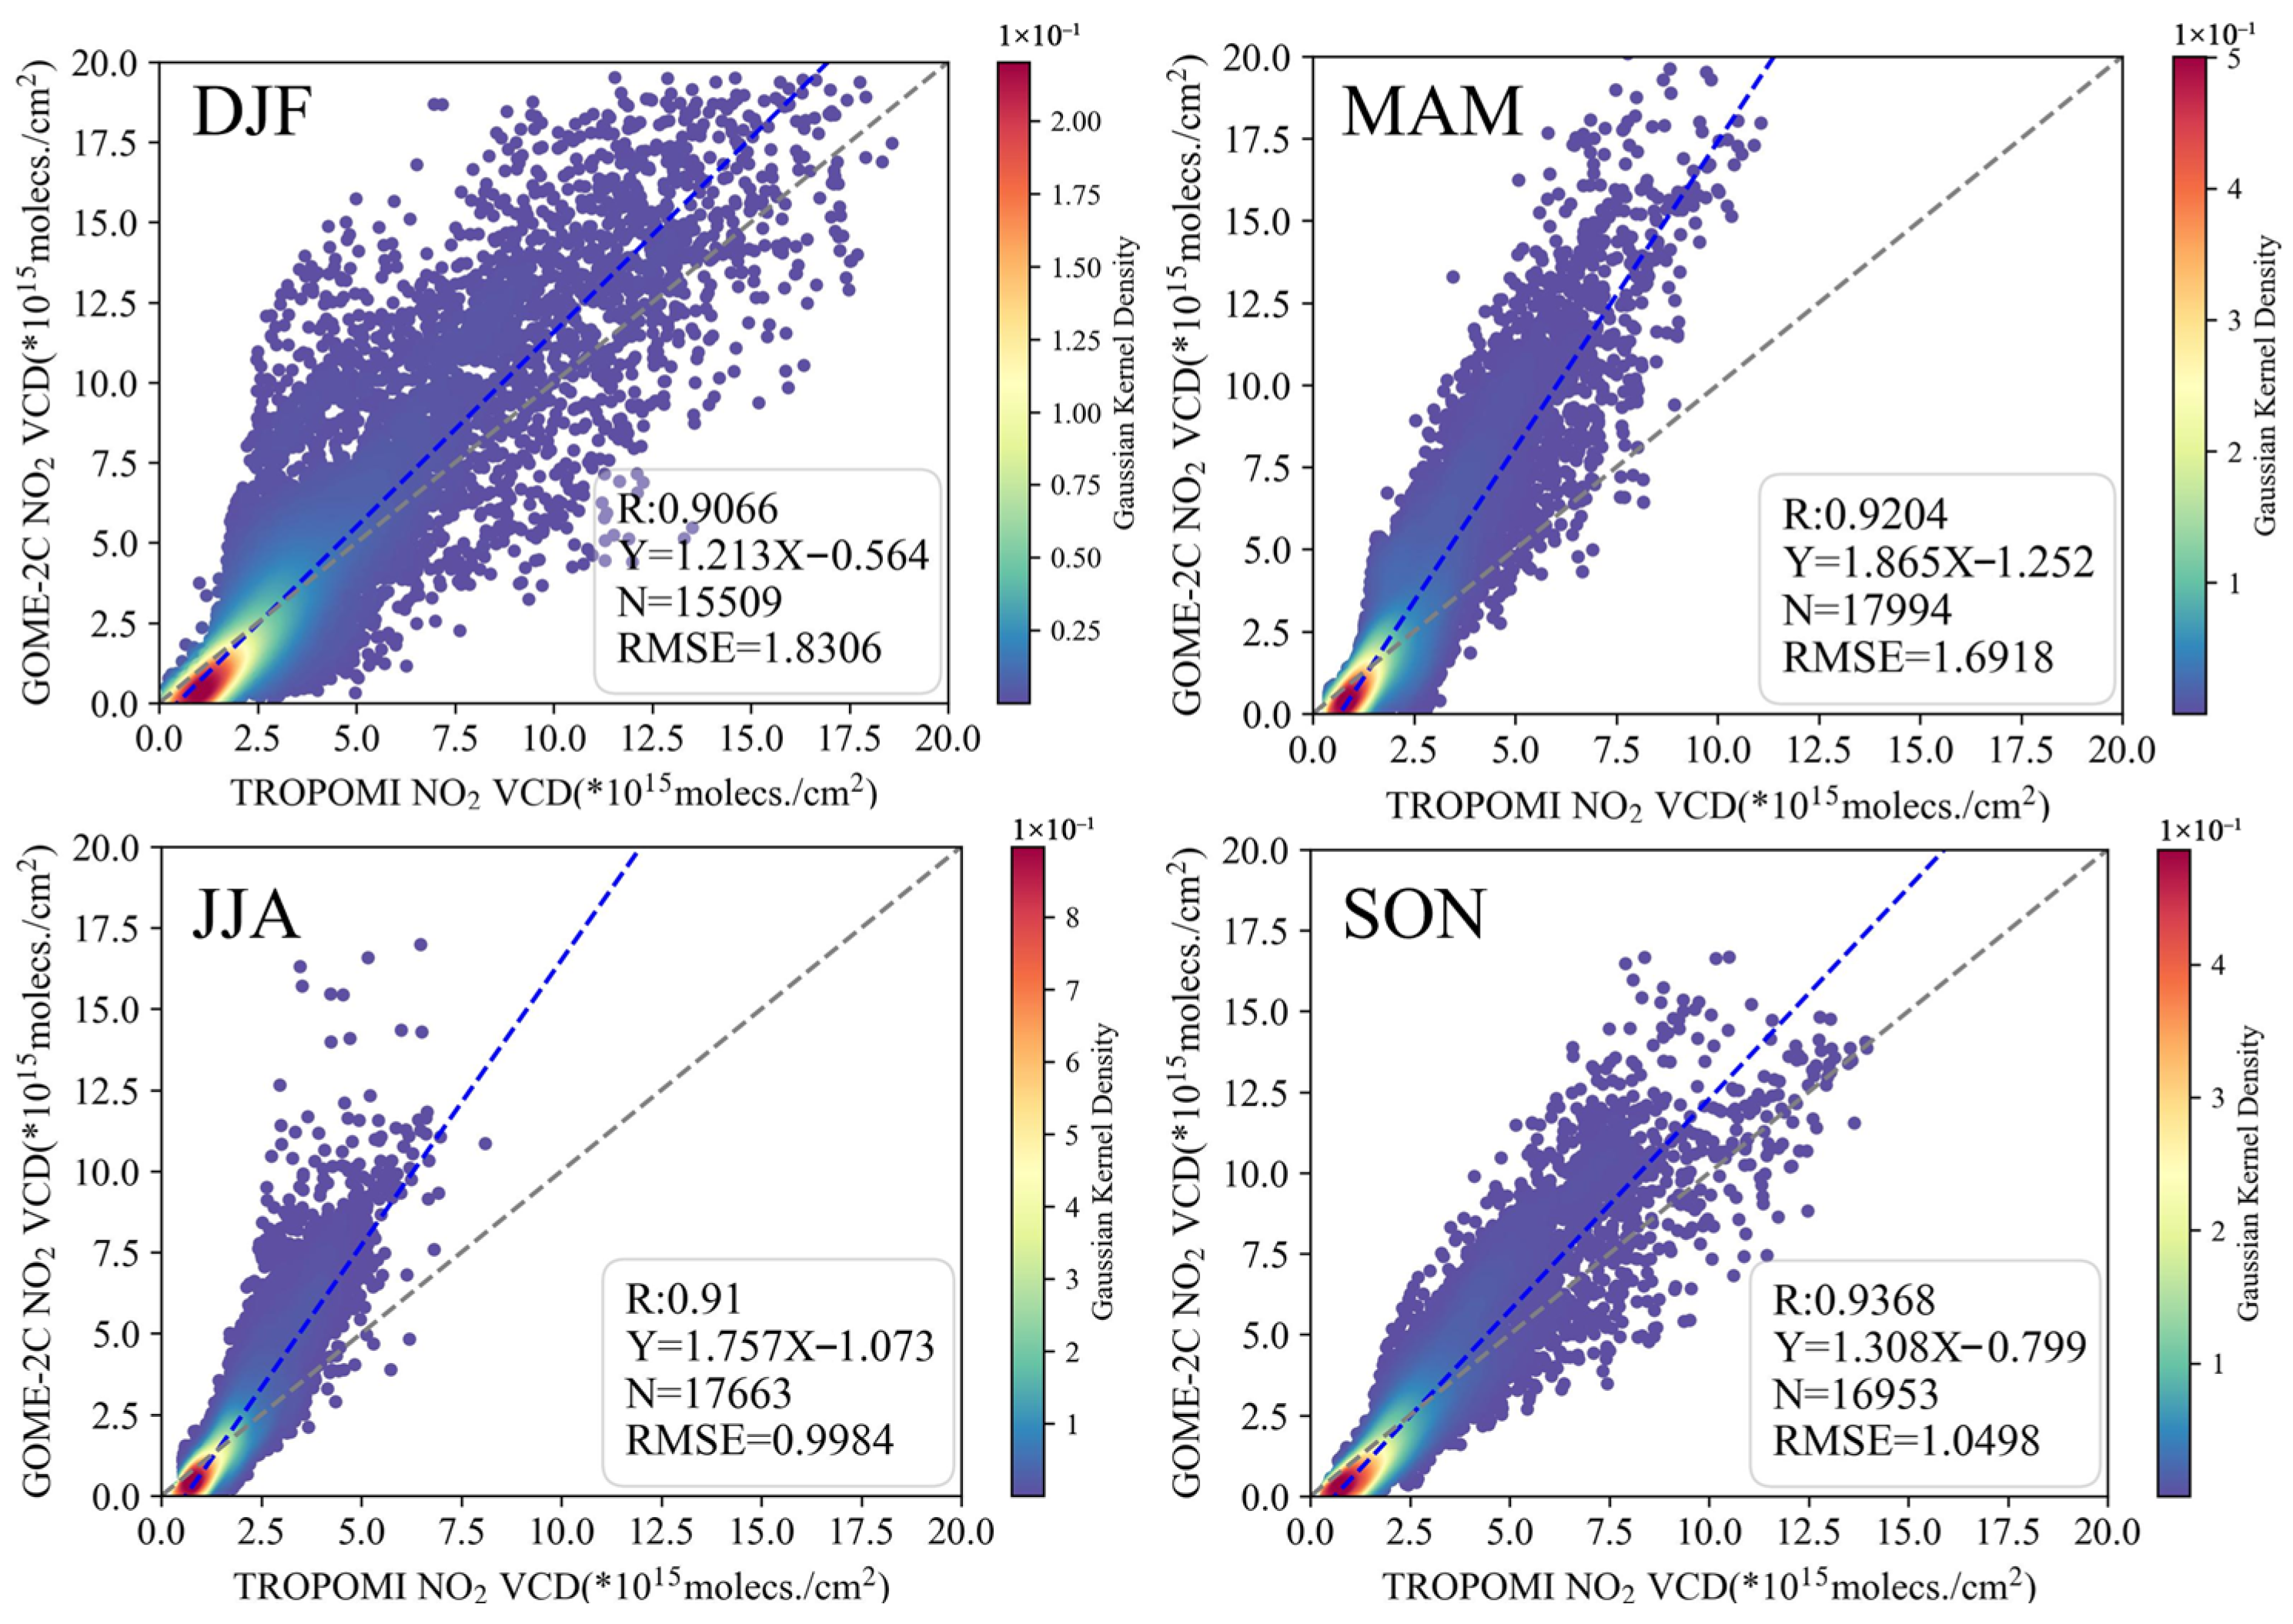
To investigate the systematic differences between morning and afternoon satellite observations and to understand the limitations of single polar-orbiting measurements, we conducted a direct intercomparison of GOME-2C (~9:30 LT) and TROPOMI (~13:30 LT) NO2 VCDs (Figure 5). This comparison served as a diagnostic tool to reveal the magnitude and nature of the discrepancies driven by their different overpass times and systematic differences. The results indicate that the NO2 monitoring results from these two datasets showed a strong correlation: R = 0.901 in DJF, R = 0.920 in MAM, R = 0.91 in JJA, and R = 0.937 in SON. The monitoring values from GOME-2C were higher than those from TROPOMI, particularly in spring and summer, where the slope reached 1.865 in MAM and 1.757 in JJA. In autumn and winter, the values from GOME-2C were similar but slightly higher than those from TROPOMI, with a higher RMSE in winter, indicating greater uncertainties between morning and afternoon NO2 observations during this season. The primary driving factor for the high slope (>1) is expected to be the different local overpass times, as morning (~9:30 LT) and afternoon (~13:30 LT) observations capture fundamentally different patterns of the NO2 diurnal cycle, which is itself governed by local emissions, transport, and photochemistry. GOME-2C observes NO2 in the morning, when traffic and industrial emissions start to build up [43,45]. TROPOMI observes in the early afternoon, when the boundary layer is deeper and the photochemistry is stronger [44,46]. This causes NO2 to mix and react, often resulting in lower observed concentrations. Therefore, analyzing the diurnal variation observation results of the geostationary GEMS satellite and the ground-based Pandora station can better demonstrate the limitations of simple snapshots during satellite overpass times.
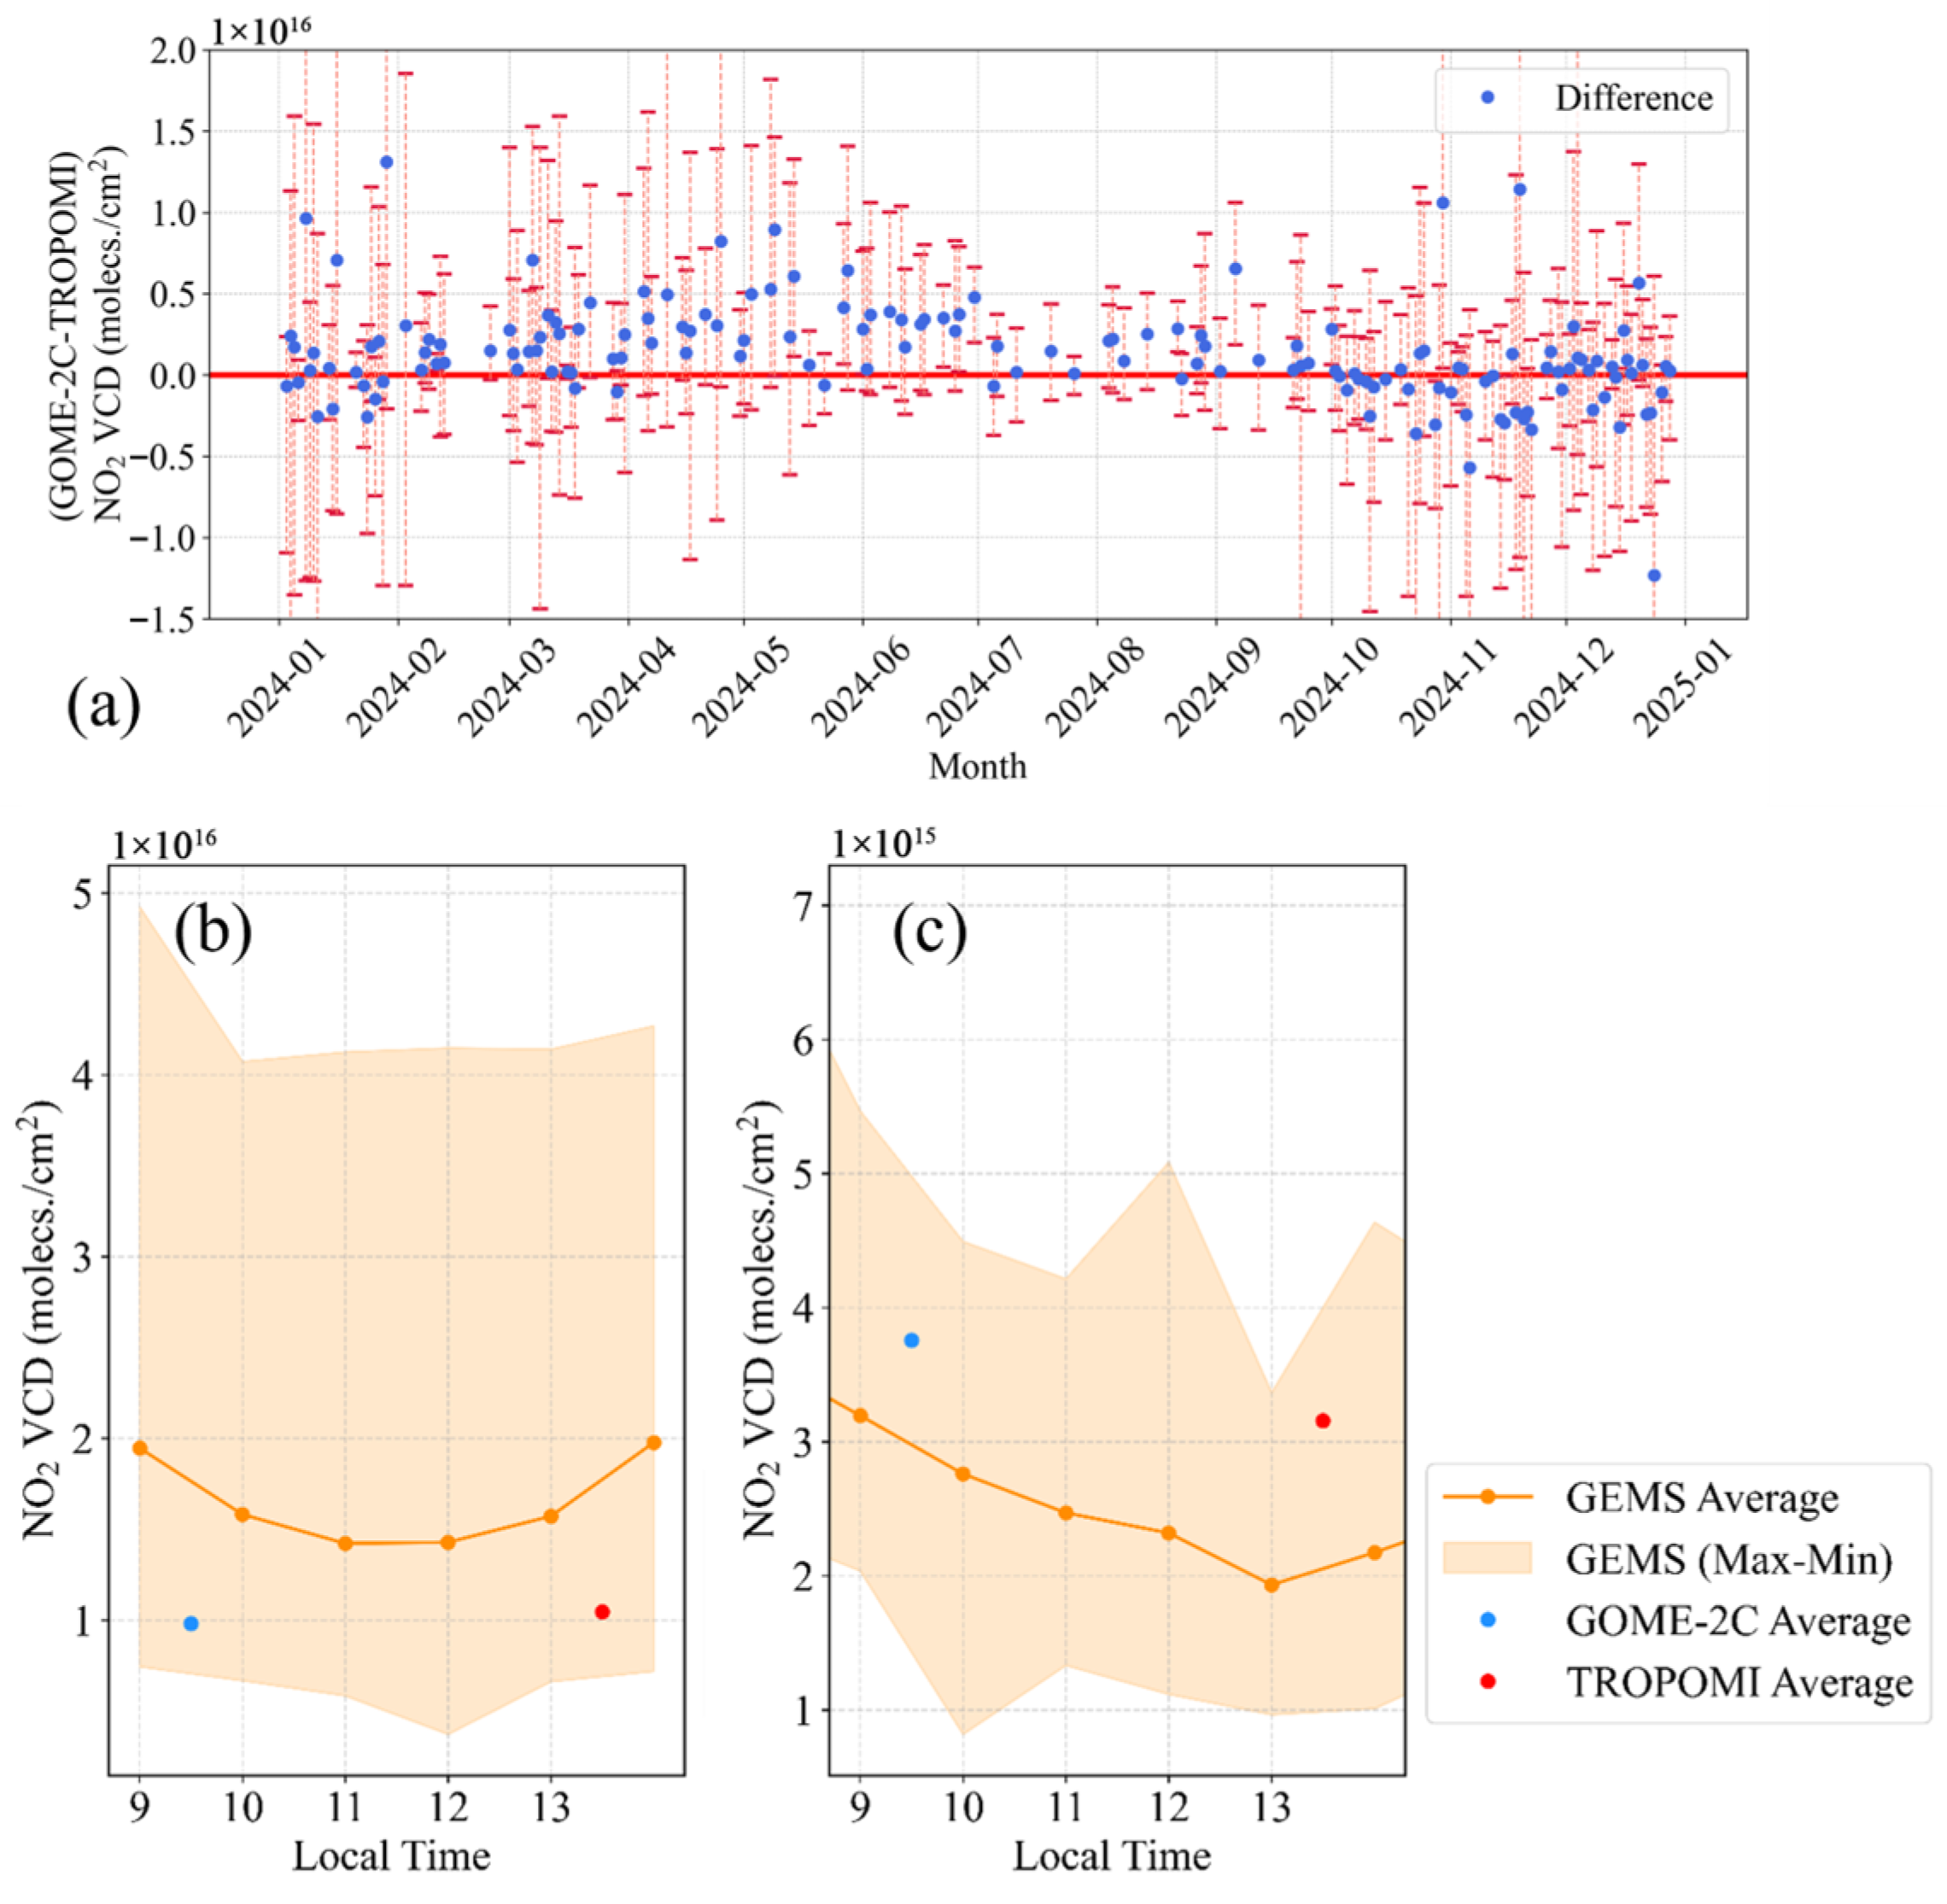
To further analyze the differences in NO2 VCD characteristics between TROPOMI and GOME-2C, we calculated the monthly mean NO2 VCD differences for the Beijing area (Figure 6). Due to the different spatial coverage, there may have been omissions in the calculation of differences between the two products on certain days. Valid difference information was effectively monitored on 160 days in 2024. The results indicate that GOME-2C generally recorded higher values in spring and summer. However, during autumn and winter, the GOME-2C values were lower than those of TROPOMI on some days, coinciding with increased pollution accumulation and weaker photochemical reactions. The range of differences from −1.23 × 10¹⁵ molecules/cm2 to 1.31 × 10¹⁵ molecules/cm2, mainly occurring between −0.5 × 10¹⁵ molecules/cm2 and 0.5 × 10¹⁵ molecules/cm2, indicates good consistency between these two products. The fluctuations in the autumn and winter seasons were even greater, which may be related to the meteorological conditions and variations in human activity associated with the observation time. The increased differences monitored in March are potentially attributable to increased emissions after the Chinese New Year, due to enhanced industrial and traffic activities in the morning and strong photochemistry in the afternoon [64].
Considering that GEMS was launched to monitor diurnal NO2 concentrations over East Asia, we also analyzed the monthly average diurnal patterns of NO2 in the Beijing area, corresponding with monthly values from GOME-2C and TROPOMI. In January, under high pollution conditions, GEMS data revealed a distinct pattern where NO2 concentrations initially decreased and then increased throughout the day. NO2 monitored by TROPOMI may be slightly higher than GOME-2C. The trend is likely influenced by Beijing’s strong and temporally variable emissions, particularly during traffic rush hours, as well as differences in layer dynamics, wind fields, and regional pollutant transport [28]. The observed concentration range was from 3.72 × 10¹⁵ to 49.2 × 10¹⁵ molecules/cm2, significantly higher than the corresponding values from TROPOMI. In contrast, the diurnal variation in July exhibited a gradual decrease in NO2 levels throughout the day, with the highest concentration occurring at the beginning of the observation period, with the GOME-2C values much higher than TROPOMI. During this month, the NO2 concentrations ranged from 0.82 × 10¹⁵ to 6.99 × 10¹⁵ molecules/cm2.
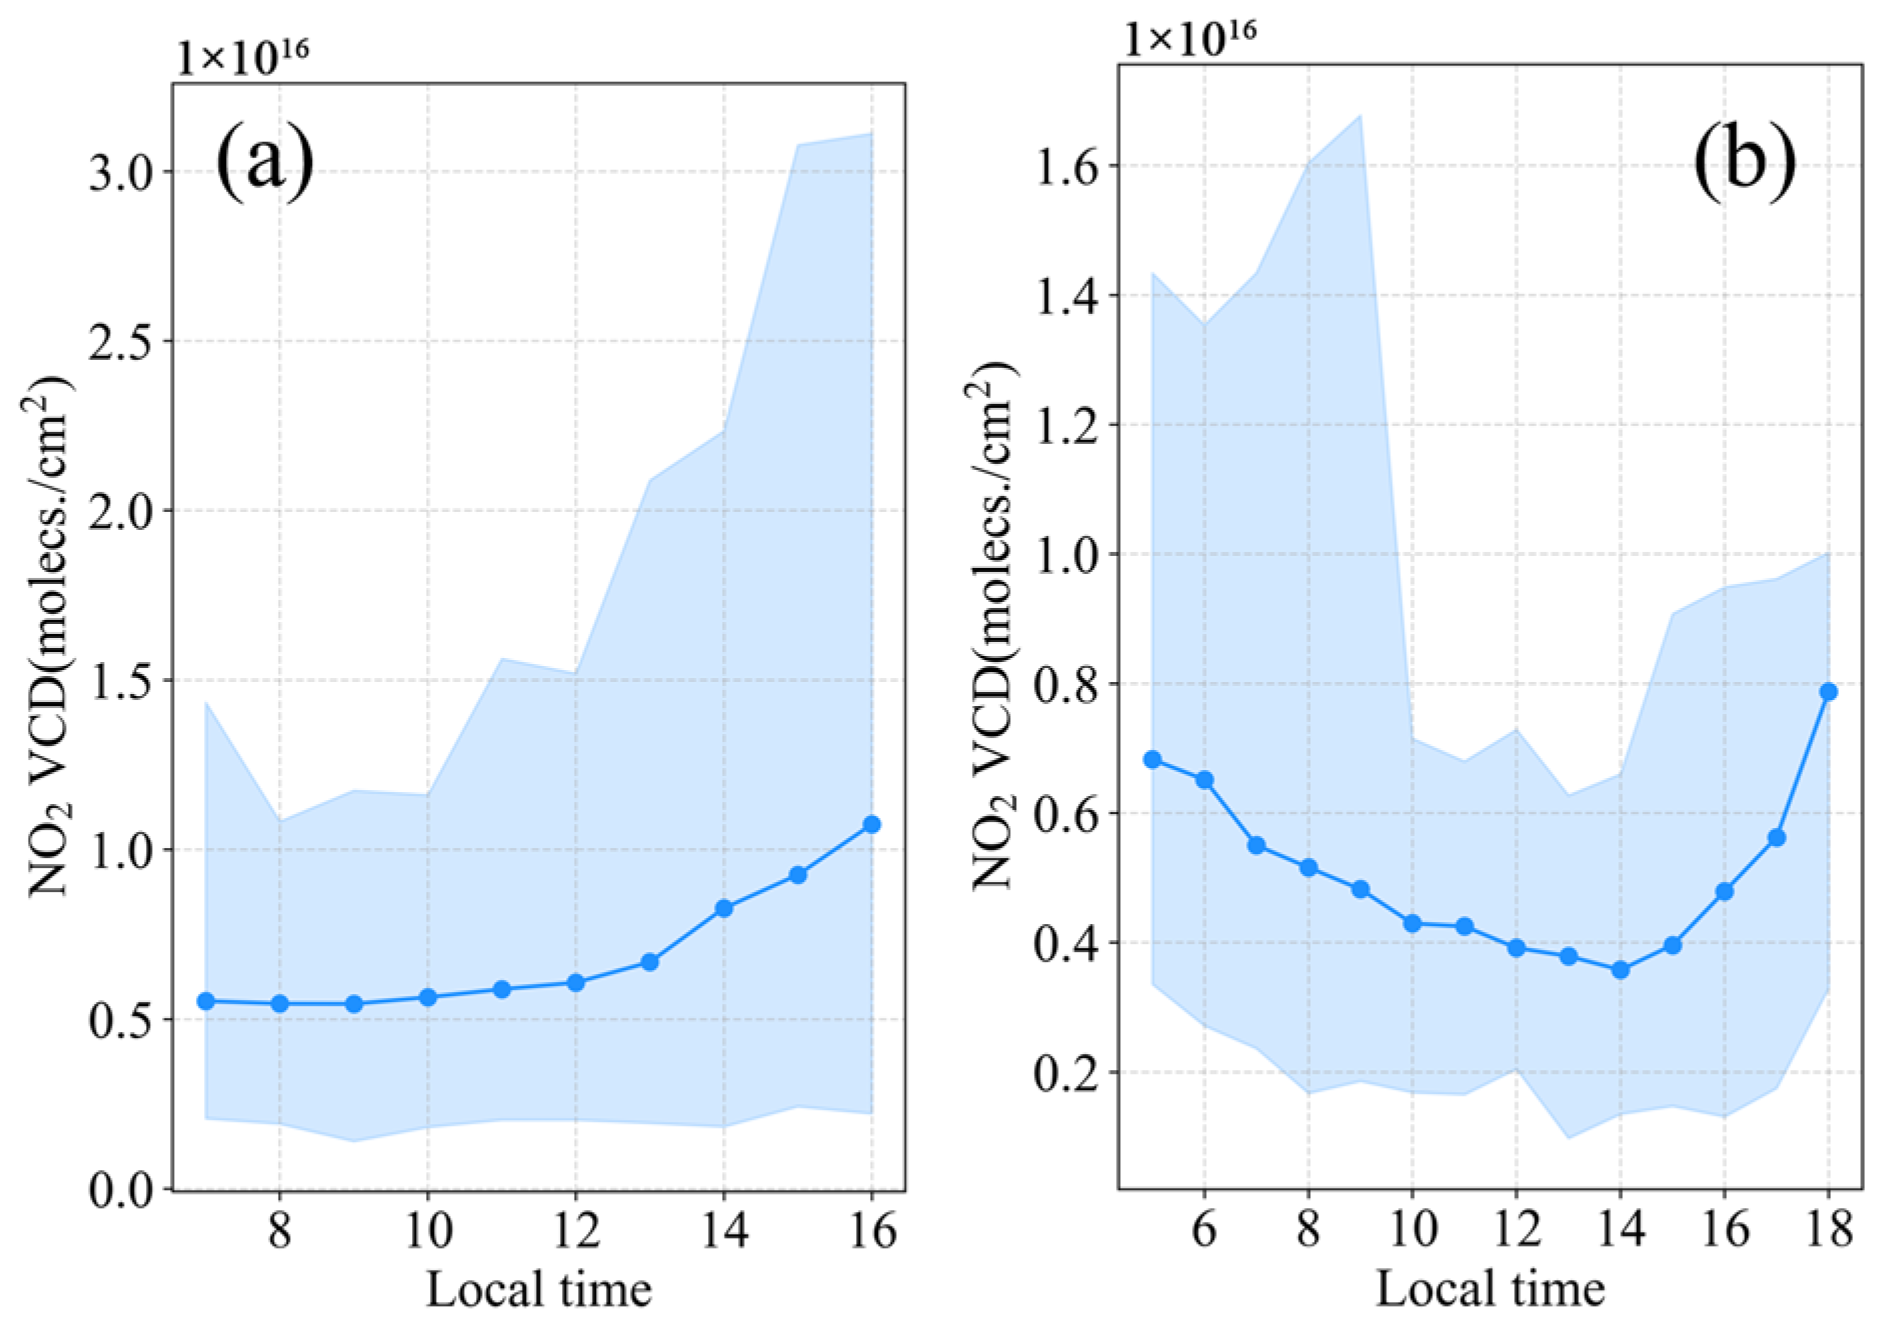
To illustrate the fundamental mechanisms driving the diurnal variability of NO2 in East Asia, we selected the Tsukuba-NIES station as a representative case. It is a well-established PGN station located in a classic urban outflow environment and clearly demonstrates the contrasting seasonal patterns typical of mid-latitude polluted regions. Figure 7 shows the diurnal variation in January and July, indicating the differences between morning and afternoon observations. The results illustrate that the NO2 VCD gradually increased throughout January, reflecting a gradual accumulation process. Consequently, this led to higher TROPOMI monitoring concentrations compared to GOME-2C during winter. In July, the diurnal variation of NO2 initially decreased and then increased, reaching its lowest value at 14:00. This suggests that NO2 concentrations decrease more significantly in the afternoon due to photochemical effects. However, as light intensity weakens, the concentration of NO2 begins to accumulate again. Although the specific characteristics may vary, these diurnal patterns are highly representative of mid-latitude polluted environments across East Asia, highlighting the challenge for polar-orbiting satellites in this critical region.

3.2.2. Central Africa

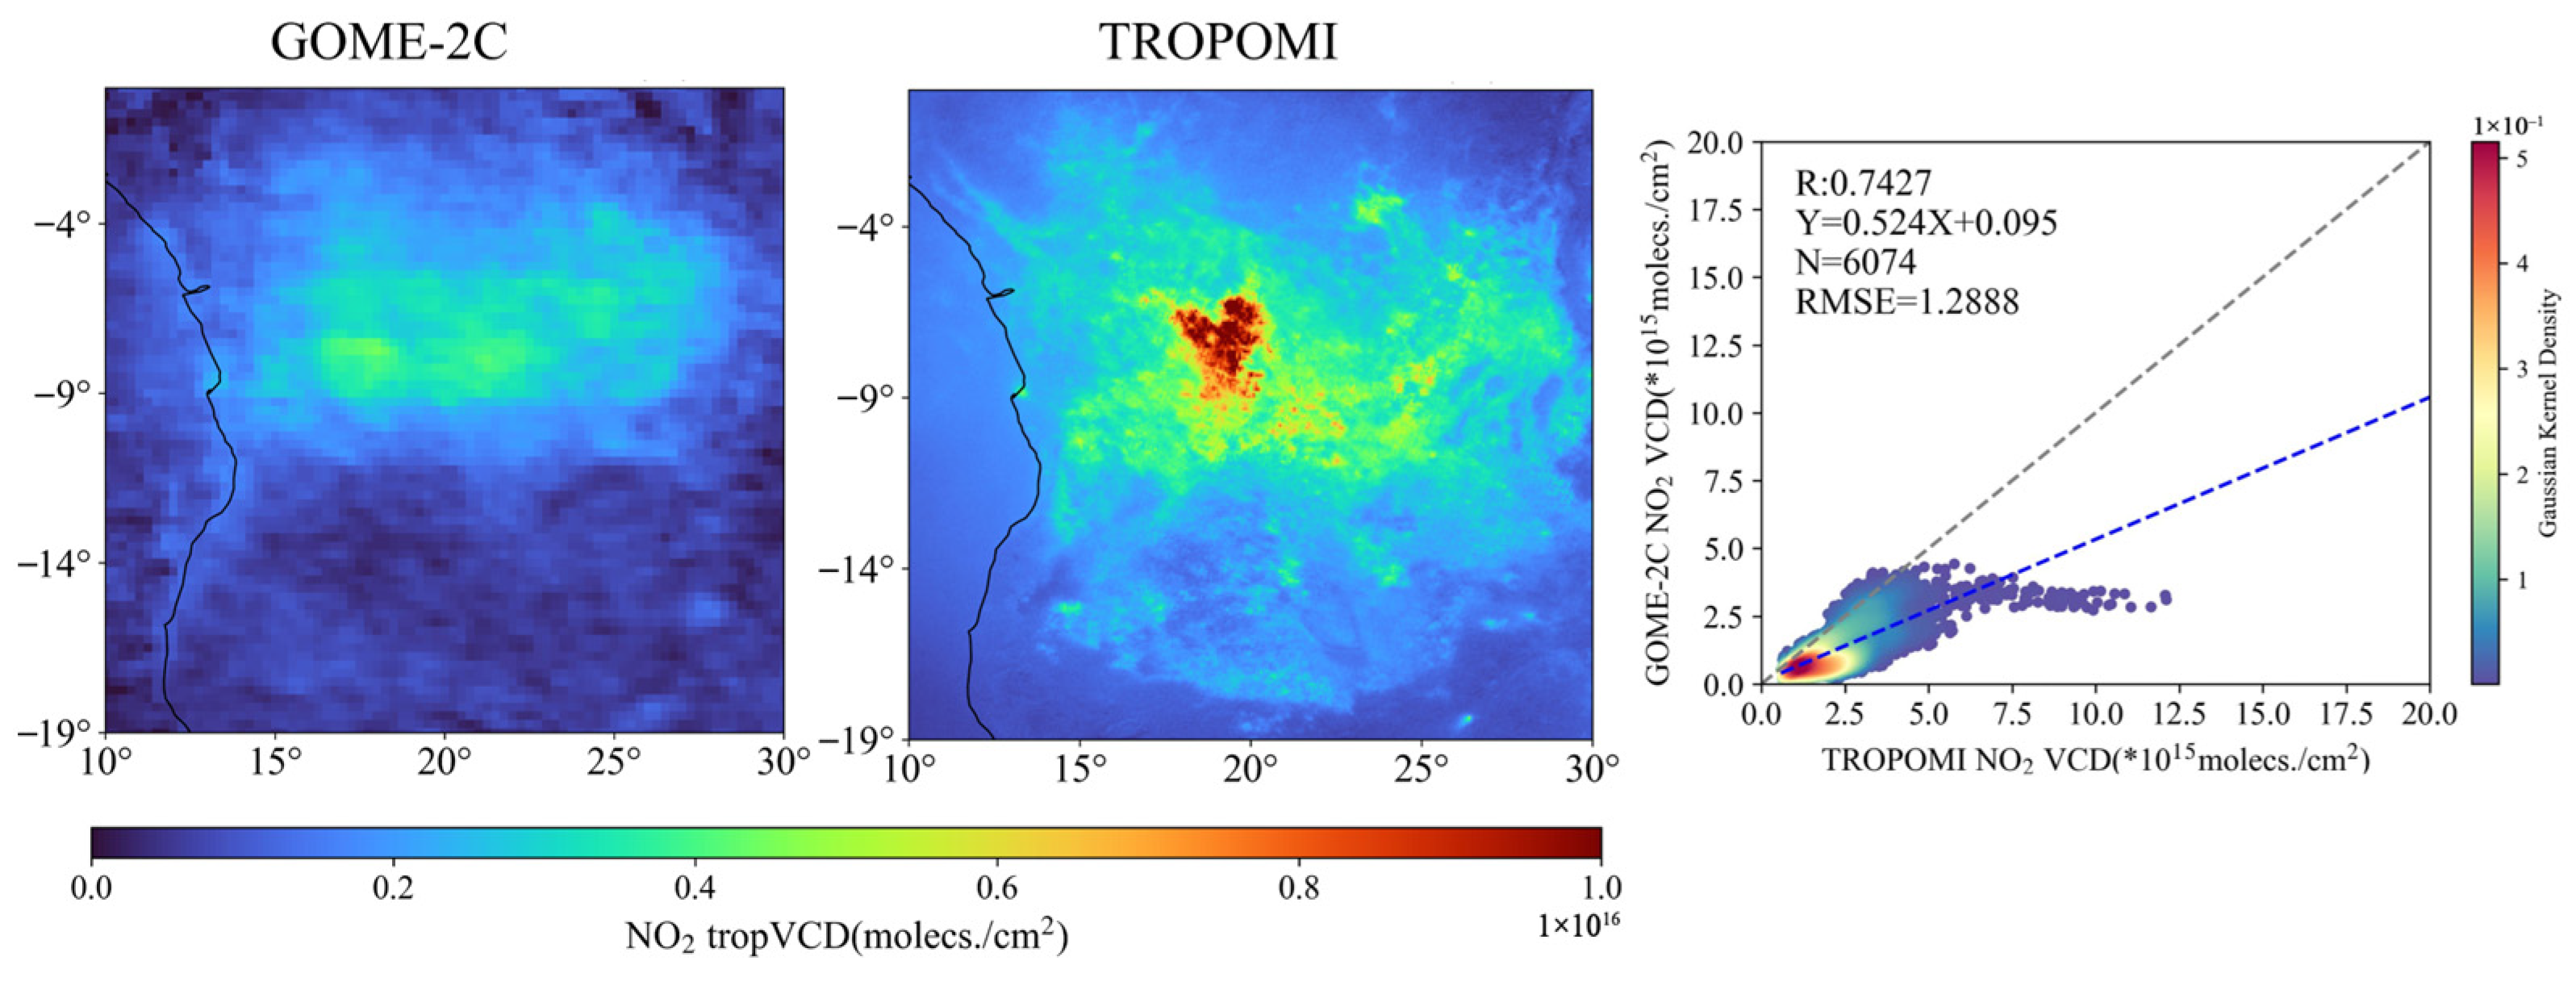
Central Africa serves as a significant case study for understanding the differences between GOME-2 and TROPOMI. NO2 VCD observations are severely impacted by seasonal biomass burning, particularly in summer, with elevated NO2 pollution levels detected by both TROPOMI and GOME-2C. Figure 8 presents the distribution and intercomparison results of NO2 VCD over Central Africa. High levels of NO2 pollution were primarily found in the wet savanna and forest regions of the Congo Basin. TROPOMI’s finer resolution enabled better detection of localized NO2 plumes from biomass burning, while GOME-2C’s coarser resolution may have smoothed out peak concentrations. Notably, the GOME-2C NO2 values were significantly lower than those of TROPOMI during summer, which contrasts with the typical understanding that morning monitoring yields higher values than afternoon monitoring. The correlation between GOME-2C and TROPOMI was R = 0.7427, with a much lower slope of 0.524, indicating greater discrepancies at higher values. In contrast, data collected during non-biomass combustion periods show that the NO2 VCD in this region remained relatively low, ranging from 0.5 × 10¹⁵ molecules/cm2 to 2.5 × 10¹⁵ molecules/cm2. The largest difference in observed values was 9.013 × 10¹⁵ molecules/cm2.
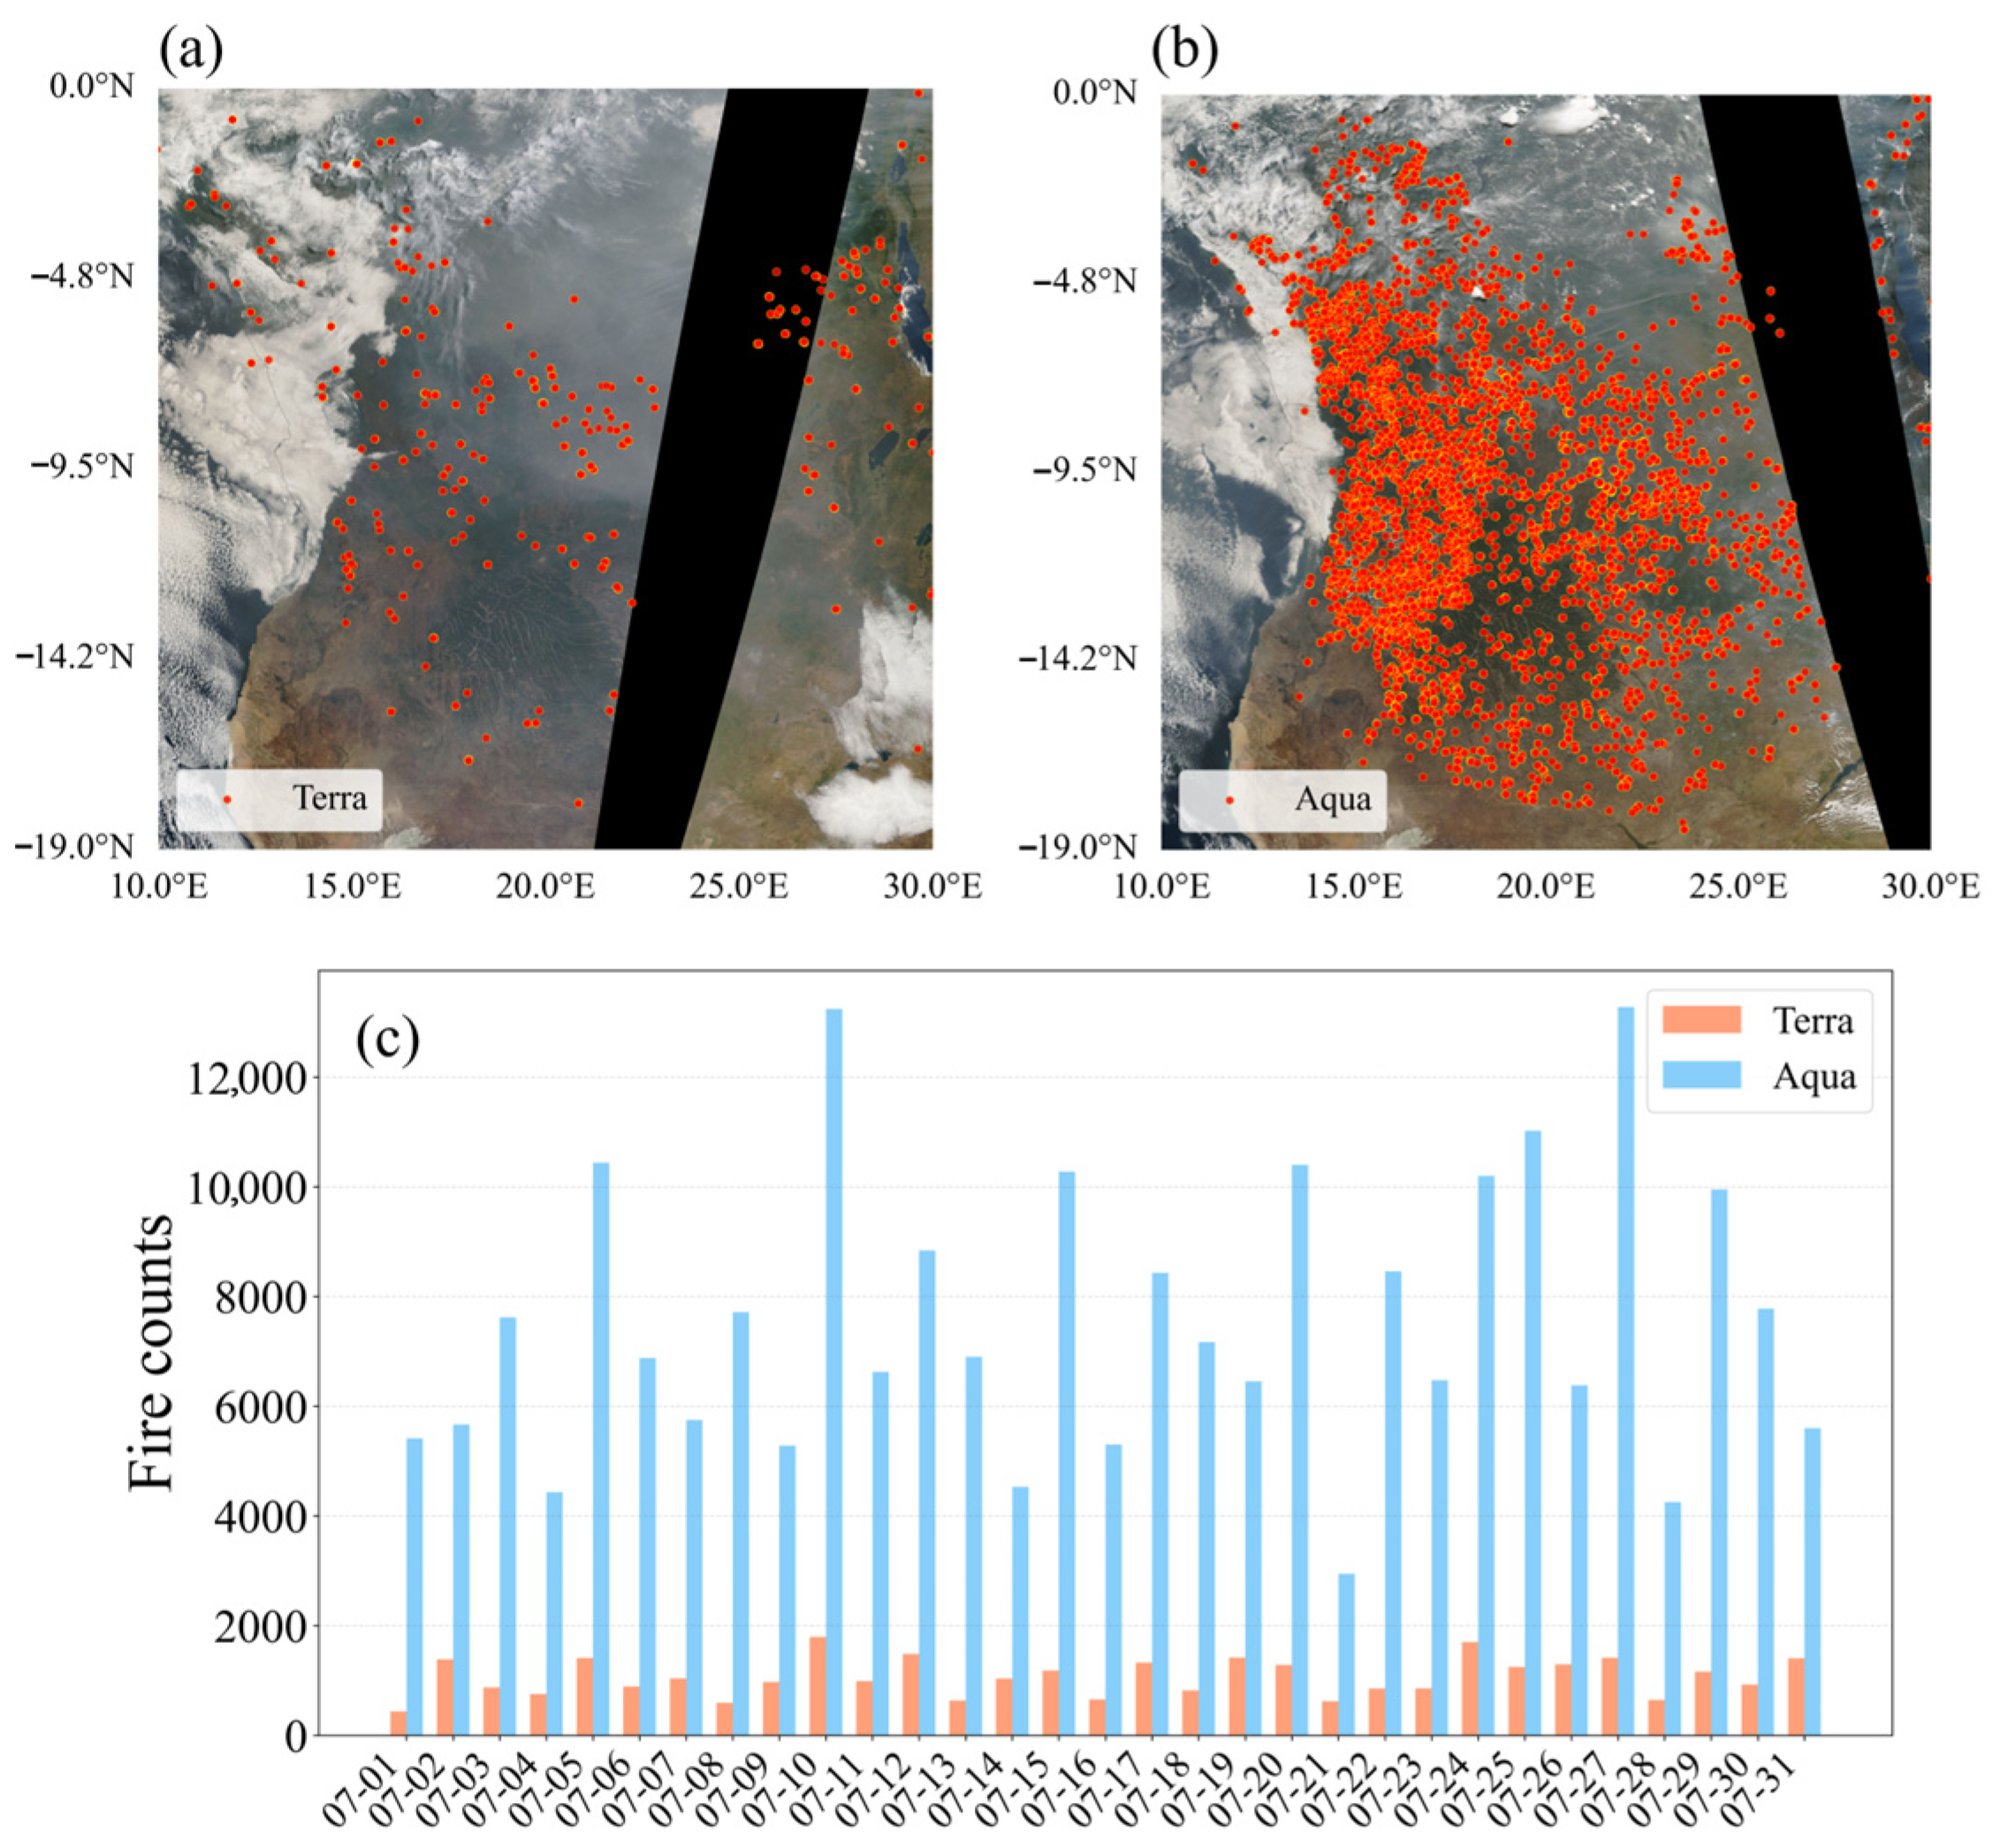
Given that the elevated NO2 VCD values affecting Central Africa are primarily attributed to biomass combustion, we mapped a distribution example of fire points in this area on 1 July 2024 (Figure 9). The results reveal a distinct pattern in which the density of fire points in the afternoon was significantly higher than in the morning, reflecting the diurnal cycle of burning activity. The distribution results show that the fire points were concentrated in the northern and southern savanna regions of the Congo Basin, with peak densities exceeding 500 fire points per 0.1° × 0.1° grid cell in the afternoon. To quantify this trend, we calculated the daily number of fire points throughout July 2024 using observations from Terra (overpass at 10:30 LT) and Aqua (overpass at 13:30 LT). Terra detected fire points ranging from 438 to 1796 per day, while Aqua recorded a substantially higher range of 2947 to 13,277 fire points per day, indicating that afternoon fire activities are approximately seven times greater than morning activities. This diurnal variation in fire point density corresponds to the NO2 VCD observations, where GOME-2C recorded significantly lower values compared to TROPOMI.

3.2.3. Europe

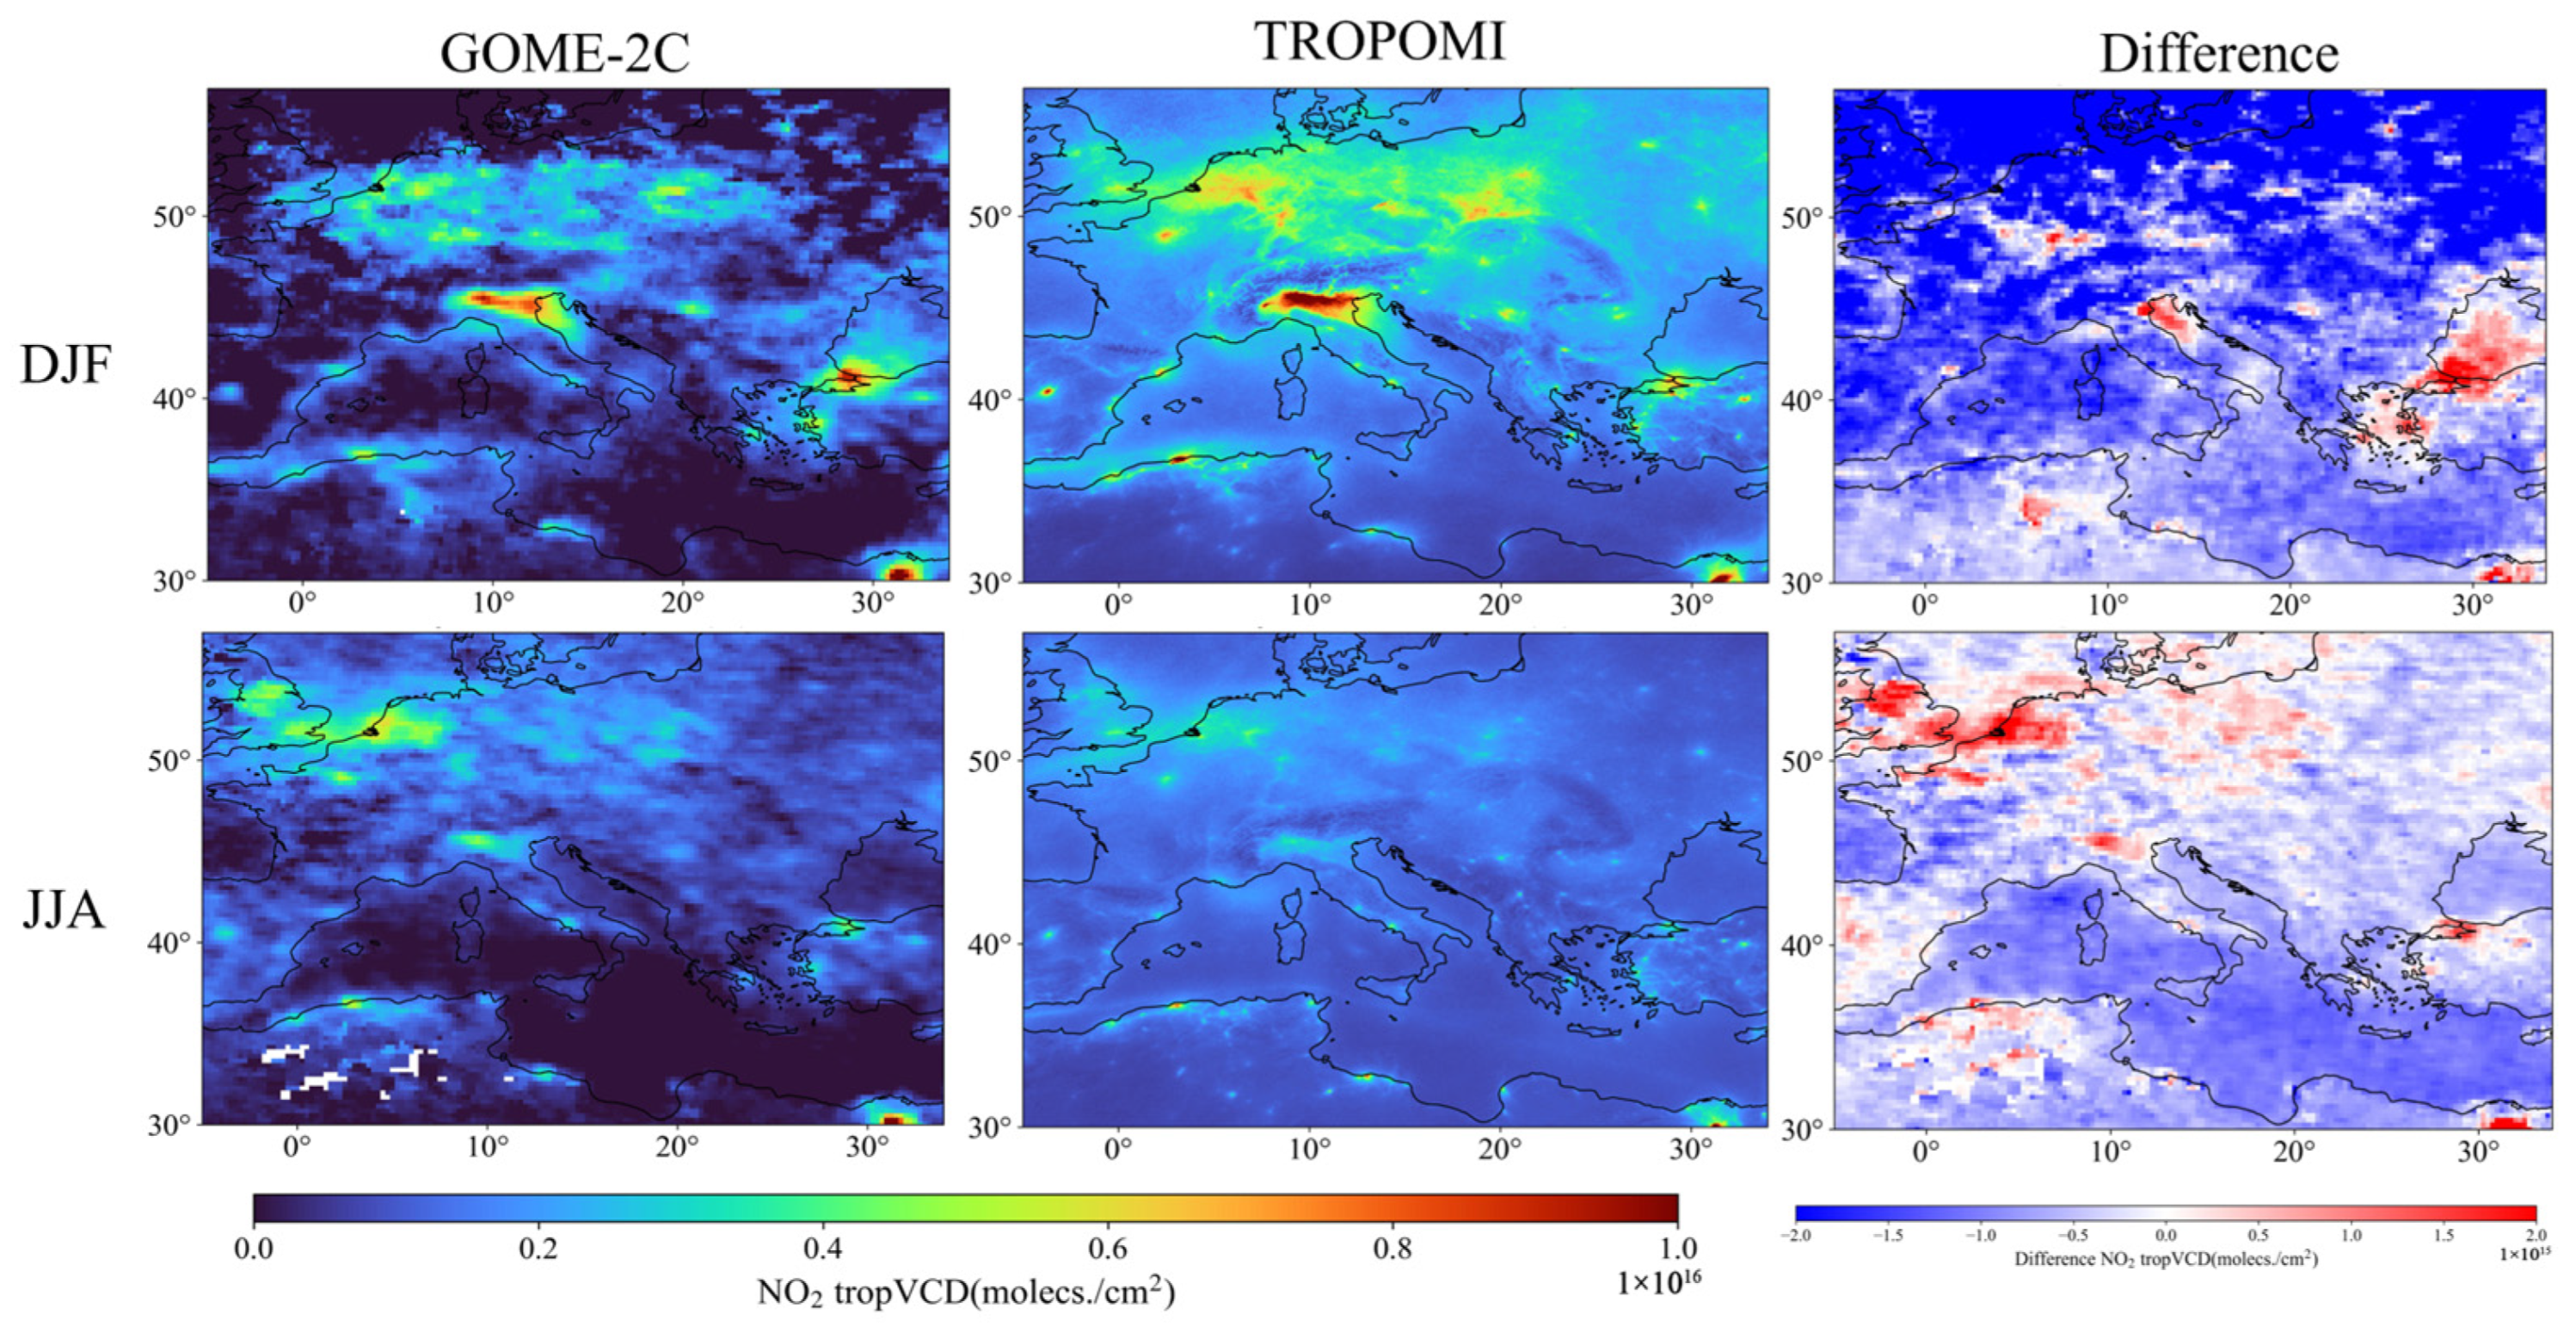
The monitoring of NO2 in Europe has garnered significant attention due to its well-established ground-based observation networks and comprehensive control measures. Figure 10 displays the spatial distribution maps of NO2 VCDs and the differences in TROPOMI and GOME-2C across Europe for the DJF and JJA seasons in 2024. The results indicate that NO2 concentrations were notably higher along the Mediterranean coast and in Western Europe, particularly in cities such as Paris and Brussels, during the winter season. A distinct low-value zone was observed in the Alps. In summer, the NO2 levels along the Mediterranean coast decreased, while the main high-value areas shifted to regions with more human activity, such as the Netherlands and the United Kingdom. Compared to GOME-2C data, TROPOMI demonstrated higher spatial resolution and a better ability to identify smaller-scale anthropogenic emission sources. The distribution of differences also shows that the background NO2 concentrations detected by GOME-2C in winter were generally lower than those recorded by TROPOMI. This difference may be influenced by GOME-2C’s monitoring capabilities in high-latitude and high-solar zenith angle regions, where there was an increased transmission path accompanied by higher noise levels. Additionally, the reduced daylight in high-latitude areas during winter resulted in weaker NO2 photochemical reactions, and the accumulation of pollutants further contributed to the observed variations in NO2 concentrations.
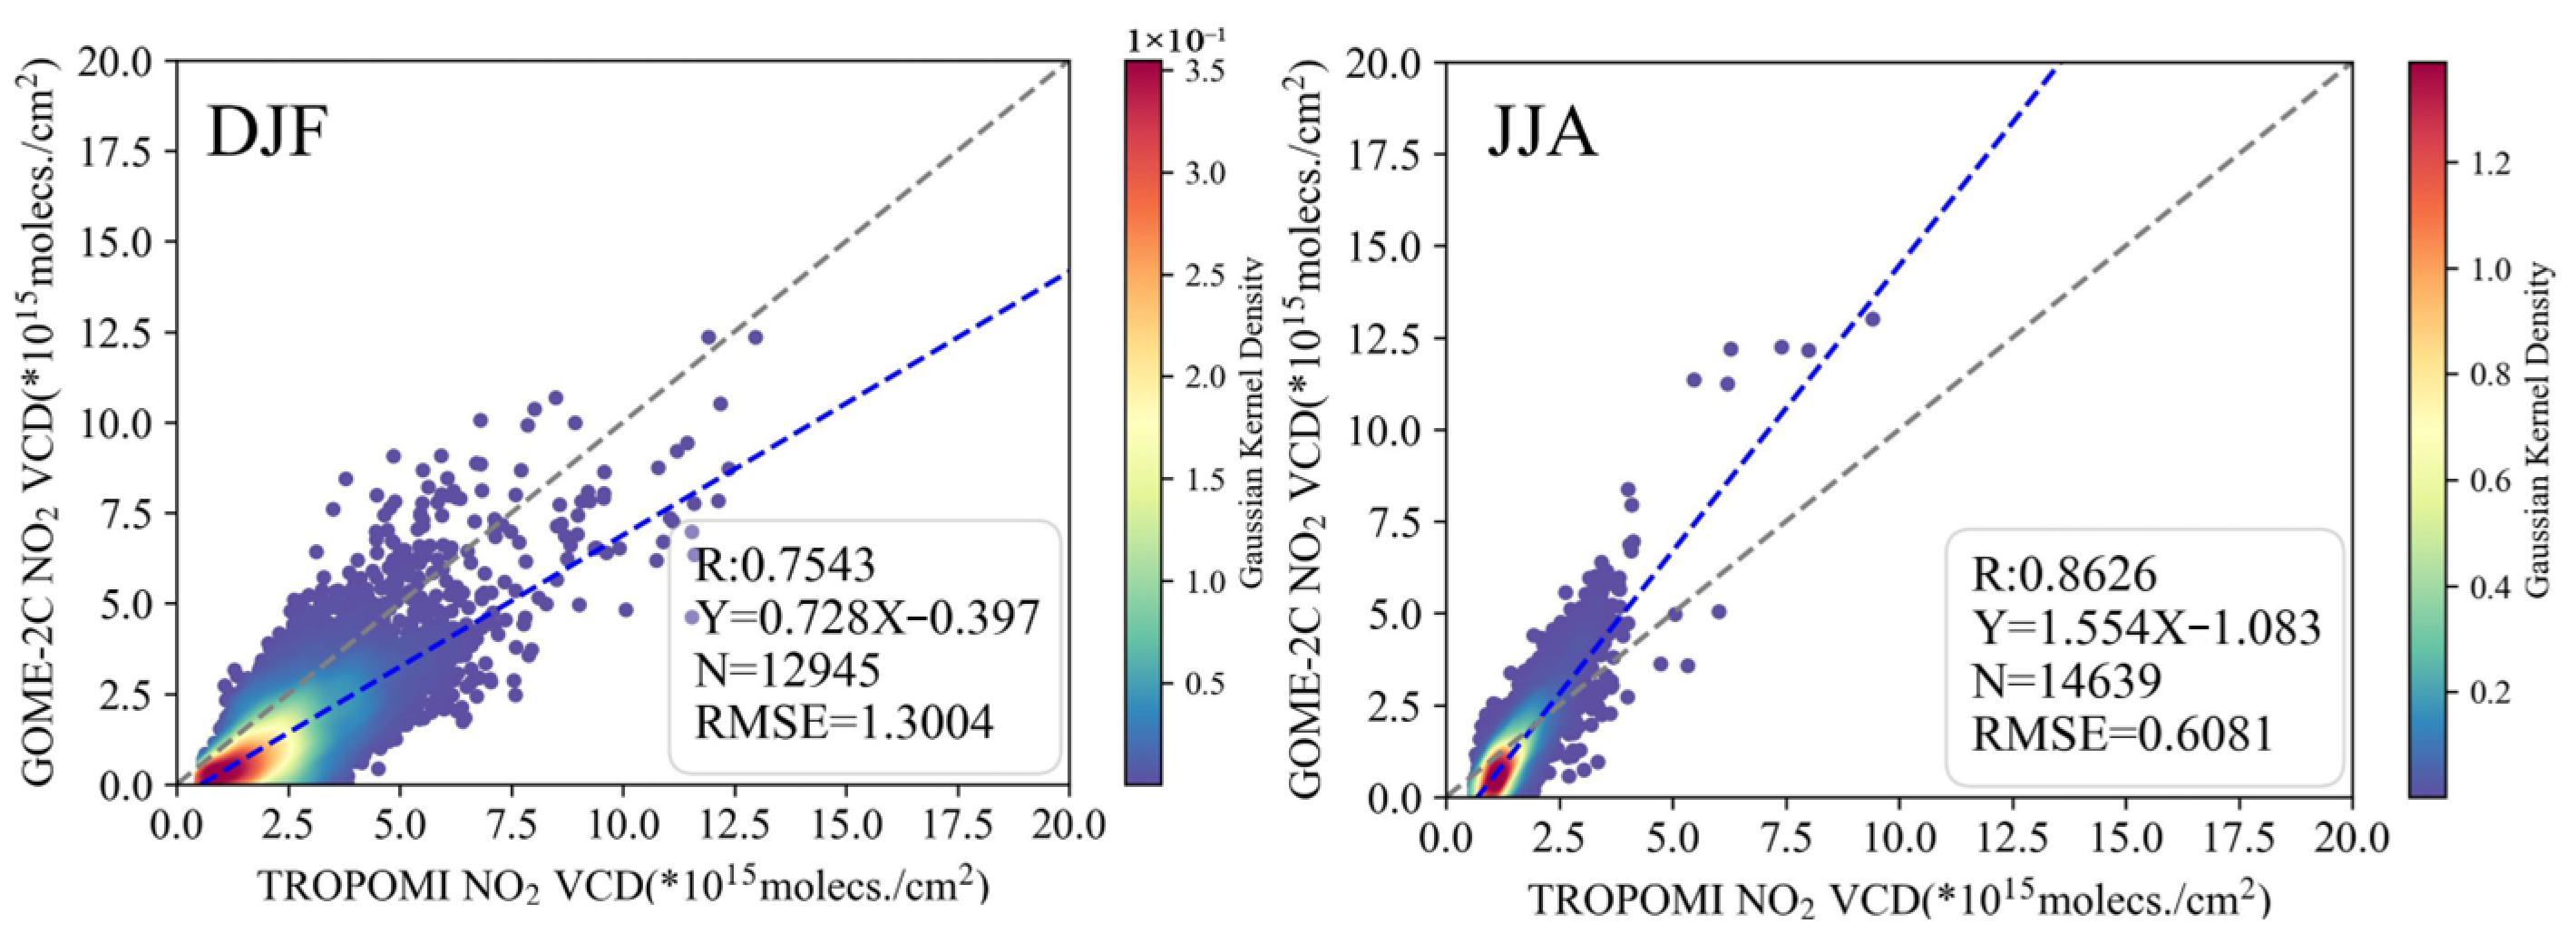
To further diagnose the systematic differences between morning and afternoon satellite observations over Europe, a direct intercomparison of GOME-2C and TROPOMI was conducted for the winter (DJF) and summer (JJA) of 2024 (Figure 11). Compared to the correlation coefficients observed in other regions, the relationship between GOME-2C and TROPOMI in Europe was relatively weaker, with values of 0.754 in DJF and 0.863 in JJA. In terms of overall concentration values, GOME-2C monitoring in summer recorded significantly higher NO2 levels than TROPOMI, with a regression slope of 1.55 and a maximum value of 13.01 × 10¹⁵ molecules/cm2, while TROPOMI’s maximum concentration reached 9.42 × 10¹⁵ molecules/cm2. In contrast, during winter, GOME-2C NO2 concentrations were notably lower than those of TROPOMI, with a regression slope of 0.754. This season also exhibited a more dispersed correlation distribution, accompanied by an RMSE of 1.3004 × 10¹⁵ molecules/cm2. These seasonal variations in NO2 VCD reflect differences influenced by pollution characteristics, meteorological conditions, and topographic factors across the European region, necessitating further analysis in conjunction with diurnal variation trends.
To further analyze the differences between GOME-2C and TROPOMI, we selected two official Pandora stations (Brussels-Uccle and Berlin) to calculate the hourly variations of the monthly average NO2 VCD. These analyses captured consistent seasonal patterns in these representative capital cities and strengthen the generalizability of our findings across Europe (Figure 12). In Brussels-Uccle, the NO2 VCD in July 2024 ranged from 1.8 × 10¹⁵ molecules/cm2 to 12.3 × 10¹⁵ molecules/cm2. Initially, the concentration of NO2 decreased due to photolysis, then gradually increased as sunlight weakened. In December 2024, the NO2 VCD showed a steady upward trend, ranging from 2.2 × 10¹⁵ molecules/cm2 to 5.5 × 10¹⁵ molecules/cm2, with the highest values observed toward the end of the day. In Berlin, the monitoring results indicate a moderately polluted area, with the NO2 VCD in July 2024 ranging from 1.3 × 10¹⁵ molecules/cm2 to 11.7 × 10¹⁵ molecules/cm2, also displaying an initial increase, followed by a decrease, and then a gradual rise. In December 2024, the NO2 VCD varied between 1.8 × 10¹⁵ molecules/cm2 to 1.44 × 10¹⁵ molecules/cm2, showing a less pronounced accumulation trend compared to Brussels-Uccle. Notably, the NO2 monitoring result at 13:30 was lower than that at 10:00 in the morning. Therefore, the differences in monitoring results between GOME-2C and TROPOMI should be classified according to the varying pollution levels in different regions. The pollution captured by polar-orbiting satellites at a single time may not accurately represent the overall pollution concentration for the entire day, leading to uncertainties in the calculation of NO2 emissions.

4. Discussion

Assessment of NO2 VCD differences between GOME-2C and TROPOMI enhances our understanding of diurnal variations, despite the limitations of polar-orbiting monitoring. A comparative analysis across various typical regions, including East Asia, Central Africa, and Europe, during different seasons revealed that, despite the differing spatial resolutions of GOME-2C and TROPOMI, the NO2 products used in this study effectively identified NO2 pollution and showed good consistency [52]. Additionally, the NO2 concentrations monitored by satellite were lower than those recorded by ground-based monitoring. This discrepancy is linked to the satellite’s coarse resolution, errors in vertical profile assumptions, and imperfect cloud processing [50].
The performance of typical areas under varying pollution characteristics and meteorological conditions on GOME-2C and TROPOMI also differed. High pollution values in East Asia were primarily found in urban areas with increased human activity, such as the North China Plain, the YRD, Seoul, and Tokyo, particularly noticeable in winter [65]. Due to the strong photolysis effect, NO2 concentrations were generally lower in summer. The difference between morning and afternoon monitoring results in winter was less pronounced than in summer, mainly due to the accumulation of regional NO2 caused by stagnant air masses and temperature inversion phenomena [66,67]. This phenomenon is also associated with a reduced photolysis effect accompanied by weaker light intensity [44]. The comparison with GEMS also revealed significant differences between polar-orbiting and geostationary satellite observations (Figure 6). These discrepancies are primarily attributed to differences in retrieval algorithms and instrument characteristics. In our analysis, the NO2 concentrations observed by GEMS were up to 60% higher than those retrieved by TROPOMI over the same region [68]. Despite these differences, the combined use of polar-orbiting and geostationary satellites enables multi-temporal and global coverage, providing a more comprehensive understanding of atmospheric NO2 dynamics and improving the temporal resolution of air quality monitoring [46].
NO2 pollution in Central Africa, primarily influenced by biomass combustion, presents a distinct case for examining diurnal variation in NO2 concentrations. During the summer, the number of fire events in the morning (GOME-2C) was significantly lower than in the afternoon (TROPOMI), which aligns with satellite observations showing elevated NO2 levels later in the day. This seasonal and temporal pattern deviates from the commonly observed diurnal cycle in urban–industrial regions, where NO2 concentrations typically peak in the morning due to anthropogenic emissions. In Central Africa, biomass burning predominantly occurred in the afternoon, intensifying NO2 accumulation and substantially increasing pollutant levels in the lower and middle troposphere [39].
The analysis of NO2 pollution from GOME-2C and TROPOMI over Europe indicated that urban areas with industrial activities and dense populations were high-level NO2 areas [41]. Similar to the pollution characteristics observed in East Asia, TROPOMI captured elevated values during its 13:30 overpass time, which can be attributed to the pollution accumulation and fewer photochemical reactions in high-latitude regions. Seasonal patterns showed that the NO2 concentrations over Europe were generally higher in winter due to increased heating-related emissions, shallow boundary layers, and reduced photochemical activity [69]. These conditions favor pollutant accumulation and explain the pronounced NO2 enhancements observed by both GOME-2C and TROPOMI during winter.
The comparative analysis of NO2 pollution characteristics across the three representative regions using GOME-2C and TROPOMI data highlighted the limitations of relying on a single polar-orbiting satellite. Due to their fixed overpass times, these satellites cannot fully capture the diurnal variation in NO2 emissions, introducing uncertainties in emission estimation and temporal trend analysis [46]. The limited temporal sampling of polar-orbiting satellites constrains their utility in capturing short-term NO2 peaks related to traffic or industrial activity, potentially leading to underestimation of exposure levels in urban areas. In contrast, geostationary missions like GEMS or TEMPO offer hourly observations that can better inform time-sensitive policy interventions such as traffic restrictions or emission alerts. The development of geostationary satellite platforms offers a promising solution to this constraint by enabling continuous observations. Currently, GEMS provides high-frequency NO2 monitoring over East Asia, while TEMPO covers North America. The upcoming Sentinel-4 mission will extend this capability to Europe and parts of Africa, offering consistent and detailed measurements across key regions.
Although geostationary satellites offer valuable long-term monitoring of diurnal variations over fixed regions, polar-orbiting satellites remain essential for observing NO2 pollution in areas outside the coverage of geostationary platforms. In the future, integrating data from both polar-orbiting and geostationary satellites will significantly enhance our understanding of NO2 pollution dynamics on a global scale. This synergistic approach will support more accurate emission assessments, improve temporal resolution, and provide a stronger scientific basis for analyzing the sources and behaviors of NO2 in diverse atmospheric environments.

5. Conclusions

In this study, we evaluated the differences in NO2 observations between the morning overpass of GOME-2C and the afternoon overpass of TROPOMI across three representative regions: East Asia, Central Africa, and Europe. Validation against ground-based datasets revealed that the fixed local overpass times of polar-orbiting satellites limit their ability to fully capture the diurnal cycle of NO2. These limitations are especially pronounced in regions with strong temporal variability or dominated by natural emission sources, such as biomass burning.
Regional analysis revealed distinct pollution characteristics across the study areas. In East Asia, NO2 pollution was concentrated in urban and metropolitan clusters, with significantly higher concentrations observed in winter. Higher differences between morning and afternoon satellite observations in winter were identified due to the reduced photolysis rate and enhanced pollutant accumulation. In Central Africa, where biomass burning is the dominant source, afternoon fire activity resulted in consistently higher NO2 values observed by TROPOMI compared to GOME-2C. Over Europe, high NO2 concentrations were found in Western Europe and Mediterranean regions, with a clear seasonal pattern of higher values in winter. The weaker solar radiation at higher latitudes resulted in a reduced photochemical removal of NO2, contributing to a gradual increase during the day. Comparisons with Pandora ground-based observations across East Asia and Europe, and with GEMS data specifically over East Asia, further confirmed these findings, underscoring the influence of emission type, meteorological conditions, and satellite overpass time on observed NO2 levels.
In summary, this study investigated the pollution characteristics of NO2 across different regions and assessed the differences in monitoring between morning and afternoon using both satellite and ground-based datasets. The analysis highlighted the limitations of polar-orbiting satellites in monitoring diurnal variations. Integrating high-frequency geostationary satellite data (e.g., GEMS, TEMPO, and Sentinel-4) with globally consistent polar-orbiting satellite observations presents a promising approach for more accurate and comprehensive monitoring of NO2 dynamics across different regions. Our findings provide a reliable reference for understanding NO2 pollution characteristics and for the future development of geostationary satellites and emission estimation.

Author Contributions

Conceptualization, J.T. and L.C.; formal analysis, Y.L. and J.F.; methodology, Y.L., C.Y. and Y.Z.; writing—original draft preparation, Y.L.; writing—review and editing, C.Y., Y.L. and M.F. All authors have read and agreed to the published version of the manuscript.

Funding

This research was funded by the National Key Research and Development Program of China (Grant No. 2022YFC3700102) and the National Natural Science Foundation of China (Grant No. 42171393).

Data Availability Statement

Publicly available datasets were analyzed in this study. The TROPOMI data can be downloaded from https://disc.gsfc.nasa.gov/ (accessed on 12 February 2025). The GOME-2C data can be downloaded from https://acsaf.org/ (accessed on 21 May 2025). Pandora ground-based data can be accessed from https://www.pandonia-global-network.org/ (accessed on 10 May 2025), and GEMS data can be accessed from https://nesc.nier.go.kr/ (accessed on 28 June 2025).

Acknowledgments

We would like to thank the following agencies for providing the satellite data used in this study. The TROPOMI Level 2 NO2 product was developed by the Royal Netherlands Meteorological Institute (KNMI), with funding from the Netherlands Space Office (NSO), and processed with support from the European Space Agency (ESA). The GOME-2C Level 3 NO2 products were provided by EUMETSAT and processed as part of the AC SAF (Atmospheric Composition Satellite Application Facility). The Pandora data used in this study were obtained from the Pandonia Global Network (PGN), which is jointly supported by ESA and NASA.

Conflicts of Interest

The authors declare no conflicts of interest.

References

  1. Yin, H.; Sun, Y.; Notholt, J.; Palm, M.; Liu, C. Spaceborne Tropospheric Nitrogen Dioxide (NO2) Observations from 2005–2020 over the Yangtze River Delta (YRD), China: Variabilities, Implications, and Drivers. Atmos. Chem. Phys. 2022, 22, 4167–4185. [Google Scholar] [CrossRef]
  2. Jin, X.; Holloway, T. Spatial and Temporal Variability of Ozone Sensitivity over China Observed from the Ozone Monitoring Instrument: OZONE SENSITIVITY OVER CHINA. J. Geophys. Res. Atmos. 2015, 120, 7229–7246. [Google Scholar] [CrossRef]
  3. Van Geffen, J.; Boersma, K.F.; Eskes, H.; Sneep, M.; Ter Linden, M.; Zara, M.; Veefkind, J.P. S5P TROPOMI NO2 Slant Column Retrieval: Method, Stability, Uncertainties and Comparisons with OMI. Atmos. Meas. Tech. 2020, 13, 1315–1335. [Google Scholar] [CrossRef]
  4. Zhang, C.; Liu, C.; Chan, K.L.; Hu, Q.; Liu, H.; Li, B.; Xing, C.; Tan, W.; Zhou, H.; Si, F.; et al. First Observation of Tropospheric Nitrogen Dioxide from the Environmental Trace Gases Monitoring Instrument Onboard the GaoFen-5 Satellite. Light Sci. Appl. 2020, 9, 66. [Google Scholar] [CrossRef]
  5. Seo, S.; Valks, P.; Lutz, R.; Heue, K.-P.; Hedelt, P.; Loyola, D.; Lee, H.; Kim, J. Tropospheric NO2 Retrieval Algorithm for Geostationary Satellite Instruments: Applications to GEMS. Atmos. Meas. Tech. 2024, 17, 20. [Google Scholar] [CrossRef]
  6. Lange, K.; Richter, A.; Burrows, J.P. Variability of Nitrogen Oxide Emission Fluxes and Lifetimes Estimated from Sentinel-5P TROPOMI Observations. Atmos. Chem. Phys. 2022, 22, 2745–2767. [Google Scholar] [CrossRef]
  7. Krotkov, N.A.; Lamsal, L.N.; Celarier, E.A.; Swartz, W.H.; Marchenko, S.V.; Bucsela, E.J.; Chan, K.L.; Wenig, M.; Zara, M. The Version 3 OMI NO2 Standard Product. Atmos. Meas. Tech. 2017, 10, 3133–3149. [Google Scholar] [CrossRef]
  8. Chang, L.-S.; Kim, D.; Hong, H.; Kim, D.-R.; Yu, J.-A.; Lee, K.; Lee, H.; Kim, D.; Hong, J.; Jo, H.-Y.; et al. Evaluation of Correlated Pandora Column NO2 and in Situ Surface NO2 Measurements during GMAP Campaign. Atmos. Chem. Phys. 2022, 22, 10703–10720. [Google Scholar] [CrossRef]
  9. Liu, O.; Li, Z.; Lin, Y.; Fan, C.; Zhang, Y.; Li, K.; Zhang, P.; Wei, Y.; Chen, T.; Dong, J.; et al. Evaluation of the First Year of Pandora NO2 Measurements over Beijing and Application to Satellite Validation. Atmos. Meas. Tech. 2024, 17, 377–395. [Google Scholar] [CrossRef]
  10. Chan, K.L.; Wiegner, M.; van Geffen, J.; De Smedt, I.; Alberti, C.; Cheng, Z.; Ye, S.; Wenig, M. MAX-DOAS Measurements of Tropospheric NO2 and HCHO in Munich and the Comparison to OMI and TROPOMI Satellite Observations. Atmos. Meas. Tech. 2020, 13, 4499–4520. [Google Scholar] [CrossRef]
  11. Burrows, J.P.; Weber, M.; Buchwitz, M.; Rozanov, V.; Ladstätter-Weißenmayer, A.; Richter, A.; DeBeek, R.; Hoogen, R.; Bramstedt, K.; Eichmann, K.-U.; et al. The Global Ozone Monitoring Experiment (GOME): Mission Concept and First Scientific Results. J. Atmos. Sci. 1999, 56, 151–175. [Google Scholar] [CrossRef]
  12. Bovensmann, H.; Burrows, J.P.; Buchwitz, M.; Frerick, J.; Noël, S.; Rozanov, V.V.; Chance, K.V.; Goede, A.P.H. SCIAMACHY: Mission Objectives and Measurement Modes. J. Atmos. Sci. 1999, 56, 127–150. [Google Scholar] [CrossRef]
  13. Richter, A.; Burrows, J.; Fietkau, S.; Medeke, T.; Notholt, J.; Oetjen, H.; Sierk, B.; Warneke, T.; Wittrock, F.; Dix, B.; et al. A Scientific NO2 Product from SCIAMACHY: First Results and Validation. Atmos. Chem. Valid. ENVISAT (ACVE-2) 2004, 562, 41.1. [Google Scholar]
  14. Liu, S.; Valks, P.; Pinardi, G.; De Smedt, I.; Yu, H.; Beirle, S.; Richter, A. An Improved Total and Tropospheric NO2 Column Retrieval for GOME-2. Atmos. Meas. Tech. 2019, 12, 1029–1057. [Google Scholar] [CrossRef]
  15. Callies, J.; Corpaccioli, E.; Eisinger, M.; Hahne, A.; Lefebvre, A. GOME-2–Metop’s Second-Generation Sensor for Operational Ozone Monitoring. ESA Bull. 2000, 102, 28–36. [Google Scholar]
  16. Levelt, P.F.; Van Den Oord, G.H.J.; Dobber, M.R.; Malkki, A.; Visser, H.; De Vries, J.; Stammes, P.; Lundell, J.O.V.; Saari, H. The Ozone Monitoring Instrument. IEEE Trans. Geosci. Remote Sens. 2006, 44, 1093–1101. [Google Scholar] [CrossRef]
  17. Ialongo, I.; Virta, H.; Eskes, H.; Hovila, J.; Douros, J. Comparison of TROPOMI/Sentinel-5 Precursor NO2 Observations with Ground-Based Measurements in Helsinki. Atmos. Meas. Tech. 2020, 13, 205–218. [Google Scholar] [CrossRef]
  18. Veefkind, J.P.; Aben, I.; McMullan, K.; Förster, H.; De Vries, J.; Otter, G.; Claas, J.; Eskes, H.J.; De Haan, J.F.; Kleipool, Q.; et al. TROPOMI on the ESA Sentinel-5 Precursor: A GMES Mission for Global Observations of the Atmospheric Composition for Climate, Air Quality and Ozone Layer Applications. Remote Sens. Environ. 2012, 120, 70–83. [Google Scholar] [CrossRef]
  19. Zhang, C.; Liu, C.; Wang, Y.; Si, F.; Zhou, H.; Zhao, M.; Su, W.; Zhang, W.; Chan, K.L.; Liu, X.; et al. Preflight Evaluation of the Performance of the Chinese Environmental Trace Gas Monitoring Instrument (EMI) by Spectral Analyses of Nitrogen Dioxide. IEEE Trans. Geosci. Remote Sens. 2018, 56, 3323–3332. [Google Scholar] [CrossRef]
  20. Wang, Q.; Zhang, P.; Xu, N.; Chen, L.; Wu, R.; Liu, J.; Si, F. An Investigation on Inter-Calibrating EMI/GF-5 With TROPOMI/S5p in Ultraviolet–Visible Spectra. IEEE Trans. Geosci. Remote Sens. 2022, 60, 5540916. [Google Scholar] [CrossRef]
  21. Kim, J.; Jeong, U.; Ahn, M.-H.; Kim, J.H.; Park, R.J.; Lee, H.; Song, C.H.; Choi, Y.-S.; Lee, K.-H.; Yoo, J.-M.; et al. New Era of Air Quality Monitoring from Space: Geostationary Environment Monitoring Spectrometer (GEMS). Bull. Am. Meteorol. Soc. 2020, 101, E1–E22. [Google Scholar] [CrossRef]
  22. Zoogman, P.; Liu, X.; Suleiman, R.M.; Pennington, W.F.; Flittner, D.E.; Al-Saadi, J.A.; Hilton, B.B.; Nicks, D.K.; Newchurch, M.J.; Carr, J.L.; et al. Tropospheric Emissions: Monitoring of Pollution (TEMPO). J. Quant. Spectrosc. Radiat. Transf. 2017, 186, 17–39. [Google Scholar] [CrossRef]
  23. Boersma, K.F.; Eskes, H.J.; Dirksen, R.J.; Van Der A, R.J.; Veefkind, J.P.; Stammes, P.; Huijnen, V.; Kleipool, Q.L.; Sneep, M.; Claas, J.; et al. An Improved Tropospheric NO2 Column Retrieval Algorithm for the Ozone Monitoring Instrument. Atmos. Meas. Tech. 2011, 4, 1905–1928. [Google Scholar] [CrossRef]
  24. Liu, S.; Valks, P.; Pinardi, G.; Xu, J.; Argyrouli, A.; Lutz, R.; Tilstra, L.G.; Huijnen, V.; Hendrick, F.; Van Roozendael, M. An Improved Air Mass Factor Calculation for Nitrogen Dioxide Measurements from the Global Ozone Monitoring Experiment-2 (GOME-2). Atmos. Meas. Tech. 2020, 13, 755–787. [Google Scholar] [CrossRef]
  25. Van Geffen, J.; Eskes, H.; Compernolle, S.; Pinardi, G.; Verhoelst, T.; Lambert, J.-C.; Sneep, M.; Ter Linden, M.; Ludewig, A.; Boersma, K.F.; et al. Sentinel-5P TROPOMI NO2 Retrieval: Impact of Version v2.2 Improvements and Comparisons with OMI and Ground-Based Data. Atmos. Meas. Tech. 2022, 15, 2037–2060. [Google Scholar] [CrossRef]
  26. Goldberg, D.L.; Tao, M.; Kerr, G.H.; Ma, S.; Tong, D.Q.; Fiore, A.M.; Dickens, A.F.; Adelman, Z.E.; Anenberg, S.C. Evaluating the Spatial Patterns of U.S. Urban NOx Emissions Using TROPOMI NO2. Remote Sens. Environ. 2024, 300, 113917. [Google Scholar] [CrossRef]
  27. Kong, Y.; Zheng, B.; Liu, Y. Tracking Daily NOx Emissions from an Urban Agglomeration Based on TROPOMI NO2 and a Local Ensemble Transform Kalman Filter. Atmos. Chem. Phys. 2025, 25, 5959–5976. [Google Scholar] [CrossRef]
  28. Zhao, Z.; Lu, Y.; Zhan, Y.; Cheng, Y.; Yang, F.; Brook, J.R.; He, K. Long-Term Spatiotemporal Variations in Surface NO2 for Beijing Reconstructed from Surface Data and Satellite Retrievals. Sci. Total Environ. 2023, 904, 166693. [Google Scholar] [CrossRef]
  29. Liu, S.; Valks, P.; Beirle, S.; Loyola, D.G. Nitrogen Dioxide Decline and Rebound Observed by GOME-2 and TROPOMI during COVID-19 Pandemic. Air Qual. Atmos. Health 2021, 14, 1737–1755. [Google Scholar] [CrossRef]
  30. Hilboll, A.; Richter, A.; Burrows, J.P. Long-Term Changes of Tropospheric NO2 over Megacities Derived from Multiple Satellite Instruments. Atmos. Chem. Phys. 2013, 13, 4145–4169. [Google Scholar] [CrossRef]
  31. Sun, W.; Lu, K.; Li, R. Global Estimates of Ambient NO2 Concentrations and Long-Term Health Effects during 2000–2019. Environ. Pollut. 2024, 359, 124562. [Google Scholar] [CrossRef]
  32. Huang, K.; Zhu, Q.; Lu, X.; Gu, D.; Liu, Y. Satellite-Based Long-Term Spatiotemporal Trends in Ambient NO2 Concentrations and Attributable Health Burdens in China From 2005 to 2020. GeoHealth 2023, 7, e2023GH000798. [Google Scholar] [CrossRef] [PubMed]
  33. Zhang, H.; Lin, Y.; Wei, S.; Loo, B.P.Y.; Lai, P.C.; Lam, Y.F.; Wan, L.; Li, Y. Global Association between Satellite-Derived Nitrogen Dioxide (NO2) and Lockdown Policies under the COVID-19 Pandemic. Sci. Total Environ. 2021, 761, 144148. [Google Scholar] [CrossRef] [PubMed]
  34. Yang, S.; Li, M.; Guo, C.; Requia, W.J.; Sakhvidi, M.J.Z.; Lin, K.; Zhu, Q.; Chen, Z.; Cao, P.; Yang, L.; et al. Associations of Long-Term Exposure to Nitrogen Oxides with All-Cause and Cause-Specific Mortality. Nat. Commun. 2025, 16, 1730. [Google Scholar] [CrossRef] [PubMed]
  35. Yang, L.H.; Jacob, D.J.; Dang, R.; Oak, Y.J.; Lin, H.; Kim, J.; Zhai, S.; Colombi, N.K.; Pendergrass, D.C.; Beaudry, E.; et al. Interpreting Geostationary Environment Monitoring Spectrometer (GEMS) Geostationary Satellite Observations of the Diurnal Variation in Nitrogen Dioxide (NO 2 ) over East Asia. Atmos. Chem. Phys. 2024, 24, 7027–7039. [Google Scholar] [CrossRef]
  36. Park, J.; Hong, H.; Lee, H.; Kim, S.-W.; Kim, J.; Van Roozendael, M.; Fayt, C.; Ahn, M.-H.; Jacob, D.J.; Seo, S.; et al. Tropospheric Nitrogen Dioxide Levels Vary Diurnally in Asian Cities. Commun. Earth Environ. 2025, 6, 389. [Google Scholar] [CrossRef]
  37. Li, D.; Qin, K.; Cohen, J.B.; He, Q.; Wang, S.; Li, D.; Zhou, X.; Ling, X.; Xue, Y. Combing GOME-2B and OMI Satellite Data to Estimate Near-Surface NO2 of Mainland China. IEEE J. Sel. Top. Appl. Earth Obs. Remote Sens. 2021, 14, 10269–10277. [Google Scholar] [CrossRef]
  38. Ahmad, N.; Lin, C.; Lau, A.K.H.; Kim, J.; Zhang, T.; Yu, F.; Li, C.; Li, Y.; Fung, J.C.H.; Lao, X.Q. Estimation of Ground-Level NO2 and Its Spatiotemporal Variations in China Using GEMS Measurements and a Nested Machine Learning Model. Atmos. Chem. Phys. 2024, 24, 9645–9665. [Google Scholar] [CrossRef]
  39. Hickman, J.E.; Andela, N.; Tsigaridis, K.; Galy-Lacaux, C.; Ossohou, M.; Bauer, S.E. Reductions in NO2 Burden over North Equatorial Africa from Decline in Biomass Burning in Spite of Growing Fossil Fuel Use, 2005 to 2017. Proc. Natl. Acad. Sci. USA 2021, 118, e2002579118. [Google Scholar] [CrossRef]
  40. Boersma, K.F.; Jacob, D.J.; Eskes, H.J.; Pinder, R.W.; Wang, J.; Van Der A, R.J. Intercomparison of SCIAMACHY and OMI Tropospheric NO2 Columns: Observing the Diurnal Evolution of Chemistry and Emissions from Space. J. Geophys. Res. Atmos. 2008, 113, 2007JD008816. [Google Scholar] [CrossRef]
  41. Liu, S.; Valks, P.; Pinardi, G.; Xu, J.; Chan, K.L.; Argyrouli, A.; Lutz, R.; Beirle, S.; Khorsandi, E.; Baier, F.; et al. An Improved TROPOMI Tropospheric NO2 Research Product over Europe. Atmos. Meas. Tech. 2021, 14, 7297–7327. [Google Scholar] [CrossRef]
  42. Chang, B.; Liu, H.; Zhang, C.; Xing, C.; Tan, W.; Liu, C. Relating Satellite NO2 Tropospheric Columns to Near-Surface Concentrations: Implications from Ground-Based MAX-DOAS NO2 Vertical Profile Observations. Npj Clim. Atmos. Sci. 2025, 8, 1. [Google Scholar] [CrossRef]
  43. Tao, M.; Fiore, A.M.; Karambelas, A.; Miller, P.J.; Valin, L.C.; Judd, L.M.; Tzortziou, M.; Whitehill, A.; Teora, A.; Tian, Y.; et al. Insights Into Summertime Surface Ozone Formation From Diurnal Variations in Formaldehyde and Nitrogen Dioxide Along a Transect Through New York City. J. Geophys. Res. Atmos. 2025, 130, e2024JD040922. [Google Scholar] [CrossRef]
  44. Edwards, D.P.; Martínez-Alonso, S.; Jo, D.S.; Ortega, I.; Emmons, L.K.; Orlando, J.J.; Worden, H.M.; Kim, J.; Lee, H.; Park, J.; et al. Quantifying the Diurnal Variation in Atmospheric NO2 from Geostationary Environment Monitoring Spectrometer (GEMS) Observations. Atmos. Chem. Phys. 2024, 24, 8943–8961. [Google Scholar] [CrossRef]
  45. Kamińska, J.A. A Random Forest Partition Model for Predicting NO2 Concentrations from Traffic Flow and Meteorological Conditions. Sci. Total Environ. 2019, 651, 475–483. [Google Scholar] [CrossRef] [PubMed]
  46. Penn, E.; Holloway, T. Evaluating Current Satellite Capability to Observe Diurnal Change in Nitrogen Oxides in Preparation for Geostationary Satellite Missions. Environ. Res. Lett. 2020, 15, 034038. [Google Scholar] [CrossRef]
  47. Ichoku, C.; Remer, L.A.; Eck, T.F. Quantitative Evaluation and Intercomparison of Morning and Afternoon Moderate Resolution Imaging Spectroradiometer (MODIS) Aerosol Measurements from Terra and Aqua. J. Geophys. Res. Atmos. 2005, 110, 2004JD004987. [Google Scholar] [CrossRef]
  48. Lange, K.; Richter, A.; Bösch, T.; Zilker, B.; Latsch, M.; Behrens, L.K.; Okafor, C.M.; Bösch, H.; Burrows, J.P.; Merlaud, A.; et al. Validation of GEMS Tropospheric NO2 Columns and Their Diurnal Variation with Ground-Based DOAS Measurements. Atmos. Meas. Tech. 2024, 17, 6315–6344. [Google Scholar] [CrossRef]
  49. Kang, Y.; Choi, H.; Im, J.; Park, S.; Shin, M.; Song, C.-K.; Kim, S. Estimation of Surface-Level NO2 and O3 Concentrations Using TROPOMI Data and Machine Learning over East Asia. Environ. Pollut. 2021, 288, 117711. [Google Scholar] [CrossRef] [PubMed]
  50. Verhoelst, T.; Compernolle, S.; Pinardi, G.; Lambert, J.-C.; Eskes, H.J.; Eichmann, K.-U.; Fjæraa, A.M.; Granville, J.; Niemeijer, S.; Cede, A.; et al. Ground-Based Validation of the Copernius Sentinel-5P TROPOMI NO2 Measurements with the NDACC ZSL-DOAS, MAX-DOAS and Pandonia Global Networks. Atmos. Meas. Tech. 2021, 14, 481–510. [Google Scholar] [CrossRef]
  51. Huang, G.; Sun, K. Non-Negligible Impacts of Clean Air Regulations on the Reduction of Tropospheric NO2 over East China during the COVID-19 Pandemic Observed by OMI and TROPOMI. Sci. Total Environ. 2020, 745, 141023. [Google Scholar] [CrossRef]
  52. De Smedt, I.; Pinardi, G.; Vigouroux, C.; Compernolle, S.; Bais, A.; Benavent, N.; Boersma, F.; Chan, K.-L.; Donner, S.; Eichmann, K.-U.; et al. Comparative Assessment of TROPOMI and OMI Formaldehyde Observations and Validation against MAX-DOAS Network Column Measurements. Atmos. Chem. Phys. 2021, 21, 12561–12593. [Google Scholar] [CrossRef]
  53. Shikwambana, L.; Mhangara, P.; Mbatha, N. Trend Analysis and First Time Observations of Sulphur Dioxide and Nitrogen Dioxide in South Africa Using TROPOMI/Sentinel-5 P Data. Int. J. Appl. Earth Obs. Geoinf. 2020, 91, 102130. [Google Scholar] [CrossRef]
  54. European Space Agency. S5P Mission Performance Centre Formaldehyde [L2__HCHO___] Readme. Available online: https://sentiwiki.copernicus.eu/__attachments/1673595/S5P-MPC-BIRA-PRF-HCHO%20-%20Sentinel-5P%20Formaldehyde%20Level%202%20Readme%202023%20-%202.7.pdf?inst-v=43bfeaf2-06ce-48ec-adc6-68038c8e270d (accessed on 24 March 2023).
  55. European Space Agency. S5P Mission Performance Centre Nitrogen Dioxide [L2__NO2___] Readme. Available online: https://sentiwiki.copernicus.eu/__attachments/1673595/S5P-MPC-KNMI-PRF-NO2%20-%20Sentinel-5P%20Nitrogen%20Dioxide%20Level%202%20Product%20Readme%20File%202023%20-%202.5.pdf?inst-v=036311ce-c427-48a7-bdf2-a9ec5ad4ff29 (accessed on 25 July 2025).
  56. Valks, P.; Pinardi, G.; Richter, A.; Lambert, J.-C.; Hao, N.; Loyola, D.; Van Roozendael, M.; Emmadi, S. Operational Total and Tropospheric NO2 Column Retrieval for GOME-2. Atmos. Meas. Tech. 2011, 4, 1491–1514. [Google Scholar] [CrossRef]
  57. Chan, K.L.; Valks, P.; Heue, K.-P.; Lutz, R.; Hedelt, P.; Loyola, D.; Pinardi, G.; Van Roozendael, M.; Hendrick, F.; Wagner, T.; et al. Global Ozone Monitoring Experiment-2 (GOME-2) Daily and Monthly Level-3 Products of Atmospheric Trace Gas Columns. Earth Syst. Sci. Data 2023, 15, 1831–1870. [Google Scholar] [CrossRef]
  58. Herman, J.; Cede, A.; Spinei, E.; Mount, G.; Tzortziou, M.; Abuhassan, N. NO2 Column Amounts from Ground-based Pandora and MFDOAS Spectrometers Using the Direct-sun DOAS Technique: Intercomparisons and Application to OMI Validation. J. Geophys. Res. Atmos. 2009, 114, 2009JD011848. [Google Scholar] [CrossRef]
  59. Rawat, P.; Naja, M.; Rajwar, M.C.; Irie, H.; Lerot, C.; Kumar, M.; Lal, S. Long-Term Observations of NO2, SO2, HCHO, and CHOCHO over the Himalayan Foothills: Insights from MAX-DOAS, TROPOMI, and GOME-2. Atmos. Environ. 2024, 336, 120746. [Google Scholar] [CrossRef]
  60. Wang, Y.; Beirle, S.; Lampel, J.; Koukouli, M.; De Smedt, I.; Theys, N.; Li, A.; Wu, D.; Xie, P.; Liu, C.; et al. Validation of OMI, GOME-2A and GOME-2B Tropospheric NO2, SO2 and HCHO Products Using MAX-DOAS Observations from 2011 to 2014 in Wuxi, China: Investigation of the Effects of Priori Profiles and Aerosols on the Satellite Products. Atmos. Chem. Phys. 2017, 17, 5007–5033. [Google Scholar] [CrossRef]
  61. Qin, X.-C.; Nakayama, T.; Matsumi, Y.; Kawasaki, M.; Imasu, R.; Morino, I.; Tanaka, Y.; Ishidoya, S.; Sato, K.; Ohashi, M. Observation of Column-Averaged Molar Mixing Ratios of Carbon Dioxide in Tokyo. Atmos. Environ. X 2019, 2, 100022. [Google Scholar] [CrossRef]
  62. Chaloulakou, A.; Mavroidis, I.; Gavriil, I. Compliance with the Annual NO2 Air Quality Standard in Athens. Required NOx Levels and Expected Health Implications. Atmos. Environ. 2008, 42, 454–465. [Google Scholar] [CrossRef]
  63. Judd, L.M.; Al-Saadi, J.A.; Janz, S.J.; Kowalewski, M.G.; Pierce, R.B.; Szykman, J.J.; Valin, L.C.; Swap, R.; Cede, A.; Mueller, M.; et al. Evaluating the Impact of Spatial Resolution on Tropospheric NO2 Column Comparisons within Urban Areas Using High-Resolution Airborne Data. Atmos. Meas. Tech. 2019, 12, 6091–6111. [Google Scholar] [CrossRef]
  64. Shen, Y.; Jiang, F.; Feng, S.; Zheng, Y.; Cai, Z.; Lyu, X. Impact of Weather and Emission Changes on NO2 Concentrations in China during 2014–2019. Environ. Pollut. 2021, 269, 116163. [Google Scholar] [CrossRef]
  65. Van Der A, R.J.; Eskes, H.J.; Boersma, K.F.; Van Noije, T.P.C.; Van Roozendael, M.; De Smedt, I.; Peters, D.H.M.U.; Meijer, E.W. Trends, Seasonal Variability and Dominant NOx Source Derived from a Ten Year Record of NO2 Measured from Space. J. Geophys. Res. Atmos. 2008, 113, 2007JD009021. [Google Scholar] [CrossRef]
  66. Meng, Z.Y.; Ding, G.A.; Xu, X.B.; Xu, X.D.; Yu, H.Q.; Wang, S.F. Vertical Distributions of SO2 and NO2 in the Lower Atmosphere in Beijing Urban Areas, China. Sci. Total Environ. 2008, 390, 456–465. [Google Scholar] [CrossRef]
  67. Li, X.-B.; Yuan, B.; Parrish, D.D.; Chen, D.; Song, Y.; Yang, S.; Liu, Z.; Shao, M. Long-Term Trend of Ozone in Southern China Reveals Future Mitigation Strategy for Air Pollution. Atmos. Environ. 2022, 269, 118869. [Google Scholar] [CrossRef]
  68. Ghahremanloo, M.; Choi, Y.; Singh, D. Deep Learning Bias Correction of GEMS Tropospheric NO2: A Comparative Validation of NO2 from GEMS and TROPOMI Using Pandora Observations. Environ. Int. 2024, 190, 108818. [Google Scholar] [CrossRef] [PubMed]
  69. Zyrichidou, I.; Koukouli, M.E.; Balis, D.S.; Katragkou, E.; Melas, D.; Poupkou, A.; Kioutsioukis, I.; Van Der A, R.; Boersma, F.K.; Van Roozendael, M.; et al. Satellite Observations and Model Simulations of Tropospheric NO2 Columns over South-Eastern Europe. Atmos. Chem. Phys. 2009, 9, 6119–6134. [Google Scholar] [CrossRef]
Figure 1. Distribution of the three hotspots selected in our study: East Asia, Central Africa, and Europe, in dashed blue boxes, and Pandonia Global Network stations represented as red points. Shaded areas represent the observational coverage of the geostationary satellites GEMS (East Asia), TEMPO (North America), and Sentinel-4 (Europe and Northern Africa).
Remotesensing 17 02846 g001
Figure 2. Validations between the Pandora datasets and GOME-2C (a) and TROPOMI (b) from 2024.
Remotesensing 17 02846 g002
Figure 3. Box plots of the Pandora NO2 column observations and daily NO2 values from GOME-2C and TROPOMI at two sites: (a) Tsukuba-NIES (140.12°E, 36.05°N) in December 2024, (b) Athens-NOA (23.775°E, 37.99°N) in June 2024.
Remotesensing 17 02846 g003
Figure 4. Seasonal distribution of tropospheric NO2 and the difference (NO2 gome-2c-NO2 TROPOMI) over East Asia in 2024. Data were derived from GOME-2C and TROPOMI observations. Seasons are defined as DJF (December–January–February), MAM (March–April–May), JJA (June–July–August), and SON (September–October–November).
Remotesensing 17 02846 g004
Figure 5. Intercomparison results between GOME-2C and TROPOMI in DFJ, MAM, JJA, and SON. The gray dashed line is the 1:1 line (y = x), and the blue dashed line is the scatter plot fit line.
Remotesensing 17 02846 g005
Figure 6. (a) Daily mean NO2 VCD differences between GOME-2C and TROPOMI over the Beijing area (115.4–117.5°E, 39.4–41°N). The red dashed lines represent the daily maximum and minimum NO2 VCD differences. (b,c) Monthly averaged NO2 VCD diurnal variation from GEMS, with coincident GOME-2C (blue point) and TROPOMI (red point) values in January (b) and July (c) 2024. The solid lines represent the mean values. The upper and lower buffer sections represent the maximum and minimum value ranges of the month at that moment.
Remotesensing 17 02846 g006
Figure 7. Monthly averaged NO2 VCD by time in Tsukuba-NIES in January (a) and July (b) 2024. The solid lines represent the mean values. The upper and lower buffer sections represent the maximum and minimum value ranges of the month at that moment.
Remotesensing 17 02846 g007
Figure 8. Distribution and intercomparison of tropospheric NO2 VCDs over Central Africa from GOME-2C and TROPOMI in JJA. The gray dashed line is the 1:1 line (y = x), and the blue dashed line is the scatter plot fit line.
Remotesensing 17 02846 g008
Figure 9. A fire distribution example of (a) Terra/MODIS (10:30 LT) and (b) Aqua/MODIS (13:30 LT) on 1 July 2024 over Central Africa. Fire counts of Terra and Aqua in July 2024 over Central Africa (c).
Remotesensing 17 02846 g009
Figure 10. Distribution of NO2 VCD differenced (NO2 GOME-2C-NO2 TROPOMI) over Europe in DJF and JJA 2024 from GOME-2C and TROPOMI.
Remotesensing 17 02846 g010
Figure 11. Intercomparison results of GOME-2C and TROPOMI over Europe in DJF and JJA 2024. The gray dashed line is the 1:1 line (y = x), and the blue dashed line is the scatter plot fit line.
Remotesensing 17 02846 g011
Figure 12. Monthly averaged NO2 VCDs by time in Brussels-Uccle (4.36°E, 50.798°N) in July (a) and December (b) 2024. (c,d) The same, but for Berlin (13.31°E, 52.46°N) using Pandora datasets. The solid lines represent the mean values. The upper and lower buffer sections represent the maximum and minimum value ranges of the month at that moment.
Remotesensing 17 02846 g012
Disclaimer/Publisher’s Note: The statements, opinions and data contained in all publications are solely those of the individual author(s) and contributor(s) and not of MDPI and/or the editor(s). MDPI and/or the editor(s) disclaim responsibility for any injury to people or property resulting from any ideas, methods, instructions or products referred to in the content.