Article

Neural Gas Network Optimization Using Improved OAT Algorithm for Oil Spill Detection in Marine Radar Imagery

by
Baozhu Jia
1,2,3,4,
Zekun Guo
1,2,
Jin Xu
1,2,3,4,*,
Peng Liu
5 and
Bingxin Liu
5
1
Shenzhen Institute of Guangdong Ocean University, Shenzhen 518116, China
2
Naval Architecture and Shipping College, Guangdong Ocean University, Zhanjiang 524091, China
3
Technical Research Center for Ship Intelligence and Safety Engineering of Guangdong Province, Zhanjiang 524088, China
4
Guangdong Provincial Key Laboratory of Intelligent Equipment for South China Sea Marine Ranching, Guangdong Ocean University, Zhanjiang 524088, China
5
Navigation College, Dalian Maritime University, Dalian 116026, China
*
Author to whom correspondence should be addressed.
Remote Sens. 2025, 17(16), 2793; https://doi.org/10.3390/rs17162793
Submission received: 10 July 2025 / Revised: 1 August 2025 / Accepted: 11 August 2025 / Published: 12 August 2025
(This article belongs to the Special Issue Remote Sensing for Marine Environmental Disaster Response)

Abstract

With the increasingly frequent exploitation and transportation of offshore oil, the threat of oil spill accidents to the marine ecological environment has become increasingly serious. It is urgent to develop efficient and reliable oil film monitoring technology. Based on the marine radar oil spill data, an innovative OAT-NGN hybrid strategy segmentation algorithm was proposed. By integrating the local feature learning ability of a Neural Gas Network (NGN) and the global search strategy of the Oat optimization algorithm (OAT), the proposed method effectively meets the challenges of traditional oil film segmentation methods in complex sea conditions. Firstly, the raw data of marine radar were preprocessed by using co-frequency interference and speckle noise suppression. Then, the OAT algorithm guided the updating of neural weights in the NGN on a global scale for the exploration of a more optimal solution space during the optimization process. Finally, the oil spill segmentation results were projected to the polar coordinate system through post-processing technology. The experimental results showed that this method effectively balanced the problem of false detection and missing detection. Compared with existing methods, OAT-NGN shown stronger adaptability in complex scenarios. In order to improve the segmentation performance, its innovative dynamic weight adjustment mechanism and spatial constraint design provide a new technical path.

Graphical Abstract

1. Introduction

With the rapid development of global marine economy, offshore oil transportation and exploitation activities are increasingly frequent [1,2,3,4]. However, this development trend has led to severe oil spill accidents, which pose a serious threat to the marine ecological environment and coastal economy [5,6,7,8]. In recent years, massive oil spill accidents have aroused worldwide attention. In October 2021, a large-scale oil spill accident occurred in the southern waters of California, the USA. It was estimated that more than 126,000 gallons of crude oil leaked into the Pacific Ocean, resulting in the forced closure of some beaches and the death of extensive wild animals [9]. In January 2022, a crude oil spill accident also occurred in the northern waters of Lima, Peru. The Italian oil tanker Mare Doricum leaked in the process of transporting crude oil to the submarine pipeline operated by Spanish oil company Repsol, resulting in the serious pollution of the coastline. The accident had brought far-reaching negative impacts on the local marine ecosystem and fisheries [10]. In June 2025, an oil tanker collision occurred in the Gulf of Oman. About 1500 hectares of the sea region were polluted by oil spills [11]. Therefore, the development of efficient and reliable oil spill detection technology is crucial to the effective response to oil spill emergency rescue.
The role of satellite remote sensing technology in the field of marine environment monitoring has been continuously enhanced [12,13,14]. HJ-1B CCD, an environmental disaster reduction satellite, and HY-1C/D CZI, an ocean color satellite, were independently developed by China [15,16,17]. The National Aeronautics and Space Administration (NASA) acquires the long-term stable observation data with the MODIS system and Landsat series satellites. It has provided important support for global marine pollution monitoring [18,19,20,21,22,23]. The Sentinel series satellites deployed by the European Space Agency through the Copernicus plan contribute to marine environmental surveys [24,25,26,27]. Li et al. [28] built a closed-loop system for training data generation, model enhancement and oil film detection. The problems of insufficient training data and the false detection of suspected oil films were solved. Its self-evolution mechanism significantly improved the generalization ability of the model [28]. Fan et al. [29] developed a feature fusion network (FMNet) for oil film recognition in Satellite images. The global features obtained by threshold segmentation were organically combined with the local features of U-Net to improve the accuracy of oil film recognition [29]. Chen et al. proposed a seminal image representation collaborative network (SRC-Net), which achieves the accurate segmentation of oil film boundary under complex sea conditions by means of the fusion of physical representation and the generation and discrimination framework [30]. Zhu et al. [31] proposed a contextual and boundary supervised detection network (CBD-Net). It further strengthens edge detection ability through the use of multi-scale feature fusion and attention mechanism [31]. Cheng et al. [32] proposed an improved J-M/k-means method by means of the perspective of feature optimization. The robust performance of dual polarimetric SAR oil film detection was significantly enhanced [32]. Song et al. [33] developed an adaptive network based on dynamic convolution and boundary constraints. Through the cooperation of conditional parametric convolution and two-dimensional discrete wavelet transform, high-precision detection in a complex oil pollution scene using full polarimetric SAR was realized [33].
Although significant progress has been made in the development of oil spill detection methods based on satellite image technology, these methods cannot completely satisfy real-time monitoring. With the breakthrough of remote sensing technology, shipborne and shore-based radar can effectively penetrate clouds and fog to achieve all-weather monitoring by virtue of its centimeter wavelength [34]. Its high-frequency scanning ability makes it possible to track the dynamic diffusion of oil films in real time. The multi-polarization channel provides an important physical basis for distinguishing oil films and sea clutter. Based on the characteristics of X-band radar, researchers have developed a series of efficient oil spill detection methods. Lau and Huang built an offshore oil spill monitoring framework that organically combined Mask R-CNN and a Geographic Information System (GIS). With the synergy of deep learning segmentation and GIS verification, the limitations of traditional on-site monitoring methods in terms of timeliness and dependence on artificial experience were effectively overcome [35]. In the field of marine radar oil spill detection, Chen et al. [36] proposed a BP neural network model based on Gray-Level Co-occurrence Matrix (GLCM) texture features and Principal Component Analysis (PCA) dimensionality reduction. This model successfully realized the high-precision extraction of oil films in an X-band maritime radar image by sliding window threshold segmentation technology [36]. Liu et al. [37] developed a semi-automatic X-band maritime radar oil spill detection method based on texture analysis, machine learning and adaptive threshold segmentation. The co-frequency interference and noise were firstly eliminated in this method. Then, the texture index was constructed to improve the extraction accuracy. It validly solved the problem of manually setting the threshold in the traditional method [37]. The study shown that X-band radar can availably identify the oil spill regions on the sea surface through a specific signal processing algorithm and the feature extraction method. However, this technology still faces several key challenges. Firstly, the radar echo signal has inherent complexity, and its scattering characteristics are affected by many factors. Secondly, oil leaks and other sea surface substances may show similar scattering characteristics in radar images, which increases the difficulty of identification. In addition, detection accuracy fluctuates under different sea conditions, especially in extreme sea conditions, and the performance may be significantly reduced.
This study proposes a hybrid segmentation algorithm based on a Neural Gas Network (NGN) and Wild Oat Optimization (OAT) to process oil spill images obtained from marine X-band radar, effectively solving the above-mentioned problems. To address the issue of incoherent complexity in radar echo signals, the local feature learning capability of the NGN is used to adaptively capture scattering characteristics. For the identification difficulties caused by the similarity in scattering characteristics between oil spills and other sea surface materials, a connectivity penalty term is introduced to enhance spatial consistency, and the global optimization of OAT is combined to achieve accurate differentiation. A collaborative optimization mechanism is adopted to maintain the stability of the data topology structure and address the issue of detection accuracy fluctuations under different sea conditions. The experimental results show that this hybrid strategy has stronger adaptability to maintain high accuracy compared to traditional methods, providing a more reliable technical solution for oil spill monitoring.
The structure of this paper is as follows: Section 2 describes the data and methods in detail. Section 3 shows the results. In Section 4, the algorithm is compared with other methods. Section 5 summarizes this study.

2. Materials and Methods

2.1. Dataset

During the crude oil spill accident caused by the oil pipeline explosion of the Dalian New Port in 2010, the experimental vessel Yukun of Dalian Maritime University obtained relevant data. The data collection adopted a shipborne X-band radar with a detection range of 0.75 nautical miles. The pixel resolution of radar images is 1024 × 1024. The data were gathered in horizontal polarization mode. The relevant equipment and original data in polar coordinates are shown in Figure 1.
The original data were preprocessed to facilitate the subsequent oil film detection and analysis. The pretreatment process is shown in Figure 2. Firstly, the radar image coordinate system was converted from polar coordinates to Cartesian coordinates. The Cartesian coordinate transformation significantly improves the interpretability, algorithm compatibility, and computational efficiency of radar data, and the converted image remains two-dimensional. This conversion provides a standardized input space for subsequent segmentation. The horizontal axis of the transformed Cartesian coordinate system is the azimuth angle, and the vertical axis is the detection distance. Secondly, a Laplace operator was used to process the image and accurately extract the co-frequency interference noise. Then, an average filter was used to smooth the extracted interference noise, which reduced the impact of co-frequency noise on image quality. Furthermore, through the precise calibration of gray-level and pixel-area thresholds, speckle noise was effectively isolated. Afterwards, a median filter was used to smooth the speckles again to further improve the clarity and stability of the image. Finally, with the help of gray correction and local contrast enhancement technology, the contrast between oil film targets and background was improved. This provided strong support for detection and analysis. Ground-truth labels for the processed images were meticulously generated via manual interpretation. The results of each step are shown in Figure 3.

2.2. NGN-OAT Oil Film Segmentation Algorithm

In radar-acquired imagery, the grayscale difference between oil film regions and the background is small, with boundaries representing misidentification. Consequently, conventional segmentation methods frequently fail to achieve satisfactory results when processing such images. To address this challenge, this paper presented a hybrid segmentation framework integrating Neural Gas Network clustering with optimal adaptive thresholding.

2.2.1. The NGN Model

The NGN model is an unsupervised clustering method based on competitive learning, which approximates the probability distribution of input data by dynamically adjusting the weights of neurons. In the field of image segmentation, the NGN achieves pixel clustering by minimizing the intra class variance [38,39,40,41,42]. The objective function can be expressed as
E = i = 1 R j = 1 C ( x i j w c i , j ) 2
where R and C represent the number of rows and columns of the image, respectively. x i j represents the pixel value of the position i , j in the image. w represents the weight of the neuron. The detailed learning process of the NGN model includes six parts.
(1)
Grid initialization: the random initialization of the weight vector:
w i U ( X m i n , X m a x ) , i = 1 , , N
where N is the preset number of neurons.
(2)
For each input sample x, calculate the distance from all neurons and sort
d i = x w i 2 , i = 1 , , N
(3)
Learning rate ϵ t and domain parameters λ t decay with the number of iterations:
ϵ t = ϵ initial ϵ final ϵ initial t / t max
λ t = λ initial λ final λ initial t / t max
T ( t ) = T initial ( T final T initial ) t / t max
where t max represents the total time step of the run, t is the current iteration progress, T final represents the initial lifespan threshold of neuronal connections. T initial is the threshold for the termination lifespan of neuronal connections.
(4)
Update weights w i of the sorted neurons:
w i w i + ϵ ( t ) · e x p k i λ ( t ) · ( x w i )
where k i is the sorting position of neuron i (starts from 0).
(5)
In the training process of the network, the connection between the nearest two neurons is established by setting the connection matrix. Then, the aging process of neuronal connections is simulated by increasing the values of relevant elements in the connection matrix. Finally, if the age of a connection surpasses the predefined threshold, T(t), the corresponding element in the connection matrix is set to 0, effectively pruning these aged connections. Dynamic synaptic pruning enhances data distribution adaptation. Topological neuron relationships boost clustering efficacy.
(6)
After the final weights are re-quantified, the model will map each pixel to the nearest neuron to generate the segmented image.

2.2.2. OAT Optimization Algorithm

Although the NGN model demonstrates unique advantages in image segmentation, several critical limitations remain. Firstly, the convergence speed of the NGN algorithm is relatively slow, which leads to its low efficiency in processing complex images. It is difficult to meet application scenarios with high real-time requirements. Secondly, the algorithm can easily fall into the local optimal solution in the optimization process, which makes the final segmentation result inaccurate. Then, in the process of image segmentation, the NGN algorithm often easily ignores the spatial information. This may lead to discontinuous or inconsistent segmentation results, which will affect reliability and practicability. So as to overcome the limitations of the NGN algorithm, a global optimization algorithm inspired by plant growth called the OAT optimization algorithm was introduced here to improve the NGN model [43]. The complete process of the algorithm is as follows:
(1)
Preprocess the image and normalize the image data:
I norm ( x , y ) = I ( x , y ) 255
where I(x, y) represents the pixel value of the original gray image.
(2)
Calculate the histogram peak of the normalized image:
t ^ init = a r g   m a x b { 0 , 0.02 , , 1 } hist ( b )
where hist(b) is the total number of pixel values falling in interval b.
(3)
The fitness function, F(t), is defined to evaluate the segmentation threshold, t. The function takes into account two key indicators: intra class variance and regional connectivity. Intra class variance is used to measure the uniformity of pixel values in each region after segmentation. Regional connectivity ensures the continuity and consistency of segmentation results in space. Through threshold t, the normalized image is binarized to obtain B t ( x , y ) :
B t x , y = 1 , if   I norm ( x , y ) > t 0 , otherwise
Calculate the intra class variance σ within 2 ( t ) :
σ within 2 ( t ) = w 1 ( t ) σ 1 2 ( t ) + w 0 ( t ) σ 0 2 ( t )
where
w 1 t = 1 N x , y B t x , y
w 0 ( t ) = 1 w 1 ( t )
σ 1 2 t = Var I norm x , y B t x , y = 1
σ 0 2 ( t ) = Var ( { I norm ( x , y ) B t ( x , y ) = 0 } )
The penalty term P ( t ) is introduced to improve the regional consistency of the segmentation results:
P ( t ) = N c ( t ) N
where Nc(t) is the number of connected regions of the binary image. This item can effectively suppress the fragmentation problem caused by oversegmentation.
(4)
For each generation, generate candidate seeds.
t i k = t k 1 + ϵ i
where ϵ i U 0.1,0.1 , i = 1 , , 10 .
Select the best seed and update the threshold:
t best ( k ) = a r g m i n t { t i ( k ) }   F ( t )
t k = α · t best ( k )
(5)
Output the optimal threshold, t*, and segmentation results:
t * = arg   min t { t k } k = 1 K F ( t )
The algorithm determines the optimal segmentation threshold by minimizing the weighted sum of intra class variance and connected region complexity. In this process, the OAT algorithm, as the core optimization framework, conducts a directional random search in the threshold space to efficiently explore the potential optimal solution:
t new = t best · α + ϵ , ϵ U ( 0.1,0.1 )
where t best is the current optimal threshold. α is the attenuation factor. The multi-seed parallel evaluation and adaptive threshold attenuation characteristics of the OAT algorithm can effectively make up for the global search defects of the NGN model. The multi-seed parallel evaluation and adaptive threshold decay mechanisms of the OAT algorithm compensate for the global exploration deficiencies inherent in the NGN model.

2.2.3. OAT-NGN Hybrid Strategy

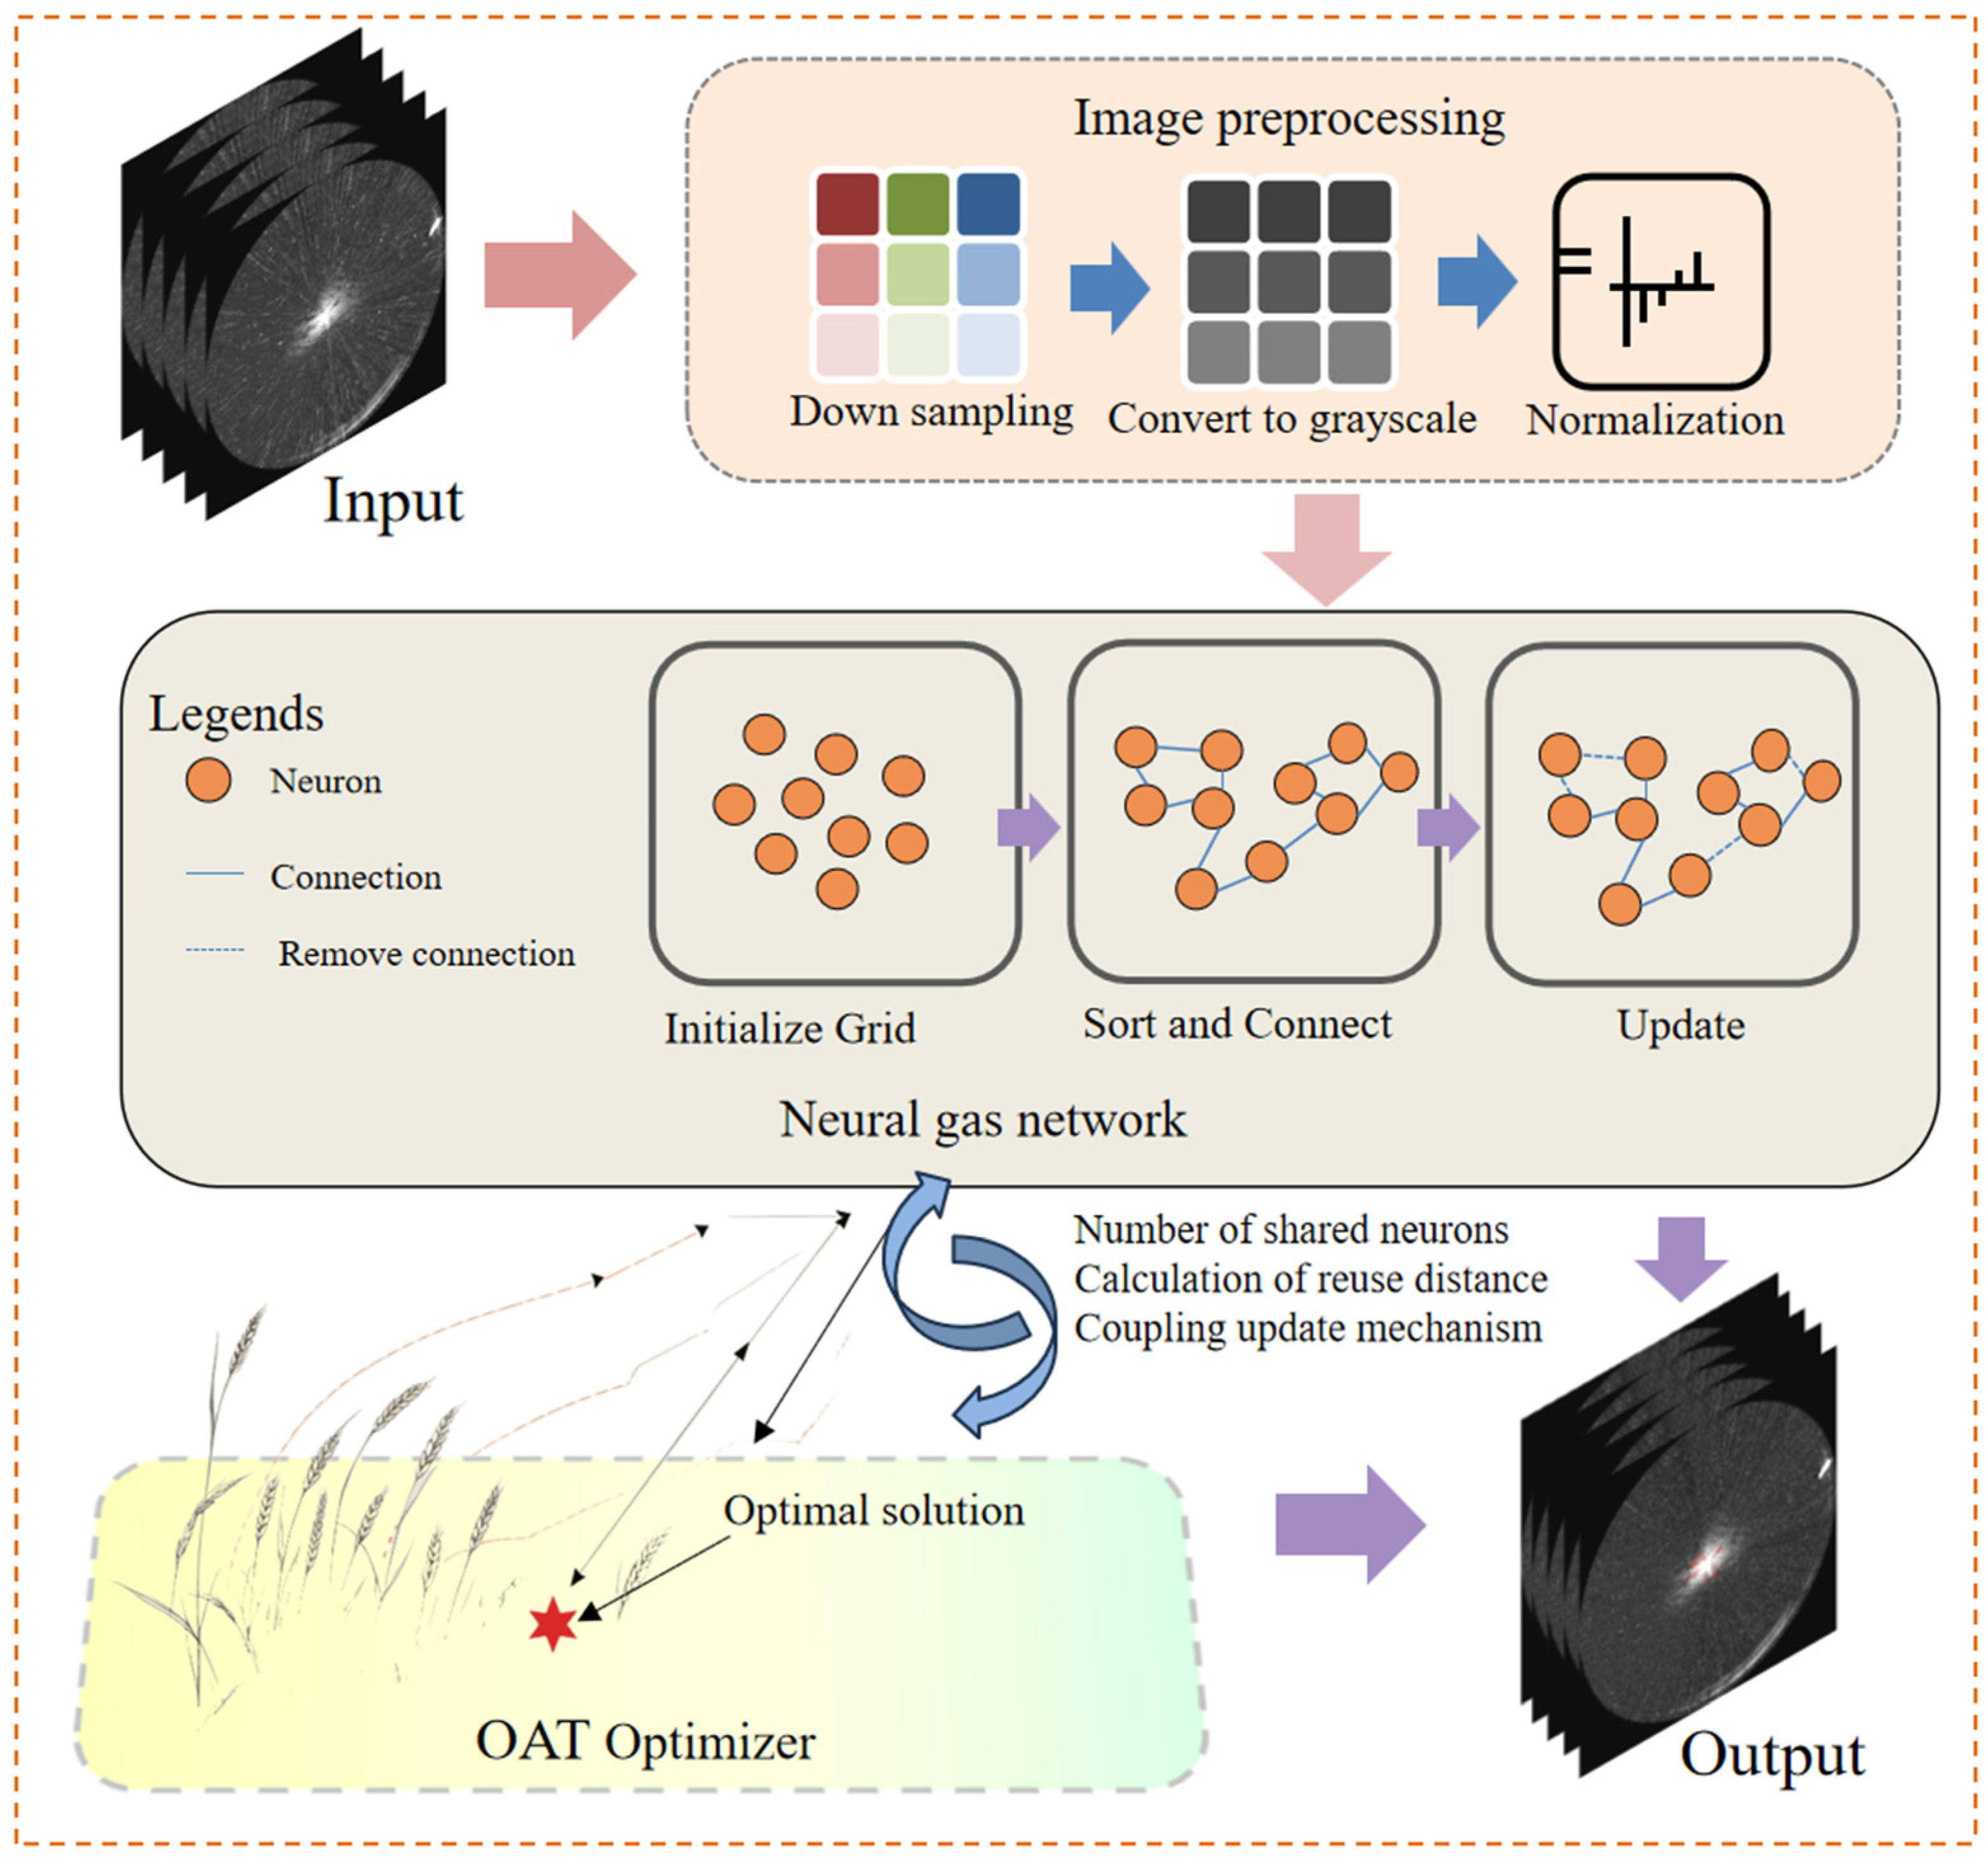
To synergistically leverage the complementary strengths of the two algorithms, this study developed a hybrid optimization framework that integrates NGN topological preservation with OAT global search capabilities. The structural framework of the algorithm is shown in Figure 4.
(1)
Global and local collaborative optimization
The NGN model achieves pixel clustering with the help of a neuron competition mechanism, which can effectively preserve the topology of data. The local learning mechanism is as follows:
w i w i + ϵ e k i / λ ( x w i )
The advantage of the NGN model is that it can adaptively learn local features, so as to better adapt to the distribution characteristics of data. However, this local learning mechanism also has some limitations. The OAT algorithm guides from a global perspective, generating candidate solutions and optimizing weights through periodic iterative processes. The formula for this mechanism is as follows:
w new = w + s e e d w ¯ ,
s e e d U ( t best 0.1 , t best + 0.1 )
where seed is a random seed point sampled from a uniform distribution, U , with a range fluctuating around the current optimal threshold, t best . w ¯ is the mean of the neuron weight vector. w new represents the new weight after adjusting the seed point.
The advantage of the OAT algorithm lies in its ability to effectively break free from the constraints of local optima. By implementing a global search strategy to avoid getting stuck in local optima, the likelihood of finding the optimal solution is increased. However, there are certain limitations when OAT is used alone, as it may overlook the spatial topology of the data. If this structure is ignored, it may lead to discontinuous or inconsistent segmentation results, thereby affecting the accuracy and reliability of the segmentation results.
During implementation, the OAT algorithm globally directs NGN synaptic weight updates, expanding the solution search space to identify optimal segmentation thresholds. The hybrid OAT-NGN algorithm synergistically combines the NGN model’s local topology-preserving capability with the global optimization strength of the OAT algorithm, thereby maintaining data topology while circumventing local optima.
(2)
Spatial information integration
The NGN model can achieve pixel clustering through its neuron competition mechanism in image segmentation and retain the topology of the data. However, this model will ignore the defects of data space topology when it is used alone. The fitness function of the OAT algorithm sets the spatial constraints by introducing the connectivity penalty term so as to effectively improve the consistency of segmentation. This mechanism can solve the problem of spatial correlation and then make up for the shortcomings of the NGN model. The penalty function F is as follows:
F = σ within 2 + 0.1 · P ( t )
The NGN-OAT hybrid designed here aims to efficiently complete the task of oil pollution image segmentation. The algorithm is mainly composed of parameter initialization, the main segmentation process and multiple function functions. Its pseudo code Algorithm 1 is as follows:
Algorithm 1. Pseudo code of the NGN-OAT Oil Segmentation algorithm
Input: Oil Spill Image (Org)
Function: Initialize Parameters
  Calculate histogram of imgData
  Set initThresh to the most frequent intensity value
  N = min (20, max (5, round(numel(imgData)/10,000)) // Number of neurons
  Return N, initThresh
 Function: Main Segmentation
  NGNnetwork = GasNN-Oat (imgData, params)
  Return segmented image
Core Function: GasNN-Oat (X, params)
  Extract parameters from params
  Shuffle input data X
  Initialize weights w from initThresh and N
  Repeat for it = 1 to MaxIt:
    Update parameters: epsilon, lambda, T
    If oat_active and mod (it, oat_updateInterval) == 0:
      Generate seeds and evaluate scores in parallel
      Update best weights if score improves
    Process data in batches to update weights w
  Return w
Function: oatFitness (X, w)
  Minimize distance to weights w and compute internal variance
  Return fitness score
Function: fastDist (X, Y)
  Calculate distance matrix D between X and Y
  Return D
Output: Segmented Image (segmented)

2.3. Evaluation Indicators

The performance of the OAT-NGN oil film segmentation algorithm is evaluated by using several indicators, such as accuracy, precision, recall, the F1-score, IoU and the Dice coefficient. These indicators comprehensively reflect the performance of the algorithm in oil film segmentation, including classification accuracy, false positive suppression, missing feature detection and boundary fidelity.
In the calculation process, the segmentation results of the algorithm were compared with the binary true value image interpreted by experts at the pixel level. A complete confusion matrix was constructed as the basis for evaluation. Some possible interference factors were eliminated in the calculation, which was helpful to evaluate the performance of the algorithm more accurately. The four key elements of the confusion matrix include true positive (TP), false positive (FP), false negative (FN), and true negative (TN). TP represents the number of pixels correctly identified as oil film, reflecting the ability of the algorithm to capture the target area. FP reflects the quantity of pixels that misjudge the background as oil film, which is used to evaluate the false alarm of the algorithm. FN represents the number of real oil film pixels missed and displays the detection blind area. TN counts the quantity of pixels correctly identified as the background. The calculated indicators have different emphases. The definition and calculation formula of each indicator are as follows:
A c c u r a c y = T P + T N T P + F P + F N + T N
P r e c i s i o n = T P T P + F P
Recall = T P T P + F N
F 1 = 2 × Precision × Recall Precision + Recall
IoU = T P T P + F P + F N
D i c e = 2 T P 2 T P + F P + F N

3. Results

The image segmentation framework developed in this research runs in a hardware environment equipped with the GeForce GTX 1660 super graphics card (NVIDIA Corporation, Santa Clara, CA, USA). The processor is an Intel Core i5-12400f processor (Intel Corporation, Santa Clara, CA, USA) with main frequency 2.50 GHz and maximum turbo frequency 4.40 GHz. The algorithm is optimized with the help of a parallel computing toolbox and GPU acceleration, which significantly improves the processing speed of oil film segmentation. The parameter setting of this algorithm is based on the adaptive strategy of task characteristics combined with empirical values. The model undergoes 50 iterations to ensure full convergence while avoiding overfitting. The learning rate decays exponentially from an initial value of 0.5 to 0.01, balancing the need for rapid convergence in the early stages and fine adjustment in the later stages. The neighborhood range decays from 3.0 to 0.5, gradually narrowing the local influence range of neuron updates. The connection lifetime threshold is gradually reduced from 30 to 5, and the network topology is dynamically optimized. The number of neurons (5–20) is automatically calculated based on the amount of input data, while the seed number of the OAT optimizer is set to half of the number of neurons (not less than 20), with a threshold decay factor of 0.73. All attenuation processes are controlled by normalized progress ( t / t max ), where t max ensures that the parameter attenuation is adapted to the data size. This setting preserves the local feature learning capability of the NGN while enhancing robustness through the global search of OAT.

3.1. Oil Film Segmentation Results

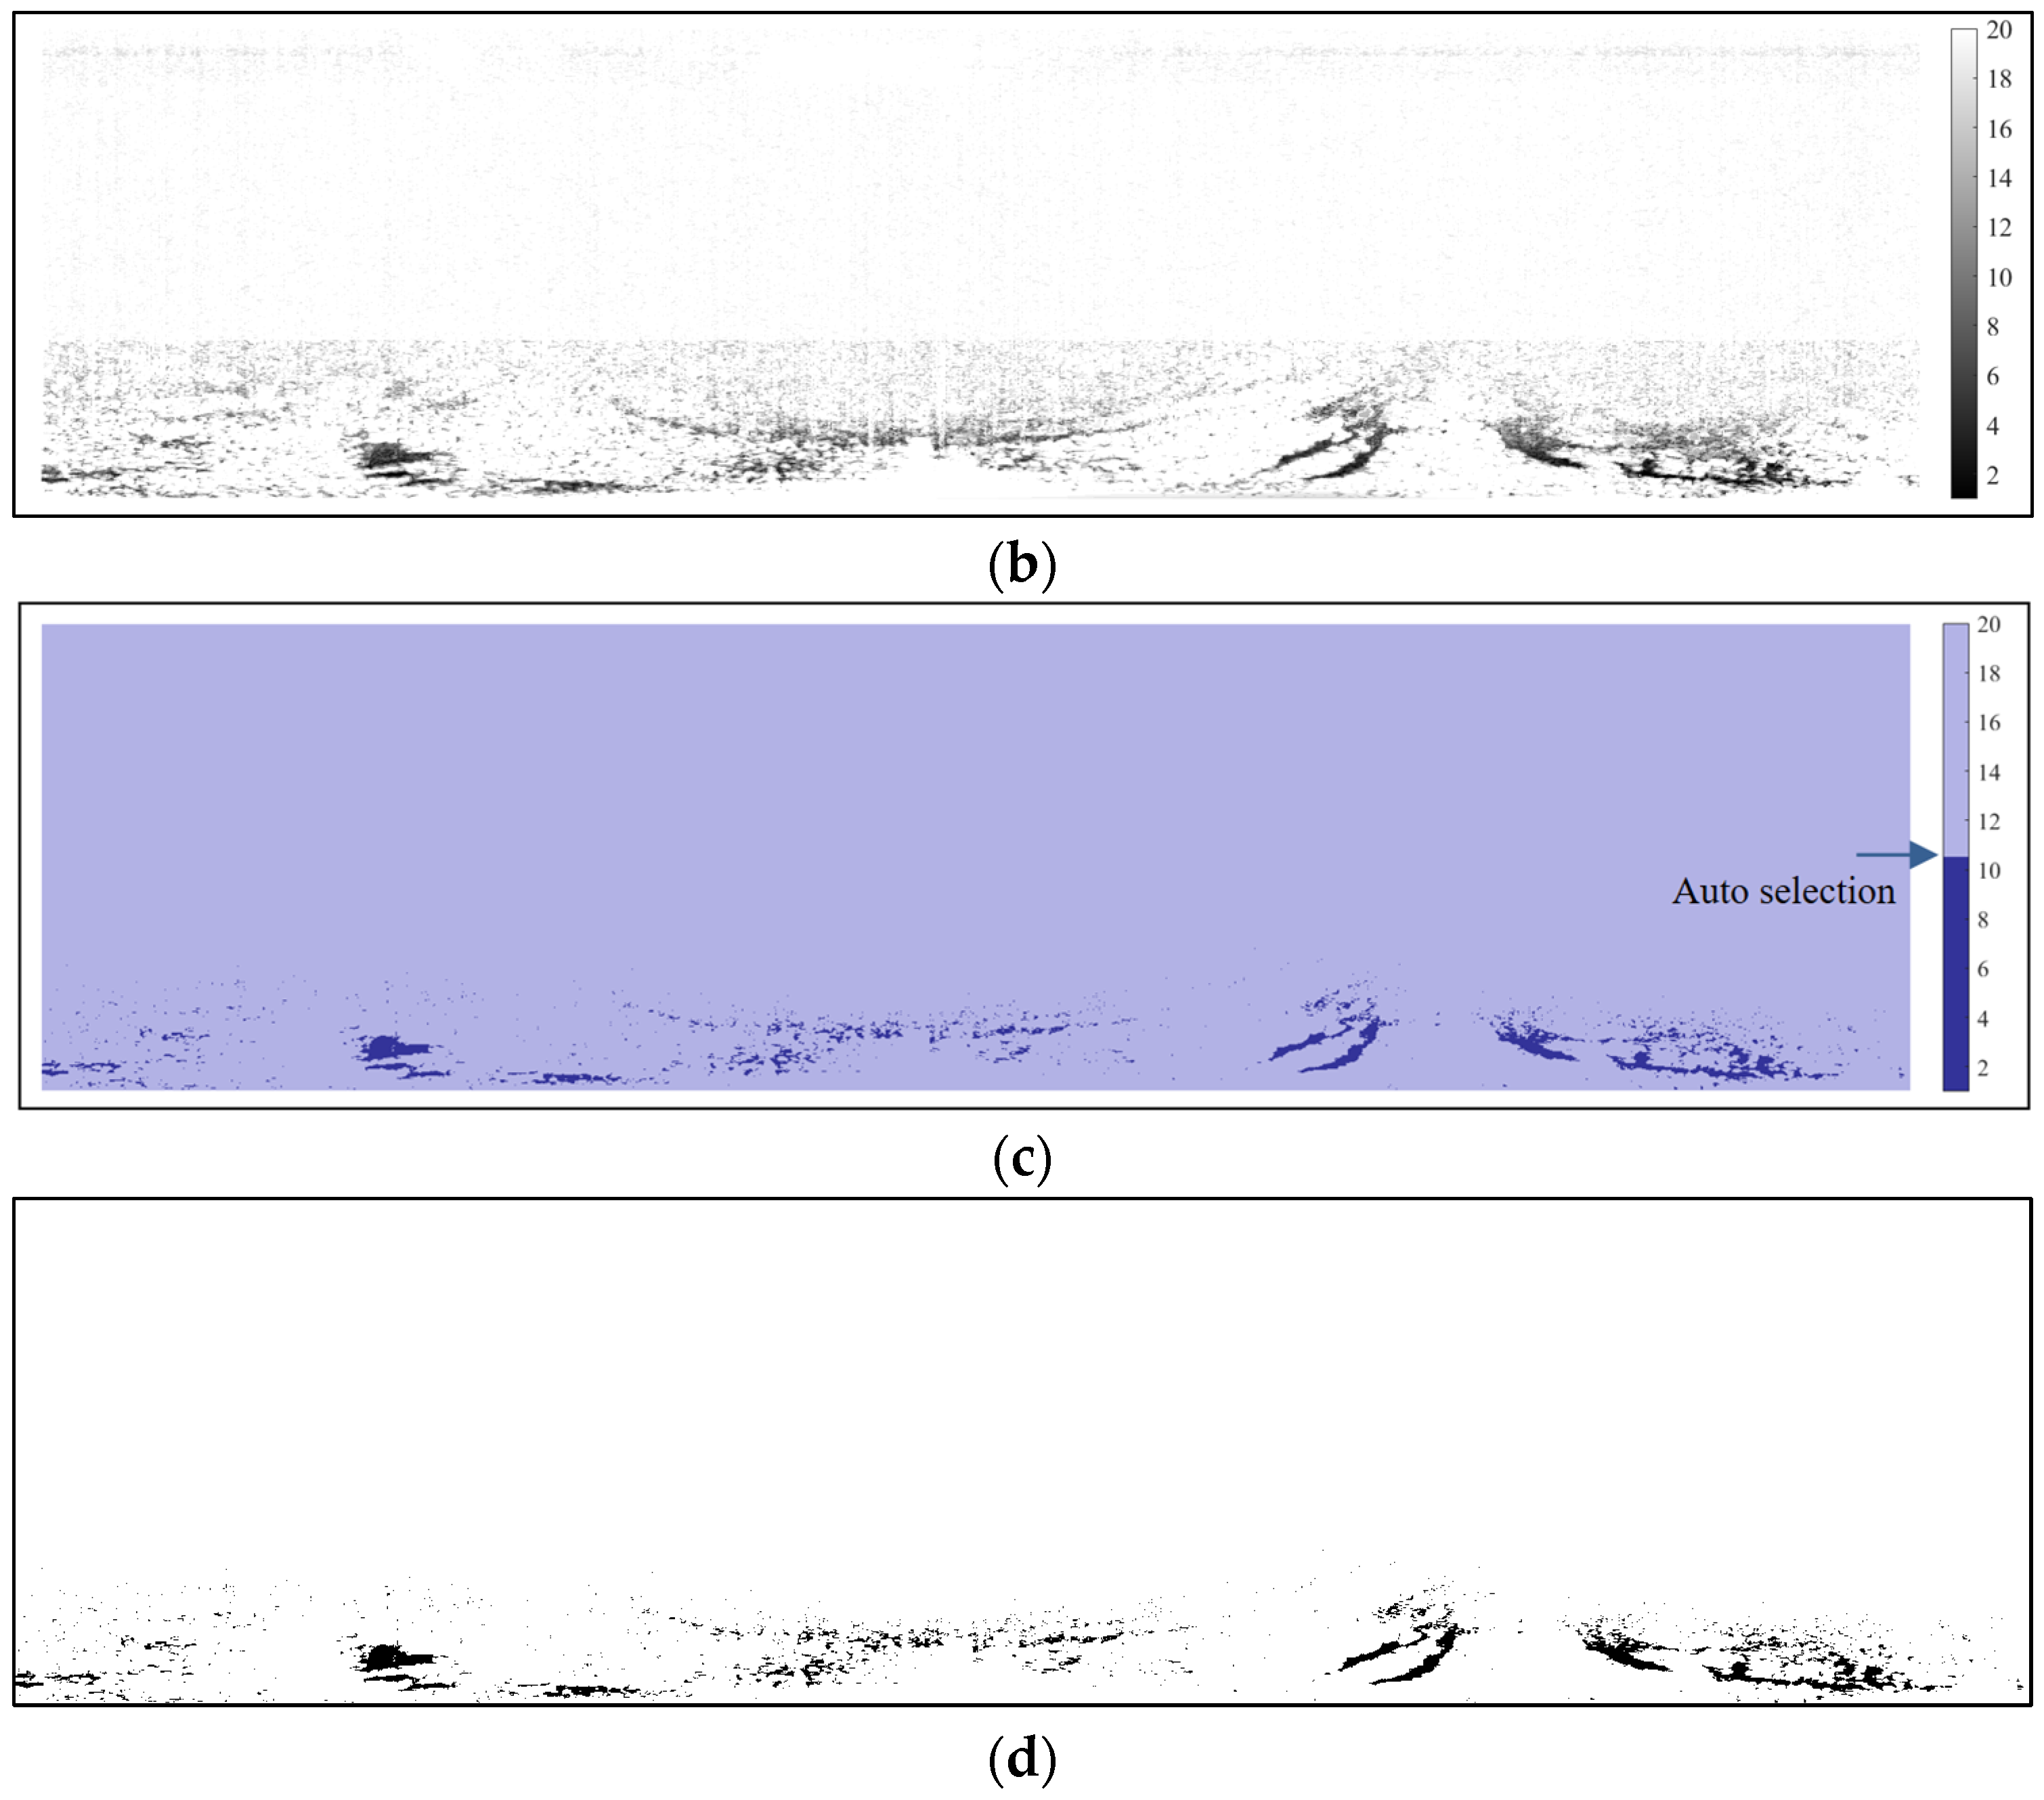
The result of oil film segmentation by the OAT-NGN algorithm is shown in Figure 5. The figure clearly shows the distribution of oil film regions. In Figure 5a, the processed oil film image is visually presented in color. A variety of colors reflect the different changes in oil film concentration. The upper part of the image is mainly dark red, indicating that there may be no-oil films in this region. The blue, green, and yellow colors in the lower area indicate the accumulation of oil film. Figure 5b was obtained after converting Figure 5a into a gray image. The dark regions may correspond to oil filmsor may be caused by wave induced fluctuations or interference reflection. Figure 5c was obtained by color system conversion for directly displaying the oil film targets. The overall effect was relatively clear, but there were still noise and background interference. Finally, the threshold was auto-selected from Figure 5c to obtain the preliminary oil film segmentation, as shown in Figure 5d.
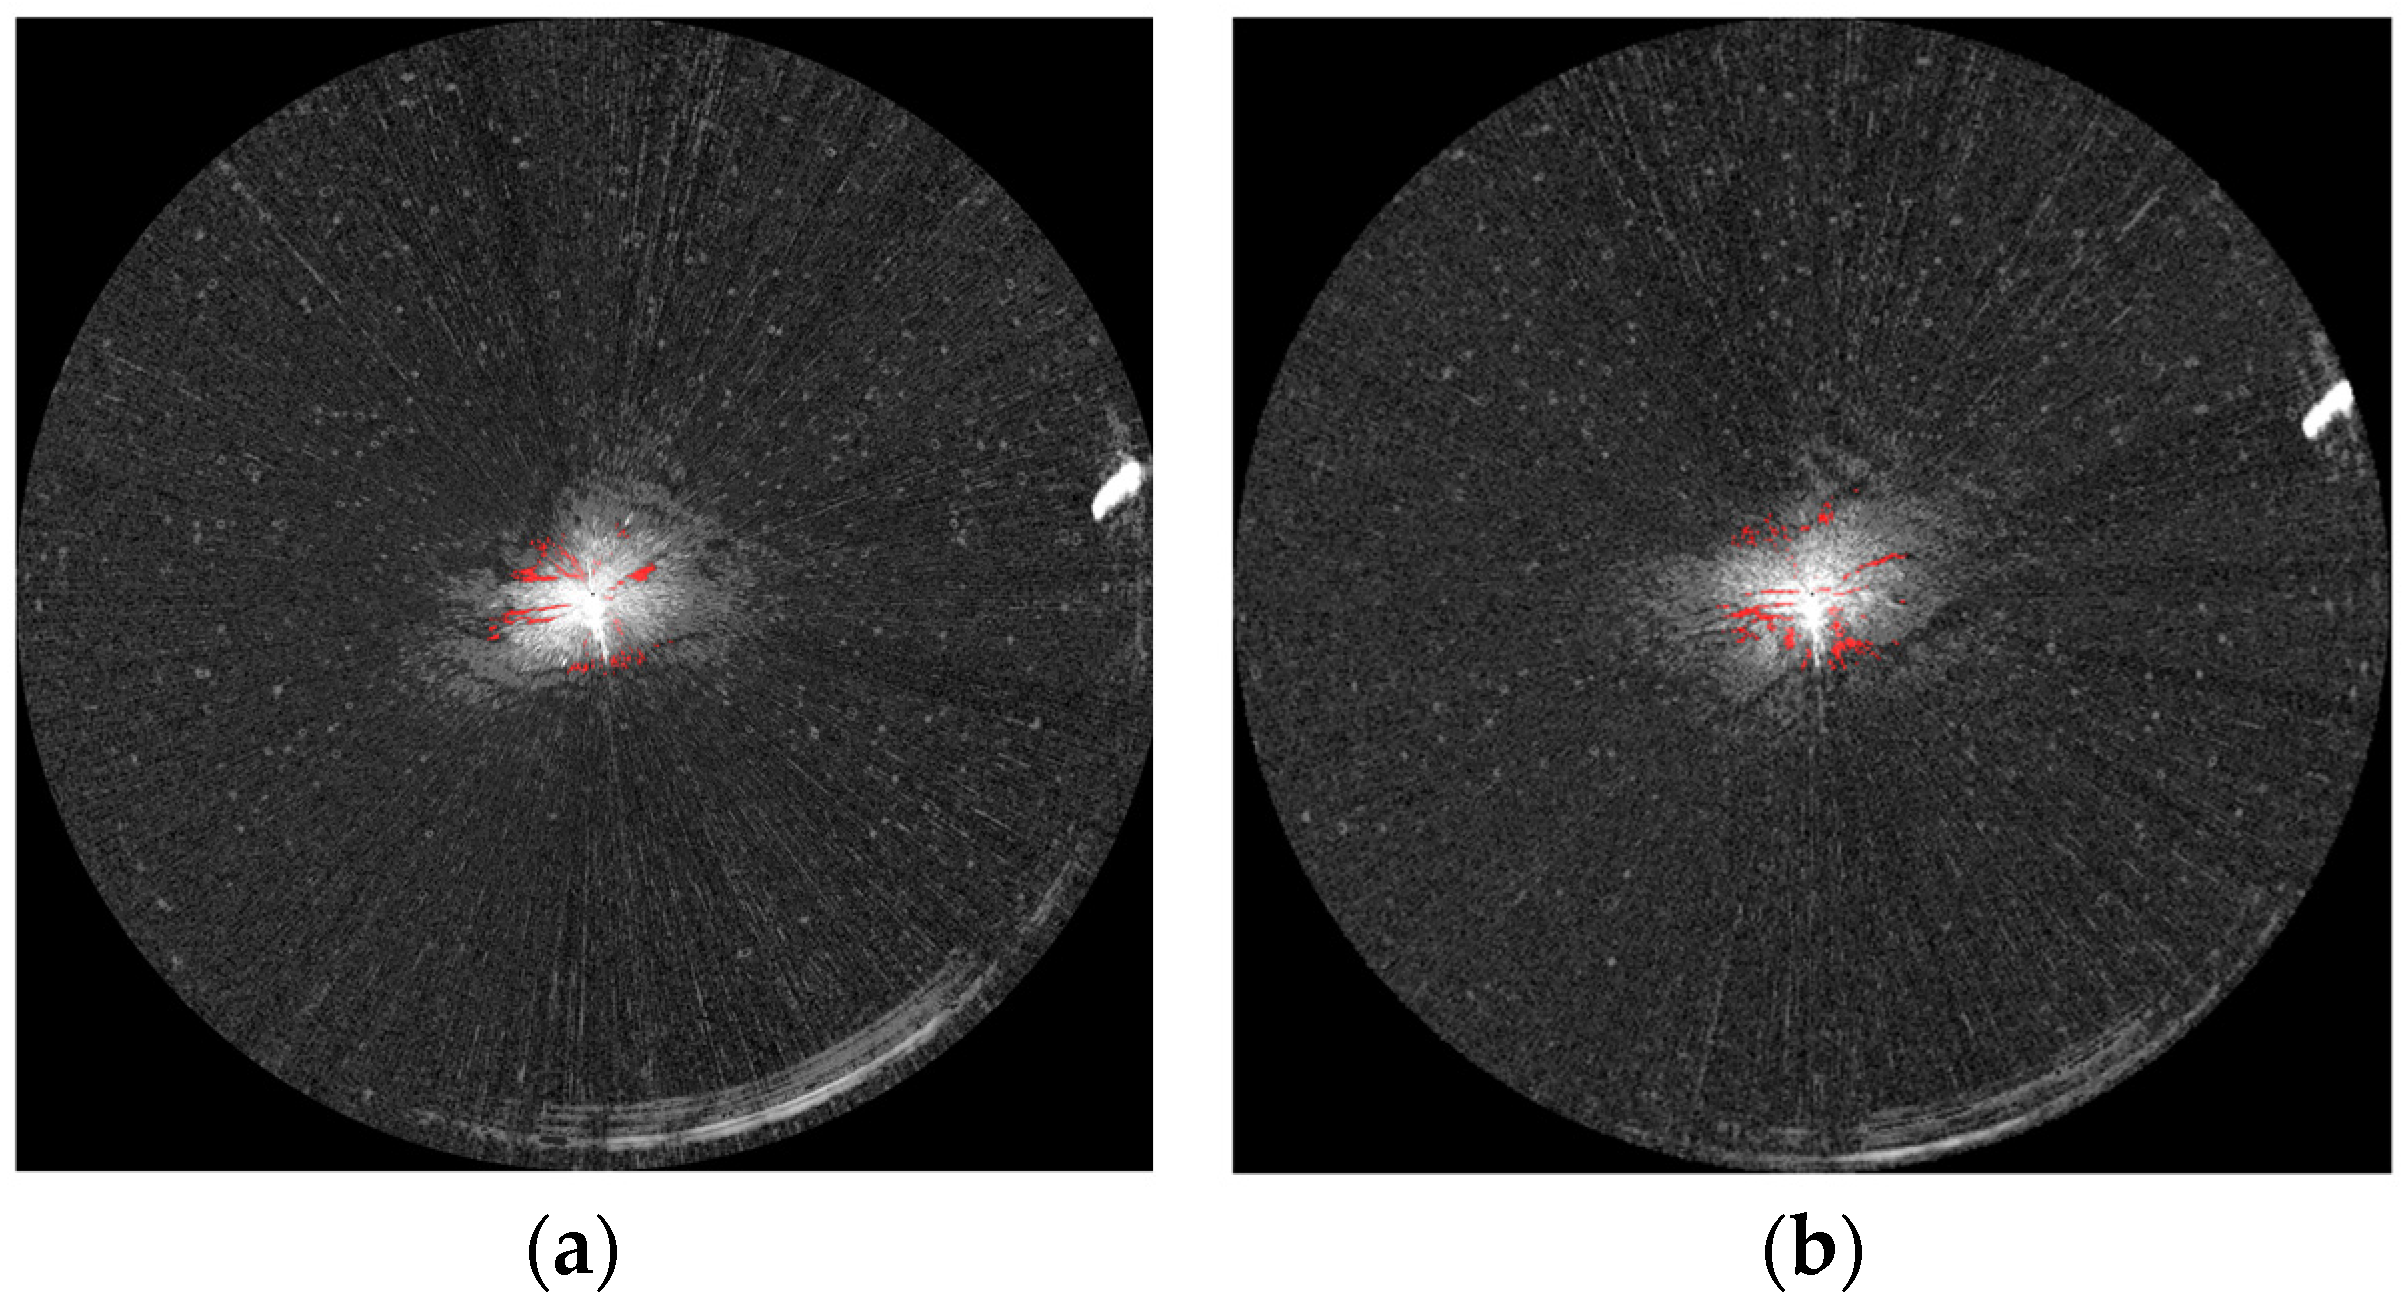
To verify the effectiveness of this method in the emergency response for oil spill monitoring, another marine radar oil spill image was also processed by using the same steps. In order to better support actual emergency rescue, the experimental results were further projected to the polar coordinate system through speckle noise suppression, as shown in Figure 6. Subsequent discussions were focused on the data in Figure 6a.
The results shown that the shape and edge details of the oil film are clearly preserved. The proposed algorithm was highly effective in accurately identifying the characteristics of oil films. However, for the recognition of suspected oil film regions, although the algorithm had shown preliminary recognition ability, the performance was still imperfect. Due to the influence of ship wake or wind waves on some suspected oil film regions, the oil film recognition precision is not good enough.

3.2. Evaluation of Experimental Results

The proposed oil film segmentation algorithm performs well in the evaluation, and each index meets practical needs for emergency rescue, as shown in Table 1. The accuracy achieves 94.5%, which shows that it can correctly classify the vast majority of pixels. The precision rate is up to 99.8%, indicating that there is almost no false detection in the segmentation results. The recall rate is 94.6%, which shows that the algorithm can capture most of the real oil film regions. Both the F1-score and Dice coefficient are 97.14%, and the IoU is 94.43%. These indicators further verify its good performance in balancing accuracy and missed detection.

4. Discussion

4.1. Comparison with NGN Model

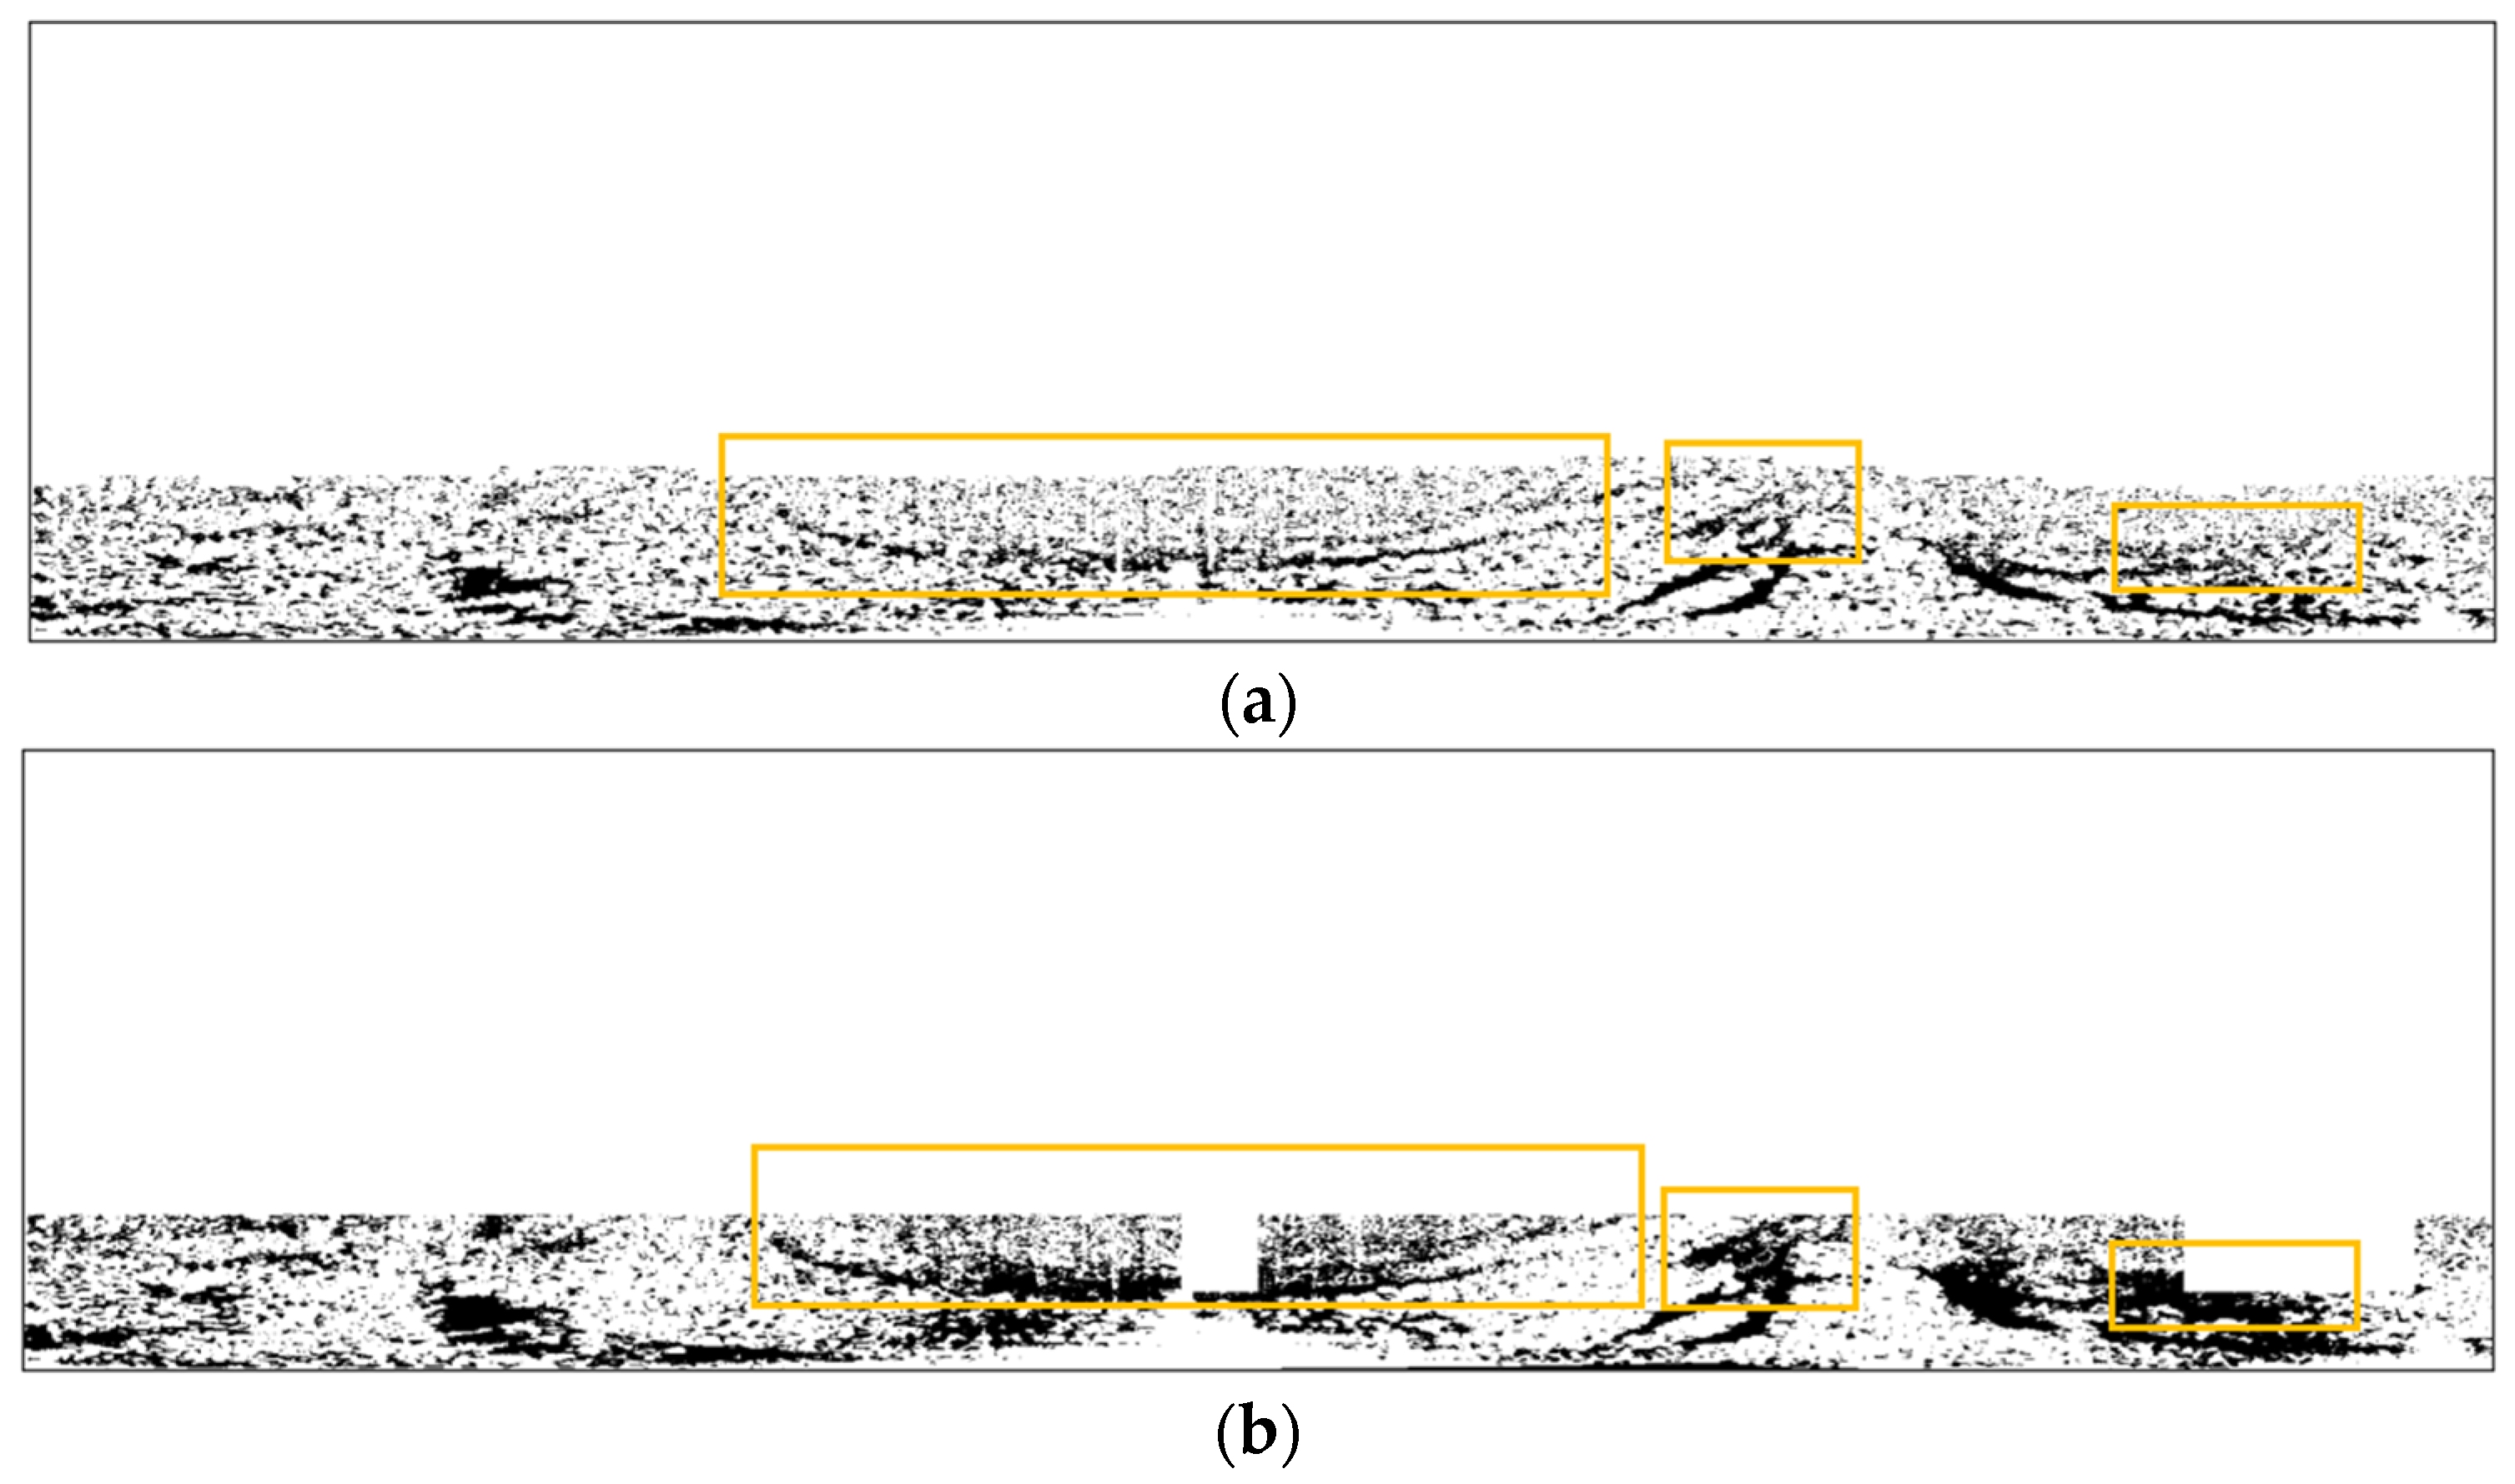
The results of the OAT-NGN algorithm were compared with those of the NGN model, as shown in Figure 7. The segmentation results of the OAT-NGN algorithm had less noise interference, and the target regions were more obvious. By contrast, the NGN model exhibited relatively significant noise interference. This not only blurred the boundaries of the target region but also potentially obscured some important details of the oil films, exerting a negative impact on the accuracy and integrity of the segmentation effect.
The orange boundary areas in the above results were the suspected oil films and stern flow regions. The NGN model mistakenly identified a large number of regions similar to oil areas considered as oil films, resulting in a high misclassification rate. In contrast, the OAT-NGN algorithm performed better in identifying oil film regions. Some oil films in the red boundary areas were not identified. It was indicated that neither algorithm could achieve ideal recognition accuracy in complex marine environments such as ship wake or wind wave interference.
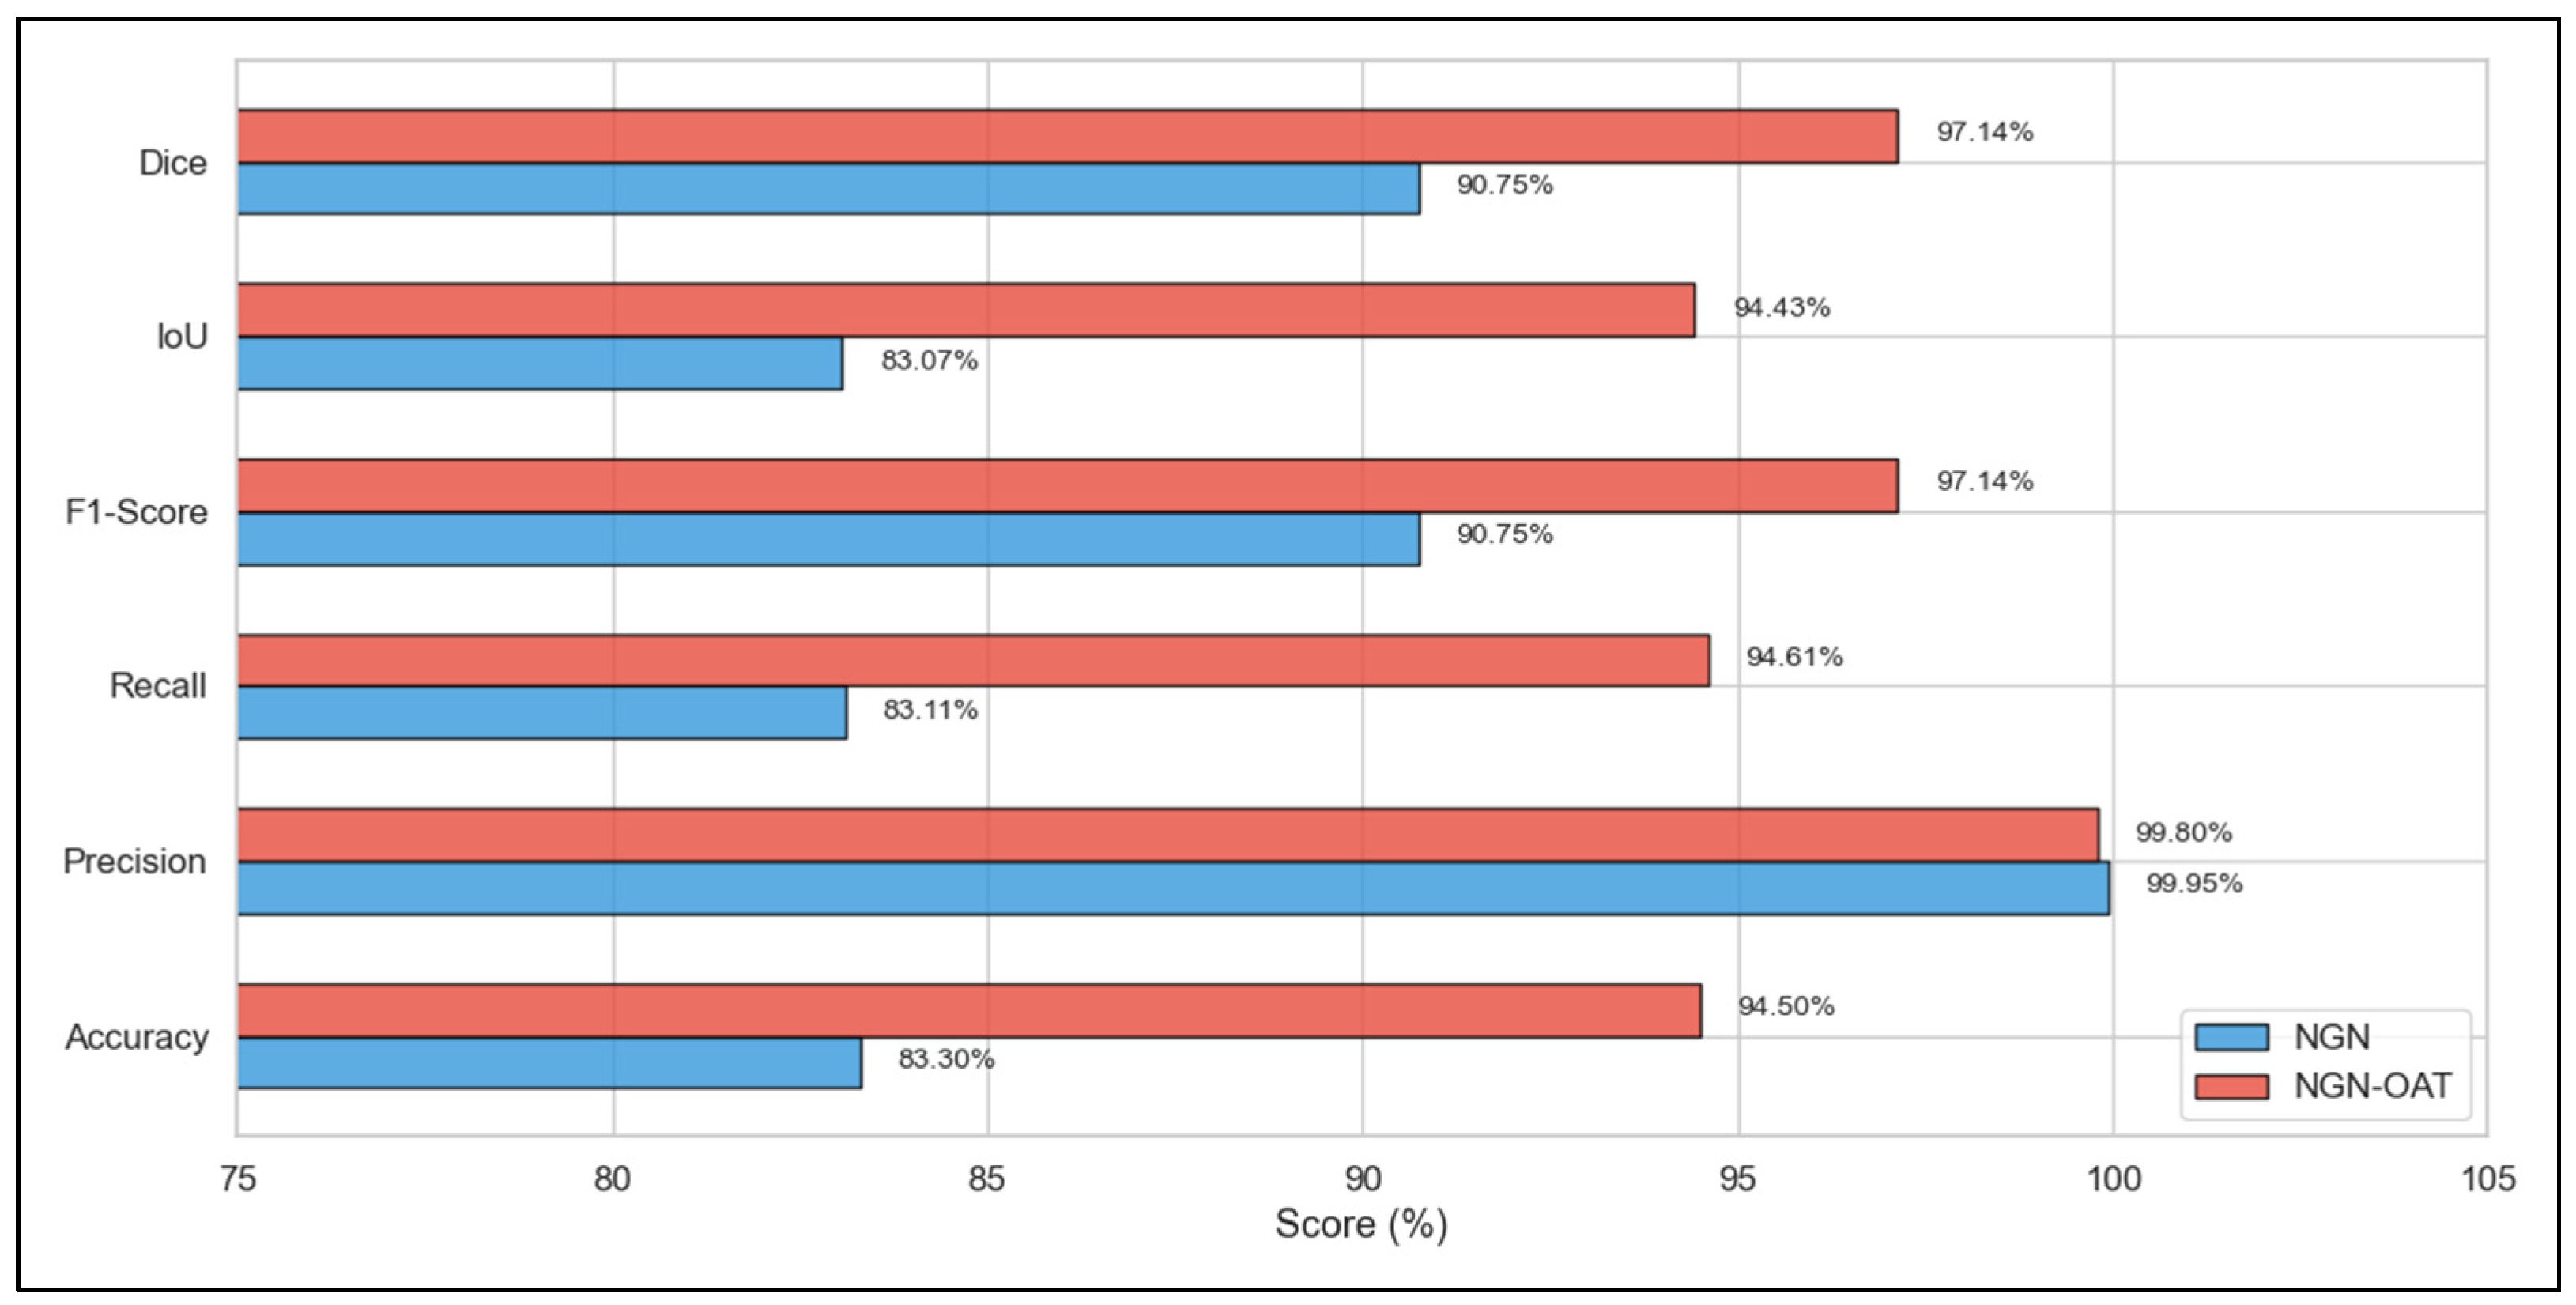
The performance indicators related to both algorithms are shown in Figure 8. The OAT-NGN algorithm exhibited superior performance in various key indicators, which was of great significance for oil film detection tasks. The accuracy of the OAT-NGN algorithm reached 94.50%, significantly higher than the 83.30% of the NGN. This proved that the OAT-NGN algorithm was more effective in distinguishing oil film regions from the backside in overall classification tasks. In terms of the recall rate, the OAT-NGN algorithm performed well with 94.61%, while the NGN model only achieved 83.11%. This means that the OAT-NGN algorithm could capture the true characteristics of the oil films more comprehensively. In terms of precision, the value of the NGN model was 99.95%, slightly higher than the 99.80% of the OAT-NGN algorithm. Both methods had extremely high precision, indicating that the probability of misjudgment in identified oil film regions was almost negligible. However, the slightly lower value of the OAT-NGN algorithm might reflect its greater emphasis on recall, sacrificing some accuracy. As for the F1-score and Dice, the OAT-NGN algorithm was once again in a leading position, reaching 97.14% and 90.75%, respectively. This means that the OAT-NGN algorithm could maintain high segmentation quality. In terms of IoU, the value of the OAT-NGN algorithm was 94.43%, far exceeding the 83.07% of the NGN algorithm. Its high IoU value implied that the segmented areas had a higher value of overlap with the real labeled areas, ensuring accuracy.

4.2. Comparison with Other Algorithms

4.2.1. Comparison with Global Adaptive Threshold Method

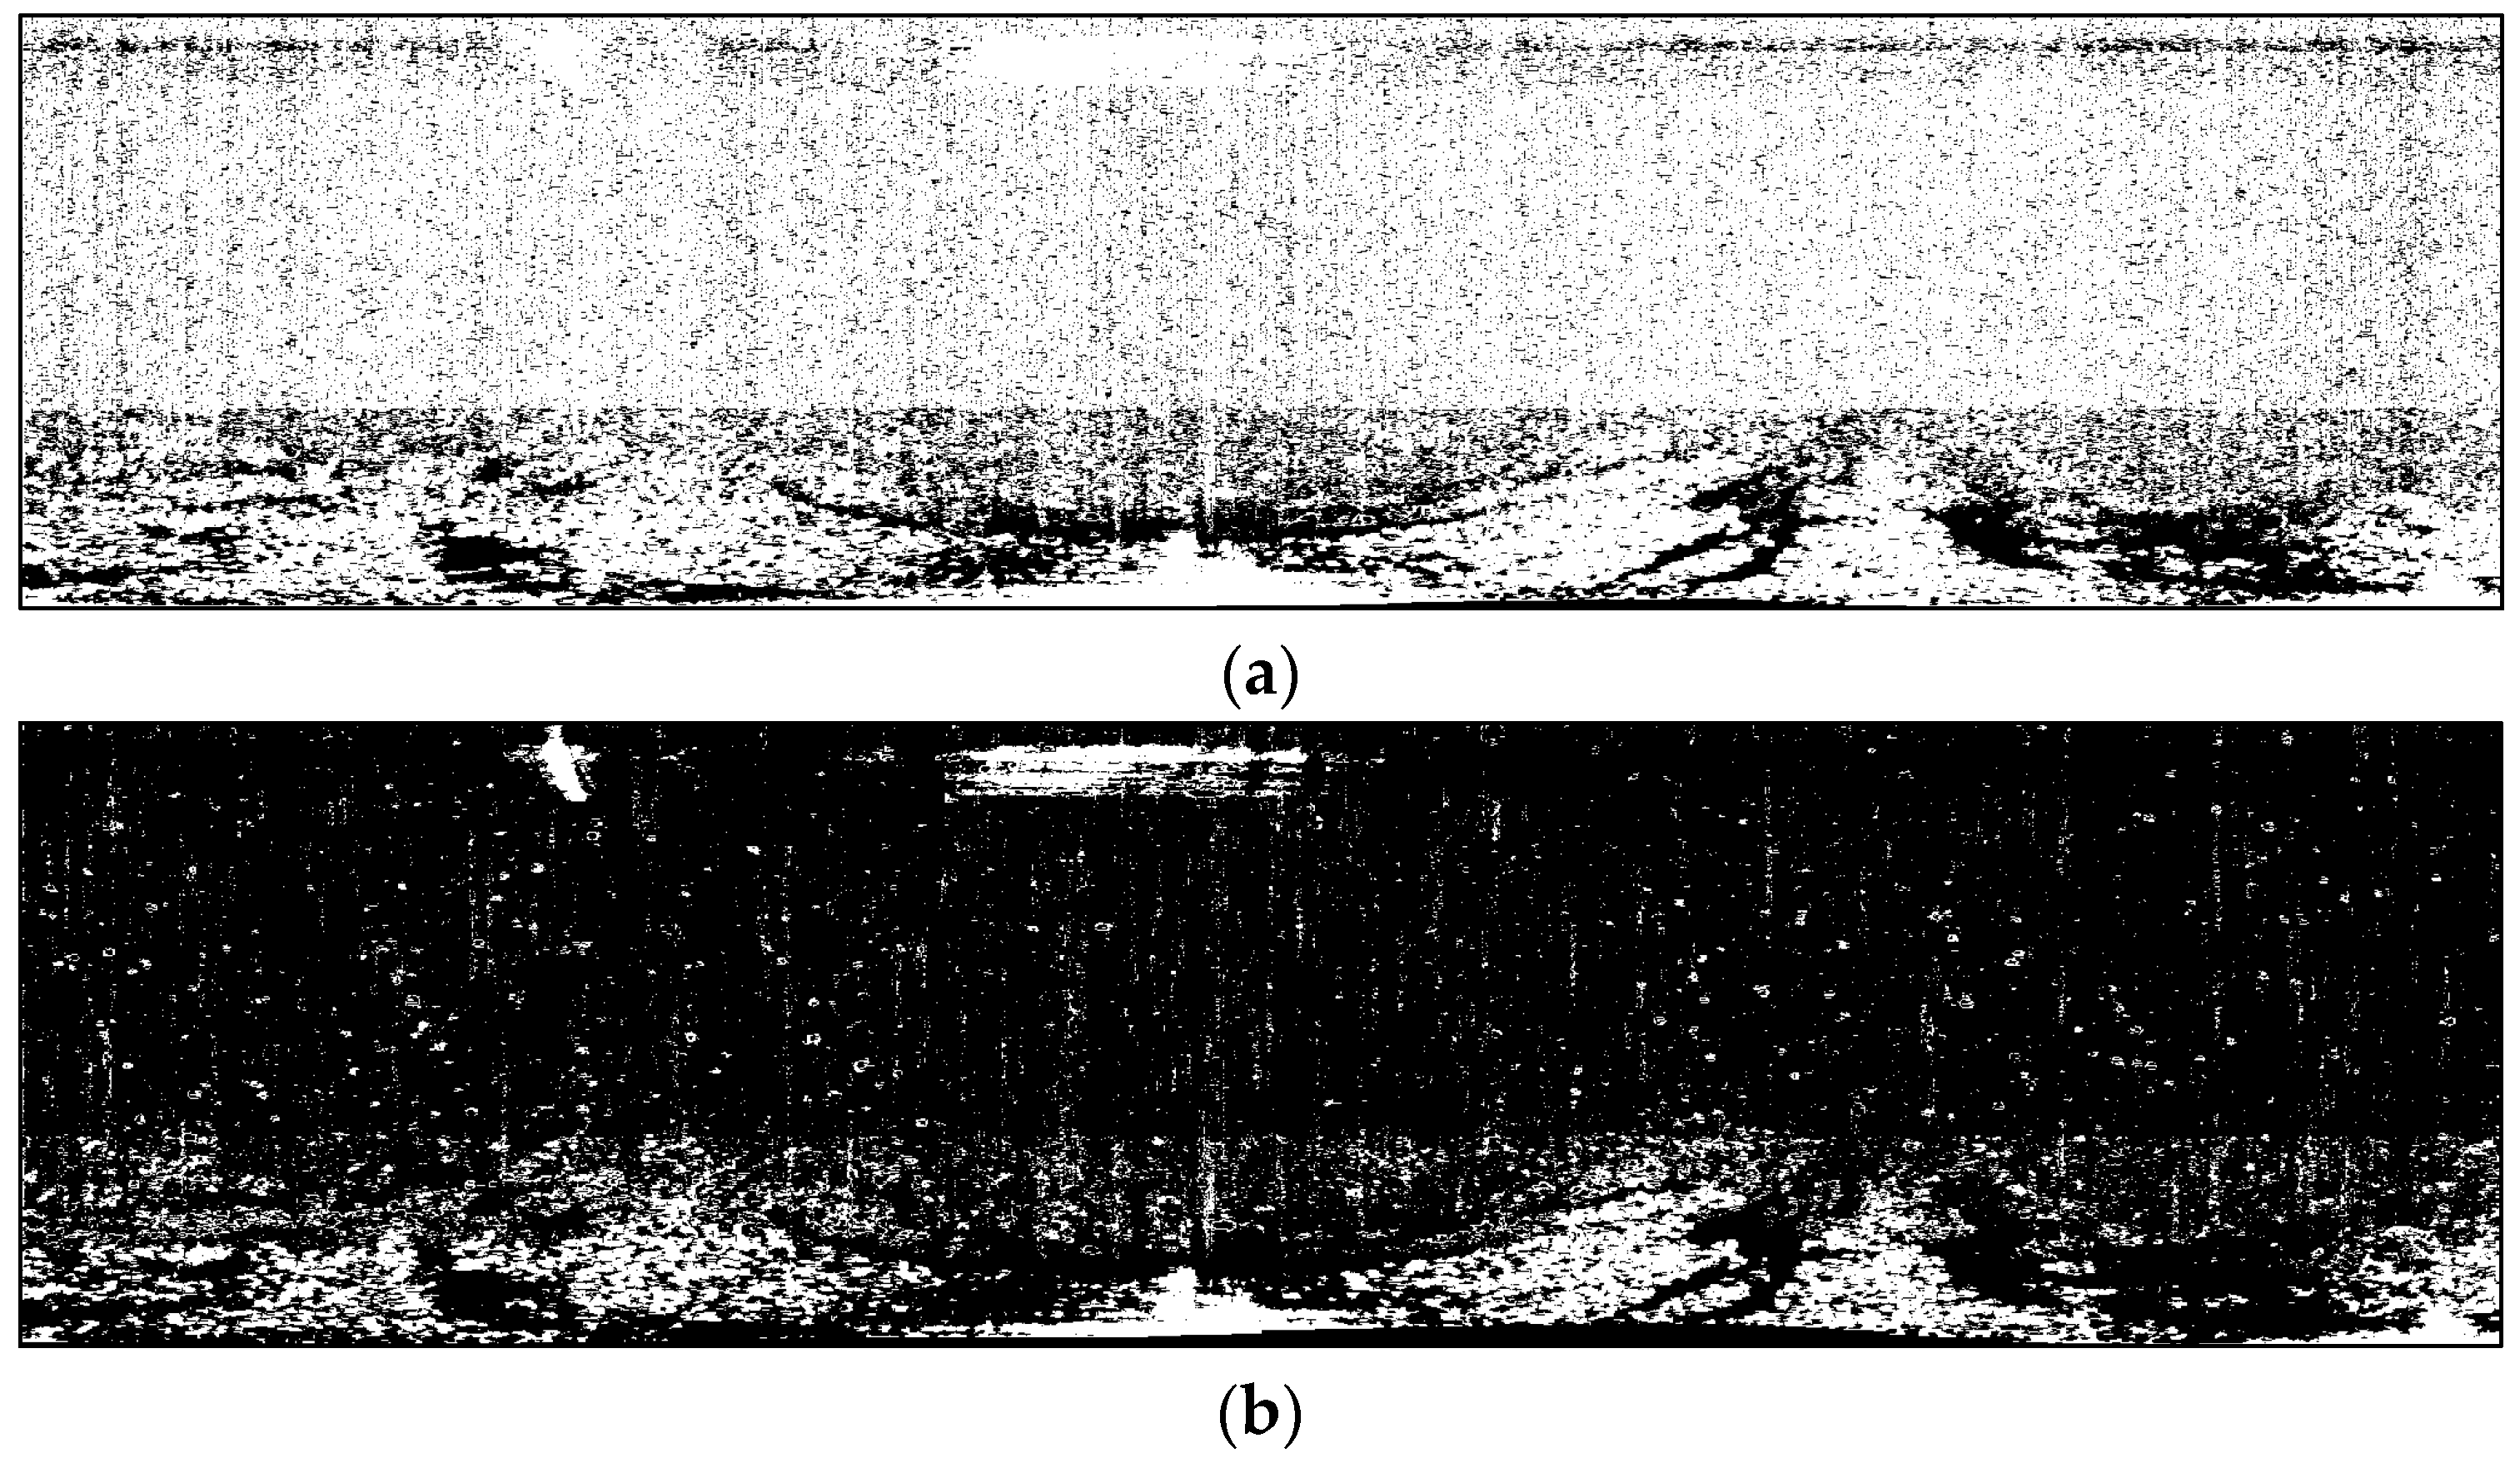
The threshold segmentation method was based on the minimum fuzzy metric proposed by Huang and Wang [44] (called Method 1 here) and the global Otsu adaptive threshold [45,46,47] (called Method 2 here). The segmentation results are shown in Figure 9. The method proposed was compared with these two global adaptive threshold methods.
In terms of noise suppression in the oil film results, the two methods shown significant differences in noise processing. Although Method 1 had oil film recognition ability, there were intensive noises in the result. The residual interference noise still needed to be further optimized and suppressed to improve the accuracy of the segmentation results. For Method 2, the results were filled with dense noise pixels, which deeply mixed with the details of the oil films, seriously interfering with the target extraction. This resulted in the need to invest a significant amount of additional cost in denoising during subsequent processing. In contrast, little noise was present in the results of our method. Through adaptive background modeling and the iterative optimization of thresholds, our method could significantly reduce the interference of noise. This mechanism provided favorable conditions for the accurate segmentation of oil films. In terms of oil film recognition ability, our method presented the outline of the oil films more clearly. Although Method 1 could identify a large number of oil film regions, its feature discrimination mechanism had limitations. It was easy to mistake suspected oil film regions and non-oil regions as real targets. Method 2 found it difficult to effectively distinguish between oil films and noises due to excessive noise interference, which led to the inaccurate extraction of target boundaries, resulting in poor recognition performance. In terms of identifying suspected oil film regions, the proposed method effectively reduced the probability of misclassification by fusing multiple features for discrimination. This feature fusion mechanism effectively improved the accuracy of oil film detection. Method 2 involved a significant amount of noise interference, making it difficult to reliably distinguish between oil films and noise. Method 1 not only has the problem of false negatives due to incomplete oil film region segmentation but also results in some oil film regions being inaccurately identified. There were also false positive cases where the background was mistakenly labeled as oil films. Therefore, our method yielded better results.

4.2.2. Comparison with Local Adaptive Threshold Method

The local Otsu adaptive thresholding method (called Method 3 here) and Sauvola local thresholding method (called Method 4 here) [48,49,50] were compared here with our method, as shown in Figure 10.
In terms of noise suppression in oil film results, Method 3 relied on local grayscale statistics, resulting in a large amount of residual fine noise. The deep overlap between oil film and noise made it difficult to effectively separate them, which seriously affected the accurate extraction of oil film features. Method 4 adjusted the threshold by local mean and standard deviation, and its noise suppression effect was improved compared to Method 3. However, there were still some residual noise interferences. Our method could significantly reduce the noise interference on oil film detection. Our method integrated multi-dimensional features such as the grayscale gradient and area connectivity. The segmentation results could clearly and completely present the contour of the oil films. The results of Method 3 were remarkably affected by local noise, resulting in blurred oil film boundaries, leading to poor recognition performance. Part of the oil film regions were accurately identified by Method 4 without noise interference. However, the edges of the oil films and weak signal parts were prone to loss. To some extent, application effectiveness in oil spill detection was limited in Method 4. Method 3 used a single threshold, which led to excessive false positives and false negatives. This might lead to the misjudgment of oil film distribution. Method 4 had a better performance than Method 3 in terms of misclassification in suspected oil film regions. However, there were still issues with mislabeling regarding targets and the incomplete identification of oil film regions. So, our method could effectively reduce the probability of misclassification in non-oil film regions.

4.2.3. Comparison with Other Machine Learning Algorithms

Xu et al. proposed a shipborne radar oil spill detection method based on Local Binary Pattern (LBP) texture features and K-Means clustering analysis [51] (called Method 5 here). Li et al. proposed a method for offshore oil spill detection that integrates the Gray-Level Co-occurrence Matrix (GLCM), Support Vector Machine (SVM), and Fuzzy C-Means (FCM) [52] (called Method 6 here). The segmentation results of the two methods are shown in Figure 11.
The results of both methods were filled with small speckles. Both methods are severely affected by the wake of the ship, leading to the misjudgment of suspected oil film regions as actual oil film areas. However, compared with the other two methods, Method 6 still performed well in identifying certain oil film regions. It could better determine the oil film region. For the identification of suspected oil films, our method and Method 5 perform well in accurately distinguishing suspected oil film areas. Method 6 had a weak ability to identify suspected oil films, resulting in a sum of false alarms. The suspected oil films were mistakenly classified as actual oil films.

4.2.4. Quantitative Comparative Analysis

The comparative experimental results clearly demonstrated that our proposed method was superior, as shown in Table 2. Specifically, our method significantly outperformed the other comparative methods in classification metrics such as accuracy, recall, and the F1-score. This outstanding performance not only confirmed the accuracy of the model in object recognition and classification but also reflected its excellent detection coverage. Although some comparison methods achieved near-perfect performance in accuracy metrics, these methods often come at the cost of sacrificing recall. Our method significantly improved recall and spatial accuracy while maintaining high precision, fully verifying its excellent performance in image recognition and segmentation tasks.

4.3. Limitations of Marine Radar Oil Spill Monitoring Technology

The detection effect of marine radar oil spill monitoring technology is significantly affected by the conditions of waves, which are directly constrained by weather conditions. There are two key limitations to the practical application of this technology. Firstly, in exceptionally calm sea conditions, the insufficient roughness of the sea surface leads to low wave echo signal strength, making it difficult to effectively identify oil film features. This low-energy echo environment will significantly reduce the detection sensitivity of the system. Secondly, under strong wind conditions, there will be a dual-interference effect: (a) Intense wind and waves will promote the mixing of oil spills and seawater, weakening the inhibitory effect of oil films on sea surface roughness. (b) Enhanced sea clutter will significantly increase the background noise level and increase the difficulty of extracting oil film features from complex wave information. More seriously, excessive wind force may also cause the physical dispersion and dilution of the oil film, fundamentally reducing its detectability.

4.4. Potentiality of NGN-OAT Model in High-Frequency Ground Wave Radar Data

The NGN-OAT segmentation strategy proposed in this study performs well in oil spill detection tasks and also demonstrates potential application value in the field of target detection using high-resolution-range Doppler images. This algorithm can effectively distinguish target signals from sea clutter interference through adaptive background modeling and a multi-feature fusion mechanism, which is highly compatible with the technical requirements of weak target detection in high-frequency ground wave radar (HFSWR) systems [53,54,55,56]. Specifically, the dynamic topology optimization mechanism based on NGNs can effectively adapt to the non-stationary distribution characteristics of targets and clutter in the time–frequency domain in the Doppler distance images, while the global search strategy of the OAT model provides a new approach for solving the detection problem of Doppler extended targets. It should be pointed out that the current research mainly focuses on the verification of marine radar oil spill segmentation tasks. In the future, specialized radar datasets will be needed to further validate the cross-domain applicability of this model in HFSWR systems.

5. Conclusions

In this study, an innovative OAT-NGN algorithm based on oil spill data collected by shipborne X-band radar is proposed. This algorithm has successfully achieved the high-precision detection and segmentation of oil film regions in the radar image. The results show that this algorithm exhibits prominent advantages in multiple performance indicators. Compared to the NGN model, the OAT-NGN algorithm has improved accuracy by 11.2%, the recall rate by 11.5%, and IoU by 11.36%. This method effectively overcomes the drawbacks of traditional methods that are prone to falling into local optima and ignoring spatial information. The OAT-NGN algorithm achieves a breakthrough mechanism. Firstly, the NGN module utilizes a neuron competition mechanism to adaptively learn local topology structures. Thus, the spatial distribution characteristics of the oil films are effectively preserved. Secondly, the OAT module introduces multiple seeds for a parallel search and connection penalty terms, which improves the robustness of the algorithm in complex scenarios such as ship wake and wind wave interference. Thirdly, the collaborative optimization mechanism of the NGN module and the OAT module achieves the organic integration of local feature learning and a global threshold search. The algorithm is enhanced to balance computational efficiency while ensuring segmentation accuracy. Compared with the other six methods, the superiority of our algorithm is further verified. The OAT-NGN algorithm can provide an efficient solution for detecting oil spills in shipborne radar datasets. Future work will focus on enhancing the detection ability of weak target signals in complex sea conditions by introducing deep learning methods and further improving recognition accuracy.

Author Contributions

Conceptualization, Z.G. and J.X.; methodology, Z.G.; software, Z.G. and J.X.; validation, Z.G., P.L., Z.G. and J.X.; resources, J.X. and B.J.; data curation, J.X.; writing—original draft preparation, Z.G.; writing—review and editing, J.X. and B.J.; supervision, J.X. and B.L.; project administration, J.X.; funding acquisition, J.X. All authors have read and agreed to the published version of the manuscript.

Funding

This research was supported by the Guangdong Basic and Applied Basic Research Foundation, grant numbers 2025A1515010886 and 2023A1515011212, the National Natural Science Foundation of China, grant number 52271359, the Special Projects in Key Fields of Ordinary Universities in Guangdong Province, grant number 2022ZDZX3005, the Shenzhen Science and Technology Program, grant number JCYJ20220530162200001, the Postgraduate Education Innovation Project of Guangdong Ocean University, grant numbers 202421, 202539 and 202551, and the Guangdong Provincial Key Laboratory of Intelligent Equipment for South China Sea Marine Ranching, grant number 080508132401.

Data Availability Statement

The data collection department did not agree to share the analysis data.

Conflicts of Interest

The authors declare no conflicts of interest.

References

  1. Yin, C. International Law Regulation of Offshore Oil and Gas Exploitation. Environ. Impact. Assess. Rev. 2021, 88, 106551. [Google Scholar] [CrossRef]
  2. Zhou, X.; Ruan, X.; Wang, H.; Zhou, G. Exploring Spatial Patterns and Environmental Risk Factors for Global Maritime Accidents: A 20-Year Analysis. Ocean Eng. 2023, 286, 115628. [Google Scholar] [CrossRef]
  3. Novaglio, C.; Bax, N.; Boschetti, F.; Emad, G.R.; Frusher, S.; Fullbrook, L.; Hemer, M.; Jennings, S.; van Putten, I.; Robinson, L.M.; et al. Deep Aspirations: Towards a Sustainable Offshore Blue Economy. Rev. Fish Biol. Fish. 2022, 32, 209–230. [Google Scholar] [CrossRef] [PubMed]
  4. Yu, J.; Zhou, D.; Yu, M.; Yang, J.; Li, Y.; Guan, B.; Wang, X.; Zhan, C.; Wang, Z.; Qu, F. Environmental Threats Induced Heavy Ecological Burdens on the Coastal Zone of the Bohai Sea, China. Sci. Total Environ. 2021, 765, 142694. [Google Scholar] [CrossRef] [PubMed]
  5. Chen, J.; Di, Z.; Shi, J.; Shu, Y.; Wan, Z.; Song, L.; Zhang, W. Marine Oil Spill Pollution Causes and Governance: A Case Study of Sanchi Tanker Collision and Explosion. J. Clean. Prod. 2020, 273, 122978. [Google Scholar] [CrossRef]
  6. Zhang, W.; Li, C.; Chen, J.; Wan, Z.; Shu, Y.; Song, L.; Xu, L.; Di, Z. Governance of Global Vessel-Source Marine Oil Spills: Characteristics and Refreshed Strategies. Ocean Coast. Manag. 2021, 213, 105874. [Google Scholar] [CrossRef]
  7. Ma, X.; Xu, J.; Pan, J.; Yang, J.; Wu, P.; Meng, X. Detection of Marine Oil Spills from Radar Satellite Images for the Coastal Ecological Risk Assessment. J. Environ. Manag. 2023, 325, 116637. [Google Scholar] [CrossRef]
  8. Wang, L.; Niu, W.; Ding, L.; Zhao, Z. A Bibliometric Review on Marine Economy: Current Status, Development and Future Directions. Mar. Policy 2023, 155, 105705. [Google Scholar] [CrossRef]
  9. Fernández-Macho, J. Forecasting Marine Spill Risk along the U.S. Pacific Coasts. Mar. Pollut. Bull 2024, 198, 115826. [Google Scholar] [CrossRef]
  10. Mogollón, R.; Arellano, C.; Villegas, P.; Espinoza-Morriberón, D.; Tam, J. REPSOL Oil Spill off Central Perú in January 2022: A Modeling Case Study. Mar. Pollut. Bull 2023, 194, 115282. [Google Scholar] [CrossRef]
  11. Oil Tanker Collision and Fire in Gulf of Oman Caused by ‘Navigational Misjudgment’. Available online: https://www.thenationalnews.com/news/uae/2025/06/17/uae-coast-guard-rescues-24-crew-members-after-oil-tanker-collision-in-sea-of-oman (accessed on 5 July 2025).
  12. Zhang, C.; Zhu, J.; Mai, W.; Chen, Z.; Xie, Y.; Fu, S.; Xia, D.; Cai, C.; Zheng, W.; Liu, J.; et al. Satellite Remote Sensing-Implemented Nontargeted Screening of Emerging Contaminant Fingerprints in a River-to-Ocean Continuum through Interpretable Machine Learning: The Pivotal Intermediary Role of Dissolved Organic Matter. Environ. Sci. Technol. 2025, 59, 8714–8726. [Google Scholar] [CrossRef] [PubMed]
  13. Mokarram, M.; Pham, T.M. Environmental Monitoring of Oil Pollution in the Marine Waters Using Machine Learning and Remote Sensing. Adv. Space Res. 2025, 75, 6173–6187. [Google Scholar] [CrossRef]
  14. El Mahrad, B.; Newton, A.; Icely, J.D.; Kacimi, I.; Abalansa, S.; Snoussi, M. Contribution of Remote Sensing Technologies to a Holistic Coastal and Marine Environmental Management Framework: A Review. Remote Sens. 2020, 12, 2313. [Google Scholar] [CrossRef]
  15. Hengkai, L.; Feng, X.; Qin, L. Remote Sensing Monitoring of Land Damage and Restoration in Rare Earth Mining Areas in 6 Counties in Southern Jiangxi Based on Multisource Sequential Images. J. Environ. Manag. 2020, 267, 110653. [Google Scholar] [CrossRef] [PubMed]
  16. Shi, D.; Zou, J.; Liu, L.; Huang, F.; Li, L. Research Progress and Prospect of Super-Large Field-of-View Infrared Imaging Technology. Laser Optoelectron. Prog. 2025, 62, 1000004. [Google Scholar] [CrossRef]
  17. Sun, K.; Jiang, G.; Wang, N.; Yu, D.; Teng, J.; Gao, S.; Huang, J.; Zhao, Z.; Song, Y.; Xin, L.; et al. A Semantic Segmentation Network for Red Tide Detection Based on Enhanced Spectral Information Using HY-1C/D CZI Satellite Data. Mar. Pollut. Bull 2025, 215, 117813. [Google Scholar] [CrossRef]
  18. Wachmann, A.; Starko, S.; Neufeld, C.J.; Costa, M. Validating Landsat Analysis Ready Data for Nearshore Sea Surface Temperature Monitoring in the Northeast Pacific. Remote Sens. 2024, 16, 920. [Google Scholar] [CrossRef]
  19. Sun, C.; Li, J.; Liu, Y.; Pan, T.; Shi, K.; Cai, X. Synthesizing Landsat Images Using Time Series Model-Fitting Methods for China’s Coastal Areas against Sparse and Irregular Observations. GIsci. Remote Sens. 2024, 61, 2421574. [Google Scholar] [CrossRef]
  20. Shen, A.; Shao, J. Spectral Harmonization Landsat-8 and Sentinel-2A: The Matching Bands Adjustment before the Missing Bands Prediction Method. IEEE Trans. Geosci. Remote Sens. 2024, 62, 1–14. [Google Scholar] [CrossRef]
  21. Yan, L.; Roy, D.P. Using Landsat 8 and 9 Operational Land Imager (OLI) Data to Characterize Geometric Distortion and Improve Geometric Correction of Landsat Multispectral Scanner (MSS) Imagery. Remote Sens. Environ. 2025, 321, 114679. [Google Scholar] [CrossRef]
  22. St-Denis, F.; Tremblay, L.B.; Mahoney, A.R.; Takata-Glushkoff, K.P.L.M. Coastal Sea Ice Concentration Derived from Marine Radar Images: A Case Study from Utqiaġvik, Alaska. Remote Sens. 2024, 16, 3357. [Google Scholar] [CrossRef]
  23. Xu, J.; Liu, Z.; Hong, G.; Cao, Y. A New Machine-Learning-Based Calibration Scheme for MODIS Thermal Infrared Water Vapor Product Using BPNN, GBDT, GRNN, KNN, MLPNN, RF, and XGBoost. IEEE Trans. Geosci. Remote Sens. 2024, 62, 1–12. [Google Scholar] [CrossRef]
  24. Bondur, V.; Chernikova, V.; Chvertkova, O.; Zamshin, V. Spatiotemporal Variability of Anthropogenic Film Pollution in Avacha Gulf near the Kamchatka Peninsula Based on Synthetic-Aperture Radar Imagery. J. Mar. Sci. Eng. 2024, 12, 2357. [Google Scholar] [CrossRef]
  25. Yi, Y.; Chen, K.; Xu, J.; Luo, Q. Tracking the Dynamics of Salt Marsh Including Mixed-Vegetation Zones Employing Sentinel-1 and Sentinel-2 Time-Series Images. Remote Sens. 2025, 17, 56. [Google Scholar] [CrossRef]
  26. Welikanna, D.R.; Jin, S. A Data Driven Oil Spill Mapping Using GMM Clustering and Damping Ratio on X-Press Pearl Ship Disaster in the Indian Ocean. Mar. Pollut. Bull. 2024, 203, 116392. [Google Scholar] [CrossRef]
  27. Oluwadare, T.S.; Chen, D.; Oluwafemi, O.; Babadi, M.; Hossain, M.; Ibukun, O. Reconstructing Snow-Free Sentinel-2 Satellite Imagery: A Generative Adversarial Network (GAN) Approach. Remote Sens. 2024, 16, 2352. [Google Scholar] [CrossRef]
  28. Li, C.; Kim, D.-j.; Park, S.; Kim, J.; Song, J. A Self-Evolving Deep Learning Algorithm for Automatic Oil Spill Detection in Sentinel-1 SAR Images. Remote Sens. Environ. 2023, 299, 113872. [Google Scholar] [CrossRef]
  29. Fan, Y.; Rui, X.; Zhang, G.; Yu, T.; Xu, X.; Poslad, S. Feature Merged Network for Oil Spill Detection Using Sar Images. Remote Sens. 2021, 13, 3174. [Google Scholar] [CrossRef]
  30. Chen, F.; Balzter, H.; Ren, P.; Zhou, H. SRCNet: Seminal Image Representation Collaborative Network for Oil Spill Segmentation in SAR Imagery. IEEE Trans. Geosci. Remote Sens. 2024, 62, 1–18. [Google Scholar] [CrossRef]
  31. Zhu, Q.; Zhang, Y.; Li, Z.; Yan, X.; Guan, Q.; Zhong, Y.; Zhang, L.; Li, D. Oil Spill Contextual and Boundary-Supervised Detection Network Based on Marine SAR Images. IEEE Trans. Geosci. Remote Sens. 2022, 60, 5213910. [Google Scholar] [CrossRef]
  32. Cheng, L.; Li, Y.; Zhang, X.; Xie, M. An Analysis of the Optimal Features for Sentinel-1 Oil Spill Datasets Based on an Improved J–M/K-Means Algorithm. Remote Sens. 2022, 14, 4290. [Google Scholar] [CrossRef]
  33. Song, D.; Huang, Q.; Gao, H.; Wang, B.; Zhang, J.; Chen, W. Adaptive Oil Spill Detection Network for Scene-Based PolSAR Data Using Dynamic Convolution and Boundary Constraints. Int. J. Appl. Earth Obs. Geoinf. 2024, 130, 103914. [Google Scholar] [CrossRef]
  34. Ji, Y.; Wang, Y.; Sun, W.; Zhang, H.; Li, F.; Huang, W. Target Monitoring Capability Analysis for Shipborne HFSWR under Different Platform Motions. IEEE Trans. Geosci. Remote Sens. 2024, 62, 1–17. [Google Scholar] [CrossRef]
  35. Lau, T.K.; Huang, K.H. A Timely and Accurate Approach to Nearshore Oil Spill Monitoring Using Deep Learning and GIS. Sci. Total Environ. 2024, 912, 169500. [Google Scholar] [CrossRef] [PubMed]
  36. Chen, R.; Jia, B.; Ma, L.; Xu, J.; Li, B.; Wang, H. Marine Radar Oil Spill Extraction Based on Texture Features and BP Neural Network. J. Mar. Sci. Eng. 2022, 10, 1904. [Google Scholar] [CrossRef]
  37. Liu, P.; Li, Y.; Liu, B.; Chen, P.; Xu, J. Semi-Automatic Oil Spill Detection on X-Band Marine Radar Images Using Texture Analysis, Machine Learning, and Adaptive Thresholding. Remote Sens. 2019, 11, 756. [Google Scholar] [CrossRef]
  38. Martinetz, T.; Schulten, K. A “Neural-Gas” Network Learns Topologies. In Artificial Neural Networks; Elsevier: Amsterdam, The Netherlands, 1991; pp. 397–402. [Google Scholar]
  39. Cottrell, M.; Hammer, B.; Hasenfuß, A.; Villmann, T. Batch and Median Neural Gas. Neural Netw. 2006, 19, 762–771. [Google Scholar] [CrossRef]
  40. Dirgová Luptáková, I.; Šimon, M.; Huraj, L.; Pospíchal, J. Neural Gas Clustering Adapted for Given Size of Clusters. Math. Probl. Eng. 2016, 2016, 9324793. [Google Scholar] [CrossRef]
  41. Qin, A.K.; Suganthan, P.N. Robust Growing Neural Gas Algorithm with Application in Cluster Analysis. Neural Netw. 2004, 17, 1135–1148. [Google Scholar] [CrossRef]
  42. Qin, A.K.; Suganthan, P.N. Enhanced Neural Gas Network for Prototype-Based Clustering. Pattern Recognit. 2005, 38, 1275–1288. [Google Scholar] [CrossRef]
  43. Wang, R.B.; Hu, R.B.; Geng, F.D.; Xu, L.; Chu, S.C.; Pan, J.S.; Meng, Z.Y.; Mirjalili, S. The Animated Oat Optimization Algorithm: A Nature-Inspired Metaheuristic for Engineering Optimization and a Case Study on Wireless Sensor Networks. Knowl. Based Syst. 2025, 318, 113589. [Google Scholar] [CrossRef]
  44. Huang, L.K.; Wang, M.J.J. Image Thresholding by Minimizing the Measures of Fuzziness. Pattern Recognit. 1995, 28, 41–51. [Google Scholar] [CrossRef]
  45. Goh, T.Y.; Basah, S.N.; Yazid, H.; Aziz Safar, M.J.; Ahmad Saad, F.S. Performance Analysis of Image Thresholding: Otsu Technique. Measurement 2018, 114, 298–307. [Google Scholar] [CrossRef]
  46. Ma, G.; Yue, X. An Improved Whale Optimization Algorithm Based on Multilevel Threshold Image Segmentation Using the Otsu Method. Eng. Appl. Artif. Intell. 2022, 113, 104960. [Google Scholar] [CrossRef]
  47. Tan, J.; Tang, Y.; Liu, B.; Zhao, G.; Mu, Y.; Sun, M.; Wang, B. A Self-Adaptive Thresholding Approach for Automatic Water Extraction Using Sentinel-1 SAR Imagery Based on OTSU Algorithm and Distance Block. Remote Sens. 2023, 15, 2690. [Google Scholar] [CrossRef]
  48. Najafi, M.H.; Salehi, M.E. A Fast Fault-Tolerant Architecture for Sauvola Local Image Thresholding Algorithm Using Stochastic Computing. IEEE Trans. Very Large Scale Integr. VLSI Syst. 2016, 24, 808–812. [Google Scholar] [CrossRef]
  49. Mohamed Razali, M.R.; Ahmad, N.S.; Mohd Zaki, Z.; Ismail, W. Region of Adaptive Threshold Segmentation between Mean, Median and Otsu Threshold for Dental Age Assessment. In Proceedings of the I4CT 2014—1st International Conference on Computer, Communications, and Control Technology, Langkawi, Malaysia, 2–4 September 2014; Institute of Electrical and Electronics Engineers Inc.: New York, NY, USA, 2014; pp. 353–356. [Google Scholar]
  50. Sauvola, J.; Pietikäinen, M. Adaptive Document Image Binarization. Pattern Recognit. 2000, 33, 225–236. [Google Scholar] [CrossRef]
  51. Xu, J.; Pan, X.; Jia, B.; Wu, X.; Liu, P.; Li, B. Oil Spill Detection Using LBP Feature and K-Means Clustering in Shipborne Radar Image. J. Mar. Sci. Eng. 2021, 9, 65. [Google Scholar] [CrossRef]
  52. Li, B.; Xu, J.; Pan, X.; Ma, L.; Zhao, Z.; Chen, R.; Liu, Q.; Wang, H. Marine Oil Spill Detection with X-Band Shipborne Radar Using GLCM, SVM and FCM. Remote Sens. 2022, 14, 3715. [Google Scholar] [CrossRef]
  53. Golubović, D.; Erić, M.; Vukmirović, N. High-Resolution Doppler and Azimuth Estimation and Target Detection in HFSWR: Experimental Study. Sensors 2022, 22, 3558. [Google Scholar] [CrossRef]
  54. Golubovic, D.; Eric, M.; Vukmirovic, N. High-Resolution Method for Primary Signal Processing in HFSWR. In Proceedings of the 2022 30th European Signal Processing Conference (EUSIPCO), Belgrade, Serbia, 29 August–2 September 2022; Volume 2022, pp. 912–916. [Google Scholar]
  55. Golubovic, D.; Eric, M.; Vukmirovic, N. Improved Detection of Targets on the High-Resolution Range-Doppler Map in HFSWRs. In Proceedings of the 2024 23rd International Symposium INFOTEH-JAHORINA (INFOTEH 2024), East Sarajevo, Bosnia and Herzegovina, 20–22 March 2024; Institute of Electrical and Electronics Engineers Inc.: New York, NY, USA, 2024. [Google Scholar]
  56. Jiang, Y.; Wang, Y.H.; Li, Y.; Chen, X. Eigenvalue-Based Ground Target Detection in High-Resolution Range Profiles. IET Radar Sonar Navig. 2020, 14, 1747–1756. [Google Scholar] [CrossRef]
Figure 1. Data collection equipment and experimental sample.
Remotesensing 17 02793 g001
Figure 2. Data preprocessing process.
Remotesensing 17 02793 g002
Figure 3. Date pretreatment. (a) Original data in Cartesian coordinate system. (b) Noise reduction by co-frequency interference. (c) Speckle noise suppression. (d) Grayscale adjustment. (e) Local contrast enhancement. (f) Expert interpretation (the suspected oil film regions are marked with a blue label, and the oil film regions are marked with cyan).
Remotesensing 17 02793 g003
Figure 4. OAT-NGN hybrid strategy structure.
Remotesensing 17 02793 g004
Figure 5. Preliminary oil film segmentation results. (a) Color quantization. (b) Grayscale display mode. (c) Auto threshold selection. (d) The preliminary segmentation.
Remotesensing 17 02793 g005aRemotesensing 17 02793 g005b
Figure 6. The final results. (a) The current oil spill image. (b) Another oil spill image.
Remotesensing 17 02793 g006
Figure 7. The comparison with the NGN model. (a) The NGN model. (b) The OAT-NGN algorithm.
Remotesensing 17 02793 g007
Figure 8. Performance comparison of NGN and OAT-NGN.
Remotesensing 17 02793 g008
Figure 9. Global adaptive threshold algorithm segmentation results. (a) Method 1. (b) Method 2.
Remotesensing 17 02793 g009
Figure 10. The segmentation results of the local adaptive algorithm. (a) Method 3. (b) Method 4.
Remotesensing 17 02793 g010
Figure 11. The segmentation results of machine learning algorithms. (a) Method 5. (b) Method 6.
Remotesensing 17 02793 g011
Table 1. Evaluation index.
IndicatorsPerformance
Accuracy94.50%
Precision99.80%
Recall94.61%
F1-score97.14%
IoU94.43%
Dice97.14%
Table 2. Comparison of evaluation indicators.
Accuracy (%)Precision (%)Recall (%)F1-Score (%)IoU (%)Dice (%)
Our Method94.5099.8094.6197.1494.4397.14
Method 188.5499.9188.4693.8488.3993.84
Method 258.4398.4158.8173.6258.2573.62
Method 352.8099.7552.2868.6052.2168.60
Method 477.7999.9177.5787.3477.5287.34
Method 575.8999.9275.5586.0875.5586.08
Method 679.6399.9379.3588.4979.3588.49
Disclaimer/Publisher’s Note: The statements, opinions and data contained in all publications are solely those of the individual author(s) and contributor(s) and not of MDPI and/or the editor(s). MDPI and/or the editor(s) disclaim responsibility for any injury to people or property resulting from any ideas, methods, instructions or products referred to in the content.