1. Introduction
Marine surveying serves as the foundation for marine economic development and environmental protection, with one of its fundamental tasks being the measurement of seafloor depths around islands, reefs, and their surrounding areas [
1,
2]. Traditional bathymetric methods primarily rely on shipborne sonar and airborne LiDAR systems [
3], which are often limited by operational costs, restricted coverage in shallow or reef-dense areas, and challenges in remote or open-ocean environments [
4,
5,
6].
At present, photon-counting LiDAR has been increasingly applied in shallow-water bathymetry due to its broad spatial coverage across remote and coastal regions and high measurement accuracy [
7,
8]. The Advanced Topographic Laser Altimeter System (ATLAS) instrument onboard the Ice, Cloud, and Land Elevation Satellite-2 (ICESat-2) is a photon-counting LiDAR system capable of emitting laser pulses at a high frequency of 10 kHz and capturing returning photons to generate high-density photon data [
9]. The ICESat-2 laser altimetry system emits laser beams with a wavelength of 532 nm, which are reflected by the water surface and received by the system to obtain water surface elevation. Due to the weak absorption of this wavelength by water, a portion of the laser penetrates the water surface, reflects off the seafloor, and returns, enabling the retrieval of seafloor elevation and the calculation of water depth. This provides a novel approach to shallow-water bathymetry.
Compared to traditional shallow-water bathymetry methods, the ICESat-2 satellite offers advantages in acquiring shallow-water depth data with periodicity, low cost, and high accuracy [
10]. Existing studies indicate that ICESat-2 demonstrates high accuracy and capability in bathymetric mapping [
11]. Gleason et al. [
12] compared ICESat-2-derived bathymetry with single-beam echo sounder measurements collected in the field, revealing a high correlation (R
2 = 0.96). Coveney et al. [
13] evaluated the vertical accuracy of ICESat-2 coastal ocean bathymetric data at four test sites in mid-latitude temperate regions, reporting an error of 0.54 m at a maximum photon depth of 11 m.
ICESat-2 utilizes photon-counting technology to detect returning photons. This technology is highly sensitive, capable of capturing extremely weak signals. However, its high sensitivity also makes it highly susceptible to various sources of background noise, including solar background light, cloud reflections, and atmospheric scattering [
14,
15]. This issue is particularly pronounced in daytime data, where sunlight at the 532 nm wavelength is reflected onto the ATLAS instrument, leading to significantly more noise photons in daytime data compared to nighttime data [
10]. To extract accurate terrain and bathymetric information from photon data, it is necessary to design and apply noise recognition algorithms capable of distinguishing and removing noise photons effectively.
Based on the distribution characteristics of signal photons and noise photons in ICESat-2 data, existing denoising algorithms mainly focus on using density thresholds to distinguish between signal photons and noise photons [
16,
17]. The core idea of density threshold clustering algorithms is to perform clustering by analyzing the local density classifications of sample data. Common density clustering algorithms include Density-Based Spatial Clustering of Applications with Noise (DBSCAN) and Ordering Points To Identify the Clustering Structure (OPTICS) [
16,
18,
19]. Determining the search radius and the number of neighboring points becomes crucial in density-based denoising algorithms. Regarding the search radius, researchers have developed denoising neighborhoods of different shapes—such as circular, elliptical, and rectangular—and determined their sizes based on terrain characteristics [
10,
18]. As for the number of neighboring points, the main method currently is to manually specify this number based on experience.
For seafloor photons, laser pulses penetrate the water surface to reach the seafloor but are affected by water column scattering and reflection during transmission. This causes the spatial characteristics and density distribution of photons to differ significantly from other surface types [
7]. To address the attenuation of seafloor photon data with depth, some researchers have designed algorithms that segment along the elevation direction and adaptively determine the photon count threshold for each segment [
20]. Chen, Le, Zhang, Wang, Qiu, and Wang [
9] improved the standard DBSCAN algorithm and proposed the Adaptive Variable Ellipse-Based Method (AVEBM). AVEBM uses an elliptical filter to replace the circular filter in the standard DBSCAN algorithm and employs elliptical windows of varying sizes and orientations to search for signal photons within the neighborhood, achieving better filtering results. Wang et al. [
21] further improved the OPTICS algorithm by combining adaptive variable ellipses and B-spline curve iterative filtering to detect seafloor signal photons, resulting in higher F1 scores compared to the AVEBM.
The above methods are mainly based on clustering algorithms and belong to unsupervised learning. Since the categories of classification are unknown in advance, clusters are formed by directly measuring the similarities between data points. With the development of machine learning technology, some researchers have adopted machine learning techniques to automatically distinguish between seafloor signal photons and noise [
22]. Currently, common machine learning algorithms such as decision trees, K-Nearest Neighbors algorithms, and neural networks have been applied in seafloor topography photon recognition [
11]. Lin and Jensen Knudby [
23] proposed a method using the deep learning model PointNet++ to automatically extract seafloor bathymetric photons from ICESat-2 satellite data, involving steps like data preprocessing and labeling, model training, and model validation and testing. Machine learning methods require predefined classification attributes and labels; through learning, a classification model is obtained to categorize new data into our predefined classes [
24]. As a data-driven approach, the performance of machine learning heavily depends on the quality and quantity of data. The accuracy, coverage, and quantity of labeled sample data directly affect the model’s classification effectiveness [
25]. Manually creating a large number of labeled training sets is not only expensive and time-consuming but also challenging to obtain sufficiently accurate labels for many tasks. Additionally, this process places higher demands on computer hardware [
26]. In view of this, this paper continues to focus on designing parameter-based algorithms to identify signal photons.
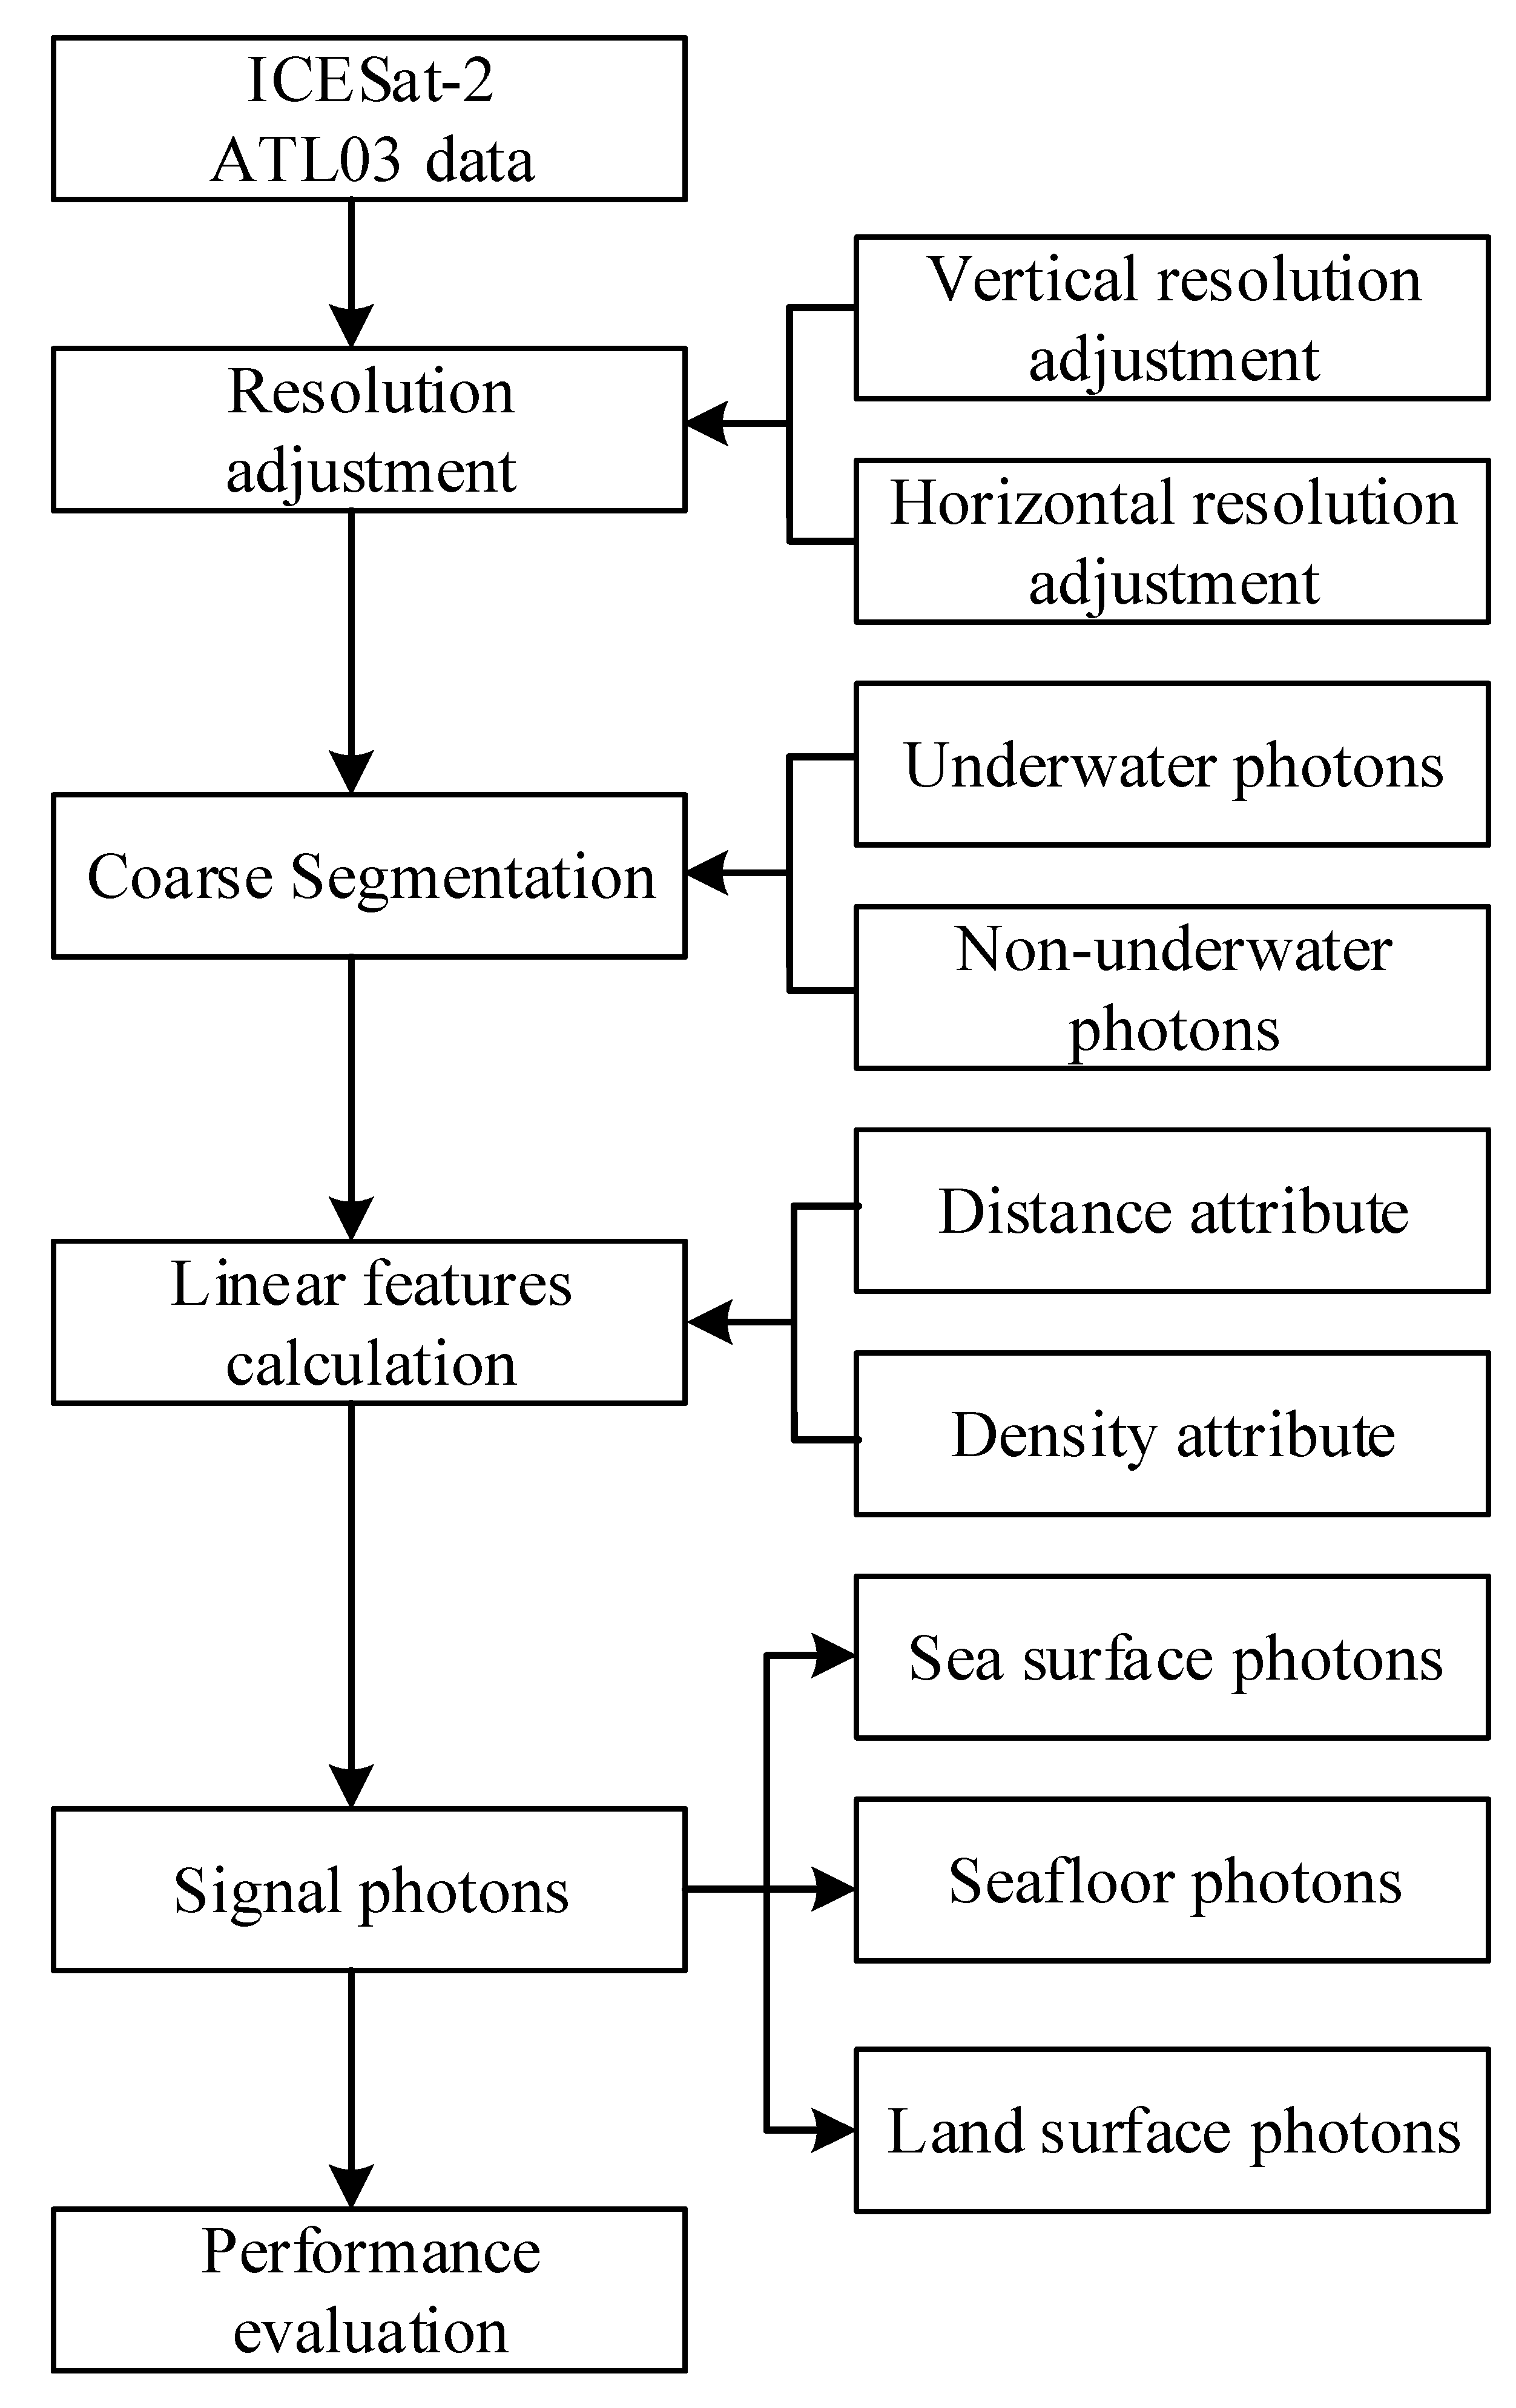
This study presents a Linear Feature-Based Signal Photon Extraction (LFSPE) method to improve the accuracy and robustness of signal photon identification for bathymetric retrieval. The LFSPE algorithm exploits the spatial distribution characteristics of photon data through a structured three-stage approach: preprocessing, coarse segmentation, and fine extraction.
In shallow-water ICESat-2 ATL03 data, bottom-return signal photons typically exhibit spatial continuity and align along approximately linear or gently curved paths that follow the laser track. This spatial structure arises from the physical properties of the seafloor and the temporal–spatial coherence of photon returns from smooth underwater surfaces. In contrast, noise photons from atmospheric scattering or background illumination appear more randomly distributed and lack such spatial regularity. Leveraging this intrinsic difference, the LFSPE method employs local linear feature analysis to effectively distinguish signal photons from noise photons.
In the preprocessing stage, the vertical and horizontal resolutions of raw ICESat-2 data are adjusted to enhance the spatial organization of signal photons and ensure uniform data quality. In the coarse segmentation stage, a segmented Gaussian fitting-based coarse segmentation is performed to distinguish underwater photons from non-underwater ones, effectively separating sea surface returns from seafloor signals. Compared with traditional density-based clustering methods such as DBSCAN, LFSPE introduces a dynamic extraction strategy based on local linear feature analysis, incorporating point density and goodness-of-fit metrics. This approach addresses the limitations of fixed-parameter clustering by enhancing adaptability to varying photon densities and complex terrain conditions. In the final fine extraction stage, LFSPE identifies signal photons that exhibit continuity and alignment along locally linear structures, using a variable neighborhood search radius that expands with depth to compensate for signal sparsity. This enables accurate and robust seafloor photon identification for shallow-water bathymetry.
3. Results
3.1. Parameter Selection
In the proposed method, parameters are categorized into insensitive and sensitive types. Insensitive parameters are those whose settings remain consistent across different experimental datasets. Sensitive parameters, however, require appropriate adjustments based on the dataset. For non-underwater data, all parameters can be set to the default values provided in
Section 3.3. For underwater photons, particularly in the process of identifying seafloor topography, certain parameters need to be adjusted according to the dataset.
During the resolution adjustment phase, the along-track distance (
) is classified as a sensitive parameter. In the signal photon identification phase, the density threshold (
) and distance threshold (
) are also sensitive parameters.
Table 2 details the settings of these sensitive parameters for the proposed algorithm. For nighttime data,
is set to 0.7 m. However, for daytime data, where signal photons are often obscured by noise photons, the
requires adjustment to enhance the continuity of signal photons.
The is typically set within the range of 20 to 37. This parameter correlates with changes in : smaller values result in higher calculated density values, necessitating corresponding adjustments to . In most cases, is set between 0 and 3 m to effectively identify signal photons. For dataset 8, however, is set to 7 m to capture a few signal photons at greater depths.
We employed MATLAB 2022a’s built-in RANSAC function for robust linear fitting when computing local linear features. A minimal sample size of 2 was used, which is appropriate for 2D line fitting. The maximum number of iterations and the confidence level were both set to their default values—1000 trials and 99% confidence, respectively.
3.2. Underwater and Non-Underwater Photon Segmentation Results
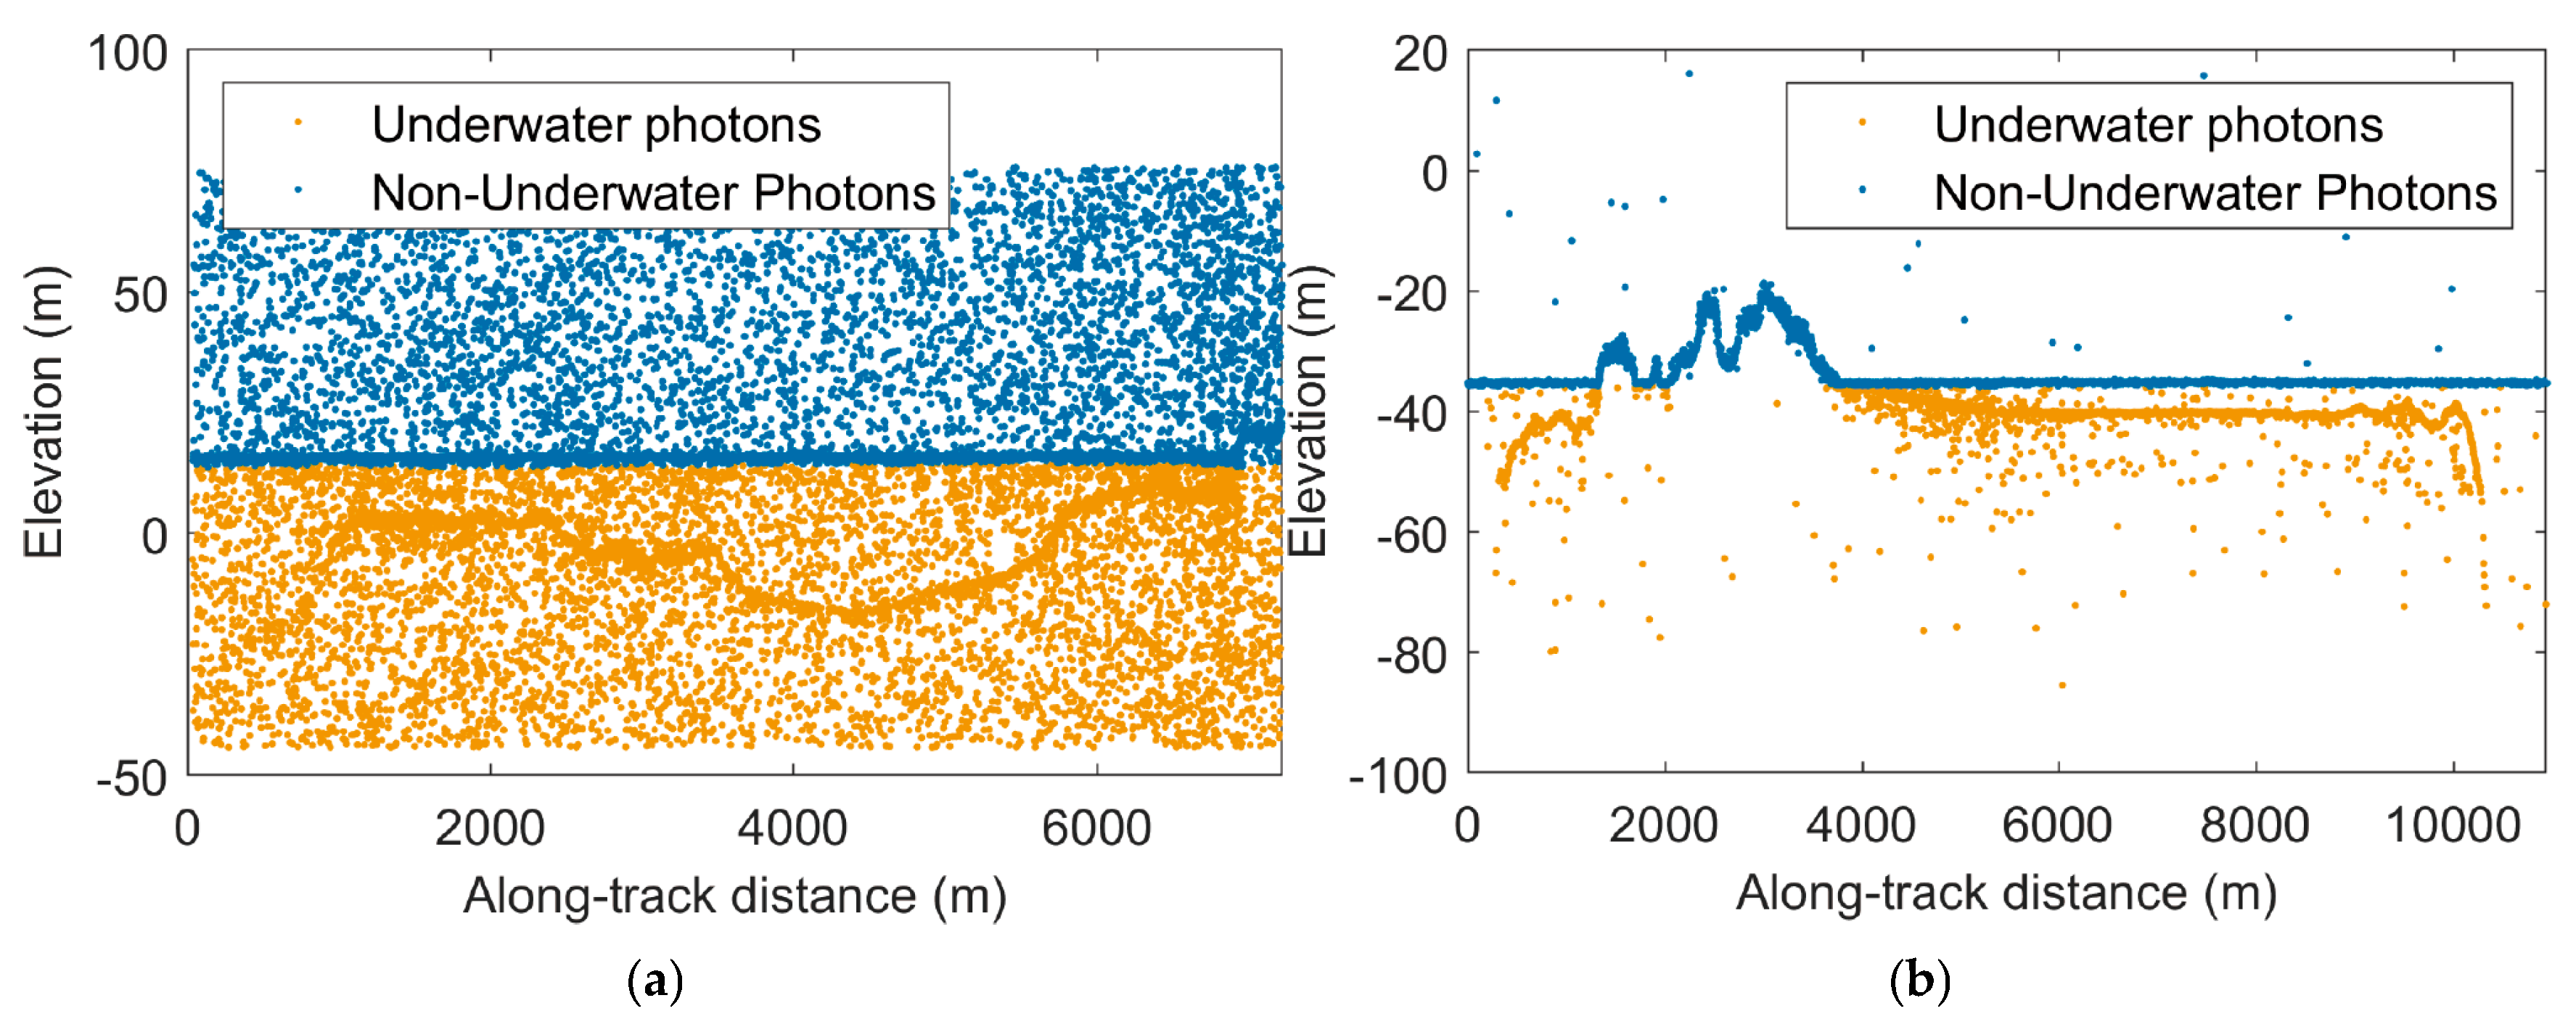
Figure 6 illustrates the results of the coarse segmentation algorithm described in
Section 2.3.2 applied to ICESat-2 photon data, distinguishing underwater photons (orange points) from non-underwater photons (blue points). Panels (a) to (h) correspond to datasets 1 through 8 in
Table 1. The results demonstrate that the coarse segmentation algorithm effectively performs signal photon extraction tasks under various regional and environmental conditions, exhibiting robustness and accuracy.
In
Figure 6a,c,d,f, which depict daytime photon data, the number of noise photons is significantly higher compared to the nighttime datasets shown in
Figure 6b,e,g,h. Among the daytime datasets, underwater photons are often connected to terrestrial photons, particularly in coastal regions. The photon data exhibit distinct stratification, indicating that the coarse segmentation algorithm effectively distinguishes between surface and underwater photons in land–sea transitional zones.
Figure 6e covers the longest track length (approximately 16,000 m), encompassing areas with varying seafloor slopes and water depths. Even in regions where the vertical distance between the sea surface and the seafloor photons is minimal, the coarse segmentation algorithm maintains its effectiveness in distinguishing underwater and non-underwater photons.
Figure 6f,g demonstrate areas with shallow-water depths and long-range flat seafloor terrains, while
Figure 6h illustrates seafloor regions with significant elevation variation. The algorithm produces clear and well-defined segmentation boundaries in these regions, further demonstrating its reliability.
3.3. Extraction Results of Signal Photons
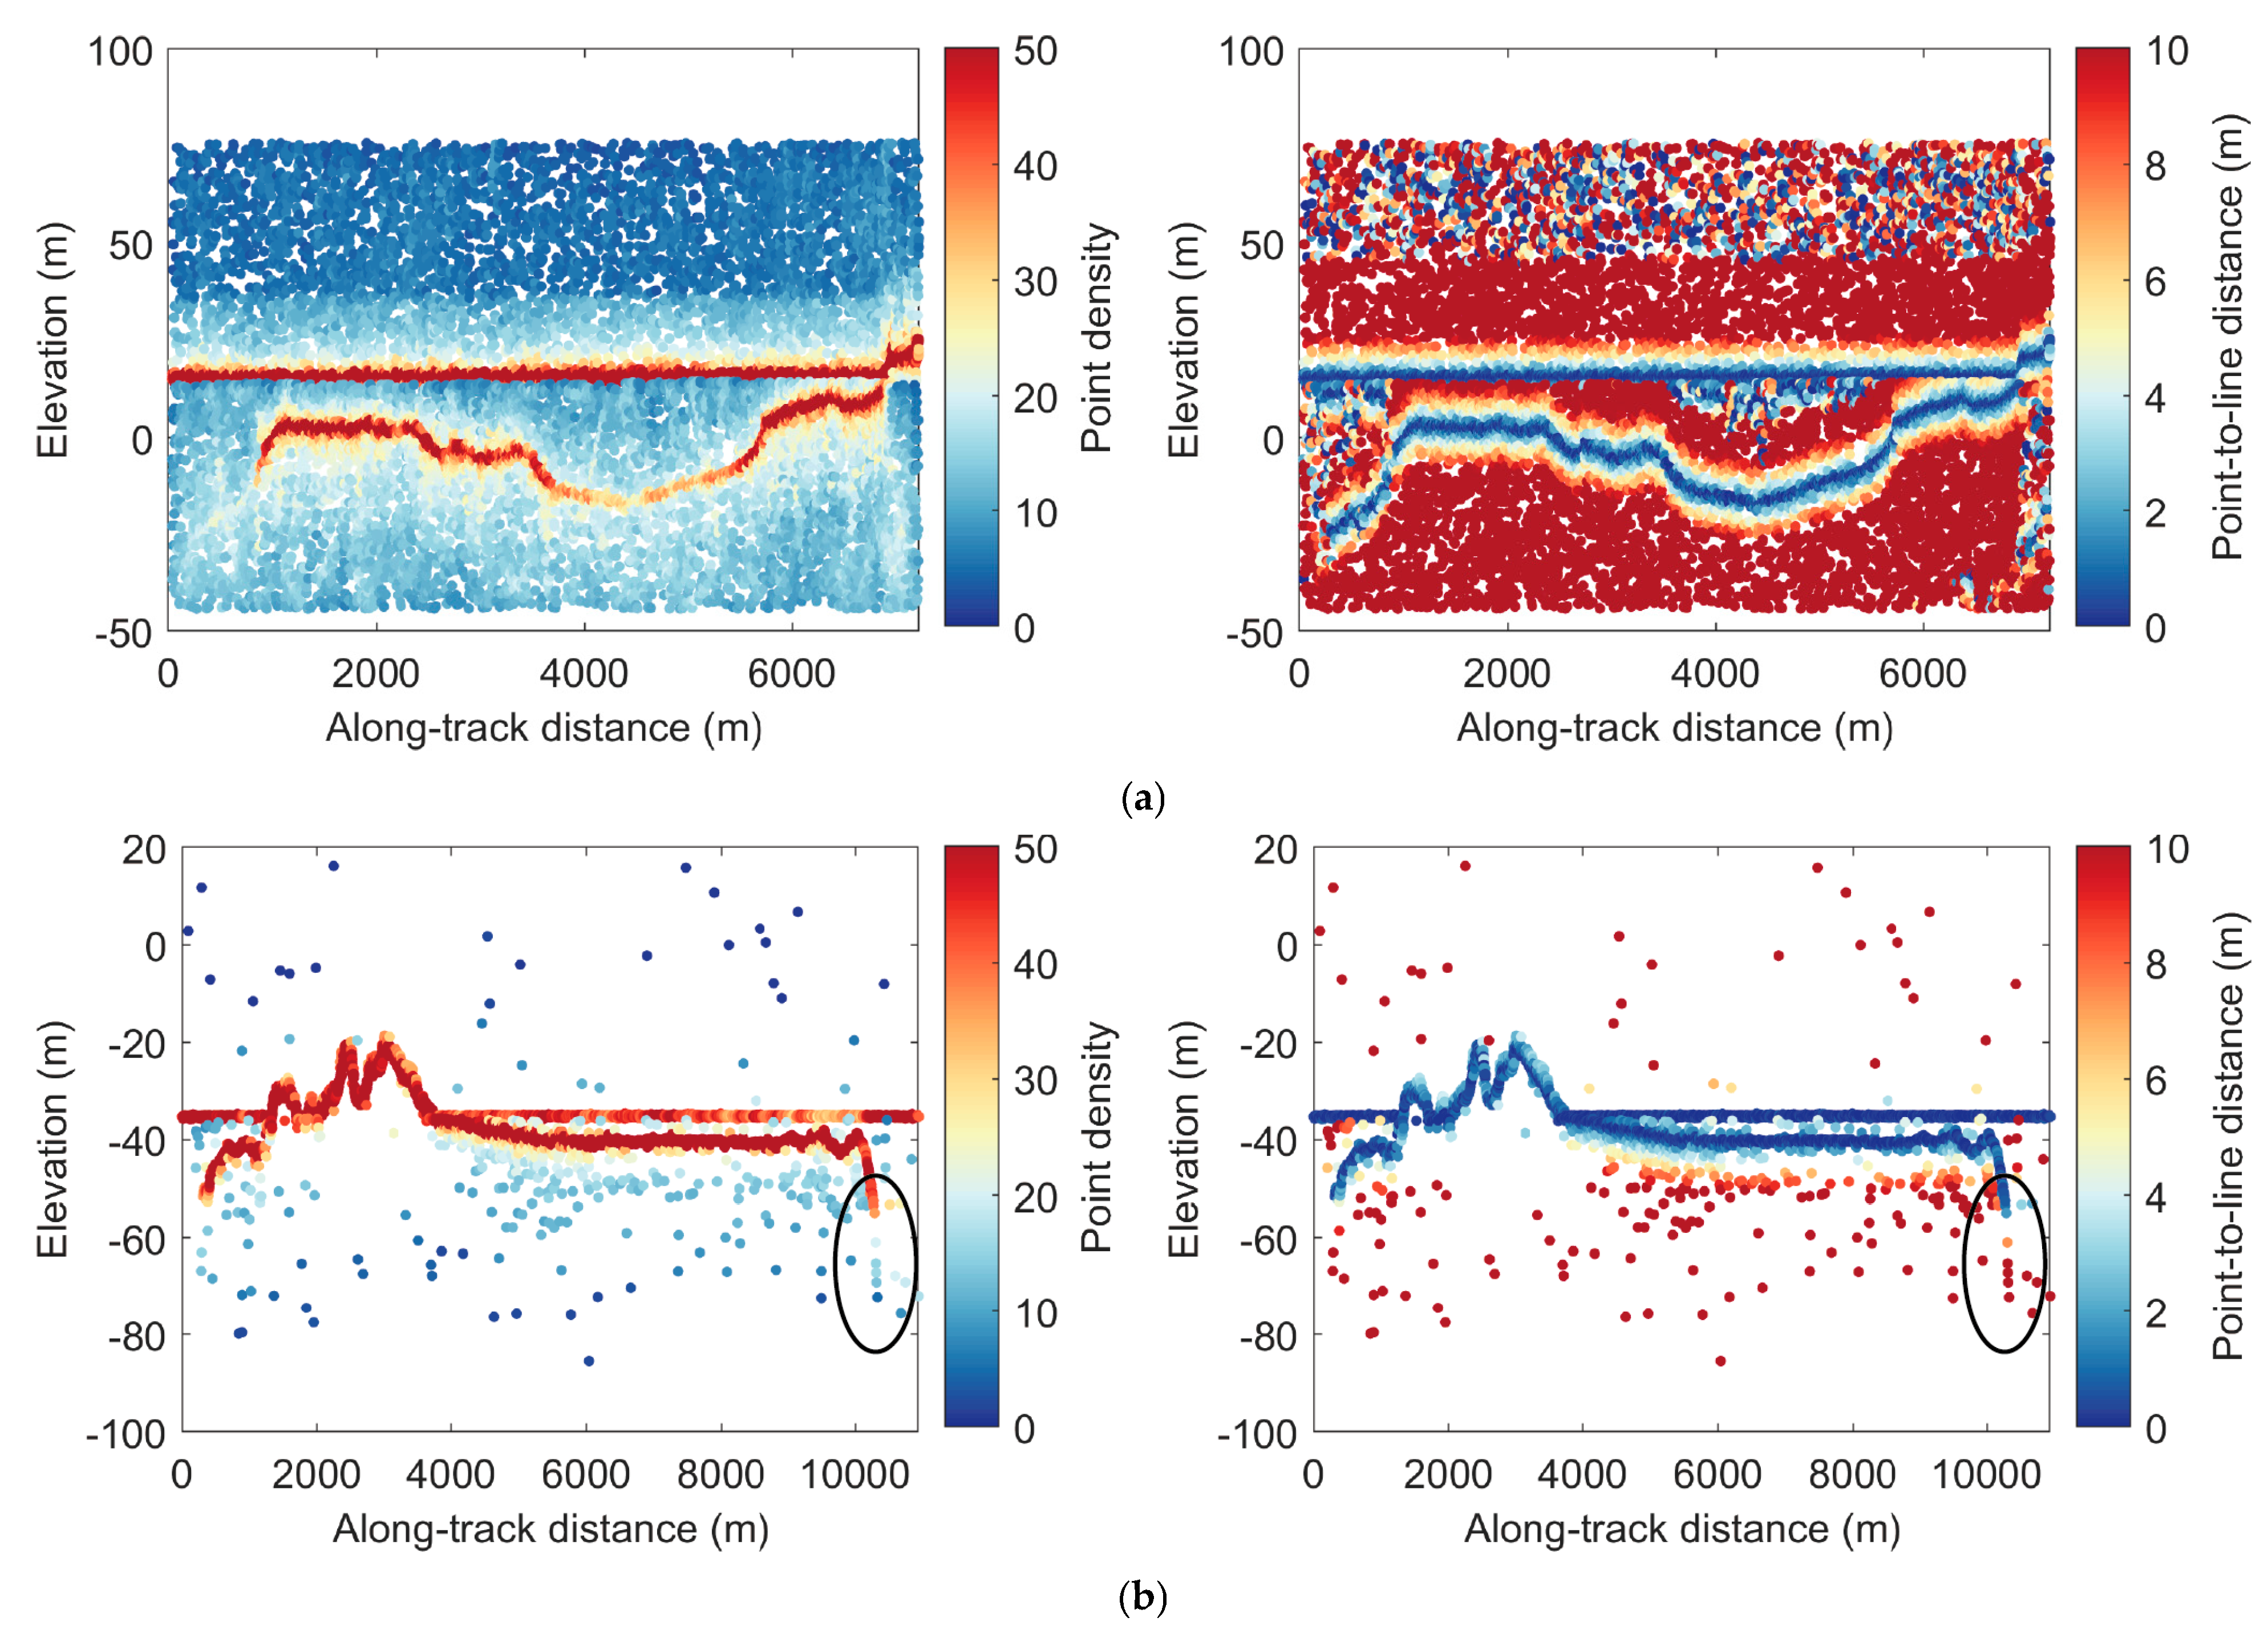
Figure 7a–h illustrate the linear features of photon data from experimental areas 1 to 8, with the left column showing density maps and the right column showing distance maps. These figures clearly demonstrate the significant differences in linear features between signal photons (e.g., sea surface, seafloor, and land photons) and noise photons. Signal photons exhibit significantly higher density values and lower distance values compared to noise photons.
The density maps (left column) depict the distribution patterns of photon density along the track direction. Surface photons maintain consistently high-density levels, reflecting their regular and continuous distribution along the track. In contrast, the density of land photons is influenced by terrain slope and vegetation cover, as shown in
Figure 7b–d,g. For seafloor photons, even with dynamically adjusted neighborhood search radii to account for increasing depth, their density decreases markedly with increasing water depth. In deeper water regions, signal photons become sparse and eventually disappear, as observed in the terminal regions of
Figure 7b,h.
The distance maps (right column) reveal the distribution of distances between photons and the line
for their neighborhood point sets, reflecting the spatial linearity of signal photons. Overall, surface photons, characterized by their regularity and continuity, exhibit smaller distances to the fit line
, typically ranging between 0 and 1. This indicates strong linearity and consistency in surface photons. Seafloor photons, however, are affected by factors such as water depth, terrain variability, and density attenuation, resulting in larger distances, generally within the range of 0 to 3. In shallow-water regions, seafloor photons exhibit higher density and smaller distances, while in deeper regions, the distance distribution becomes more variable, as highlighted by the ellipses in
Figure 7b,h.
Figure 8 compares the extraction performance of the proposed method (left column) with the DBSCAN algorithm (right column) across the eight experimental areas. In the figures, black points denote noise photons, orange points represent identified seafloor photons, blue points indicate sea surface photons, and green points correspond to land photons. The results demonstrate that the proposed method effectively identifies seafloor photons in sparse photon regions, even in deeper-water regions, as highlighted in the magnified region of
Figure 8a. In shallow-water regions, the boundaries between seafloor and surface photons are clearer, as shown in the magnified region of
Figure 8b. Additionally, the proposed method exhibits robust performance in sparse or complex photon regions, capturing more underwater photons, as demonstrated in the magnified region of
Figure 8e.
In contrast, the DBSCAN algorithm shows significant shortcomings. As water depth increases, DBSCAN often fails to detect many seafloor photons. For surface photons, DBSCAN frequently misclassifies noise photons near the surface as signal photons, as illustrated in
Figure 8a.
3.4. Evaluation of Signal Photon Extraction Accuracy
To quantitatively evaluate the performance of the proposed method, a manually annotated reference dataset was created. Manual labeling was performed using PhotonLabeling, a custom-developed interactive software designed for ICESat-2 photon data annotation. Signal photons were identified through visual inspection based on their spatial continuity, depth progression, and local density. Annotation consistency was ensured through cross-validation and consensus. The PhotonLabeling tool used for this process is publicly available for download at:
https://github.com/zwshi-pku/PhotonLabeling (accessed on 5 August 2025).
A statistical analysis of the seafloor photon extraction results across eight datasets was conducted. The results demonstrate that the proposed algorithm consistently achieved high accuracy across diverse scenarios. The average precision, recall, F1 score, and overall accuracy were 0.977, 0.958, 0.967, and 0.972, respectively. Notably, precision exceeded 0.96 for all datasets, reflecting the method’s strong ability to suppress noise photons. Recall values surpassed 0.90 in most datasets, particularly in high-density photon environments such as datasets 2 and 8, where recall reached 0.985 and 0.997, respectively. The highest F1 scores were also observed in these datasets, peaking at 0.986 (dataset 2) and 0.985 (dataset 8). Overall accuracies exceeded 0.97 in five of the eight datasets, with a maximum of 0.990. These results are summarized in
Table 3, confirming the robustness and generalization capability of the proposed algorithm under varying photon densities and seafloor complexity.
Compared to the DBSCAN algorithm, which achieved a precision of 0.751, a recall of 0.817, a F1 score of 0.778, and an overall accuracy of 0.796, the proposed method demonstrated substantial improvements across all evaluation metrics. Specifically, precision increased by 30.0%, recall by 17.3%, F1 score by 24.3%, and overall accuracy by 22.2%.
3.5. Performance Evaluation Across Different Water Depth Intervals
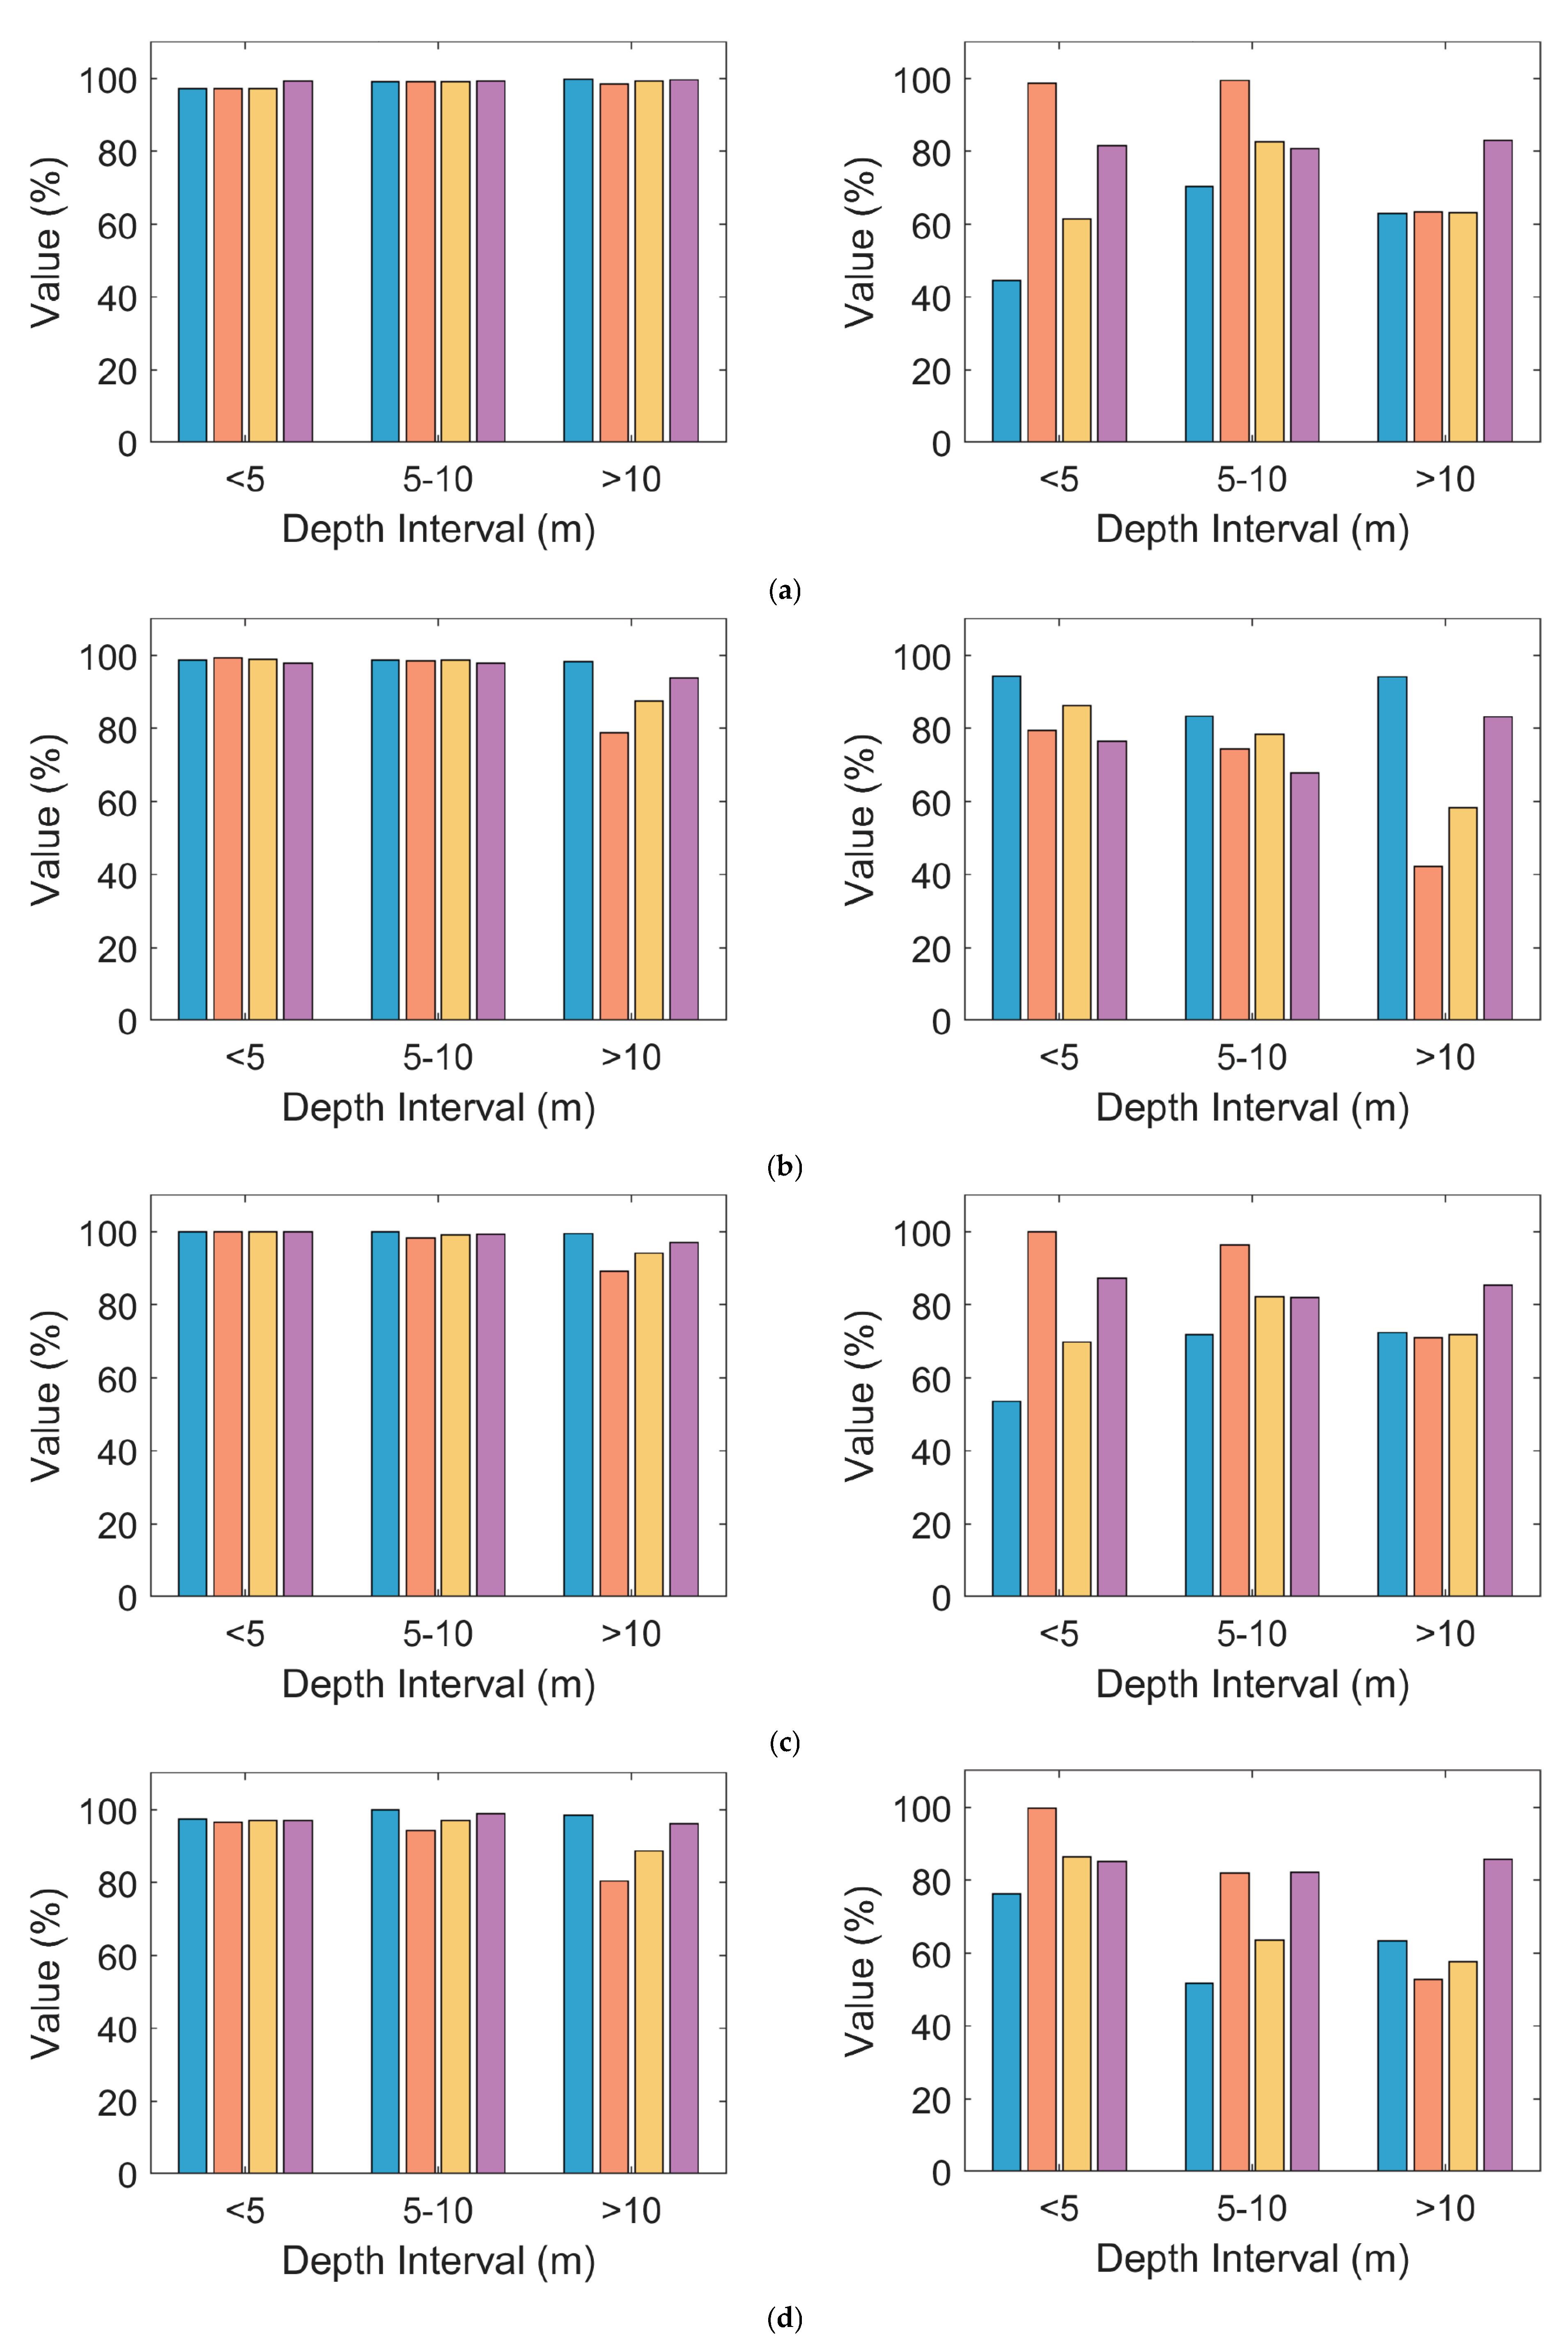
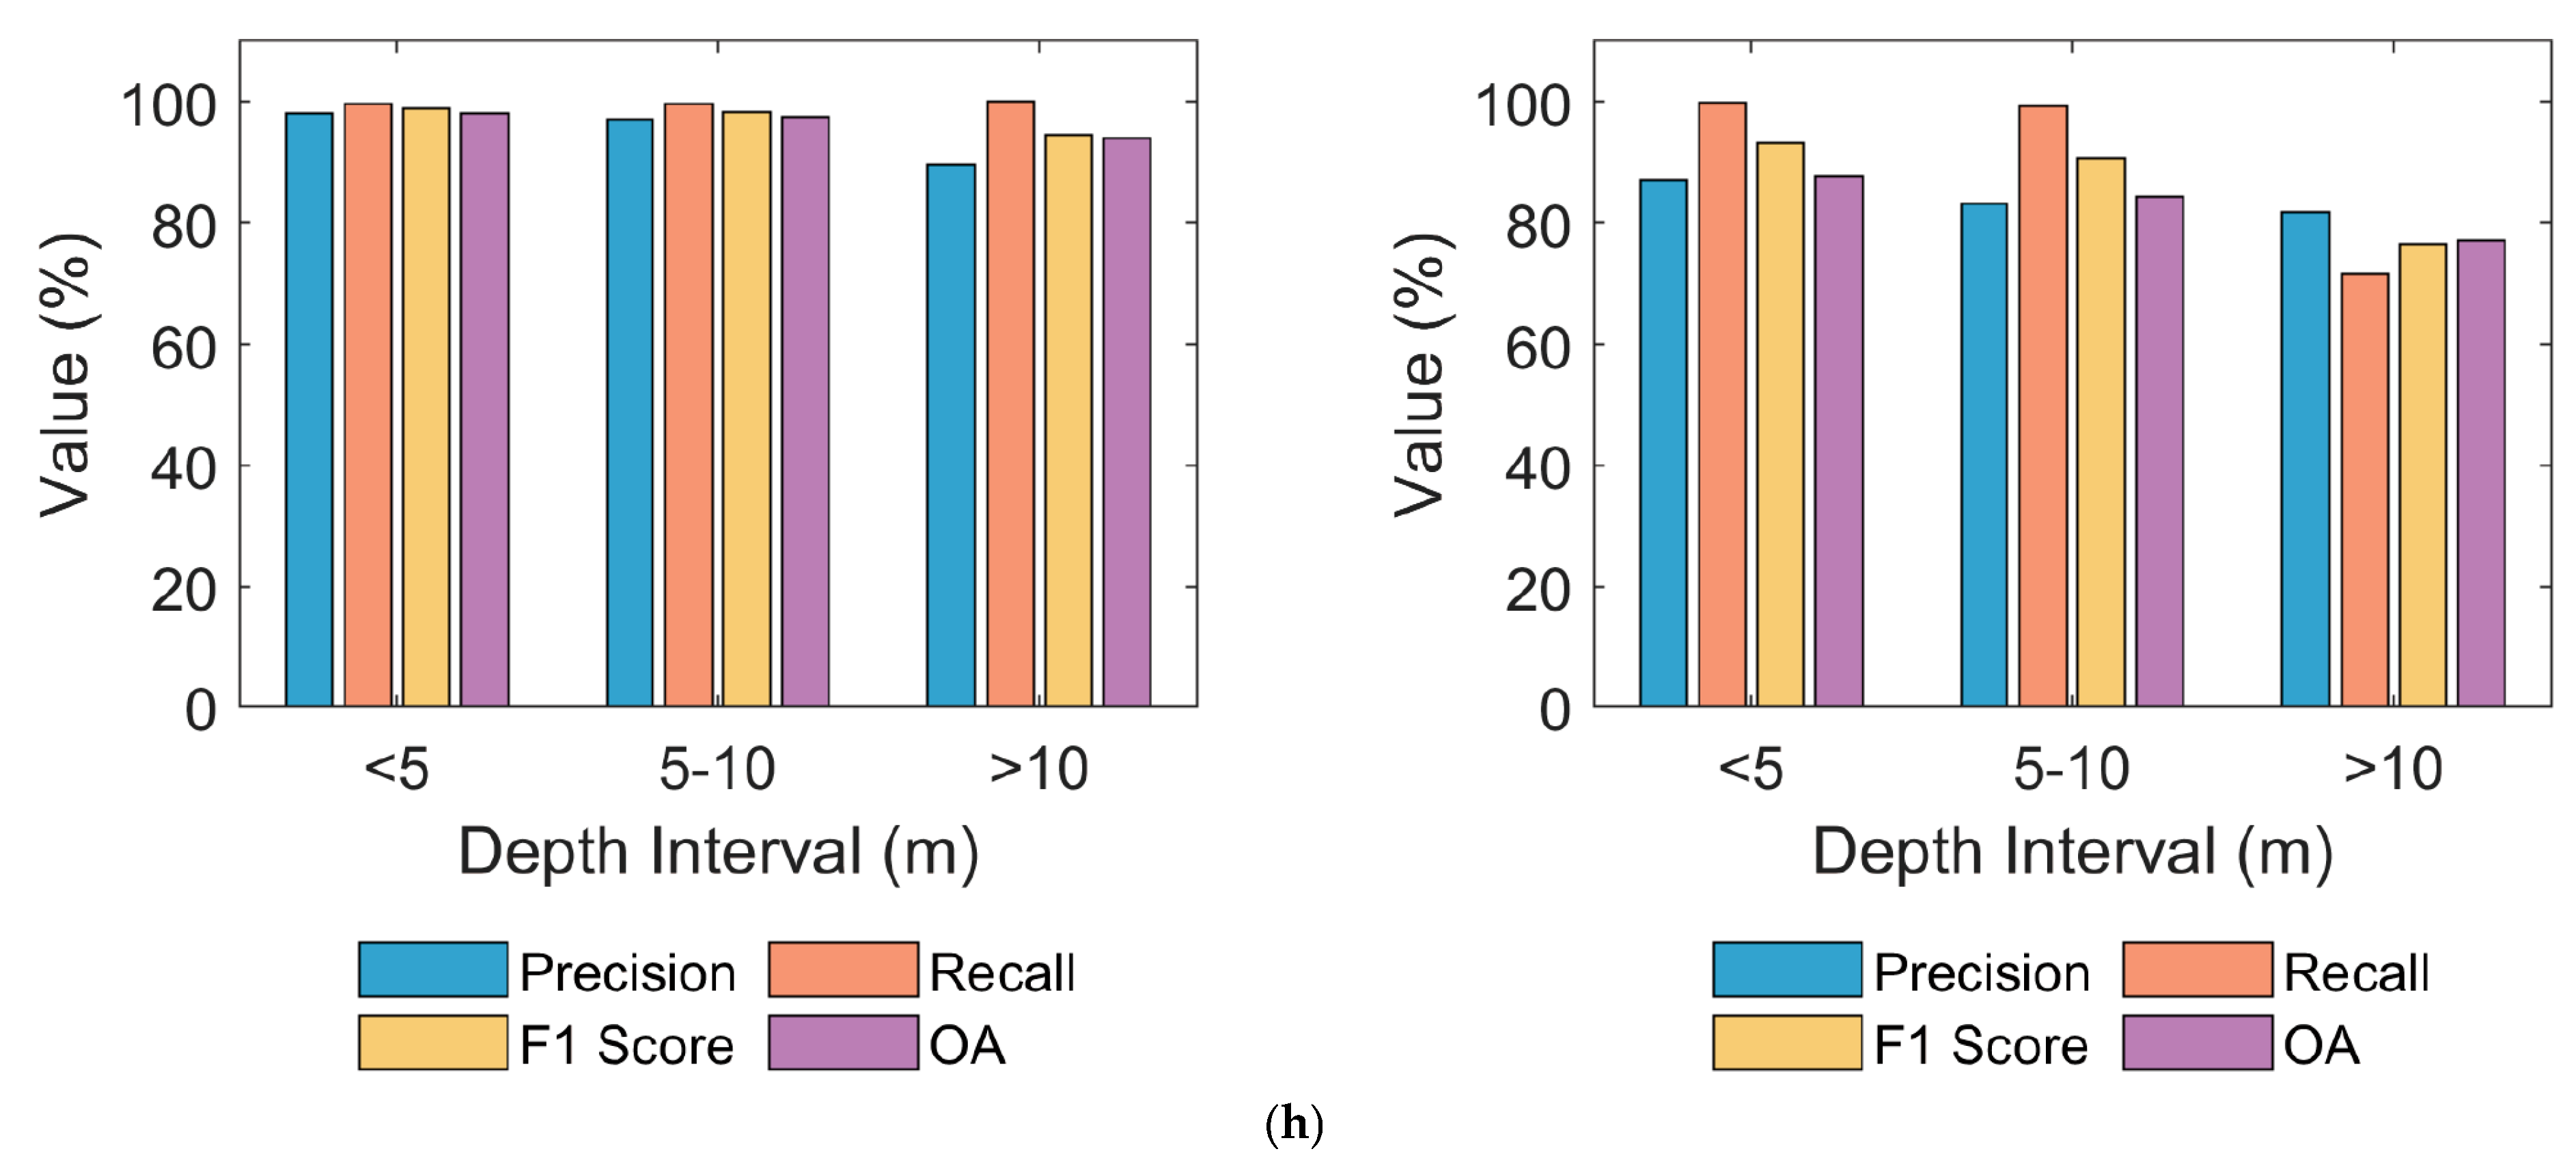
To evaluate the robustness and adaptability of the proposed LFSPE algorithm under varying water depths, the experimental data were divided into three depth intervals: 0–5 m, 5–10 m, and greater than 10 m. Four standard metrics—precision, recall, F1 score, and overall accuracy—were calculated for each of the eight experimental regions.
Figure 9 illustrates the performance of the proposed method (left panel) and the comparison algorithm DBSCAN (right panel) across the eight experimental regions (a–h). It can be observed that the proposed method consistently achieves high scores across all depth intervals, with only minor performance degradation as depth increases. This demonstrates the algorithm’s strong adaptability in scenarios with sparse signal photons and high noise levels.
In contrast, DBSCAN exhibits significant variations in performance across different depths, mainly due to its tendency to misclassify a large number of noise photons as signal photons while missing many actual signal photons. The performance drop in the >10 m interval is particularly notable, indicating its limited ability to handle photon density variations across depth. These results confirm the robustness of the proposed method in complex seafloor topographies and deeper-water regions.
To further contextualize our results, we note that Huang, Dong, Liu, Chen, Li, Wang and Meng [
28] proposed a photon denoising method that accounts for heterogeneous density and weak connectivity. According to their published results (see Figure 14 in [
28]), signal extraction performance declines more substantially in deeper waters (depth > 10 m). In contrast, the proposed LFSPE method maintains relatively stable and high accuracy across all depth intervals, including those exceeding 10 m. This comparison suggests that our approach may offer enhanced robustness and reliability in photon-limited or high-noise underwater environments.
3.6. Bathymetric Accuracy Evaluation
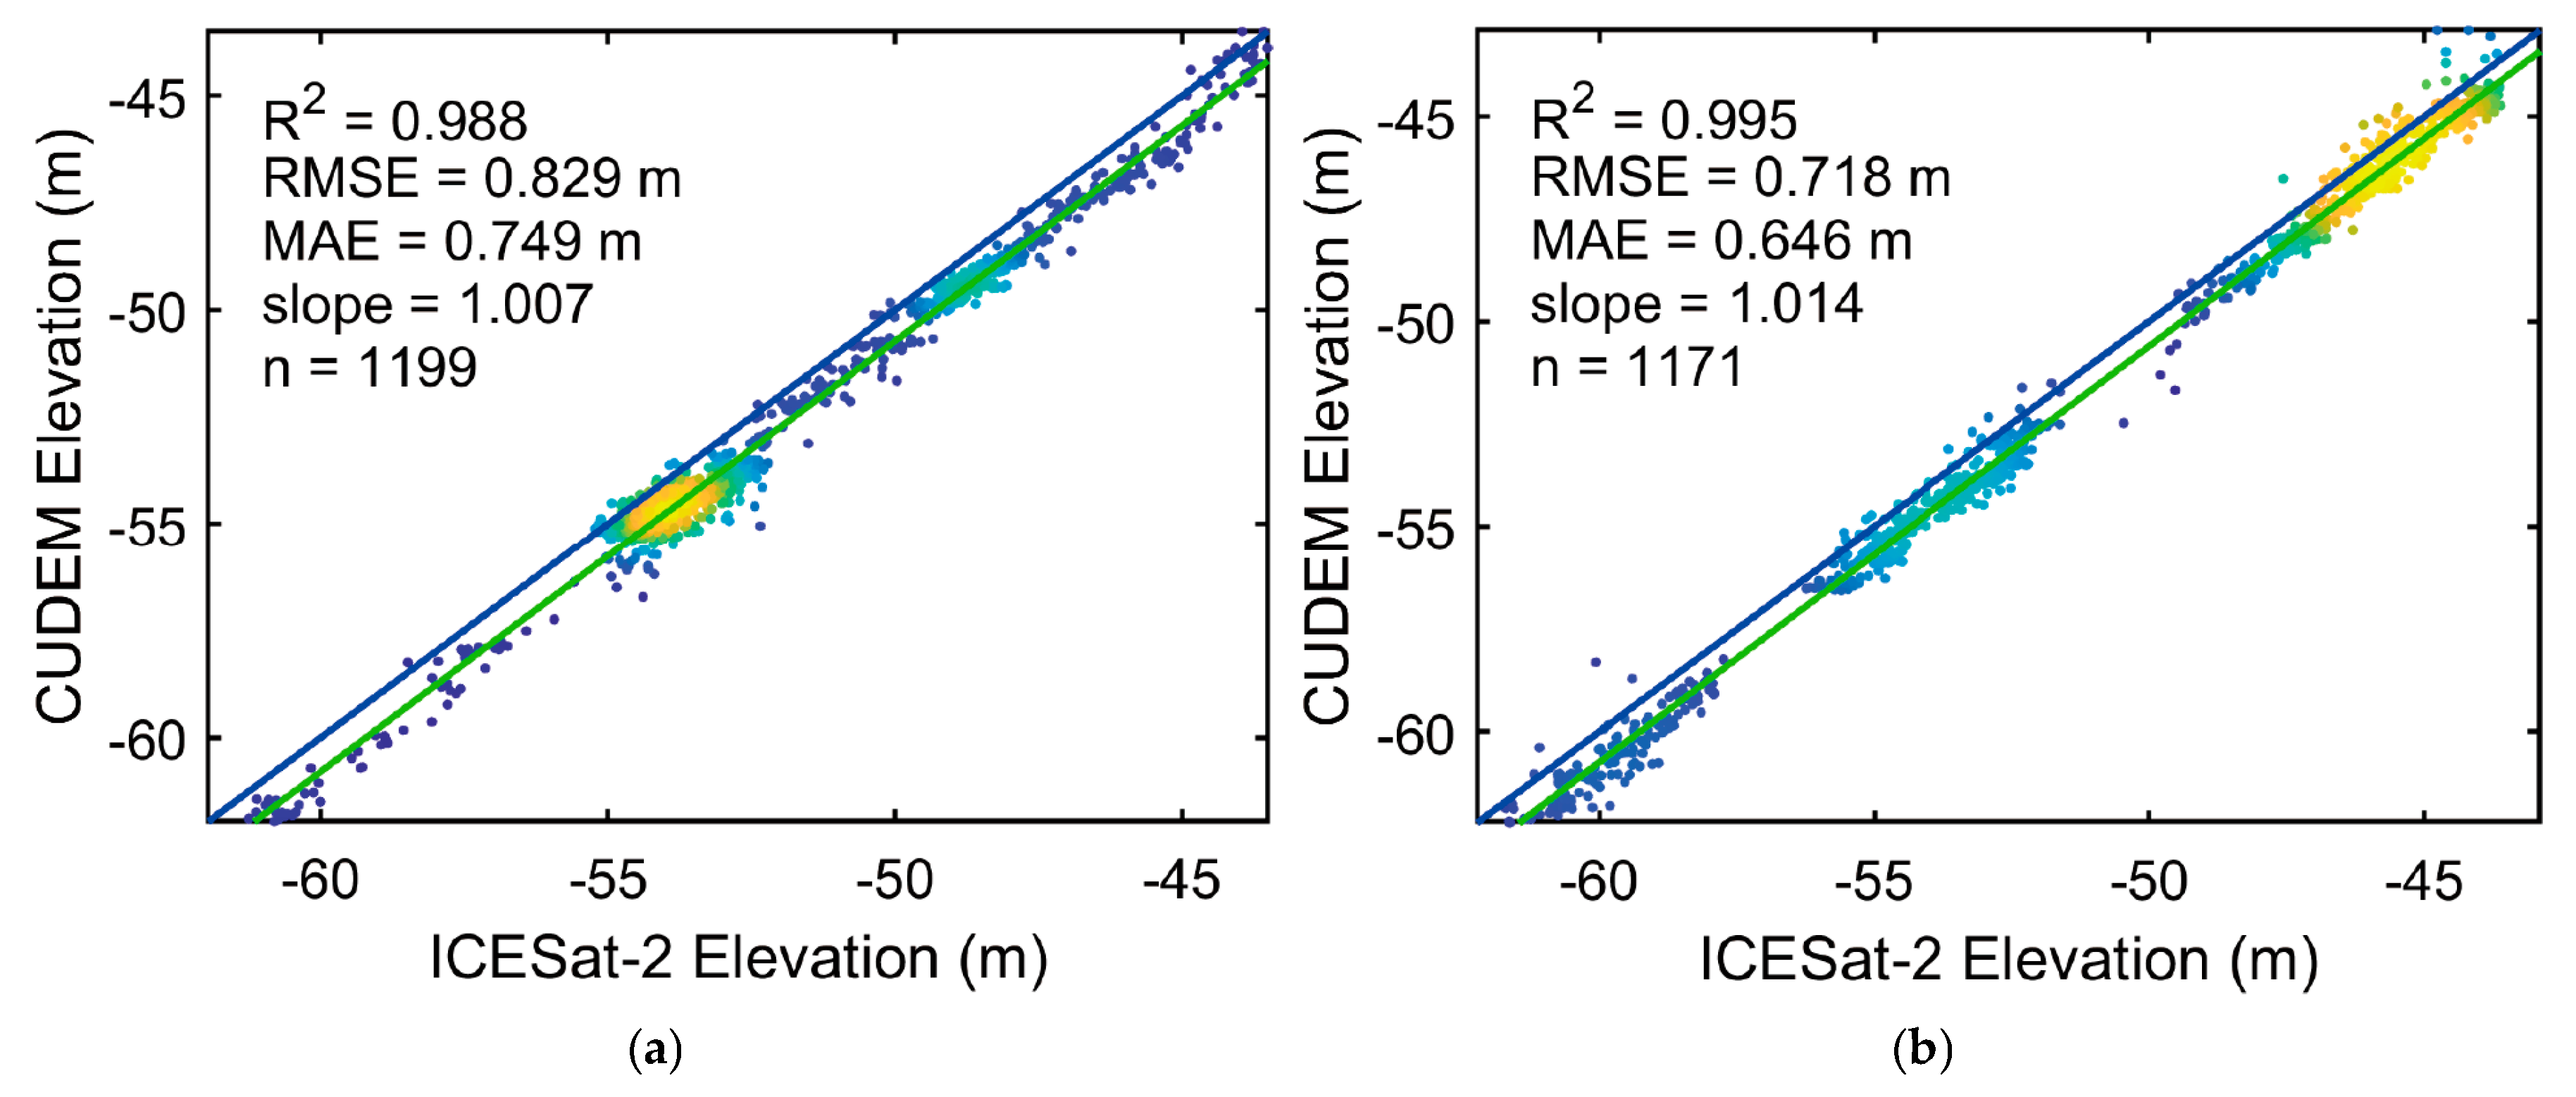
To further validate the accuracy of the proposed seafloor signal photon extraction method, the extracted results were compared with a high-resolution reference dataset—CUDEM. Since only experimental regions 3 and 4 in the dataset are accompanied by CUDEM elevation data, this section focuses on evaluating the bathymetric accuracy for these two regions, as shown in
Figure 10a,b.
The comparison with CUDEM data demonstrates a strong consistency between the bathymetric results extracted from ICESat-2 data and the CUDEM elevation model. The correlation coefficients R2 for experimental regions 3 and 4 reached 0.988 and 0.995, respectively, indicating a high degree of linear correlation. This suggests that the proposed method accurately captures depth variation trends, even in complex topographic environments. Specifically, the root mean square error (RMSE) was 0.829 m and 0.718 m for experimental regions 3 and 4, respectively, while the mean absolute error (MAE) was 0.749 m and 0.646 m. The slopes of the regression lines were 1.007 and 1.014 for experimental areas 3 and 4, respectively, further demonstrating the precision and consistency of the method in complex terrain.
The comparative evaluation with CUDEM data substantiates the effectiveness of the proposed method for seafloor photon extraction and bathymetric measurement. High R2 values, along with low RMSE and MAE values, indicate that the method reliably provides accurate seafloor photon extraction results.
4. Discussion
4.1. Sensitivity Analysis of Algorithm Parameters
The parameters in the proposed algorithm are categorized into two types: non-sensitive parameters and sensitive parameters. Non-sensitive parameters are those that remain consistent across all eight experimental datasets, while sensitive parameters require adjustment according to the specific characteristics of the data to achieve optimal signal photon extraction.
In the vertical resolution adjustment phase, a smaller value can lead to over-clustering, retaining redundant photons, whereas a larger may result in the loss of signal photons. This issue is particularly pronounced in shallow-water regions, where excessive values may cause the omission of sea surface and seafloor signal photons. Therefore, must be set to a value smaller than the shallow-water depth. In this study, is consistently set to 0.5 m, making it a non-sensitive parameter across all datasets.
In the horizontal resolution adjustment phase, the along-track interval significantly influences datasets with varying photon density distributions. Adjusting ensures that the algorithm’s linear feature thresholds remain adaptable. Larger intervals may reduce the continuity of signal photons, while smaller intervals (<0.5 m) increase sensitivity to noise photons. For datasets with significant noise (e.g., daytime data), a smaller can mitigate signal photon suppression by noise. Conversely, nighttime datasets perform well with default settings. For sparse seafloor photons, reducing helps maintain signal continuity.
During the coarse segmentation phase, the algorithm employs a segmented single-Gaussian fitting approach to classify photons. This segmentation avoids failure in regions with long along-track distances, large datasets, or significant terrain undulations. After segmentation, seafloor slopes with gradually increasing depth (
Figure 4a) allow Gaussian fitting to determine segmentation thresholds, distinguishing surface from seafloor photons. In nearly parallel seafloor and surface scenarios, the histogram reflects two peaks, where the surface photon peak is higher and at a greater elevation. Gaussian fitting can leverage this feature for segmentation (
Figure 4b). When the seafloor peak surpasses the surface peak (
Figure 4c), overall Gaussian fitting constrains the segmentation results for accurate segmentation. Without segmentation, coarse segmentation may fail in shallow-water and coastal transition zones, such as in experimental areas 5, 6, and 8. The global Gaussian model serves as a reference baseline for the approximate sea surface elevation across the entire track. Local Gaussian models are fitted to segmented photon subsets for finer-scale surface detection. The consistency between local and global estimates is evaluated, and significant deviations are flagged to reduce false sea surface identification due to local anomalies. This integration strategy enhances segmentation robustness without requiring numerical fusion of the two models. By combining global and local Gaussian models, the proposed method provides a robust approach to segmenting underwater and non-underwater photons, adapting to variations in water surface elevation along the track.
In the signal photon extraction phase, the density threshold () represents the minimum density required for a photon to be classified as a signal photon. Setting too low results in misclassification of noise photons as signal photons, reducing precision. Conversely, setting too high leads to the omission of sparse signal photons, particularly in low-density datasets. Based on experimental results, an optimal range of 20 ≤ ≤ 37 strikes a balance between minimizing misclassification and retaining true signals.
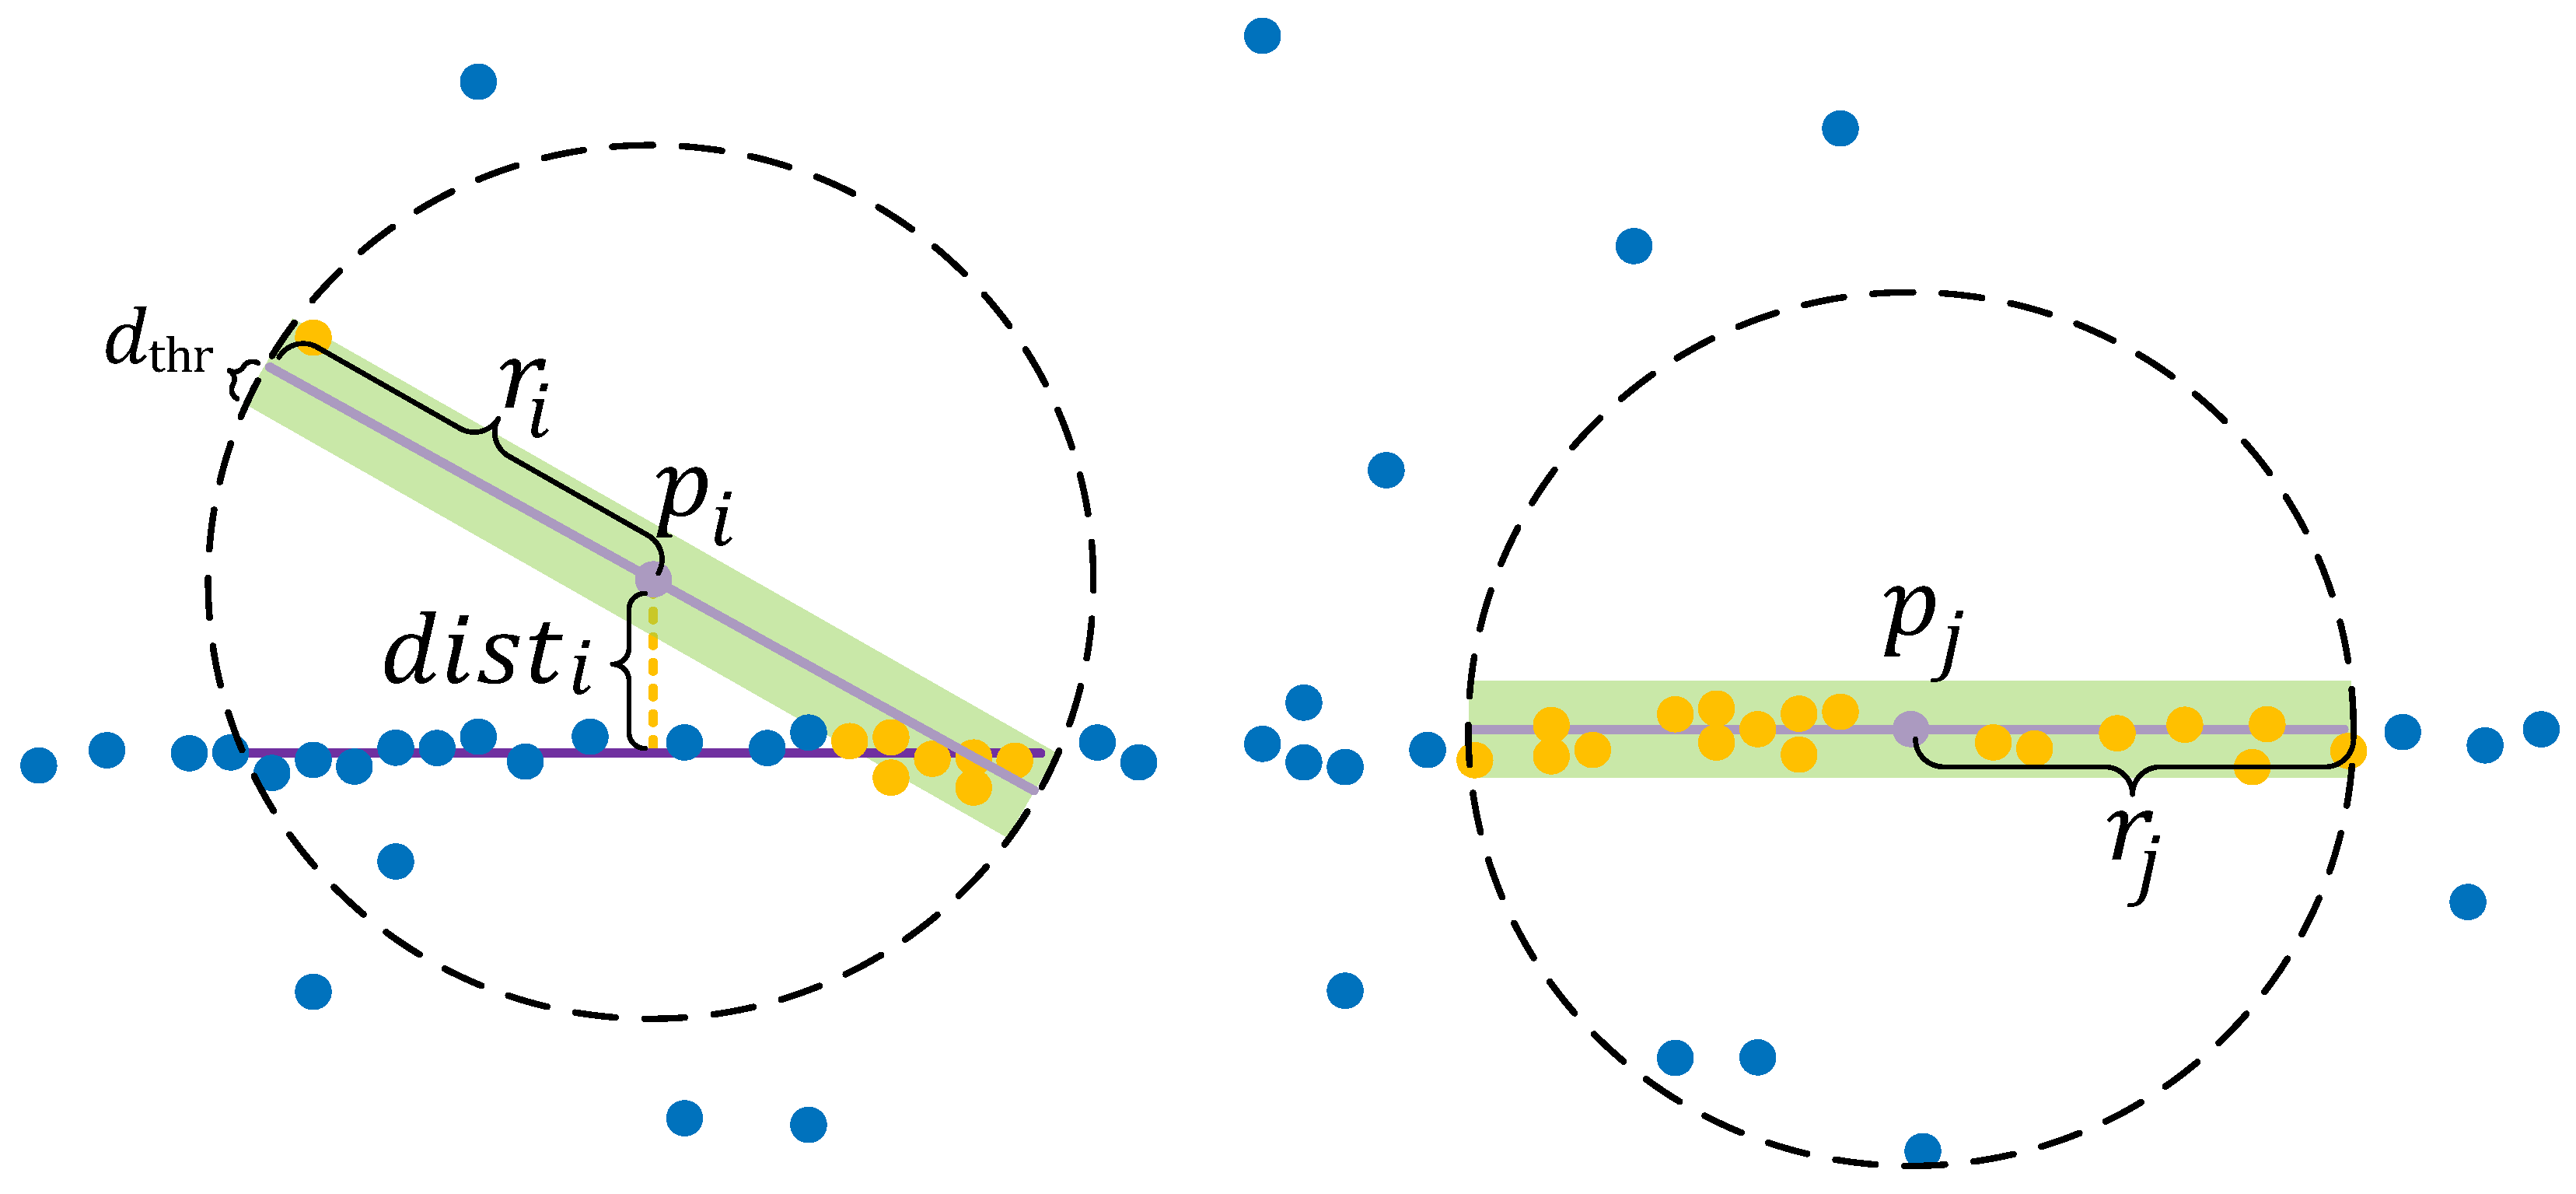
The distance threshold () measures the maximum allowable deviation of a photon from the line . A smaller excludes true signal photons with minor deviations caused by noise or irregular terrain, while a larger includes more noise photons, reducing precision. Experimental results show that an optimal range of 1–3 effectively extracts signal photons from noise photons.
Both
and
can be determined using linear feature maps. For most datasets, these thresholds remain consistent, but in sparse seafloor photon cases, adjustments may be necessary to accommodate specific conditions. Specifically, the density and distance maps shown in
Figure 7 reveal distinct separation patterns between signal and noise photons, which serve as intuitive references for threshold selection. By examining the local density peaks and distance decay trends of known signal photon clusters, we identify a suitable range for each threshold that avoids over-segmentation while preserving true signal structures. This empirical approach allows flexible adaptation to diverse photon profiles while maintaining consistency in classification criteria across experiments.
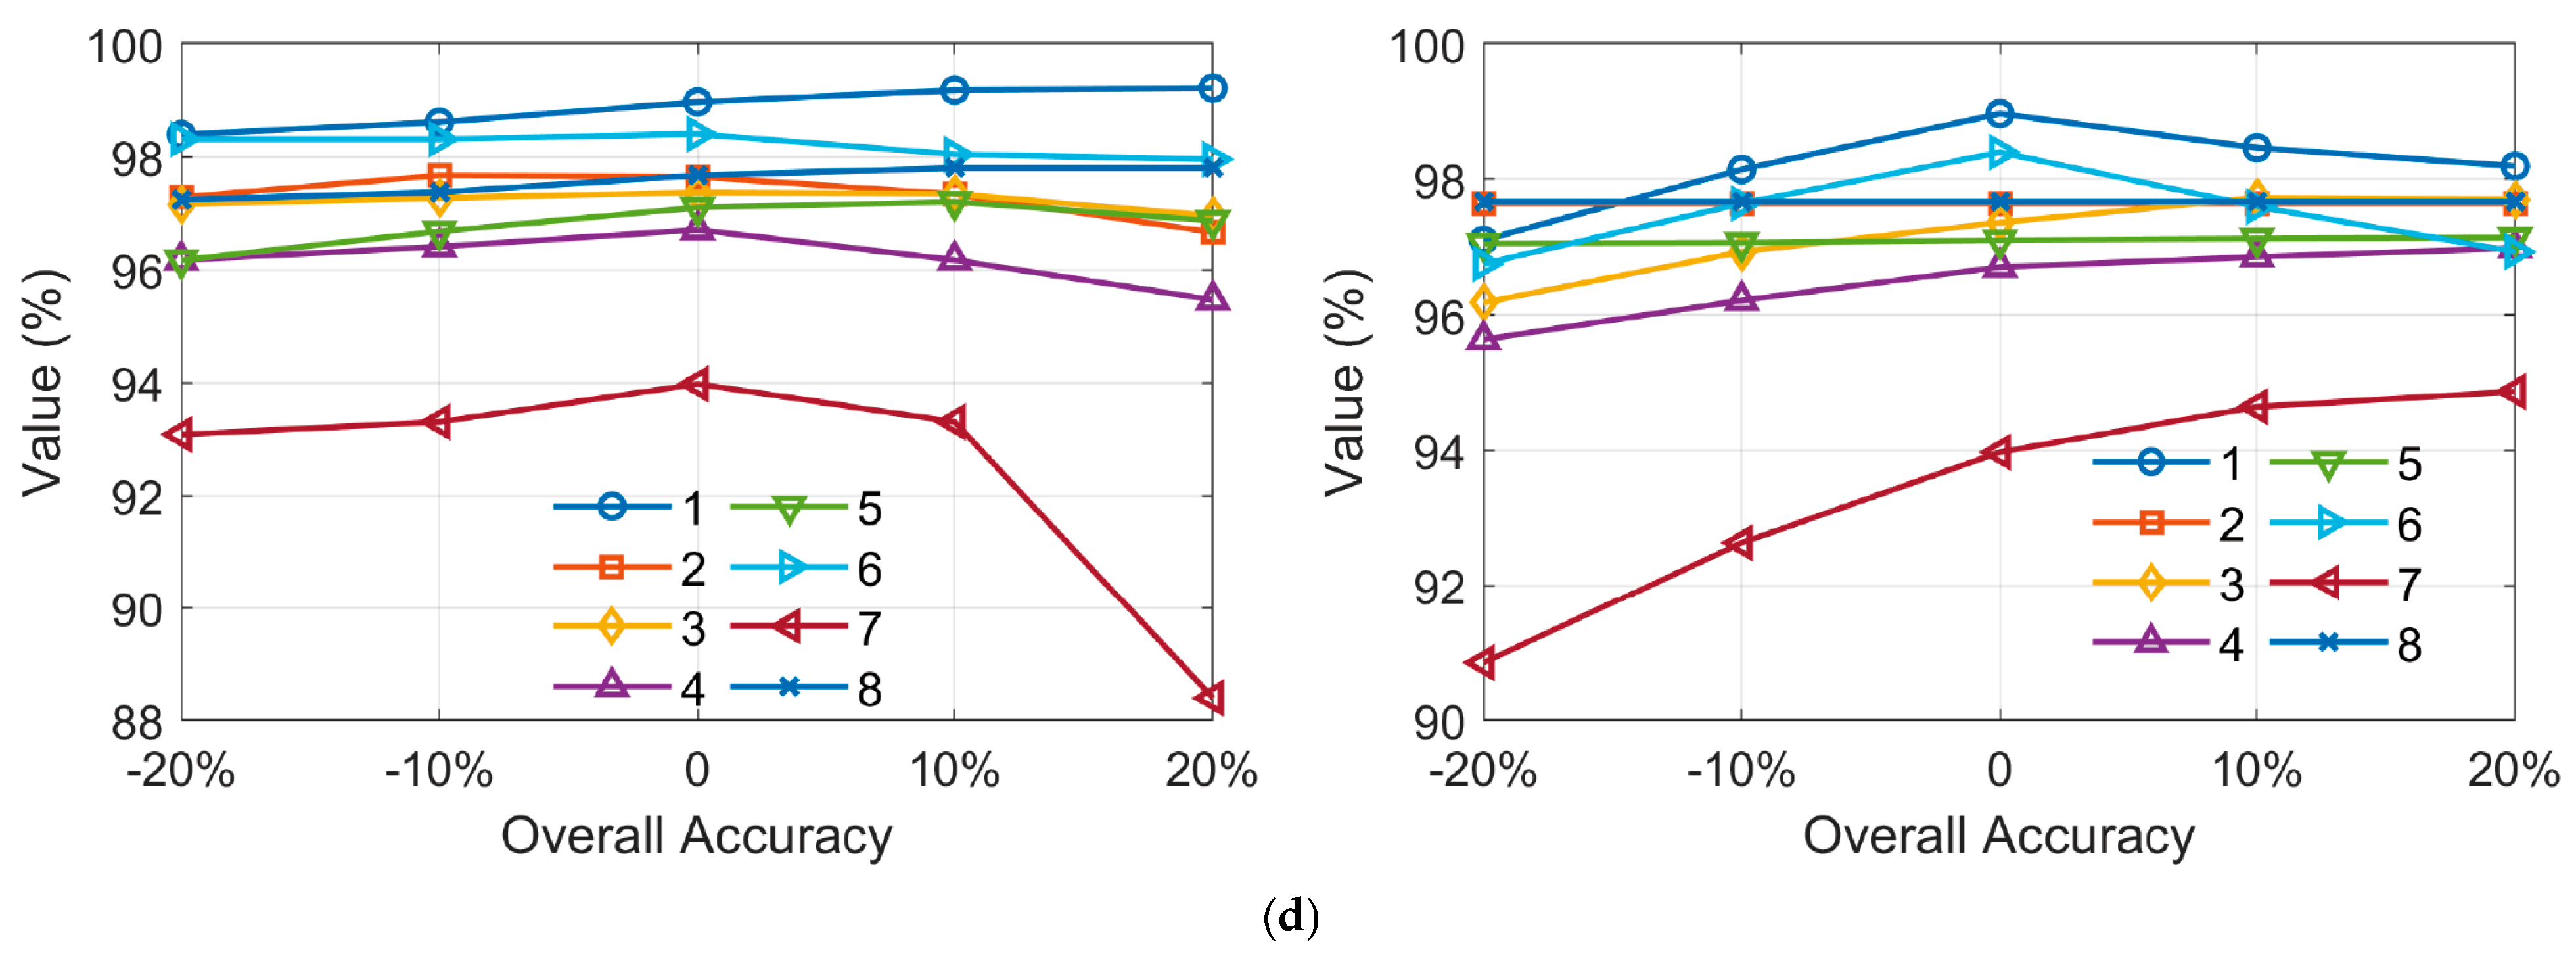
To evaluate the robustness of the proposed method to key parameter variations, we conducted a sensitivity analysis focusing on two critical parameters:
and
. While d_track is also involved in the algorithm design, its influence is coupled with
and
. Therefore, we isolate the effects of
and
by varying each independently within a ±20% range, while keeping other parameters fixed.
Figure 11 illustrates the variations in precision, recall, F1 score, and overall accuracy across all eight datasets. The left column shows the results for
, and the right column shows the results for
.
The results reveal that the LFSPE algorithm maintains high performance under moderate parameter perturbations. When varies, the lowest observed metrics across all datasets are: precision 95.230%, recall 80.545%, F1 score 88.841%, and overall accuracy 88.393%. In comparison, for , the minimum metrics are: precision 93.326%, recall 84.276%, F1 score 90.852%, and overall accuracy 90.848%. These results indicate that the algorithm exhibits slightly greater sensitivity to , particularly in terms of recall.
Additionally, it can be observed that datasets 3, 4, and 7 are more sensitive to parameter changes than the others. These datasets show more pronounced performance degradation under both increased and decreased thresholds, likely due to their lower signal-to-noise ratio or more complex underwater topography. Overall, the analysis confirms that while parameter tuning can affect performance, the algorithm remains robust within a reasonable range.
4.2. Detection Capability of the Proposed Method
The traditional DBSCAN denoising algorithm requires extensive parameter tuning, particularly for the neighborhood radius (
) and the minimum number of points (
), to achieve satisfactory results. As shown in the right column of
Figure 8, DBSCAN necessitates dataset-specific parameter adjustments to match the distribution characteristics of different ICESat-2 datasets, making the process time-consuming and complex. In contrast, the proposed method simplifies this challenge by using fixed parameters during the preprocessing stage, irrespective of the experimental region. This consistency significantly reduces the complexity of parameter adjustments. Furthermore, the signal photon extraction phase employs a parameter visualization approach based on photon linear features, streamlining the configuration process.
When handling high-noise or sparse photon data, DBSCAN often underperforms. As illustrated in
Figure 8a, DBSCAN struggles to adapt to the significant differences in signal photon density between shallow and deeper-water regions, leading to suboptimal identification of signal photons. For surface photons, DBSCAN tends to misclassify noise photons near the signal photons as surface photons, further compromising its performance.

