Article

Landslide Detection with MSTA-YOLO in Remote Sensing Images

1
College of Geological Engineering and Geomatics, Chang’an University, Xi’an 710054, China
2
The State Key Laboratory of Loess, Xi’an 710054, China
3
Power China Group, Northwest Engineering Corporation Limited, Xi’an 710065, China
4
The Xi’an Key Laboratory of Clean Energy Digital Technology, Xi’an 710065, China
*
Author to whom correspondence should be addressed.
These authors contributed equally to this work.
Remote Sens. 2025, 17(16), 2795; https://doi.org/10.3390/rs17162795
Submission received: 9 June 2025 / Revised: 1 August 2025 / Accepted: 11 August 2025 / Published: 12 August 2025

Abstract

Deep learning-based landslide detection in optical remote sensing images has been extensively studied. However, several challenges remain. Over time, factors such as vegetation cover and surface weathering can weaken the distinct characteristics of landslides, leading to blurred boundaries and diminished texture features. Furthermore, obtaining landslide samples is challenging in regions with low landslide frequency. Expanding the acquisition range introduces greater variability in the optical characteristics of the samples. As a result, deep learning models often struggle to achieve accurate landslide identification in these regions. To address these challenges, we propose a multi-scale target attention YOLO model (MSTA-YOLO). First, we introduced a receptive field attention (RFA) module, which initially applies channel attention to emphasize the primary features and then simulates the human visual receptive field using convolutions of varying sizes. This design enhances the model’s feature extraction capability, particularly for complex and multi-scale features. Next, we incorporated the normalized Wasserstein distance (NWD) to refine the loss function, thereby enhancing the model’s learning capacity for detecting small-scale landslides. Finally, we streamlined the model by removing redundant structures, achieving a more efficient architecture compared to state-of-the-art YOLO models. Experimental results demonstrated that our proposed MSTA-YOLO outperformed other compared methods in landslide detection and is particularly suitable for wide-area landslide monitoring.

1. Introduction

Landslides are one of the important natural geological disasters in the world, which seriously threatens the safety of human life and property [1,2]. Landslides are triggered by various factors. In addition to natural factors such as earthquakes and rainfall, human activities [3,4,5,6] may also cause landslides. Landslide detection is of great significance and requires arduous work. Rapid and accurate landslide detection can provide great serviceability and help for disaster relief and treatment.
In optical images, landslides typically exhibit the following characteristics due to the disruption of the original terrain integrity: (1) bare soil partially covered by vegetation; (2) fractured ground surfaces; (3) coarse and uneven textures; and (4) discontinuous landscape patterns. Over time, the distinctive surface characteristics of landslides gradually diminish due to factors such as vegetation regrowth and surface weathering. For such landslides, existing methods have difficulty to meet the requirements of precise detection.
Currently, the extraction of landslide features from optical imagery primarily relies on the expertise and experience of landslide specialists, who manually analyze remote sensing images to delineate landslide locations and boundaries. However, this approach is time-consuming and labor-intensive, and its effectiveness is influenced by the subjective judgment of individual experts, leading to inconsistencies in landslide interpretation. Automatic extraction methods aim to translate the visual interpretation expertise into remote sensing algorithms and rules, enabling computers to automatically identify landslides. Compared to manual interpretation, automatic extraction is highly sensitive to the quality of the remote sensing images, often resulting in relatively lower recognition accuracy. Recently, deep learning methods have been increasingly applied to the field of remote sensing [7,8,9,10,11,12,13], including the automatic detection of landslides [14,15,16,17,18]. This process typically involves two steps: first, landslide regions are annotated based on prior knowledge, and then the labeled data are used to train deep learning models, enabling the detection of landslides in other regions.
Specifically, in order to improve detection performance, Zhang et al. [19] introduced a context enhancement module composed of dilated convolutions into the regression branch of the decoupled head, replacing the coupled head in YOLOv5s with an improved decoupled head to boost model effectiveness. Additionally, Gao et al. [20] proposed a multi-scale attention model (SWIN-MA) based on Swin transformer, capable of comprehensively capturing and learning multi-scale landslide features. Meanwhile, Dong et al. [21] developed a multi-scale feature fusion lightweight neural network (MFFLnet) and employed a deep transfer learning (TL) strategy, enabling MFFLnet to leverage prior landslide knowledge from the source domain and apply fine-grained data augmentation to mitigate overfitting. However, these models exhibit inconsistent performance when dealing with small targets, objects with extreme shapes (e.g., slender, narrow, or tall), and datasets containing diverse target types within the same class.
Therefore, current research has also proposed corresponding methods for specific landslide challenges. Huang et al. [22] combined morphological edge recognition with Swin transformer deep learning models to enhance boundary delineation, effectively solving the problems of boundary irregularity and feature discretization in landslide detection. Due to the presence of interference factors such as vegetation cover, it is often difficult for models to fully learn the optical characteristics of landslides. Chen et al. [9] and Xu et al. [23] utilized the texture features of high-resolution images and combined them with auxiliary features such as normalized vegetation index (NDVI) and gray level co-occurrence matrix (GLCM) to improve model performance. However, these studies are only focused on a specific area, and the performance of large-scale landslide detection has not been fully validated, resulting in significant limitations.
To explore more effective solutions for landslide detection, Zhao et al. [24] and Gao et al. [25] integrated the strengths of CNN and transformer models, proposing a network that simultaneously focuses on both local and global characteristics of landslides. Despite their advantages, transformer-based models and their improved variants [10,26] generally require large-scale datasets and prolonged training times to achieve optimal performance. Consequently, these requirements significantly limit the practical application of such models in scenarios with constrained computational resources.
To address the aforementioned challenges, we conducted a comprehensive investigation of mainstream attention mechanisms and modules [27,28,29,30,31,32,33,34,35,36], among which the efficient channel attention (ECA) [37] and receptive field blocks (RFB) [38] stood out due to their feature enhancement capabilities. However, these methods exhibit certain limitations when applied to landslide detection. Specifically, ECA performance is constrained in complex scenarios involving diverse landslide characteristics, while RFB lacks attention to channel information during the training process, which limits its ability to effectively capture landslide features. To overcome these limitations, we propose a novel attention mechanism called receptive field attention (RFA), designed to enhance landslide detection accuracy while maintaining computational efficiency. Building on this innovation, we introduce multi-scale target attention YOLO (MSTA-YOLO), which demonstrates superior performance in detecting multi-scale landslides, capturing subtle and ambiguous features, and effectively identifying small landslides in three-channel optical imagery. The main contributions of this paper are as follows:
(1)
A novel attentional mechanism denoted as receptive field attention (RFA) is proposed. The design of RFA refers to the structure of the human receptive field, allowing the model to extract more effective features from both channel and space perspectives.
(2)
The normalized Wasserstein distance (NWD) [39] is introduced into the loss function instead of the traditional cross ratio calculation method, which reduces the sensitivity of the traditional cross ratio and further improves the performance of the model on small targets.
(3)
The MSTA-YOLO model demonstrates significant performance improvements on both the Bijie and Luding landslide datasets, outperforming existing state-of-the-art models. Furthermore, its application to the Southwest landslide dataset validates the enhanced transfer learning capability enabled by our proposed module.

2. Data and Study Areas

To comprehensively evaluate the proposed MSTA-YOLO model, we conducted experiments on three landslide datasets: Bijie, Luding, and Southwest. The Bijie dataset, widely utilized in current research, provides a benchmark for comparing our method with state-of-the-art landslide detection models. The Luding dataset, featuring representative landslide targets, serves as a critical test for evaluating the model’s practical applicability in real-world disaster prevention scenarios. Furthermore, the Southwest dataset was employed to verify the enhanced transfer learning capability of our model compared to the original version.

2.1. Bijie Landslide Dataset

To train and evaluate the proposed model, we utilized the Bijie landslide dataset, which was published by Wuhan University, China [40]. The study area is located in Bijie City, Guizhou Province, China, with a total area of 26,853 square kilometers, covering the entire territory of Bijie City. The region has an average altitude of 1600 m and is surrounded by mountains and rivers. Due to its steep slopes, fragile ecological environment, and geological instability, this area is one of the most landslide-prone regions in China.
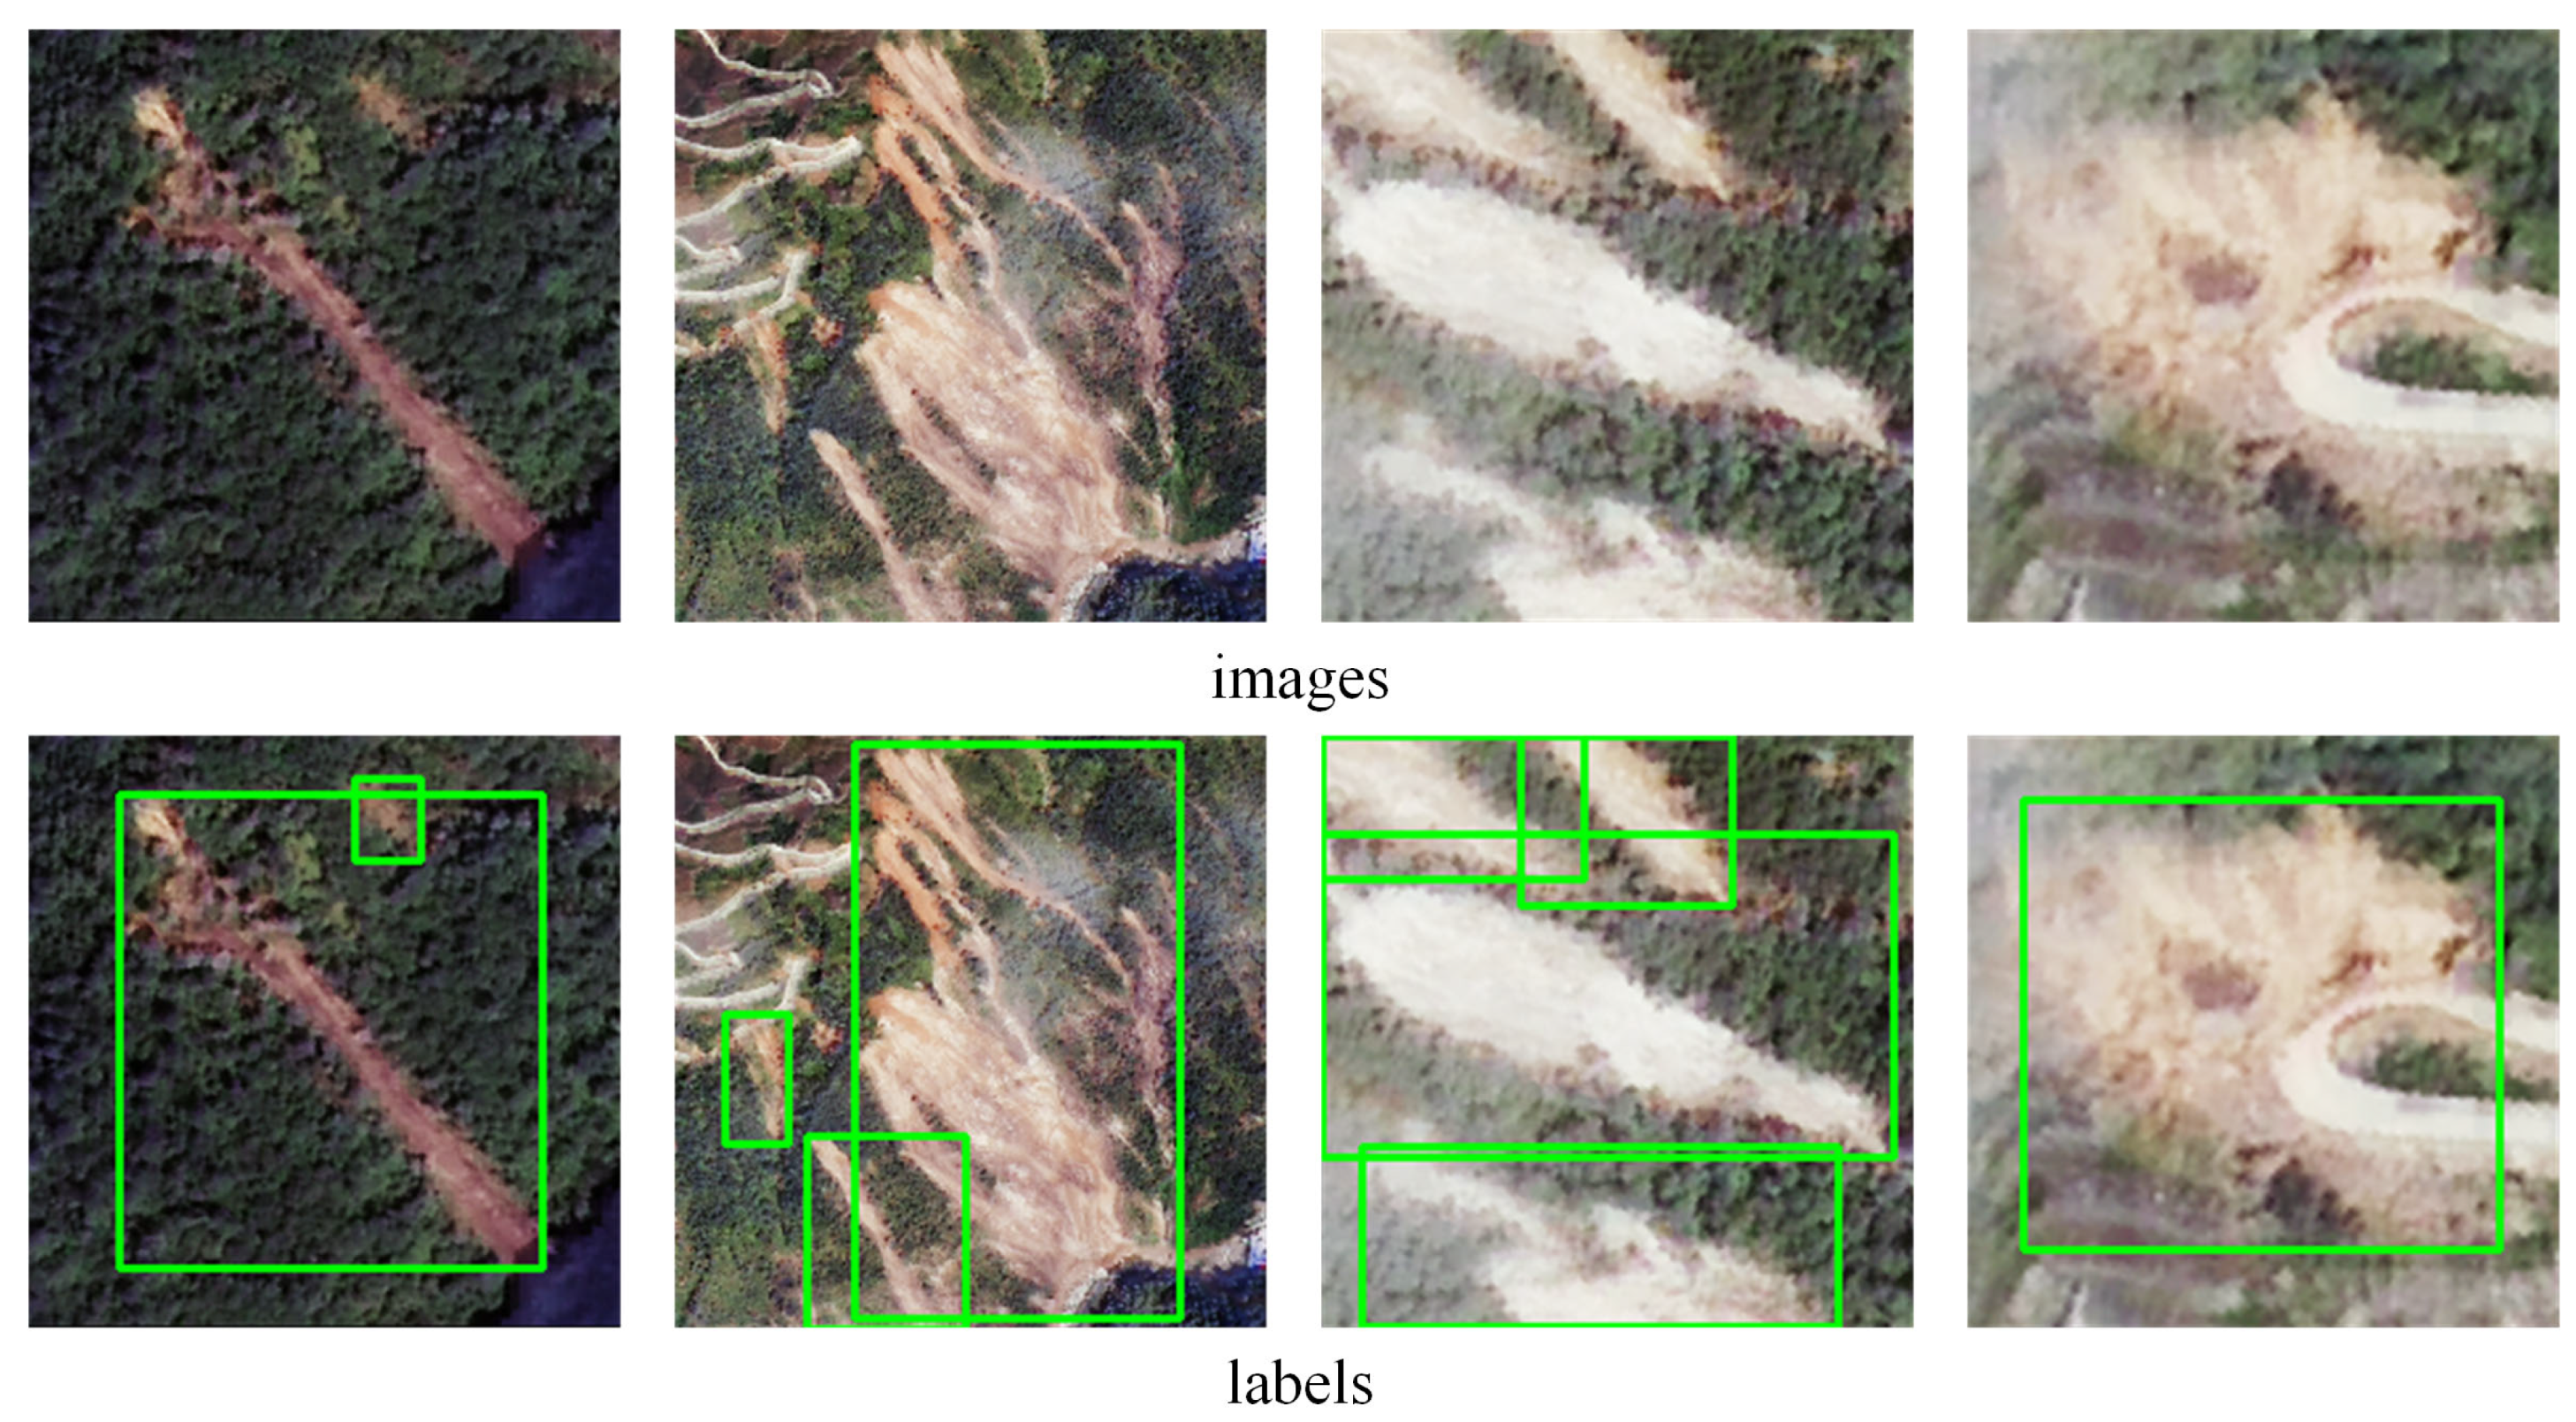
This dataset comprises 770 optical remote sensing images of landslide samples, extracted from TripleSat satellite imagery captured between May and August 2018. Each sample consists of RGB bands with a spatial resolution of 0.8 m. To ensure uniformity, all images are resized to 320 × 320 pixels using the LetterBox strategy. The dataset is randomly divided into three groups in an 8:1:1 ratio, which are used for training, validation, and testing, respectively. The processed data set is shown in Figure 1.

2.2. Luding Landslide Dataset

For comprehensive model validation, we incorporated the Luding landslide dataset [41] to supplement experimental evaluation. Distinct from the Bijie dataset, Luding contains predominantly newly-formed landslides, providing critical reference values for real-world landslide disaster identification.
The Luding landslide dataset [41] originates from GF-2 satellite imagery (Orbit 43565) acquired on 10 September 2022, following the Mw6.8 Luding earthquake on 5 September 2022, in Ganzi Tibetan Autonomous Prefecture, Sichuan Province. This disaster triggered extensive landslides, providing the raw data for dataset construction. As shown in Figure 2, the newly generated landslide has a relatively clear boundary, but the size varies greatly. If there are multiple landslides in the same image, the boundaries between each landslide are rather difficult to distinguish. Within the county-level administrative region, subject to the constraints of the study scope, the Luding landslide dataset contains 283 images, each 224 × 224 pixels in size. This poses challenges to the learning and generalization capabilities of the model. To ensure that the model can receive sufficient learning based on this dataset, we divided the dataset in an 8:1:1 ratio to guarantee the sufficiency of training samples.

2.3. Southwest Landslide Dataset

In real-world applications, landslide detection often encounters more complex challenges. Compared with Bijie City and Luding County, regions with low landslide frequency usually contain fewer landslide targets and exhibit more distinctive characteristics of these targets. We refer to such regions as difficult areas. Detecting landslides in these difficult areas is equally important. However, the dimensional variations and diverse optical features of landslide targets in these regions, combined with the limited sample size due to the low frequency of landslides, make accurate detection particularly challenging.
To evaluate the model’s performance in identifying landslides in difficult areas, we use the Southwest landslide dataset [19]. The landslide dataset has a wide study area covering five provinces in southwest China, including Gansu, Sichuan, Guizhou, Yunnan, and Tibet. It is located between 90°23′–106°39′E and 22°27′–33°56′N. These areas are between 500 and 4500 m above sea level, and the terrain is complex. The dataset contains only 500 positive sample images, each containing one or more landslides. After expert interpretation and confirmation of the samples in the dataset, we ultimately used it for training and testing. As shown in Figure 3, the size of landslide targets in this dataset varies greatly, and the number of landslide targets of different sizes is limited. As shown in Figure 4, the optical characteristics of landslide in the data set are extremely rich. The model can only learn multiple types of landslides with very limited samples, and the challenge is extremely difficult.

3. Methods

3.1. MSTA-YOLO Network Structure

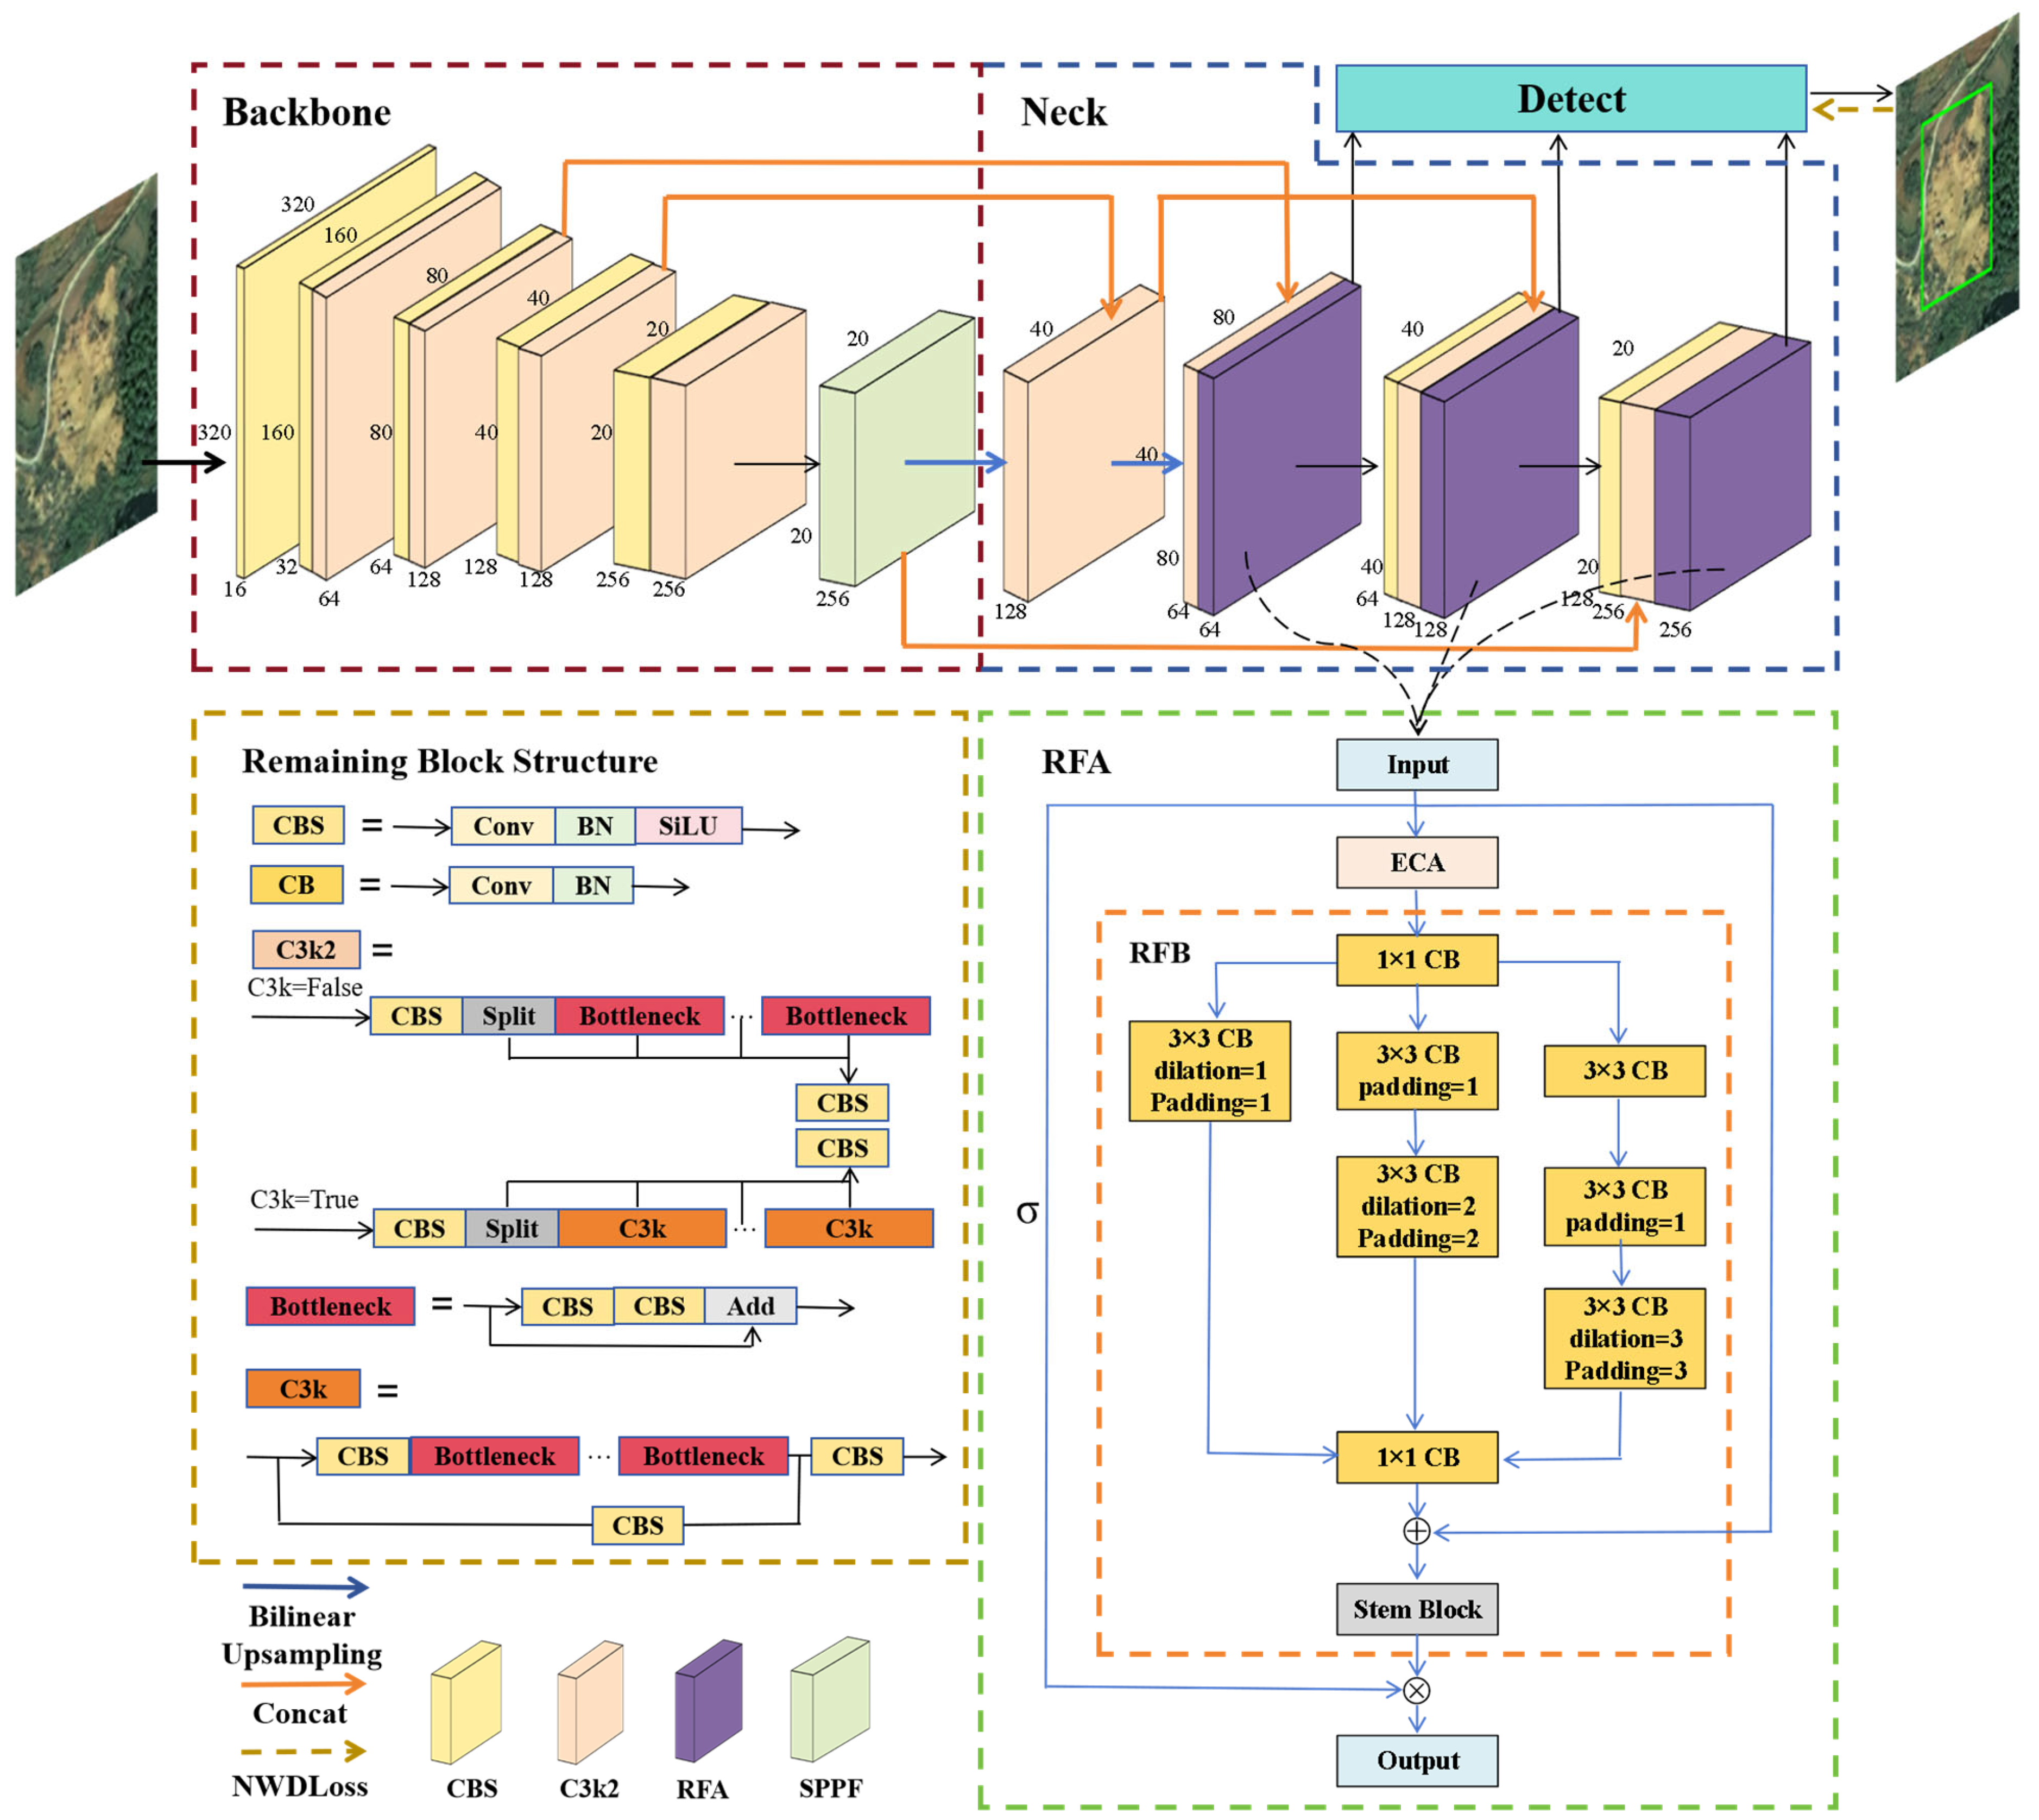
To address the complex optical characteristics of landslides and improve detection accuracy, we propose an innovative model called multi-scale target attention YOLO (MSTA-YOLO). The overall structure diagram of MSTA-YOLO is shown in Figure 5. While retaining the advantages of YOLOv11, MSTA-YOLO reconstructs its network structure to enhance feature extraction and small target recognition capabilities. First, we introduced receptive field attention (RFA) at three positions in the neck of the model, connected to the detection head to detect small, medium, and large targets. RFA simulates the human visual receptive field by combining multi-scale convolution operations and channel attention, allowing the model to better capture multi-scale landslide features and enhance its learning ability. Second, since landslide samples often contain a large number of small targets, the traditional boundary regression loss in the detection head is prone to errors when dealing with these targets. To address this, we replaced the traditional method with normalized Wasserstein distance (NWD) loss, which improves the model’s ability to distinguish between positive and negative samples and facilitates more effective model convergence. Finally, we removed the C2PSA block from YOLOv11, which was found to be redundant and negatively impacted model learning. The removal of this module simplifies the model structure and improves overall efficiency, as confirmed through detailed data analysis in our ablation experiments. These improvements enabled MSTA-YOLO to achieve superior landslide detection performance across diverse scenarios, including multi-scale targets, complex optical features, and limited sample conditions.

3.2. YOLOv11 and C2PSA Block

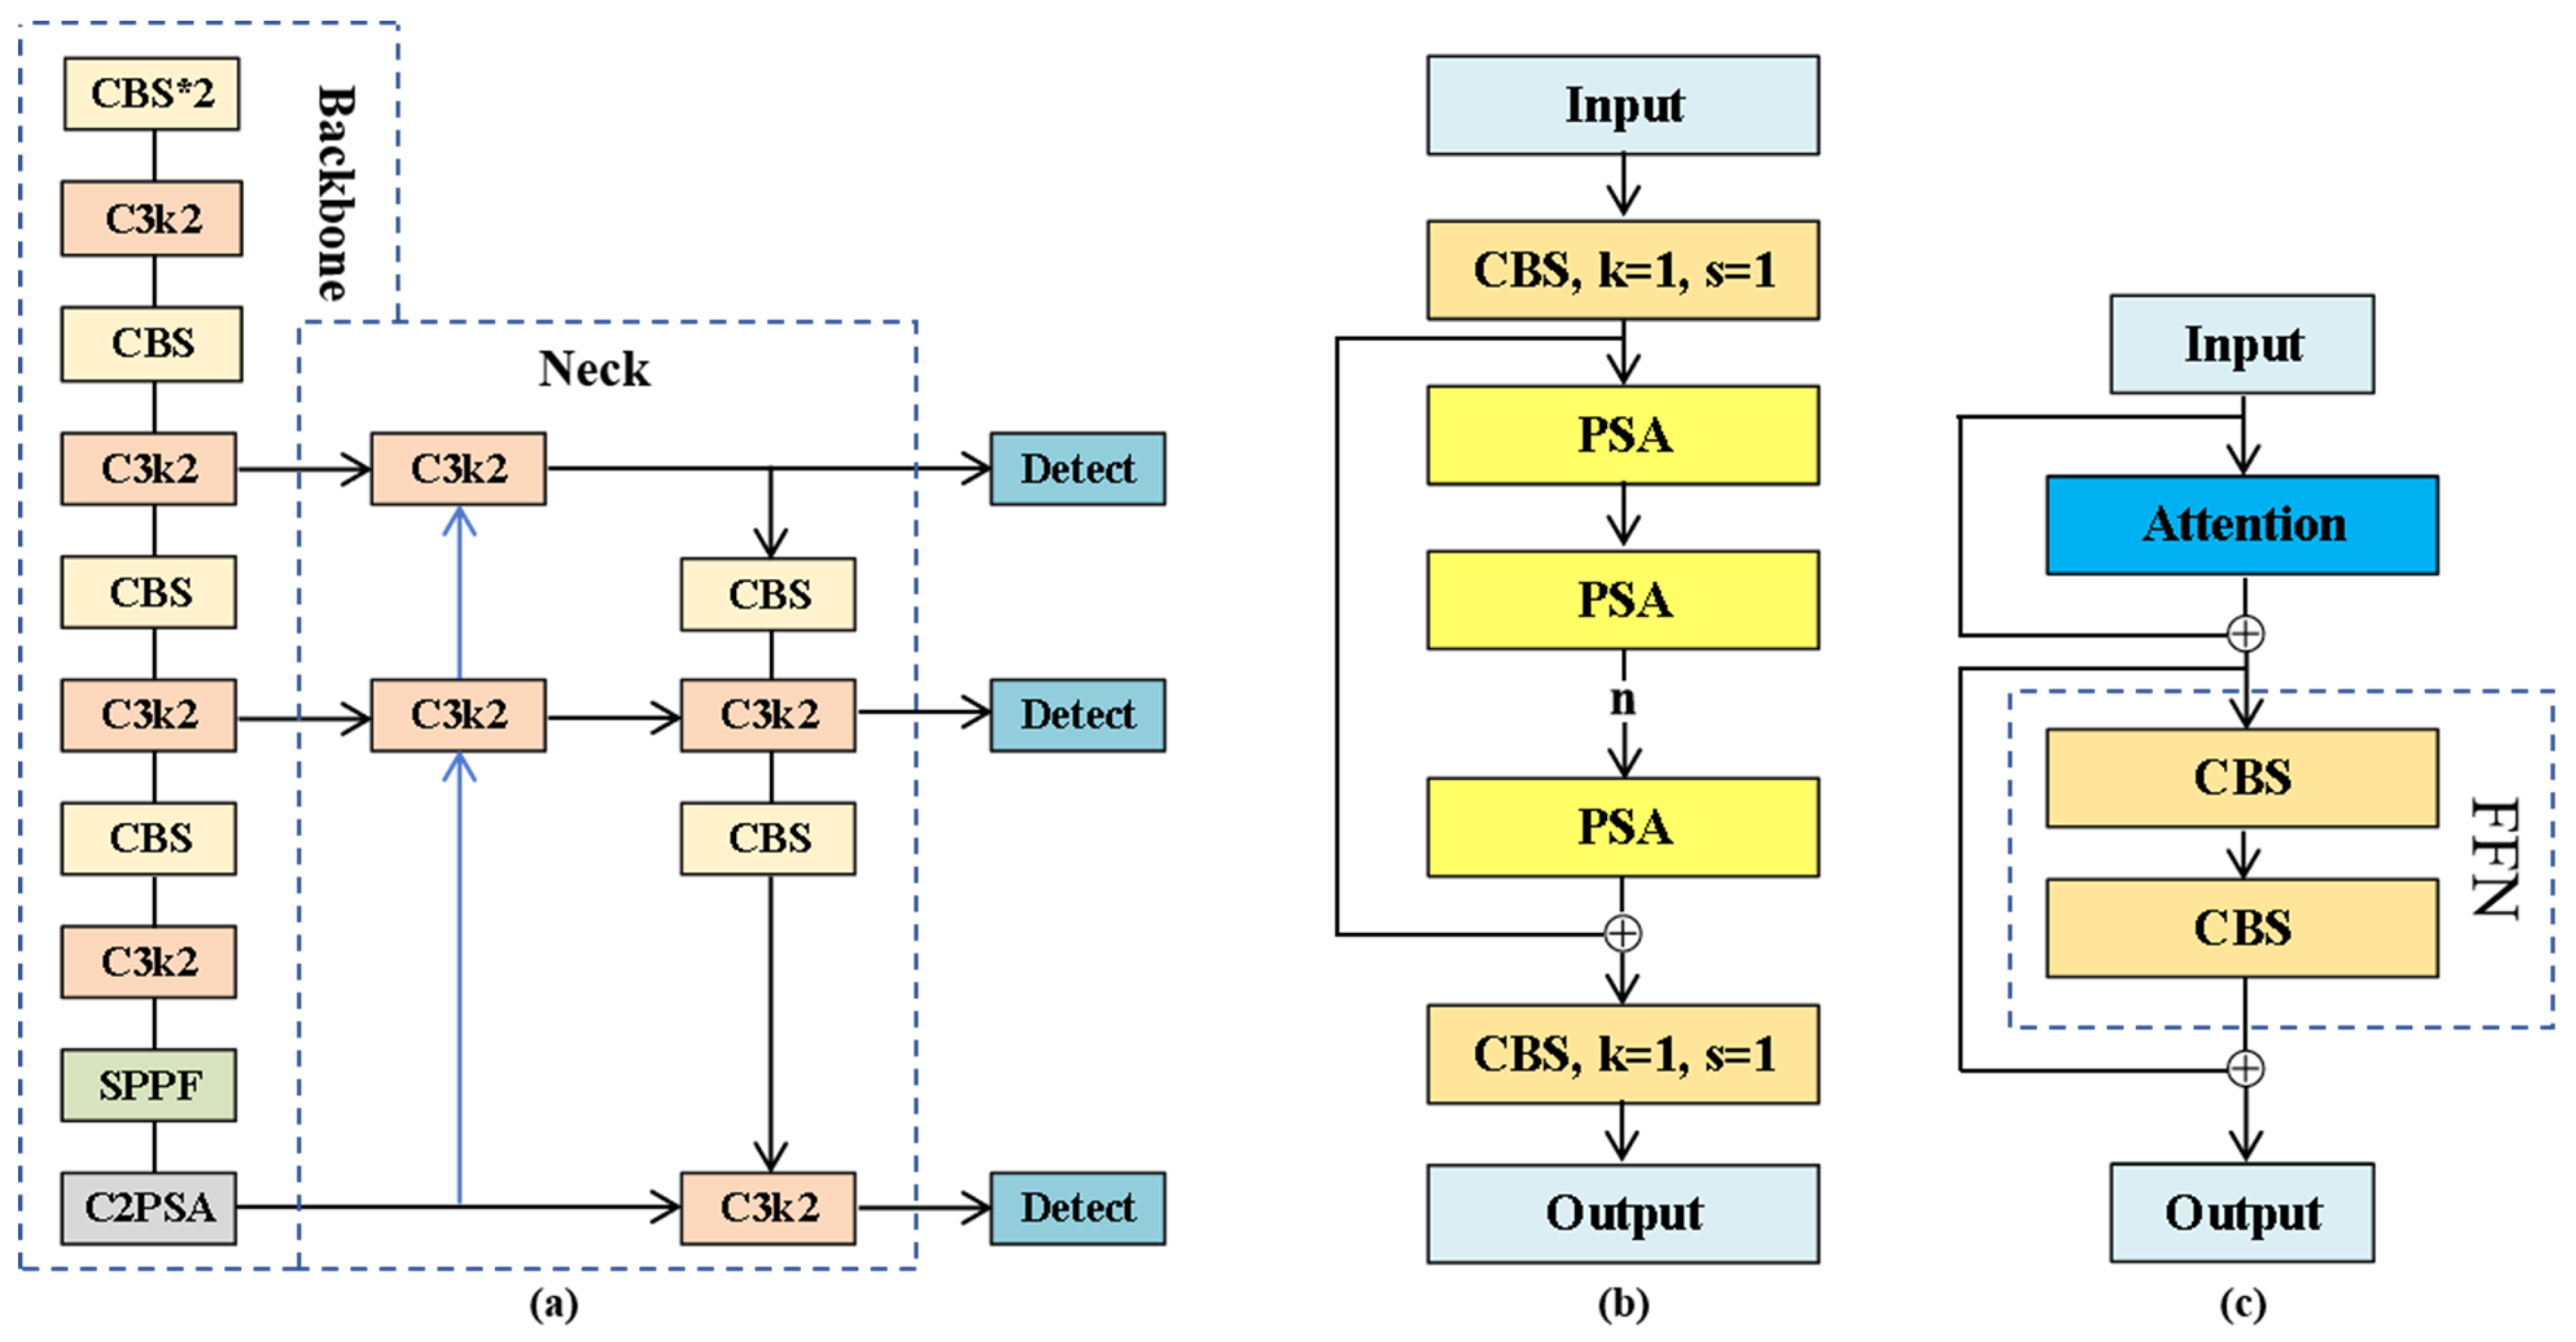
Compared with the previous models of the YOLO series, the YOLOv11 not only proposes an updated downsampling module and detection head, but also introduces the C2PSA mechanism. The C2PSA block combines the cross stage partial (CSP) structure and the pyramid squeeze attention (PSA) block, enhancing the feature extraction ability of YOLOv11. As shown in Figure 6, after a simple convolution operation, the feature map is divided into the primary processing branch and the secondary processing branch. The main branch realizes dynamic feature modulation through multiple PSA blocks to enhance the model’s perception of the target position. The secondary path retains the original feature features.
This design is effective, but there is a potential conflict with the RFA we proposed. First, when C2PSA establishes global dependencies, it does not pay additional attention to the information at specific important positions, which often easily leads to the loss of important information. RFA pays more attention to the characteristics of the central area within the receptive field range, which does not conform to the logic of feature extraction by C2PSA. Second, the inclusion of ECA in RFA enhances the model’s attention to important channels. Meanwhile, a richer CSP structure is designed to improve the expression ability of features. These designs are clearly further improvements over the C2PSA. To sum up, RFA, with the same CSP structure as C2PSA, has more diverse and rich considerations. Therefore, there is a potential risk of incompatibility between the two. In the experiment in Section 4.3, the results prove this point.

3.3. Receptive Field Attention

In remote sensing images, landslides have a variety of optical features and scales, which makes it difficult for the model to extract the feature information of landslides effectively. In this paper, we designed an RFA module, which can effectively improve the adaptability of the model to multi-scale and nonlinear, so as to improve the performance of the YOLO model in landslide detection. As shown in Figure 5, the RFA contains three branches. The first branch obtains the channel attention vector of the original feature through the sigmoid function and generates the corresponding weight. The second branch consists of the ECA and the receptive field module (RFB) to fully extract the feature information. The third branch is used for weighting and adding features in specific positions to enrich the semantic information of features and make the expression of features more accurate.

3.3.1. Receptive Field Block

Inspired by the human receptive field, the RFB utilizes multi-branch pooling, with different branches using a convolution kernel of different sizes to respond to receptive fields of different sizes, using extended convolution layers to control eccentricity and reshaping them to generate the final representation.
As illustrated in Figure 5, the RFB module comprises three distinct processing branches, each configured with specific padding and dilation parameters to handle feature information at different scales. The unified configuration of padding and dilation parameters is briefly referred to as DP in the following text: (1) Small-scale processing branch—implements a basic dilated convolution (DP = 1) for local feature extraction. (2) Medium-scale processing branch—extends the first branch by incorporating an additional standard convolution layer (pooling coefficient = 1) while increasing the padding and dilation coefficient to DP = 2. (3) Large-scale processing branch—augments the architecture with a 3 × 3 standard convolution layer and further elevates the padding and dilation coefficient to DP = 3 for global context capture.
The hierarchical design balances feature extraction across different scales. Small-scale features contain limited but precise information. Therefore, they undergo minimal processing. This preserves their delicate details. In contrast, large-scale features often contain irrelevant content. Thus, they require deeper refinement. The system fuses outputs from multiple branches. This fused output optimizes the receptive field characteristics. Specifically, it maintains an optimal size–eccentricity relationship. The design emphasizes central regions in the receptive field. It also enhances spatial robustness. Most importantly, it prioritizes high-level feature abstraction. This focus helps avoid over-reliance on location-specific details. Then, the receptive field features and initial features are weighted and added, and the formula is as follows:
X a = 0.1 X F + X in
where, XF represents the receptive field feature, Xin represents the initial feature, and Xa represents the output feature after weighted addition.

3.3.2. Efficient Channel Attention

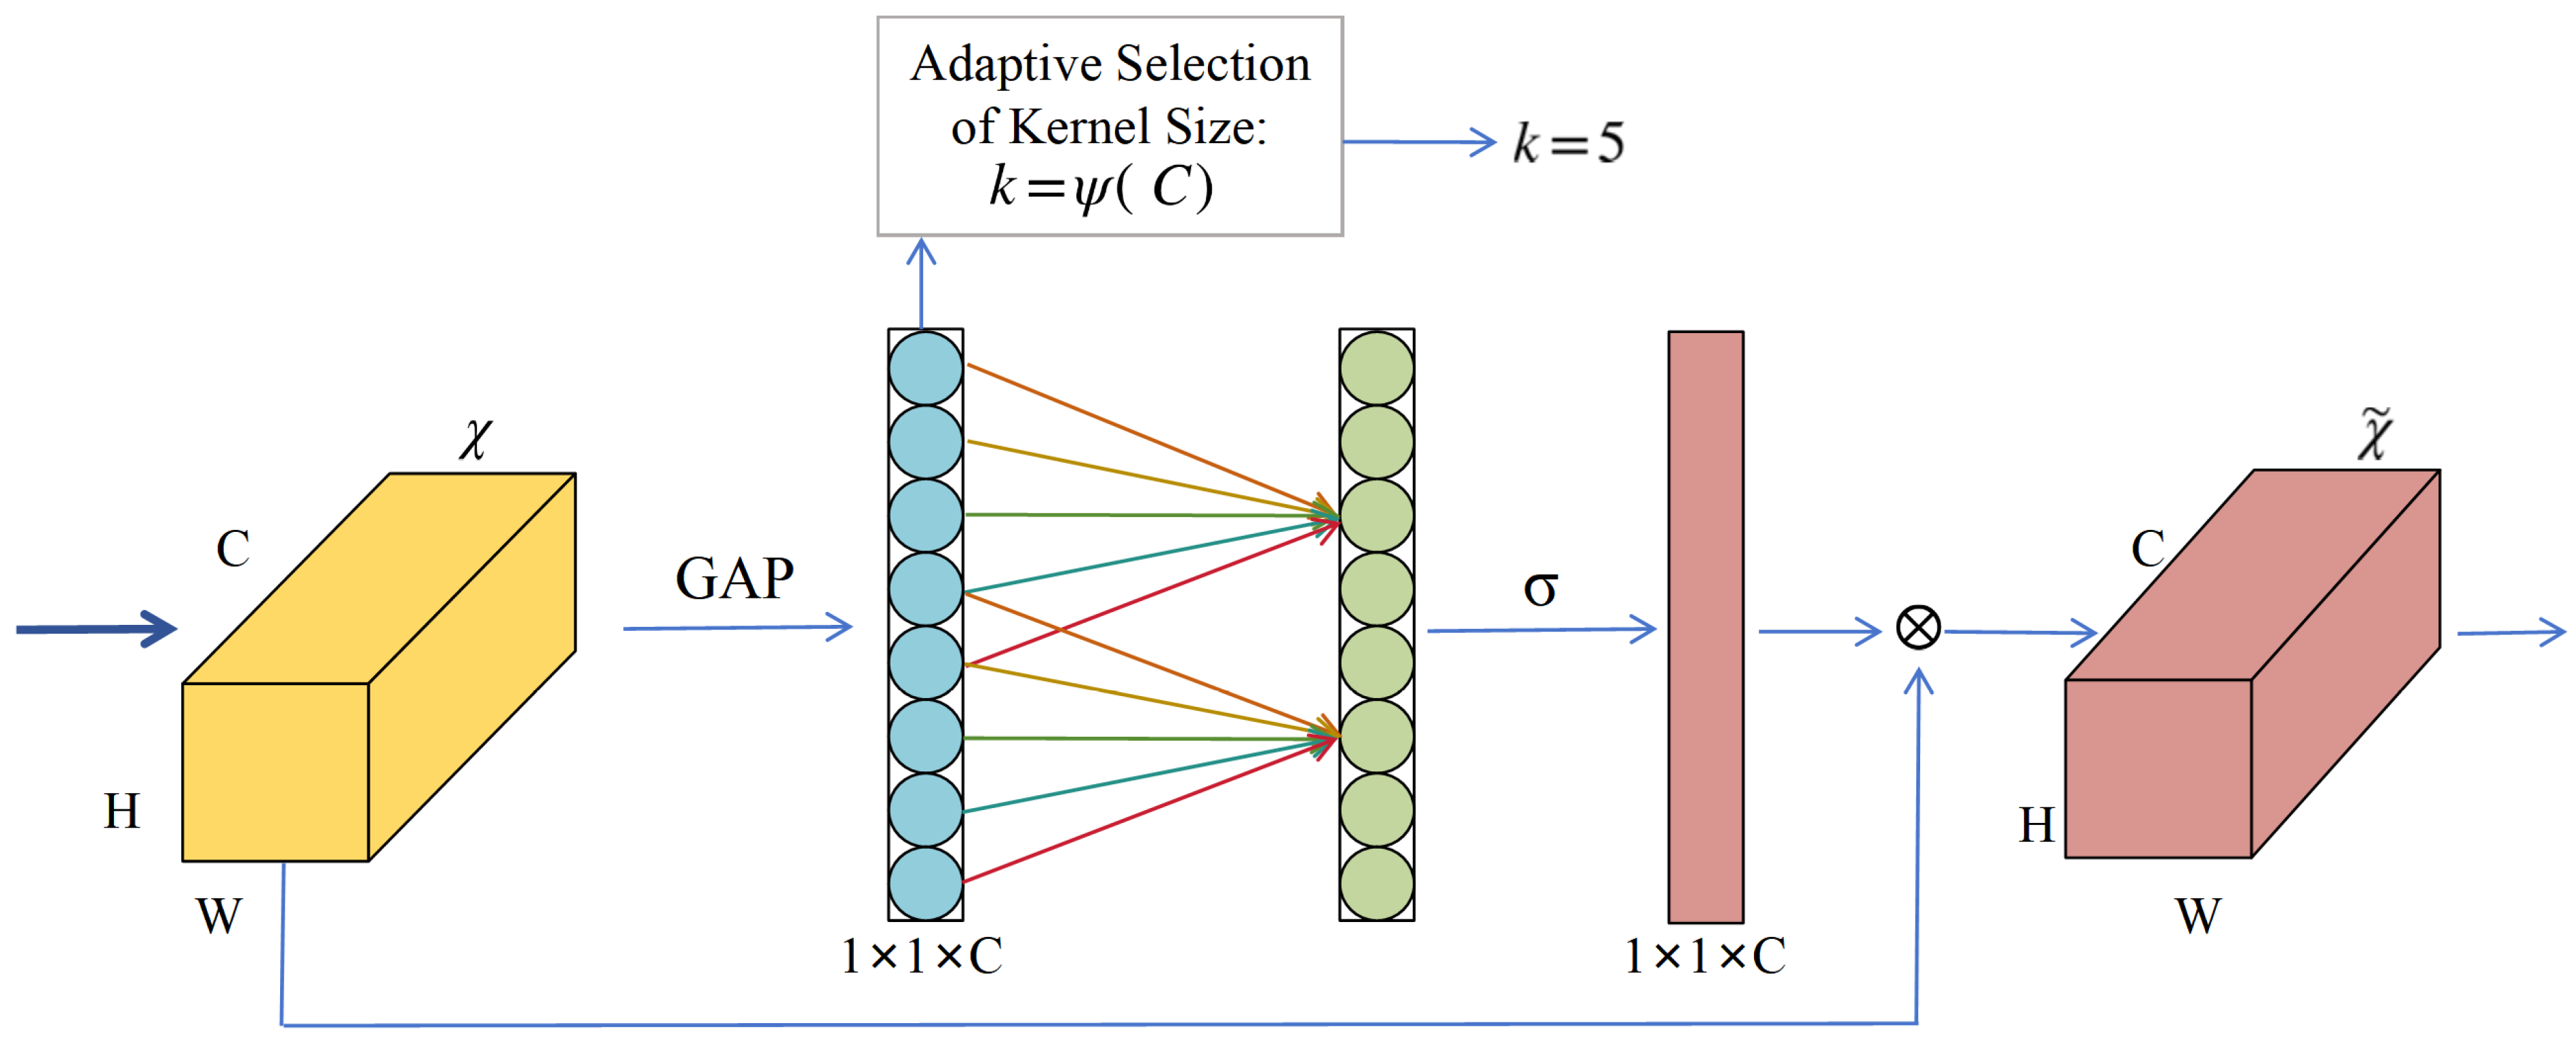
ECA is an efficient plug and play channel attention mechanism that does not require a lot of additional computation. ECA consists of a compression module for compressing global spatial information and an incentive module for implementing channel interaction. Its structure is shown in Figure 7. Specifically, first perform global average pooling (GAP) on the eigenvalue X H × W × C , and its calculation formula is as follows:
X 1 = GAP ( X ) c = 1 H W i = 1 H j = 1 W X c , i , j
where C, H, and W, respectively, represent the number of channels, height, and width. c represents the index of the channel, and i and j represent the position indexes of height and width, respectively. GAP ( ) c represents the independent calculation of the average value of all spatial positions for each channel c. The output is X 1 1 × 1 × C .
Second, calculate the channel weights based on X1 and multiply them with the input original features. The calculation process is as follows:
ω = F ECA ( X 1 ) = σ ( Conv 1 D ( X 1 ) )
Y = ω X
where σ represents the sigmoid function and ω represents the channel attention vector. Y represents the output feature map. Conv1D represents a one-dimensional convolution with a convolution kernel of size k. The convolution kernel size k is determined from the channel dimension C. Specifically, k is calculated as follows:
k = ψ ( C ) = log 2 ( C ) γ + b γ o d d
where |∙|odd indicates the nearest odd number of|∙|, γ and b are hyperparameters. According to the conclusion of Wang et al. [37], we set the values of γ and b to 2 and 1, respectively.
In RFA, the feature map is first processed by ECA, which has a significant effect and a small number of parameters. The feature map is then sufficiently reshaped by RFB to highlight the importance of areas close to the center, allowing the model to focus on identifying high-level abstract features. It starts from two branches of the input feature graph. One of the branches fuses the original features with the output features of RFB to enrich the semantic expression of the features; the other branch is processed through the sigmoid activation function to generate a weight matrix ω 1 that retains the original feature information. The calculation formulas are as follow:
ω 1 = σ ( X )
X out = ω 1 ReLU ( X a )
where Xout is regarded as the output of RFA. Such a design can ensure the accurate semantic expression of the feature map and improve the performance of the feature map in detail. A ReLU activation function is then placed in the stem block to improve the expressiveness of the model.

3.4. Normalized Wasserstein Distance

The traditional calculation of regression loss relies on the cross ratio (IoU), and its calculation formula is as follows:
I o U = A B A B
where A represents the prediction box and B represents the true box. This simple calculation has high sensitivity when learning and detecting small targets; that is, a small deviation between the prediction box and the true position will significantly reduce the IoU. Figure 8 shows the most common situations of deviation between the prediction box and the real box. This will lead to the model’s inability to reasonably distinguish between positive and negative samples, making it difficult for the network to converge. At the same time, the smaller the size of the images in the dataset, the worse this phenomenon is.
Normalized Wasserstein distance (NWD) mainly uses Wasserstein distance to measure the similarity of bounding boxes, thereby overcoming the difficulties of traditional IoU and its modifications [42,43,44,45,46] when processing small target scenarios. NWD first models the bounding box as a two-dimensional Gaussian distribution and then uses normalized Wasserstein distance to measure the similarity of the derived Gaussian distribution.
Specifically, given two 2D Gaussian distributions μ 1 = N ( m 1 , 1 ) and μ 2 = N ( m 2 , 2 ) , the second-order Wasserstein distance between them is defined as follows:
W 2 2 ( μ 1 , μ 2 ) = m 1 m 2 2 2 + T r ( 1 + 2 2 ( 2 1 / 2 1 2 1 / 2 ) 1 / 2 )
To convert this distance into a measure of similarity between 0 and 1, NWD normalized in exponential form is defined as follows:
NWD ( N 1 , N 2 ) = exp ( W 2 2 ( N 1 , N 2 ) C 2 )
where C2 is the constant associated with the dataset and is usually set to the average absolute size of the target detection dataset [36]. Its calculation formula is the following:
C 2 = 1 n i = 1 n P i
where Pi represents the pixel value of each target box, and n represents the number of target boxes.

3.5. Evaluation Metrics

The main goal of this study was to delineate the landslide area and identify the candidate box location. The Bijie landslide dataset has different scales of targets, and some types of landslides are occluded by trees. Therefore, the accuracy of landslide location needs to be accurately expressed. We improved the model’s expression of the deviation between the predicted values and the true values by introducing NWD, and based on this, selected four evaluation metrics to fully measure the performance of the model: precision, recall, average precision mAP50, and mAP50–95. Precision, recall, and F1-score are calculated using the following formula:
P = T P T P + F P
R = T P T P + F N
F 1 = 2 P R P + R
where TP is the number of correct objects detected. FP is the number of incorrectly detected objects. FN is the number for missing the actual landslides. The AP value is the area enclosed by the P-R curve, which is calculated as follows:
A P = 0 1 P d R
where P is precision and R is recall.
mAP is the weighted average of the average accuracy AP for all classes including mAP@50 and mAP@50–95 and represents the mAP calculated for IoU threshold of 0.5 and the average mAP calculated for IoU threshold of 0.5 to 0.95, with 0.05 as the step size. The mAP is calculated using the following formula:
m A P = i = 1 M A P M
where M is the number of classes.

4. Results

In this section, we verify the feasibility of our approach based on specific research areas. In Section 4.1, we described the relevant settings we used in our experiment. In Section 4.2, we verify the feasibility of the proposed approach. In Section 4.3, we perform ablation experiments to prove the connection between the various modules in MSTA-YOLO. In Section 4.4, we detail the performance of MSTA-YOLO in detecting landslides in difficult areas.

4.1. Experimental Setup

To ensure the reliability of the experiment, we maintained a consistent hardware and software configuration across all experiments. The hardware configuration includes a 12th Gen Intel(R) Core(TM) i7-12700H CPU, 32 GB of RAM and a Windows operating system. The batch size is set to 1, with each training session running for 200 epochs. The learning rate is set to 0.01, and the number of workers is set to 8. Due to the small sample size of the Luding landslide dataset, in order to prevent overfitting, our model sets the batch size to 8 when training the Luding landslide dataset.

4.2. Accuracy Verification of MSTA-YOLO on Bijie Landslide Dataset

As shown in Table 1, the proposed MSTA-YOLO has the best comprehensive performance. Specifically, in terms of precision, our method improved by 6.1% compared to the original YOLOv11. Although our method was lower than the 96.17% of LA-YOLO-LLL model in precision, our method took into account the precision and recall rates of F1 and mAP50 parameters which are 3.17% and 3.7% higher than the LA-YOLO-LLL model, respectively. In terms of recall rate, our method outperformed the second best performing YOLOv8 by 3.4%, up to 99.5%, which is significantly higher than all other models. Moreover, our mAP50 reached 99.1%, 3.4%, and 3% higher than YOLOv8 and YOLOv11, respectively, and mAP@50–95 was 3.2% and 3.8% higher than YOLOv8 and YOLOv11, respectively. At the same time, our method was still 3.1% higher in F1 scores than the existing best-performing model proposed by Jiang et al.
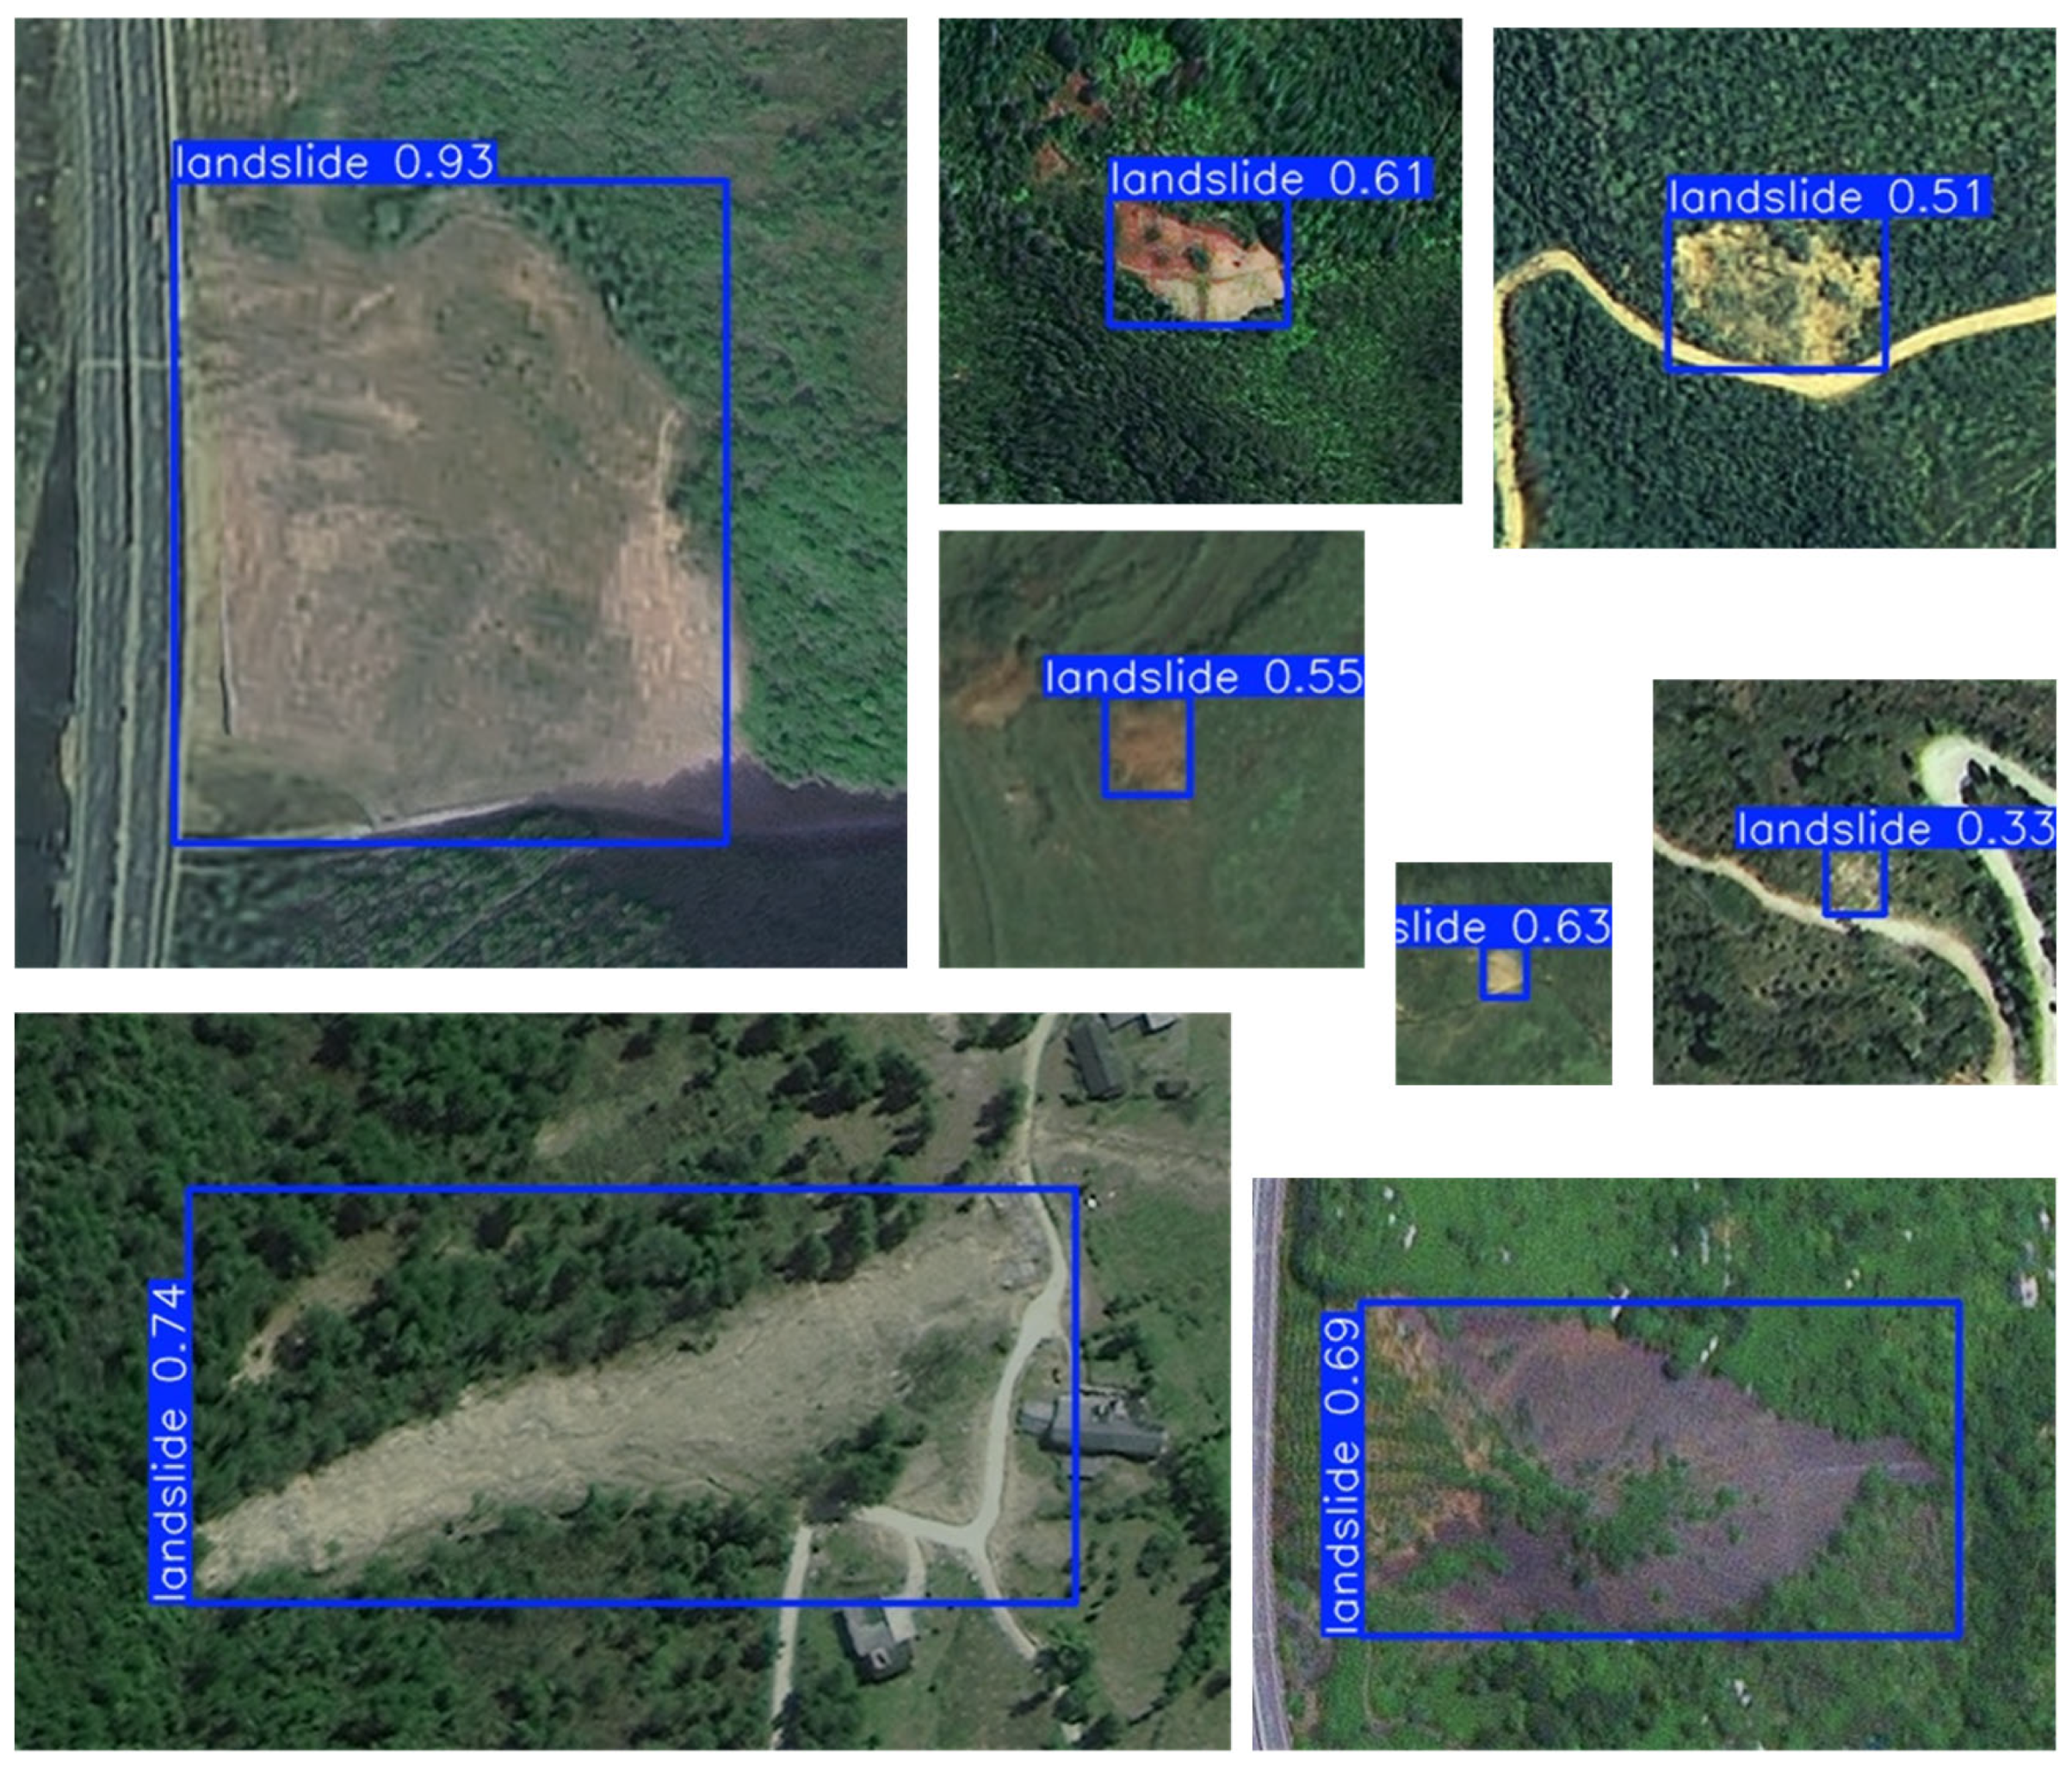
In Figure 9, we can see that MSTA-YOLO has good stability in performance against a variety of challenging types of landslide images. First, we defined targets smaller than 32 pixels by 32 pixels as small targets, which are difficult for the model to learn due to the limited features; however, these targets are still accurately and stably detected by our method. Secondly, the shape and size of the object were different, and there may even have been some very small, very large or extreme shapes (such as slender, narrow, and tall, etc.) of the object, which bring great difficulties to the accurate identification and accurate positioning of the target. Our model still showed excellent stability in this type of detection. Finally, due to the influence of vegetation occlusion, surface differentiation, and other factors, the boundary between some targets and the background was not clear, and the overall feature expression of the targets very weak, which often readily causes missed detection and misdetection of the model. However, our method still performed well under such circumstances.

4.3. Ablation Experiment

In order to fully analyze the effectiveness of the above strategies, we conducted ablation experiments on the Bijie landslide dataset and selected YOLOv11 as the baseline. The experimental results are shown in Table 2.
Adding RFA to the neck of YOLOv11 increases the average accuracy of mAP50 and mAP50–95 by 0.9% and 1%, respectively. This proves that the designed RFA effectively improves the performance of YOLOv11 in landslide detection on the basis of the original.
As shown in Table 2, although the performance of the model decreases to a certain extent when the C2PSA block is added separately compared to YOLOv11, the performance of the model is greatly improved when RFA or NWD is added separately again. Specifically, when the model without C2PSA module is added with RFA, compared with the model with only RFA, the average accuracy of mAP50 and mAP@50–95 is improved by 1% and 3.8%, respectively, and compared with YOLOv11, the average accuracy is improved by 1.9% and 4.8%, respectively. If NWD is introduced alone, the model performance will slightly decrease compared with YOLOv11. However, when the C2PSA block is removed, the model performance is improved compared with YOLOv11, and the average accuracies of mAP50 and mAP@50–95 are improved by 2.1% and 2.2%, respectively. If RFA is further introduced, the comprehensive performance of the model will achieve the optimum. In general, by removing redundant modules and removing C2PSA blocks, the performance of the model can be effectively released, while NWD can have a positive effect.
Ablation experiments show that the proposed RFA and the introduced NWD can optimize the performance of the model, and the redundant modules removed also have positive significance.

4.4. Performance Test Based on the Luding Landslide Dataset

Compared with mAP50, this experiment mainly referred to the more rigorous mAP@50–95 metric. As shown in Table 3, compared with other models, the MSTA-YOLO we proposed has outstanding comprehensive performance. Specifically, in the precision parameter, although the 89.7% and 92.1% of YOLOv9 and YOLOv11, respectively, are higher than our 86%, their poor recall leads to the performance of YOLOv9 and YOLOv11 not being sufficiently satisfactory. In terms of F1 scores, MSTA-YOLO was 2.5% and 8.5% higher than YOLOv9 and YOLOv11, respectively. This indicates that during training, YOLOv9 and YOLOv11 often tend to miss many targets that must be detected in order to improve accuracy. Although YOLOv10 strikes a good balance between precision and recall, its various performances are not outstanding, and it still fails to meet the application requirements. The MSTA-YOLO we proposed strikes a good balance between precision and recall. Therefore, in mAP@50–95, our method outperformed YOLOv9 by 6.2%, YOLOv10 by 10.6%, and YOLOv11 by 18.2%, respectively. Meanwhile, it can also be seen from the simple ablation experiments based on Luding landslide dataset in Table 4 that the module we proposed can effectively improve the performance of the model.
To visually demonstrate the advantages of our approach, we present the performance of three of the best-performing models in the Luding landslide dataset. In Figure 10a, due to the overly long and narrow shape of the target, YOLOv11 missed the target in the image. In Figure 10b, the three models have deviated from the real labels to varying degrees, respectively. Specifically, YOLOv9 accurately identified individual landslides in the images. YOLOv11 not only missed a large number of landslide targets but also failed to precisely locate the identified targets. The performance of MSTA-YOLO was completely better than these. In Figure 10c, the ability of the three models to precisely locate the target is further demonstrated. In Figure 10d,e, we find that when facing landslide targets with relatively complex optical features, YOLOv9 cannot define well the boundary of the landslide, while YOLOv11 cannot determine whether there is a single landslide or multiple landslides in this area. It can be seen from Figure 10f that MSTA-YOLO can better define the boundary of the landslide. Overall, MSTA-YOLO has sufficient capabilities to deal with the rapid detection of newly formed landslides in specific areas.

4.5. Verification of Difficult Areas Based on the Southwest Landslide Dataset

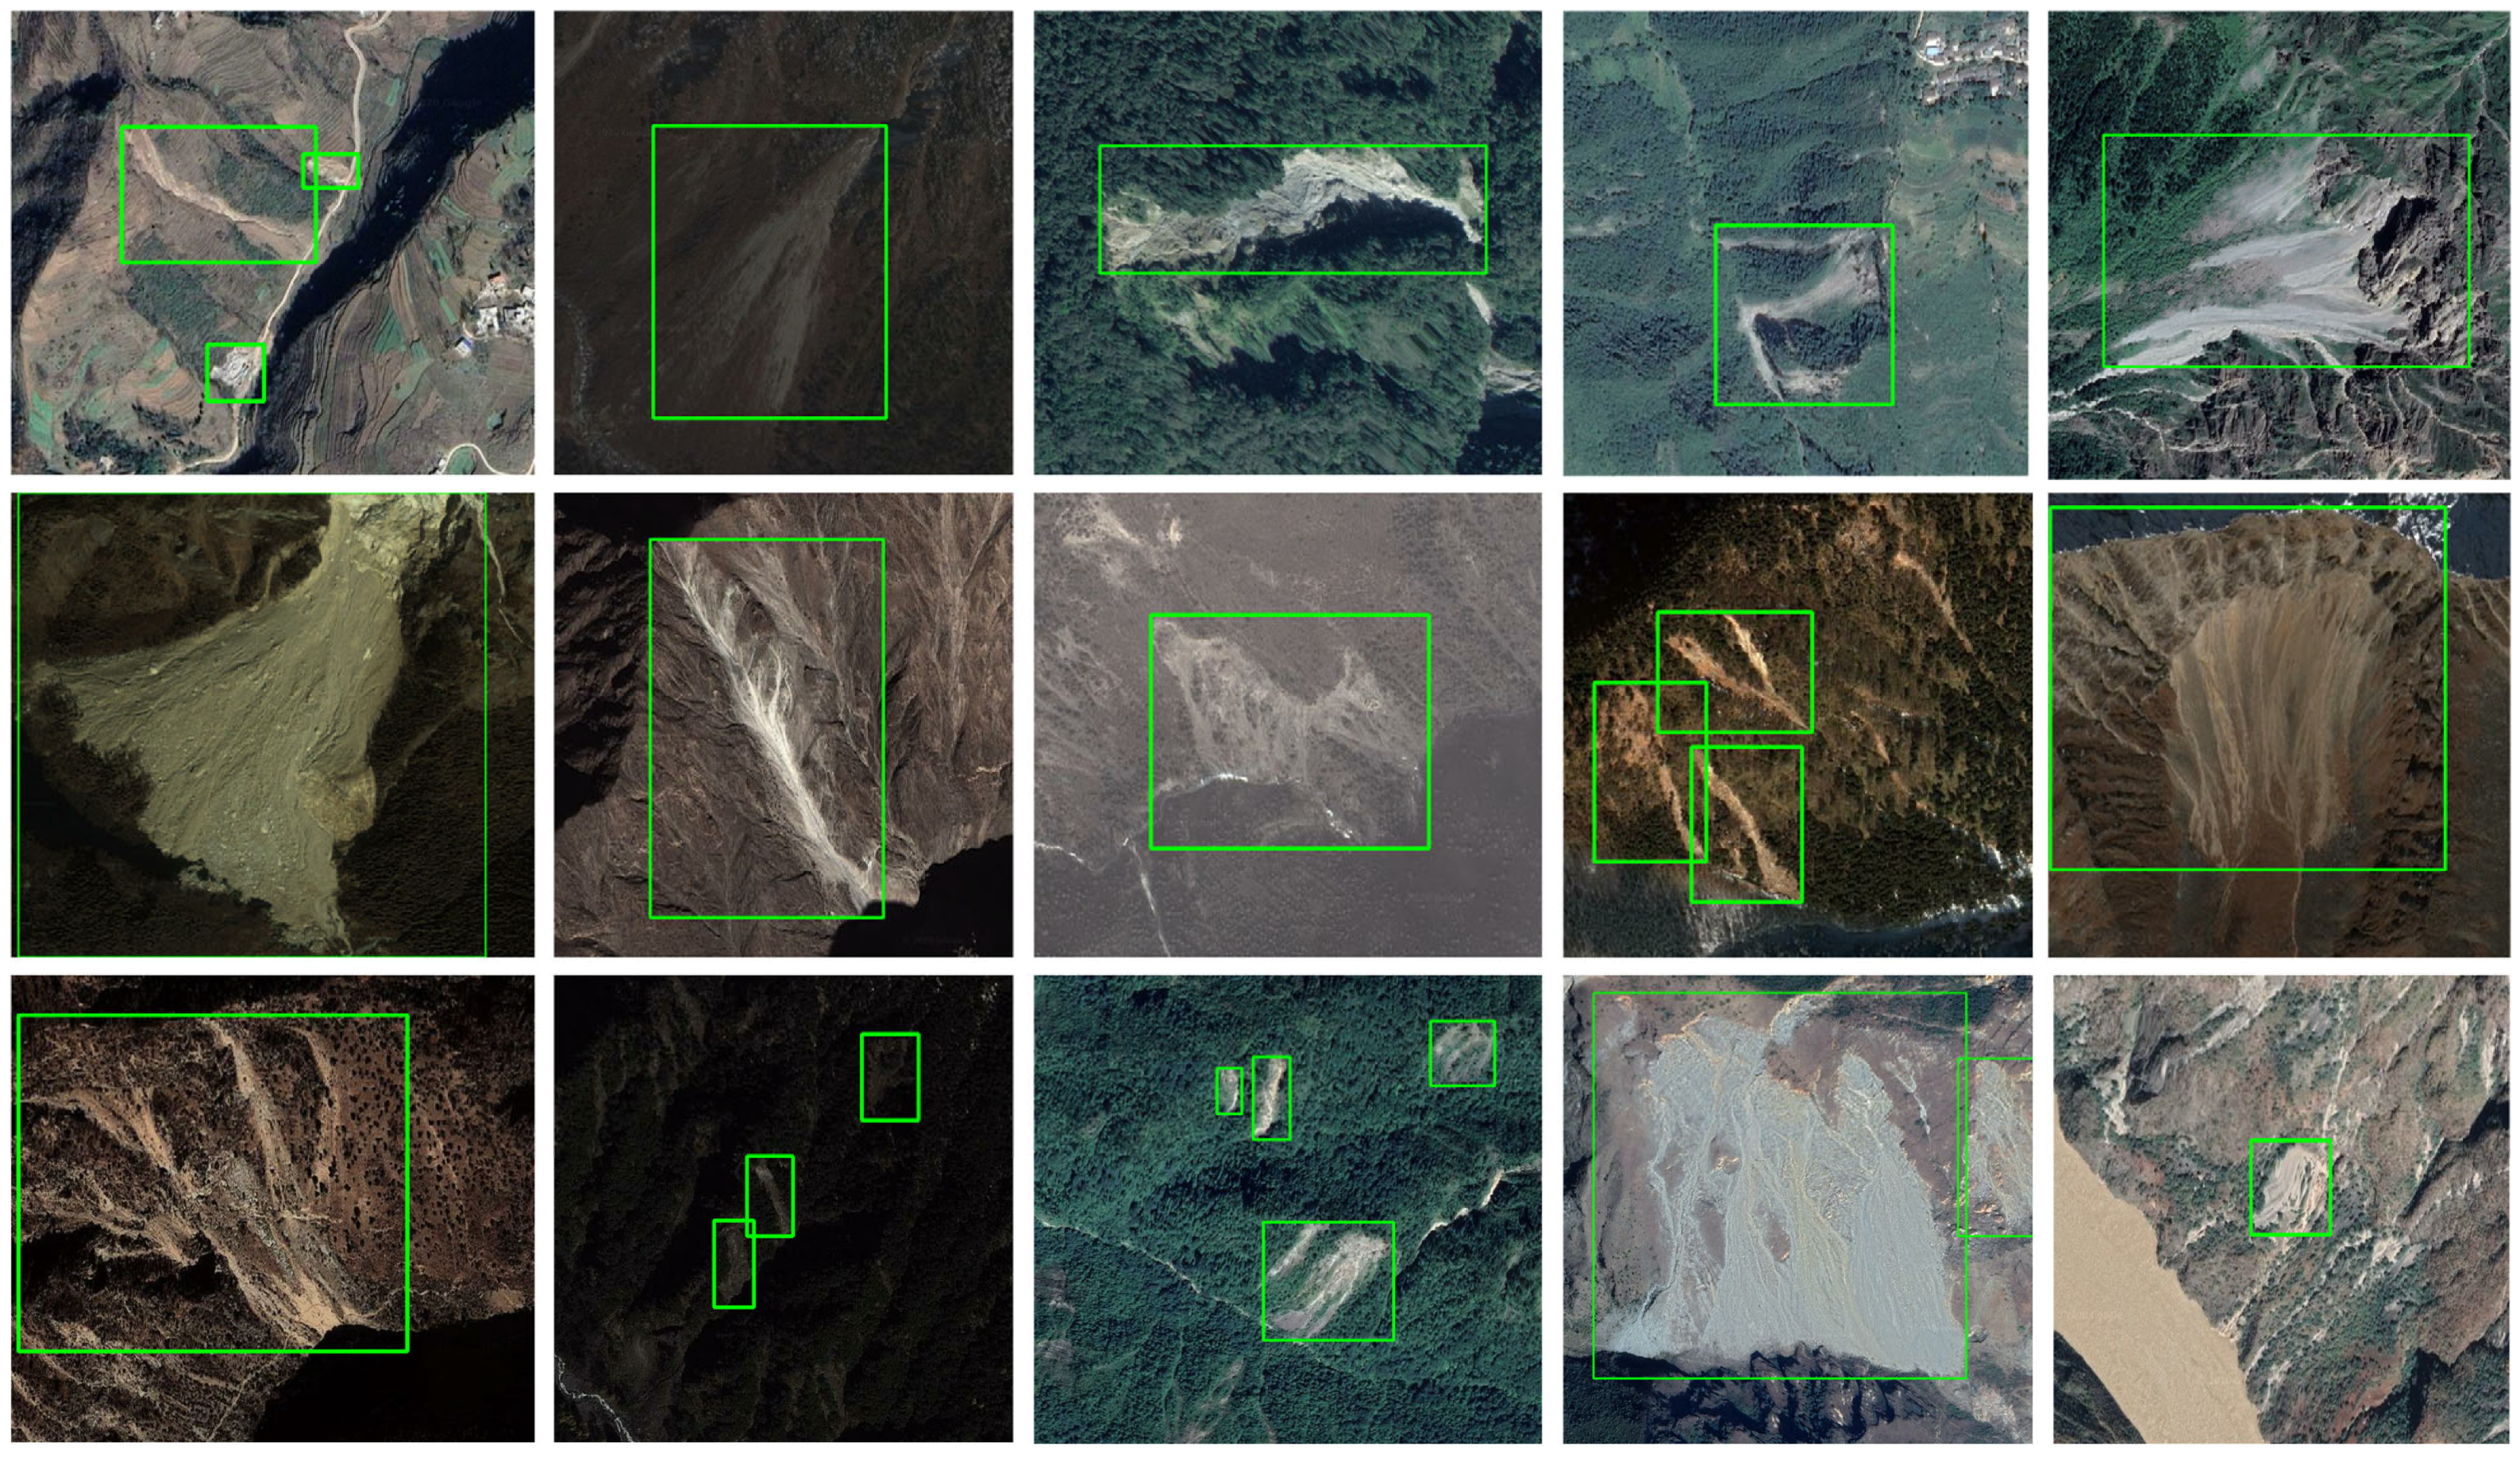
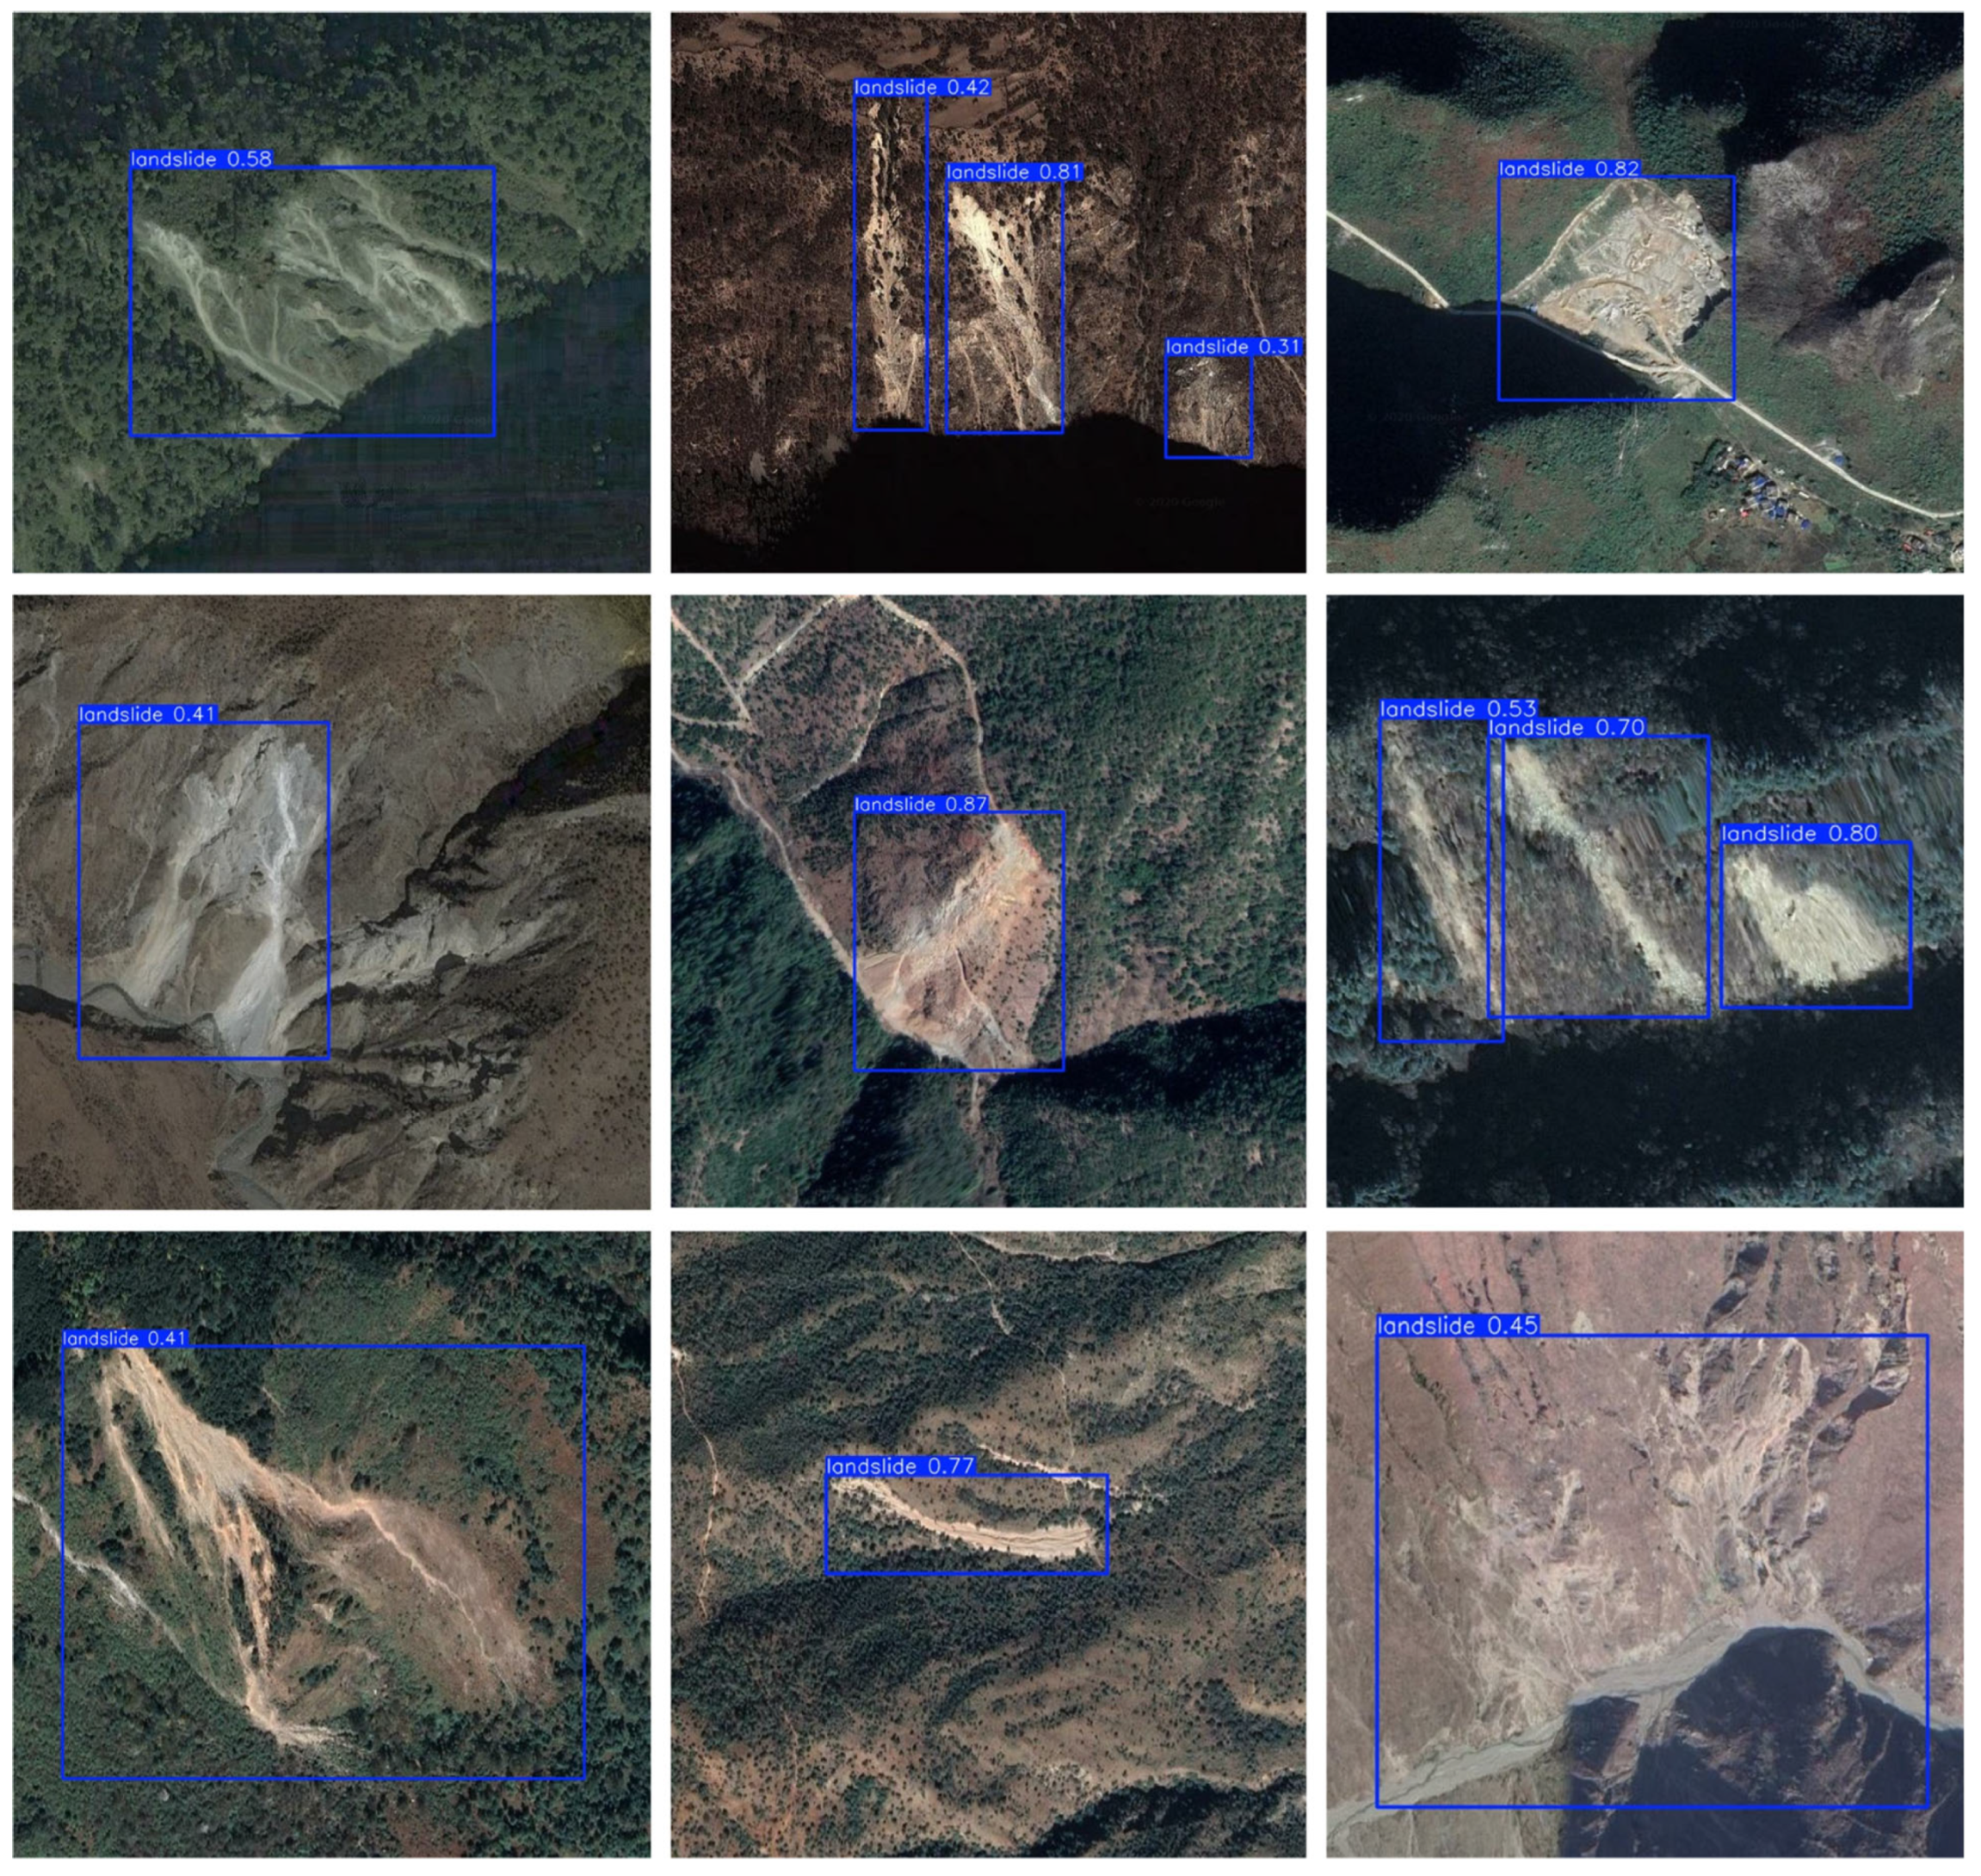
In this section, we mainly demonstrate the improvement effect of the modules we designed and introduced on the learning ability in difficult areas. Due to the significant differences between the Southwest landslide dataset and the two datasets in the previous experimental section, we adopted a transfer learning strategy to fine-tune the model on this dataset. MSTA-YOLO utilizes the weights pre-trained on the Bijie landslide dataset as the initial model and fine-tunes the parameters on the Southwest landslide dataset. The Southwest landslide dataset is randomly divided into training, validation, and test sets in a ratio of 8:1:1. The number of training iterations is set to 100, with a batch size of 8, and the remaining hyperparameters remain consistent with the training configuration of the Bijie landslide dataset. The test results of the fine-tuned MSTA-YOLO model on the Southwest landslide dataset are presented in Figure 11.
As shown in Figure 11, the performance of MSTA-YOLO is very stable when faced with multi-scale landslide targets with different optical characteristics. However, in the face of individual landslide targets with blurred boundaries, the accurate positioning of MSTA-YOLO is challenged. In order to accurately evaluate its advancements compared to traditional methods, we compared MSTA-YOLO with its corresponding YOLOv11. The comparison results are shown in Table 5.
Overall, MSTA-YOLO has a stronger transfer learning ability and a stronger ability to extract complex features, which is conducive to the accurate identification of landslides in difficult areas. Specifically, MSTA-YOLO outperformed YOLOv11 on the mAP@50–95 metric by as much as 4%. Among other accuracy indicators, MSTA-YOLO had an equally excellent performance. Meanwhile, we introduced GFLOPs and FPS to measure the complexity and detection speed of the model. GFLOPs represent the number of floating-point operations required for one forward inference (unit: 109 times). FPS represents the number of image frames that the model can process per second. Experiments prove that the model we proposed, compared with the original YOLOv11, only slightly increases the model complexity while ensuring a significant improvement in accuracy, and it has no obvious impact on the real-time performance of model checking.

5. Discussion

In the actual detection of landslides, the optical characteristics of landslide samples are complex, and the acquisition of landslide samples is difficult. This makes it very complex for the existing methods to achieve precise detection in specific areas. This paper proposes the MSTA-YOLO model. First, it took the Bijie landslide dataset as the baseline and proved that its performance had reached the best level among existing models. Second, we verified the practicability of MSTA-YOLO based on the Luding landslide dataset. Finally, based on the Southwest landslide dataset, we verified that our method can achieve stronger detection capabilities in some difficult areas through transfer learning. The experimental results not only demonstrate the superiority of our method, but also show that when a sudden landslide disaster occurs in a specific area, even if the local landslide samples are limited and the optical characteristics of the samples are complex, MSTA-YOLO can still achieve precise detection of landslides.
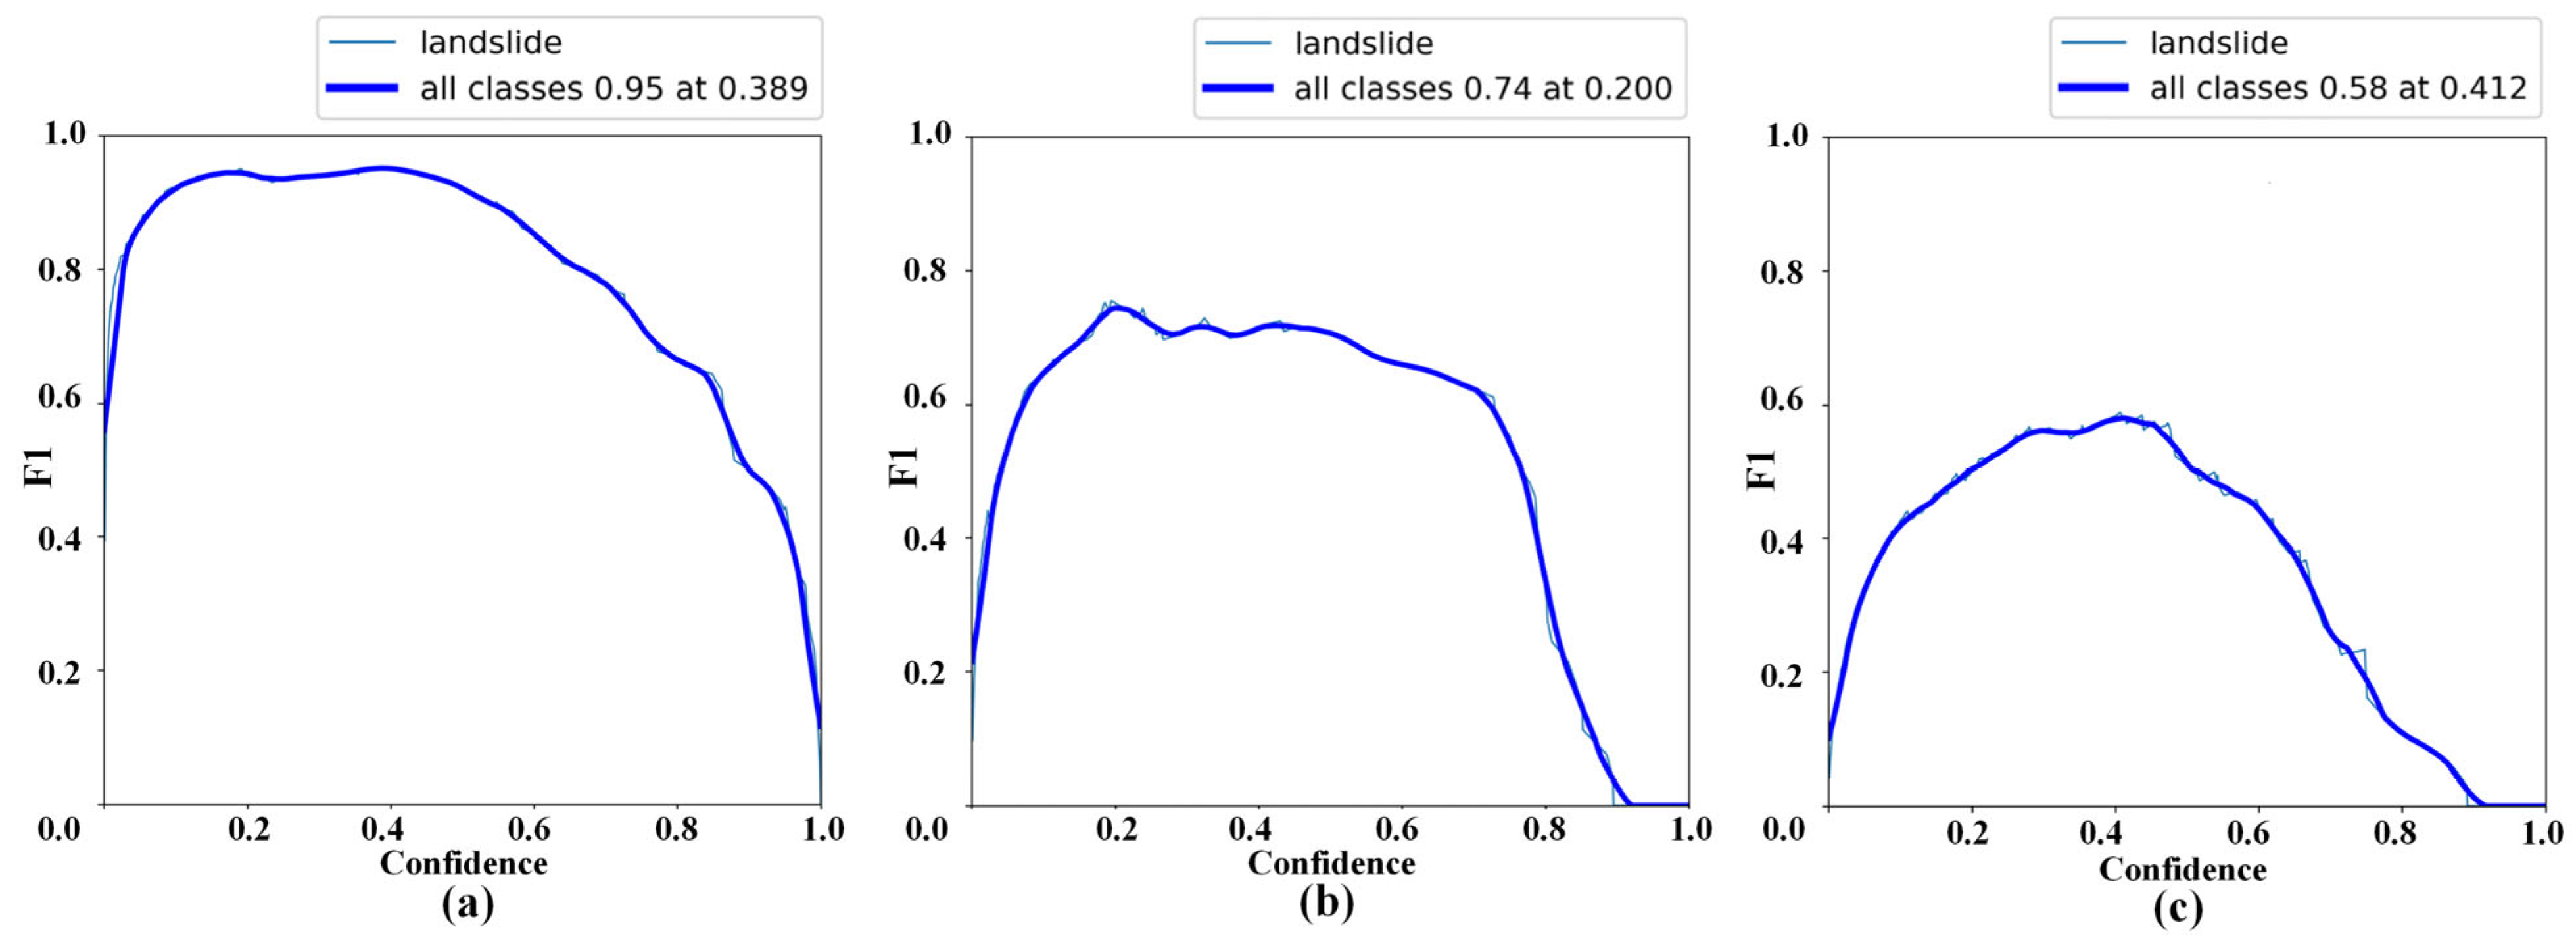
The F1-confidence curve in Figure 12 shows the performance of MSTA-YOLO during training under different confidence thresholds in different datasets: In the Bijie landslide dataset, when the threshold is set to 0.389, the F1 score will reach the highest of 0.95. In the Luding landslide dataset, the F1 score of the model reaches the best when the threshold is 0.20. When the threshold of the model was set at 0.412, the F1 score reached the highest of 0.58 in the Southwest landslide dataset. This surface model is more strategically inclined towards a higher recall rate to ensure the detection of potential landslide risks. In subsequent tests, using the corresponding optimal threshold can achieve a good balance between accuracy and recall, thereby enhancing the overall ability of the model to detect landslide targets.
As shown in Table 5, in this paper, RFA is used to replace the traditional C2PSA of YOLOv11. While ensuring the improvement of model performance, it does not bring excessive computational costs. This inexpensive design means that this block has broad application prospects. Meanwhile, experiments proved that the design based on the receptive fields has broad potential in landslide detection. NWD enhanced the model’s performance in detecting landslides, demonstrating that small-sized landslides play a significant role in landslide detection. In future work, we will continue to develop blocks with more outstanding performance based on receptive fields and will propose lightweight models with better performance.

6. Conclusions

In order to realize the accurate detection of multi-scale landslides under complex conditions, we propose the MSTA-YOLO landslide detection model. By designing RFA and introducing NWD loss function, the structure of the model was reconstructed, which made the model more suitable for accurate landslide detection in local low resolution remote sensing images. This study conducted experiments using the landslide datasets of Bijie City, Guizhou Province and Luding County, Sichuan Province. Experimental results showed that MSTA-YOLO had a better performance than other single-stage rapid detection models, and could meet the task requirements of accurately identifying landslides in local low-resolution three-channel remote sensing images. Meanwhile, based on transfer learning of the Southwest landslide dataset, we demonstrated that MSTA-YOLO can effectively learn and extract landslides with multiple characteristics in difficult areas, which indirectly proved the feasibility of the module we designed and the recommended method.

Author Contributions

Conceptualization, B.W. and J.X.; methodology, B.W. and J.S.; validation, B.W., Y.C., H.C. and H.S.; formal analysis, Y.Y.; investigation, B.W. and Y.C.; resources, J.X.; data curation, B.W.; writing—original draft preparation, B.W., H.L. and C.C.; writing—review editing, J.X.; visualization, B.W.; supervision, J.X. and J.S.; project administration, J.X.; funding acquisition, J.X. and H.S. All authors have read and agreed to the published version of the manuscript.

Funding

This work was supported in part by the National Key R&D Program of China (2023YFC3008300, 2023YFC3008304, and 2022YFC3004302); in part by Major Program of the National Natural Science Foundation of China (41941019); in part by National Natural Science Foundation of China (42371356, 42171348, 41929001); in part by the Shaanxi Province Science and Technology Innovation Team (2021TD-51), the Shaanxi Province Geoscience Big Data and Geohazard Prevention Innovation Team (2022); in part by the Fundamental Research Funds for the Central Universities (300102262202, 300102260301/087, 300102264915, 300102260404/087, 300102262902, 300102269103, 300102269304, 300102269205, 300102262712); in part by the Northwest Engineering Corporation Limited Major Science and Technology Projects (XBY-YBKJ-2023-23); in part by The Key Scientific and Technological Project of Power China Corporation (KJ-2023-022).

Data Availability Statement

The original data presented in the study are openly available in the Bijie landslide dataset at https://gpcv.whu.edu.cn/data/Bijie_pages.html, accessed on 3 January 2025. The Luding landslide dataset can be obtained from China resources satellite data with application center, https://www.cresda.com/zgzywxyyzx/index.html, accessed on 1 November 2024. The original data presented in the study are openly available in Southwest landslide dataset at https://github.com/YhQIAO/LandSlide_Detection_Faster-RCNN, accessed on 3 March 2025.

Conflicts of Interest

Author Haixing Shang was employed by the company Northwest Engineering Corporation Limited. The remaining authors declare that the research was conducted in the absence of any commercial or financial relationships that could be construed as a potential conflict of interest.

References

  1. Jiao, L.; Zhang, F.; Liu, F.; Yang, S.; Li, L.; Feng, Z.; Qu, R. A survey of deep learning-based object detection. IEEE Access 2019, 7, 128837–128868. [Google Scholar] [CrossRef]
  2. Dalal, N.; Triggs, B. Histograms of oriented gradients for human detection. In Proceedings of the 2005 IEEE Computer Society Conference on Computer Vision and Pattern Recognition (CVPR’05), San Diego, CA, USA, 20–25 June 2005; IEEE: Piscataway, NJ, USA, 2005; Volume 1, pp. 886–893. [Google Scholar]
  3. Haque, U.; Da Silva, P.F.; Devoli, G.; Pilz, J.; Zhao, B.; Khaloua, A.; Wilopo, W.; Andersen, P.; Lu, P.; Glass, G.E.; et al. The human cost of global warming: Deadly landslides and their triggers (1995–2014). Sci. Total Environ. 2019, 682, 673–684. [Google Scholar] [CrossRef] [PubMed]
  4. Tian, Y.; Xu, C.; Ma, S.; Xu, X.; Wang, S.; Zhang, H. Inventory and spatial distribution of landslides triggered by the 8th August 2017 MW 6.5 Jiuzhaigou earthquake, China. J. Earth Sci. 2019, 30, 206–217. [Google Scholar] [CrossRef]
  5. Gorum, T.; Korup, O.; van Westen, C.J.; van der Meijde, M.; Xu, C.; van der Meer, F.D. Why so few? Landslides triggered by the 2002 Denali earthquake, Alaska. Quat. Sci. Rev. 2014, 95, 80–94. [Google Scholar] [CrossRef]
  6. Qu, F.; Qiu, H.; Sun, H.; Tang, M. Post-failure landslide change detection and analysis using optical satellite Sentinel-2 images. Landslides 2021, 18, 447–455. [Google Scholar] [CrossRef]
  7. Qiu, W.; Gu, L.; Gao, F.; Jiang, T. Building extraction from very high-resolution remote sensing images using refine-UNet. IEEE Geosci. Remote Sens. Lett. 2023, 20, 6002905. [Google Scholar] [CrossRef]
  8. Xing, Y.; Han, G.; Mao, H.; He, H.; Bo, Z.; Gong, R.; Ma, X.; Gong, W. MAM-YOLOv9: A Multi-Attention Mechanism Network for Methane Emission Facility Detection in High-Resolution Satellite Remote Sensing Images. IEEE Trans. Geosci. Remote Sens. 2025, 63, 5614516. [Google Scholar] [CrossRef]
  9. Chen, X.; Zhao, C.; Lu, Z.; Xi, J. Landslide Inventory Mapping Based on Independent Component Analysis and UNet3+: A Case of Jiuzhaigou, China. IEEE J. Sel. Top. Appl. Earth Obs. Remote Sens. 2023, 17, 2213–2223. [Google Scholar] [CrossRef]
  10. Chen, X.; Zhao, C.; Liu, X.; Zhang, S.; Xi, J.; Khan, B.A. An Embedding Swin Transformer Model for Automatic Slow-moving Landslides Detection based on InSAR Products. IEEE Trans. Geosci. Remote Sens. 2024, 62, 5223915. [Google Scholar] [CrossRef]
  11. Zhang, X.; Zhang, B.; Yu, W.; Kang, X. Federated deep learning with prototype matching for object extraction from very-high-resolution remote sensing images. IEEE Trans. Geosci. Remote Sens. 2023, 61, 5603316. [Google Scholar] [CrossRef]
  12. Wang, B.; Liu, Z.; Xi, J.; Gao, S.; Cong, M.; Shang, H. Detection of Greenhouse and Typical Rural Buildings with Efficient Weighted YOLOv8 in Hebei Province, China. Remote Sens. 2025, 17, 1883. [Google Scholar] [CrossRef]
  13. Li, X.; Chen, P.; Yang, J.; An, W.; Zheng, G.; Luo, D.; Lu, A. Ship Target Search in Multi-Source Visible Remote Sensing Images Based on Two-Branch Deep Learning. IEEE Geosci. Remote Sens. Lett. 2024, 51, 5003205. [Google Scholar]
  14. Cai, H.; Chen, T.; Niu, R.; Plaza, A. Landslide detection using densely connected convolutional networks and environmental conditions. IEEE J. Sel. Top. Appl. Earth Obs. Remote Sens. 2021, 14, 5235–5247. [Google Scholar] [CrossRef]
  15. Wang, L.; Lei, H.; Jian, W.; Wang, W.; Wang, H.; Wei, N. Enhancing Landslide Detection: A Novel LA-YOLO Model for Rainfall-Induced Shallow Landslides. IEEE Geosci. Remote Sens. Lett. 2025, 22, 6004905. [Google Scholar] [CrossRef]
  16. Chen, X.; Liu, C.; Wang, S.; Deng, X. LSI-YOLOv8: An improved rapid and high accuracy landslide identification model based on YOLOv8 from remote sensing images. IEEE Access 2024, 12, 97739–97751. [Google Scholar] [CrossRef]
  17. Lv, Z.; Yang, T.; Lei, T.; Zhou, W.; Zhang, Z.; You, Z. Spatial-spectral similarity based on adaptive region for landslide inventory mapping with remote sensed images. IEEE Trans. Geosci. Remote Sens. 2024, 62, 4405111. [Google Scholar] [CrossRef]
  18. Chen, Y.; Ming, D.; Yu, J.; Xu, L.; Ma, Y.; Li, Y.; Ling, X.; Zhu, Y. Susceptibility-guided landslide detection using fully convolutional neural network. IEEE J. Sel. Top. Appl. Earth Obs. Remote Sens. 2022, 16, 998–1018. [Google Scholar] [CrossRef]
  19. Zhang, W.; Liu, Z.; Zhou, S.; Qi, W.; Wu, X.; Zhang, T.; Han, L. LS-YOLO: A novel model for detecting multiscale landslides with remote sensing images. IEEE J. Sel. Top. Appl. Earth Obs. Remote Sens. 2024, 17, 4952–4965. [Google Scholar] [CrossRef]
  20. Gao, M.; Chen, F.; Wang, L.; Zhao, H.; Yu, B. Swin Transformer-based Multi-scale Attention Model for Landslide Extraction from Large-scale Area. IEEE Trans. Geosci. Remote Sens. 2024, 62, 4415314. [Google Scholar] [CrossRef]
  21. Dong, A.; Dou, J.; Li, C.; Chen, Z.; Ji, J.; Xing, K.; Zhang, J.; Daud, H. Accelerating cross-scene co-seismic landslide detection through progressive transfer learning and lightweight deep learning strategies. IEEE Trans. Geosci. Remote Sens. 2024, 62, 4410213. [Google Scholar] [CrossRef]
  22. Huang, Y.; Zhang, J.; He, H.; Jia, Y.; Chen, R.; Ge, Y.; Ming, Z.; Zhang, L.; Li, H. MAST: An earthquake-triggered landslides extraction method combining morphological analysis edge recognition with swin-transformer deep learning model. IEEE J. Sel. Top. Appl. Earth Obs. Remote Sens. 2023, 17, 2586–2595. [Google Scholar] [CrossRef]
  23. Xu, G.; Wang, Y.; Wang, L.; Soares, L.P.; Grohmann, C.H. Feature-based constraint deep CNN method for mapping rainfall-induced landslides in remote regions with mountainous terrain: An application to Brazil. IEEE J. Sel. Top. Appl. Earth Obs. Remote Sens. 2022, 15, 2644–2659. [Google Scholar] [CrossRef]
  24. Zhao, Z.; Chen, T.; Dou, J.; Liu, G.; Plaza, A. Landslide susceptibility mapping considering landslide local-global features based on CNN and transformer. IEEE J. Sel. Top. Appl. Earth Obs. Remote Sens. 2024, 17, 7475–7489. [Google Scholar] [CrossRef]
  25. Gao, S.; Xi, J.; Li, Z.; Ge, D.; Guo, Z.; Yu, J.; Wu, Q.; Zhao, Z.; Xu, J. Optimal and multi-view strategic hybrid deep learning for old landslide detection in the loess plateau, Northwest China. Remote Sens. 2024, 16, 1362. [Google Scholar] [CrossRef]
  26. Chen, T.; Wang, Q.; Zhao, Z.; Liu, G.; Dou, J.; Plaza, A. LCFSTE: Landslide conditioning factors and swin transformer ensemble for landslide susceptibility assessment. IEEE J. Sel. Top. Appl. Earth Obs. Remote Sens. 2024, 17, 6444–6454. [Google Scholar] [CrossRef]
  27. Hu, J.; Shen, L.; Sun, G. Squeeze-and-excitation networks. In Proceedings of the IEEE Conference on Computer Vision and Pattern Recognition, Salt Lake City, UT, USA, 13–28 June 2018; pp. 7132–7141. [Google Scholar]
  28. Woo, S.; Park, J.; Lee, J.Y.; Kweon, I.S. Cbam: Convolutional block attention module. In Proceedings of the European Conference on Computer Vision (ECCV), Munich, Germany, 8–14 September 2018; pp. 3–19. [Google Scholar]
  29. Chen, B.; Huang, Y.; Xia, Q.; Zhang, Q. Nonlocal spatial attention module for image classification. Int. J. Adv. Robot. Syst. 2020, 17, 1729881420938927. [Google Scholar] [CrossRef]
  30. Misra, D.; Nalamada, T.; Arasanipalai, A.U.; Hou, Q. Rotate to attend: Convolutional triplet attention module. In Proceedings of the IEEE/CVF Winter Conference on Applications of Computer Vision, Online, 5–9 January 2021; pp. 3139–3148. [Google Scholar]
  31. Chen, X.; Wang, X.; Zhou, J.; Qiao, Y.; Dong, C. Activating more pixels in image super-resolution transformer. In Proceedings of the IEEE/CVF Conference on Computer Vision and Pattern Recognition, Vancouver, BC, Canada, 17–24 June 2023; pp. 22367–22377. [Google Scholar]
  32. Han, D.; Ye, T.; Han, Y.; Xia, Z.; Pan, S.; Wan, P.; Song, S.; Huang, G. Agent attention: On the integration of softmax and linear attention. In Proceedings of the European Conference on Computer Vision, Milan, Italy, 29 September–4 October 2024; Springer Nature: Cham, Switzerland, 2024; pp. 124–140. [Google Scholar]
  33. Li, Y.; Li, X.; Yang, J. Spatial group-wise enhance: Enhancing semantic feature learning in cnn. In Proceedings of the Asian Conference on Computer Vision, Macao, China, 4–8 December 2022; pp. 687–702. [Google Scholar]
  34. Xiao, Y.; Xu, T.; Yu, X.; Fang, Y.; Li, J. A Lightweight Fusion Strategy with Enhanced Inter-layer Feature Correlation for Small Object Detection. IEEE Trans. Geosci. Remote Sens. 2024, 62, 4708011. [Google Scholar] [CrossRef]
  35. Lou, M.; Zhang, S.; Zhou, H.Y.; Yang, S.; Wu, C.; Yu, Y. TransXNet: Learning both global and local dynamics with a dual dynamic token mixer for visual recognition. IEEE Trans. Neural Netw. Learn. Syst. 2025, 36, 11534–11547. [Google Scholar] [CrossRef]
  36. Li, M.; Huang, H.; Huang, K. FCAnet: A novel feature fusion approach to EEG emotion recognition based on cross-attention networks. Neurocomputing 2025, 638, 130102. [Google Scholar] [CrossRef]
  37. Wang, Q.; Wu, B.; Zhu, P.; Li, P.; Zuo, W.; Hu, Q. ECA-Net: Efficient channel attention for deep convolutional neural networks. In Proceedings of the IEEE/CVF Conference on Computer Vision and Pattern Recognition, Seattle, WA, USA, 13–19 June 2020; pp. 11534–11542. [Google Scholar]
  38. Liu, S.; Huang, D. Receptive field block net for accurate and fast object detection. In Proceedings of the European Conference on Computer Vision (ECCV), Munich, Germany, 8–14 September 2018; pp. 385–400. [Google Scholar]
  39. Wang, J.; Xu, C.; Yang, W.; Yu, L. A normalized Gaussian Wasserstein distance for tiny object detection. arXiv 2021, arXiv:2110.13389. [Google Scholar]
  40. Ji, S.; Yu, D.; Shen, C.; Li, W.; Xu, Q. Landslide detection from an open satellite imagery and digital elevation model dataset using attention boosted convolutional neural networks. Landslides 2020, 17, 1337–1352. [Google Scholar] [CrossRef]
  41. Li, Y.; Wu, Z.; Wu, J.; Zhang, R.; Xu, X.; Zhou, Y. DBSANet: A Dual-Branch Semantic Aggregation Network Integrating CNNs and Transformers for Landslide Detection in Remote Sensing Images. Remote Sens. 2025, 17, 807. [Google Scholar] [CrossRef]
  42. Peng, H.; Yu, S. A systematic IOU-related method: Beyond simplified regression for better localization. IEEE Trans. Image Process 2021, 30, 5032–5044. [Google Scholar] [CrossRef] [PubMed]
  43. Rezatofighi, H.; Tsoi, N.; Gwak, J.; Sadeghian, A.; Reid, I.; Savarese, S. Generalized intersection over union: A metric and a loss for bounding box regression. In Proceedings of the IEEE/CVF Conference on Computer Vision and Pattern Recognition, Long Beach, CA, USA, 15–20 June 2019; pp. 658–666. [Google Scholar]
  44. Zheng, Z.; Wang, P.; Liu, W.; Li, J.; Ye, R.; Ren, D. Distance-IoU loss: Faster and better learning for bounding box regression. In Proceedings of the AAAI Conference on Artificial Intelligence, New York, NY, USA, 7–12 February 2020; Volume 34, pp. 12993–13000. [Google Scholar]
  45. Zhang, Y.F.; Ren, W.; Zhang, Z.; Jia, Z.; Wang, L.; Tan, T. Focal and efficient IOU loss for accurate bounding box regression. Neurocomputing 2022, 506, 146–157. [Google Scholar] [CrossRef]
  46. Loss, G.Z.S. More powerful learning for bounding box regression. arXiv 2022, arXiv:2205.12740. [Google Scholar]
  47. Zhang, R.X.; Zhu, W.; Li, Z.H.; Zhang, B.C.; Chen, B. Re-net: Multibranch network with structural reparameterization for landslide detection in optical imagery. IEEE J. Sel. Top. Appl. Earth Obs. Remote Sens. 2023, 17, 2828–2837. [Google Scholar] [CrossRef]
  48. Xiang, X.; Gong, W.; Li, S.; Chen, J.; Ren, T. TCNet: Multiscale fusion of transformer and CNN for semantic segmentation of remote sensing images. IEEE J. Sel. Top. Appl. Earth Obs. Remote Sens. 2024, 17, 3123–3136. [Google Scholar] [CrossRef]
  49. Lv, P.; Ma, L.; Li, Q.; Du, F. ShapeFormer: A shape-enhanced vision transformer model for optical remote sensing image landslide detection. IEEE J. Sel. Top. Appl. Earth Obs. Remote Sens. 2023, 16, 2681–2689. [Google Scholar] [CrossRef]
  50. Du, Y.; Xu, X.; He, X. Optimizing geo-hazard response: LBE-YOLO’s innovative lightweight framework for enhanced real-time landslide detection and risk mitigation. Remote Sens. 2024, 16, 534. [Google Scholar] [CrossRef]
  51. Fan, S.; Fu, Y.; Li, W.; Bai, H.; Jiang, Y. ETGC2-net: An enhanced transformer and graph convolution combined network for landslide detection. Nat. Hazards 2025, 121, 135–160. [Google Scholar] [CrossRef]
  52. Jiang, W.; Xi, J.; Li, Z.; Ding, M.; Yang, L.; Xie, D. Landslide detection and segmentation using mask R-CNN with simulated hard samples. Geomat. Inf. Sci. Wuhan Univ. 2023, 48, 1931–1942. [Google Scholar]
  53. Yang, Y.; Miao, Z.; Zhang, H.; Wang, B.; Wu, L. Lightweight attention-guided YOLO with level set layer for landslide detection from optical satellite images. IEEE J. Sel. Top. Appl. Earth Obs. Remote Sens. 2024, 17, 3543–3559. [Google Scholar] [CrossRef]
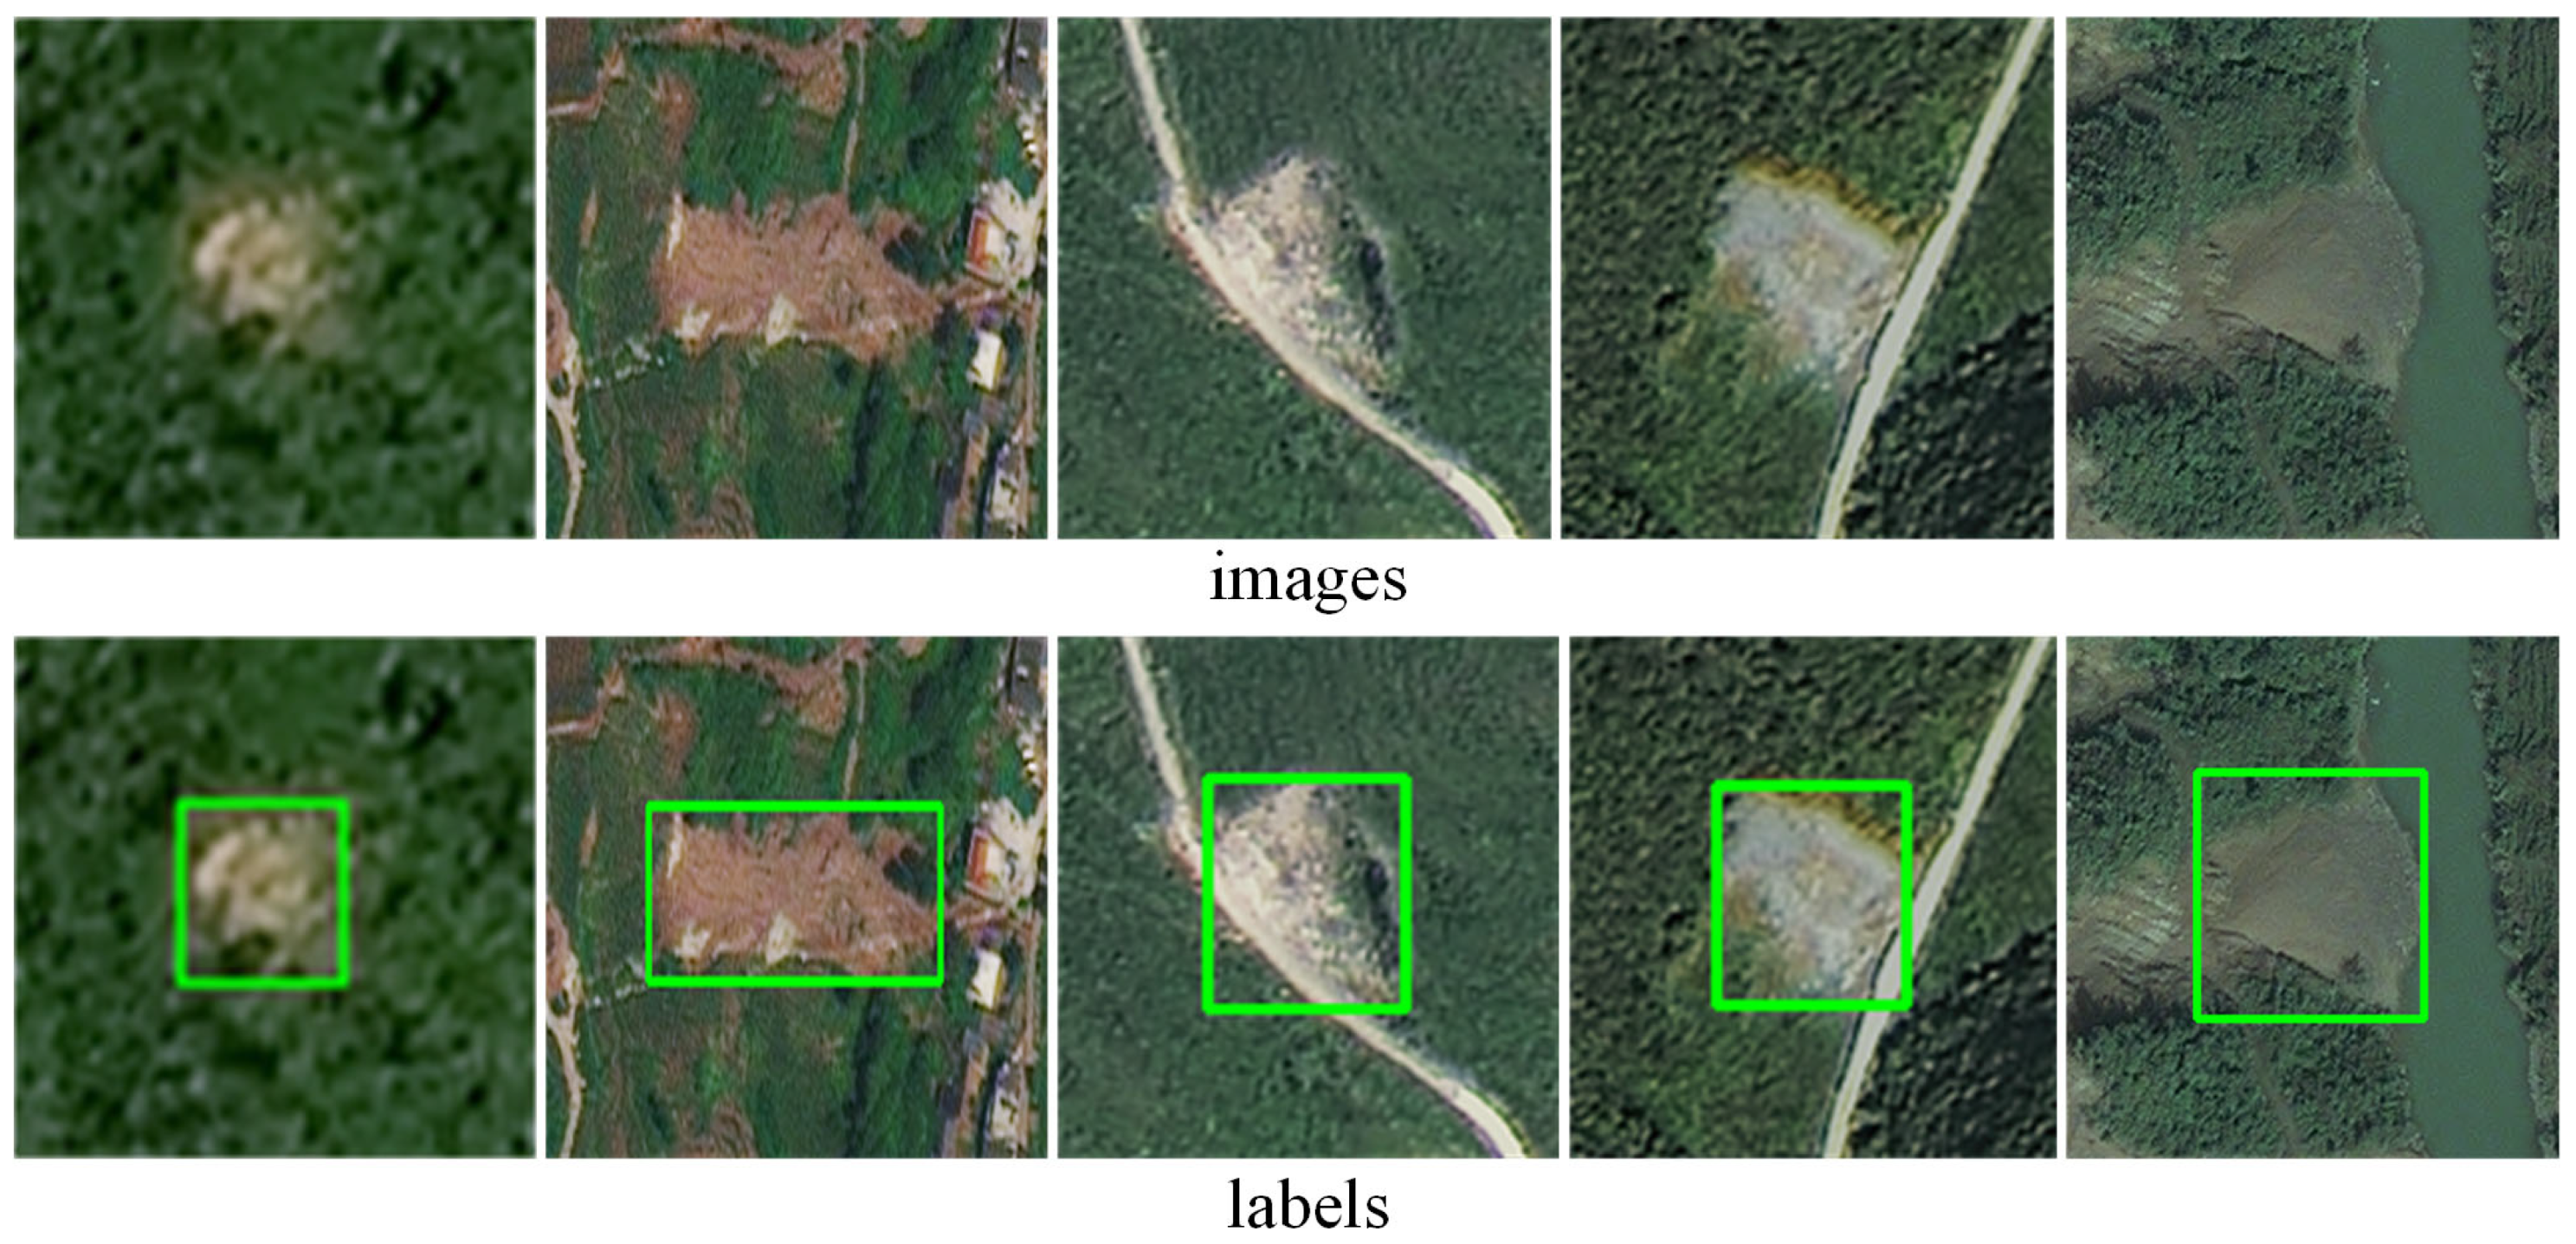
Figure 1. Bijie landslide dataset. The labels are indicated by green boxes.
Remotesensing 17 02795 g001
Figure 2. Luding landslide dataset. The labels are indicated by green boxes.
Remotesensing 17 02795 g002
Figure 3. The shape and size of all landslides in the dataset. (a) The shapes of all target boxes are displayed (b), and the coordinates of each point represent the sizes of different target box heights and widths. (c) Showing landslides of different sizes. The labels are indicated by green boxes.
Remotesensing 17 02795 g003
Figure 4. Individual representation of different landslide samples in the Southwest dataset. The labels are indicated by green boxes.
Remotesensing 17 02795 g004
Figure 5. MSTA-YOLO general frame diagram. Compared to the original YOLOv11 in the upper sampling part, MSTA-YOLO adds the RFA module in the neck, while eliminating the redundant C2PSA block. In addition, NWD is introduced into the detector to make the loss function more reasonable.
Remotesensing 17 02795 g005
Figure 6. The overall structure of YOLOv11. (a) The YOLOv11 network. (b) The structure of C2PSA block. (c) Structure of the PSA block.
Remotesensing 17 02795 g006
Figure 7. ECA structure diagram.
Remotesensing 17 02795 g007
Figure 8. The distribution of the prediction box and the real box during the training and testing process. Among them, the prediction box is represented by blue and the true box by green. The color usage in the following figure is consistent with that of this figure.
Remotesensing 17 02795 g008
Figure 9. Detection results of MSTA-YOLO. Among them, we kept the original size of the image.
Remotesensing 17 02795 g009
Figure 10. Detection results based on the Luding landslide dataset. (1) Original image. (2) The test results of YOLOv9. (3) The test result of YOLOv11. (4) The test results of MSTA-YOLO. (5) Ground truth. Columns (af) show representative detection cases on different test images.
Remotesensing 17 02795 g010
Figure 11. Detection results of MSTA-YOLO in Southwest landslide dataset.
Remotesensing 17 02795 g011
Figure 12. The F1-confidence curve of the MSTA-YOLO experimental results. (a) Experiments based on the Bijie landslide dataset. (b) Experiments based on the Luding landslide dataset. (c) Experiments based on the Southwest landslide dataset.
Remotesensing 17 02795 g012
Table 1. Comparison of results of landslide recognition accuracy of each model.
MethodPRF1mAP50mAP@50–95
YOLOv1069.2%75.3%72.1%80.7%50.8%
YOLOv979.8%80.5%80.1%86.4%52.5%
Re-Net [47] 83.88%
TCNet [48]84.19%89.2%85.12%
DBSANet [41] 87.08%
ShapeFormer [49]86.74%89.52%88.11%
LBE-YOLO [50]90.6%86.5%88.5%91.0%
ETGC2-net [51]90.11%89.98%90.04%
Jiang et al. [52]92.3%96.0%94.1%
YOLOv886.7%96.1%91.2%95.7%66.7%
YOLOv1188.9%93.4%91.1%96.1%66.1%
LA-YOLO-LLL [53]96.17%91.98%94.03%95.4%
MSTA-YOLO (ours)95%99.5%97.2%99.1%69.9%
Table 2. Ablation based on Bijie landslide dataset. Among them, * represents that the C2PSA block has been removed from the model.
MethodPRmAP50mAP@50–95
YOLOv1188.9%93.4%96.1%66.1%
YOLOv11 + RFA91%93.5%97%67.1%
YOLOv11 + NWD88.4%89.6%94.6%65.2%
YOLOv11 + RFA + NWD91.4%96.5%97.8%60.6%
YOLOv11 *89.1%97.4%95.3%70.3%
YOLOv11 * + RFA93.7%96.2%98%70.9%
YOLOv11 * + NWD90.5%99.4%98.2%68.3%
MSTA-YOLO (ours)95%99.5%99.1%69.9%
Table 3. Comparative experiments based on the Luding landslide dataset.
MethodPRF1mAP@50–95
YOLOv989.7%68.3%77.6%49.2%
YOLOv1077.0%68.3%72.4%44.8%
YOLOv1192.1%58.5%71.6%37.2%
MSTA-YOLO (ours)87.1%79.5%83.1%56.3%
Table 4. Ablation based on Luding landslide dataset. Among them, * represents that the C2PSA block has been removed from the model.
MethodPRF1mAP@50–95
YOLOv1192.1%58.5%71.6%37.2%
YOLOv11 + RFA84.7%74.4%79.2%54.5%
YOLOv11 + NWD90.5%73.1%80.8%55.9%
YOLOv11 * + RFA86.0%75.0%80.1%55.4%
YOLOv11 * + NWD92.6%69.2%79.2%51.2%
MSTA-YOLO (ours)87.1%79.5%83.1%56.3%
Table 5. Detection performance of YOLOv11 and MSTA-YOLO in Southwest landslide dataset.
MethodPRmAP50mAP@50–95GFLOPsFPS
YOLOv1169.8%48.5%57.6%26.5%6.429.77
MSTA-YOLO72.1%49.9%59.1%30.5%7.029.31
Disclaimer/Publisher’s Note: The statements, opinions and data contained in all publications are solely those of the individual author(s) and contributor(s) and not of MDPI and/or the editor(s). MDPI and/or the editor(s) disclaim responsibility for any injury to people or property resulting from any ideas, methods, instructions or products referred to in the content.