Technical Note

Global Asymmetric Changes in Land Evapotranspiration Components During Drought: Patterns and Variability

1
State Key Laboratory for Climate System Predictions and Risk Management/Key Laboratory of Meteorological Disaster, Ministry of Education (KLME)/Collaborative Innovation Center on Forecast and Evaluation of Meteorological Disasters, Nanjing University of Information Science and Technology, Nanjing 210044, China
2
School of Atmospheric Sciences, Nanjing University of Information Science and Technology, Nanjing 210044, China
*
Author to whom correspondence should be addressed.
Remote Sens. 2025, 17(16), 2790; https://doi.org/10.3390/rs17162790
Submission received: 11 June 2025 / Revised: 31 July 2025 / Accepted: 4 August 2025 / Published: 12 August 2025

Abstract

Understanding and predicting changes in land evapotranspiration (ET) during droughts is crucial for elucidating land-atmosphere interactions. While previous studies have primarily focused on overall ET or individual components, they often overlook the mutual influences among different ET components. To address this gap, this study presents the first global analysis of concurrent changes in multiple ET components during meteorological droughts. Utilizing advanced satellite-based and reanalysis-based datasets, including the Global Land Evaporation Amsterdam Model (GLEAM) and the ECMWF reanalysis v5 (ERA5-Land) for the period 2000–2020, we find that the average probability of drought-driven increases in ET (P(ET+)) was approximately 0.5 during drought events. In contrast, the probabilities of an increase for the primary components—bare soil evaporation (Eb), canopy interception evaporation (Ei), and transpiration (Et)—were below 0.4, while the probability of drought-driven increases in snow sublimation (Es) exceeded 0.6. Globally, ET decreased by an average of 20.5 mm/month during a given drought period, though it increased in humid regions and snow-covered areas. Mild droughts resulted in an overall ET reduction, with increases in Eb and Es partially offsetting decreases in Et and Ei. However, as drought intensity increased, ET shifted toward an increase, which was constrained under extreme droughts. These findings highlight the asymmetric and interdependent responses of ET components to drought, underscoring the critical need to understand these interactions for accurately predicting ET dynamics under drought stress.

Graphical Abstract

1. Introduction

Drought is a severe hydro-meteorological disaster primarily driven by persistent precipitation deficits, compounded by enhanced evaporation, which can propagate through the hydrological system, reducing soil moisture and runoff [1]. Severe droughts can profoundly impact human society and ecosystems, causing crop failures, water supply shortages, and natural disasters such as widespread plant mortality and wildfires [1,2,3]. Accurately understanding and quantifying these impacts remains challenging, largely due to the great uncertainties in how evapotranspiration (ET)—a crucial nexus between the water cycle and surface energy balance—responds to drought, particularly with respect to its individual components [4,5]. ET components primarily include soil evaporation, vegetation transpiration, canopy interception, and snow evaporation, all of which vary significantly across different land cover types and climatic zones [6]. Critically, the magnitude and pattern of ET changes during drought not only govern the surface water balance but also modulate land-atmosphere interactions, thereby driving the spatialtemporal propagation of drought stress through the atmosphere, soil, hydrology, and natural ecosystems [2]. Therefore, understanding and predicting the response of ET to drought is crucial for developing robust drought early-warming systems and effective climate adaptation strategies.
Extensive research has developed estimation methods for the dynamic changes in ET, with some studies attempting to elucidate ET variations during the drought evolution process [7,8,9]. Under normal conditions, sufficient soil moisture allows land surface moisture to meet atmospheric demand, ensuring a balance between soil moisture and atmospheric water needs. However, prolonged precipitation deficits during drought periods create a water imbalance, gradually depleting soil moisture. As drought intensifies and soil water becomes critically limited, ET typically declines [10,11]. This decline is often driven by a reduction in soil evaporation or decreased transpiration due to vegetation stomatal closure [12,13]. Such deviations in ET, whether in the form of a decrease or an increase, can accelerate surface water loss, exacerbate water scarcity, and place additional stress on vegetation ecosystems [14,15].
Critically, the ET variations during droughts do not occur uniformly. Previous studies have established that the response of ET to drought exhibits significant regional heterogeneity, primarily driven by climate aridity and land surface conditions. In water-limited arid regions, drought-induced water stress leads to a strong coupling between extreme high temperatures and the partitioning of surface energy, causing ET to be more sensitive to atmospheric conditions than to soil moisture within its effective range [16,17]. In contrast, in energy-limited humid regions, the response of ET to drought evolves dynamically over the course of a drought. During the early stages of drought in humid regions, high solar radiation and adequate soil moisture can increase ET, potentially exacerbating precipitation deficits [11]. This pattern, observed in regions such as the Amazon and the Yangtze River Basin, typically involves an initial increase in ET due to higher insolation at the onset of a drought, followed by a decrease as conditions shift from energy-limited to water-limited [18,19].
Despite substantial advances have been made in estimating ET dynamics and characterizing its response to drought, a critical gap persists in the literature. Existing studies mainly focus on aggregate ET fluxes, largely overlooking the differential responses and complex interplay among different ET components during multi-stage drought evolution. As a result, the spatial variability and co-evolution patterns of ET components during drought remain poorly quantified and understood, particularly when accounting for the spatial heterogeneity of underlying surfaces. This knowledge gap significantly hinders our ability to accurately predict integrated ET responses during droughts. To address this gap, the present study provides the first global investigation into the concurrent changes and interactions of key ET components—soil evaporation, vegetation transpiration, canopy interception, and snow sublimation—during meteorological droughts. Using meteorological drought as the primary indicator and the probability of drought-driven increases in ET (P(ET+)) as a metric to characterize the full spectrum of ET changes, we aim to elucidate the behaviors and mutual influences among these components.

2. Materials and Methods

2.1. Gridded Precipitation Dataset

The gridded precipitation dataset used in this study was sourced from the Climatic Research Unit (CRU), provided by the UK National Centre for Atmospheric Science. The CRU dataset offers global monthly precipitation data at a resolution of 0.5° × 0.5°. It was generated using the Angular Distance Weighting (ADW) interpolation method, which combines monthly observations calculated from daily or sub-daily data provided by national meteorological services and other external proxies. The dataset includes monthly averages of various climatic parameters [20]. A key advantage of this dataset is its reliance on global precipitation station observations, which enhances its reliability relative to meteorological reanalysis data. For this study, we used monthly precipitation data from January 2000 to December 2020, primarily due to the availability of more reliable observational data in the near history, thereby reducing uncertainty in drought identification.

2.2. GLEAM and ERA5-Land Datasets

The ET component data used in this study were obtained from the Global Land Evaporation Amsterdam Model (GLEAM) product, which was retrieved based on satellite observations and reanalysis data. GLEAM consists of a set of algorithms designed to estimate the various components of terrestrial ET separately [21,22]. The algorithm utilizes satellite observations of net radiation, air temperature, precipitation, vegetation optical depth, and snow water equivalent to estimate global terrestrial ET. The GLEAM ET product has been globally validated and demonstrates high accuracy in representing terrestrial ET across various ecosystems [23]. The underlying framework of GLEAM is based on the Priestley-Taylor method, which maximizes the recovery of evaporation information extracted from existing climate and environmental observations, particularly satellite data [24]. One of GLEAM’s strengths is its inclusion of multiple ET components, such as vegetation transpiration (Et), canopy interception (Ei), bare soil evaporation (Eb), snow sublimation (Es), and open water evaporation (Ew), all with a high resolution of 0.25° × 0.25°. For this study, we utilized global land ET and its components data from January 2000 to December 2020, which were resampled to a resolution of 0.5° × 0.5°. The 0.5-degree resolution was chosen because the SPI index is based on precipitation data at 0.5° × 0.5°, ensuring consistency when linking ET changes with drought. Moreover, resampling the dataset from 0.25-degree to 0.5-degree resolution helps reduce uncertainty and optimizes computational resources, while still providing sufficient detail for our global-scale study. For comparison and verification purposes, the monthly averaged reanalysis data from the ECMWF reanalysis v5 (ERA5-Land) with an original resolution of 0.1° × 0.1° were also resampled to 0.5° × 0.5° and employed in this study [25,26].

2.3. Drought Identification Using the SPI

This study employs the Standardized Precipitation Index (SPI) to identify meteorological droughts. The SPI is calculated using long-term monthly precipitation data, derived from the cumulative probability density function of precipitation, and then standardized to a normal distribution using the gamma distribution function. This standardization eliminates spatial and temporal differences in precipitation distribution [27]. The SPI is widely used for identifying large-scale drought due to its simplicity, adaptability across various time scales, and minimal data requirements [28]. Droughts are defined by the SPI values less than −0.5. Specifically, SPI ≤ −2.0 indicates extreme drought, −2.0 < SPI ≤ −1.5 represents severe drought, −1.5 < SPI ≤ −1.0 denotes moderate drought, −1.0 < SPI ≤ −0.5 indicates mild drought, −0.5 < SPI < 0.5 signifies normal conditions, and SPI ≥ 0.5 indicates wet conditions. To capture meteorological droughts globally and reduce the impact of seasonal fluctuations, a 3-month time scale is applied for the SPI, and the average number of drought months per year is calculated to determine drought frequency in this study.

2.4. Probability of Drought-Driven Increase in ET

In this study, the spatial variation characteristics of ET were analyzed based on the probability of an increase in ET and its individual components. The ET+ phenomenon was statistically analyzed using the difference between the ET value for a given month and the previous month. Our decision to define the ET variations based on the difference from the previous month, rather than relative to the ET climatology, aims to better capture changes in ET during drought periods. We believe that using the climatological average might obscure the critical variations that occur during droughts. From a physical standpoint, this approach helps assess whether the land surface water can continuously or intermittently supply the atmospheric evaporation demand during drought periods. Thus, this study calculated the variations in ET and its components based on the original time series data, as follows:
Δ E T m o n t h = E T m o n t h E T m o n t h 1
When Δ E T m o n t h > 0 , it refers to the increase in ET (ET+) on that given month. The same definition applies to the components of ET. The probability of increase in ET and its components, i.e., P(ET+), P(Eb+), P(Ei+), P(Et+), and P(Es+), are also used in this study. The “probability of increase” refers to the likelihood that a given ET component experiences an increase during a specified drought period. This probability is calculated by evaluating the frequency of positive changes in the ET or its individual component values relative to the total number of drought months. It can be used to indicate the overall tendency of ET or its components during droughts at a specific location. If P(ET+) < 0.5, it indicates that ET or its components tend to decrease during droughts at that location; if P(ET+) > 0.5, they tend to increase. Drought months are identified based on the SPI on a 3-month time scale, with a value less than −0.5 indicating a drought. All drought samples were derived from the period from January 2000 to December 2020.

3. Results Analysis

3.1. Difference of ET Between Drought and Non-Drought Periods

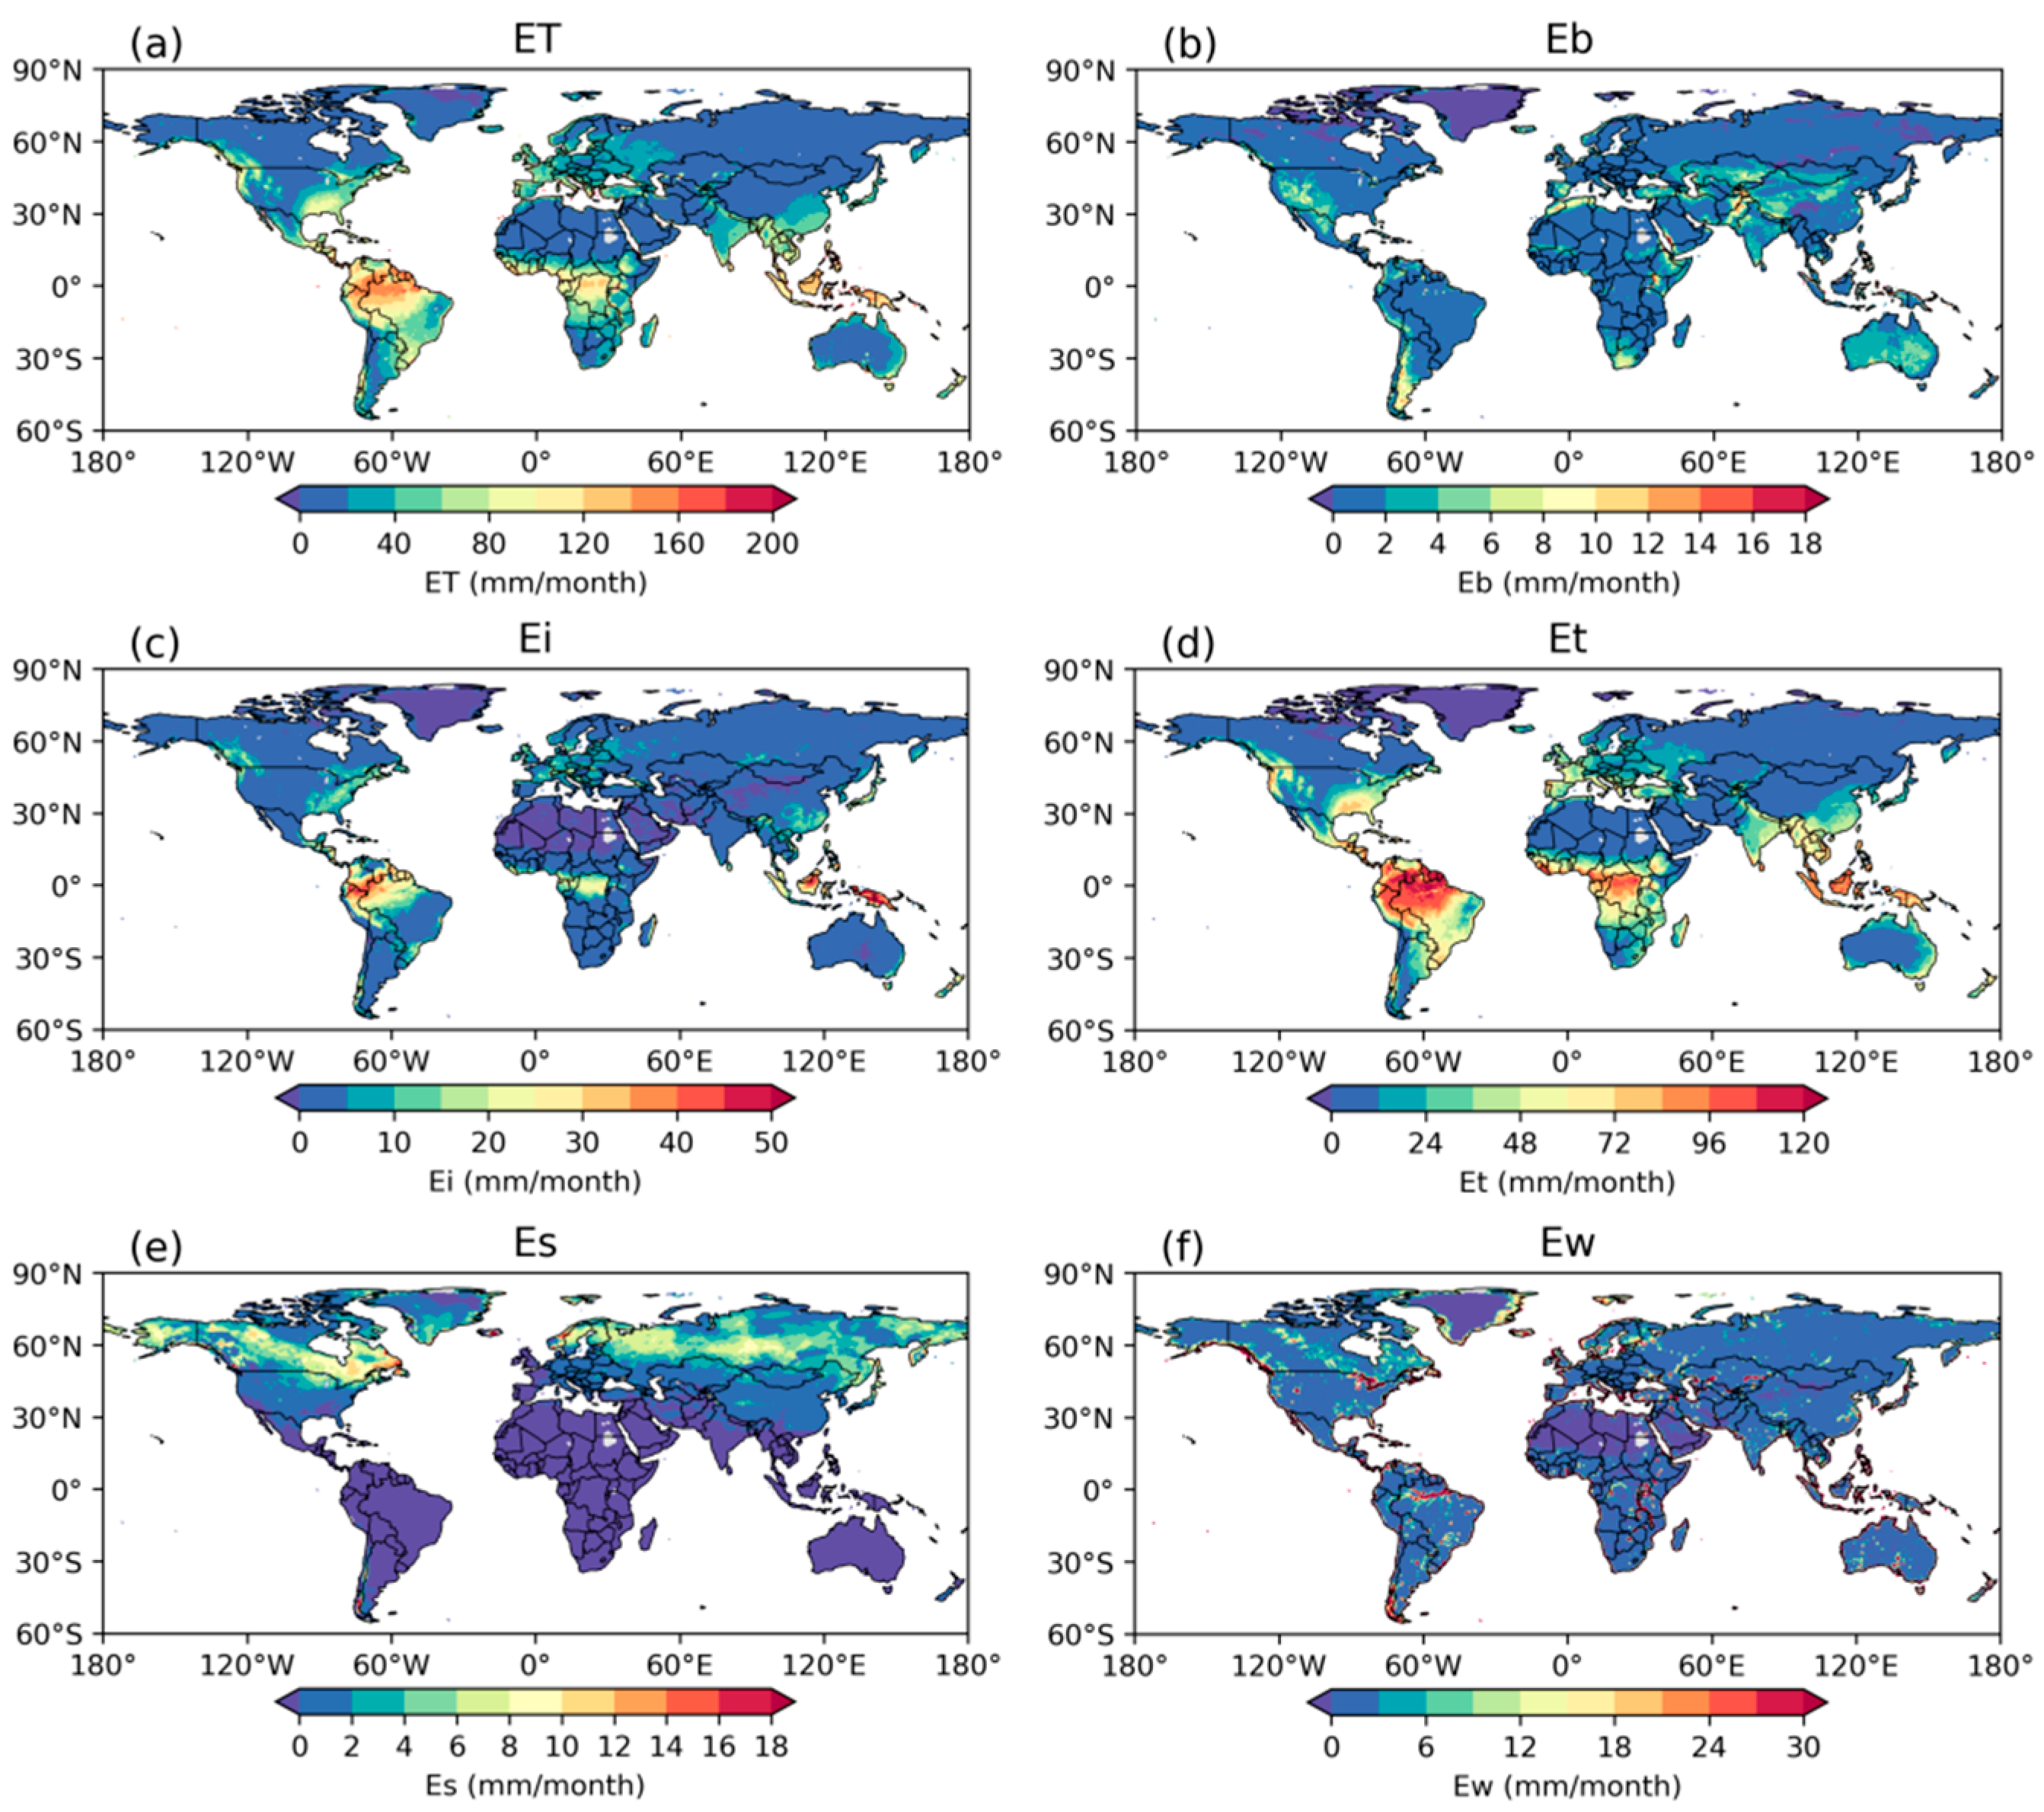
This study began by identifying droughts using the SPI (Figure 1). The spatial distribution of drought frequency, as indicated by the SPI, shows significant spatial variability, reflecting differences in the intensity and occurrence of drought events. Overall, extreme droughts are relatively infrequent, while moderate droughts occur more frequently, with a frequency ranging from 0.6 to 4.2 months per year. Moderate droughts are particularly widespread in several regions, including the Amazon Basin, West Asia, Africa, South Asia, and southwest China. Notably, the SPI analysis highlights that hyper-arid regions such as the Sahara Desert exhibit a high frequency of mild droughts (SPI ≤ −1.0) (Figure 1d). This anomaly stems from the region’s extremely low average precipitation and limited variability, a result of the physical constraints on how much drier conditions can become below an already minimal average. The SPI quantifies drought by measuring statistical deviations from local climate norms, and in the Sahara, even small reductions in already low precipitation can trigger an SPI value indicating mild drought. Despite this frequent occurrence, the high frequency of mild droughts does not suggest that the Sahara experiences less water stress; its climate remains persistently arid with extreme water scarcity regardless of SPI fluctuations. This mismatch reveals a key problem: the SPI cannot fully reflect how ecosystems experience water shortage. To quantify drought impacts on surface-atmosphere exchanges, Figure 2 illustrates the global average ET and its components during drought periods. On average, vegetation transpiration (Et) is the dominant component of ET, particularly in tropical regions, where the contribution of plants to overall ET is significantly higher. In contrast, bare soil evaporation (Eb) and snow sublimation (Es) account for a smaller proportion (Figure 2). These patterns highlight the importance of vegetation in regulating ET variability during drought conditions, especially in areas with abundant vegetation cover, such as tropical forests.
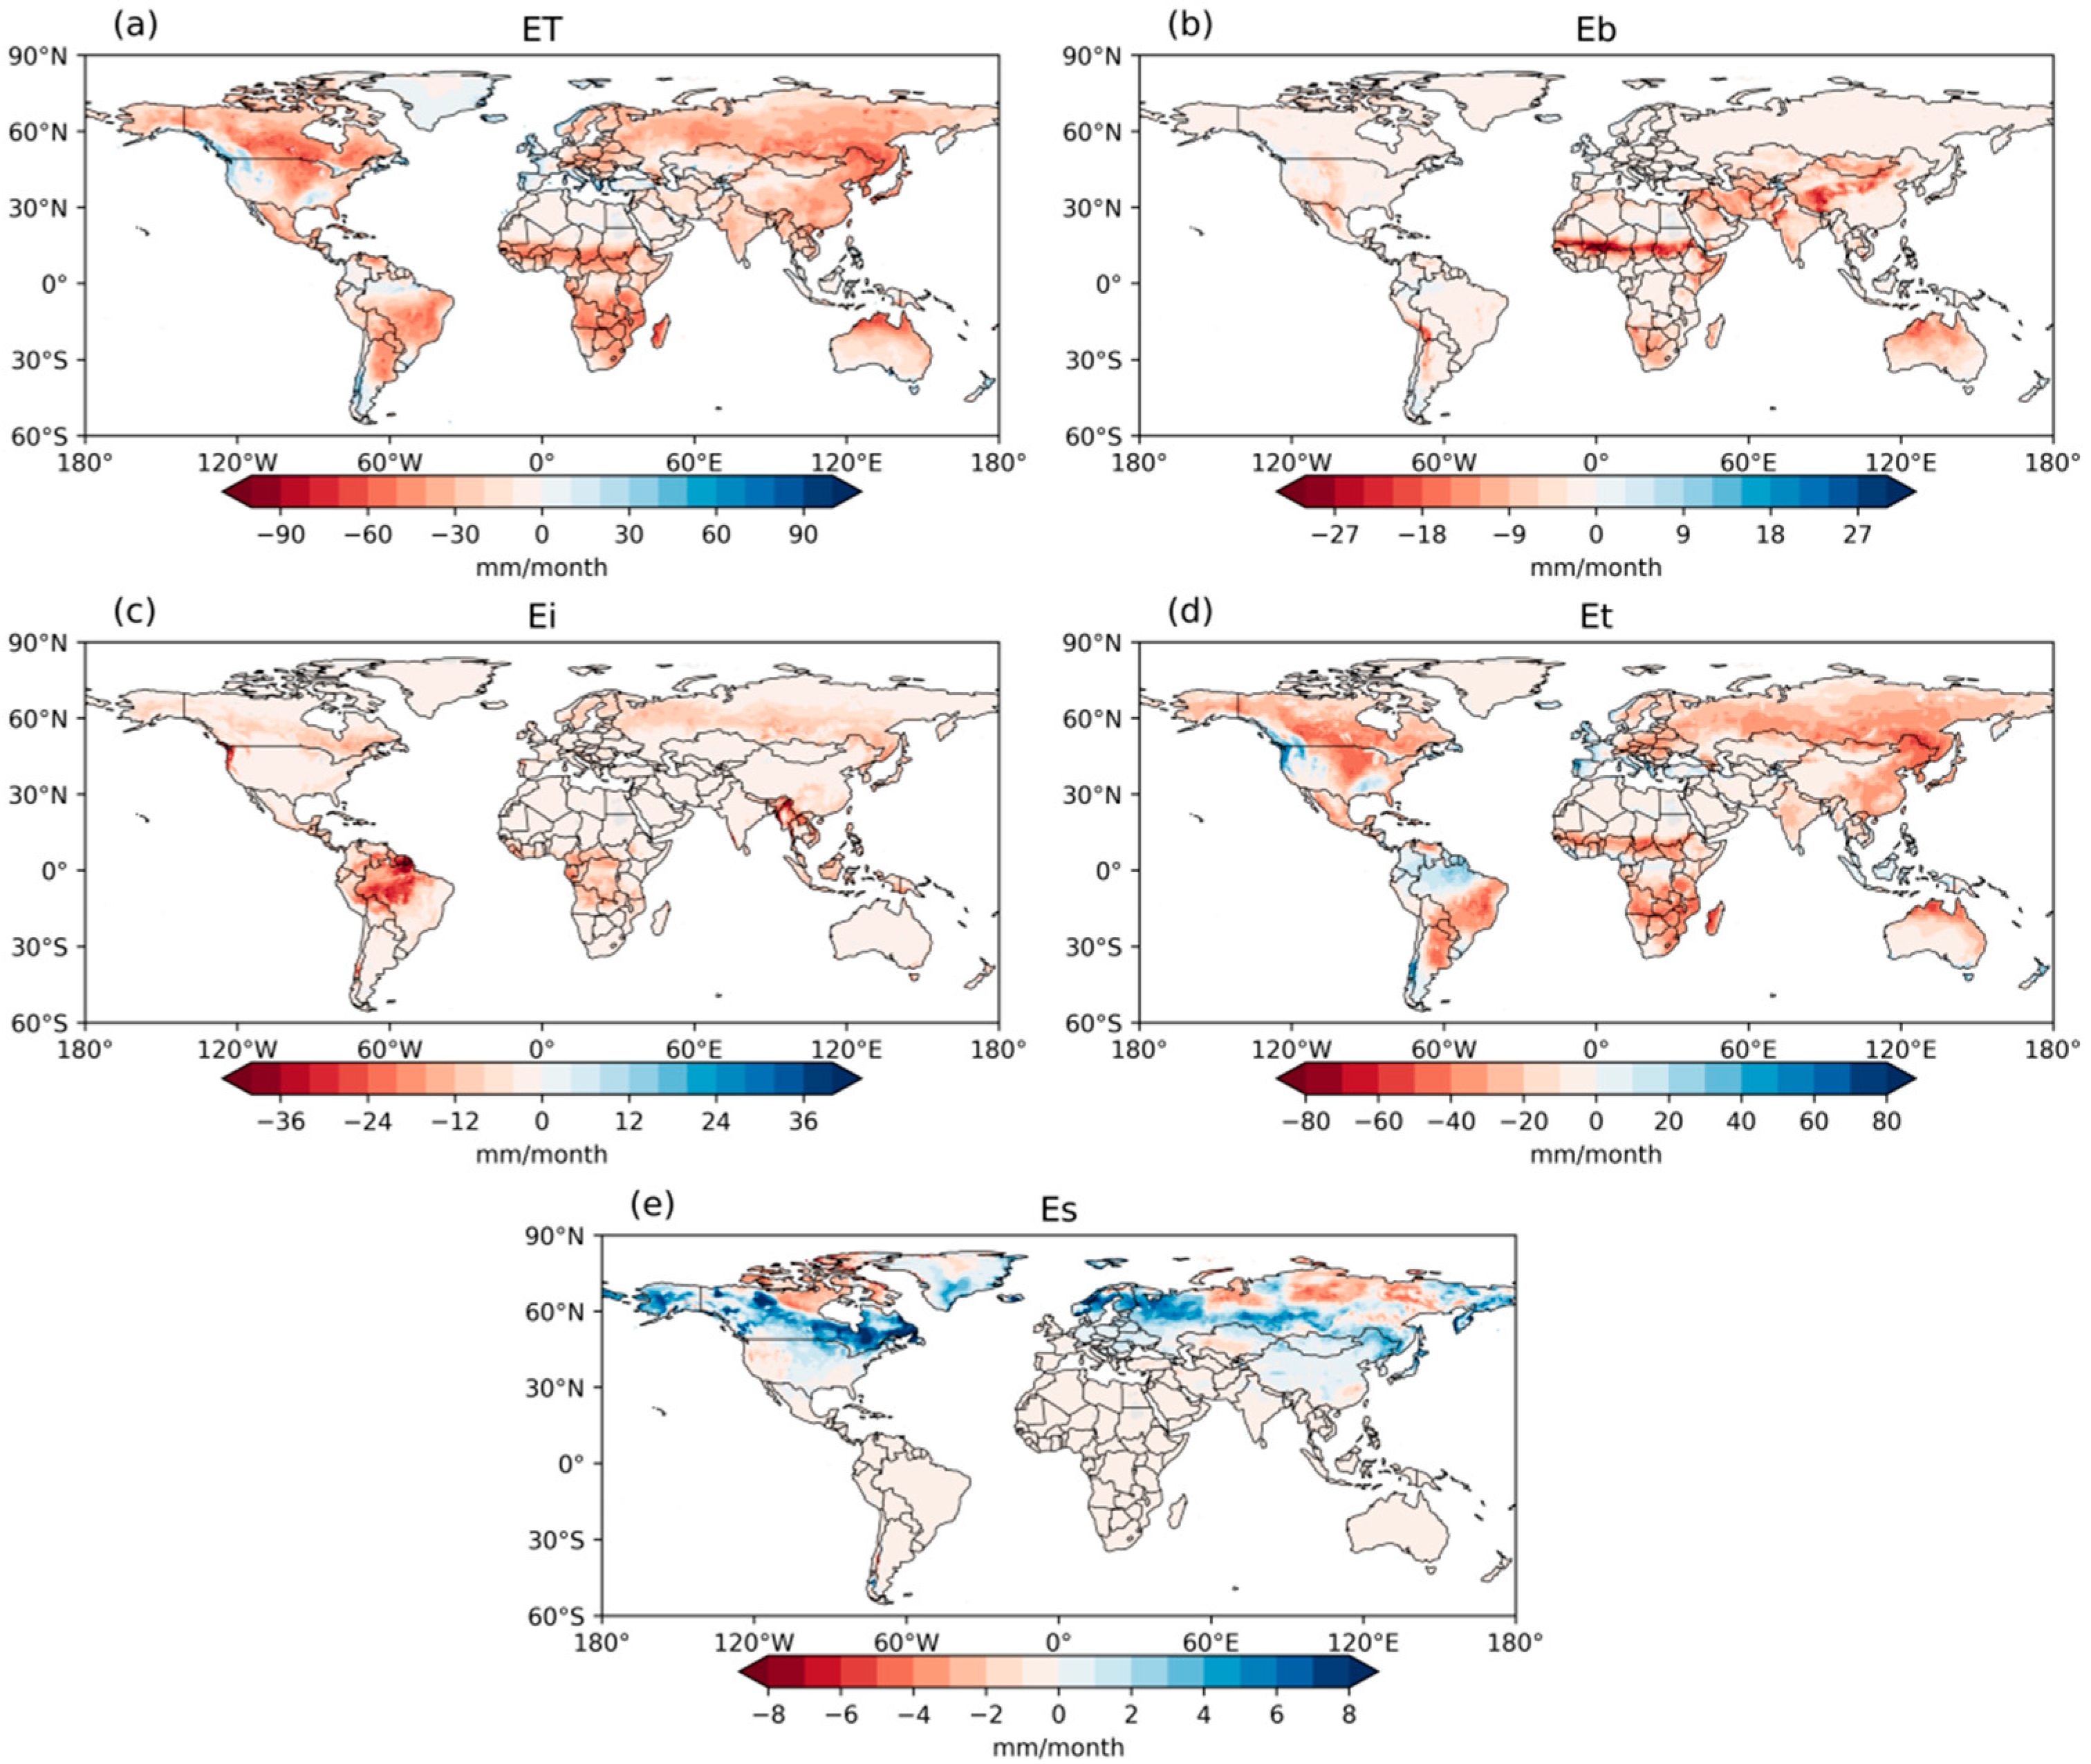
By comparing drought months with non-drought months across all studied years, this study examines how different components of ET are affected by drought stress and their spatial distribution characteristics (Figure 3). Overall, global ET decreases significantly during droughts, with a global land surface average reduction of 20.5 mm/month, drive primarily by suppressed vegetation processes. The reduction in ET is uneven across different components, with bare soil evaporation (Eb) decreasing by 2.95 mm/month, canopy interception evaporation (Ei) decreasing by 3.71 mm/month due to reduced rainfall capture, and vegetation transpiration (Et) decreasing by 13.23 mm/month, reflecting stomatal closure under water stress. Notably, snow sublimation (Es) increases by 0.42 mm/month during droughts as drier conditions enhance radiative forcing on snowpacks. The most pronounced reductions in ET are observed primarily in regions such as central North America, central South America, areas on both sides of the equator in Africa, northeastern Asia, and northern Australia. In contrast, ET increases during drought periods along the western coasts of mid-latitude continents (Figure 3a). These spatial patterns highlight the differential impacts of drought across various geographical regions. Consequently, agricultural regions with high ET dependency face amplified water loss risks during droughts.
In tropical rainforest regions, ET either remains largely unchanged or increases significantly during droughts. This increase in ET follows a pattern similar to that of vegetation transpiration (Et), as shown in Figure 3d. In densely vegetated regions like tropical rainforests, canopy interception evaporation (Ei) decreases substantially during droughts, while vegetation transpiration (Et) increases (Figure 3c,d). This suggests that the drought, primarily driven by reduced precipitation, leads to a decrease in canopy interception and an increase in Et, making transpiration the dominant process driving the rise in ET. In contrast, bare soil evaporation (Eb) predominantly decreases during droughts, with the most significant reductions occurring in subtropical and temperate sparsely vegetated areas (Figure 3b). This indicates that changes in soil moisture evaporation play a dominant role in the overall variations of ET in these regions. Finally, unlike the other components, snow sublimation (Es) increases during droughts in high-latitude snow-covered regions. However, it decreases in some polar-adjacent areas, such as northern Canada and northern Siberia (Figure 3e), reflecting the complex dynamics of snow-covered regions during drought periods.

3.2. Effect of Different Intensity of Drought on ET Components

Based on the SPI classification of drought intensity, the global distribution of drought frequency across different intensity levels was statistically analyzed (Figure 1). Extreme and severe droughts occur less frequently and are mainly observed in the eastern United States, Western and Eastern Europe, central Africa, and Indonesia, with additional occurrences in northern South America and southern Australia (Figure 1a,b). Moderate droughts are widely distributed across many regions globally, with the highest frequency observed in central South America, the Middle East, areas on both sides of the equator in Africa, central and western China, and Southeast Asia (Figure 1c). Regions with high and stable precipitation are more prone to experiencing severe drought events due to increased likelihood of extreme dry anomalies.
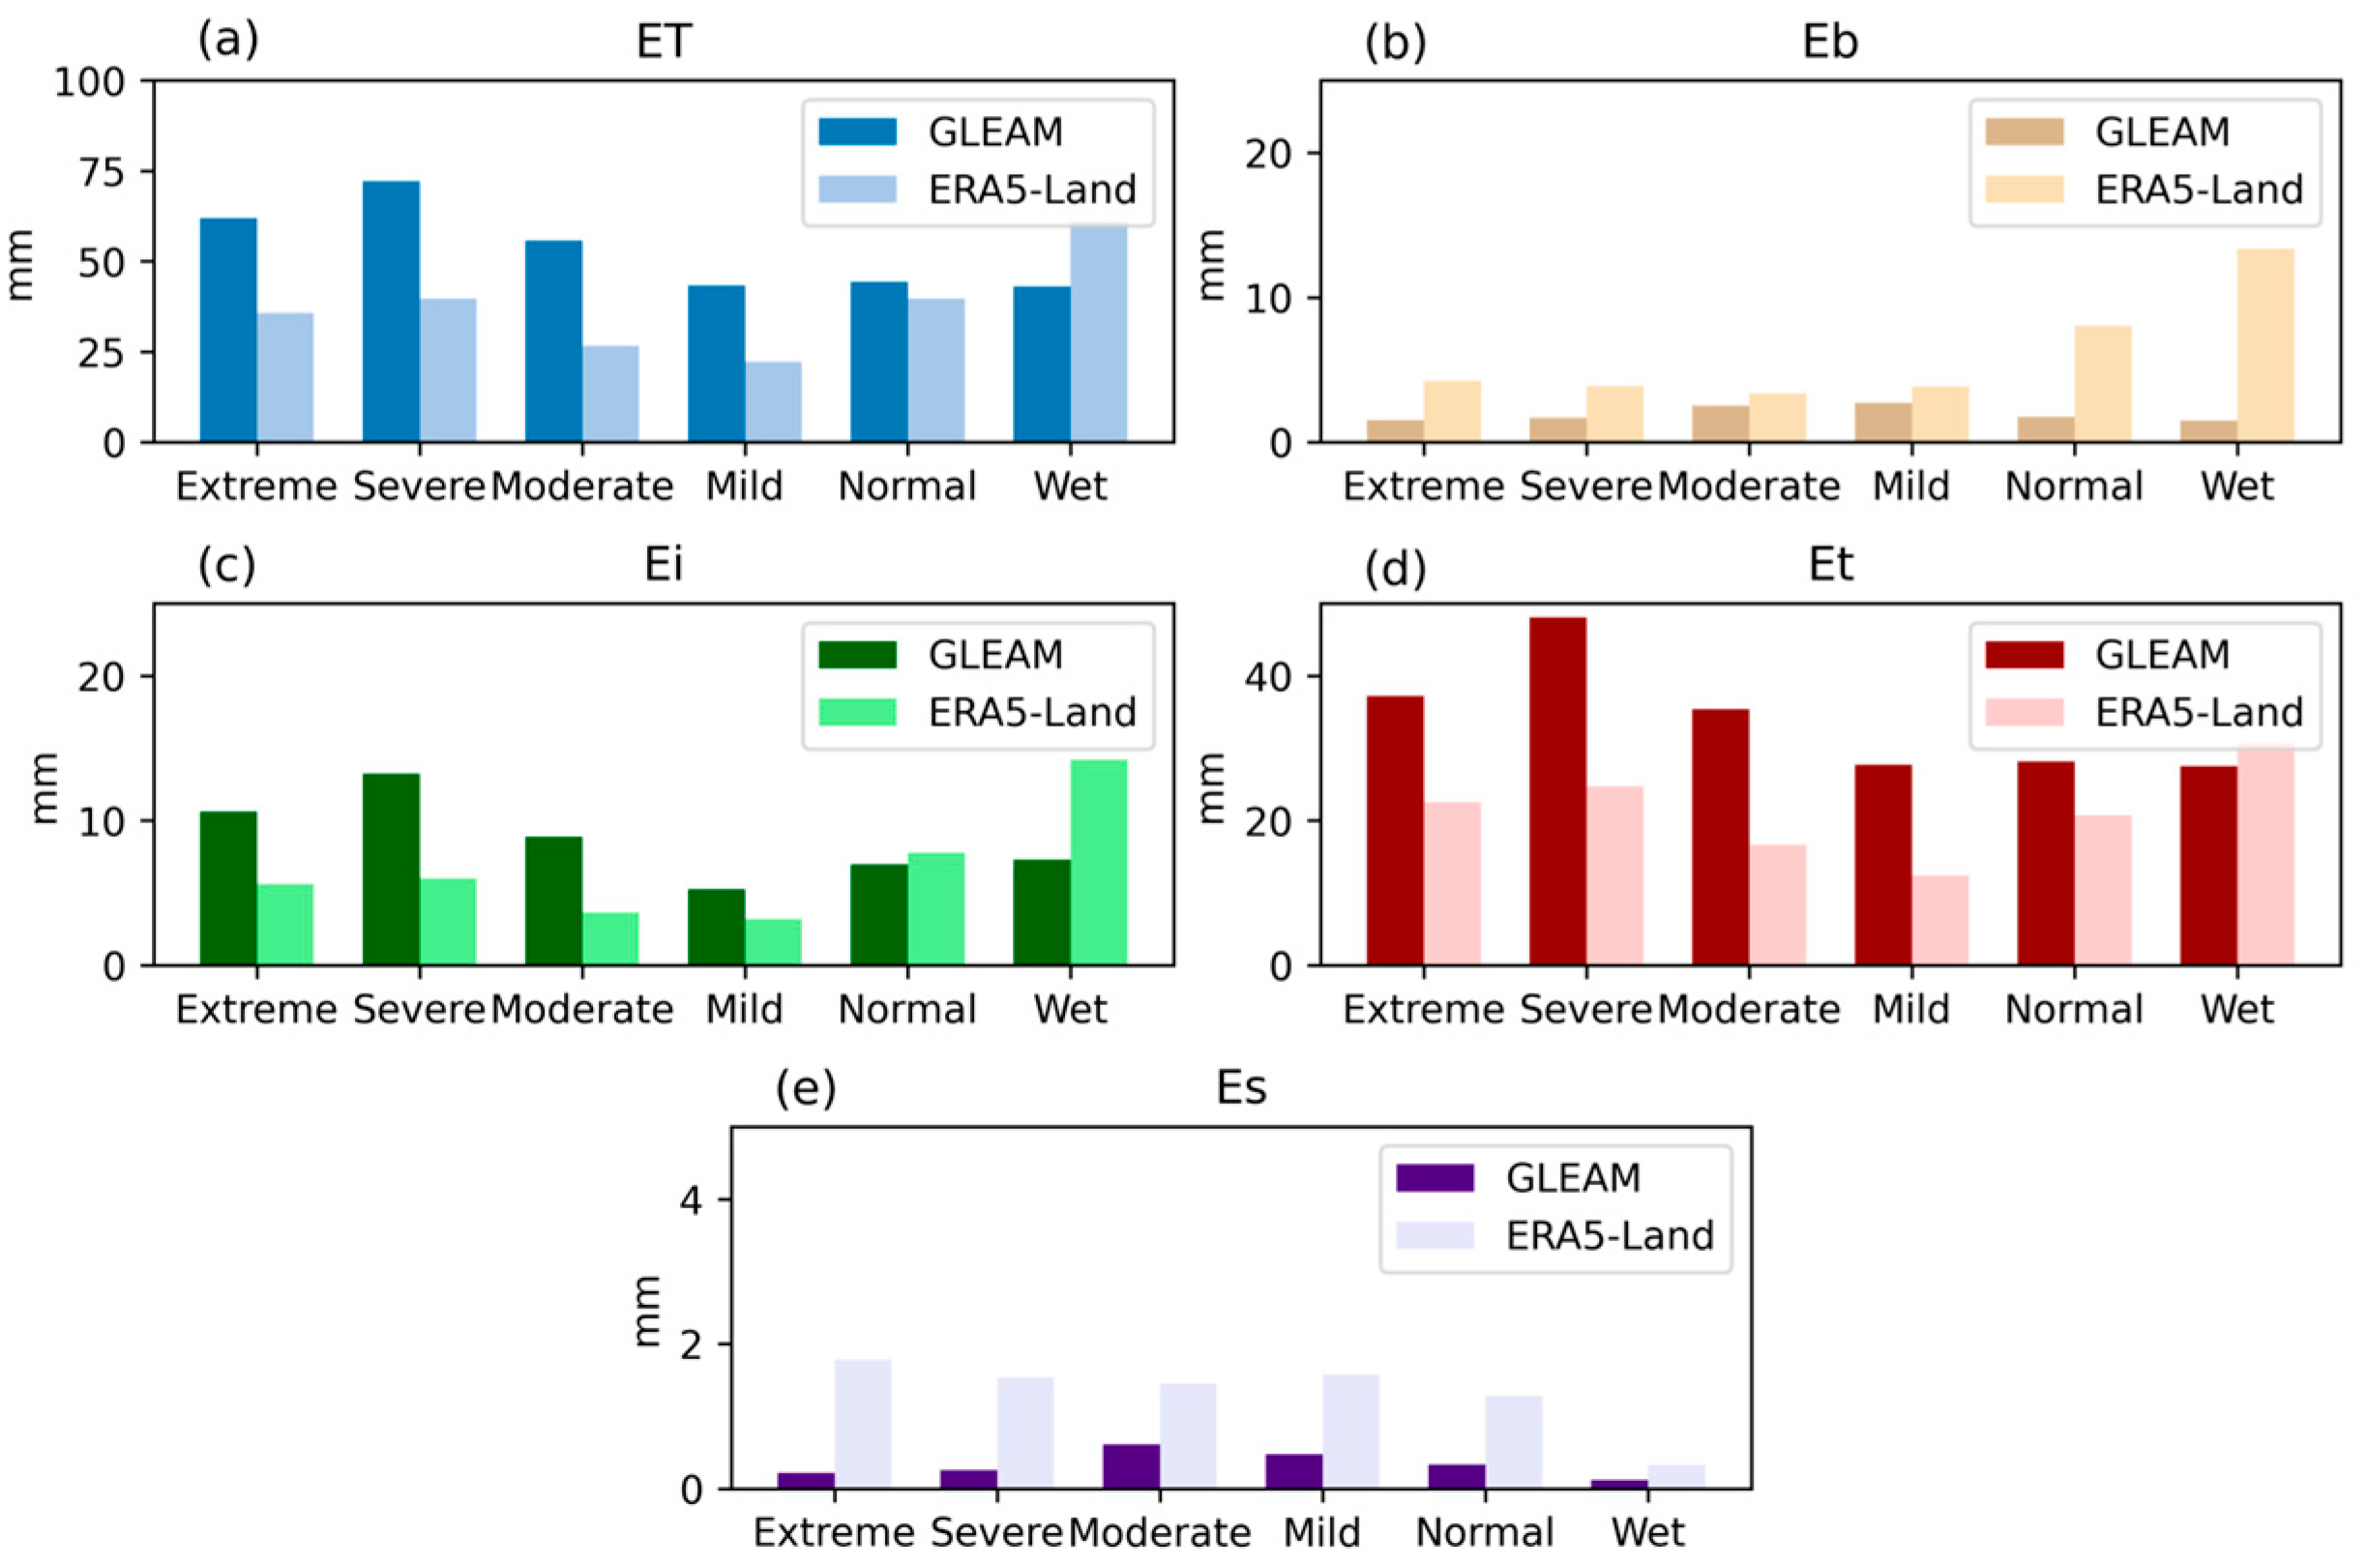
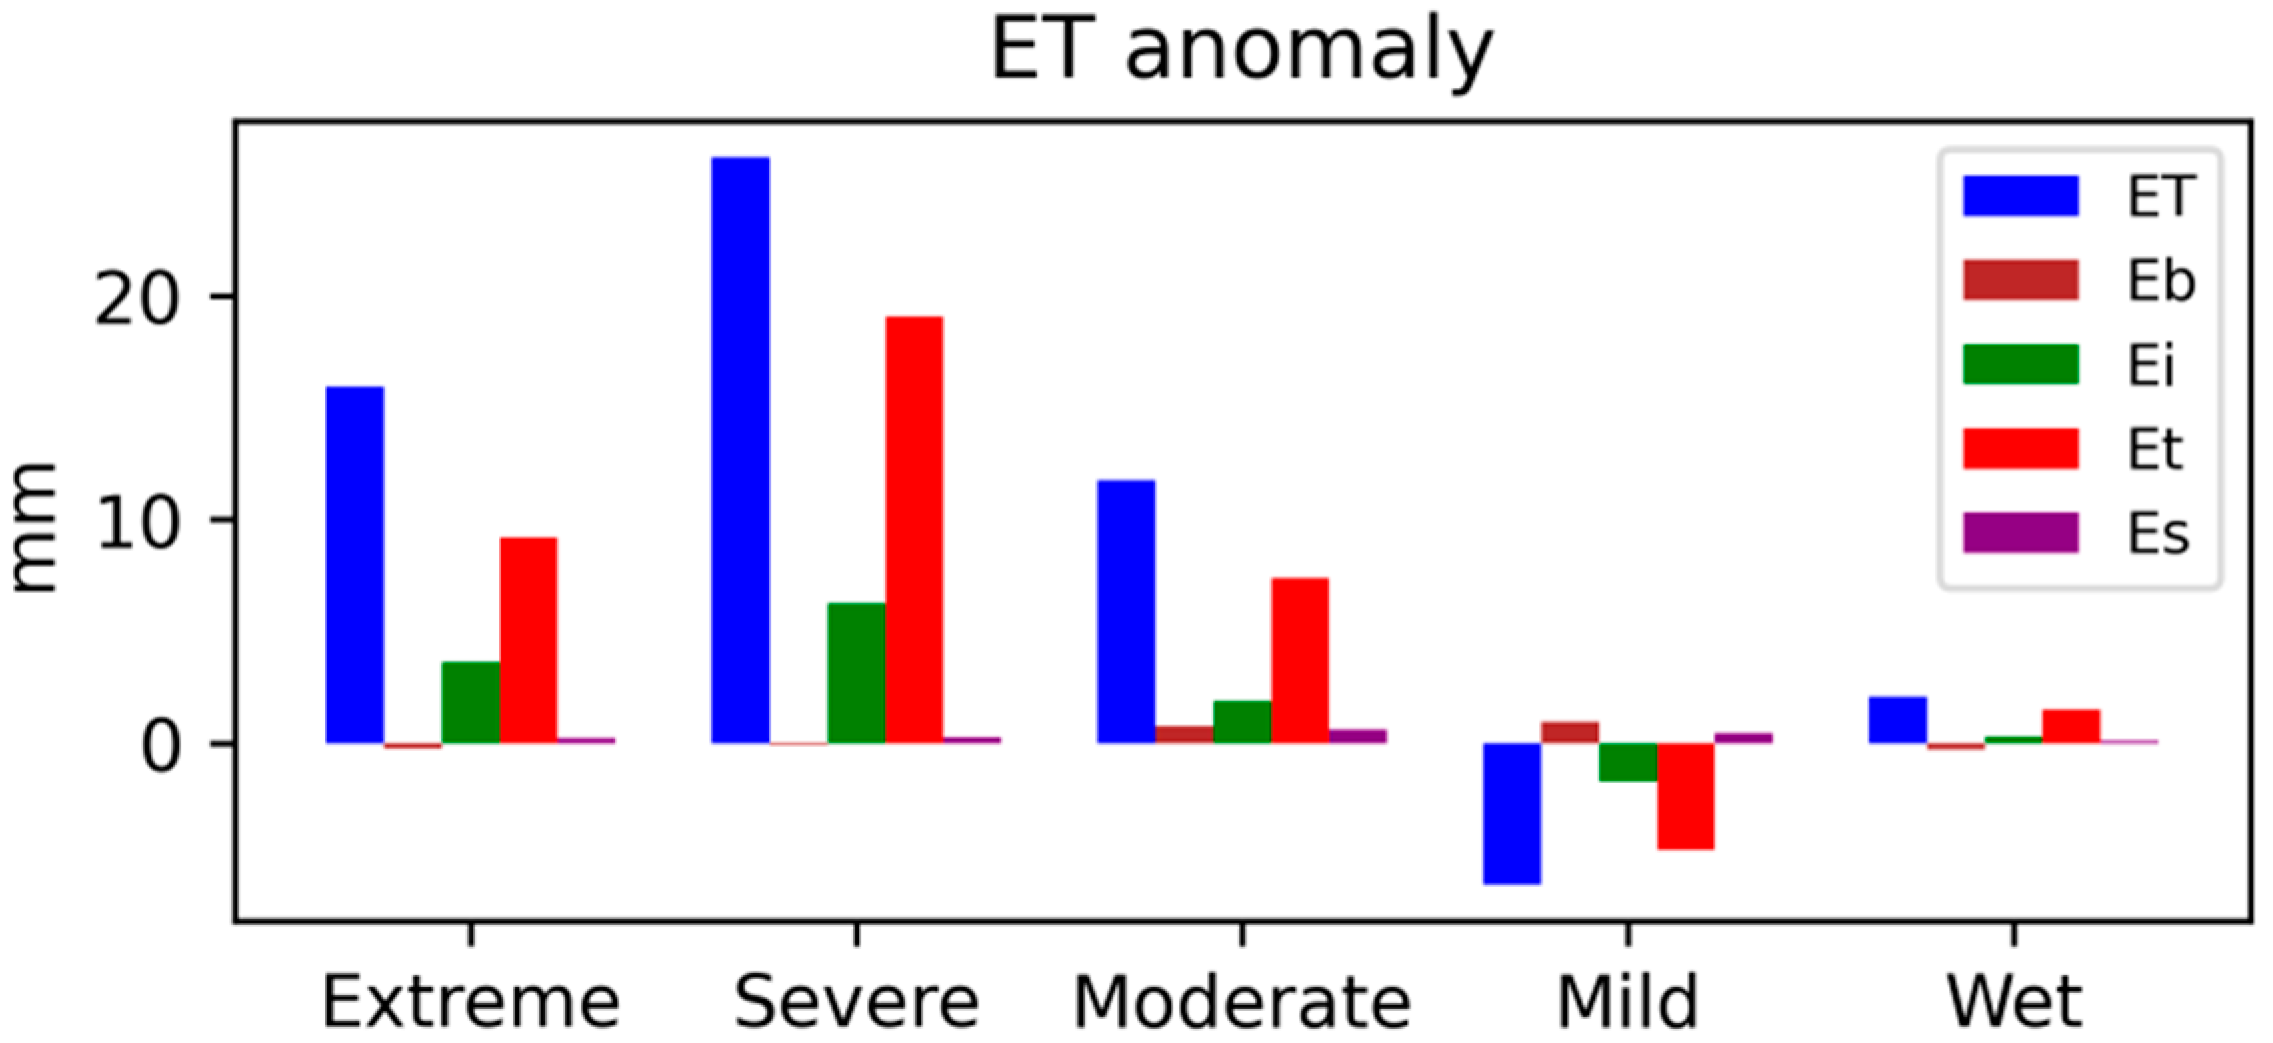
Under different drought intensities, the components of ET exhibit asymmetric changes that may partially offset each other, making them difficult to be fully captured by changes in total ET (Figure 4 and Figure 5). We found that under mild drought conditions, both ET and its primary components (Ei and Et) decrease. As drought severity increases, ET rises, reaching its peak during severe droughts. However, under extreme drought conditions, ET decreases again. Eb and Es follow a similar trend, initially increasing and then decreasing as drought intensity intensifies. Among the three main components, only Eb exhibits inconsistent behavior, i.e., it increases during mild droughts and gradually decreases as drought intensity intensifies. In addition, validation with ERA5-Land data was performed (Figure 4). Although there are numerical differences between the two datasets, both lead to the same conclusion: mild droughts result in a reduction in ET and its primary components; ET increases with drought severity, peaking during severe droughts, but once drought intensity reaches the extreme drought level, ET no longer continues to rise and instead decreases.

3.3. The Global Distribution of the ET+ Phenomenon

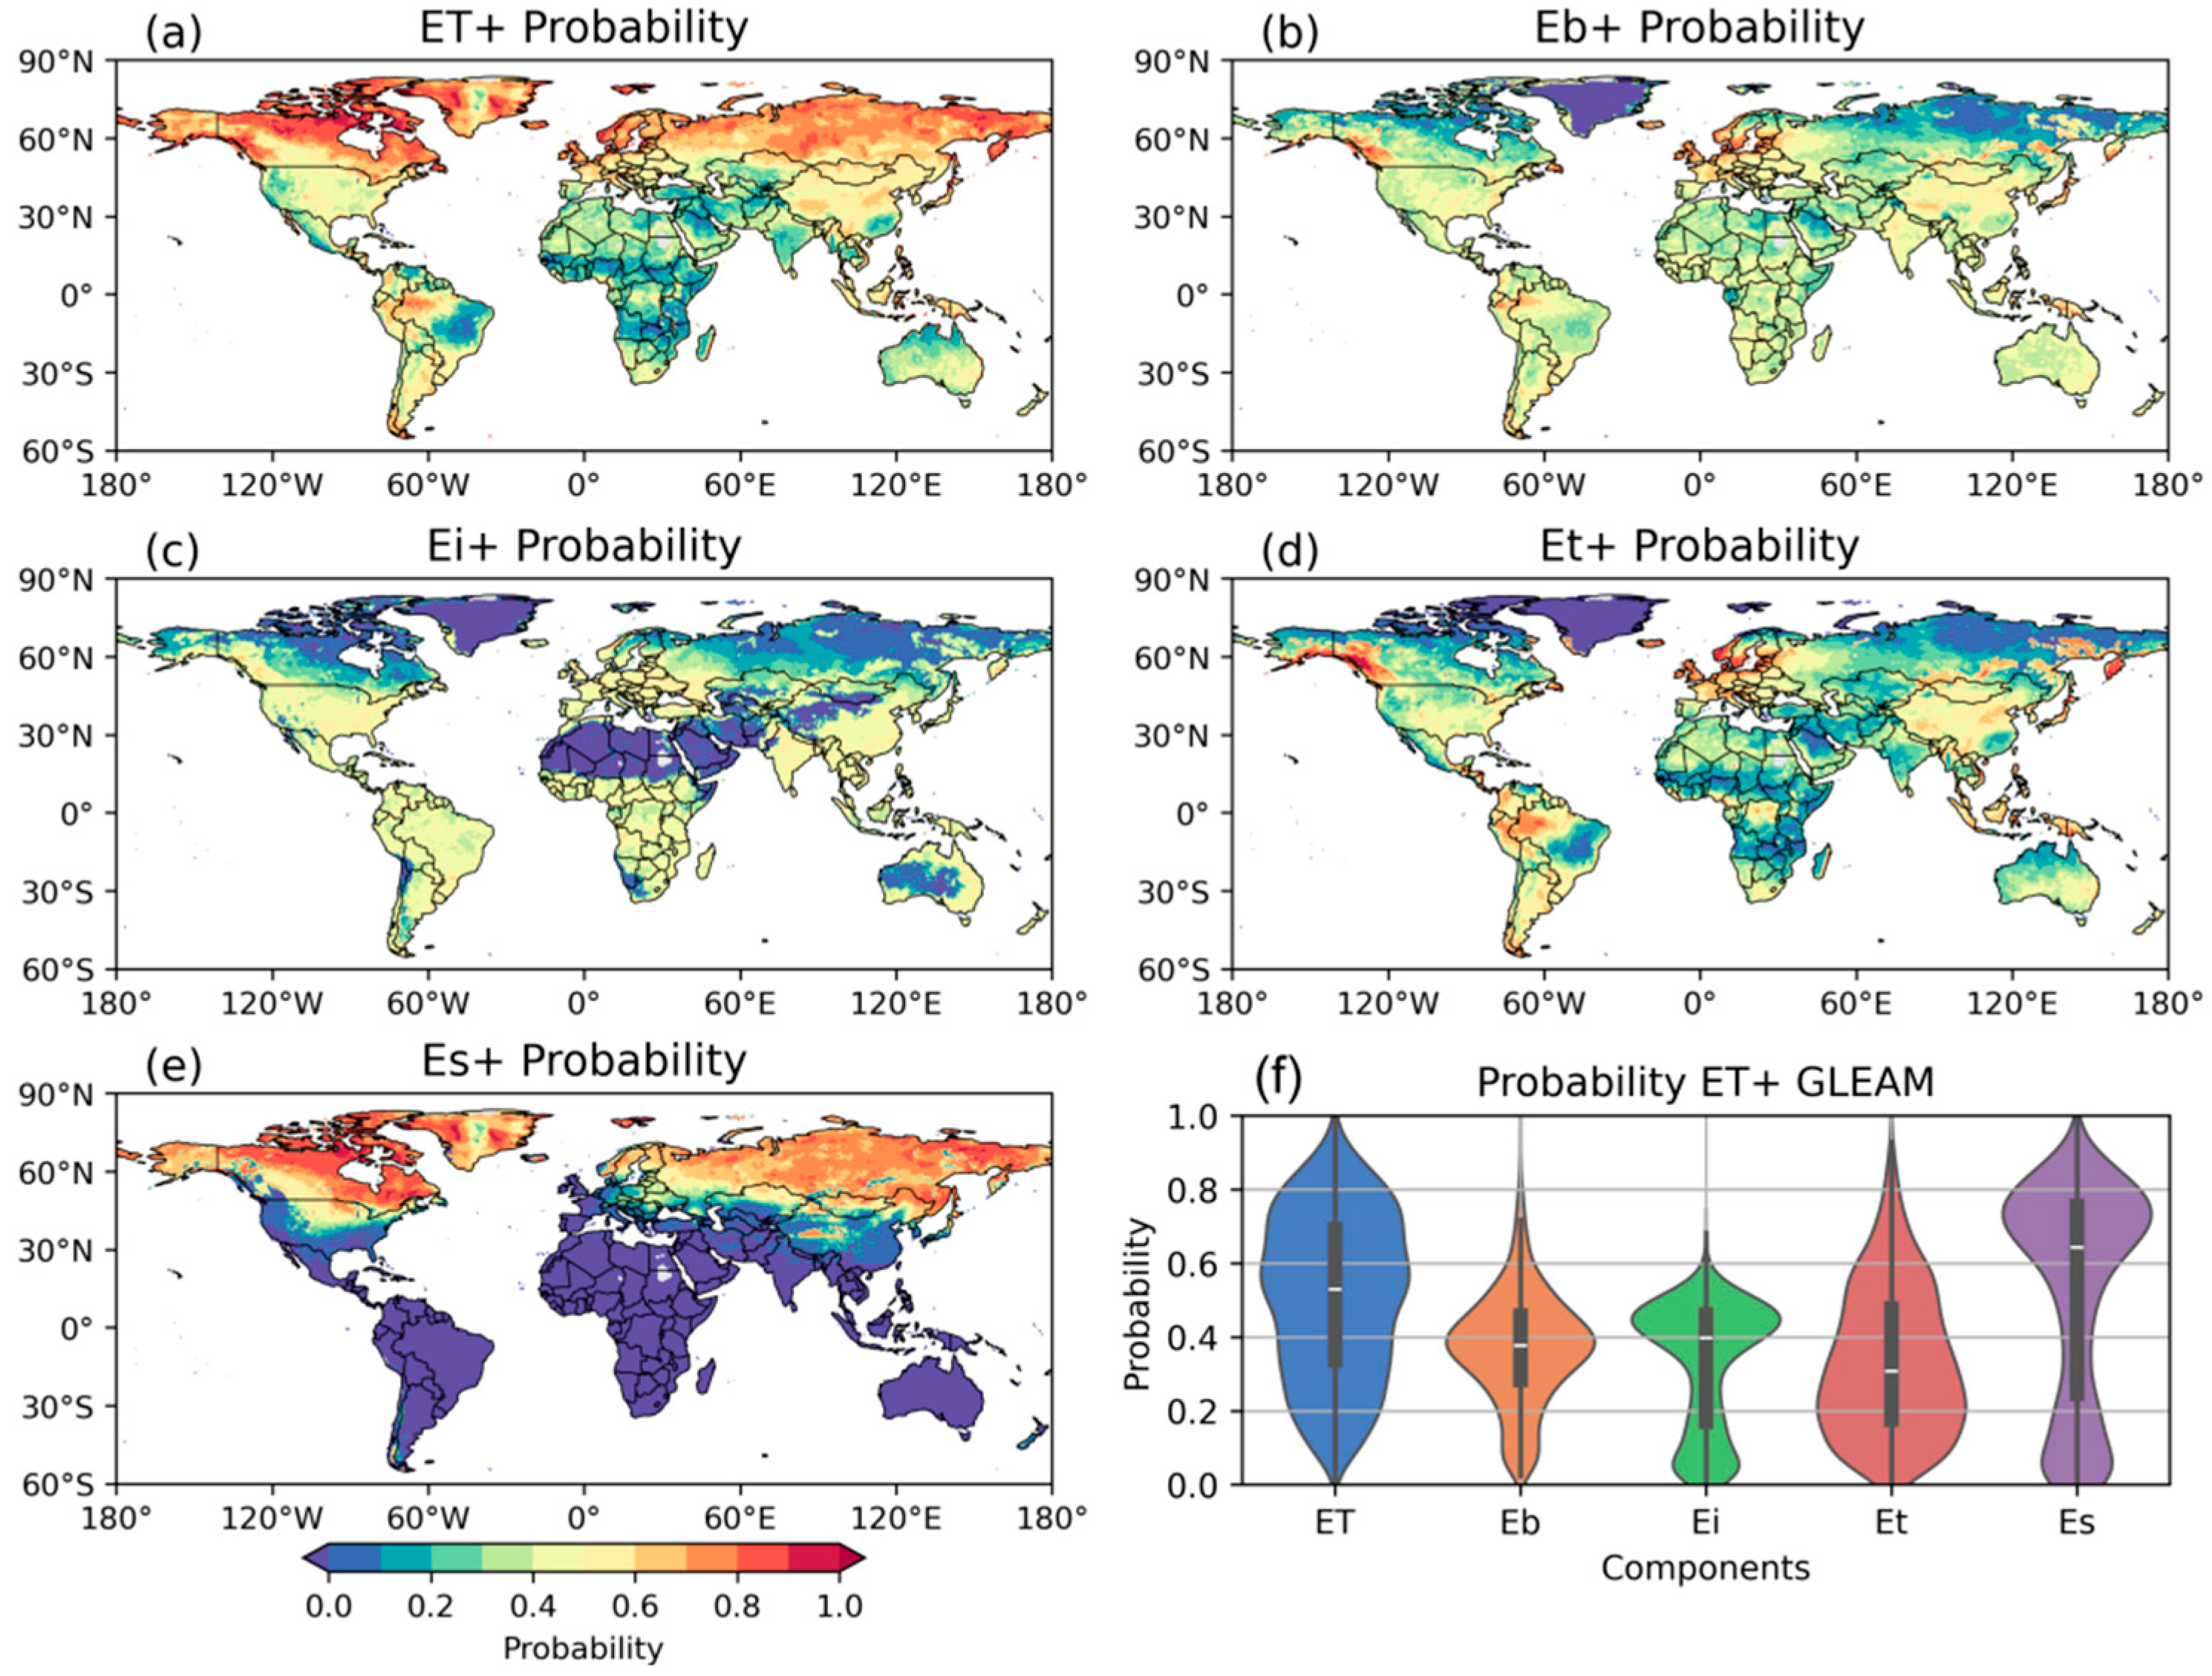
The phenomenon of drought-driven increases in ET, referred to as the ET+ phenomenon, was investigated by analyzing changes in ET and its individual components between drought and non-drought periods. The probability of ET increase during drought months (P(ET+)) was statistically quantified, revealing that the ET+ phenomenon is widespread globally (Figure 6). P(ET+) represents the proportion of months with increased ET or its components relative to the total number of drought months. High P(ET+) values are predominantly observed in high-latitude regions and tropical rainforests, with additional occurrences in continental interiors. In contrast, low P(ET+) values are mainly found in subtropical regions on both sides of the equator (Figure 6a). The global average P(ET+) is approximately 0.52 (Figure 6f), which closely aligns with the findings from previous studies [9].
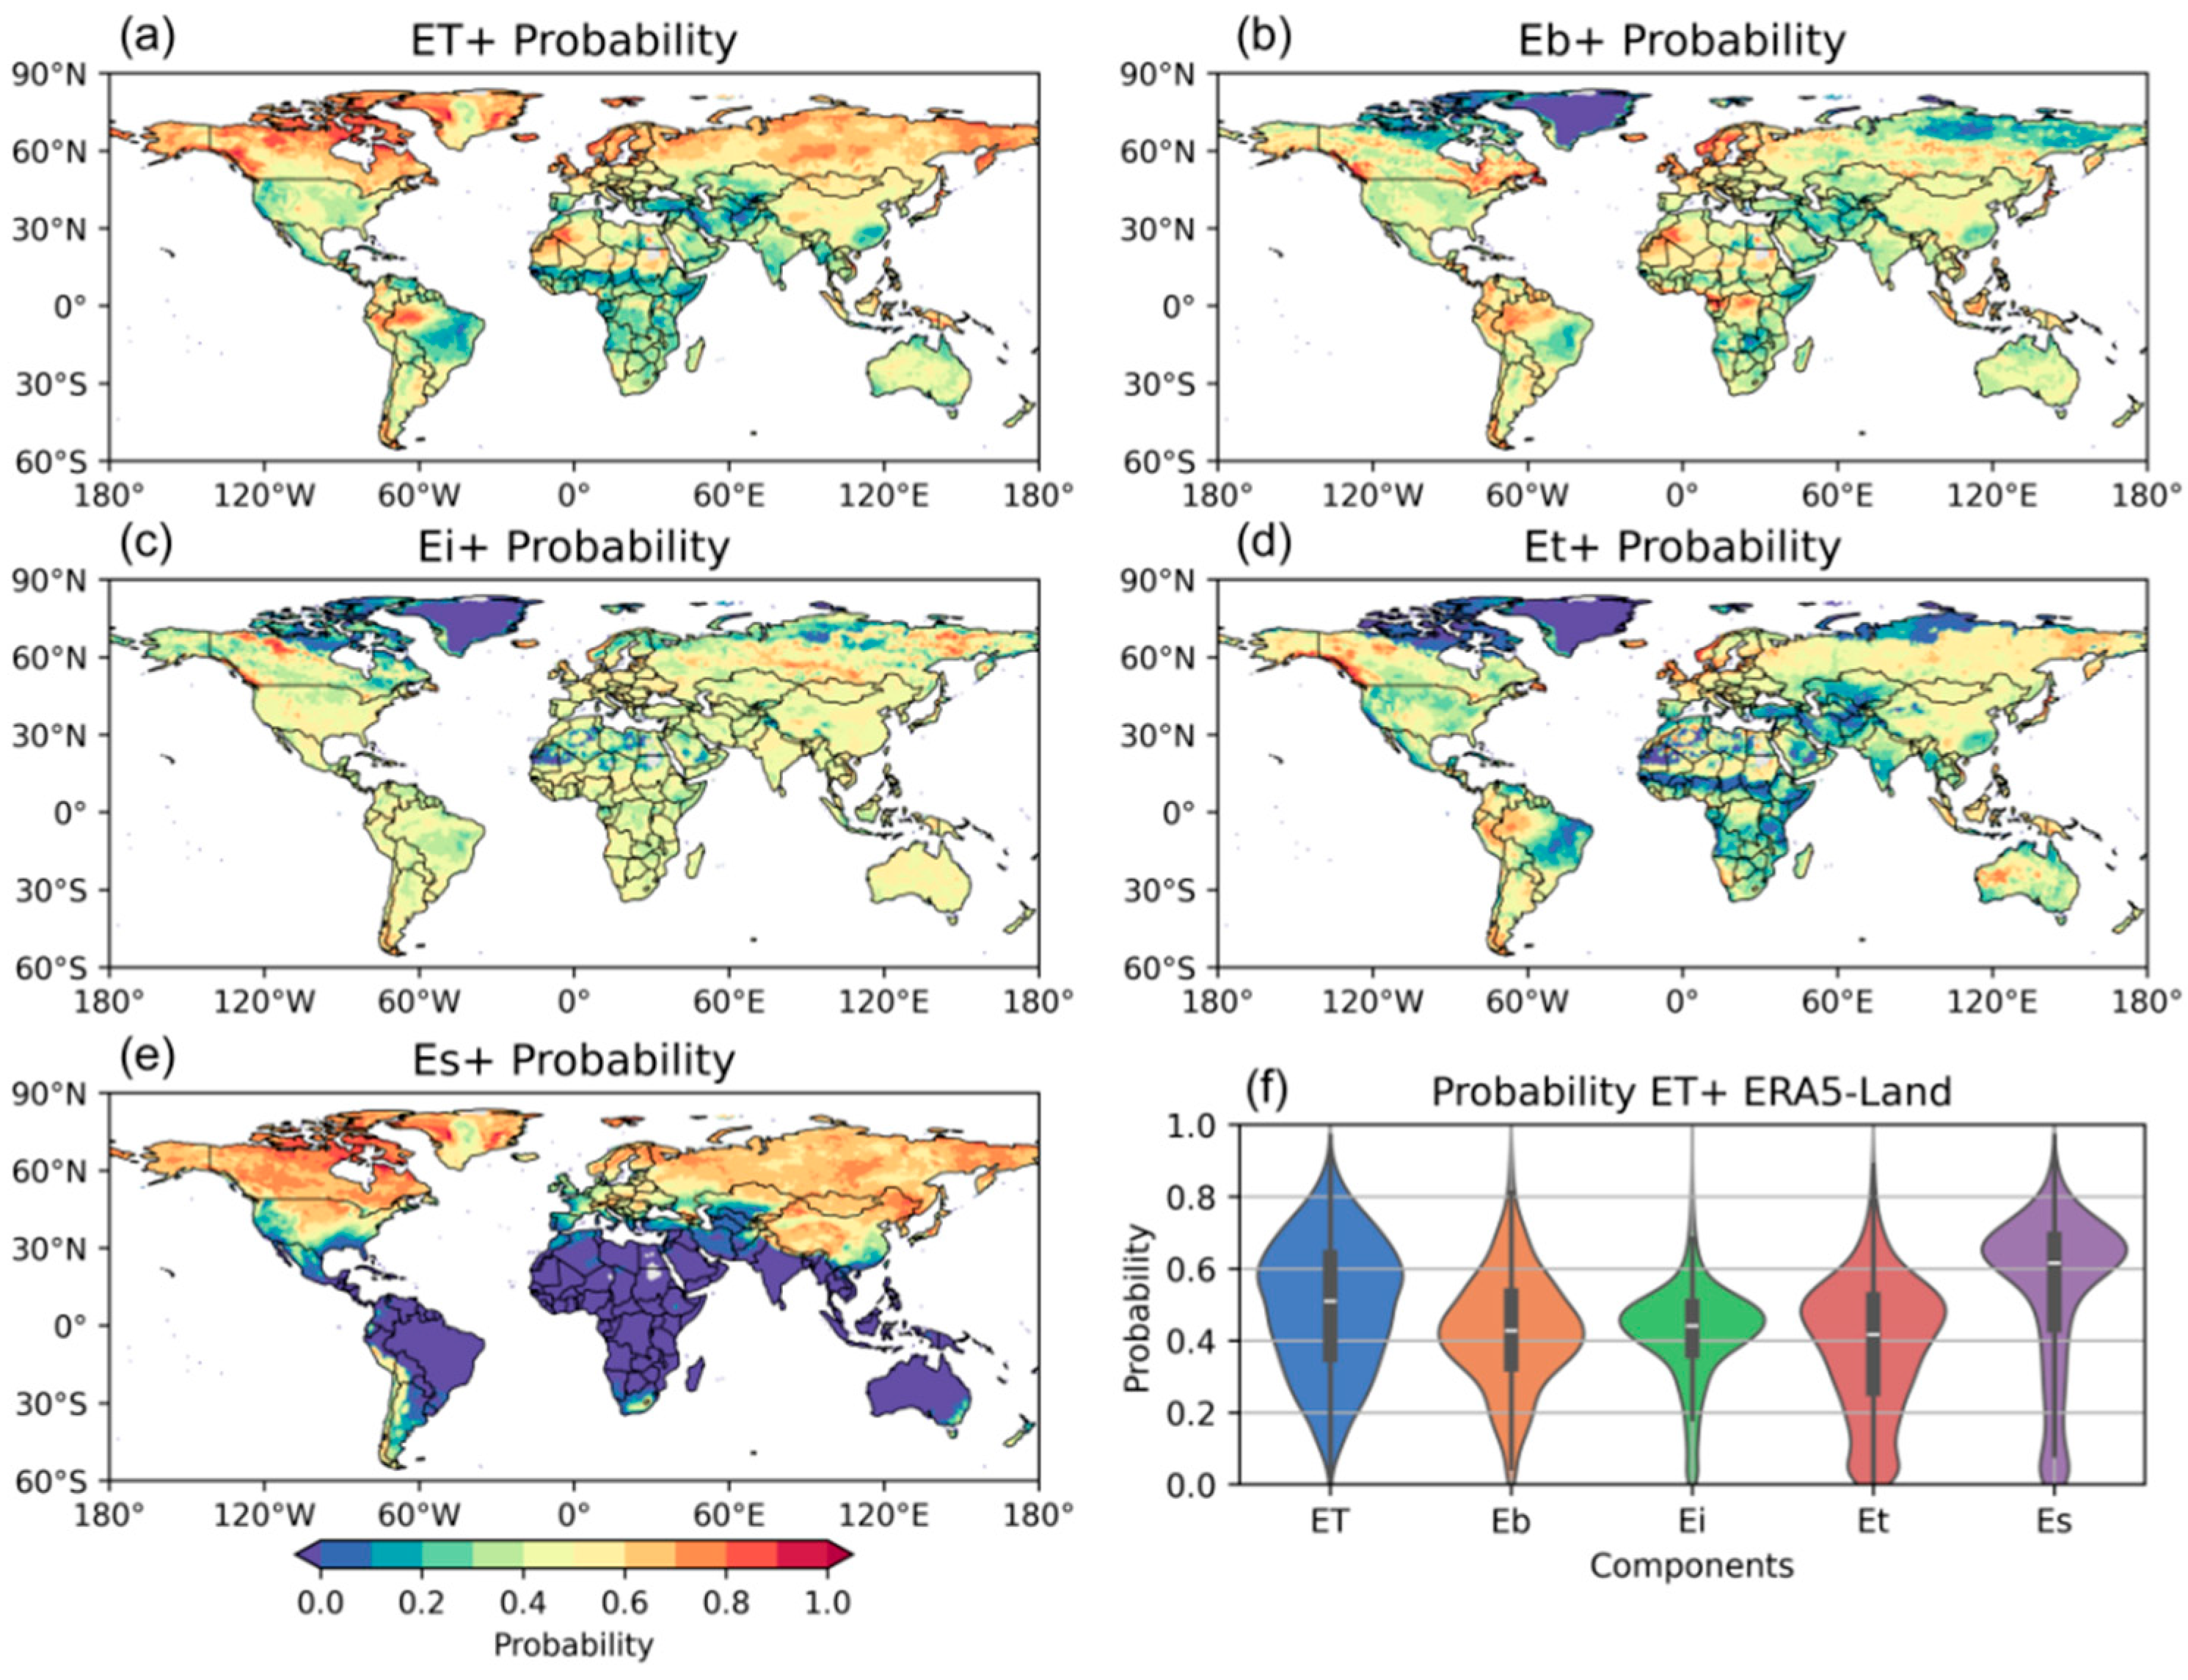
For bare soil evaporation (Eb), the average P(Eb+) is approximately 0.38, with high values concentrated in humid regions along the western coasts of continents, near the equator, and in mid-latitude East Asia. Most regions exhibit P(Eb+) values close to 0.4. For canopy interception evaporation (Ei), the average P(Ei+) is approximately 0.4, with very few regions exceeding 0.5, indicating that Ei tends to decrease during droughts. This is primarily due to the direct impact of reduced precipitation on the amount of water intercepted by vegetation canopies (Figure 6c–f). Since vegetation transpiration (Et) dominates ET, the spatial distribution of P(Et+) closely resembles that of P(ET+) in most mid- and low-latitude regions (Figure 6a–d). However, discrepancies arise in high-latitude regions, where Et tends to decrease while total ET increases. This is largely attributed to the dominant role of snow sublimation (Es) in ET at high latitudes, where Es commonly increases during droughts (Figure 6e), driving the overall increase in ET in these regions. Validation with ERA5-Land dataset yielded results consistent with those from GLEAM (Figure 7), with minor differences observed in high-latitude regions for P(Ei+) and mid-latitude regions for P(Et+), where ERA5-Land estimates slightly higher probabilities (Figure 7c–e).

3.4. Temporal Variation of ET Components During Drought Events

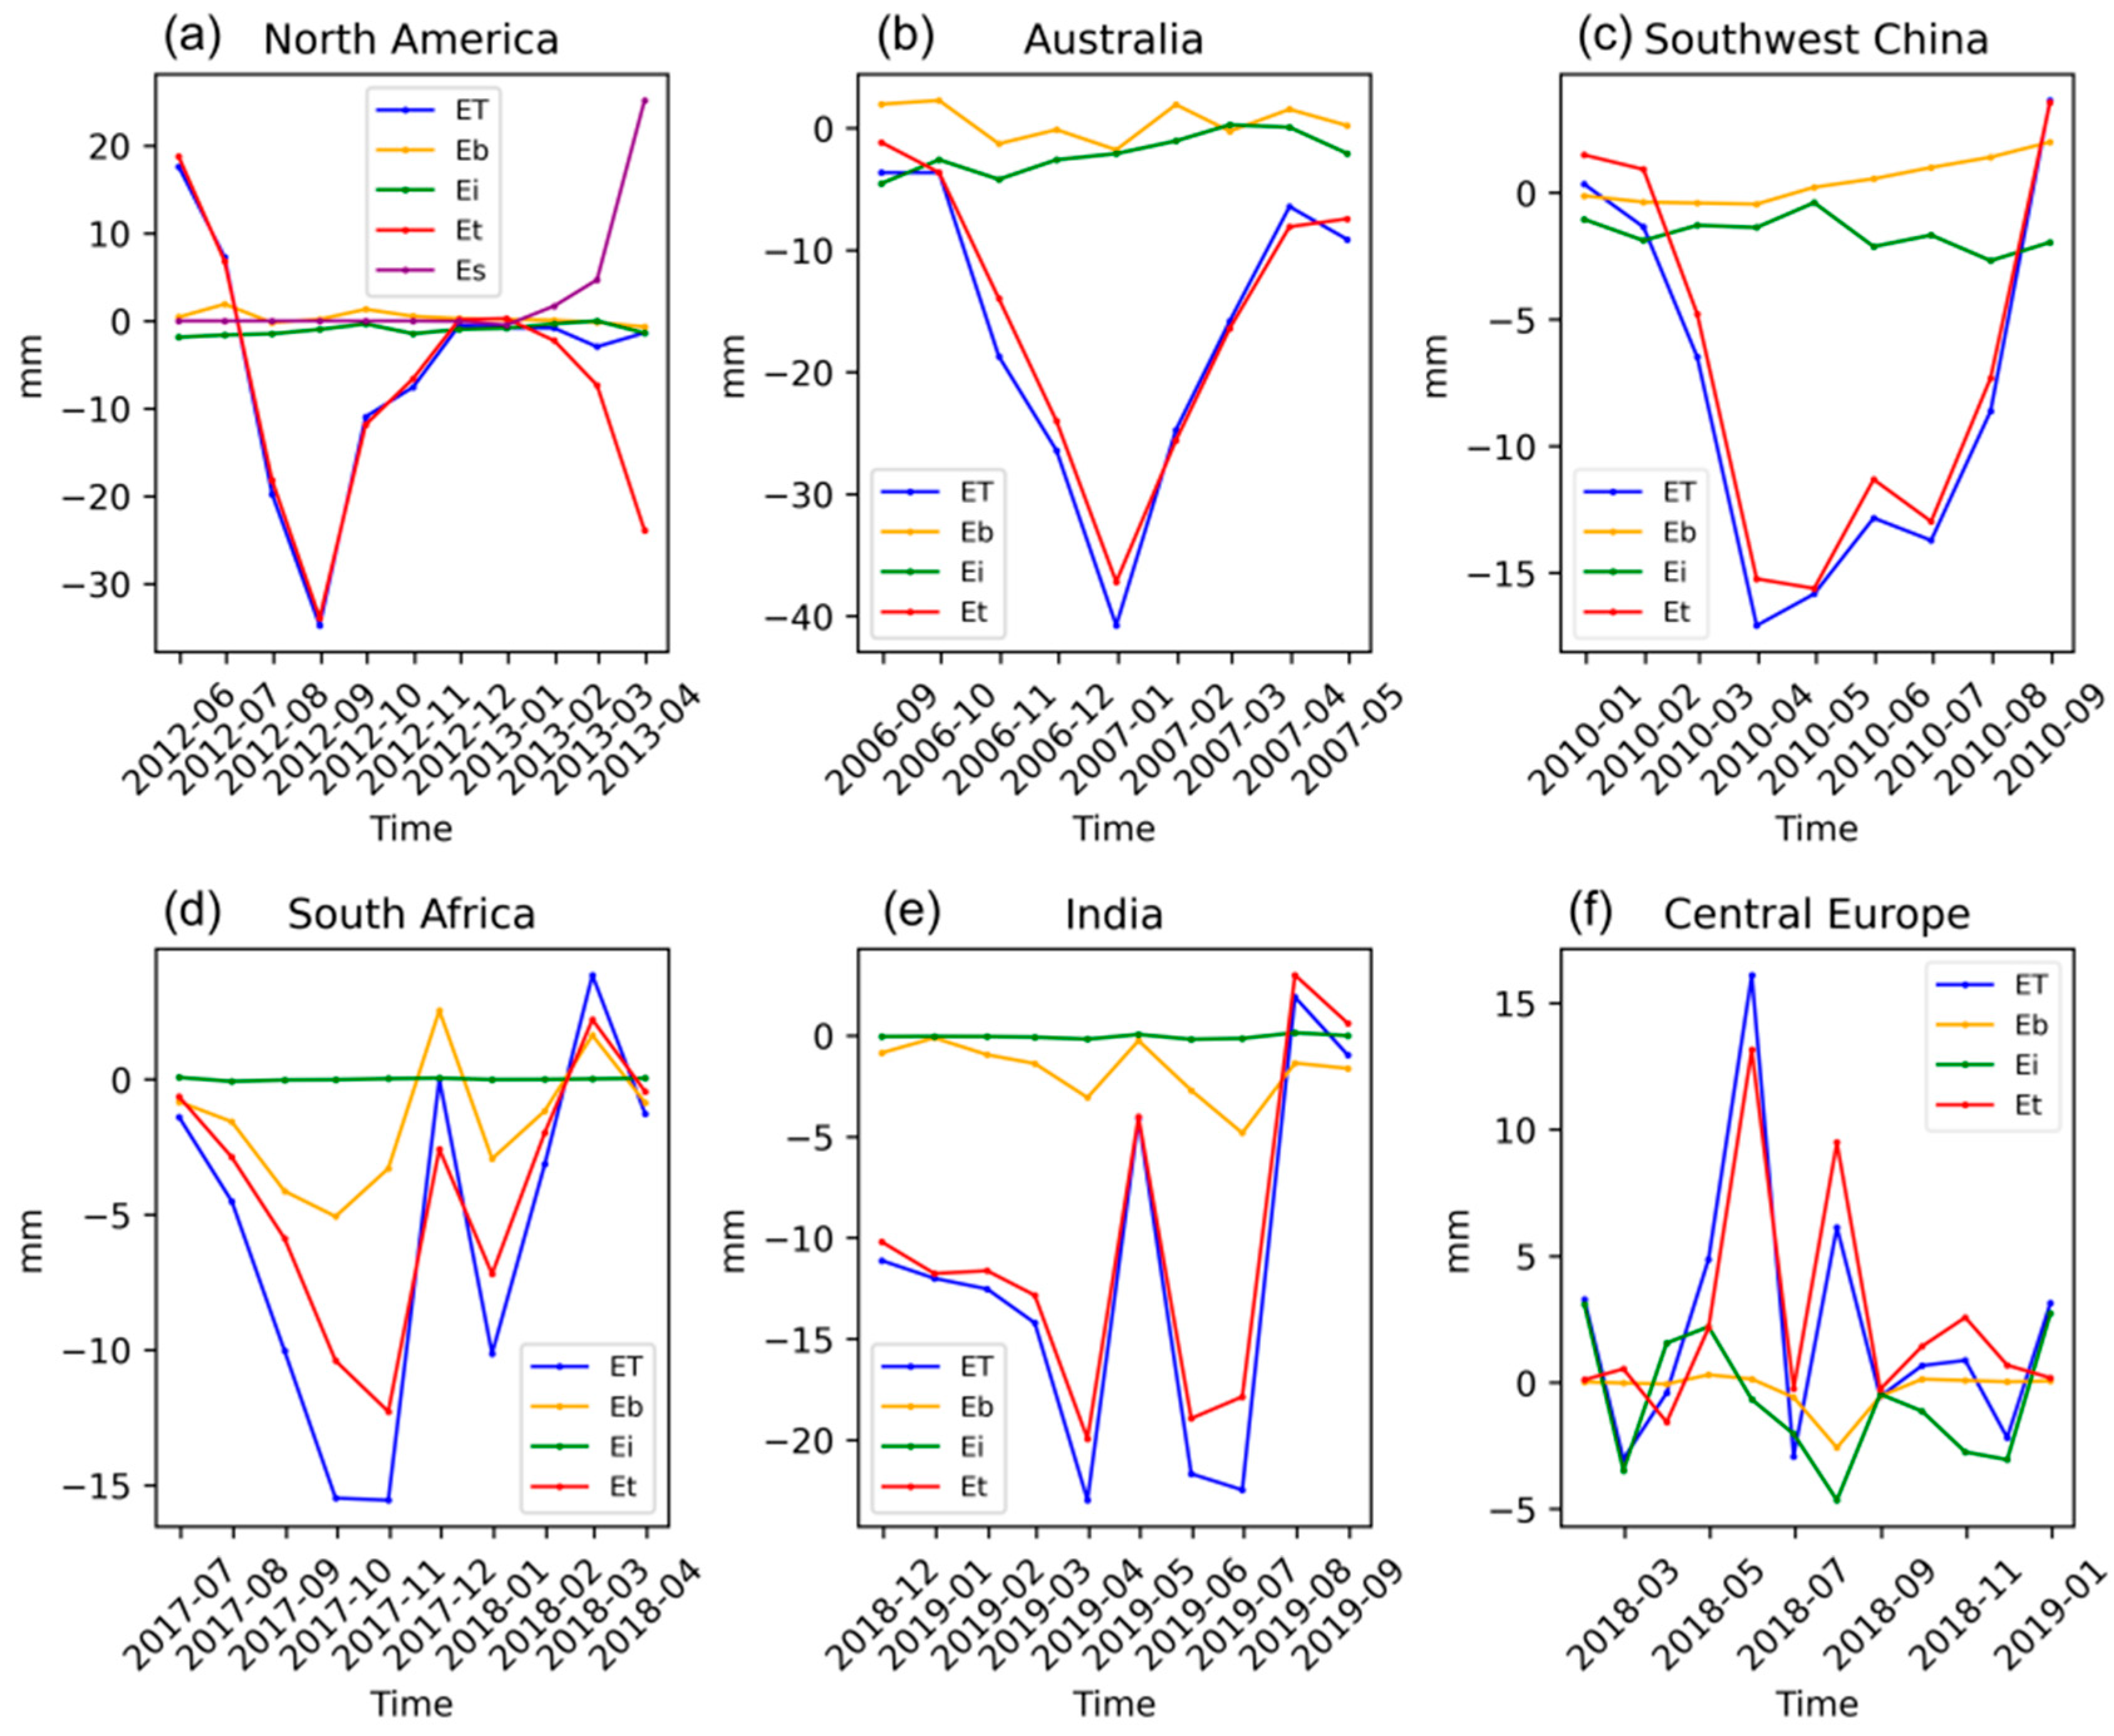
To characterize ET dynamics during droughts, this study further investigated the concurrent variations in ET and its components during typical drought events across global regions (Figure 8). These drought events were notable for their high intensity and widespread impacts, which have caused significant losses in agricultural production and human livelihoods [29,30]. In general, surface water loss is severe during meteorological drought periods, among which vegetation transpiration (Et) is the dominant component, followed by soil evaporation (Eb). Interception evaporation (Ei) showed negligible changes (Figure 8). On average over the long term, Ei is largely influenced by precipitation. However, there is very little precipitation during drought periods, which means Ei should be not significantly affected by rainfall patterns during droughts. This is why, as shown in Figure 8, there is almost no change in Ei during the drought. It is worth noting that in areas covered with snow (Figure 4a), the decrease in Et may be offset by the increase in snow sublimation (Es), thereby resulting in the minimal change in total ET.
Among the studied drought events, the ET variation curves primarily followed two patterns: (1) a unimodal pattern, in which ET initially decreased significantly, reached a trough, and then gradually returned to near-normal levels, indicating seasonal drought characteristics (Figure 8a–c); and (2) a bimodal or multimodal pattern, where ET initially decreased, then increased significantly, and subsequently decreased again, showing a decrease-increase-decrease trend (Figure 8d–f). The latter pattern, characterized by sharp fluctuations in ET during specific drought months, is typically associated with compound extreme heat and drought events [15]. Extreme high-temperature events in May 2018, December 2017, and April 2019 in the corresponding regions may have contributed to these dramatic fluctuations in ET [20,31,32,33,34,35,36]. These ET patterns are most likely related to soil water supply and vegetation cover conditions prior to drought, but the underlying mechanisms need to be further explored in future studies.

4. Discussion

This study presents the first global, monthly-scale quantitative analysis of changes in ET components during droughts. Our findings reveal a predominant pattern of ET frequent increases, consistent with the previous study of [9]. However, we also uncover widespread and asymmetric responses among individual ET components. The ET+ phenomenon is observed in the drought evolution process, with a global average probability of approximately 0.5. This phenomenon, particularly driven by significant increases in snow sublimation over high-latitude regions (Es, P(Es+) ≈ 0.7), challenges the simplistic view of uniform ET decline and highlights the complexity of land-atmosphere interactions under water stress.
The asymmetric behavior of ET components is striking. Both P(Eb+) and P(Ei+) approximate 0.4, P(Et+) is around 0.3, and P(Es+) is close to 0.7. This divergence highlights distinct drought adaptation pathways, that is, soil and canopy evaporation respond moderately, vegetation transpiration relatively suppresses water loss, while snow-dominated systems exhibit amplified evaporation under dry-cold synergy. This pronounced increase in Es, predominantly observed in mid-to-high latitudes, is a critical finding that is often overlooked due to its relatively small absolute magnitude under freezing conditions [37]. Incorporating Es+ anomalies elevates the global P(ET+) to approximately 0.5, significantly altering the perceived overall ET response to drought. This highlights the non-negligible contribution of cryospheric processes to the terrestrial water cycle during droughts, even in non-glaciated regions.
Contrary to the general decrease in ET over water-limited regions, transpiration (Et) increases in humid regions during droughts. This response suggests distinct ecosystem water-use strategies under moisture stress in energy-limited environments [38]. We posit this may result from enhanced root water uptake efficiency driven by plant physiological adaptations and/or increased atmospheric demand coinciding with initially sufficient deep soil moisture reserves [39]. In densely vegetated areas, sustained or even increased ET may occur if soil moisture remains accessible beyond the rooting zone affected by initial drying [40]. Conversely, arid regions lack such buffers and thus the tight coupling between atmospheric demand and soil moisture limitation typically leads to a reduction in ET.
Drought intensity emerges as a key modulator of ET component dynamics, revealing a non-linear response. Our findings suggest that under mild drought conditions, total ET decreases, but this reduction is partially offset by the increases in evaporation from bare soil (Eb) and sublimation (Es), leading to minimal changes in overall ET [41]. In contrast, under severe drought conditions, all ET components tend to present an increase, with more intense droughts resulting in a greater increase. However, during extreme drought conditions, the increase in ET is constrained by a lack of available soil moisture to meet the atmospheric evaporation demand. The observed asymmetry in ET component responses likely stems from the interplay of diverse factors, including soil moisture and vegetation heterogeneity, drought intensity and duration, and climate zones.
Our findings have significant implications for understanding the land-atmosphere interactions and for improving the simulation of ET during drought conditions. Current land surface and climate models often struggle to accurately partition ET or capture its component-specific responses to drought. Explicitly representing the asymmetric behaviors and interactions of Eb, Ei, Et, and Es, particularly the role of Es and the increase in Et in humid regions, is crucial for enhancing the accuracy of ET simulations and drought forecasts within Earth system models. While leveraging advanced global datasets (e.g., GLEAM), our analysis is constrained by inherent uncertainties in ET component partitioning. Accurately capturing dynamic vegetation physiological changes (e.g., stomatal conductance collapse) and their impact on Et remains challenging for state-of-the-art surface flux products, especially under extreme drought or aerosol contamination conditions that alter surface radiation regimes and leaf properties [42]. Furthermore, validating the ET changes, particularly Es and Ei, with ground observations is inherently difficult. Therefore, future research should focus on improving ET partitioning schemes for drought conditions, integrating in situ and remote sensing data for better validation, and investigating the ecohydrological mechanisms driving ET variations.

5. Conclusions

This study establishes the global quantification of drought-induced ET changes through integrated analysis of SPI-defined drought events and multi-source ET products. It specifically reveals differential responses across ET components and their interactions in modulating drought impacts. The key conclusions are summarized as follows:
(1)
The ET+ phenomenon is commonly observed during droughts, with a global average P(ET+) of approximately 0.5. In high-latitude regions, the increase in snow sublimation (Es) is a key contributor to ET+. In humid regions, the increase in transpiration (Et) plays a significant role in the overall increase in ET during droughts. Snow sublimation (Es) also increases in most high-latitude areas during meteorological droughts. While mild droughts may cause a reduction in ET, this reduction can be partially offset by increases in Eb and Es.
(2)
Event-based analysis indicates that the changes in ET during droughts primarily follow unimodal or bimodal patterns. The unimodal pattern is marked by a gradual decrease in ET during the early stages of drought, followed by a recovery in later stages. In contrast, the bimodal pattern involves sharp fluctuations in ET.
(3)
Our findings emphasize the importance of addressing the responses of individual ET components to drought separately, highlighting the need for region-specific strategies to mitigate drought stress.

Author Contributions

Conceptualization, methodology, formal analysis, writing—original draft preparation, writing—review and editing, R.W.; visualization, formal analysis, data curation, writing—original draft preparation, H.Z. All authors have read and agreed to the published version of the manuscript.

Funding

This study was supported by the National Natural Science Foundation of China (42201028) and the Natural Science Foundation of Jiangsu Province of China (BK20220455).

Data Availability Statement

The GLEAM data used in this study can be obtained at https://www.gleam.eu/ (accessed on 1 September 2024), the ERA5-Land data can be obtained from the Climate reanalysis of ECMWF at https://www.ecmwf.int/en/forecasts/datasets (accessed on 1 September 2024), and the CRU precipitation data can be obtained at https://climatedataguide.ucar.edu/climate-data (accessed on 1 September 2024).

Acknowledgments

We thank the academic community (GLEAM, ECMWF, and CRU) for opening up and sharing the datasets used in this study online. We also thank the three anonymous reviewers and the academic editor for their valuable comments.

Conflicts of Interest

The authors declare no conflicts of interest.

References

  1. Williams, A.P.; Allen, C.D.; Macalady, A.K.; Griffin, D.; Woodhouse, C.A.; Meko, D.M.; Swetnam, T.W.; Rauscher, S.A.; Seager, R.; Grissino-Mayer, H.D.; et al. Temperature as a potent driver of regional forest drought stress and tree mortality. Nat. Clim. Change 2013, 3, 292–297. [Google Scholar] [CrossRef]
  2. Mohammed, R.; Scholz, M. Impact of Evapotranspiration Formulations at Various Elevations on the Reconnaissance Drought Index. Water Resour. Manag. 2017, 31, 531–548. [Google Scholar] [CrossRef]
  3. Oyounalsoud, M.S.; Yilmaz, A.G.; Abdallah, M.; Abdeljaber, A. Drought prediction using artificial intelligence models based on climate data and soil moisture. Sci. Rep. 2024, 14, 19700. [Google Scholar] [CrossRef]
  4. Bhaga, T.D.; Dube, T.; Shekede, M.D.; Shoko, C. Impacts of Climate Variability and Drought on Surface Water Resources in Sub-Saharan Africa Using Remote Sensing: A Review. Remote Sens. 2020, 12, 4184. [Google Scholar] [CrossRef]
  5. Singer, M.B.; Asfaw, D.T.; Rosolem, R.; Cuthbert, M.O.; Miralles, D.G.; MacLeod, D.; Quichimbo, E.A.; Michaelides, K. Hourly potential evapotranspiration at 0.1° resolution for the global land surface from 1981-present. Sci. Data 2021, 8, 224. [Google Scholar] [CrossRef] [PubMed]
  6. Bidabadi, M.; Babazadeh, H.; Shiri, J.; Saremi, A. Estimation reference crop evapotranspiration (ET0) using artificial intelligence model in an arid climate with external data. Appl. Water Sci. 2024, 14, 3. [Google Scholar] [CrossRef]
  7. Wang, R.; Li, L.; Gentine, P.; Zhang, Y.; Chen, J.; Chen, X.; Chen, L.; Ning, L.; Yuan, L.; Lü, G. Recent increase in the observation-derived land evapotranspiration due to global warming. Environ. Res. Lett. 2022, 17, 024020. [Google Scholar] [CrossRef]
  8. Wang, R.; Li, L.; Chen, L.; Ning, L.; Yuan, L.; Lü, G. Respective contributions of precipitation and potential evapotranspiration to long-term changes in global drought duration and intensity. Int. J. Climatol. 2022, 42, 10126–10137. [Google Scholar] [CrossRef]
  9. Zhao, M.; Geruo, A.; Liu, Y.; Konings, A.G. Evapotranspiration frequently increases during droughts. Nat. Clim. Change 2022, 12, 1024–1030. [Google Scholar] [CrossRef]
  10. Orth, R.; Seneviratne, S.I. Analysis of soil moisture memory from observations in Europe. J. Geophys. Res. Atmos. 2012, 117, D15115. [Google Scholar] [CrossRef]
  11. Teuling, A.J.; van Loon, A.F.; Seneviratne, S.I.; Lehner, I.; Aubinet, M.; Heinesch, B.; Bernhofer, C.; Grünwald, T.; Prasse, H.; Spank, U. Evapotranspiration amplifies European summer drought. Geophys. Res. Lett. 2013, 40, 2071–2075. [Google Scholar] [CrossRef]
  12. Miralles, D.G.; Teuling, A.J.; van Heerwaarden, C.C.; Vilà-Guerau de Arellano, J. Mega-heatwave temperatures due to combined soil desiccation and atmospheric heat accumulation. Nat. Geosci. 2012, 5, 739–743. [Google Scholar] [CrossRef]
  13. Novick, K.A.; Ficklin, D.L.; Stoy, P.C.; Williams, C.A.; Bohrer, G.; Oishi, A.C.; Papuga, S.A.; Blanken, P.D.; Noormets, A.; Sulman, B.N.; et al. The increasing importance of atmospheric demand for ecosystem water and carbon fluxes. Nat. Clim. Change 2016, 6, 1023–1027. [Google Scholar] [CrossRef]
  14. Frank, D.C.; Poulter, B.; Saurer, M.; Esper, J.; Huntingford, C.; Helle, G.; Treydte, K.; Zimmermann, N.E.; Schleser, G.H.; Ahlström, A.; et al. Water-use efficiency and transpiration across European forests during the Anthropocene. Nat. Clim. Change 2015, 5, 579–583. [Google Scholar] [CrossRef]
  15. Wang, R.; Lü, G.; Ning, L.; Yuan, L.; Li, L. Likelihood of compound dry and hot extremes increased with stronger dependence during warm seasons. Atmos. Res. 2021, 260, 105692. [Google Scholar] [CrossRef]
  16. Seneviratne, S.I.; Corti, T.; Davin, E.L.; Hirschi, M.; Jaeger, E.B.; Lehner, I.; Orlowsky, B.; Teuling, A.J. Investigating soil moisture–climate interactions in a changing climate: A review. Earth-Sci. Rev. 2010, 99, 125–161. [Google Scholar] [CrossRef]
  17. Miralles, D.G.; van den Berg, M.J.; Teuling, A.J.; de Jeu, R.A.M. Soil moisture-temperature coupling: A multiscale observational analysis. Geophys. Res. Lett. 2012, 39, L21707. [Google Scholar] [CrossRef]
  18. Jiang, Y.; Yang, M.; Liu, W.; Mohammadi, K.; Wang, G. Eco-hydrological responses to recent droughts in tropical South America. Environ. Res. Lett. 2022, 17, 114034. [Google Scholar] [CrossRef]
  19. Zhang, Y.; Liu, X.; Wang, K.; Bai, P. Response of evapotranspiration to the 2022 unprecedented extreme drought in the Yangtze River Basin. Int. J. Climatol. 2024, 44, 2779–2791. [Google Scholar] [CrossRef]
  20. Harris, I.; Osborn, T.J.; Jones, P.; Lister, D. Version 4 of the CRU TS monthly high-resolution gridded multivariate climate dataset. Sci. Data 2020, 7, 109. [Google Scholar] [CrossRef]
  21. Miralles, D.G.; De Jeu, R.A.M.; Gash, J.H.; Holmes, T.R.H.; Dolman, A.J. Magnitude and variability of land evaporation and its components at the global scale. Hydrol. Earth Syst. Sci. Discuss. 2011, 15, 967–981. [Google Scholar] [CrossRef]
  22. Martens, B.; Miralles, D.G.; Lievens, H.; van der Schalie, R.; de Jeu, R.A.M.; Fernández-Prieto, D.; Beck, H.E.; Dorigo, W.A.; Verhoest, N.E.C. GLEAM v3: Satellite-based land evaporation and root-zone soil moisture. Geosci. Model Dev. 2017, 10, 1903–1925. [Google Scholar] [CrossRef]
  23. Miralles, D.G.; Holmes, T.R.H.; De Jeu, R.A.M.; Gash, J.H.; Meesters, A.G.C.A.; Dolman, A.J. Global land-surface evaporation estimated from satellite-based observations. Hydrol. Earth Syst. Sci. 2011, 15, 453–469. [Google Scholar] [CrossRef]
  24. Priestley, C.H.B.; Taylor, R.J. On the assessment of surface heat flux and evaporation using large-scale parameters. Mon. Weather. Rev. 1972, 100, 81–92. [Google Scholar] [CrossRef]
  25. Muñoz Sabater, J. ERA5-Land Monthly Averaged Data from 1950 to Present. Copernicus Climate Change Service (C3S) Climate Data Store (CDS). 2019. Available online: https://cds.climate.copernicus.eu/datasets/reanalysis-era5-land-monthly-means?tab=overview (accessed on 4 August 2025).
  26. Panwar, A.; Kleidon, A. Evaluating the response of diurnal variations in surface and air temperature to evaporative conditions across vegetation types in FLUXNET and ERA5. J. Clim. 2022, 35, 6301–6328. [Google Scholar] [CrossRef]
  27. McKee, T.B.; Doesken, N.J.; Kleist, J. The relationship of drought frequency and duration to time scales. In Proceedings of the 8th Conference on Applied Climatology, Anaheim, CA, USA, 17–22 January 1993; Volume 17, pp. 179–183. [Google Scholar]
  28. Kourtis, I.M.; Vangelis, H.; Tigkas, D.; Mamara, A.; Nalbantis, I.; Tsakiris, G.; Tsihrintzis, V.A. Drought assessment in Greece using SPI and ERA5 climate reanalysis data. Sustainability 2023, 15, 15999. [Google Scholar] [CrossRef]
  29. Hoerling, M.; Eischeid, J.; Kumar, A.; Leung, R.; Mariotti, A.; Mo, K.; Schubert, S.; Seager, R. Causes and predictability of the 2012 Great Plains drought. Bull. Am. Meteorol. Soc. 2014, 95, 269–282. [Google Scholar] [CrossRef]
  30. Ummenhofer, C.C.; England, M.H.; McIntosh, P.C.; Meyers, G.A.; Pook, M.J.; Risbey, J.S.; Gupta, A.S.; Taschetto, A.S. What causes southeast Australia’s worst droughts? Geophys. Res. Lett. 2009, 36, L04706. [Google Scholar] [CrossRef]
  31. Santos, C.A.; Brasil Neto, R.M.; Nascimento, T.V.; Silva, R.M.; Mishra, M.; Frade, T.G. Geospatial drought severity analysis based on PERSIANN-CDR-estimated rainfall data for Odisha state in India (1983–2018). Sci. Total Environ. 2020, 750, 141258. [Google Scholar] [CrossRef]
  32. Odoulami, R.C.; Wolski, P.; New, M.G. Attributing the driving mechanisms of the 2015–2017 drought in the Western Cape (South Africa) using self-organising maps. Environ. Res. Lett. 2023, 18, 074043. [Google Scholar] [CrossRef]
  33. Yang, Y.; Roderick, M.L.; Guo, H.; Miralles, D.G.; Zhang, L.; Fatichi, S.; Luo, X.; Zhang, Y.; McVicar, T.R.; Tu, Z.; et al. Evapotranspiration on a greening Earth. Nat. Rev. Earth Environ. 2023, 4, 626–641. [Google Scholar] [CrossRef]
  34. Hari, V.; Rakovec, O.; Markonis, Y.; Hanel, M.; Kumar, R. Increased future occurrences of the exceptional 2018–2019 Central European drought under global warming. Sci. Rep. 2020, 10, 12207. [Google Scholar] [CrossRef]
  35. Zhang, Y.; Peña-Arancibia, J.L.; McVicar, T.R.; Chiew, F.H.; Vaze, J.; Liu, C.; Lu, X.; Zheng, H.; Wang, Y.; Liu, Y.Y.; et al. Multi-decadal trends in global terrestrial evapotranspiration and its components. Sci. Rep. 2016, 6, 19124. [Google Scholar] [CrossRef]
  36. Barriopedro, D.; Gouveia, C.M.; Trigo, R.M.; Wang, L. The 2009/10 drought in southwestern China: Possible causes and impacts on vegetation. J. Hydrometeorol. 2012, 13, 1251–1267. [Google Scholar] [CrossRef]
  37. Mtupili, M.; Wang, R.; Gu, L.; Yin, J. Delayed response of soil moisture and hydrological droughts to meteorological drought over East Asia. Int. J. Climatol. 2025, 45, e8883. [Google Scholar] [CrossRef]
  38. Ahmed, K.R.; Paul-Limoges, E.; Rascher, U.; Damm, A. A first assessment of the 2018 European drought impact on ecosystem evapotranspiration. Remote Sens. 2021, 13, 16. [Google Scholar] [CrossRef]
  39. He, K.; Lu, H. Interaction between evapotranspiration and meteorological and hydrological factors in drought events: A case study of the Yangtze River Basin. In Proceedings of the IGARSS 2023—2023 IEEE International Geoscience and Remote Sensing Symposium 2023, Pasadena, CA, USA, 16–21 July 2023; pp. 2835–2838. [Google Scholar]
  40. Cooley, S.S.; Williams, C.A.; Fisher, J.B.; Halverson, G.H.; Perret, J.; Lee, C.M. Assessing regional drought impacts on vegetation and evapotranspiration: A case study in Guanacaste, Costa Rica. Ecol. Appl. 2018, 29, e01834. [Google Scholar] [CrossRef] [PubMed]
  41. Liu, Y.; Kumar, M.; Katul, G.G.; Porporato, A. Plant hydraulics accentuates the effect of atmospheric moisture stress on transpiration. Nat. Clim. Change 2020, 10, 691–695. [Google Scholar] [CrossRef]
  42. Chen, L.; Chen, H.; Du, X.; Wang, R. Retrieval of surface energy fluxes considering vegetation changes and aerosol effects. Remote Sens. 2024, 16, 668. [Google Scholar] [CrossRef]
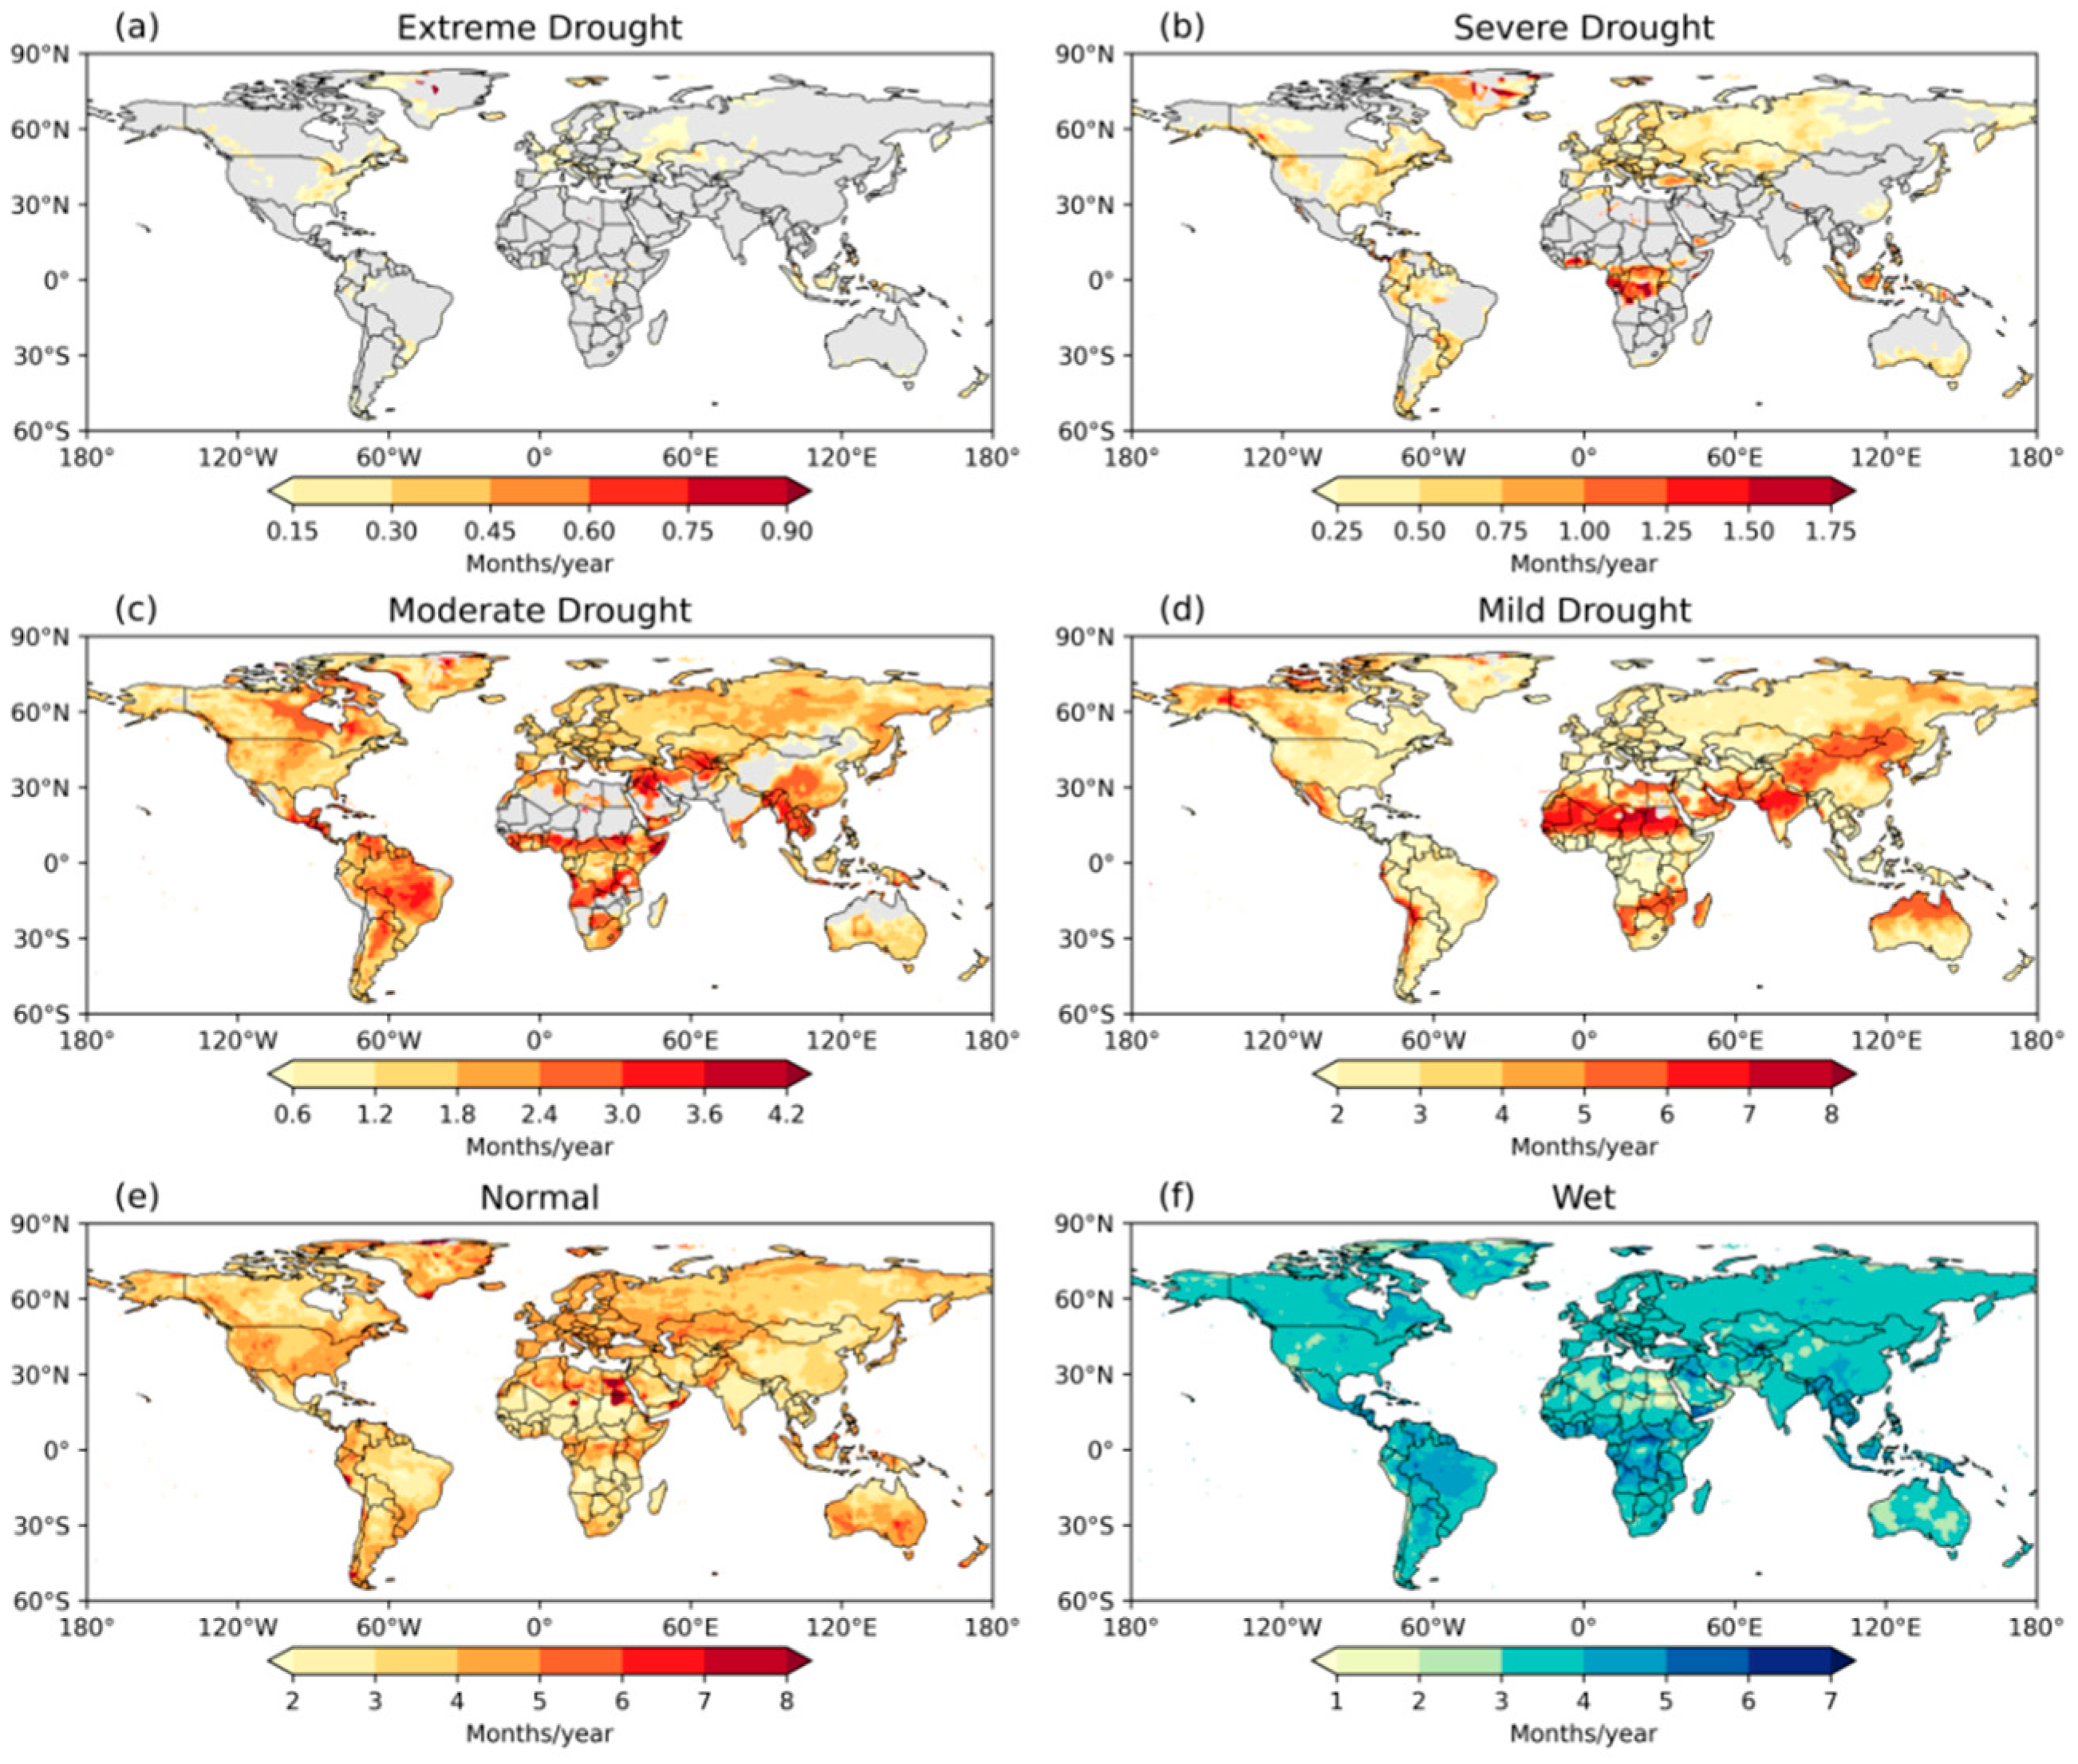
Figure 1. Global spatial patterns of drought event frequency across varying intensities. Darker colors represent higher frequencies of drought events, while lighter colors indicate lower frequencies. Spatial distribution of event occurrence frequency for (a) extreme drought, (b) severe drought, (c) moderate drought, (d) mild drought, (e) normal condition, and (f) wet condition.
Remotesensing 17 02790 g001
Figure 2. Global average of ET and its components during droughts. (a) ET is total evapotranspiration, (b) Eb is bare soil evaporation, (c) Ei is canopy interception evaporation, (d) Et is vegetation transpiration, (e) Es is snow and ice evaporation, and (f) Ew is open water evaporation.
Remotesensing 17 02790 g002
Figure 3. Differences in the ET components between drought and non-drought periods. Red indicates decrease and blue represents increase. Evaporation from open water is not considered, as it does not interact with other components. Spatial distribution of the difference for (a) evapotranspiration (ET), (b) bare soil evaporation (Eb) (c) canopy interception evaporation (Ei), (d) vegetation transpiration (Et), and (e) snow and ice evaporation (Es).
Remotesensing 17 02790 g003
Figure 4. Variations in ET and its individual components during droughts of varying intensities. Two datasets (GLEAM and ERA5-Land) are used for comparison. (a) ET represents total evapotranspiration, (b) Eb refers to bare soil evaporation, (c) Ei is canopy interception evaporation, (d) Et is vegetation transpiration, and (e) Es is snow and ice evaporation. Evaporation from open water is not considered, as it does not interact with the other components.
Remotesensing 17 02790 g004
Figure 5. Averaged variations of ET and its individual components under varying drought intensities.
Remotesensing 17 02790 g005
Figure 6. Global distribution of the probability of increase in ET (P(ET+)) and its components during droughts (2000–2020) from the GLEAM dataset. The figures display the probability of drought-driven increase in (a) ET, (b) Eb, (c) Ei, (d) Et, (e) Es, and (f) a statistical comparison of increased probability across ET components during droughts.
Remotesensing 17 02790 g006
Figure 7. Global distribution of the probability of increase in ET (P(ET+)) and its components during droughts (2000–2020) from the ERA5-Land dataset. The figures display the probability of drought-driven increase in (a) ET, (b) Eb, (c) Ei, (d) Et, (e) Es, and (f) a statistical comparison of increased probability across ET components during droughts.
Remotesensing 17 02790 g007
Figure 8. Temporal variations in different ET components during prolonged droughts: (a) the drought in Central America during 2012–2013, (b) the drought in southeastern Australia during 2006–2007, (c) the Southwest China drought during 2009–2010, (d) the severe drought in South Africa and its surrounding areas during 2017–2018, (e) the drought in western India in 2019, and (f) the drought in Central Europe in 2018.
Remotesensing 17 02790 g008
Disclaimer/Publisher’s Note: The statements, opinions and data contained in all publications are solely those of the individual author(s) and contributor(s) and not of MDPI and/or the editor(s). MDPI and/or the editor(s) disclaim responsibility for any injury to people or property resulting from any ideas, methods, instructions or products referred to in the content.