Article

Assessment of the Applicability of Hue from In Situ Spectral Measurements to Remote Sensing of Plant Phenology

1
Graduate School of Science and Technology, University of Tsukuba, 1-1-1 Tennodai, Tsukuba 305-8572, Ibaraki, Japan
2
Institute for Advanced Academic Research, Chiba University, 1-33 Yayoi-cho, Inage, Chiba 263-8522, Chiba, Japan
3
Earth System Division, National Institute for Environmental Studies, 16-2 Onogawa, Tsukuba 305-8506, Ibaraki, Japan
4
Institute of Life and Environmental Sciences, University of Tsukuba, 1-1-1 Tennodai, Tsukuba 305-8572, Ibaraki, Japan
5
Graduate School of Agricultural and Life Sciences, The University of Tokyo, 1-1-1 Yayoi, Bunkyo, Tokyo 113-8657, Japan
6
Teshio Experimental Forest, Field Science Center for Northern Biosphere, Hokkaido University, 131 Toikanbetsu, Horonobe 098-2943, Hokkaido, Japan
7
Institute for Agro-Environmental Sciences, National Agriculture and Food Research Organization (NARO), 3-1-3 Kannondai, Tsukuba 305-8604, Ibaraki, Japan
*
Author to whom correspondence should be addressed.
Remote Sens. 2025, 17(16), 2767; https://doi.org/10.3390/rs17162767
Submission received: 27 May 2025 / Revised: 19 July 2025 / Accepted: 30 July 2025 / Published: 9 August 2025
(This article belongs to the Section Ecological Remote Sensing)

Abstract

Climate change is accelerating, and the monitoring of plant phenology is becoming increasingly important. In response to this need, many vegetation indices (VIs) and analytical methods have been developed. However, many VIs are vulnerable to uncertainties caused by snowmelt, making them potentially unsuitable for monitoring spring phenology in forested regions where leaf flush (start of season, SOS) begins simultaneously with snowmelt. Although several VIs for snowy regions have been proposed, most of them were designed for tundra vegetation, such as grasslands. Currently, no VI or analytical method specifically suited for snowy forested regions has been firmly established. Similarly, there is still no well-established method for continuously monitoring autumn coloration. In this study, we propose the use of hue, one of the components of the HSV model, for remote sensing of plant phenology. Hue quantifies differences in object color and is expected to facilitate clearer distinction of snow influence. It may also enable accurate detection of canopy color transitions, such as autumn coloration. We evaluate the applicability of hue to remote sensing using in situ spectroradiometer observations collected from five sites of the Phenological Eyes Network (PEN), which represent a range of ecosystems—including forests, grasslands, and paddy fields—as well as the relative spectral response (RSR) of the Second-generation Global Imager (SGLI) onboard the GCOM-C satellite operated by JAXA (Japan Aerospace Exploration Agency). The results suggest that hue is more robust to snow-related uncertainties than traditional VIs (NDVI, EVI, CCI, NDGI) and may also be effective for quantifying autumn coloration. Hue is calculated solely from blue, green, and red reflectance, without relying on near-infrared (NIR) or shortwave infrared (SWIR) channels. Since blue, green and red channels are available on almost all optical satellite sensors, hue may offer broader applicability than many traditional VIs.

1. Introduction

Plant phenology—the seasonal timing of plant events such as spring leaf flush (start of season, SOS), flowering, fruiting, autumn coloration (end of season, EOS), and leaf fall—is a key indicator of climate change [1,2,3,4,5,6]. Climate change influences a variety of environmental factors, including shifts in precipitation patterns and increases in temperature [7,8,9]. These environmental changes alter plant phenology [10,11,12,13,14], potentially leading to phenological mismatches [15] and shifts in species distributions [16,17], which may negatively affect ecosystems. Furthermore, the impacts of climate change extend beyond ecosystems to economic activities [18]. For instance, in Japan, flowering and autumn coloration are important tourism resources that are closely linked to local economies. Therefore, monitoring plant phenology is essential for understanding the ecological and economic impacts of climate change [16].
To monitor vegetation changes at large spatial scales, satellite remote sensing has been widely used in many studies. The most commonly used vegetation index (VI) is the normalized difference vegetation index (NDVI) [19]. To address the issue of saturation in dense vegetation [20,21,22], the enhanced vegetation index (EVI) was developed [23]. However, both NDVI and EVI increase during snowmelt [24,25,26,27], and such increases are often misinterpreted as plant growth. This introduces uncertainty in spring phenology monitoring in snowy regions. In addition, NDVI is considered unsuitable for capturing autumn coloration [26].
To overcome these limitations during snowmelt, various VIs have been proposed. For example, the normalized difference water index (NDWI), normalized difference infrared index (NDII), and green–red vegetation index (GRVI) have been suggested as effective tools to distinguish snowmelt from vegetation growth [25,28,29,30]. These indices typically show a decline in value during snowmelt before leaf flush, reducing the likelihood of confusing snowmelt with subsequent vegetation development. However, in certain vegetation types—such as Japanese beech forests (Fagus crenata) and understory vegetation—snowmelt and leaf flush occur simultaneously (e.g., Figure 1, a beech forest in late May, located at the foot of Mt. Gassan in Yamagata Prefecture, Japan). In such cases, the decline in index values caused by snowmelt and the increase caused by plant growth may offset each other, making it difficult to accurately track phenological transitions. To address this issue, Gonsamo et al. [31] developed the phenology index (PI), which combines the advantages of NDVI and NDII. However, PI struggles to detect phenological changes in areas with low vegetation density [32]. As a solution, Wang et al. [32] proposed the normalized difference phenology index (NDPI), which aims to minimize the influence of snowmelt by reducing the spectral difference between snow and soil reflectance. However, NDPI has been found to be unsuitable for vegetation in arid regions [33]. Yang et al. [33] developed the normalized difference greenness index (NDGI) for monitoring tundra and grassland ecosystems. NDGI has demonstrated good performance as a snow-free VI in tundra and grassland environments, but its applicability outside tundra regions remains unverified. It is still unclear whether NDGI is effective in snowy forested regions such as those found in Japan.
Furthermore, compared to spring phenology, relatively few studies have focused on monitoring EOS using satellite remote sensing (e.g., [34,35,36]). In previous studies on EOS detection, NDVI and EVI have frequently been used [35,36] despite being considered unsuitable for EOS monitoring [24,25,26]. Although GRVI is known to capture the mid-stage of EOS effectively [30], its ability to accurately track canopy changes associated with autumn coloration has not been fully validated.
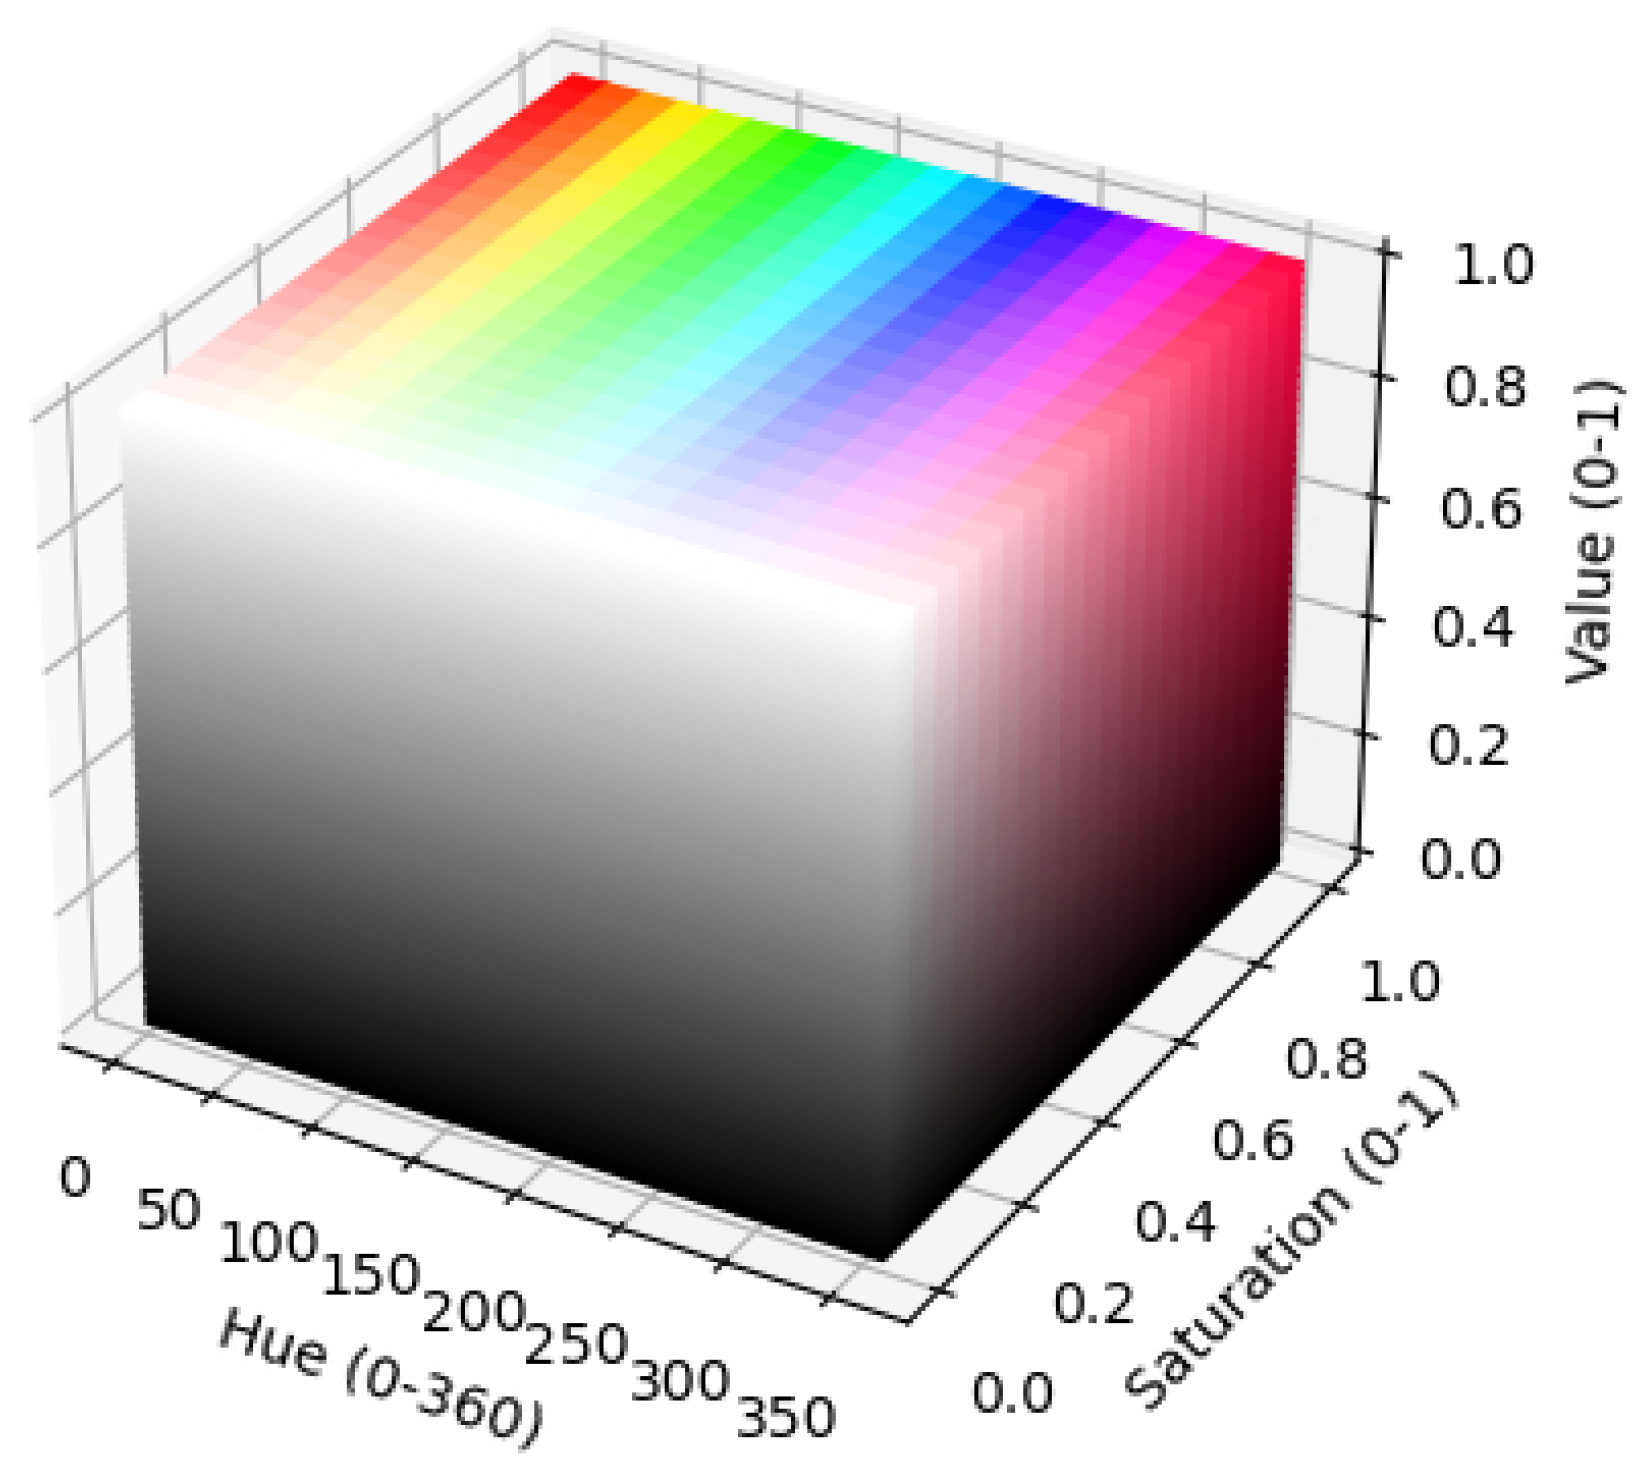
In this study, we propose year-round phenology monitoring using hue. Hue is one of the components of the HSV (or HSB) model (Figure 2) developed to represent colors in a way that more closely resembles how humans perceive them and represents differences in color appearance and quantifies the color characteristics of objects [37]. Leaf color is determined by pigments such as carotenoids and chlorophyll, which exhibit distinct behaviors in the visible light spectrum. Therefore, hue is expected to strongly correlate with the color of land cover or canopy and may effectively reflect the conditions of both snow cover and autumn coloration. Hue has been used in several near-surface remote sensing studies involving digital photography [38,39,40,41,42,43,44,45,46]; however, it has not yet been applied to satellite remote sensing of plant phenology, and its behavior remains largely unexplored in that context.
To evaluate the applicability of hue for plant phenology using remote sensing, this study analyzed multi-year time series hyperspectral reflectance data collected by the Phenological Eyes Network (PEN)—a long-term field observation network for terrestrial vegetation [47,48,49,50]. Specifically, we examined the relationship between hue simulated from PEN hyperspectral observations using the relative spectral response (RSR) of the Second-generation Global Imager (SGLI) onboard the GCOM-C satellite operated by JAXA (Japan Aerospace Exploration Agency) and phenological events recorded by fixed-point digital cameras at several PEN sites in Japan. In fact, GCOM-C/SGLI has high-quality visible observation channels, which are considered useful for monitoring vegetation phenology [14].

2. Materials and Methods

2.1. Study Area

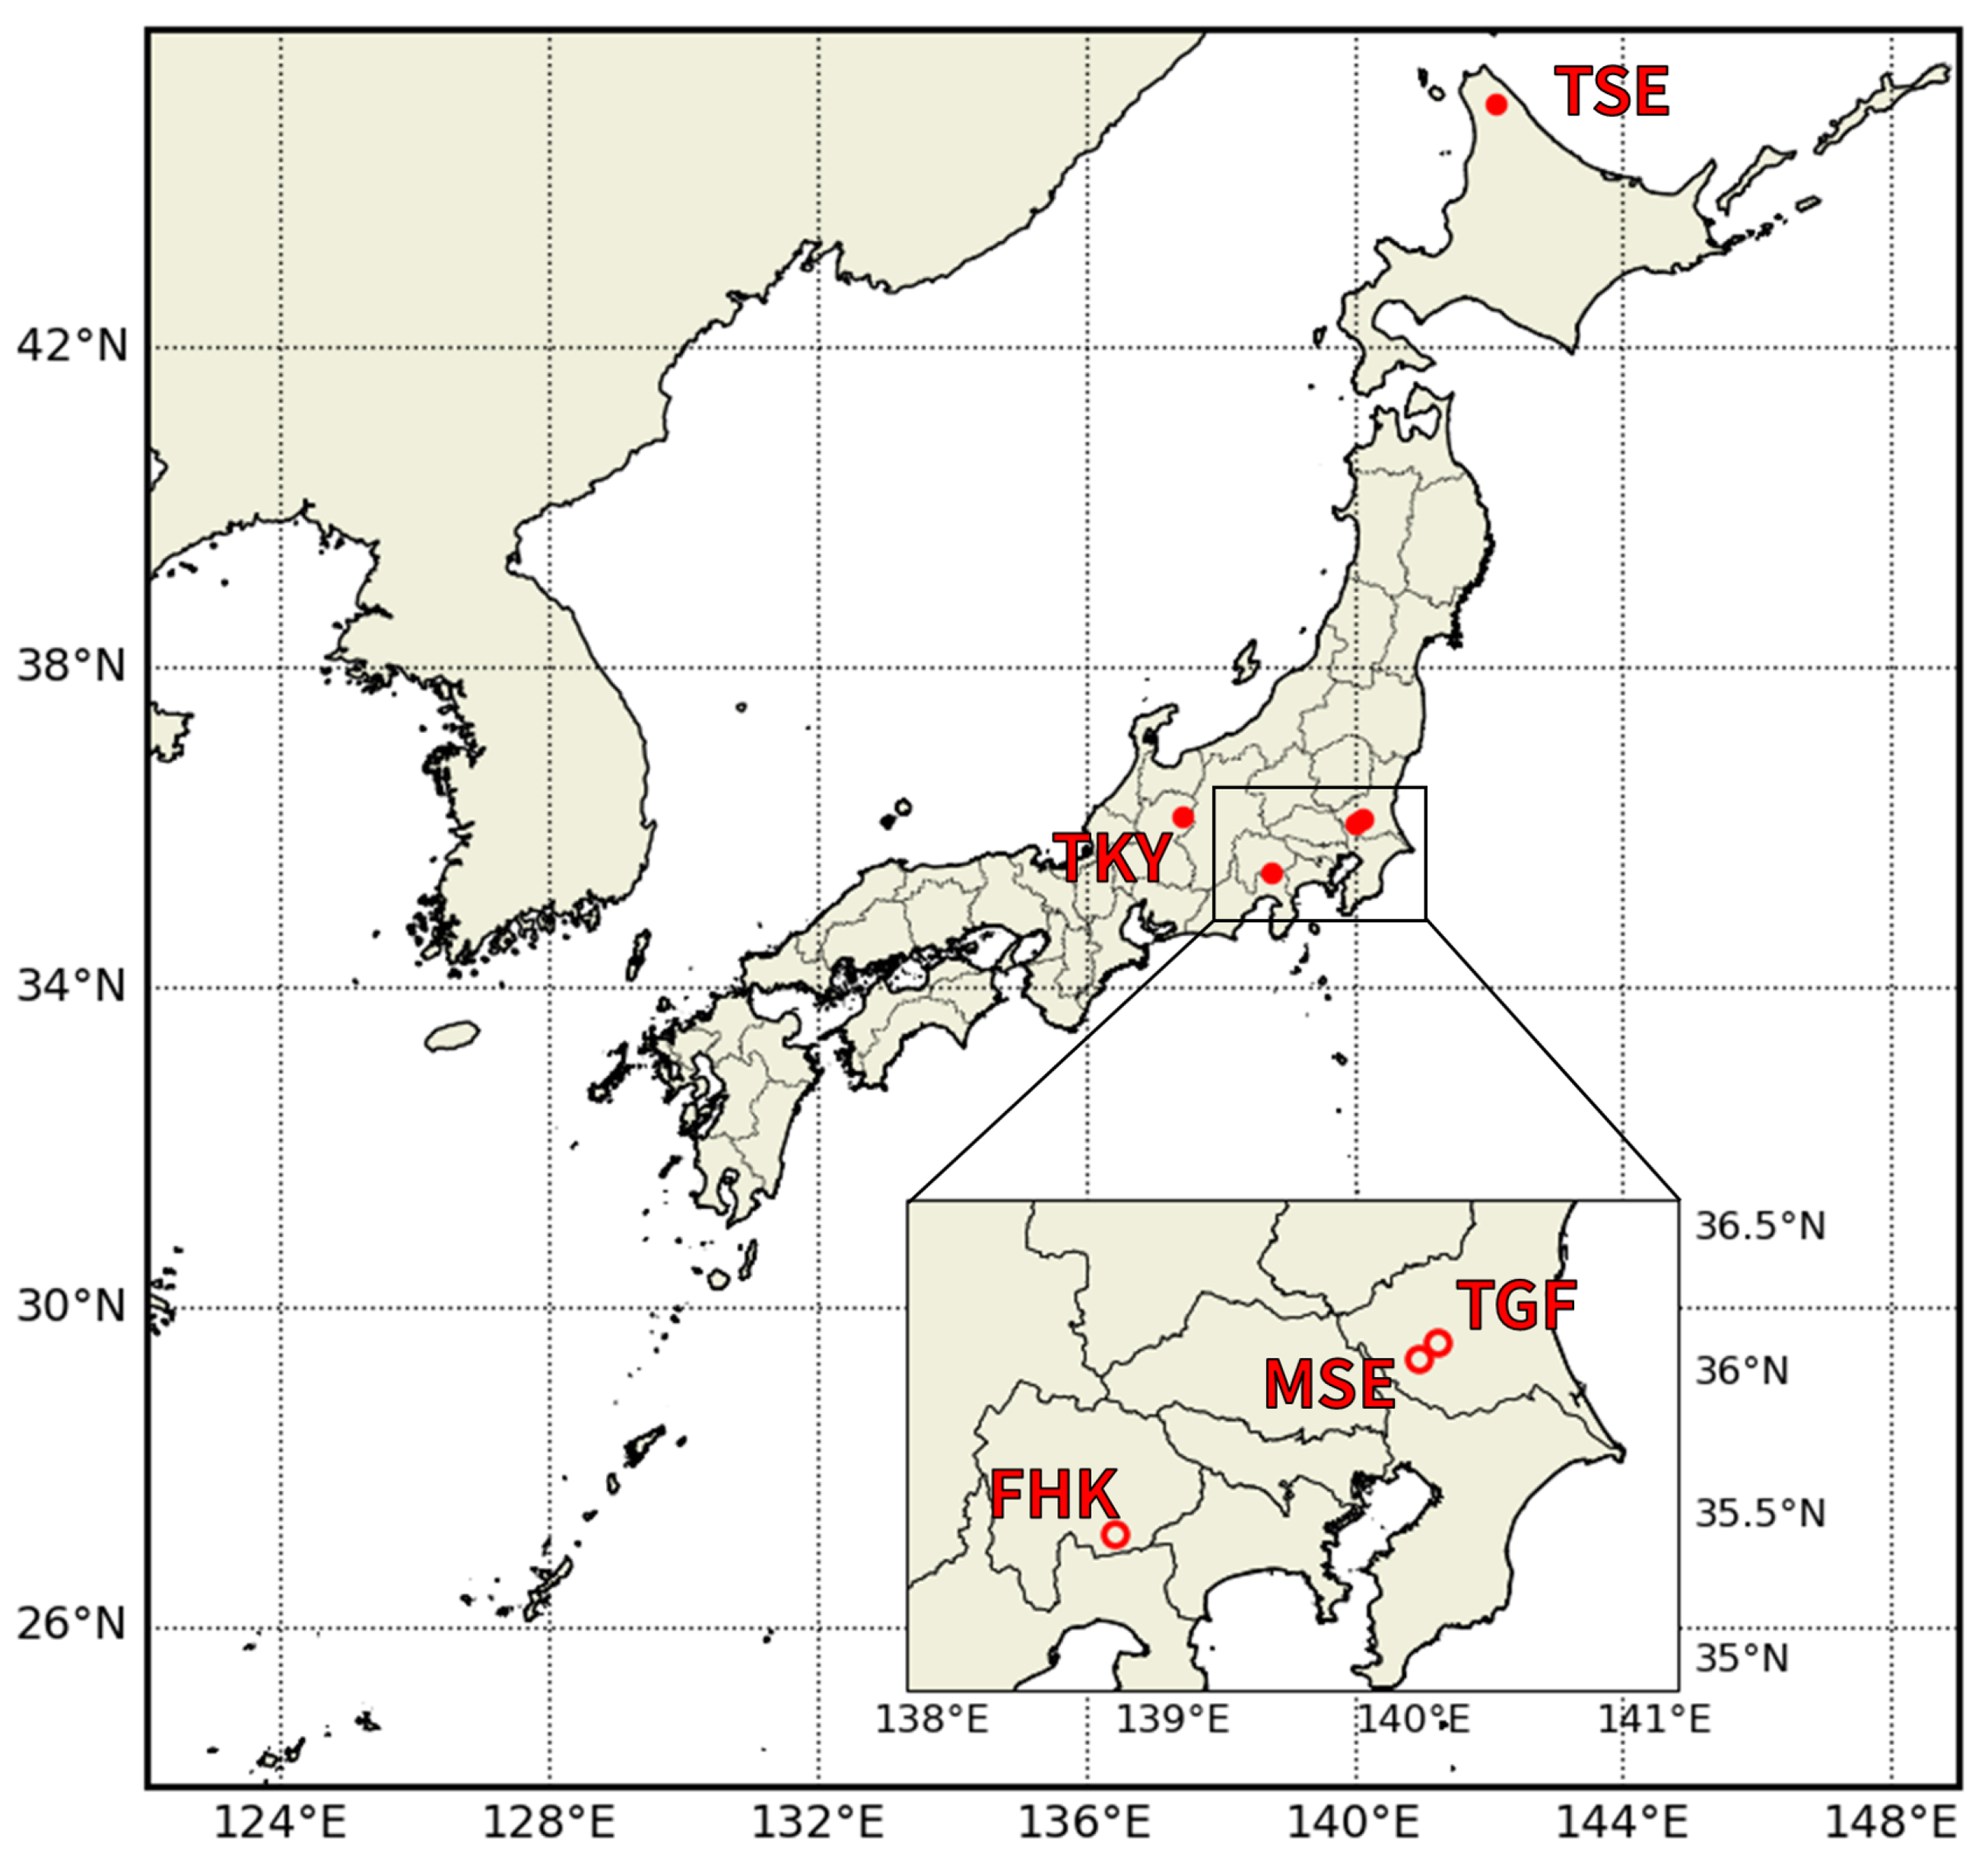
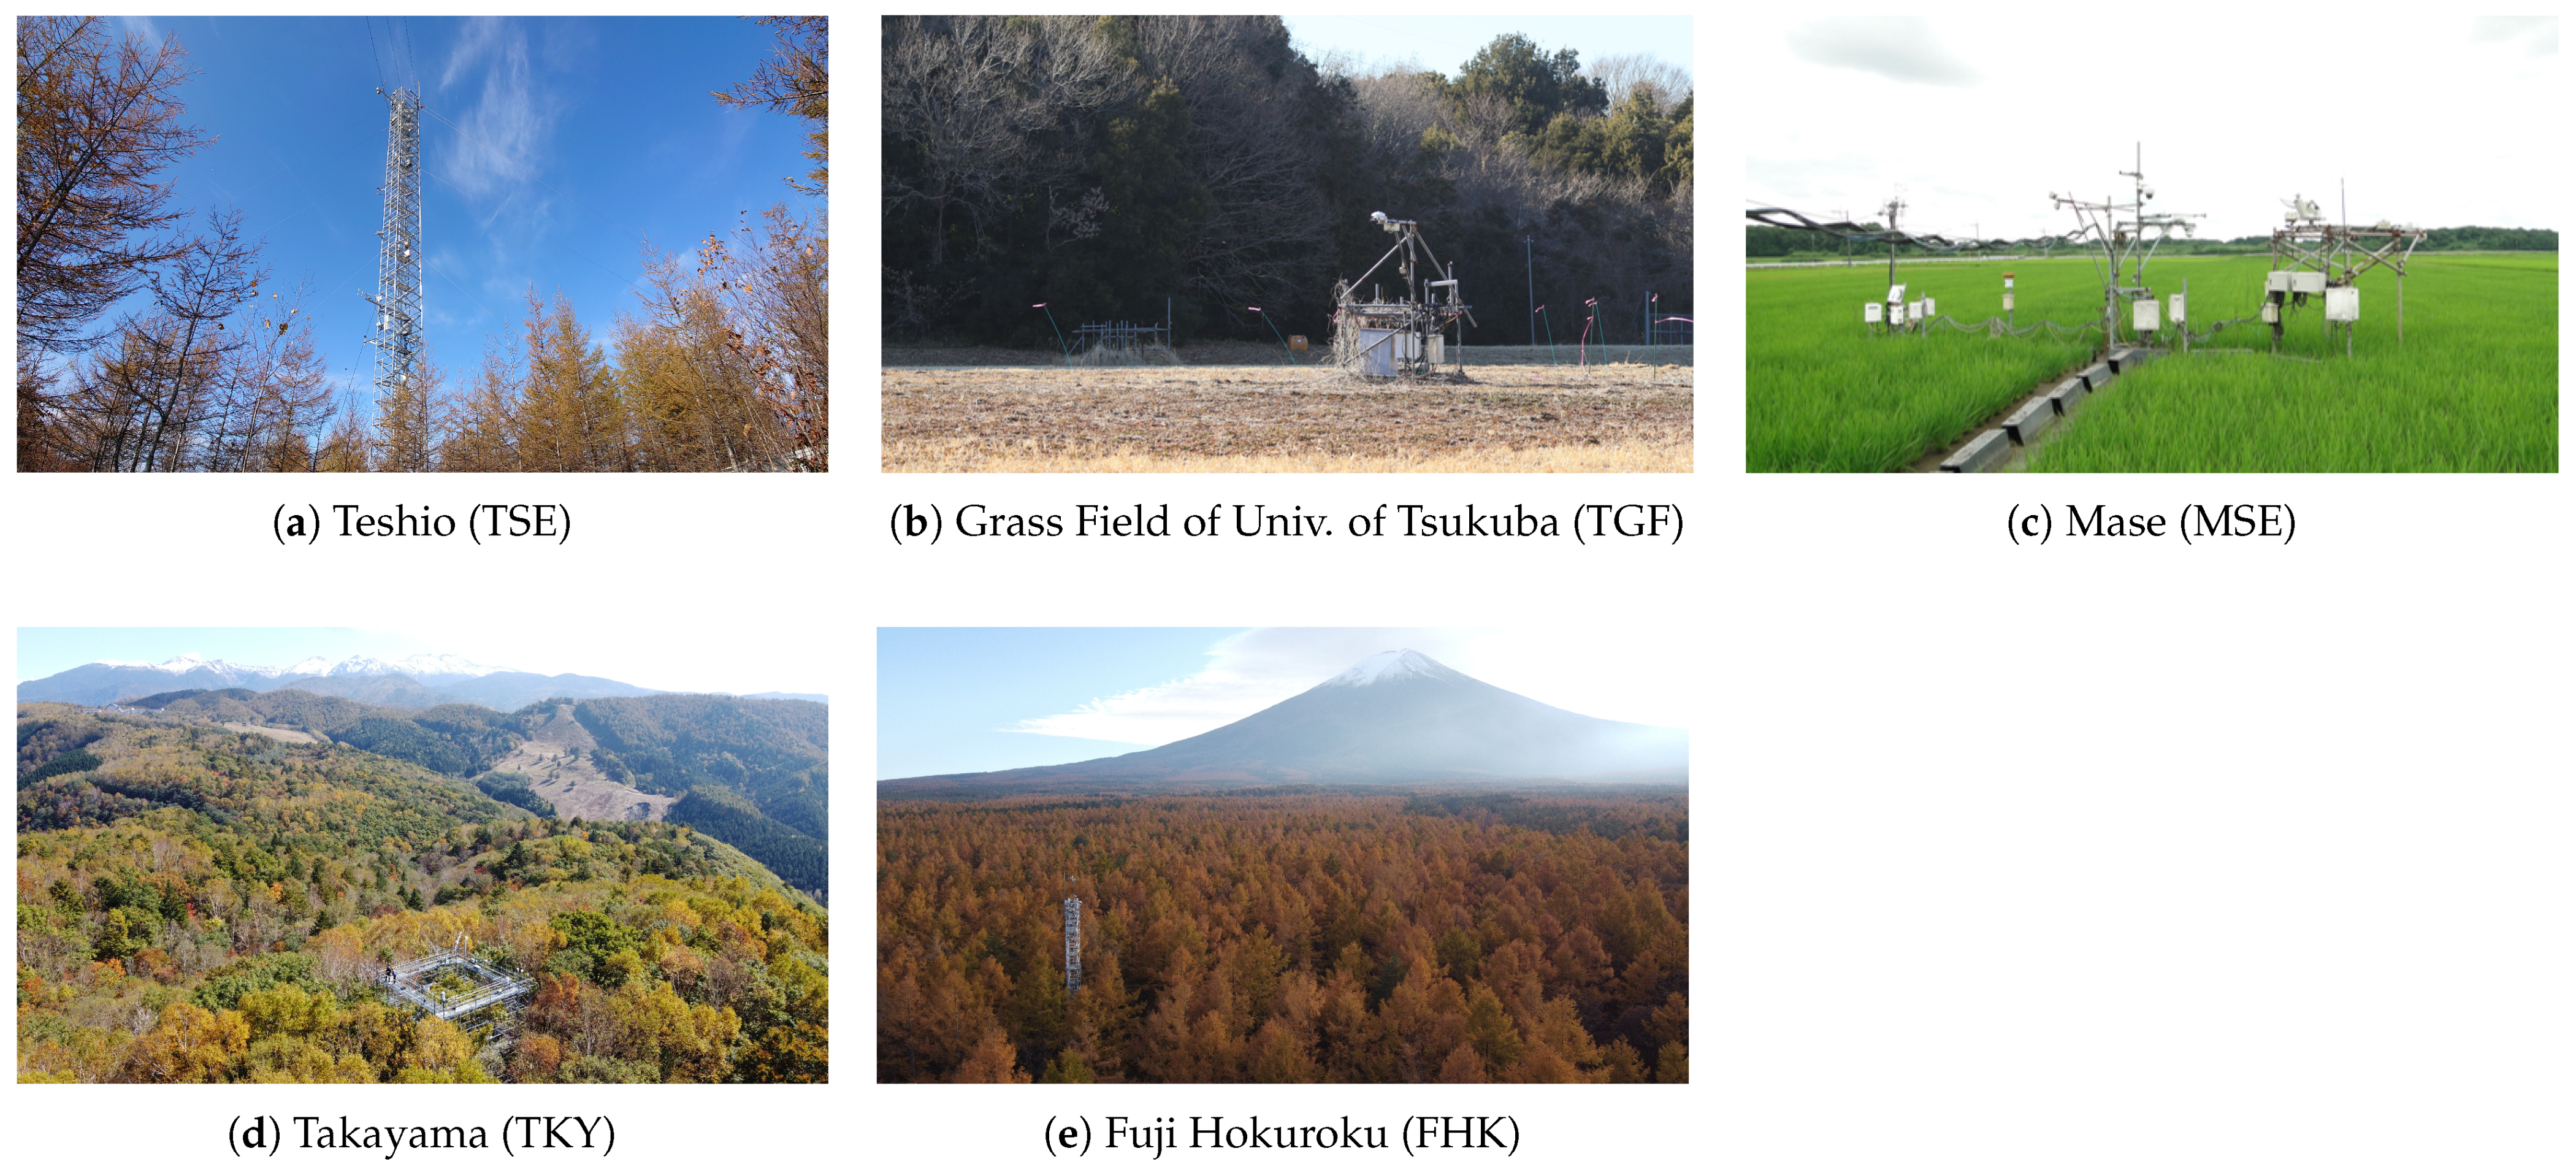
We used five PEN sites in Japan, as shown in Figure 3 and Figure 4, and Table 1 (TSE: Teshio; TGF: Center for Grass Field of Research in Isotopes and Earth Environmental Dynamics (CRiED) in the University of Tsukuba; MSE: Mase; TKY: Takayama; FHK: Fuji Hokuroku), covering four major ecosystems in Japan: deciduous needle-leaved forest: DNF (TSE and FHK); grassland (TGF); rice paddy (MSE); and deciduous broad-leaved forest: DBF (TKY). These sites also belong to AsiaFlux [51] and TSE, MSE, TKY, and FHK belong to the Japan Long Term Ecological Research Network (JaLTER) [52].
TSE is a sparse deciduous needle-leaved forest (DNF) located in the northern part of Hokkaido. The canopy is primarily composed of young hybrid larch trees (Larix kaempferi × L. gmelinii), while the understory is dominated by dwarf bamboo species, namely Sasa senanensis and S. kurilensis. However, the larch canopy covers less than half of the area, with the remaining area exposed and occupied by dwarf bamboo. The site is frequently covered with snow from November to April. TGF is a 160 m diameter circular grassland consisting of C3 and C4 species located in a diluvial upland. The dominant species are Miscanthus sinensis, Imperata cylindrica, Solidago altissima, and Pueraria lobata subsp. lobata. Mowing is conducted twice yearly (mid-summer and late autumn), and snow is rarely seen in TGF. MSE is a single-crop paddy field to cultivate rice (Oryza sativa L.; Koshihikari), located in the back marsh of Kokai River. Typically, spring plowing is carried out in March or early April. Transplanting, heading, and harvesting occur in early May, late July, and mid-September, respectively. Irrigation starts at the end of April, and mid-season drainage is conducted from June to July. Snow is rarely seen in MSE. TKY is a DBF located on the northwest slope of a volcano (Mt. Norikura). Its canopy species are Quercus crispula, and Betula ermanii with the dwarf bamboo (S. senanensis) in the understory. The area is continuously covered with snow from December to March. FHK is a DNF located on the northern side of a volcano (Mt. Fuji), with the canopy mainly composed of mature larch (L. kaempferi). Other species include Pinus densiflora, Cornus controversa, and Q. crispula. The understory includes ferns (Dryopteris crassirhizoma or D. expansa) and the dwarf bamboo (Sasamorpha borealis). FHK experiences intermittent snow cover from February to March. Topographic effects were not a concern in this study, as all sites were located on flat terrain.

2.2. In Situ Data

We used spectral irradiance data and canopy images automatically obtained by the PEN system. The PEN system includes a hemispherical spectral radiometer (HSSR) and an automatic digital fisheye camera (ADFC), which are mounted on top of the observation towers at each site [47,48]. The HSSR measures the incident light from the sky and the reflected light from the vegetation canopy, while the ADFC captures the vegetation canopy images. These in situ data have been used in many studies of vegetation remote sensing (e.g., [14,30,54,55]). We selected and analyzed yearly data with a few missing periods: from 2018 to 2020 for TSE, from 2019 to 2021 for TGF, from 2017 to 2019 for MSE, and from 2018 to 2019 for TKY and FHK. Notably, the PEN systems at each site primarily capture the dominant vegetation species: Sasa dwarf bamboo and larch trees at TSE, rice at MSE, Q. crispula at TKY, and larch trees at FHK.

2.2.1. Hemispherical Spectral Radiometer: HSSR

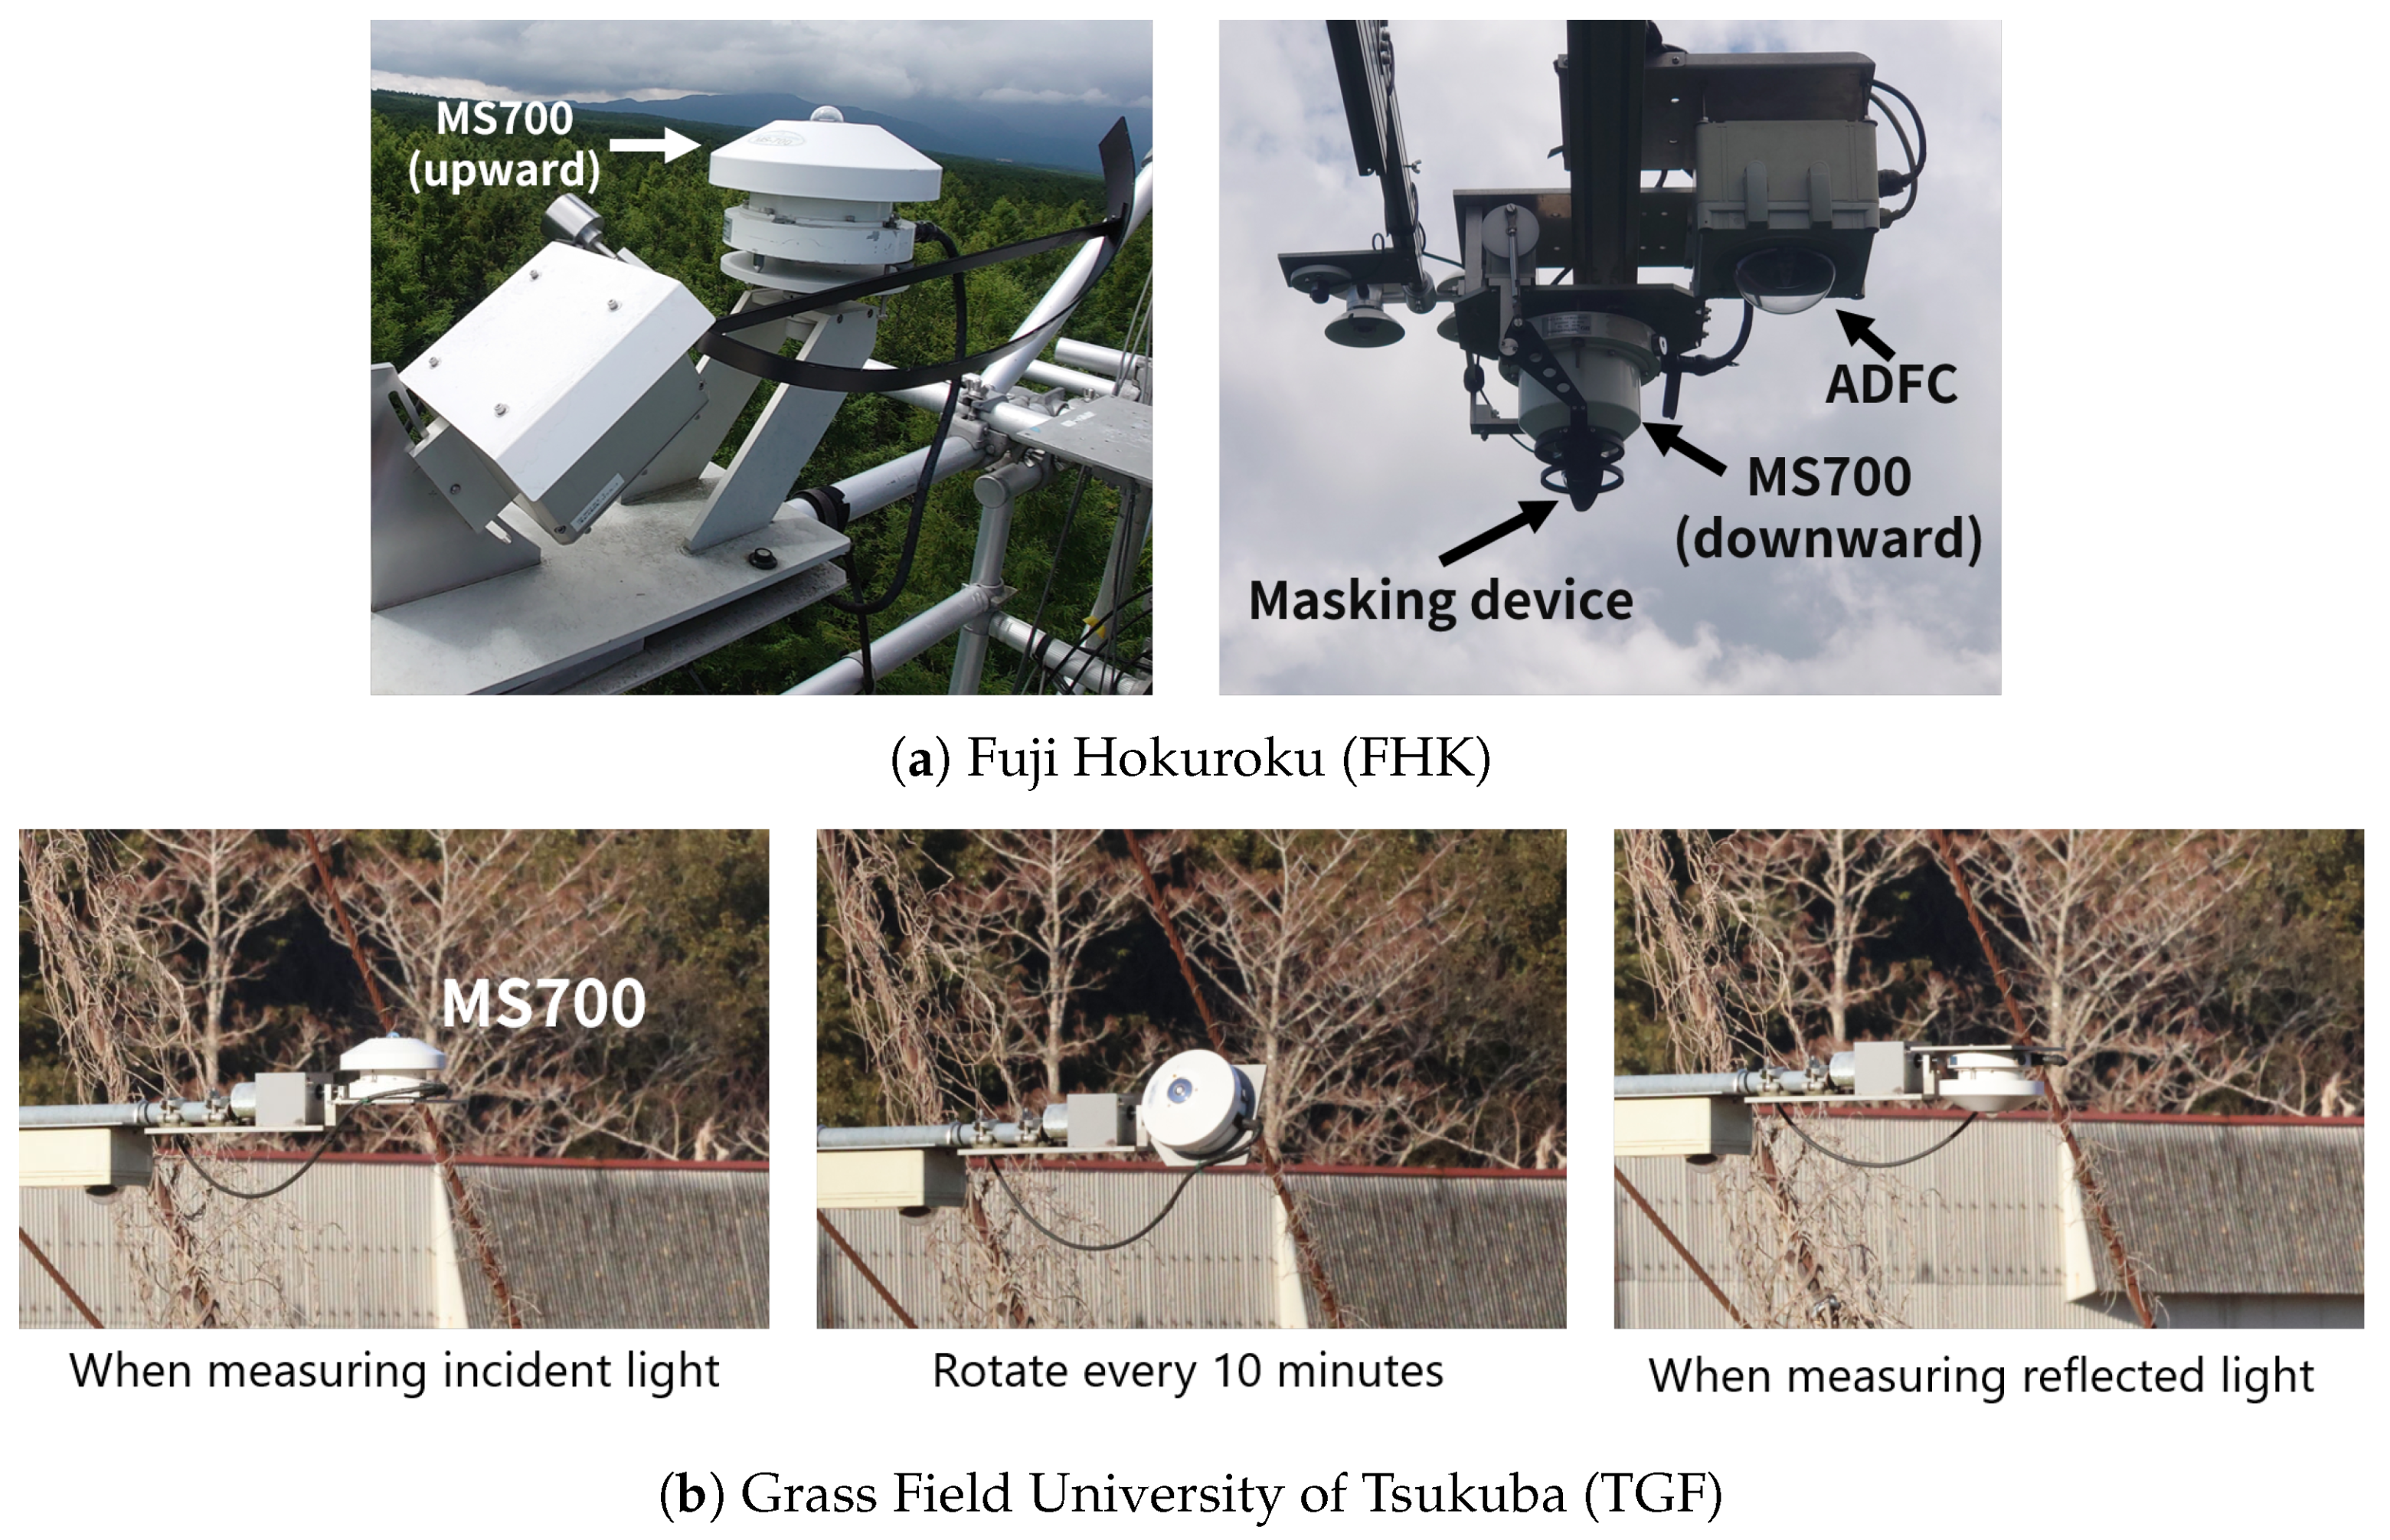
We have been using a hyperspectral radiometer MS-700 (EKO Instrument Co., Ltd., Tokyo, Japan) for HSSR at each site [47,48]. The MS-700 has an observation wavelength range from 350 nm to 1050 nm, with an interval of 3.3 nm. At TSE and FHK, two HSSRs were installed at the top of each observation tower (Figure 5a): one fixed upward to measure incident light from the sky, and the other fixed downward to measure reflected light from the vegetation canopy. Data were collected at 1-min intervals at TSE and 4-min intervals at FHK. At TGF, MSE, and TKY, a single HSSR was installed at the top of the observation towers (Figure 5b), and it flipped up and down by an external motor (CHS-AR, Hayasaka Rikoh Co., Ltd., Hokkaido, Japan), making observation of incident light (sky) and reflected light (vegetation canopy) with a single sensor [47,48]. A single cycle of the observation of the incident and reflected light is 10 min. Therefore, a time gap existed between the measurements of incident and reflected light. To minimize the impact of this gap, the incident light corresponding to each reflected light measurement was estimated as the average of the incident light values obtained immediately before and after the reflected light measurement.
At TSE, TKY, and FHK, masking devices were installed. It works to measure the reflected light to block contaminating light, which are reflections from the observation towers and skylight coming from near the horizon [55]. At TSE and FHK, HSSRs were removed in winter in order to prevent malfunction due to heavy snow.

2.2.2. Automatic Digital Fisheye Camera: ADFC

The ADFC system was composed of a digital camera (COOLPIX4300 or COOLPIX 4500, Nikon Corp., Tokyo, Japan), a fisheye lens (FC-E8, Nikon Corp.), and a waterproof case [47,48]. Each ADFC captures multiple photos per day, and in this study, we mainly used the ones taken around noon (e.g., Figure 6).

2.3. Analysis of HSSR Data

2.3.1. Simulation of Satellite Channels

We converted in situ spectral irradiance data (HSSR data) into weighted-average reflectance which simulates spectral channels (Table 2) of GCOM-C/SGLI.
We used HSSR data observed during periods of high solar altitude, specifically from 9:00 to 14:59. The HSSR spectral data were convolved with the relative spectral response (RSR) of GCOM-C/SGLI-VNR (visible and near-infrared radiometer) (Figure 7) to calculate the irradiance for each channel. Furthermore, for each channel, the reflectance was calculated by dividing the canopy irradiance by the sky irradiance. This method is described by the following Equation (1) [54]:
R ( VN x ) = g ( λ ) R S R VN x ( λ ) d λ f ( λ ) R S R VN x ( λ ) d λ
where f ( λ ) represents the incident spectral irradiance from the sky, g ( λ ) represents the reflected spectral irradiance from the vegetation canopy, and VNx is the channel label ( x = 01 , 02 , ; Table 2). R(VNx) is simulated reflectance, and R S R VN x ( λ ) is RSR of channel VNx. As mentioned earlier, f ( λ ) at TGF, MSE, and TKY is the average of two incident light measurements observed at times close to each reflected light observation.

2.3.2. Calculation of VIs and Hue

From the simulated reflectance of each GCOM-C/SGLI channel, we calculated traditional VIs (NDVI, EVI, Chlorophyll Carotenoid Index: CCI, NDGI) and hue. Each VI is calculated using Equations (2)–(5) as follows [19,33,54,58]:
N D V I = R ( VN 11 ) R ( VN 08 ) R ( VN 11 ) + R ( VN 08 )
E V I = 2.5 ( R ( VN 11 ) R ( VN 08 ) ) R ( VN 11 ) + 6 R ( VN 08 ) 7.5 R ( VN 03 ) + 1
C C I = R ( VN 05 ) R ( VN 08 ) R ( VN 05 ) + R ( VN 08 )
N D G I = 0.64 R ( VN 05 ) + 0.36 R ( VN 11 ) R ( VN 08 ) 0.64 R ( VN 05 ) + 0.36 R ( VN 11 ) + R ( VN 08 )
As already mentioned, NDVI and EVI have been widely used for vegetation monitoring; however, these indices have some uncertainty due to snowmelt and are unsuitable for EOS detection [24,25,26]. CCI is a type of GRVI. The primary difference between CCI and normal GRVI is that CCI uses spectral channels (red and green) with narrower wavelength ranges than normal GRVI [54,59]. GRVI performs similarly to CCI [60]. NDGI is a snow-free VI for tundra vegetation [33].
Hue is one of the components in the HSV (or HSB) model (Figure 2), representing the differences in the appearance of colors and quantifying the characteristics of an object’s color. HSV model is converted from the RGB model, and hue is normally represented as an angle ranging from 0° to 360°. We calculated hue using Equation (6) as follows:
H = 0 , if M m = 0 , 60 ° × G B M m , if M = R , 60 ° × B R M m + 2 , if M = G , 60 ° × R G M m + 4 , if M = B .
where B, G, and R are the simulated reflectance of each channel (R(VN03), R(VN05), or R(VN06), and R(VN08)); M represents the maximum value of B, G, and R, and m represent the minimum values of B, G, and R. GCOM-C/SGLI has two green bands with different center wavelengths: VN05 (529.7 nm) and VN06 (566.1 nm). VN06 corresponds to the standard green wavelength range, and similar green bands with comparable center wavelengths are also available on other satellite sensors, such as Sentinel-2/MSI (Multispectral Imager) and Landsat-8/OLI (Operational Land Imager). In this study, we calculated two types of hue—Hue (VN05) and Hue (VN06)—each using one of these green bands.
Furthermore, to examine the correspondence of hue values across different sensors, we also calculated hue using RSR of Sentinel-2/MSI (R: Band 4, G: Band 3, B: Band 2), Landsat-8/OLI (R: Band 4, G: Band 3, B: Band 2), and Terra/MODIS (R: Band 1, G: Band 4 or Band 11, B: Band 3). Since Terra/MODIS has two green bands—Band 4 (555 nm) and Band 11 (531 nm)—we calculated hue separately using each of these bands. After calculating each spectral index for each observation time, each daily average was computed to create the time series.

3. Results

3.1. Teshio Site (TSE): Deciduous Needle-Leaved Forest (DNF)

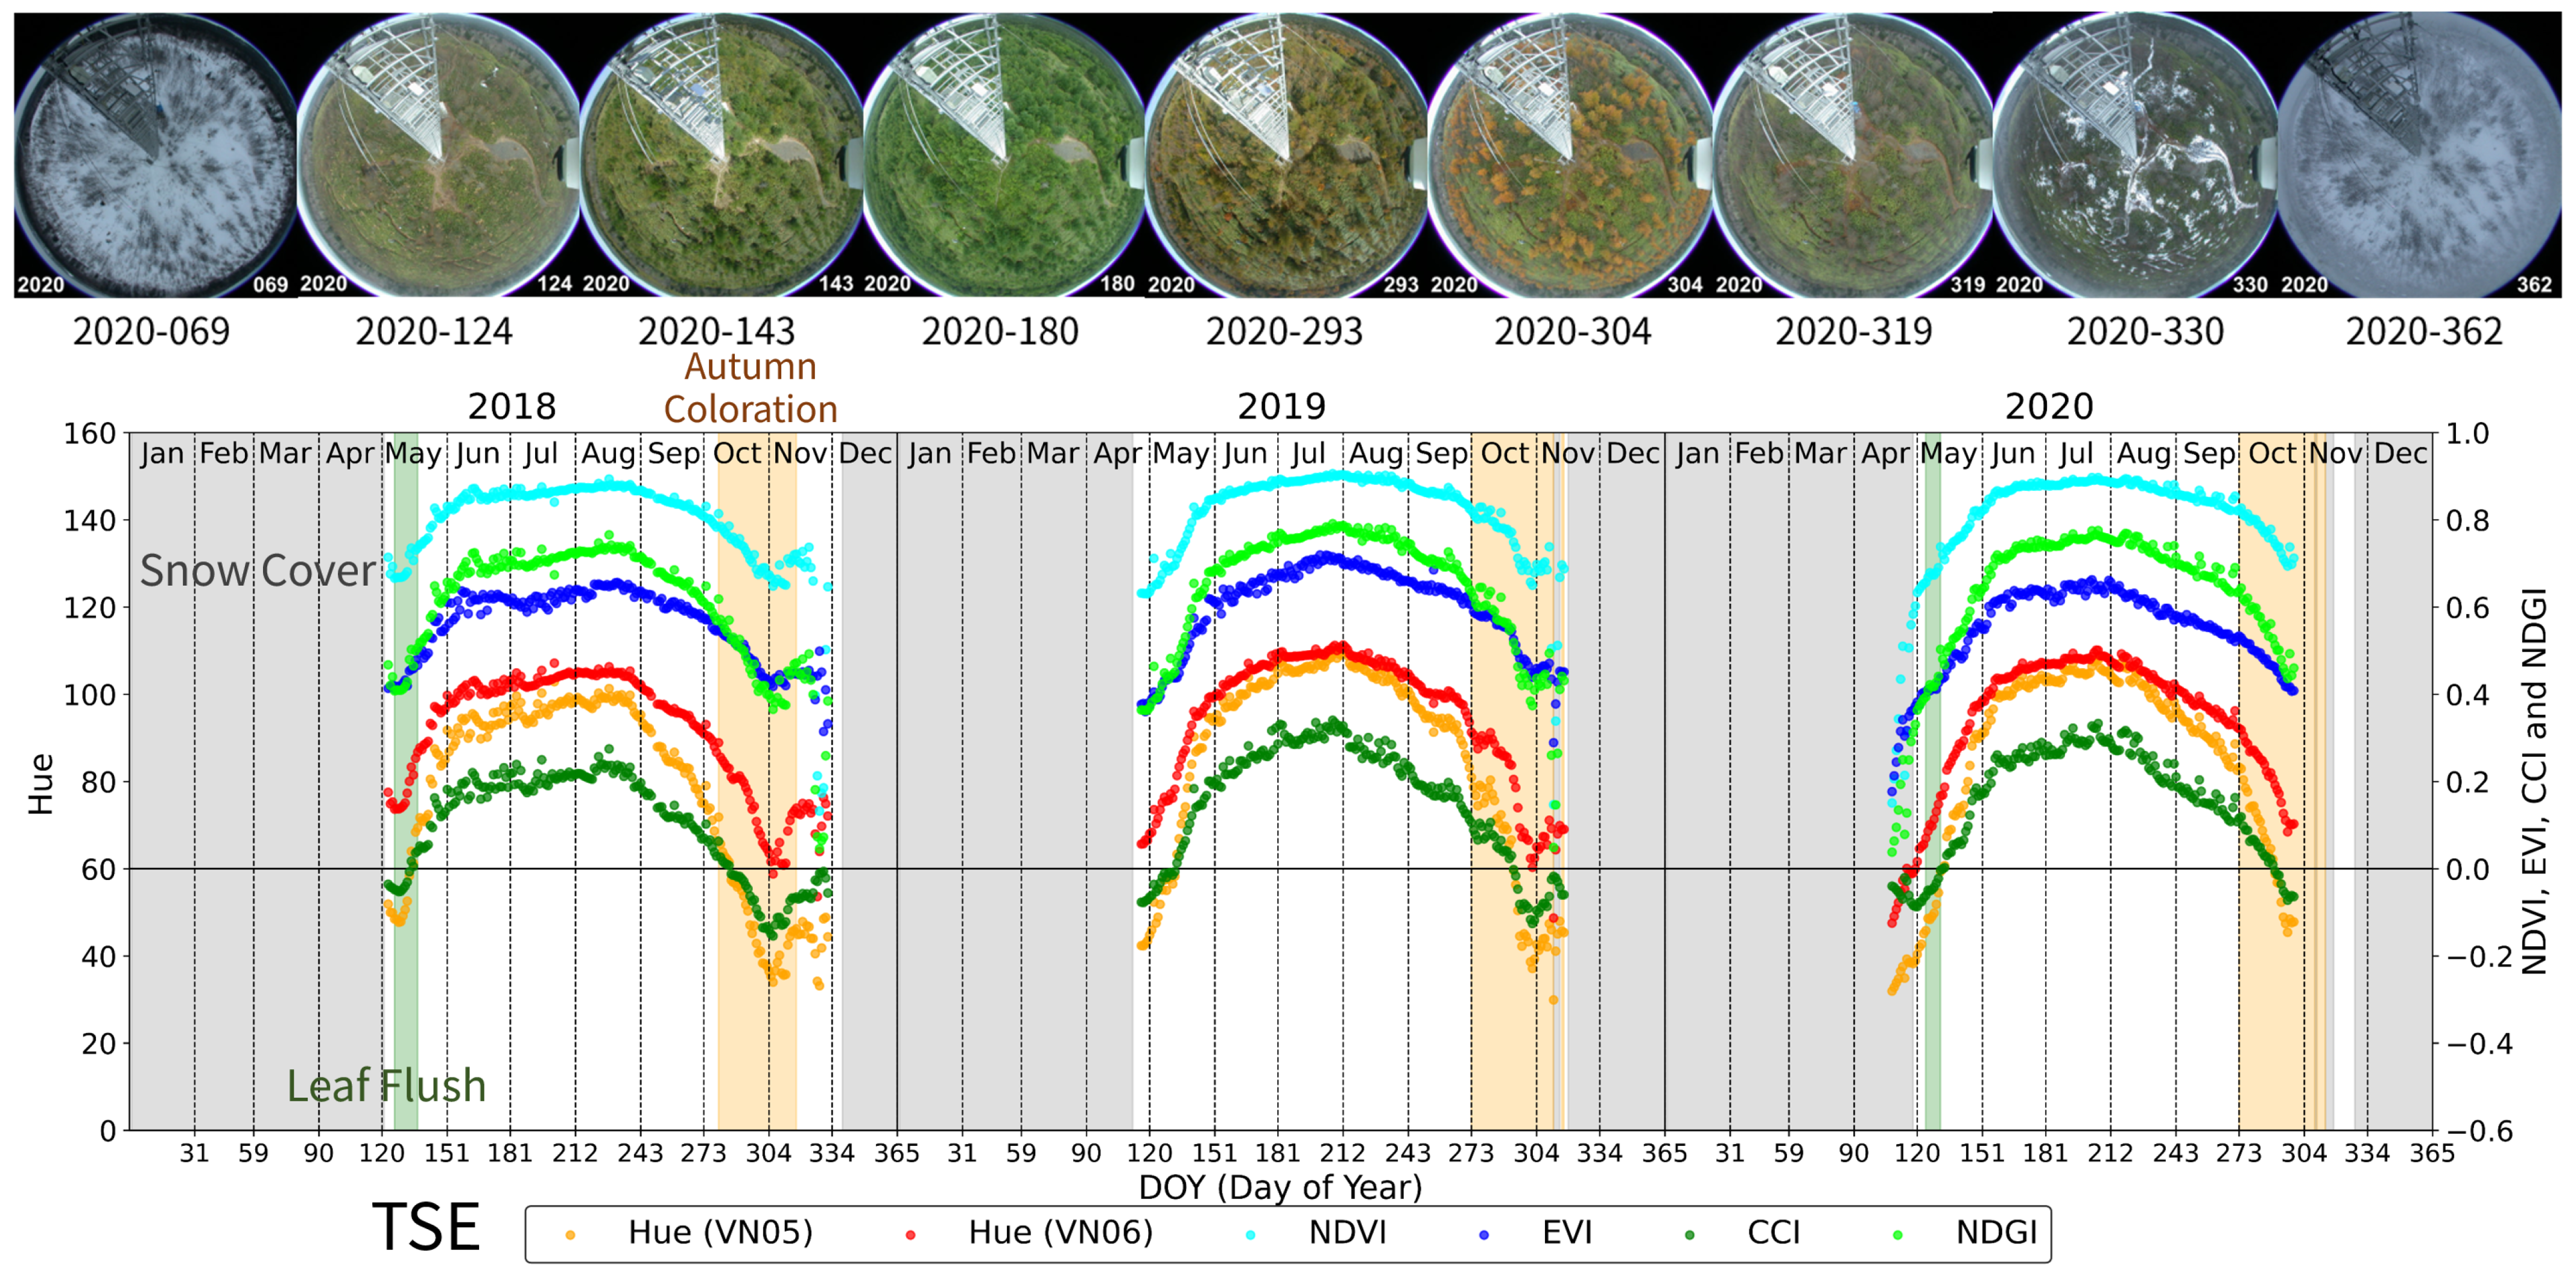
From the ADFC images at TSE, snow was present from approximately DOY 320 to DOY 130 (the gray bands of Figure 8), leaf flush occurred around DOY 130 (the green band of Figure 8), autumn coloration started around DOY 275, and all leaves had fallen by DOY 315 (the orange bands of Figure 8). The peak of autumn coloration was observed around DOY 301–307 (2018), DOY 296–305 (2019), and DOY 301–308 (2020).
During the snowmelt period, NDVI, EVI, and NDGI increased significantly (around late April in 2020 in Figure 8), with further increases observed during the subsequent leaf flush of larch trees. CCI decreased slightly at the snowmelt timing, reached approximately zero at leaf flush, and then increased to around 0.3. All indices began to decline from July to August, reaching their minimum values near the peak of autumn coloration. At this point, the values were Hue (VN05): 35–40, Hue (VN06): 60–65, NDVI: 0.7, EVI: 0.5, CCI: 0.1 and NDGI: 0.4. This peak was particularly pronounced in hue, CCI, and NDGI. Subsequently, all indices increased with leaf fall. Additionally, in 2018 and 2019, snow was observed during the HSSR observation periods (2018: DOY 329 onwards, 2019: DOY 309, 314–317). During this time, the values of hue, NDVI, EVI, and NDGI decreased, while CCI continued to increase. Scattering spectral indices during DOY 320–334 (2018) and DOY 312–315 (2019) might be caused by some troubles, such as a water drop on the sensor dome of HSSR.

3.2. Grass Field of CRiED in the University of Tsukuba (TGF): Grassland

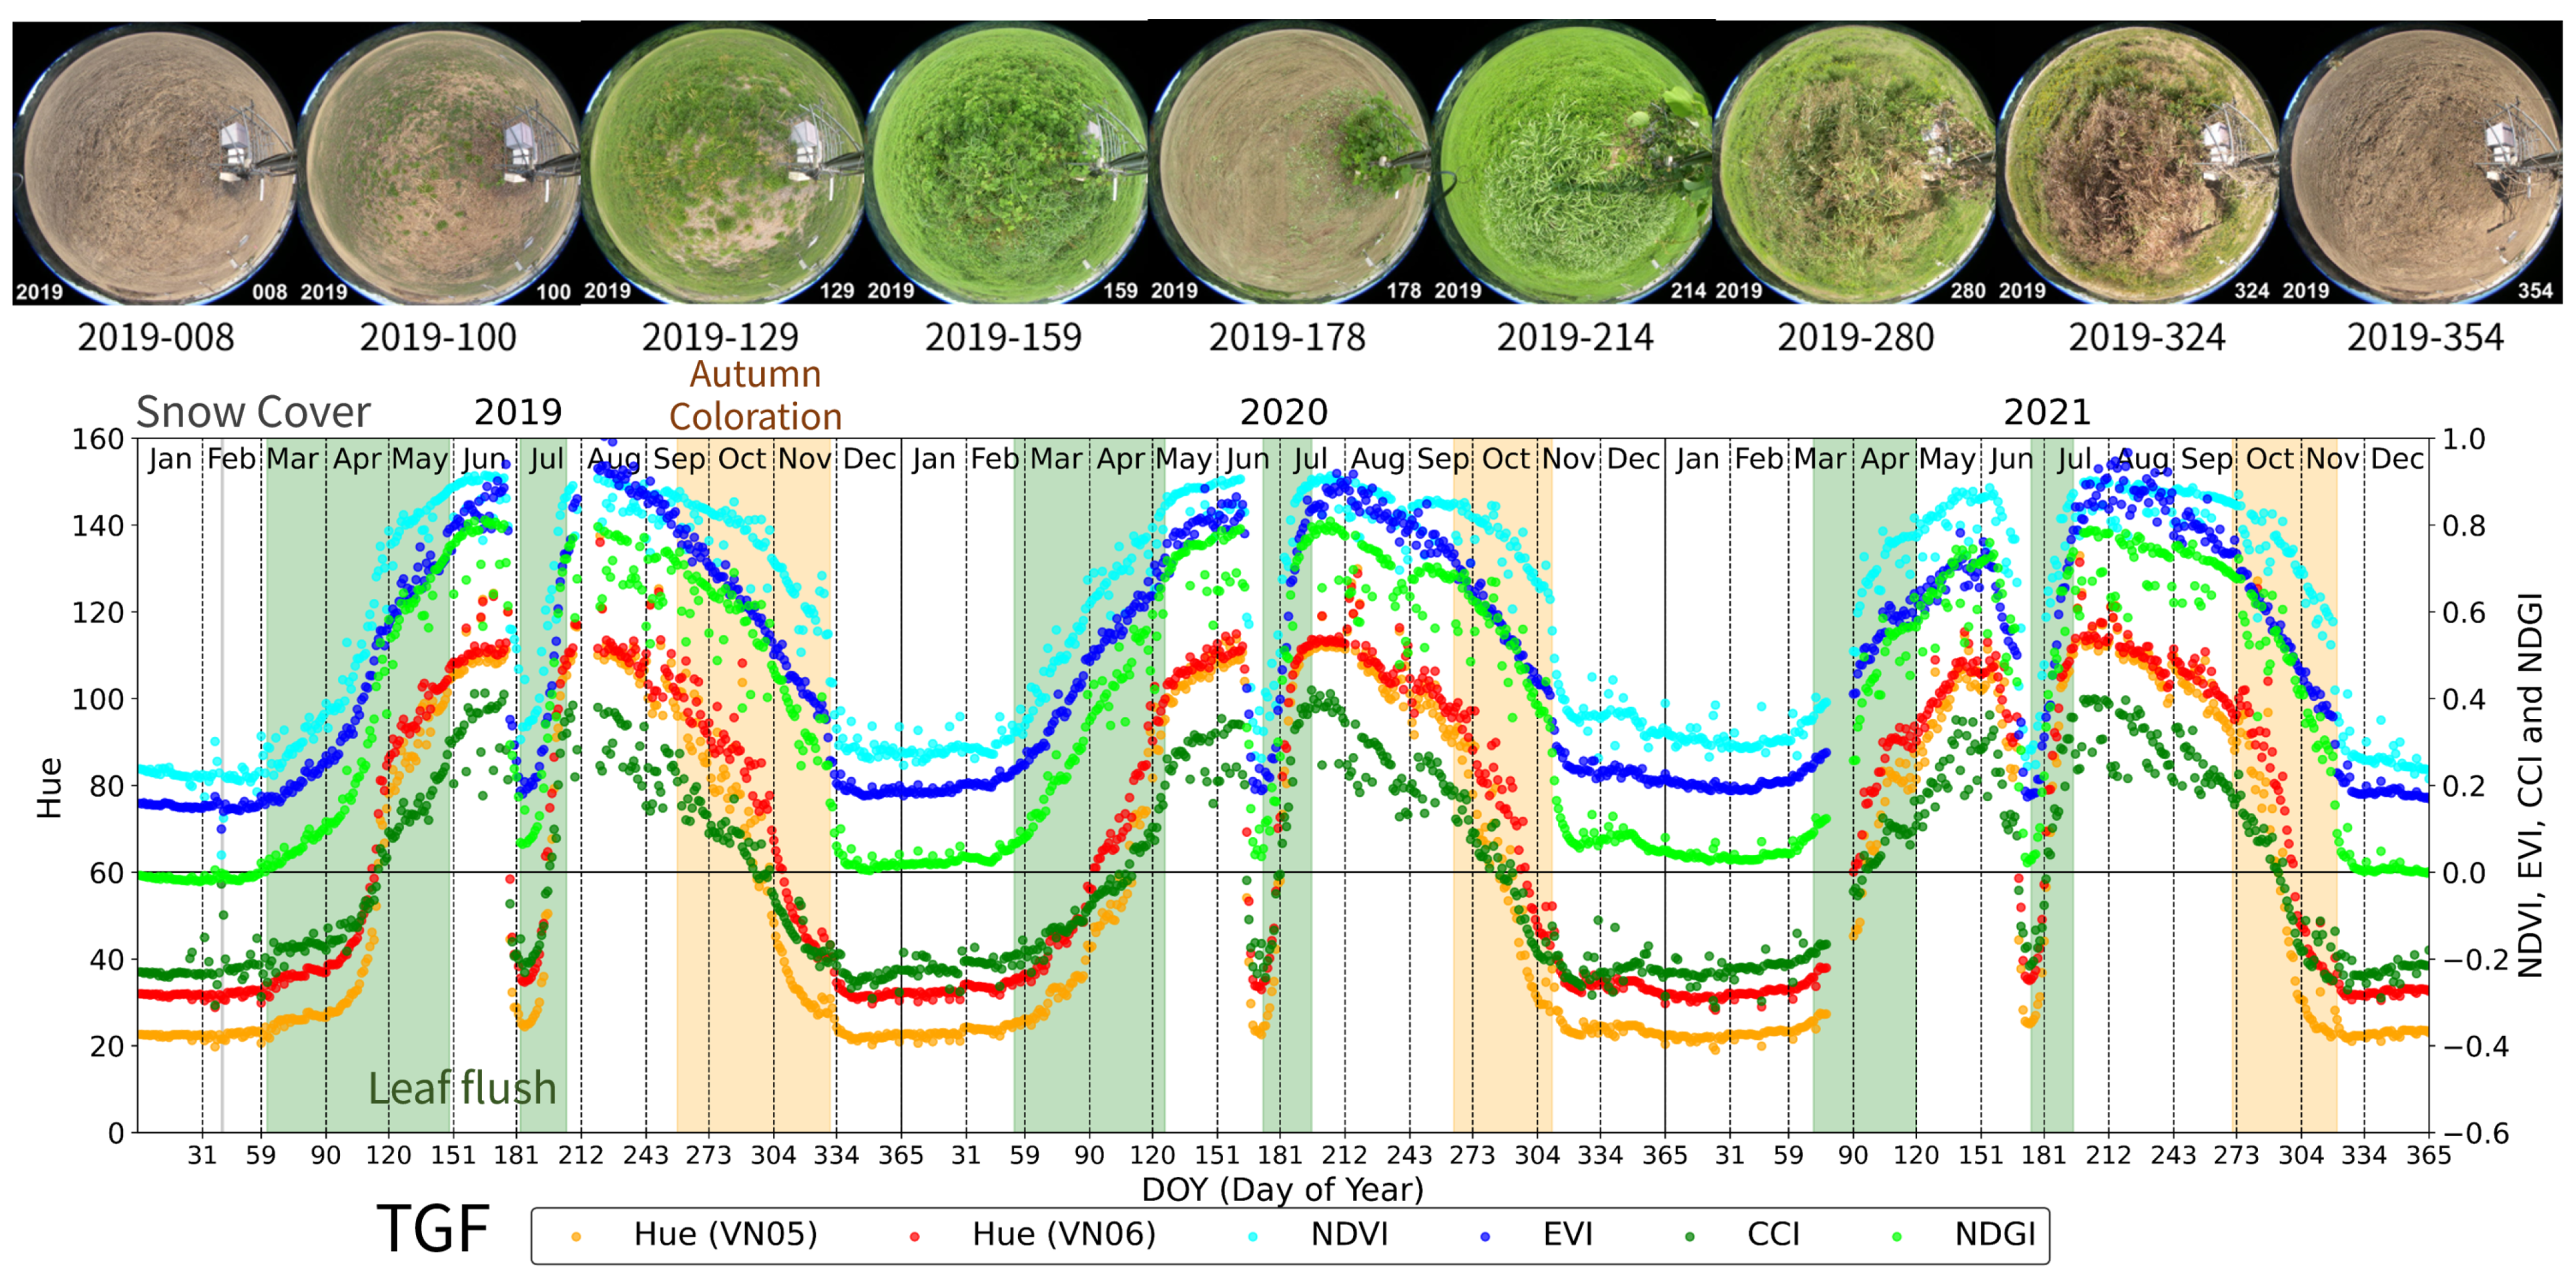
From the ADFC images at TGF, snow cover was observed on DOY 40–41 in 2019 (the gray bands in Figure 9). Leaf flush was observed in spring (around DOY 62 in 2019, DOY 54 in 2020, and DOY 71 in 2021), and again after grass mowing, which occurred in the latter half of June (DOY 178 in 2019, DOY 165 in 2020, and DOY 169 in 2021) (the green bands in Figure 9). Subsequently, autumn coloration and the flowering of Solidago altissima began around DOY 260 (the orange bands in Figure 9). A second round of grass mowing was conducted on DOY 330 (2019), DOY 310 (2020), and DOY 320 (2021).
Prior to leaf flush, Hue (VN05) was between 20 and 30, Hue (VN06) ranged from 30 to 40, NDVI around 0.2, EVI from 0.1 to 0.2, CCI from 0.3 to 0.2 , and NDGI around 0 (Figure 9, DOY 1–61 (2019), DOY 1–53 (2020) and DOY 1–70 (2021)). Following this, all indices increased significantly with leaf flush. When mowing was conducted, all spectral indices dropped suddenly. After this, all indices increased corresponding to plants’ regrowth. In the season of autumn coloration, all indices decreased gradually and took stable values in winter.

3.3. Mase Site (MSE): Rice Paddy

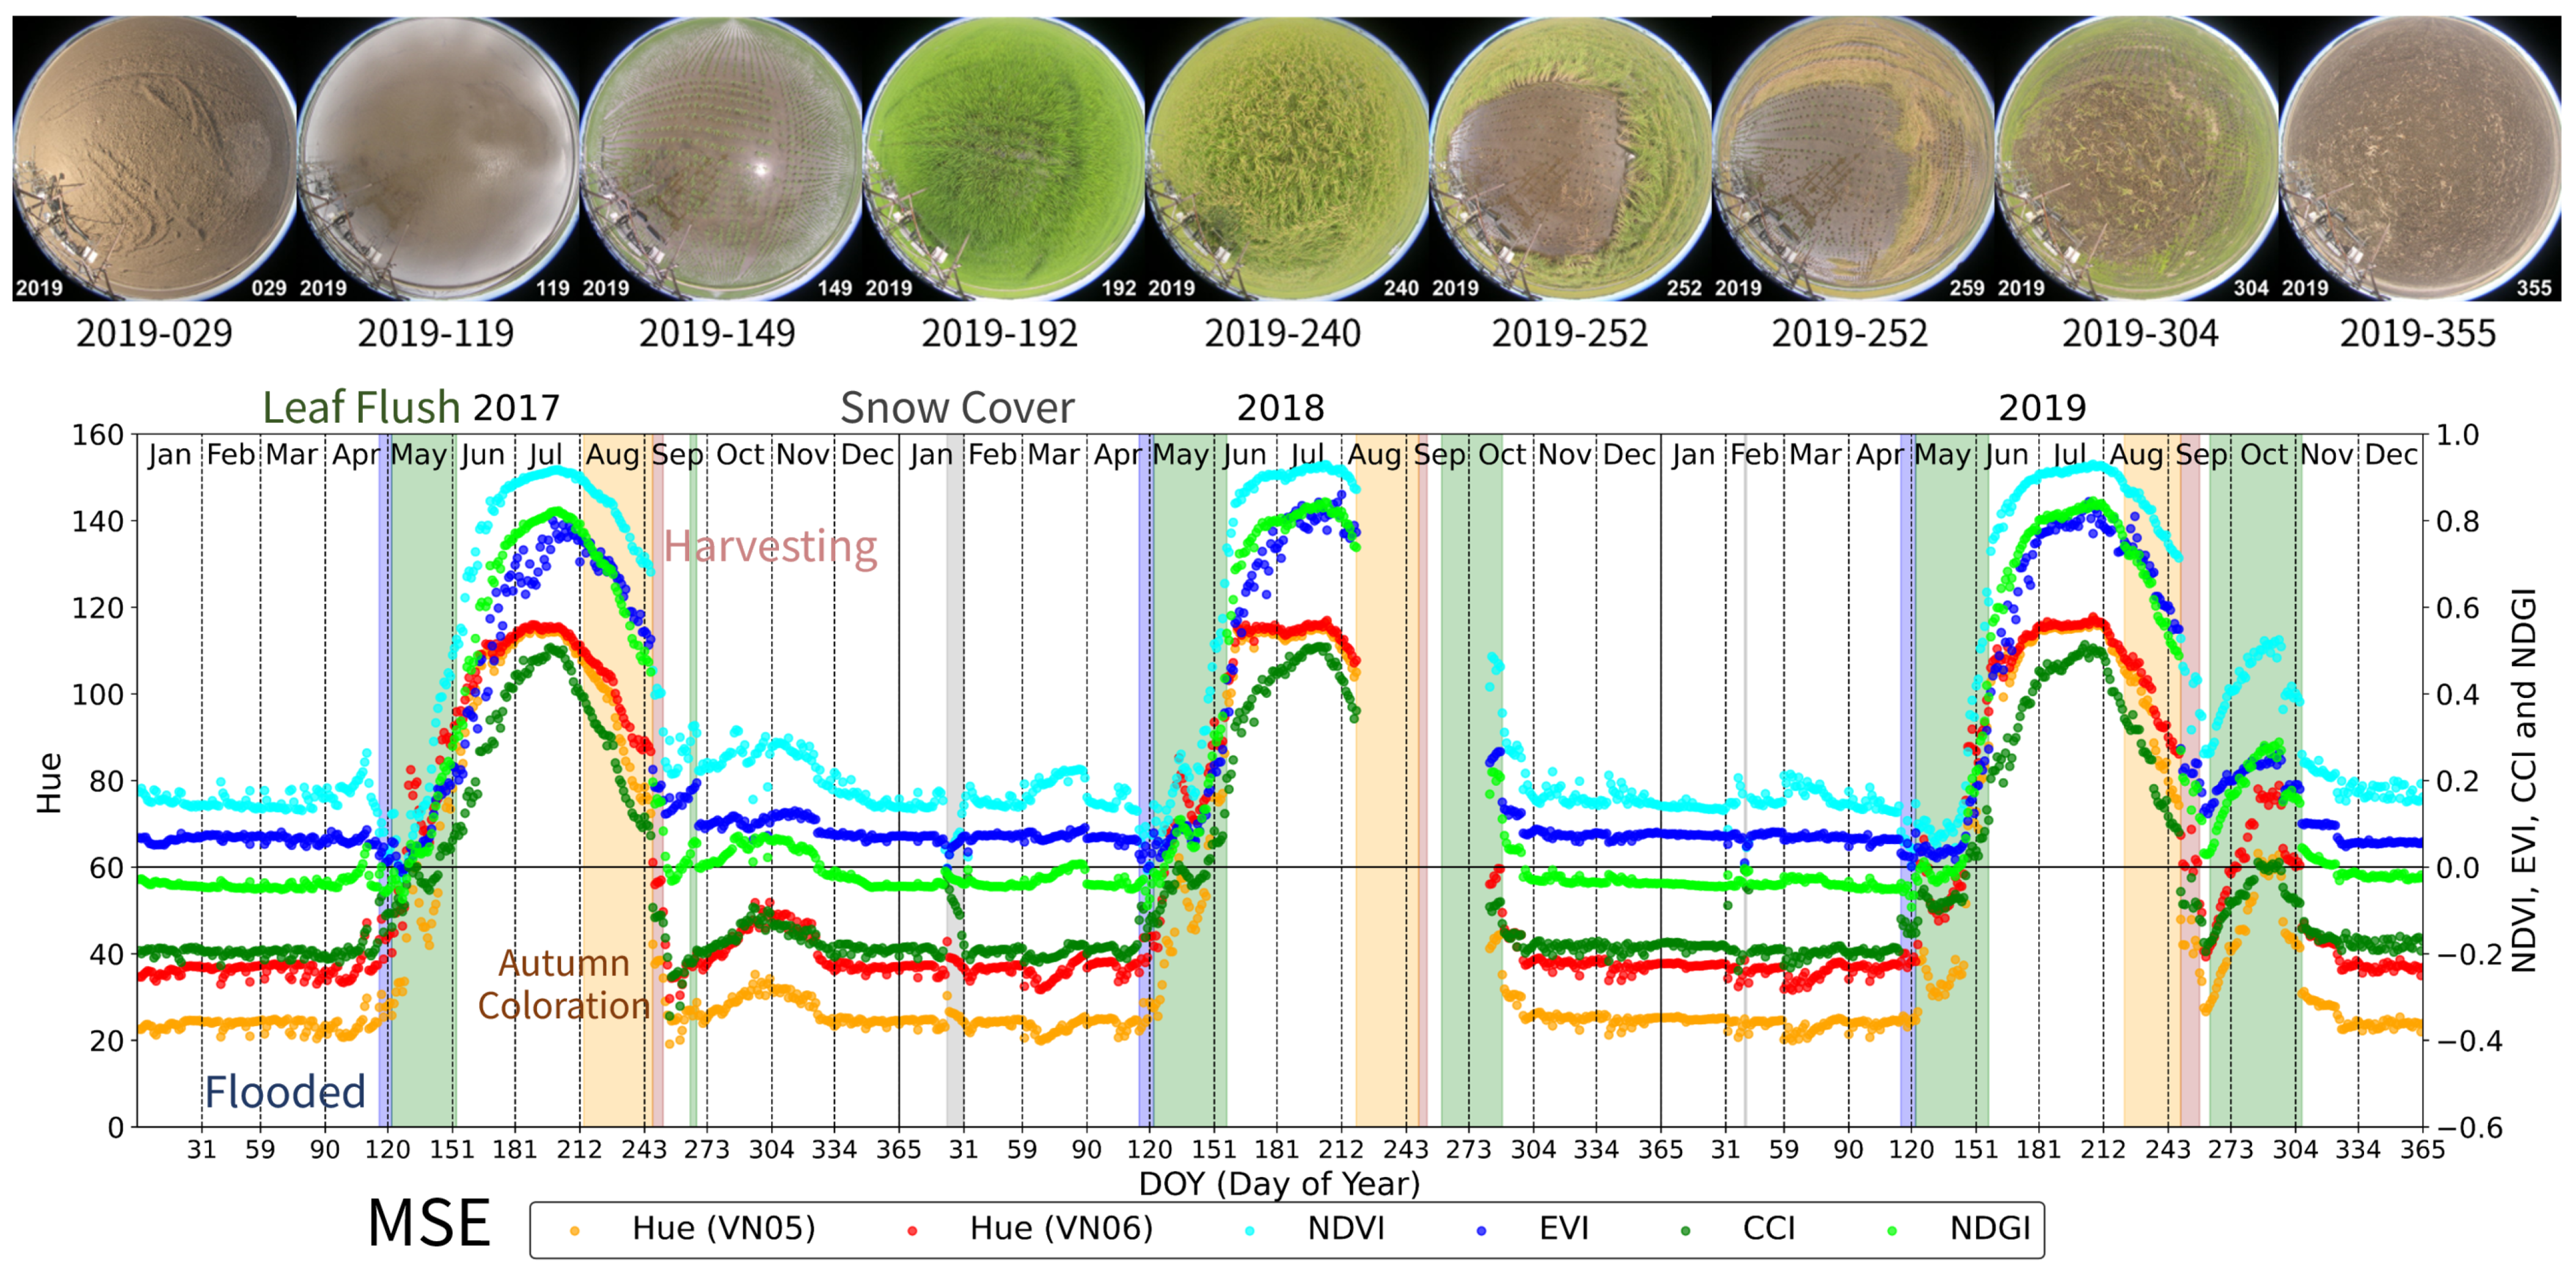
From the ADFC images at MSE, snow was observed during DOY 23–30 in 2018 and DOY 40 in 2019 (the gray bands of Figure 10). Flooding by irrigation started around DOY 114 each year, followed by rice planting around DOY 122. Autumn coloration began around DOY 220 (the orange bands of Figure 10), and harvesting took place from around DOY 248 for several days (the pink bands of Figure 10). After that, rice sprouting started (ratoon), and a small amount of green vegetation became visible (the green bands in autumn of Figure 10). However, tilling destroyed the ratoon around DOY 310 and subsequently the soil was exposed until the next flooding occurred.
During the bare soil period (Figure 10, around DOY 320–114), the values of Hue (VN05): 24, Hue (VN06): 35, NDVI: 0.2, EVI: 0.08, CCI: 0.2 , and NDGI: 0.05 were observed, and each spectral index showed an upward or downward trend. With flooded, NDVI and NDGI increased about 0.1 (2017), or fluctuations in their values, but no significant changes were observed in hue, EVI, or CCI. As rice grew, all spectral indices increased, peaked in late July, and began to decline, reaching the lowest peak at harvest. Afterward, the indices were increased by ratoon and then decreased by tilling.

3.4. Takayama Site (TKY): Deciduous Broad-Leaved Forest (DBF)

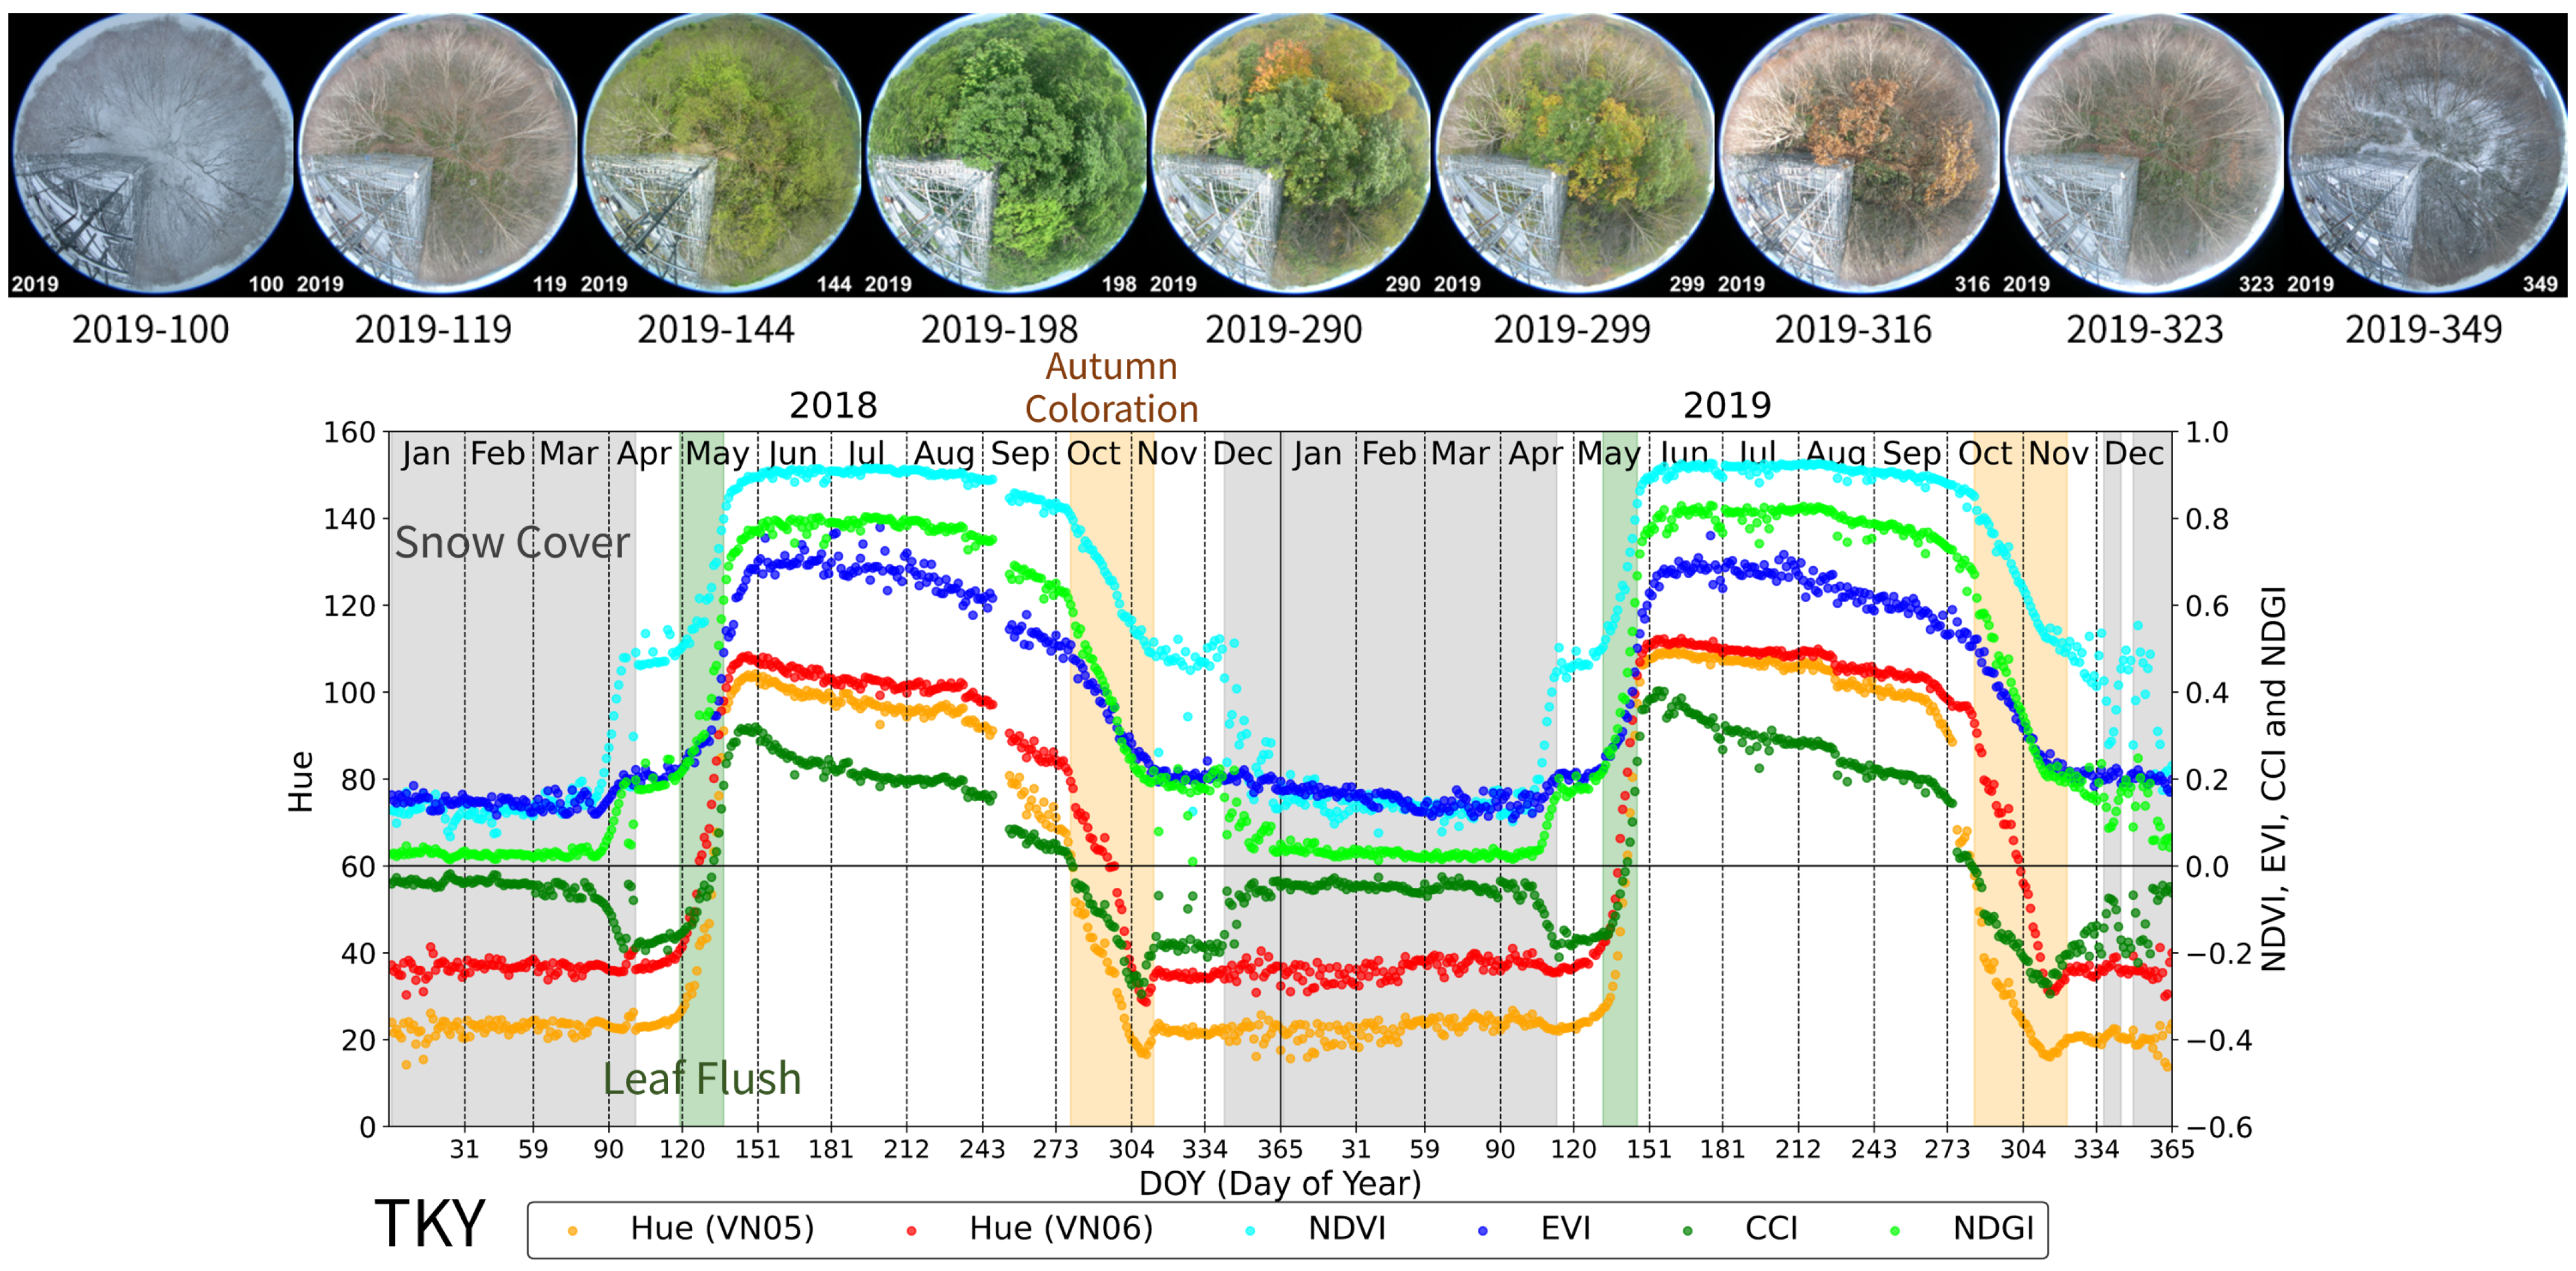
From the ADFC images at TKY, snow was observed from December to February each year (the gray bands of Figure 11). In 2018, snowmelt began around DOY 80, and new snow accumulated around DOY 98, but by DOY 100, the snow had completely melted. After summer in 2018, snow was first observed on DOY 343, and snowmelt began around DOY 100 in 2019, with complete snowmelt occurring around DOY 113. Leaf flush started around DOY 119 in 2018 and DOY 132 in 2019 (the green bands of Figure 11), and autumn coloration began around DOY 280 (the orange bands of Figure 11). However, B. ermanii began autumn coloration earlier than Q. crispula. Almost all trees had shed their leaves by DOY 312 (2018) and DOY 321 (2019).
During the snow cover period (the gray bands of Figure 11, around DOY 1–100), Hue (VN05) remained around 24, Hue (VN06) remained around 35, NDVI and EVI were around 0.2, CCI was around 0.1 , and NDGI was around 0.05. At the timing of snowmelt, NDVI, EVI, and NDGI increased in value, while CCI decreased to around 0.2 . After the leaf flush period (the green bands of Figure 11), the values of each index rapidly increased. From late May to mid-June, values gradually decreased, with a sharp decline starting in late August 2018 and late September 2019. Hue and CCI reached the trough around the peak of autumn coloration, and values increased again at the leaf-shedding timing. However, other indices remained steady from the peak of autumn coloration until snow accumulation. At the onset of snow accumulation, NDVI and NDGI decreased while CCI increased. No significant changes were observed in hue and EVI.

3.5. Fuji Hokuroku Site (FHK): Deciduous Needle-Leaved Forest (DNF)

From the ADFC images at FHK, snow and snowmelt repeatedly occurred from January to April (the gray bands of Figure 12). The snow completely disappeared on DOY 87 (2018) and DOY 104 (2019). Leaf flush began around DOY 102 in 2018) and DOY 113 in 2019 (the green bands of Figure 12), and autumn coloration started around DOY 297 in 2018 and DOY 288 in 2019 (the orange bands of Figure 12). The peak of it occurred from DOY 309 to 316 (2018) and from DOY 309 to 317 (2019). By DOY 331 (2018) and DOY 329 (2019), almost all the leaves had fallen.
At the timing of snowmelt (Figure 12, DOY around 104 in 2019), NDVI, EVI, and NDGI increased, while CCI decreased to around 0.2 . During leaf flush periods (the green bands of Figure 12), each index rapidly increased. From late May to mid-June, the values gradually decreased, with a sharp decline starting in late October 2018 and mid-October 2019. At the peak of autumn coloration, each index reached the peak of the decrease, and values increased again with leaf-shedding. In 2019, after leaf shedding, snow was observed, and while NDVI, CCI, and NDGI showed fluctuating values, hue and EVI showed little variation.

3.6. Relationship Between Spectral Indices and Site Condition

We classified the period (condition) of each site into several categories (Table 3: leaf flush, green leaf, autumn coloration, understory vegetation, bare soil, full snow cover, partial snow cover, and flooded period) based on the visual interpretation from ADFC images. Some categories were not defined at some sites due to differences in land use, land cover, and climate type between sites. Some periods were not classified due to missing data or challenges in accurately interpreting ADFC images. At each site, phenological and land surface periods were defined as follows:
  • Leaf Flush period: At TSE, TGF, TKY, and FHK, this period was defined as the time from the onset of budburst to the subsequent development and expansion of leaves. At MSE, it was defined as the period from rice planting to the full coverage of the soil by green leaves.
  • Green Leaf period: This is a period of green canopy covered with green leaves after the leaf flush. At TSE, TGF, TKY, and FHK, it ended by the start of the autumn coloration. At MSE, it ended with the earing of rice.
  • Autumn Coloration period: This is a period during which the canopy or dominant species changed leaf color from green to yellow or red, ending with leaf fall. At MSE, it was defined as the period from earing of rice to harvesting.
  • Understory Vegetation period (only TSE, TKY, and FHK): This period refers to times when understory vegetation was visible before the canopy leaf flush in spring or after leaf fall in autumn.
  • Bare Soil period (only TGF and MSE): Defined as the period when the bare soil surface was exposed, observed at TGF and MSE.
  • Snow Cover period: Refers to the period during which snow was present, including the snowmelt phase.
    Full Snow Cover: Ground surface mostly covered by snow (more than 90%).
    Partial Snow Cover: Only part of the ground surface covered by snow (10%–90%).
  • Flooded period (only MSE): At MSE, it is defined as the period of surface water flooding prior to rice planting.
Table 3. The start and end DOYs of each vegetation condition and site based on visual interpretation from ADFC images. Some periods were not classified due to missing data or challenges in accurately interpreting ADFC images.
Site IDYearGreen
Leaf
Autumn
Coloration
Leaf
Flush
Understory
Vegetation
Bare
Soil
Full
Snow
Partial
Snow
Flooded
TSE2018138–279280–317126–137122–125, 324 1–110,
339–365
111–121
2019134–272273–311,
316–317
1–105, 312
332–365
106–111,
313–314,
319–331
2020132–272273–308,
310–313
124–131119–123,
318–320
1–100,
114,
309, 315,
336–365
101–113,
115–118
316–317,
328–335
TGF2019149–177,
205–257
258–33062–148,
183–204
1–39,
42–61,
331–365
40
2020126–164,
196–263
264–31054–125,
173–195
1–53,
350–365
2021120–168,
195–270
271–32071–119,
175–194
1–70,
321–365
MSE2017153–213214–246122–152,
265–268
1–114,
326–365
116–121
2018157–218219–248122–156,
260–288
1–22,
31–113,298–365
23–33114–121
2019157–221222–248122–156,
263–306
1–39,
41–114,
324–365
40115–121
TKY2018137–278279–312119–136101–118,
313–341
1–81,
353–357,
362–365
82–100,
342–352,
358–361
2019132–245284–321132–145113–131,
322–336,
344–348,
351–353,
355–356
1–103,
357–365
104–112,
337–343,
349–350,
354
FHK2018115–296297–33096–1141–21, 64–66,
68–79, 88–95,
331–365
22–59,
67,
80–86
60–63,
87
2019124–287288–329107–1231–31, 35–61,
63–69, 71–99,
104–106,
330–332,
335–356
100–102,
357–365
32–34,
62, 70,
103,
333–334
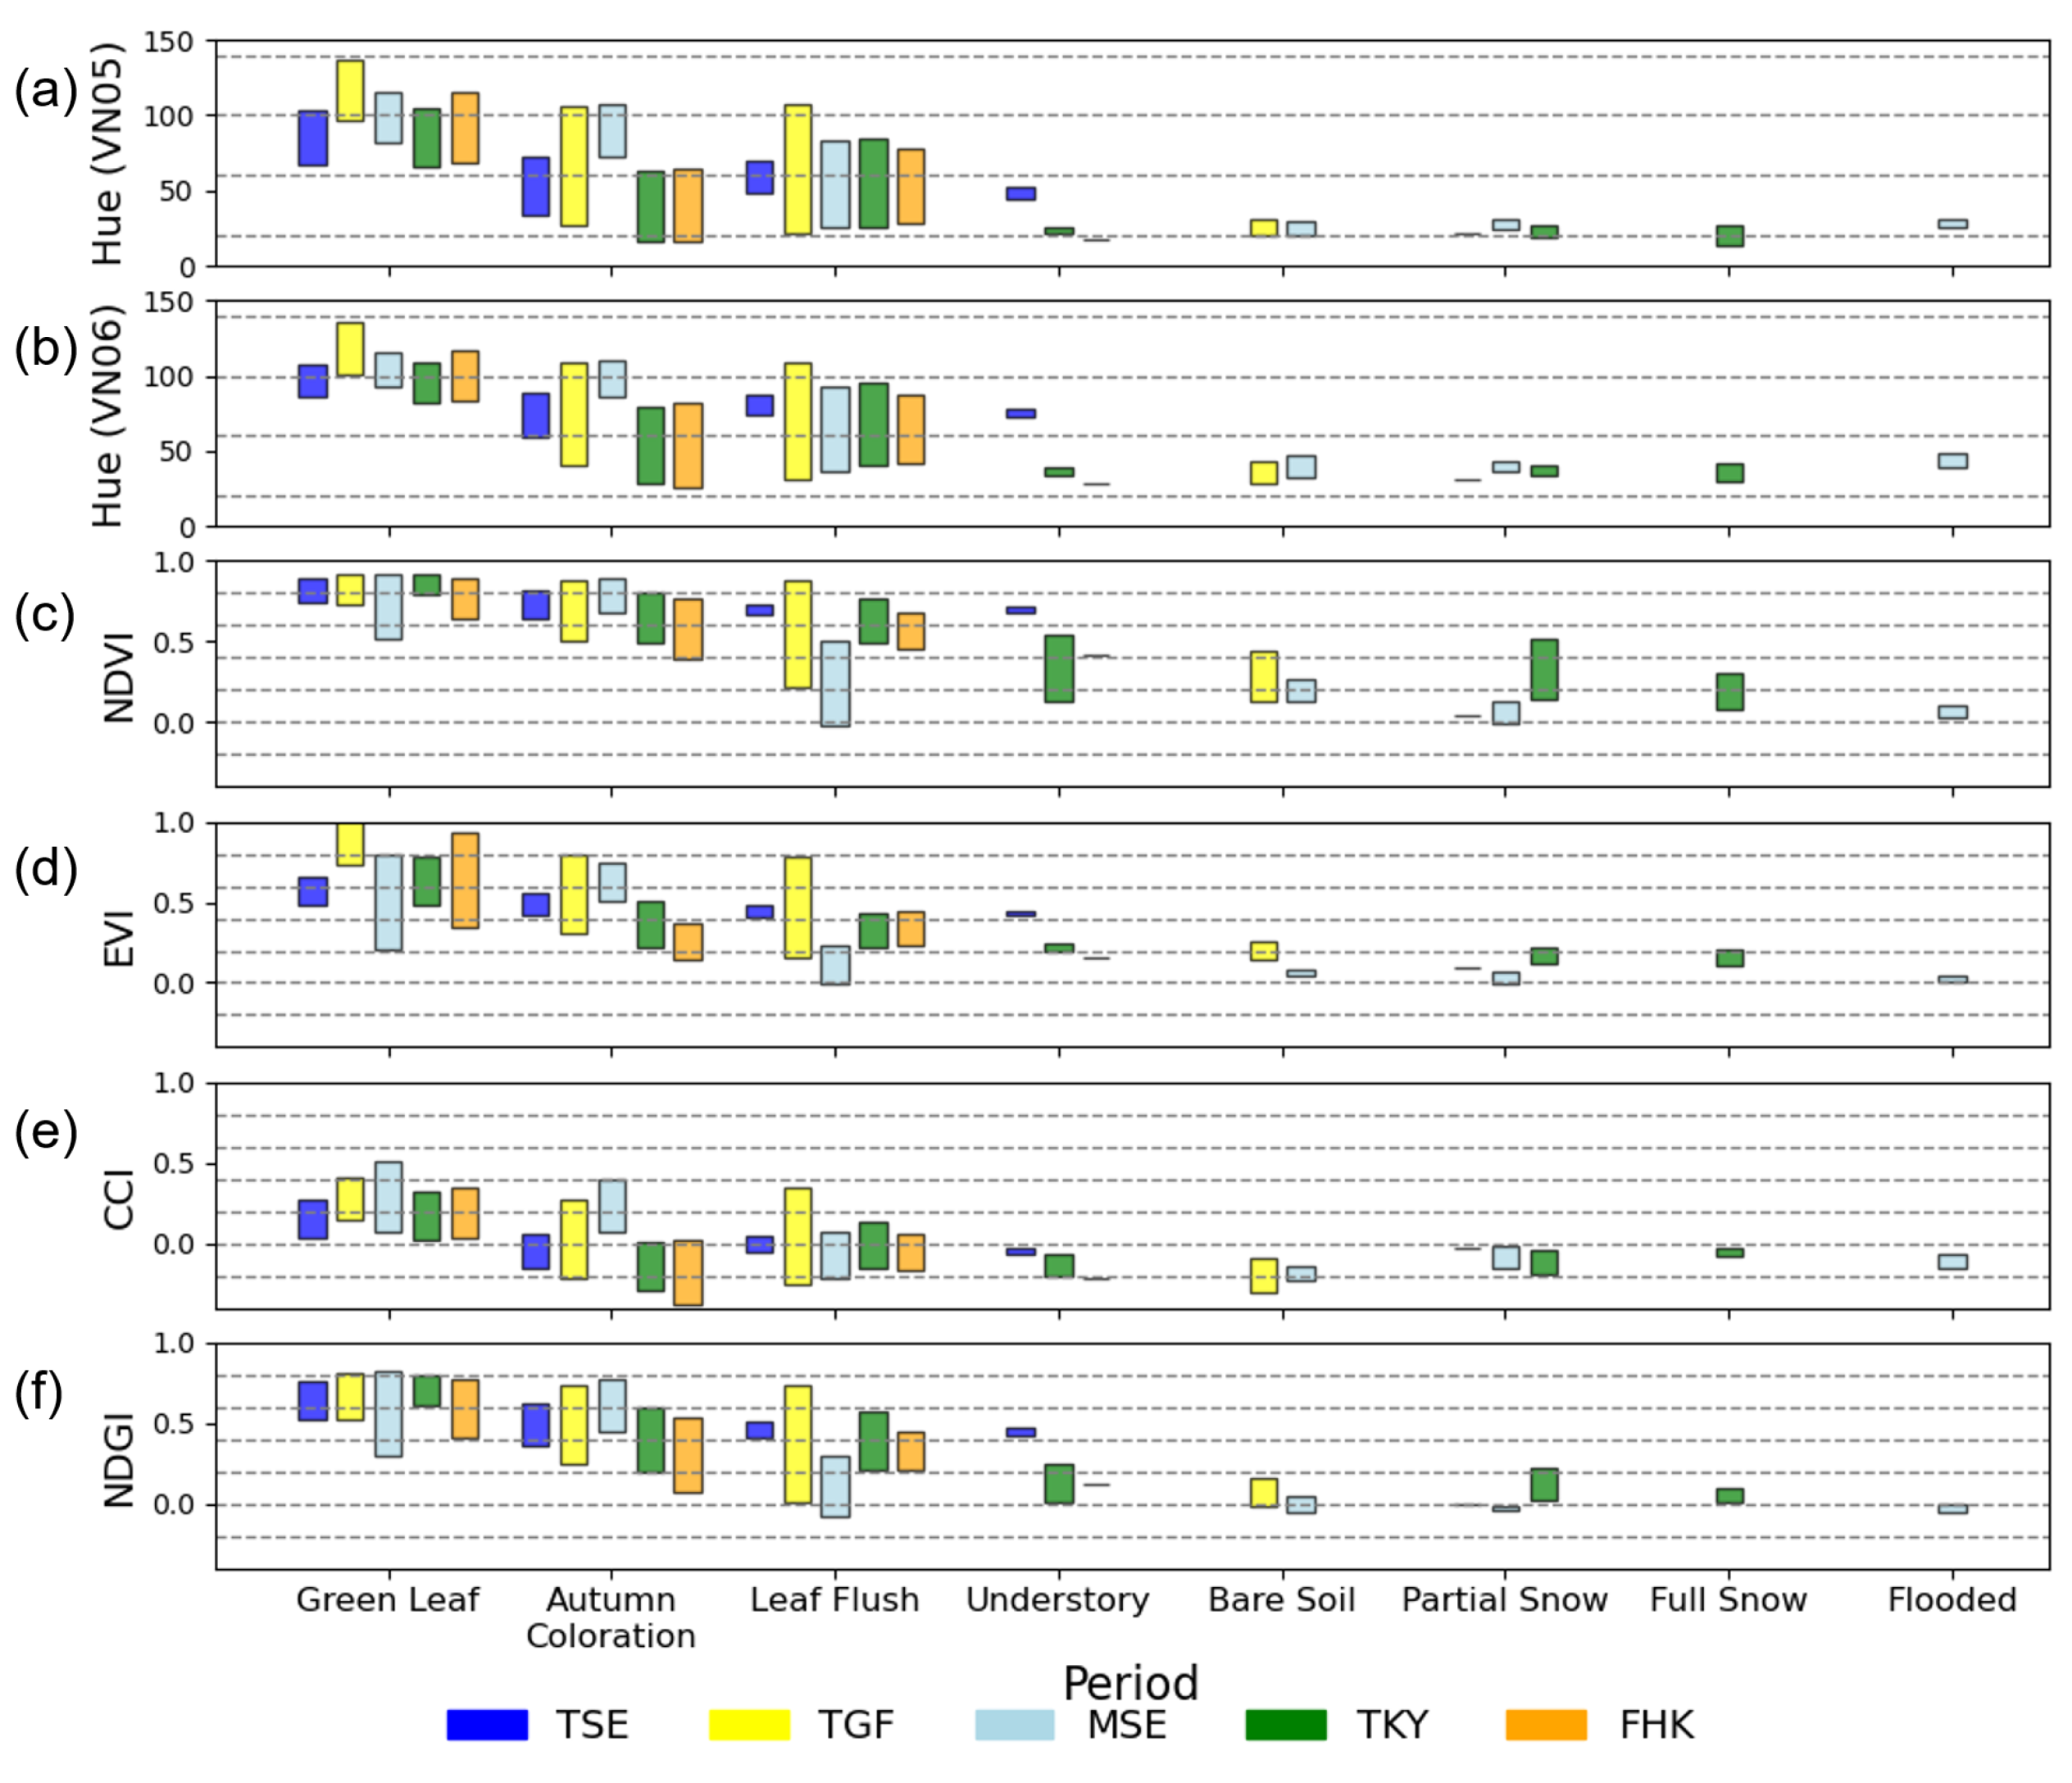
The range diagrams of each spectral index for each site and condition are shown in Figure 13. Hue (both VN05 and VN06) and CCI showed clear differences in values between the green leaf period and the autumn coloration period, while the other indices did not exhibit such clear distinctions (excluding MSE). VIs other than EVI exhibited clear changes in values between the full and partial snow cover periods, while hue and EVI remained relatively stable across these periods. Hue, at forested sites (TSE, TKY, and FHK), generally had values below 60 in categories other than the leaf flush and green leaf period.

3.7. Comparison Between Hue (VN05) and Hue (VN06)

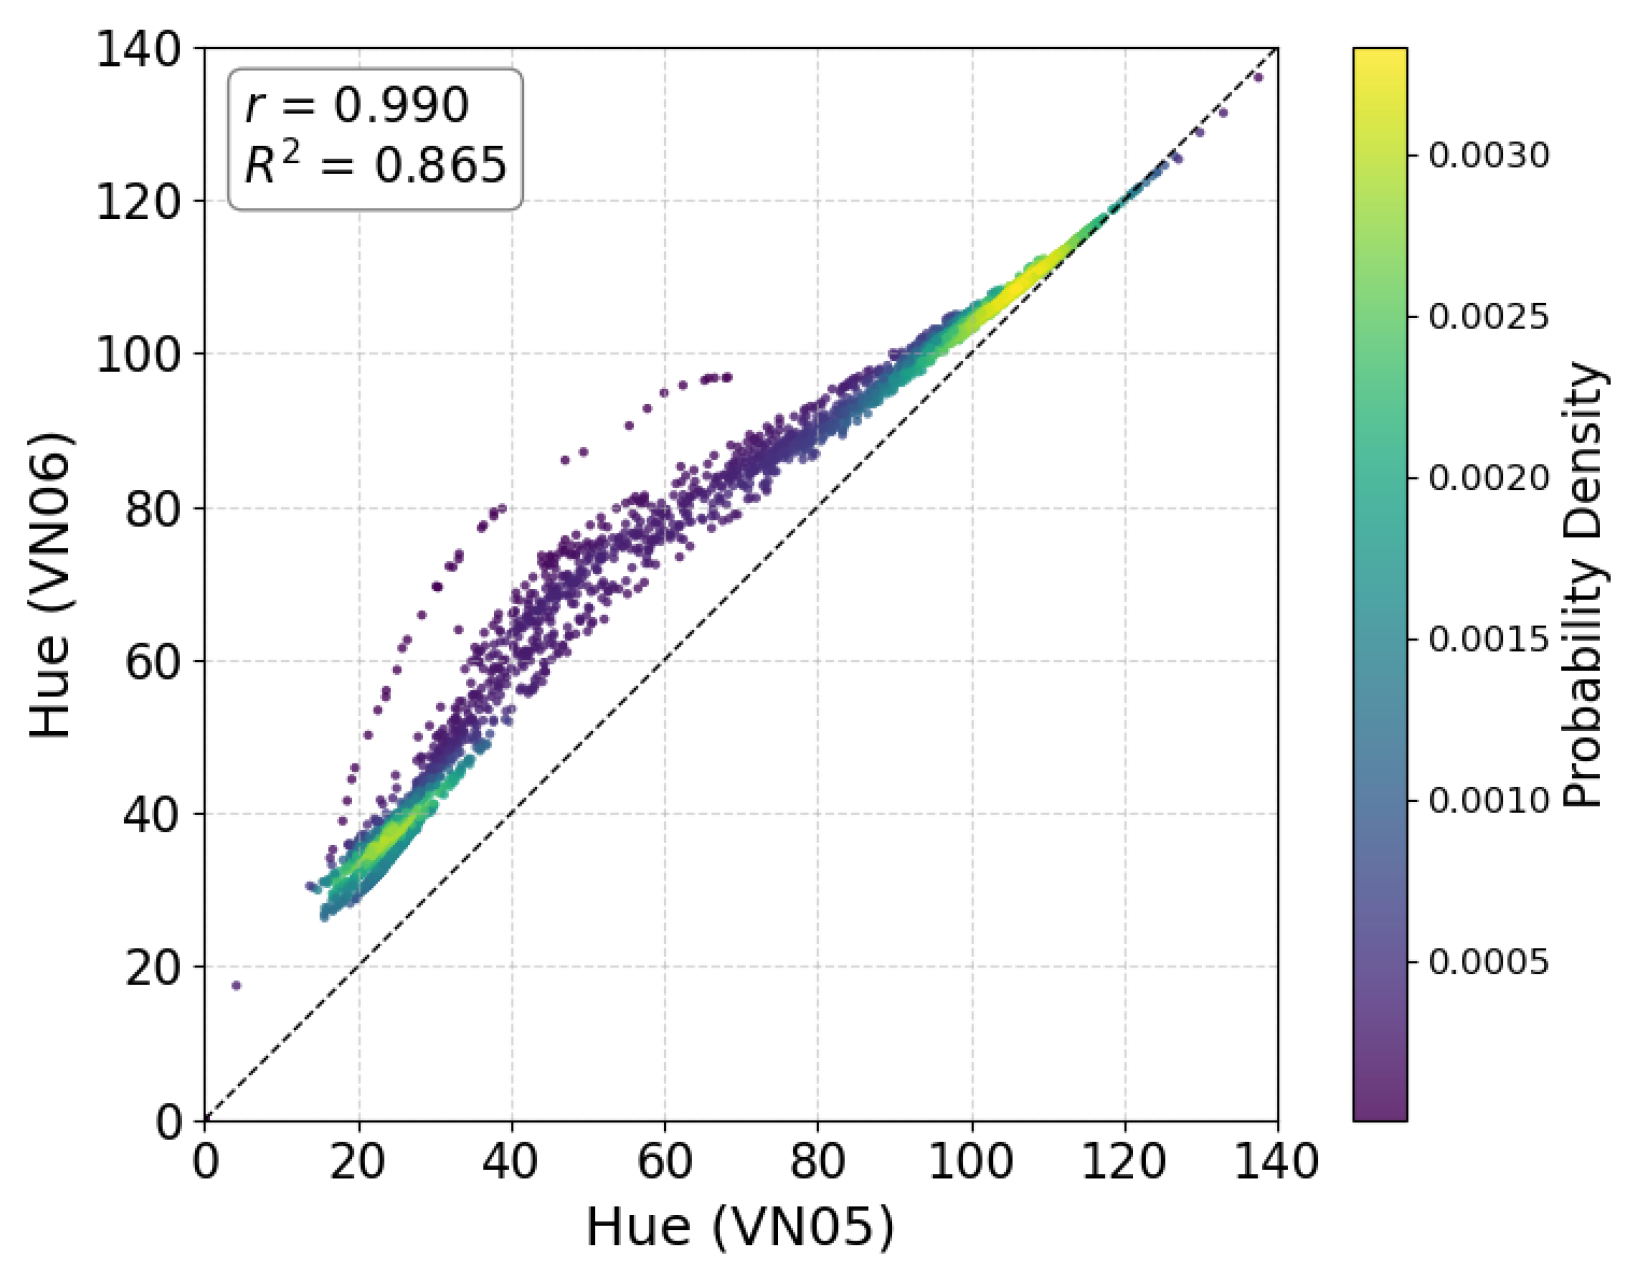
Hue (VN05) and Hue (VN06) showed a strong correlation; however, a perfect one-to-one correspondence was not observed (Figure 14: correlation coefficient r = 0.990, coefficient of determination R 2 = 0.864). Overall, the data exhibit an upward trend, indicating that Hue (VN06) increases as Hue (VN05) increases. In particular, in the range where Hue (VN05) exceeds approximately 90 and is below 30, the values of both indices closely match, showing strong consistency. In contrast, in the range from 30 to 90, Hue (VN06) especially tends to be higher than Hue (VN05), suggesting a systematic difference between the two.

3.8. Comparison of Hue Across Multiple Satellite Sensors

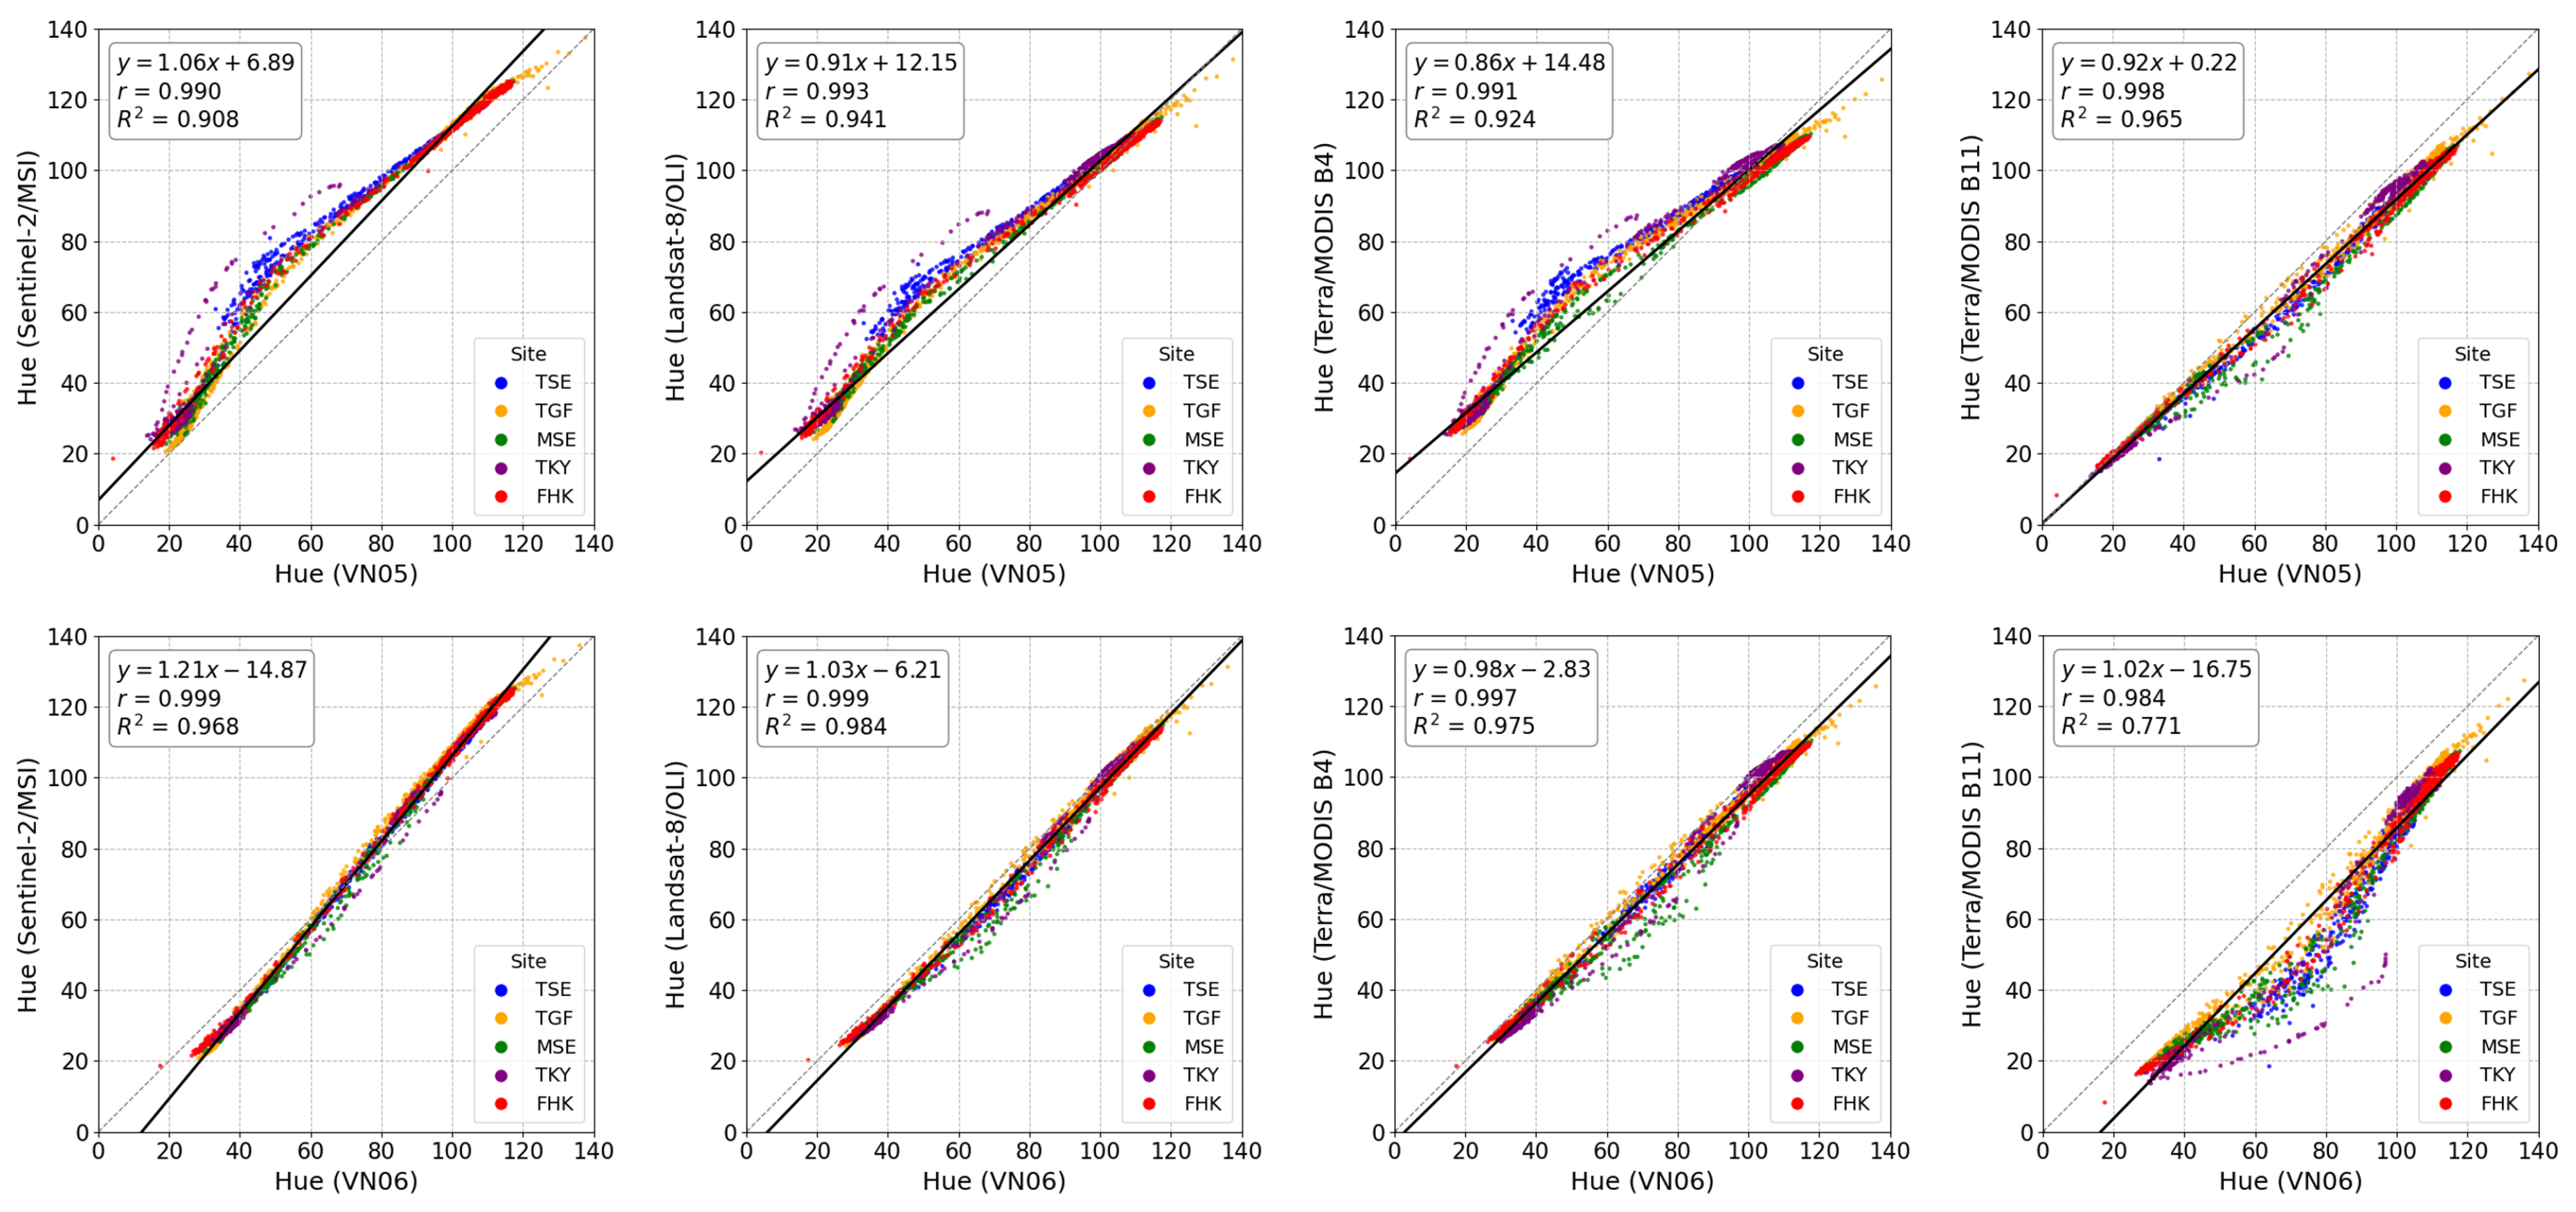
Hue (VN05 and VN06) showed strong correlations with hue values derived from other sensors. In particular, extremely high correlations were observed for the following combinations: VN05 and Terra/MODIS Band 11, VN06 and Sentinel-2/MSI, VN06 and Landsat-8/OLI, and VN06 and Terra/MODIS Band 4, with correlation coefficients (r) exceeding 0.997 and coefficients of determination ( R 2 ) greater than 0.96 (Figure 15).

4. Discussion

An increase in values during the leaf flush period was observed across all spectral indices (Figure 8, Figure 9, Figure 10, Figure 11 and Figure 12). However, as shown in many previous studies, NDVI, EVI, and NDGI also showed increases during the snowmelt period (TKY: Figure 11; FHK: Figure 12). This suggests that these three indices may confuse snowmelt and actual vegetation growth. Additionally, CCI (GRVI) showed a decrease in value during the snowmelt period, as previously reported by Motohka et al. [30]. In forests where leaf flush begins simultaneously with snowmelt, such as beech forests in heavy snowfall regions (Figure 1), this CCI decrease due to snowmelt and increase due to leaf flush may cancel each other out, potentially making it difficult to accurately detect leaf flush phenology. In contrast, the hue index we propose did not show any noticeable increase or decrease in value during the snow cover period, unlike the other indices. In other words, hue captured vegetation growth without being affected by snowmelt. Owing to this stability during the snow cover period, hue is considered to be applicable to both no-snow-covered regions and snow covered areas. However, at TSE, an increase in hue values was observed from the snowmelt period to the understory vegetation period. At this site, the larch canopy covers less than half of the total area, leaving the remaining area exposed and dominated by dwarf bamboo [54]. In addition to this, at MSE, spectral indices showed an upward or downward trend during the snow cover period. At MSE, there is no plant, including understory vegetation in winter. Reflectance at MSE in the snow period is determined by soil and accumulated snow. In contrast, at the other forest sites (FHK and TKY), the tree canopy is almost completely closed. Therefore, the increase or decrease in hue values at TSE and MSE is likely due to the exposure of the understory vegetation (e.g., dwarf bamboo) following snowmelt and backdrop component (e.g., soil, snow). At TKY and FHK, however, trunks and branches attenuate the reflected light from the understory, which may explain the absence of a hue increase during the snowmelt period at those sites.
As mentioned earlier, Hue (both VN05 and VN06) and CCI show clear differences between the green leaf period and the autumn coloration period compared to the other indices (Figure 13). The color of plant leaves is determined by pigments such as carotenoids and chlorophyll, which are closely related to the physiological functions of the leaves [61]. Since hue quantifies the color of plant leaves, it may offer a way to estimate the proportion of these pigments and effectively capture the state of autumn coloration.
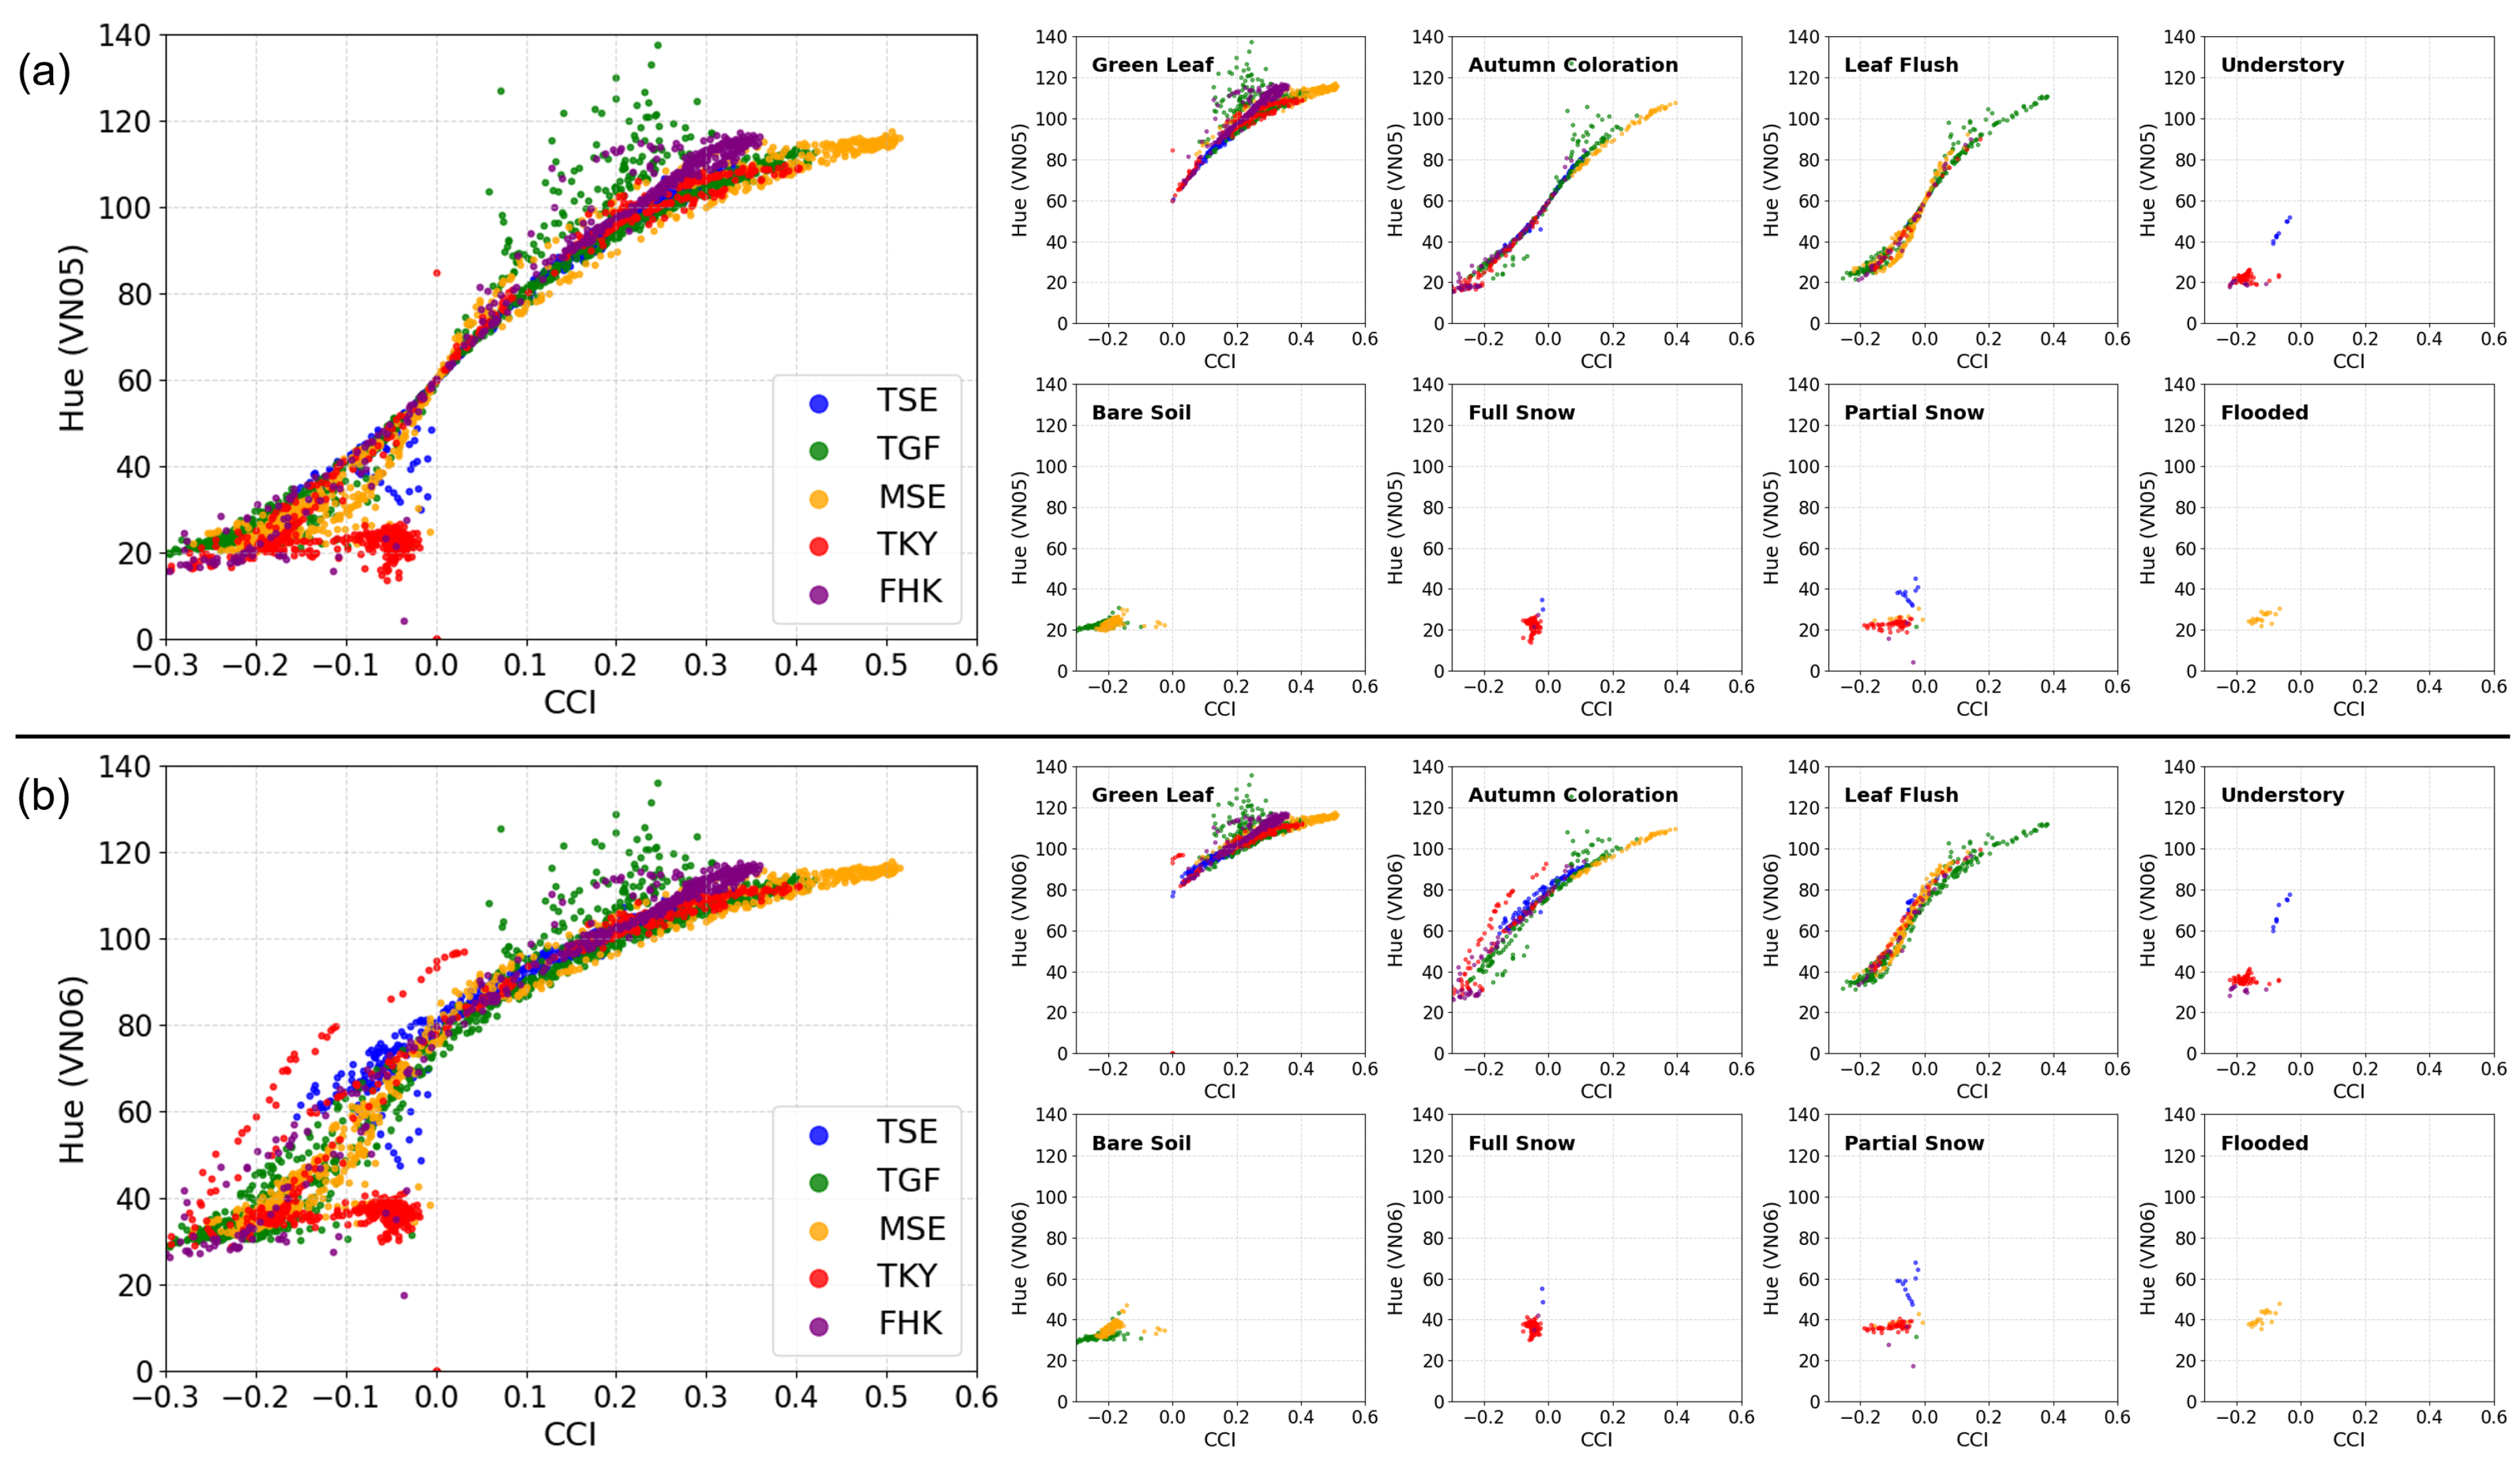
Based on these characteristics of hue, we evaluated its applicability for phenology detection by comparing it with existing methods. Motohka et al. [30] demonstrated that GRVI (equivalent to CCI) effectively represents both mid-stage SOS and mid-stage EOS using a GRVI threshold of 0, based on in situ data from the Phenological Eyes Network (PEN) in Japan. Since their method is recognized as suitable for SOS monitoring in Japan among conventional VIs [14], we compared Hue (both VN05 and VN06) with CCI in this study (Figure 16). The results showed that, at all sites, the timing when CCI reached zero and when Hue (VN05) reached 60 was nearly identical, suggesting that mid-stage SOS and mid-stage EOS can be detected with similar accuracy using a Hue (VN05) threshold of 60—comparable to the method proposed by Motohka et al. While Hue (VN06) value corresponding to CCI = 0 was approximately 80, the relationship between Hue (VN06) and CCI was less clearly defined than that of Hue (VN05). This discrepancy is likely due to the difference in the green bands used for calculating CCI and Hue (VN06), with VN06 (566.1 nm) deviating from the green wavelength employed in CCI (VN05: 529.7 nm). Therefore, when conducting comparative evaluations with CCI, using Hue (VN05) may be more appropriate. However, such consistency was not observed during the snow cover period (both full and partial snow cover), particularly at TKY. During this period, CCI fluctuated within the range of 0.3 to 0.1 , whereas Hue (VN05) consistently remained around 20. This contrast further suggests that hue is less affected by snow compared to CCI, highlighting its robustness under snowy conditions. Hue (VN06) also showed the same trend in snow cover period.
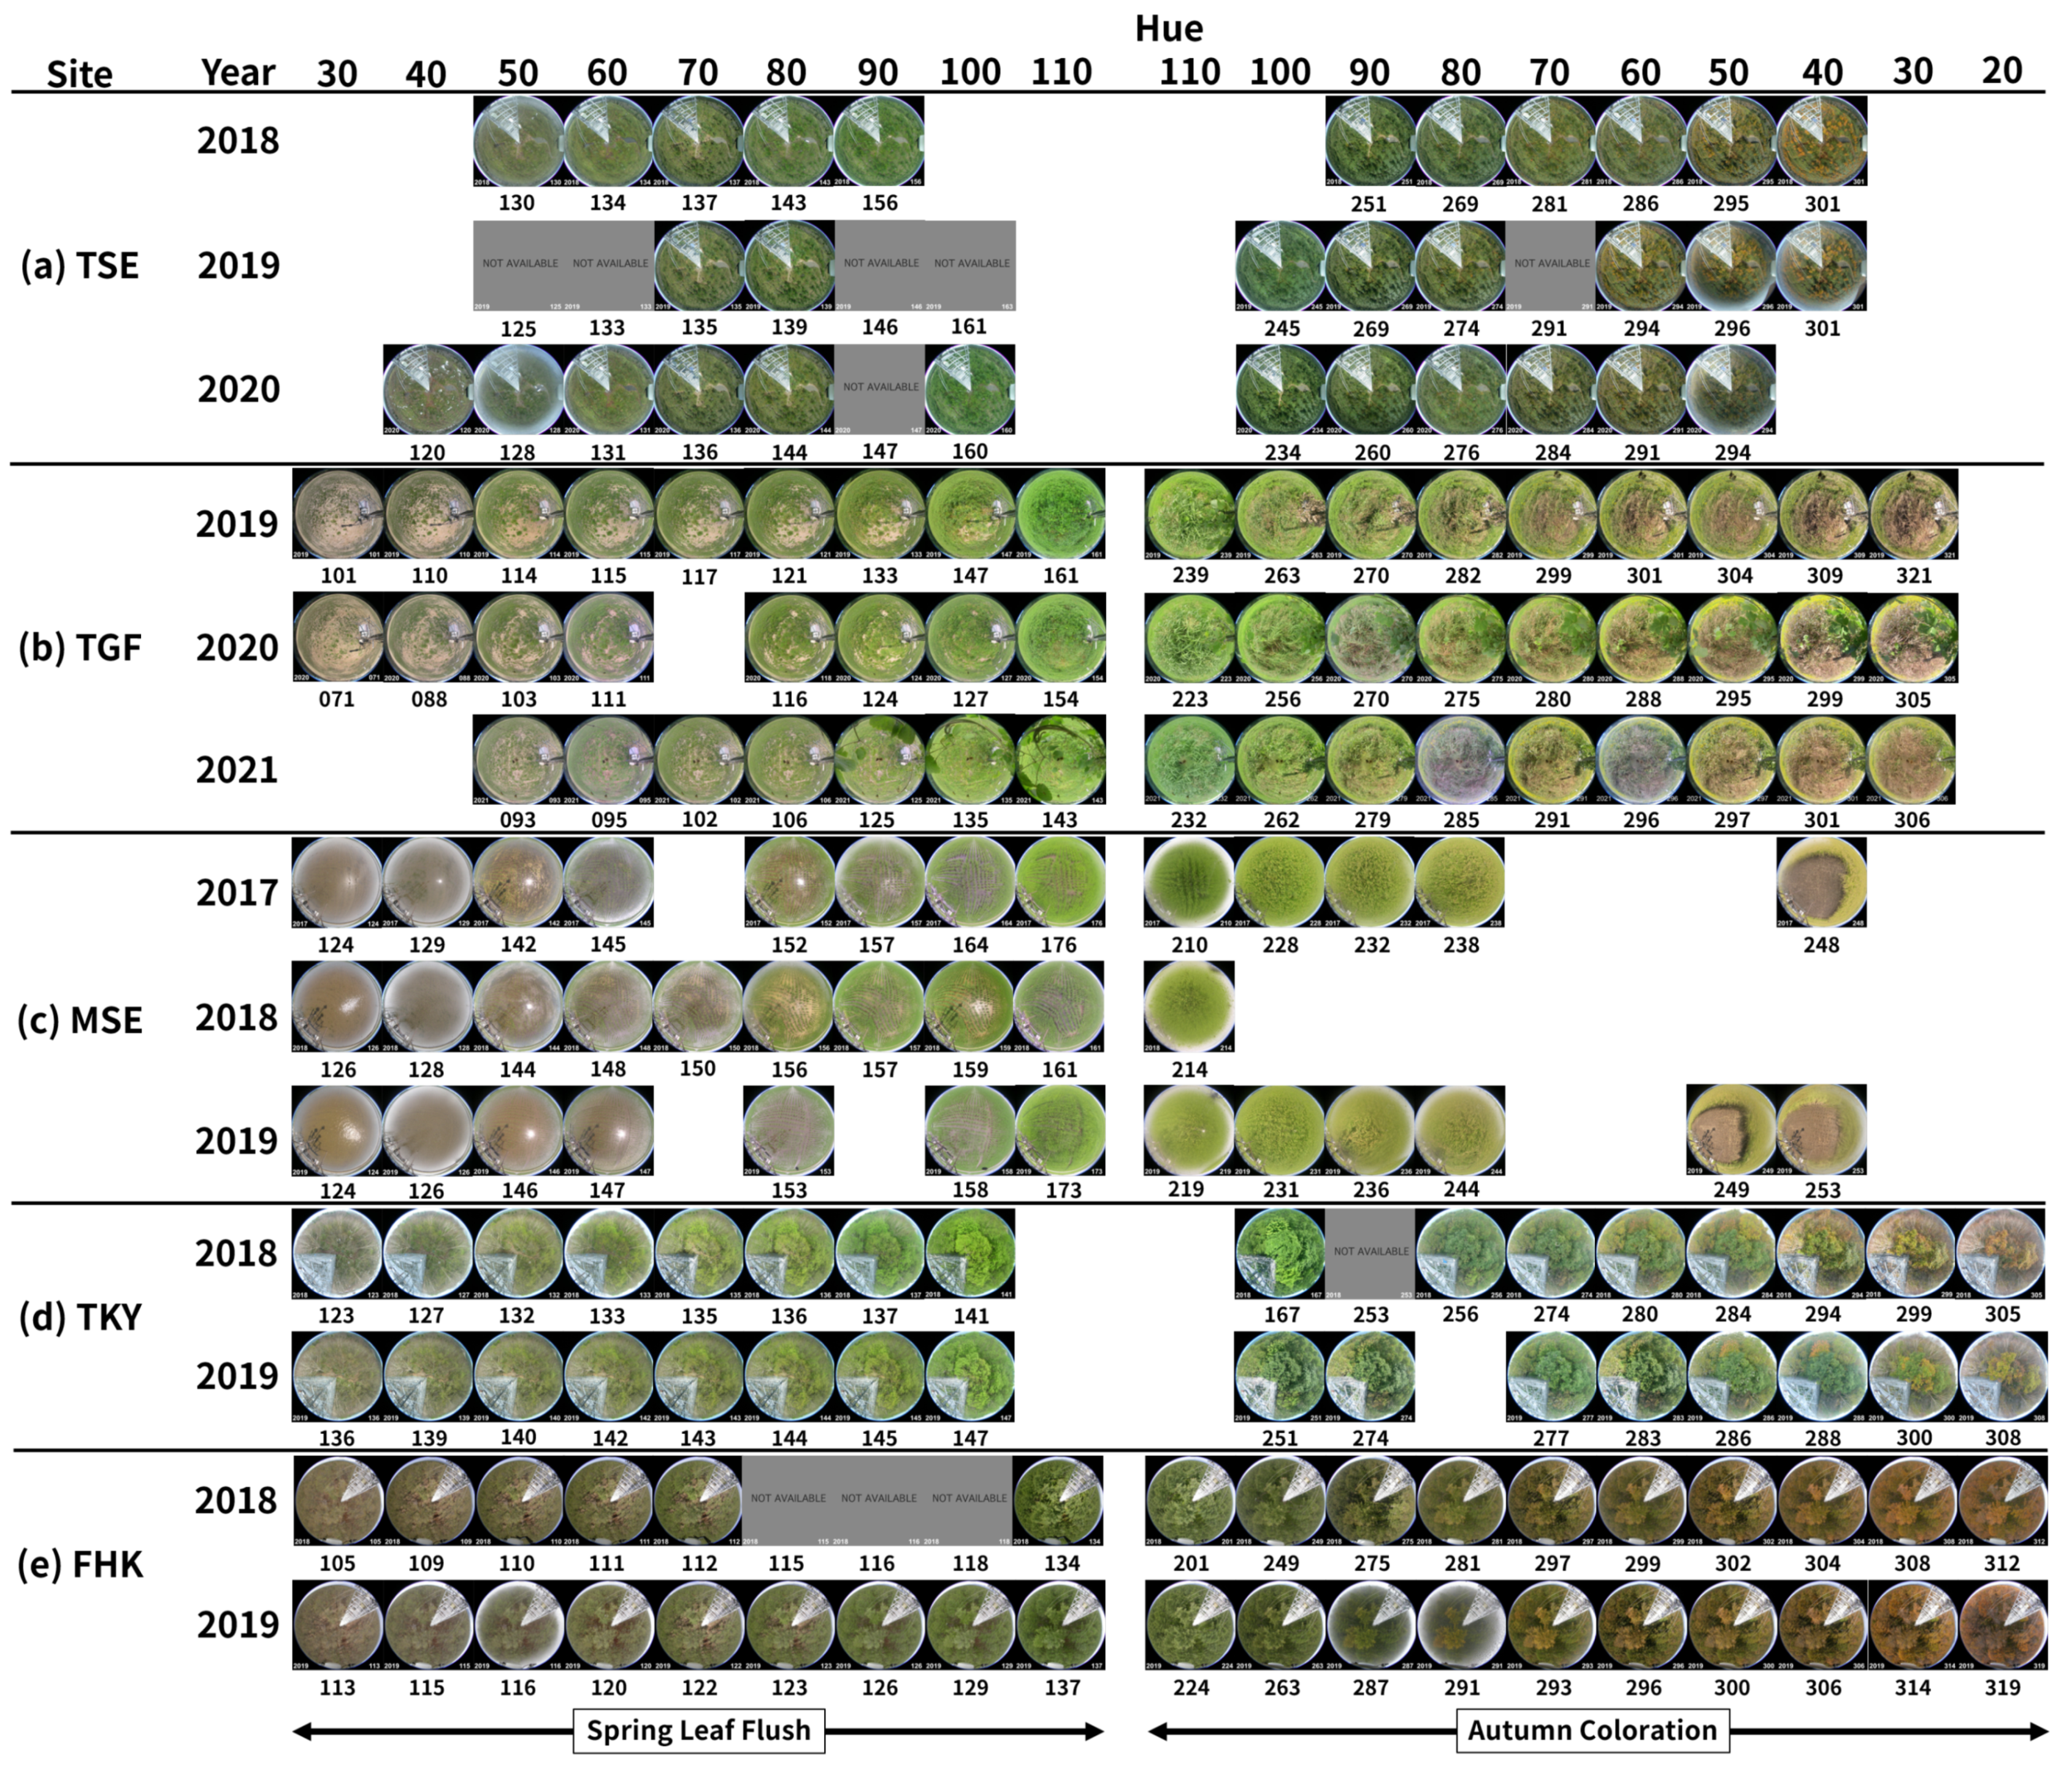
Hue demonstrated the capability to consistently extract specific vegetation states at each site using fixed threshold values (Figure 17). For example, Hue = 60 (VN05) corresponded to the mid-stage of SOS across all sites, and Hue = 80 (VN06) effectively distinguished between pre-harvest and post-harvest stages at MSE. Furthermore, even during the autumn coloration period—which is generally difficult to detect accurately using satellite remote sensing—setting threshold values enabled the extraction of consistent coloration states at each site. However, phenology detection based on thresholds may be susceptible to noise and external disturbances. Therefore, it is necessary to statistically examine the relationship between hue values and phenological stages. Additionally, developing detection methods tailored specifically to hue would be a worthwhile direction for future research. Moreover, understanding the ecological significance of hue—such as why Hue = 60 (VN05) corresponds to the mid-stage of SOS, or how autumn coloration is reflected in hue value changes—will be important topics for future discussion and investigation.
Another major advantage of hue lies in its high potential for sensor compatibility. Unlike many VIs developed for snowy regions—such as NDWI, PI, NDPI, and NDGI—hue does not require near-infrared (NIR) or shortwave infrared (SWIR) bands. Instead, it is calculated solely from the reflectance of the three visible bands (blue, green, and red) [28,29,31,32,33]. Since these visible bands are included in nearly all optical satellite sensors, hue can be applied even to platforms that lack NIR or SWIR bands, giving it broader applicability compared to many conventional VIs. In addition to this spectral simplicity, our cross-sensor comparison demonstrated that simulated hue values of GCOM-C/SGLI showed very high consistency with those calculated for other major satellite sensors, including Sentinel-2/MSI, Landsat-8/OLI, and Terra/MODIS. Specifically, Hue (VN06) exhibited extremely strong agreement with hue from Sentinel-2/MSI and Landsat-8/OLI, while Hue (VN05) showed high correlation with hue calculated using MODIS Band 11 (Figure 15). These findings indicate that hue has high interoperability across satellite platforms and is broadly applicable to satellite-based phenological studies.
Cao et al. [27] quantitatively evaluated the performance of NDPI, NDGI, and NDVI for detecting vegetation green-up date (GUD) in northern middle and high latitudes (above 40°N), focusing on uncertainties caused by snowmelt. Their study revealed a latitude-dependent spatial pattern in GUD uncertainty. In regions between 40°N and 55°N, NDPI and NDGI achieved significantly lower uncertainties than NDVI, whereas all three indices showed substantial GUD uncertainties at higher latitudes (55°N–70°N). Additionally, the reliability of each index varied depending on vegetation type: NDGI performed best in arid and semi-arid grasslands, while NDPI showed superior performance in deciduous broadleaf forests (NDGI and NDVI showed high performance, but their reliability was slightly lower than that of NDPI). In light of these findings, it is necessary to compare hue not only with traditional VIs based on NIR and visible bands but also with SWIR-based indices such as NDPI to comprehensively assess its utility in snow-affected ecosystems. Our study suggests that hue may be more robust than NDGI against snowmelt, particularly in mid-latitude forested regions. The robustness of NDPI and NDGI against snow is based on ratios and differences between bands, including NIR and SWIR, allowing them to capture vegetation changes while minimizing the influence of snow and soil [27,32,33]. In contrast, hue is derived from the relative differences among the RGB bands and reflects changes in canopy and land cover coloration, particularly during seasonal transitions such as leaf flush. Given these fundamentally different mechanisms of robustness against snow, it remains necessary to clarify why hue can be considered a robust index under snowmelt conditions. The findings of Cao et al. [27] are highly relevant to our study, as they highlight the challenge of snowmelt-induced uncertainty in phenology detection. While their analysis focused on SWIR and NIR-based indices, our results indicate that hue—a visible band-based index—exhibited stability during the snow cover period (e.g., Figure 11). This suggests that hue may offer a complementary or alternative approach to NDPI and NDGI, particularly in environments where NIR and SWIR bands are unavailable or affected by noise.
However, satellite data are influenced by multiple factors, including aerosols [62,63], clouds, BRDF (Bidirectional Reflectance Distribution Function) effects, topographic shadow [64,65,66,67], and heterogeneous land surfaces such as mixed pixels [27]. Consequently, evaluating the robustness of hue under these varying conditions is essential. Empirical validation using satellite images obtained under diverse environmental conditions, along with in situ hue measurements, will be critical for assessing the reliability and broader applicability of the hue-based approach across large spatial scales.
In this study, we divided the phenological process into six stages for forest sites (TSE, TKY and FHK), five stages for the grassland site (TGF), and six stages for the paddy field site (MSE), and examined the behavior of spectral indices at each stage. However, these stage classifications can be further refined for each site—for example, the senescence stage in deciduous forests or the milk-ripe stage in rice growth. We believe that future studies focusing more specifically on each ecosystem and its detailed phenological transitions will be essential for advancing the use of spectral indices in phenology monitoring.

5. Conclusions

In this study, we simulated hue values from GCOM-C/SGLI reflectance using in situ spectral data collected at five PEN sites in Japan, covering four major ecosystems (DNF, DBF, grassland and paddy field), and assessed the applicability of hue to remote sensing of plant phenology. Compared to conventional VIs (NDVI, EVI, CCI, and NDGI), hue showed stable behavior against snowmelt and the capability for phenological detection without uncertainty caused by snow. Furthermore, comparisons with in situ phenological camera (ADFC) images demonstrated that hue was capable of tracking key phenological transitions. These results suggest that hue may be particularly suitable for monitoring vegetation phenology in snowy forested regions, such as Japanese beech (Fagus crenata) forests on the Sea of Japan side, where leaf flush often coincides with snowmelt.
Hue is calculated solely from visible reflectance (RGB), allowing its use even with satellite sensors that lack NIR or SWIR bands. This gives hue broader compatibility than many traditional indices. Our cross-sensor comparison further revealed strong correlations between hue derived from GCOM-C/SGLI (VN03, VN06, VN08 bands) and hue values from Sentinel-2/MSI and Landsat-8/OLI, as well as between GCOM-C/SGLI (VN03, VN05, VN08 bands) and Terra/MODIS (Bands 1, 11, 3), supporting the interoperability of hue across multiple satellite platforms.
However, satellite data are inherently affected by factors such as aerosols, clouds, BRDF effects, and topography. Thus, further evaluation is required to assess the robustness of hue under such conditions and to establish practical methodologies for its operational use. In this context, Cao et al. [27] highlighted snowmelt-induced uncertainties in phenology detection using SWIR- and NIR-based indices. Our findings suggest that hue, based solely on visible bands, can remain stable during snow cover periods, offering a complementary or alternative approach in environments where NIR and SWIR data are limited or noisy.
Additionally, the ecological meaning of hue and other VIs remains largely unexplored, as current evaluations rely heavily on visual phenology comparisons. Future research should aim to clarify the ecological relevance of hue and other VIs to advance our understanding of plant phenology from both physiological and remote sensing perspectives.

Author Contributions

Conceptualization, Y.M. and T.S.; methodology, Y.M.; software, Y.M. and T.S.; formal analysis, Y.M.; investigation, Y.M.; resources, Y.T., R.I., T.K., H.M., K.T., K.O. and K.N.N.; data curation, Y.M.; writing—original draft preparation, Y.M.; writing—review and editing, Y.M., K.O. and K.N.N.; visualization, Y.M.; supervision, Y.M. and K.N.N.; project administration, Y.M. and K.N.N.; funding acquisition, H.M., K.O. and K.N.N. All authors have read and agreed to the published version of the manuscript.

Funding

This study was mainly funded by ER3GCF102 and ER4GCF102 (led by Kenlo Nasahara) of the 3rd and 4th Research Announcement on Earth Observation (EORA3: 2022–2024; EORA4: 2025–2027) of the Japan Aerospace Exploration Agency (JAXA). PEN system and data in this research has been partly supported by KAKENHI (21H05312, 21H05316 and 25H00940: Hiroyuki Muraoka; 19H03077 and 19H03085: Keisuke Ono), the Environment Research and Technology Development Fund (JPMEERF20252M02) of the Environmental Restoration and Conservation Agency provided by Ministry of the Environment of Japan led by Hiroyuki Muraoka, Japan Science and Technology Agency (JST) PRESTO#JPMJPR17O4 led by Keisuke Ono, JAXA (EORA2 ER2GCF103 and GCOM RA6 PI#116: Kenlo Nasahara).

Institutional Review Board Statement

Not applicable.

Data Availability Statement

The PEN data are available via http://www.pheno-eye.org/ (accessed on 7 March 2025).

Acknowledgments

We want to express our gratitude to Koji Suzuki of Gifu University (TKY) for their cooperation in obtaining PEN data. We would like to thank four anonymous reviewers for providing valuable suggestions and comments.

Conflicts of Interest

The authors declare no conflicts of interest.

References

  1. Menzel, A.; Sparks, T.H.; Estrella, N.; Koch, E.; Aasa, A.; Ahas, R.; Alm-Kübler, K.; Bissolli, P.; Braslavská, O.; Briede, A. European phenological response to climate change matches the warming pattern. Glob. Change Biol. 2006, 12, 1969–1976. [Google Scholar] [CrossRef]
  2. Piao, S.; Fang, J.; Zhou, L.; Ciais, P.; Zhu, B. Variations in satellite-derived phenology in China’s temperate vegetation. Glob. Change Biol. 2006, 12, 672–685. [Google Scholar] [CrossRef]
  3. Yang, L.H.; Rudolf, E.V. Phenology, ontogeny and the effects of climate change on the timing of species interactions. Ecol. Lett. 2010, 13, 1–10. [Google Scholar] [CrossRef]
  4. Jeong, S.J.; Ho, C.H.; GIM, H.J.; Brown, M.E. Phenology shifts at start vs. end of growing season in temperate vegetation over the Northern Hemisphere for the period 1982–2008. Glob. Change Biol. 2011, 17, 2385–2399. [Google Scholar] [CrossRef]
  5. Gill, A.L.; Gallinat, A.S.; Sanders-DeMott, R.; Rigden, A.J.; Short Gianotti, D.J.; Mantooth, J.A.; Templer, P.H. Changes in autumn senescence in northern hemisphere deciduous trees: A meta-analysis of autumn phenology studies. Ann. Bot. 2015, 116, 875–888. [Google Scholar] [CrossRef]
  6. Thackeray, S.J.; Henrys, P.A.; Hemming, D.; Bell, J.R.; Botham, M.S.; Burthe, S.; Helaouet, P.; Johns, D.G.; Jones, I.D.; Leech, D.I. Phenological sensitivity to climate across taxa and trophic levels. Nature 2016, 535, 241–245. [Google Scholar] [CrossRef]
  7. AR6 Synthesis Report: Climate Change 2023. Available online: https://www.ipcc.ch/report/sixth-assessment-report-cycle/ (accessed on 7 March 2025).
  8. G20 Climate Risk Atlas: Japan. Available online: https://files.cmcc.it/g20climaterisks/Japan.pdf (accessed on 7 March 2025).
  9. Climate Change in Japan 2025—Report on Assessment of Observed/Projected Climate Change Relating to the Atmosphere, Land and Oceans. Available online: https://www.data.jma.go.jp/cpdinfo/ccj/index.html (accessed on 27 March 2025).
  10. Cleland, E.E.; Chuine, I.; Menzel, A.; Mooney, H.A.; Schwartz, M.D. Shifting plant phenology in response to global change. Trends Ecol. Evol. 2007, 22, 357–365. [Google Scholar] [CrossRef] [PubMed]
  11. Peñuelas, J.; Rutishauser, T.; Filella, I. Phenology feedbacks on climate change. Science 2009, 324, 887–888. [Google Scholar] [CrossRef]
  12. Chuine, I. Why does phenology drive species distribution? Philos. Trans. R. Soc. Biol. Sci. 2010, 365, 3149–3160. [Google Scholar] [CrossRef] [PubMed]
  13. Ito, K.; Sano, J. Effect of the snow-free timing and temperature rise on the flushing phenology of seedlings. Jpn. J. Ecol. 2012, 62, 111–120. [Google Scholar]
  14. Mizuno, Y.; Tachikawa, H.; Sasagawa, T.; Kobayashi, T.; Nasahara, K.N. Impact of high temperature in 2023 and 2024 on spring leaf flush phenology in Japan derived by GCOM-C satellite. Sci. Rep. 2025, 15, 12920. [Google Scholar] [CrossRef]
  15. Kudo, G.; Ida, T.Y. Early onset of spring increases the phenological mismatch between plants and pollinators. Ecology 2013, 94, 2311–2320. [Google Scholar] [CrossRef] [PubMed]
  16. Takano, K.T.; Nakao, K.; Ozeki, M.; Hotta, M.; Hamada, T.; Suka, T.; Ohashi, H.; Hirata, A.; Ishigooka, Y.; Matsui, T. Velocity of climate change (VoCC) analyses toward local adaptation to climate change. Pap. Environ. Inf. Sci. 2019, 33, 49–54. [Google Scholar]
  17. Matsui, T.; Tanaka, N.; Yagihashi, T. Predicting changes in suitable habitats for beech (Fagus crenata Blume) forests under climate warming in Shirakami mountains world natural heritage area, northern Japan. J. Jpn. For. Soc. 2007, 89, 7–13. [Google Scholar] [CrossRef]
  18. Expanding the Economic Impact of Tourism. Available online: https://www.mlit.go.jp/common/001294468.pdf (accessed on 12 March 2025).
  19. Tucker, C.J. Red and photographic infrared linear combinations for monitoring vegetation. Remote Sens. Environ. 1979, 8, 127–150. [Google Scholar] [CrossRef]
  20. Holben, B.N.; Tucker, C.J.; Fan, C.J. Spectral assessment of soybean leaf area and leaf biomass. Photogramm. Eng. Remote Sens. 1980, 46, 651–656. [Google Scholar]
  21. Qiao, K.; Zhu, W.; Xie, Z.; Li, P. Estimating the seasonal dynamics of the leaf area index using piecewise LAI-VI relationships based on phenophases. Remote Sens. 2019, 11, 689. [Google Scholar] [CrossRef]
  22. Tan, C.W.; Zhang, P.P.; Zhou, X.X.; Wang, Z.X.; Xu, Z.Q.; Mao, W.; Li, W.X.; Huo, Z.Y.; Guo, W.S.; Yun, F. Quantitative monitoring of leaf area index in wheat of different plant types by integrating NDVI and Beer-Lambert law. Sci. Rep. 2020, 10, 929. [Google Scholar] [CrossRef] [PubMed]
  23. Huete, A.; Didan, K.; Miura, T.; Rodriguez, E.P.; Gao, X.; Ferreira, L.G. Overview of the radiometric and biophysical performance of the MODIS vegetation indices. Remote Sens. Environ. 2002, 83, 195–213. [Google Scholar] [CrossRef]
  24. Shabanov, N.V.; Zhou, L.; Knyazikhin, Y.; Myneni, R.B.; Tucker, C.J. Analysis of interannual changes in northern vegetation activity observed in AVHRR data from 1981 to 1994. IEEE Trans. Geosci. Remote Sens. 2002, 40, 115–130. [Google Scholar] [CrossRef]
  25. Delbart, N.; Kergoat, L.; Le Toan, T.; Lhermitte, J.; Picard, G. Determination of phenological dates in boreal regions using normalized difference water index. Remote Sens. Environ. 2005, 97, 26–38. [Google Scholar] [CrossRef]
  26. Nagai, S.; Nasahara, K.N.; Muraoka, H.; Akiyama, T.; Tsuchida, S. Field experiments to test the use of the normalized-difference vegetation index for phenology detection. Agric. For. Meteorol. 2010, 150, 152–160. [Google Scholar] [CrossRef]
  27. Cao, R.; Feng, Y.; Liu, X.; Shen, M.; Zhou, J. Uncertainty of vegetation green-up date estimated from vegetation indices due to snowmelt at northern middle and high latitudes. Remote Sens. 2020, 12, 190. [Google Scholar] [CrossRef]
  28. Delbart, N.; Le Toan, T.; Kergoat, L.; Fedotova, V. Remote sensing of spring phenology in boreal regions: A free of snow-effect method using NOAA-AVHRR and SPOT-VGT data (1982–2004). Remote Sens. Environ. 2006, 101, 52–62. [Google Scholar] [CrossRef]
  29. Dunn, A.H.; de Beurs, K.M. Land surface phenology of North American mountain environments using moderate resolution imaging spectroradiometer data. Remote Sens. Environ. 2011, 115, 1220–1233. [Google Scholar] [CrossRef]
  30. Motohka, T.; Nasahara, K.N.; Oguma, H.; Tsuchida, S. Applicability of green-red vegetation index for remote sensing of vegetation phenology. Remote Sens. 2010, 2, 2369–2387. [Google Scholar] [CrossRef]
  31. Gonsamo, A.; Chen, J.M.; Price, D.T.; Kurz, W.A.; Wu, C. Land surface phenology from optical satellite measurement and CO2 eddy covariance technique. J. Geophys. Res. Biogeosci. 2012, 117, G03032. [Google Scholar] [CrossRef]
  32. Wang, C.; Chen, J.; Wu, J.; Tang, Y.; Shi, P.; Black, T.A.; Zhu, K. A snow-free vegetation index for improved monitoring of vegetation spring green-up date in deciduous ecosystems. Remote Sens. Environ. 2017, 196, 1–12. [Google Scholar] [CrossRef]
  33. Yang, W.; Kobayashi, H.; Wang, C.; Shen, M.; Chen, J.; Matsushita, B.; Tang, Y.; Kim, Y.; Bret-Harte, M.S.; Zona, D.; et al. A semi-analytical snow-free vegetation index for improving estimation of plant phenology in tundra and grassland ecosystems. Remote Sens. Environ. 2019, 228, 31–44. [Google Scholar] [CrossRef]
  34. Nagai, S.; Inoue, T.; Suzuki, R. Leaf-coloring information published on web sites and its utility in the ground-truthing of satellite remote-sensing data for mapping autumn leaf phenology. Jpn. J. Biometeorol. 2015, 52, 119–129. [Google Scholar]
  35. Zhao, B.; Donnelly, A.; Schwartz, M.D. Evaluating autumn phenology derived from field observations, satellite data, and carbon flux measurements in a northern mixed forest, USA. Int. J. Biometeorol. 2020, 64, 713–727. [Google Scholar] [CrossRef]
  36. Takagi, K.; Takami, K.; Murai, R. Mapping Tender Green and Autumn Color using Earth Observation Satellite GCOM-C1. Bull. Kochi Univ. Technol. 2020, 18, 57–63. [Google Scholar]
  37. Xing, J.; Zhang, Y.C.; Gao, J.C. Research on Improved Infrared and Visible Image Fusion Algorithm Based on HSV Color Space. Mech. Electron. 2022, 40, 15–19. [Google Scholar]
  38. Meyer, G.E.; Neto, J.C. Verification of color vegetation indices for automated crop imaging applications. Comput. Electron. Agric. 2008, 63, 282–293. [Google Scholar] [CrossRef]
  39. Yang, W.; Wang, S.; Zhao, X.; Zhang, J.; Feng, J. Greenness identification based on HSV decision tree. Inf. Process. Agric. 2015, 2, 149–160. [Google Scholar] [CrossRef]
  40. Hassanein, M.; Lari, Z.; El-Sheimy, N. A new vegetation segmentation approach for cropped fields based on threshold detection from hue histograms. Sensors 2018, 18, 1253. [Google Scholar] [CrossRef] [PubMed]
  41. Beniaich, A.; Silva, M.L.N.; Avalos, F.A.P.; de Menezes, M.D.; Cândido, B.M. Determination of vegetation cover index under different soil management systems of cover plants by using an unmanned aerial vehicle with an onboard digital photographic camera. Semin. Ciências Agrárias 2019, 40, 49–66. [Google Scholar] [CrossRef]
  42. Fan, Y.; Chen, Y.; Chen, X.; Zhang, H.; Liu, C.; Duan, Q. Estimating the aquatic-plant area on a pond surface using a hue-saturation-component combination and an improved Otsu method. Comput. Electron. Agric. 2021, 188, 106372. [Google Scholar] [CrossRef]
  43. Guan, P.; Zheng, Y.; Lei, G. Analysis of canopy phenology in man-made forests using near-earth remote sensing. Plant Methods 2021, 17, 104. [Google Scholar] [CrossRef]
  44. Ribeiro, A.L.A.; Maciel, G.M.; Siquieroli, A.C.S.; Luz, J.M.Q.; Gallis, R.B.D.A.; Assis, P.H.D.S.; Catão, H.C.R.M.; Yada, R.Y. Vegetation indices for predicting the growth and harvest rate of lettuce. Agriculture 2023, 13, 1091. [Google Scholar] [CrossRef]
  45. Song, Z.; Lu, Y.; Ding, Z.; Sun, D.; Jia, Y.; Sun, W. A new remote sensing desert vegetation detection index. Remote Sens. 2023, 15, 5742. [Google Scholar] [CrossRef]
  46. Biró, L.; Kozma-Bognár, V.; Berke, J. Comparison of RGB indices used for vegetation studies based on structured similarity index (SSIM). J. Plant Sci. Phytopathol. 2024, 8, 007–012. [Google Scholar] [CrossRef]
  47. Tsuchida, S.; Nishida, K.; Iwao, K.; Kawato, W.; Oguma, H.; Iwasaki, A. Phenological Eyes Network for Validation of Remote Sensing Data. J. Remote Sens. Soc. Jpn. 2005, 25, 282–288. [Google Scholar]
  48. Nasahara, K.N.; Nagai, S. Development of an in situ observation network for terrestrial ecological remote sensing: The Phenological Eyes Network (PEN). Ecol. Res. 2015, 30, 211–223. [Google Scholar] [CrossRef]
  49. Nagai, S.; Akitsu, T.; Saitoh, T.M.; Busey, R.C.; Fukuzawa, K.; Honda, Y.; Ichie, T.; Ide, R.; Ikawa, H.; Iwasaki, A.; et al. 8 million phenological and sky images from 29 ecosystems from the Arctic to the tropics: The Phenological Eyes Network. Ecol. Res. 2018, 33, 1091–1092. [Google Scholar] [CrossRef]
  50. Phenological Eyes Network (PEN). Available online: http://www.pheno-eye.org/ (accessed on 7 March 2025).
  51. AsiaFlux. Available online: https://www.asiaflux.net/ (accessed on 7 March 2025).
  52. Japan Long Term Ecological Research Network (JaLTER). Available online: http://www.jalter.org/ (accessed on 7 March 2025).
  53. Beck, H.E.; Zimmermann, N.E.; McVicar, T.R.; Vergopolan, N.; Berg, A.; Wood, E.F. Present and future Köppen-Geiger climate classification maps at 1-km resolution. Sci. Data 2018, 5, 180214. [Google Scholar] [CrossRef]
  54. Sasagawa, T.; Akitsu, T.K.; Ide, R.; Takagi, K.; Takanashi, S.; Nakaji, T.; Nasahara, K.N. Accuracy assessment of photochemical reflectance index (PRI) and chlorophyll carotenoid index (CCI) derived from GCOM-C/SGLI with in situ Data. Remote Sens. 2021, 14, 5352. [Google Scholar] [CrossRef]
  55. Ide, R.; Hirose, Y.; Oguma, H.; Saigusa, N. Development of a masking device to exclude contaminated reflection during tower-based measurements of spectral reflectance from a vegetation canopy. Agric. For. Meteorol. 2016, 223, 141–150. [Google Scholar] [CrossRef]
  56. GCOM-C “SHIKISAI” Data Users Handbook version B. 2023. Available online: https://gportal.jaxa.jp/gpr/assets/mng_upload/GCOM-C/GCOM-C_SHIKISAI_Data_Users_Handbook_jp_B.pdf (accessed on 11 March 2025).
  57. SGLI Sensor Characterization. Available online: https://suzaku.eorc.jaxa.jp/GCOM_C/data/prelaunch/index.html (accessed on 11 March 2025).
  58. Li, M.; Yang, W.; Kondoh, A. Improving remote estimation of vegetation phenology using GCOM-C/SGLI land surface reflectance data. Remote Sens. 2022, 14, 4027. [Google Scholar] [CrossRef]
  59. Gamon, J.A.; Huemmrich, K.F.; Wong, C.Y.; Ensminger, I.; Garrity, S.; Hollinger, D.Y.; Noormets, A.; Peñuelas, J. A remotely sensed pigment index reveals photosynthetic phenology in evergreen conifers. Proc. Natl. Acad. Sci. USA 2016, 113, 13087–13092. [Google Scholar] [CrossRef]
  60. Yin, G.; Verger, A.; Descals, A.; Filella, I.; Peñuelas, J. A broadband green-red vegetation index for monitoring gross primary production phenology. J. Remote Sens. 2022, 2022, 9764982. [Google Scholar] [CrossRef]
  61. Sims, D.A.; Gamon, J.A. Relationships between leaf pigment content and spectral reflectance across a wide range of species, leaf structures and developmental stages. Remote Sens. Environ. 2002, 81, 337–354. [Google Scholar] [CrossRef]
  62. Tucker, C.J.; Pinzon, J.E.; Brown, M.E.; Slayback, D.A.; Pak, E.W.; Mahoney, R.; Vermote, E.F.; El Saleous, N. An extended AVHRR 8-km NDVI dataset compatible with MODIS and SPOT vegetation NDVI data. Int. J. Remote Sens. 2005, 26, 4485–4498. [Google Scholar] [CrossRef]
  63. Pinzon, J.E.; Tucker, C.J. A non-stationary 1981–2012 AVHRR NDVI3g time series. Remote Sens. 2014, 6, 6929–6960. [Google Scholar] [CrossRef]
  64. Simpson, J.J.; Stitt, J.R. A procedure for the detection and removal of cloud shadow from AVHRR data over land. IEEE Trans. Geosci. Remote Sens. 1998, 36, 880–897. [Google Scholar] [CrossRef]
  65. Yang, X.; Zuo, X.; Xie, W.; Li, Y.; Guo, S.; Zhang, H. A correction method of NDVI topographic shadow effect for rugged terrain. IEEE J. Sel. Top. Appl. Earth Obs. Remote Sens. 2022, 15, 8456–8472. [Google Scholar] [CrossRef]
  66. Ma, Y.; He, T.; McVicar, T.R.; Liang, S.; Liu, T.; Peng, W.; Song, D.; Tian, F. Quantifying how topography impacts vegetation indices at various spatial and temporal scales. Remote Sens. Environ. 2024, 312, 114311. [Google Scholar] [CrossRef]
  67. Lorenzi, L.; Melgani, F.; Mercier, G. A complete processing chain for shadow detection and reconstruction in VHR images. IEEE Trans. Geosci. Remote Sens. 2012, 50, 3440–3452. [Google Scholar] [CrossRef]
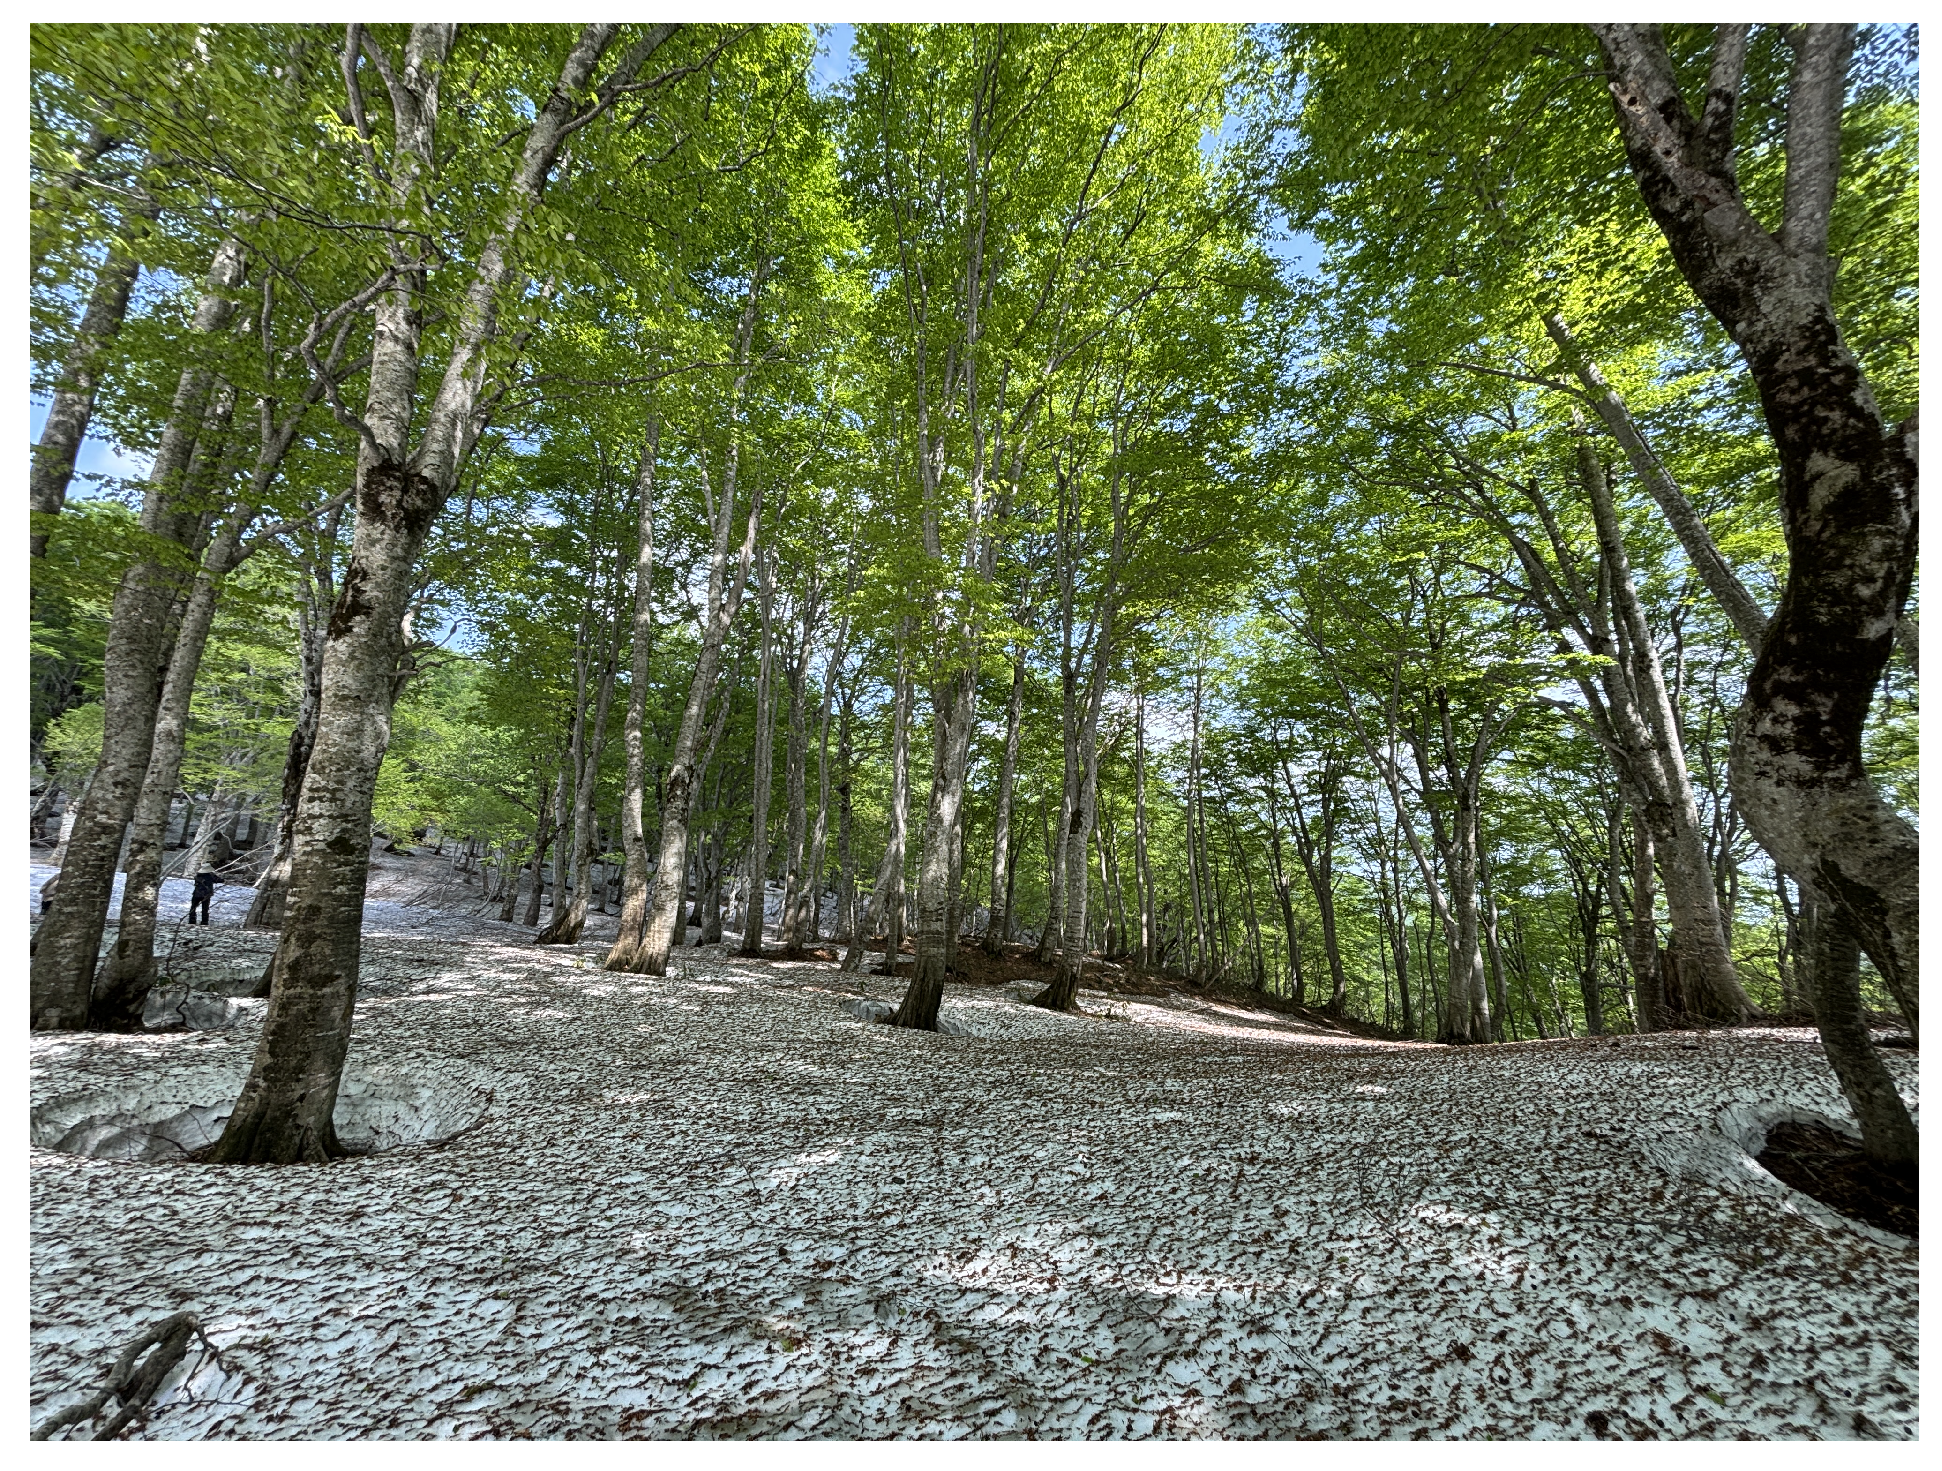
Figure 1. A beech (Fagus crenata) forest in late May (21 May 2025), located at the foot of Mt. Gassan in Yamagata Prefecture, Japan (38°30′37.16″N, 140°00′06.48″E). The white area at the bottom of the image represents accumulated snow, and the brown fragments on the snow are mainly bud scales from beech trees, shed during spring leaf flush. In this forest, snowmelt and spring leaf flush occur simultaneously—a phenomenon commonly observed in beech forests on the Sea of Japan side, where heavy snowfall is typical during winter.
Remotesensing 17 02767 g001
Figure 2. The schematic of the HSV (HSB) model. Hue (H) represents the color itself, saturation (S) represents the intensity or purity of the color, and value (V) indicates the brightness of the color.
Remotesensing 17 02767 g002
Figure 3. Location of Phenological Eyes Network (PEN) sites used in this study (TSE: Teshio CC-LaG experiment site; TGF: Grass Field of Center for Research in Isotopes and Earth Environmental Dynamics (CRiED) in the University of Tsukuba; MSE: Mase Flux Site; TKY: Takayama Flux Observation Site; FHK: Fuji Hokuroku Flux Observation Site).
Remotesensing 17 02767 g003
Figure 4. Overview of the five Phenological Eyes Network (PEN) sites we used.
Remotesensing 17 02767 g004
Figure 5. Examples of the PEN Hemispherical Spectral Radiometer (HSSR) and its rotation system.
Remotesensing 17 02767 g005
Figure 6. Examples of ADFC (Automatic Digital Fisheye Camera) images (camera ID: y_18d, TKY). The bottom numbers represent “year”–“day of year” (DOY).
Remotesensing 17 02767 g006
Figure 7. The relative spectral response (RSR) of GCOM-C/SGLI-VNR’s spectral channels shown in Table 2 [57]. The black, gray, blue, yellow-green, green, and orange dotted lines are reflectance measured at TKY in 2019 by HSSR (hemi-spherical spectroradiometer: MS-700) on DOY 40 (covered by snow), DOY 108 (snowmelt), DOY 118 (understory), DOY 142 (young leaf canopy), DOY 168 (flourishing leaf canopy) and DOY 310 (autumn leaf canopy).
Remotesensing 17 02767 g007
Figure 8. Annual cycle of in situ spectral indices and ADFC images from the Teshio (TSE; Sparse Deciduous Needle-leaved Forest: Sparse DNF). The images show the typical change. The date of each ADFC image is the bottom number as the “day of year (DOY)”. The graphs show time-series Hue (VN05), Hue (VN06), NDVI, EVI, CCI, and NDGI observed by the HSSRs. The gray bands are snow cover periods, the green bands are leaf flush periods (no data in 2019 because ADFC stopped in this period), and the orange bands are autumn coloration periods based on visual interpretation from ADFC images. At TSE, HSSRs were removed in winter in order to prevent damage from snow. Scattering spectral indices during DOY 320–334 (2018) and DOY 312–315 (2019) might be caused by some troubles, such as a water drop on the sensor dome of HSSR.
Remotesensing 17 02767 g008
Figure 9. Annual cycle of in situ spectral indices and ADFC images from Grass Field of CRiED in the University of Tsukuba (TGF; Grassland). The images show the typical change. The date of each ADFC image is the bottom number as the “day of year (DOY)”. The graphs show time series Hue (VN05), Hue (VN06), NDVI, EVI, CCI, and NDGI observed by the HSSR. The gray bands are snow cover periods, the green bands are leaf flush periods (including after mowing), and the orange bands are autumn coloration periods based on visual interpretation from ADFC images.
Remotesensing 17 02767 g009
Figure 10. Annual cycle of in situ spectral indices and ADFC images from the Mase (MSE; Rice Paddy). The images show the typical change. The date of each ADFC image is the bottom number as the “day of year (DOY)”. The graphs show time series Hue (VN05), Hue (VN06), NDVI, EVI, CCI, and NDGI observed by the HSSR. The gray bands are snow seasons, the blue bands are flooded periods before planting rice, the green bands are leaf flush periods (including ratoon, rice growth after harvesting), the orange bands are autumn coloration periods, and the pink bands are harvesting season based on visual interpretation from ADFC images.
Remotesensing 17 02767 g010
Figure 11. Annual cycle of in situ spectral indices and ADFC images from the Takayama (TKY) deciduous broad-leaved forest (DBF). The images show the typical change. The date of each ADFC image is the bottom number as the “day of year (DOY)”. The graphs show time-series Hue (VN05), Hue (VN06), NDVI, EVI, CCI, and NDGI observed by the HSSR. The gray bands are snow cover periods, the green bands are leaf flush periods, and the orange bands are autumn coloration periods based on visual interpretation from ADFC images.
Remotesensing 17 02767 g011
Figure 12. Annual cycle of in situ spectral indices and ADFC images from the Fuji Hokuroku (FHK) deciduous needle-leaved forest (DNF). The images show the typical change. The date of each ADFC image is the bottom number as the “day of year (DOY)”. The graphs show time series Hue (VN05), Hue (VN06), NDVI, EVI, CCI, and NDGI observed by the HSSRs. The gray bands are snow cover periods, the green bands are leaf flush periods, and the orange bands are autumn coloration periods based on visual interpretation from ADFC images. At FHK, HSSRs were removed in winter in order to prevent malfunction due to heavy snow.
Remotesensing 17 02767 g012
Figure 13. The ranges of spectral indices (a): Hue (VN05), (b): Hue (VN06), (c): NDVI, (d): EVI, (e): CCI, (f): NDGI) for each period and site. These periods are classified based on visual interpretation from ADFC images (Table 3).
Remotesensing 17 02767 g013
Figure 14. Scatter plots of Hue (VN05: 529.7 nm) versus Hue (VN06: 566.1 nm) across all observation sites ( n = 3890 ). r is the correlation coefficient and R 2 is the coefficient of determination.
Remotesensing 17 02767 g014
Figure 15. Scatter plots comparing simulated hue values of GCOM-C/SGLI (Hue VN05 and VN06) with those of other satellite sensors: Sentinel-2/MSI, Landsat-8/OLI, and Terra/MODIS. The top row shows comparisons with Hue (VN05), and the bottom row with Hue (VN06). For Terra/MODIS, two green bands were used (Band 4 and Band 11) to calculate hue separately. Each panel includes the regression line (dashed), the identity line (solid), and the regression equation with the correlation coefficient (r) and coefficient of determination ( R 2 ).
Remotesensing 17 02767 g015
Figure 16. Scatter plots showing the relationship between CCI (Chlorophyll Carotenoid Index) and Hue ((a): VN05, (b): VN06) derived from GCOM-C/SGLI for all observations (left) and for each condition based on visual interpretation (Table 3). CCI was derived from VN05 and VN08 bands of GCOM-C/SGLI.
Remotesensing 17 02767 g016
Figure 17. ADFC images when Hue (VN05) exceeded the threshold at each year ((a): TSE, (b): TGF, (c): MSE, (d): TKY, (e): FHK). The left half is the spring leaf flush periods, showing the date (bottom number as “day of year (DOY)”) when each threshold is first exceeded and continues to increase, along with the image for that day. The other half is the autumn coloration periods, showing the date (DOY) when each threshold is first below and continues to decrease, along with the image for that day.
Remotesensing 17 02767 g017
Table 1. Specifications of five PEN sites we used.
Site IDSite
Name
Forest
Type
Latitude,
Longitude
(WGS84),
Altitude
Köppen-
Geiger
Climate
Classification [53]
Dominant Species
TSETeshioMixed,
DNF
45°03′21″N,
142°06′26″E,
70 m
DfbHybrid larch
(Larix kaempferi and
L. gmelinii),
Sasa senanensis,
and S. kurilensis
TGFGrass Field of
CRiED in the
University
of Tsukuba
Grassland36°06′35″N,
140°06′00″E,
27 m
CfbMiscanthus sinensis,
Imperata cylindrica,
Solidago altissima,
and Pueraria lobata
subsp. lobata
MSEMaseRice
Paddy
36°03′14″N,
140°01′37″E,
13 m
CfbOryza sativa L.
(cultivar: Koshihikari)
TKYTakayamaDBF36°8′43″N,
137°25′25″E,
1420 m
DfbQuercus crispula,
Betula ermanii,
and Sasa senanensis
FHKFuji
Hokuroku
DNF35°26′37″N,
138°45′53″E,
1100 m
CfbLarix kaempferi,
Pinus densiflora,
Cornus controversa,
and Quercus crispula
Table 2. Specification of the spectral channels of GCOM-C/SGLI-VNR (excluding polarization channels) [56].
ChannelCenter Wavelength [nm]Band Width [nm]Spatial Resolution [m]
VN01379.910.6250
VN02412.310.3250
VN03443.310.1250
VN04490.010.3250
VN05529.719.1250
VN06566.119.8250
VN07672.322.0250
VN08672.421.9250
VN09763.111.4250
VN10867.120.9250
VN11867.420.8250
Disclaimer/Publisher’s Note: The statements, opinions and data contained in all publications are solely those of the individual author(s) and contributor(s) and not of MDPI and/or the editor(s). MDPI and/or the editor(s) disclaim responsibility for any injury to people or property resulting from any ideas, methods, instructions or products referred to in the content.