1. Introduction
The Global Precipitation Measurement (GPM) mission is a flagship international collaborative initiative jointly led by the National Aeronautics and Space Administration (NASA) and the Japan Aerospace Exploration Agency (JAXA) [
1]. It is designed to provide global precipitation observations with improved temporal and spatial resolution, aiming to enhance understanding of the global water and energy cycle and to support applications such as weather forecasting, hydrological modeling, and climate monitoring [
2]. As the successor to the Tropical Rainfall Measurement Mission (TRMM), the GPM Core Observatory was successfully launched in 2014, carrying the Dual-frequency Precipitation Radar (DPR) as its primary instrument [
3]. DPR enables detailed monitoring of the three-dimensional structure of precipitation within the 65°S–65°N latitudinal belt [
4]. Utilizing both Ku-band (13.6 GHz) and Ka-band (35.5 GHz) frequencies, DPR facilitates high-resolution retrievals of precipitation characteristics, including drop size distribution (DSD) and instantaneous rainfall rate, particularly over regions with sparse or no ground-based observations [
5,
6].
Over the past decade, extensive validation studies have been conducted to evaluate the accuracy and limitations of GPM-DPR precipitation products under diverse geographic and climatic conditions. For example, during the winters of 2015–2017, the Olympic Mountains Experiment integrated S-band dual-polarization radar, ground-based microwave radiometers, and a dense network of 50 rain gauges to assess GPM-DPR performance over complex terrain in Washington State, USA [
7]. The results indicated a missed detection rate of up to 42% on windward slopes, largely due to significant Ka-band signal attenuation associated with small liquid particles (Dm < 0.8 mm) [
8]. Under intense orographic precipitation (>10 mm·h
−1), GPM-DPR tended to underestimate precipitation intensity by 25–35%, though this error could be reduced to within ±15% through dual-polarization differential reflectivity (Z
DR)-based bias correction [
9]. Additionally, the classification accuracy for solid precipitation was found to be only 61% in mountainous areas, compared to 78% over flat terrain [
10].
In southeastern Austria, Lasser et al. employed a high-density rain gauge network (n = 153) to validate DPR performance under varying precipitation intensities during warm seasons (2014–2018). The findings showed a spatial correlation coefficient of 0.81 under convective rainfall conditions [
11]. However, DPR consistently underestimated light rain (<2 mm·h
−1) by 19% ± 7%, while the error for moderate precipitation (2–10 mm·h
−1) remained within ±12%. For heavy rainfall events (>10 mm·h
−1), DPR exhibited a maximum overestimation of 28%, likely due to the presence of mixed-phase hydrometeors [
12].
Speirs et al. [
13] performed a three-dimensional comparative analysis between the GPM-DPR V07 product and C-band dual-polarization radar over complex terrain in Switzerland. The results demonstrated a strong dependence of radar detection efficiency and reflectivity bias on terrain slope: for slopes <5°, detection efficiency was 91% with a reflectivity bias of +0.8 dBZ; for slopes between 5° and 15°, efficiency declined to 76% with a −2.3 dBZ bias; and for slopes >15°, detection efficiency dropped sharply to 53%, with a −4.1 dBZ bias.
In a study focusing on Mediterranean cyclones, D’Adderio et al. [
14] compared TRMM-PR and GPM-DPR retrievals across 20 rainstorm events from 2014 to 2016. The single-frequency Ku-band algorithm was found to overestimate path-integrated attenuation (PIA) by ~18% in stratiform precipitation. In contrast, the dual-frequency algorithm of DPR substantially reduced the root mean square error (
RMSE) of precipitation rate estimates by 31%, and the correlation coefficient between satellite-derived Dm and aircraft-based in situ observations improved from 0.42 (Ku-only) to 0.69 (dual-frequency) [
15,
16].
These studies highlight both the capabilities and limitations of GPM-DPR in accurately retrieving surface precipitation and its vertical structure, particularly under complex environmental conditions [
17]. While GPM-DPR represents a significant advancement in spaceborne precipitation measurement, systematic biases remain due to variability in topography, land surface characteristics, and precipitation microphysics [
18].
To address these challenges, recent research has increasingly turned to data fusion techniques, integrating ground-based observations with satellite remote sensing data to enhance retrieval accuracy and physical consistency [
19]. For instance, domestic studies have proposed multi-source data fusion methods combining GPM-DPR and ground measurements, which significantly improve precipitation microphysical parameter retrievals, especially in complex terrain. Ma et al. (2023) further demonstrated that fusing disdrometer and radar data through complementary multi-source approaches optimizes rainfall estimation accuracy, providing new pathways for precise microphysical characterization of precipitation [
20].
Moreover, the application of deep learning and machine learning techniques has shown promising advancements in precipitation retrievals. Deep learning methods that merge physical models with data-driven approaches have significantly enhanced quantitative precipitation estimation (QPE), particularly in capturing spatiotemporal variability and heavy rainfall events, outperforming traditional algorithms despite challenges related to computational cost and operational deployment. Machine learning algorithms incorporating polarimetric variables have also refined traditional Z-R relationships, improving extreme precipitation and high-resolution rainfall estimates. These advances bear important implications for applications such as urban flood forecasting, although model interpretability and extrapolation risks remain topics of ongoing research [
21].
Ground-based raindrop spectrometers, which provide direct measurements of microphysical parameters such as raindrop size distribution and liquid water content, serve as a valuable reference for validating and correcting satellite radar estimates [
22]. Comparative analyses between satellite-borne and surface-based instruments allow for a better understanding of discrepancies in radar reflectivity (
Z) and precipitation rate (
R) retrievals across various precipitation regimes and terrain types [
23].
In this study, we quantitatively assess the accuracy of GPM-DPR surface precipitation rate and radar reflectivity using high-resolution ground-based disdrometer data from multiple sites across China. We develop a localized reflectivity correction model and comprehensively compare GPM-DPR data before and after correction against ground disdrometer and millimeter-wave cloud radar observations in both horizontal and vertical dimensions. These efforts aim to improve the quantitative accuracy and reliability of GPM-DPR products for precipitation research and applications.
The paper is organized as follows:
Section 2 describes the data and quality control;
Section 3 presents the evaluation and correction model development;
Section 4 discusses regional adaptive R–Z relationships and their effects;
Section 5 concludes and suggests future work.
2. Materials and Methods
2.1. Observation Instruments
To evaluate the accuracy of satellite-based precipitation retrieval products provided by the Global Precipitation Measurement (GPM) mission, this study utilized the gridded radar precipitation product across China for the year 2023, and conducted a systematic comparison with in situ measurements from over 2000 ground-based meteorological stations equipped with disdrometers. The ground-based observational data were collected using the DSG5 Precipitation Weather Sensor (PWS), which operates based on the laser obscuration principle. The PWS detects voltage disturbances caused by precipitation particles intersecting a laser beam, enabling the estimation of particle size and terminal fall velocity.
The PWS features high temporal resolution and provides two-dimensional measurements of particle size and fall speed. It outputs key microphysical parameters such as the raindrop size distribution (DSD), liquid water content, and precipitation intensity [
24,
25]. Specifically, both particle diameter and fall velocity are discretized into 32 bins (diameter range: 0.0625–24.5 mm; fall speed range: 0.05–20.8 m·s
−1), enabling the generation of minute-level spectra [
26]. Based on the retrieved DSD, essential microphysical quantities including precipitation rate, radar reflectivity factor (
Z), and mass-weighted mean diameter (
Dm) can be calculated [
27]. The PWS supports a precipitation intensity detection range of 0.001–1200 mm·h
−1, with a sensitivity of 0.001 mm·h
−1, making it particularly effective for detecting light and weak precipitation events. In this study, the PWS observations are treated as ground-truth reference values and are used to evaluate the consistency and accuracy of GPM-DPR satellite products, providing a robust basis for satellite–ground integrated precipitation retrieval.
Prior to conducting the comparison between GPM products and the disdrometer measurements, the PWS data underwent rigorous quality control procedures, including cross-validation with co-located standard rain gauge observations to ensure data reliability [
28,
29]. The technical specifications of the PWS and the rain gauges used in this study are summarized in
Table 1.
The GPM-DPR data products used in this study are categorized into Level-I, Level-II, and Level-III according to processing level, and include three main scanning modes; Normal Scan (NS), Matched Scan (MS), and High-Sensitivity Scan (HS), each optimized for different precipitation conditions and observation requirements [
30,
31].
Level-I data refer to the raw signals acquired by the satellite-borne instruments, without geophysical processing. Level-II data are generated from Level-I observations through radiometric calibration and retrieval algorithms to derive physical parameters, such as radar reflectivity and precipitation rate, while retaining the original spatial resolution. Level-III data are obtained by spatial and temporal interpolation and resampling of Level-II data to produce gridded precipitation products with fixed resolution in both space and time. These include half-hourly, daily, and monthly precipitation estimates, which are suitable for large-scale statistical analyses and climate research.
In this study, the secondary product 2A-DPR was selected, with a focus on the Normal Scan (NS) mode. The NS mode provides a wide swath and is generally applicable to most mid-latitude precipitation events, making it suitable for satellite–ground comparative analysis.
2.2. Quality Control of Raindrop Spectrometer Measured Data
To improve the statistical reliability of the raindrop size distribution (DSD), multiple quality control procedures were applied to the raw disdrometer observations. Specifically, raindrops with diameters exceeding 6 mm were excluded to eliminate artifacts resulting from drop fragmentation. Given the detection threshold and signal-to-noise characteristics of the DSG5 disdrometer, measurements falling within the two smallest diameter bins (diameter < 0.312 mm) were also removed due to their high uncertainty. Furthermore, observations exhibiting fall velocities deviating by more than 60% from the theoretical values predicted by the Atlas-type velocity–diameter relationship were considered spurious and discarded [
32]. These filters were designed to suppress the influence of instrumental errors, wind-induced drift, and other non-precipitation disturbances.
For each one-minute observation interval, data were retained as valid precipitation measurements only if the following two conditions were simultaneously satisfied:
Minimum drop count threshold: the total number of valid raindrop detections per minute was no less than 10;
Precipitation intensity threshold: the derived rainfall intensity was equal to or greater than 0.1 mm·h−1.
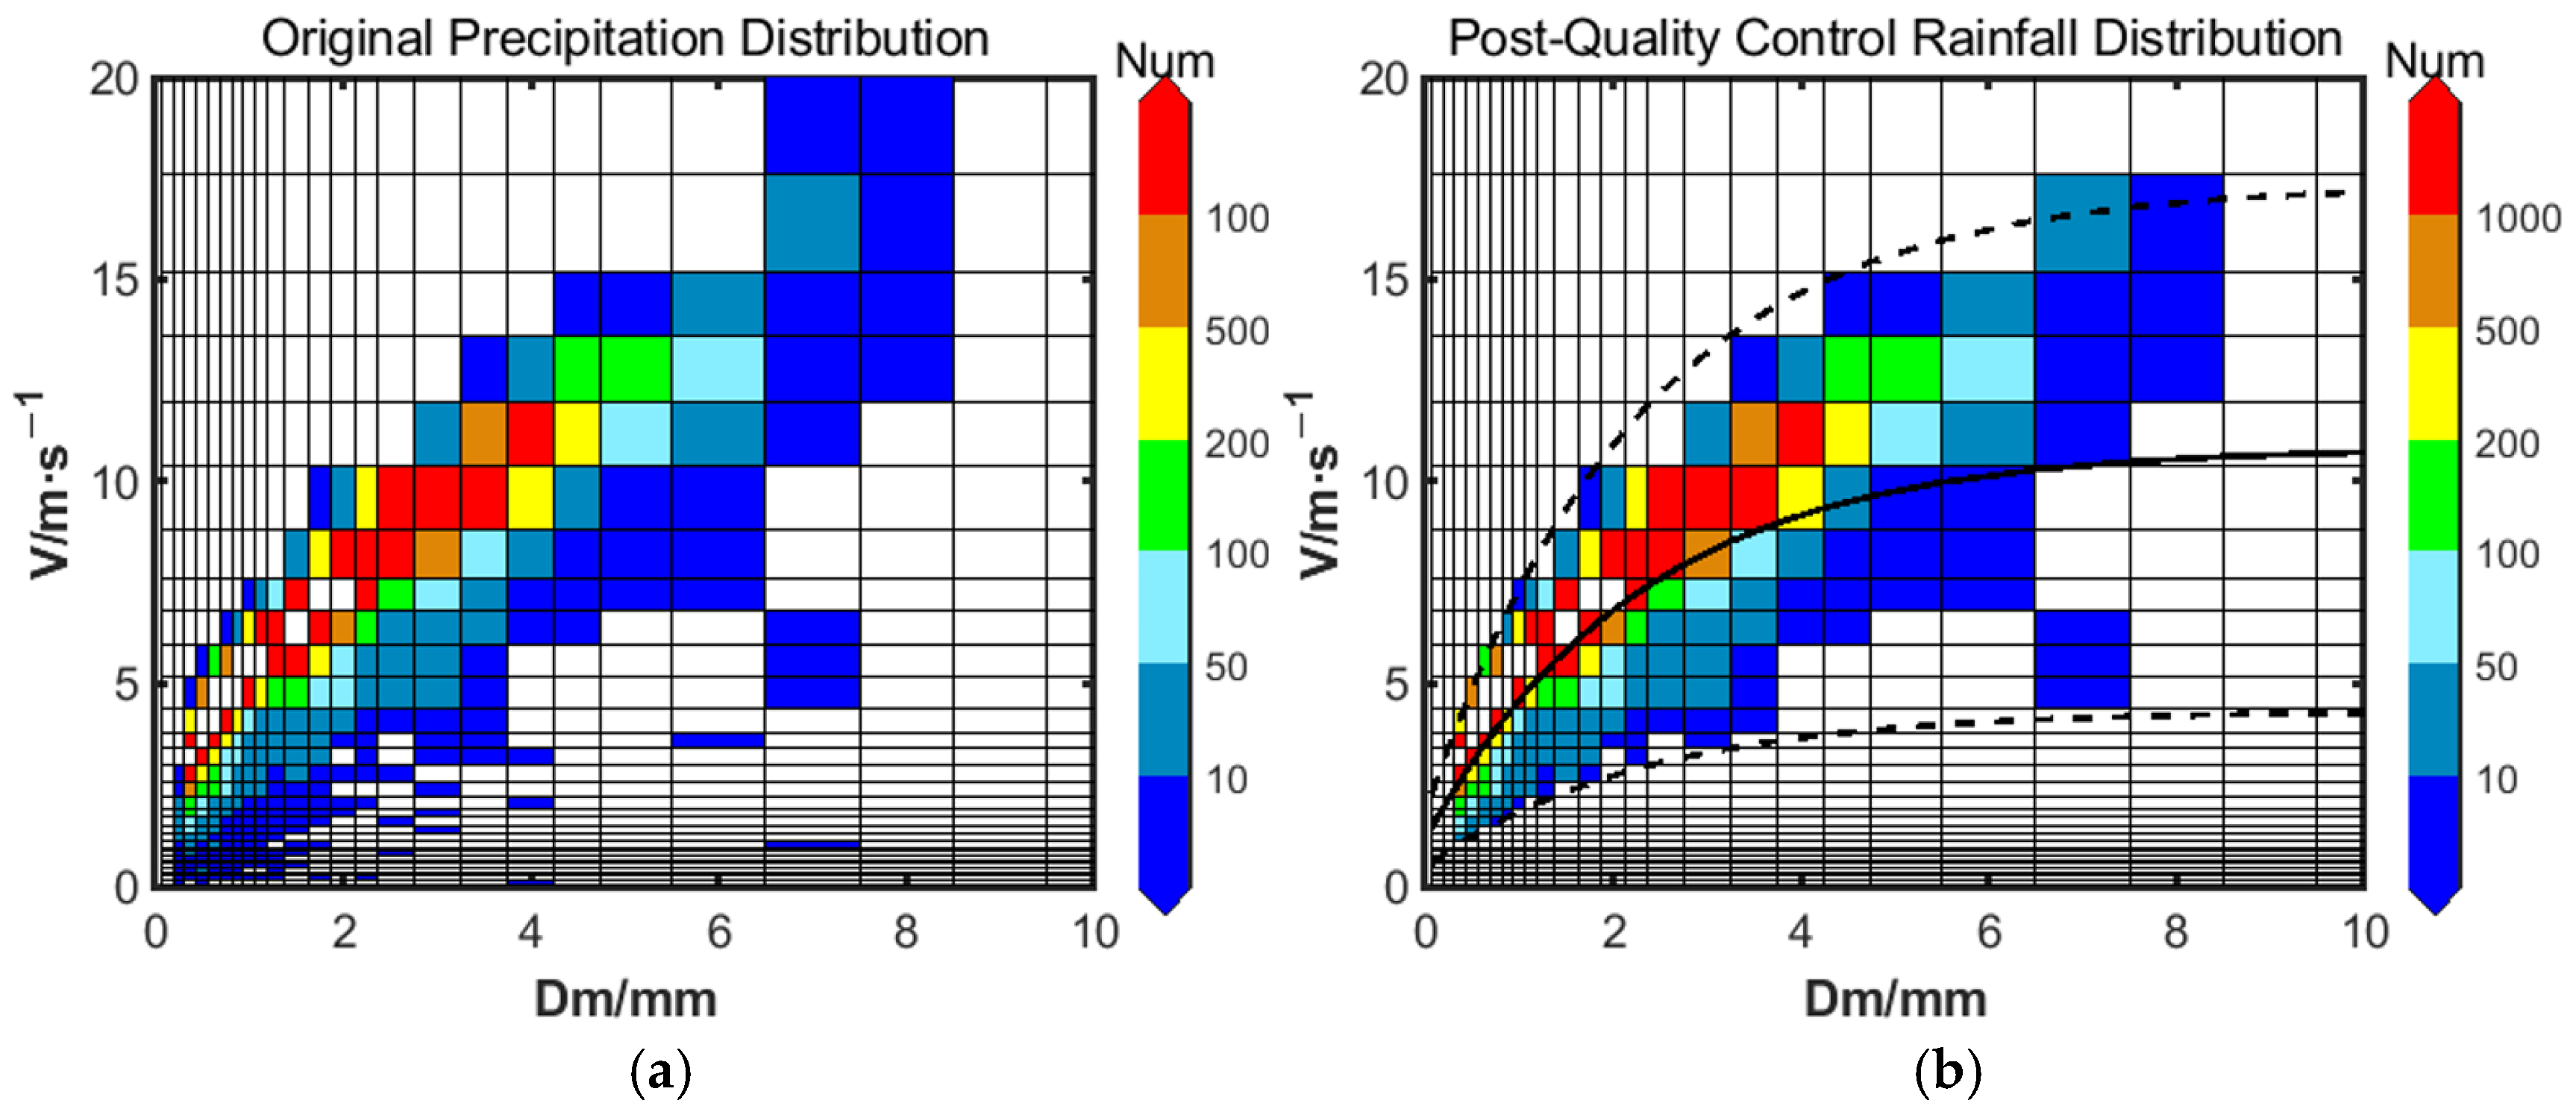
Figure 1 illustrates the DSD before and after quality control. As shown, approximately 5.79% of observations that did not meet physical or instrumental consistency requirements were successfully excluded through the quality control process, thereby enhancing the reliability of the retained dataset.
Due to the lack of high-resolution wind speed observations at the monitoring sites, horizontal wind corrections were not incorporated in the quality control process of this study. To minimize the impact of wind, we selected periods with stable precipitation and low wind speeds for analysis. Future work will integrate wind data to further improve the quality control procedures.
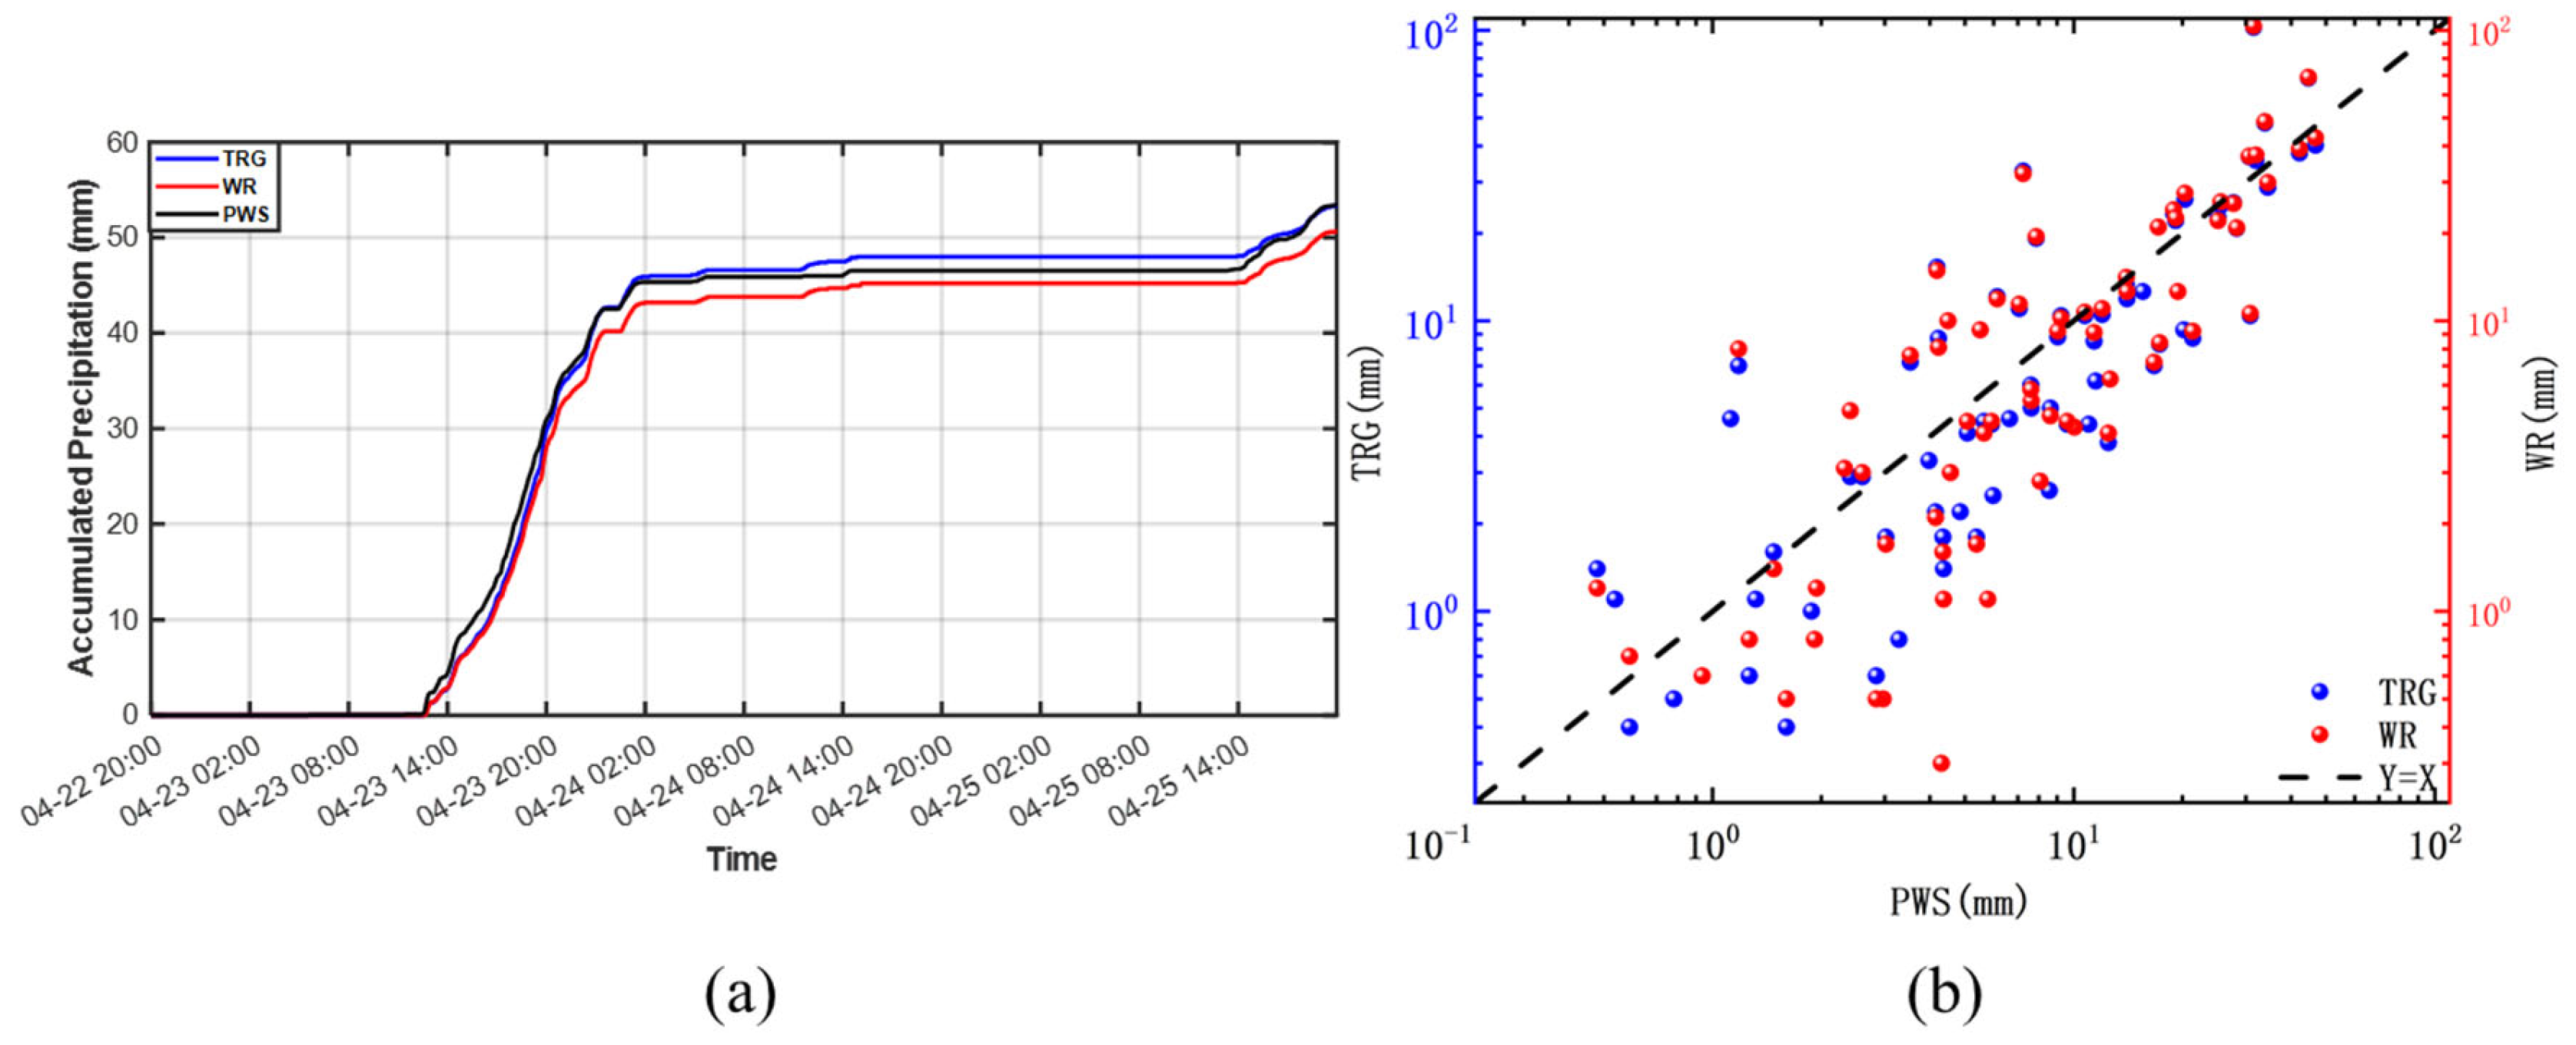
Based on the quality-controlled raindrop spectrometer data, the number of particles per unit volume is calculated using standard formulas to derive the raindrop size distribution. To assess the accuracy of the spectrometer-derived results after quality control and the reliability of its precipitation measurements, this study compares the calculated values with observations from a ground-based rain gauge. Taking the precipitation event at Jinghe Station on 23 April 2022 as an example (
Figure 1),
Figure 2a shows the temporal evolution of cumulative minute-level precipitation recorded by the PWS, WR, and TRG instruments. The three time series exhibit a consistent overall trend, indicating good agreement in measurement dynamics.
Figure 2b presents a comparison of daily cumulative precipitation, demonstrating that the PWS measurements are generally consistent with those from TRG and WR. Most data points lie close to the 1:1 reference line, indicating a high correlation among the three instruments.
2.3. Correlation and Error Analysis
In this study, five quantitative indicators are employed for comparative analysis: the Pearson correlation coefficient (
CC), mean bias (
MB), relative error (
RE), root mean square error (
RMSE), and normalized root mean square error (
NRMSE) [
33]. The mathematical definitions of these metrics are as follows:
where N denotes the total number of samples for each parameter, and the subscript i refers to the i-th sample. The symbols
and
represent the arithmetic means of the corresponding parameters from DPR and PWS, respectively. The above error metrics are used to assess the accuracy of GPM data relative to ground-based observations at different temporal and spatial resolutions, and to evaluate the discrepancies between satellite and ground measurements.
2.4. Data Matching Method
To ensure spatial and temporal consistency among multiple data sources, this study employed a rigorous spatiotemporal matching strategy. Specifically, for ground-based raindrop spectrometer sites distributed across the Chinese mainland, effective precipitation observations corresponding to GPM satellite overpasses in 2023 were first identified. A comprehensive quality control procedure was then applied to eliminate invalid or low-quality records, thereby ensuring the reliability and representativeness of the matched samples. Over the course of the study period, a total of 279 valid GPM overpass events were recorded.
With respect to spatial matching, three commonly used approaches were compared and evaluated, drawing upon the methodology proposed by Adirosi et al. [
34]. Ultimately, the grid-based nearest-neighbor method was selected for its superior performance in reducing spatial mismatches and improving the accuracy of satellite–ground comparisons [
35]. Compared with the geometric intersection method, the grid-based strategy places greater emphasis on data alignment within a fixed spatial domain, thereby avoiding uncertainties arising from volumetric mismatches, radar beam interpolation, or differences in sampling geometry between satellite and ground-based sensors.
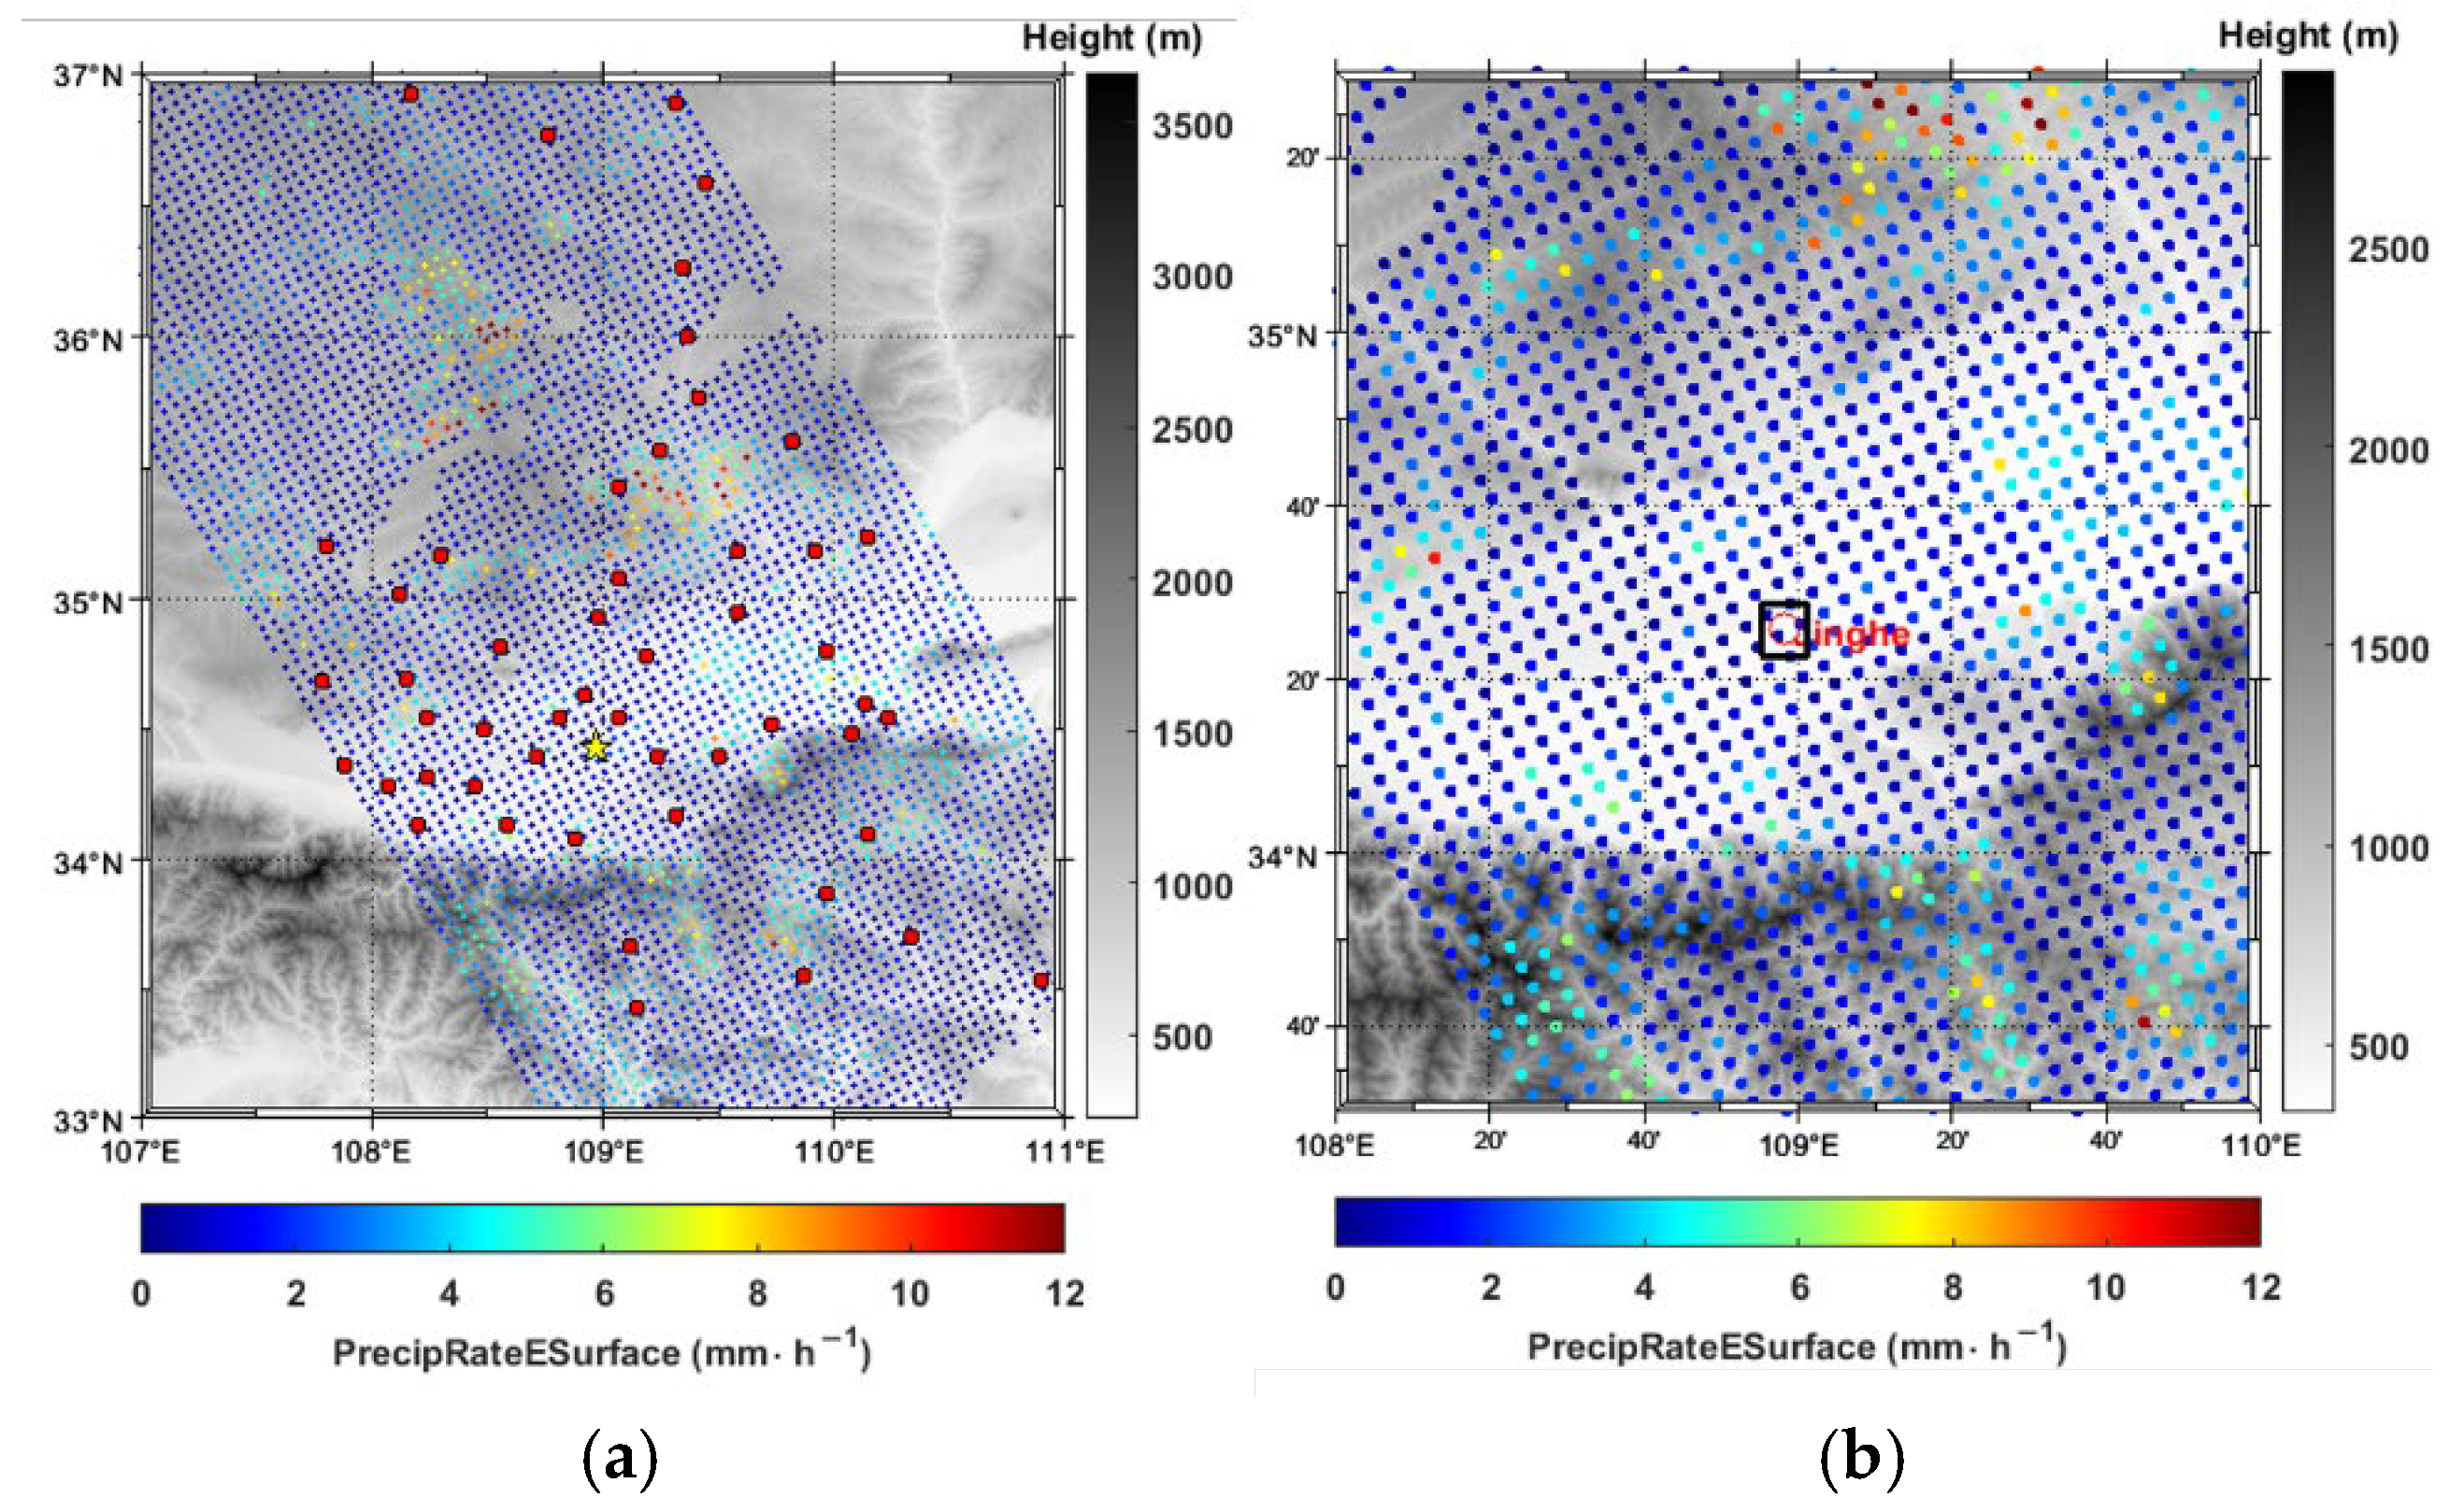
As illustrated in
Figure 3, a uniform 0.05° × 0.05° spatial grid was constructed, centered on each ground-based raindrop spectrometer location. Within each grid cell, the closest valid satellite observation was extracted to represent the matched data point, ensuring a consistent spatial reference framework for subsequent analyses.
To ensure the timeliness and representativeness of satellite–ground matched observations, this study adopted a time-synchronized comparison strategy. Specifically, the UTC timestamp of the GPM satellite overpass was designated as the reference zero time point (T = 0). Ground-based raindrop spectrometer observations within a ±10 min window surrounding this reference time were selected. From these data, two key parameters—radar reflectivity factor (Z) and precipitation rate (R)—were extracted and compared against the corresponding variables retrieved from the Normal Scan (NS) channel of the GPM 2A-DPR Level-II product.
During the 2023 observation period, precipitation data from 2430 raindrop spectrometer stations across mainland China were processed. Each station was individually matched with GPM overpass tracks under strict criteria that required temporal alignment within the defined ±10 min window and spatial correspondence within the previously defined 0.05° × 0.05° matching grid. To further ensure data quality, satellite observations with radar reflectivity values below the DPR minimum detection threshold of 12 dBZ were excluded from the analysis.
As shown in
Figure 4, a case study was conducted using three years (2021–2023) of continuous minute-level rainfall observations from the Xi’an Jinghe Station. Time-delay analysis was performed to determine the optimal moment for satellite–ground comparison. The results indicate that data corresponding to the 5th minute after the satellite overpass exhibited the highest temporal stability and representativeness. Furthermore, national-scale statistical comparisons across multiple stations confirmed the broader applicability of this delay adjustment across varying geographic and climatic regions.
Accordingly, this study adopts the 5 min post-overpass timestamp as the standardized matching time, providing a robust temporal reference framework for subsequent evaluation of GPM product retrieval accuracy and the development of reflectivity correction algorithms. All further analyses in this study are based on data matched at this representative time point, and statistical metrics introduced earlier were employed to quantitatively assess the agreement and error characteristics between satellite and ground observations.
2.5. Construction and Analysis of Z–R Relationship Model
The DPR onboard GPM typically employs an empirical power-law relationship between the radar reflectivity factor (
Z) and the precipitation rate (
R) during precipitation rate retrieval [
36]. This relationship is primarily used for initial precipitation rate estimation, path attenuation correction, and microphysical parameter inversion. Although the DPR algorithm also incorporates Bayesian inversion and dual-frequency differential techniques, the power-law relationship remains fundamental for estimating near-surface precipitation rates. The details are described as follows:
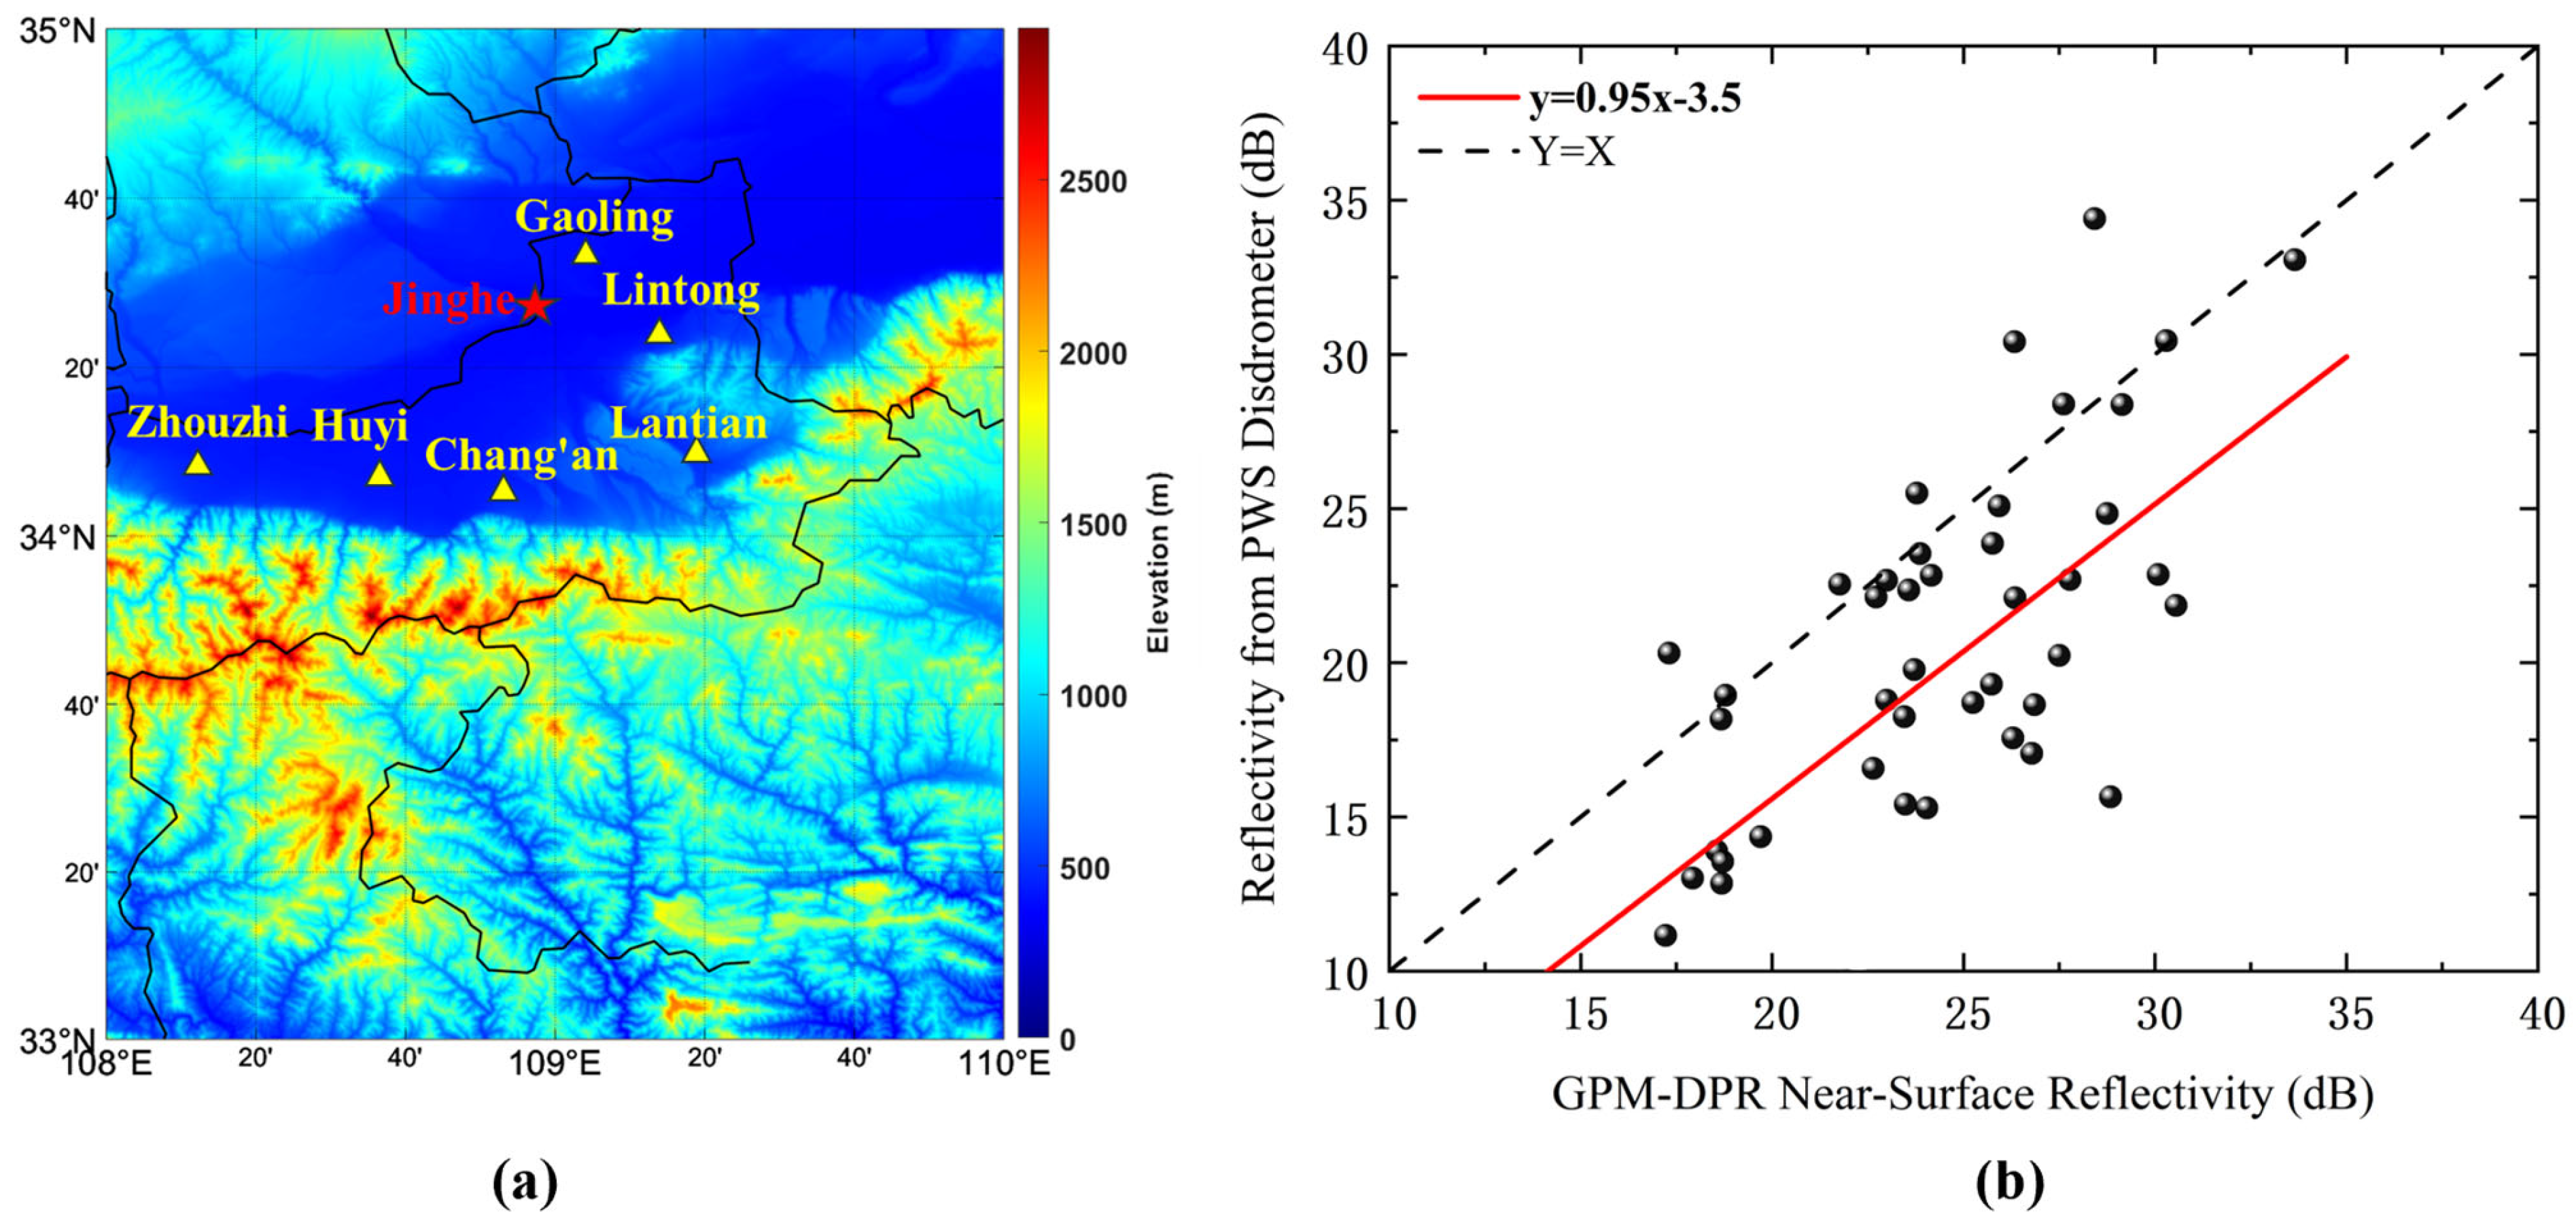
Here, Z denotes the radar reflectivity factor with units of mm6·m−3, and the coefficients a and b are empirical fitting parameters. The current DPR operational products generally adopt fixed values for these parameters (a = 200, b = 1.6). To improve the applicability and accuracy of GPM-DPR products over China, especially in plain regions with high-quality ground observations, this study selects Jinghe Station, located in the Guanzhong Plain, as a representative site. A preliminary correction model for the near-surface DPR reflectivity factor is developed based on satellite–ground synchronous observations. This work aims to identify the systematic bias between the GPM reflectivity and the raindrop spectrometer inversion values from ground measurements, and to establish a quantitative relationship between them to correct the low-level precipitation intensity estimates of GPM products.
After rigorous quality control, a logarithmic linear regression model is applied to fit the relationship between
Z and precipitation rate
R, resulting in a localized empirical relationship for Jinghe Station. The formula is transformed as follows:
where the coefficient
a′ and the exponent
b′ represent the amplitude term and the degree of nonlinearity of the model, respectively.
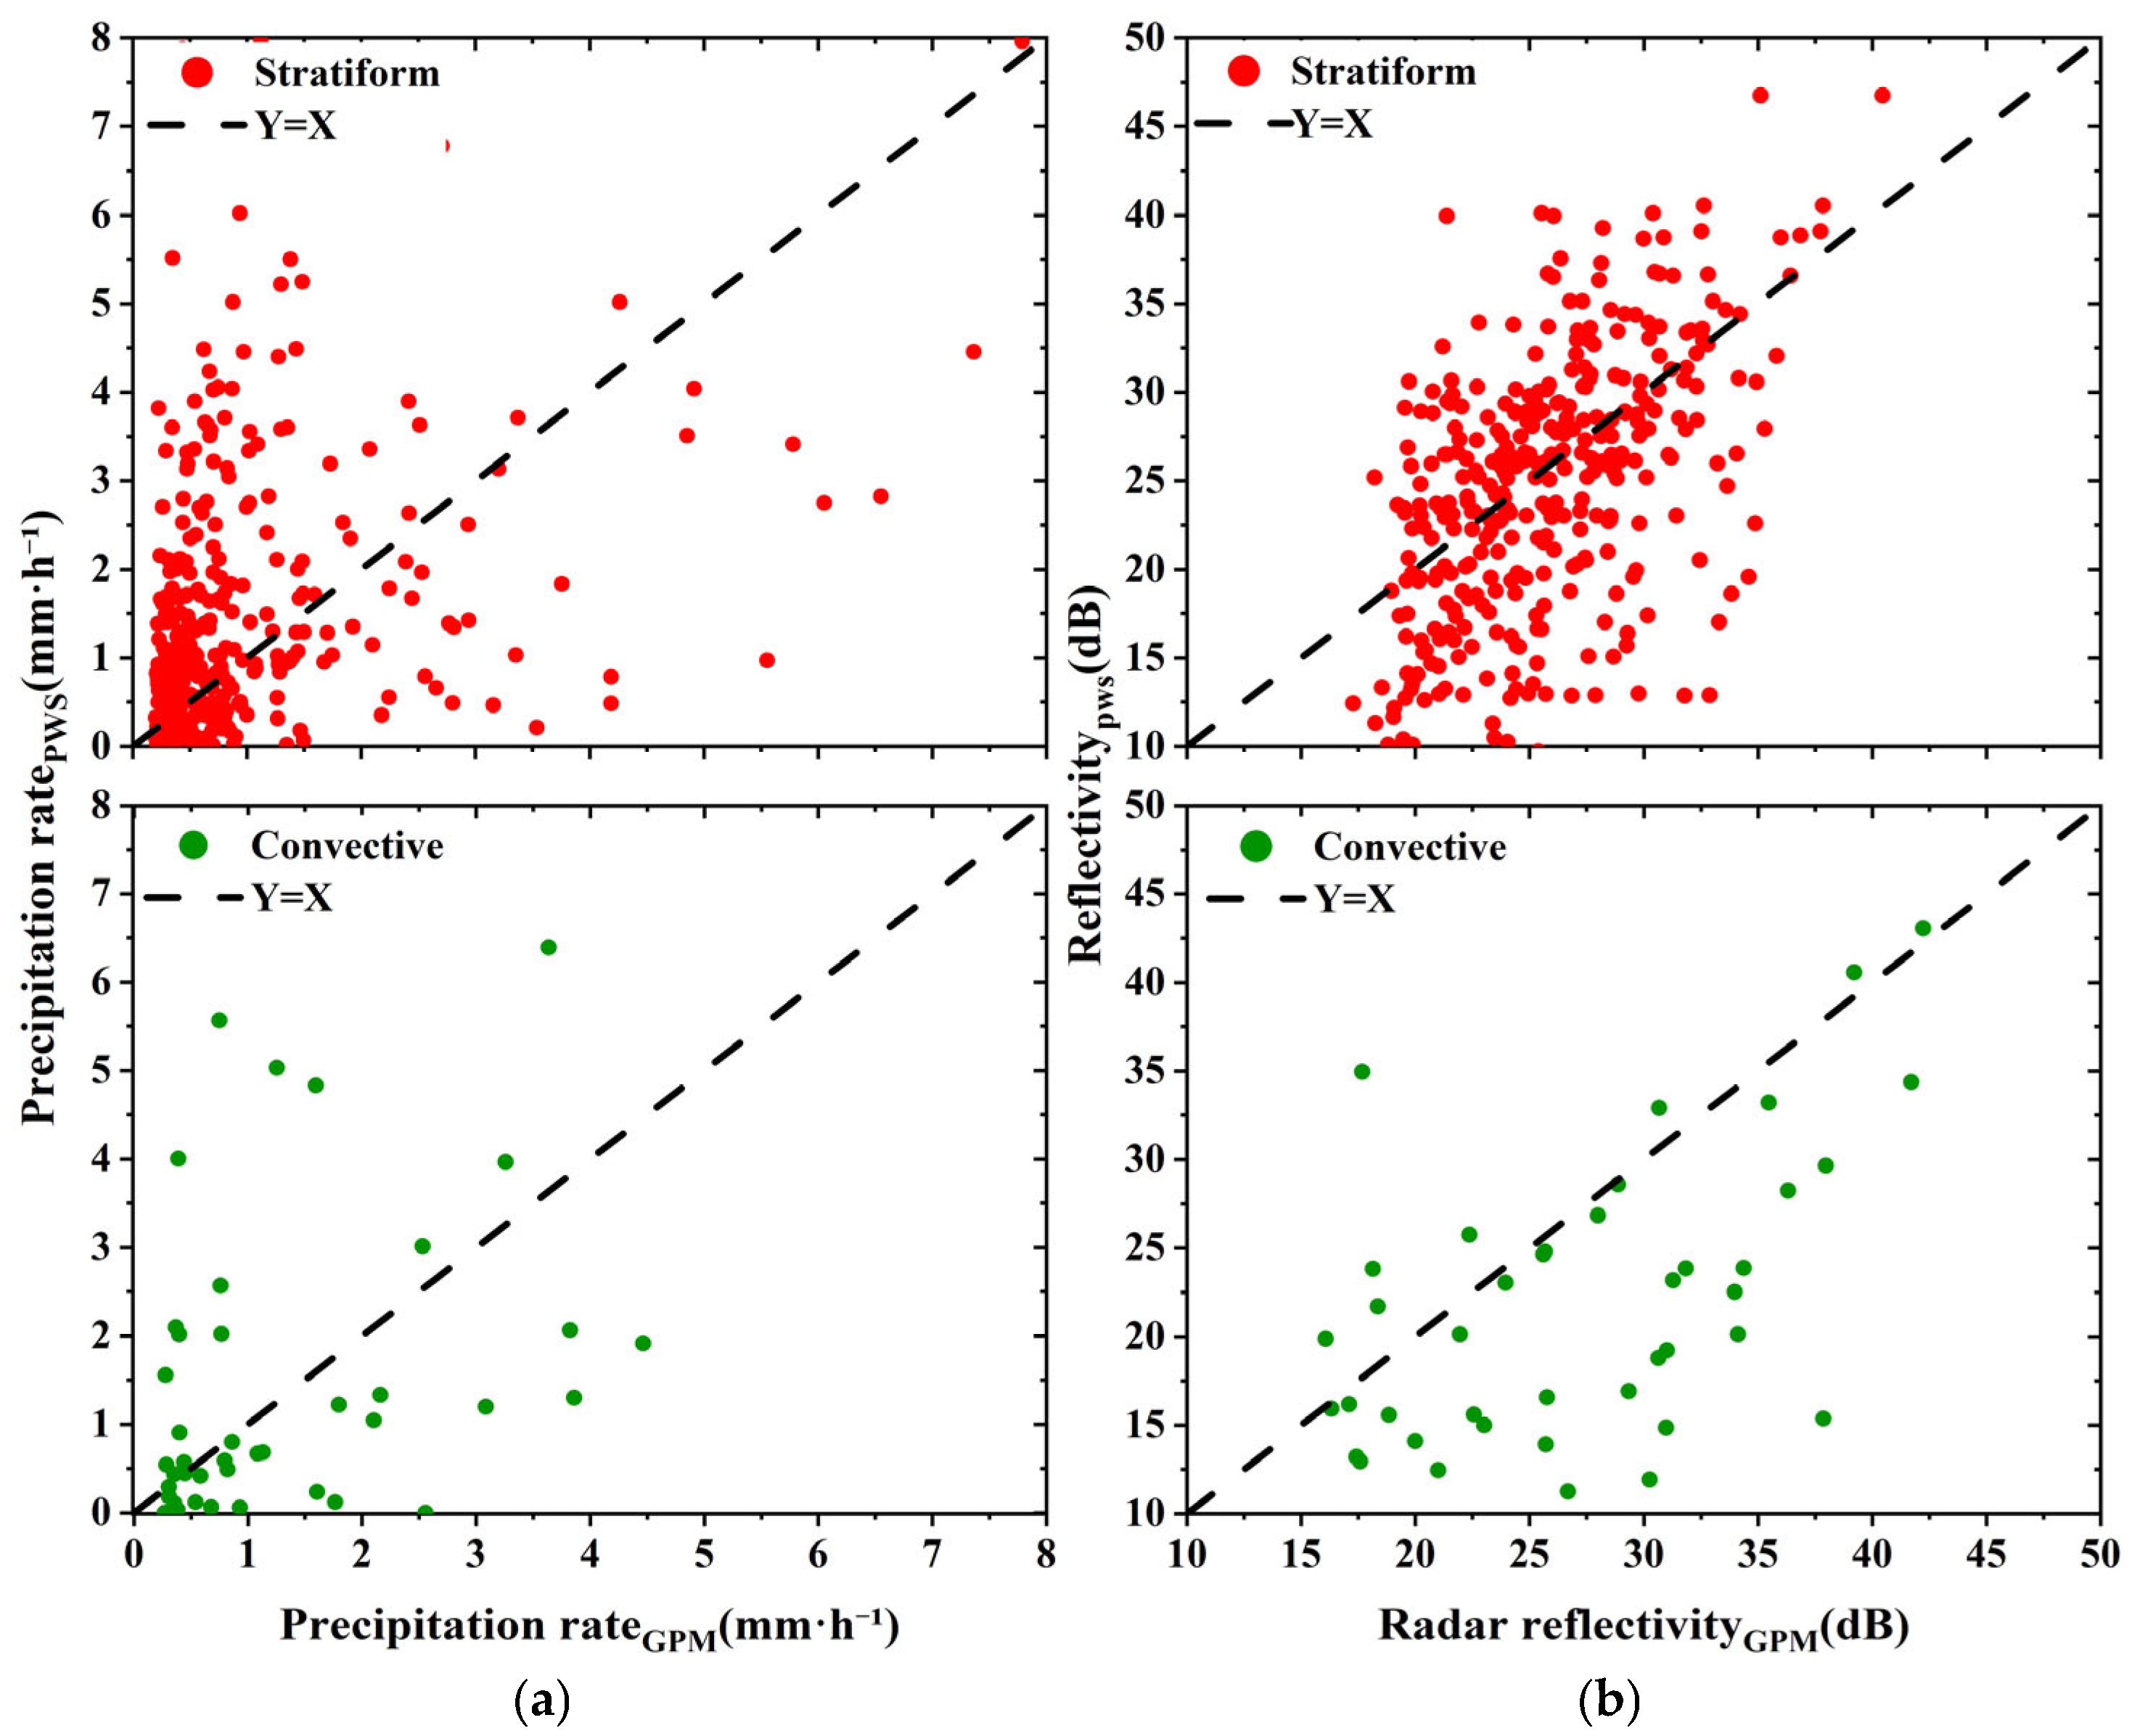
To evaluate the performance of GPM-DPR precipitation retrieval under different terrain and precipitation type conditions, the observation data are categorized based on site elevation and the precipitation type identified by the DPR product:
Terrain classification: plains (0–500 m above sea level), hills (500–1000 m), mountains (1000–2000 m), and plateaus (above 2000 m);
Precipitation type classification: stratiform precipitation and convective precipitation.
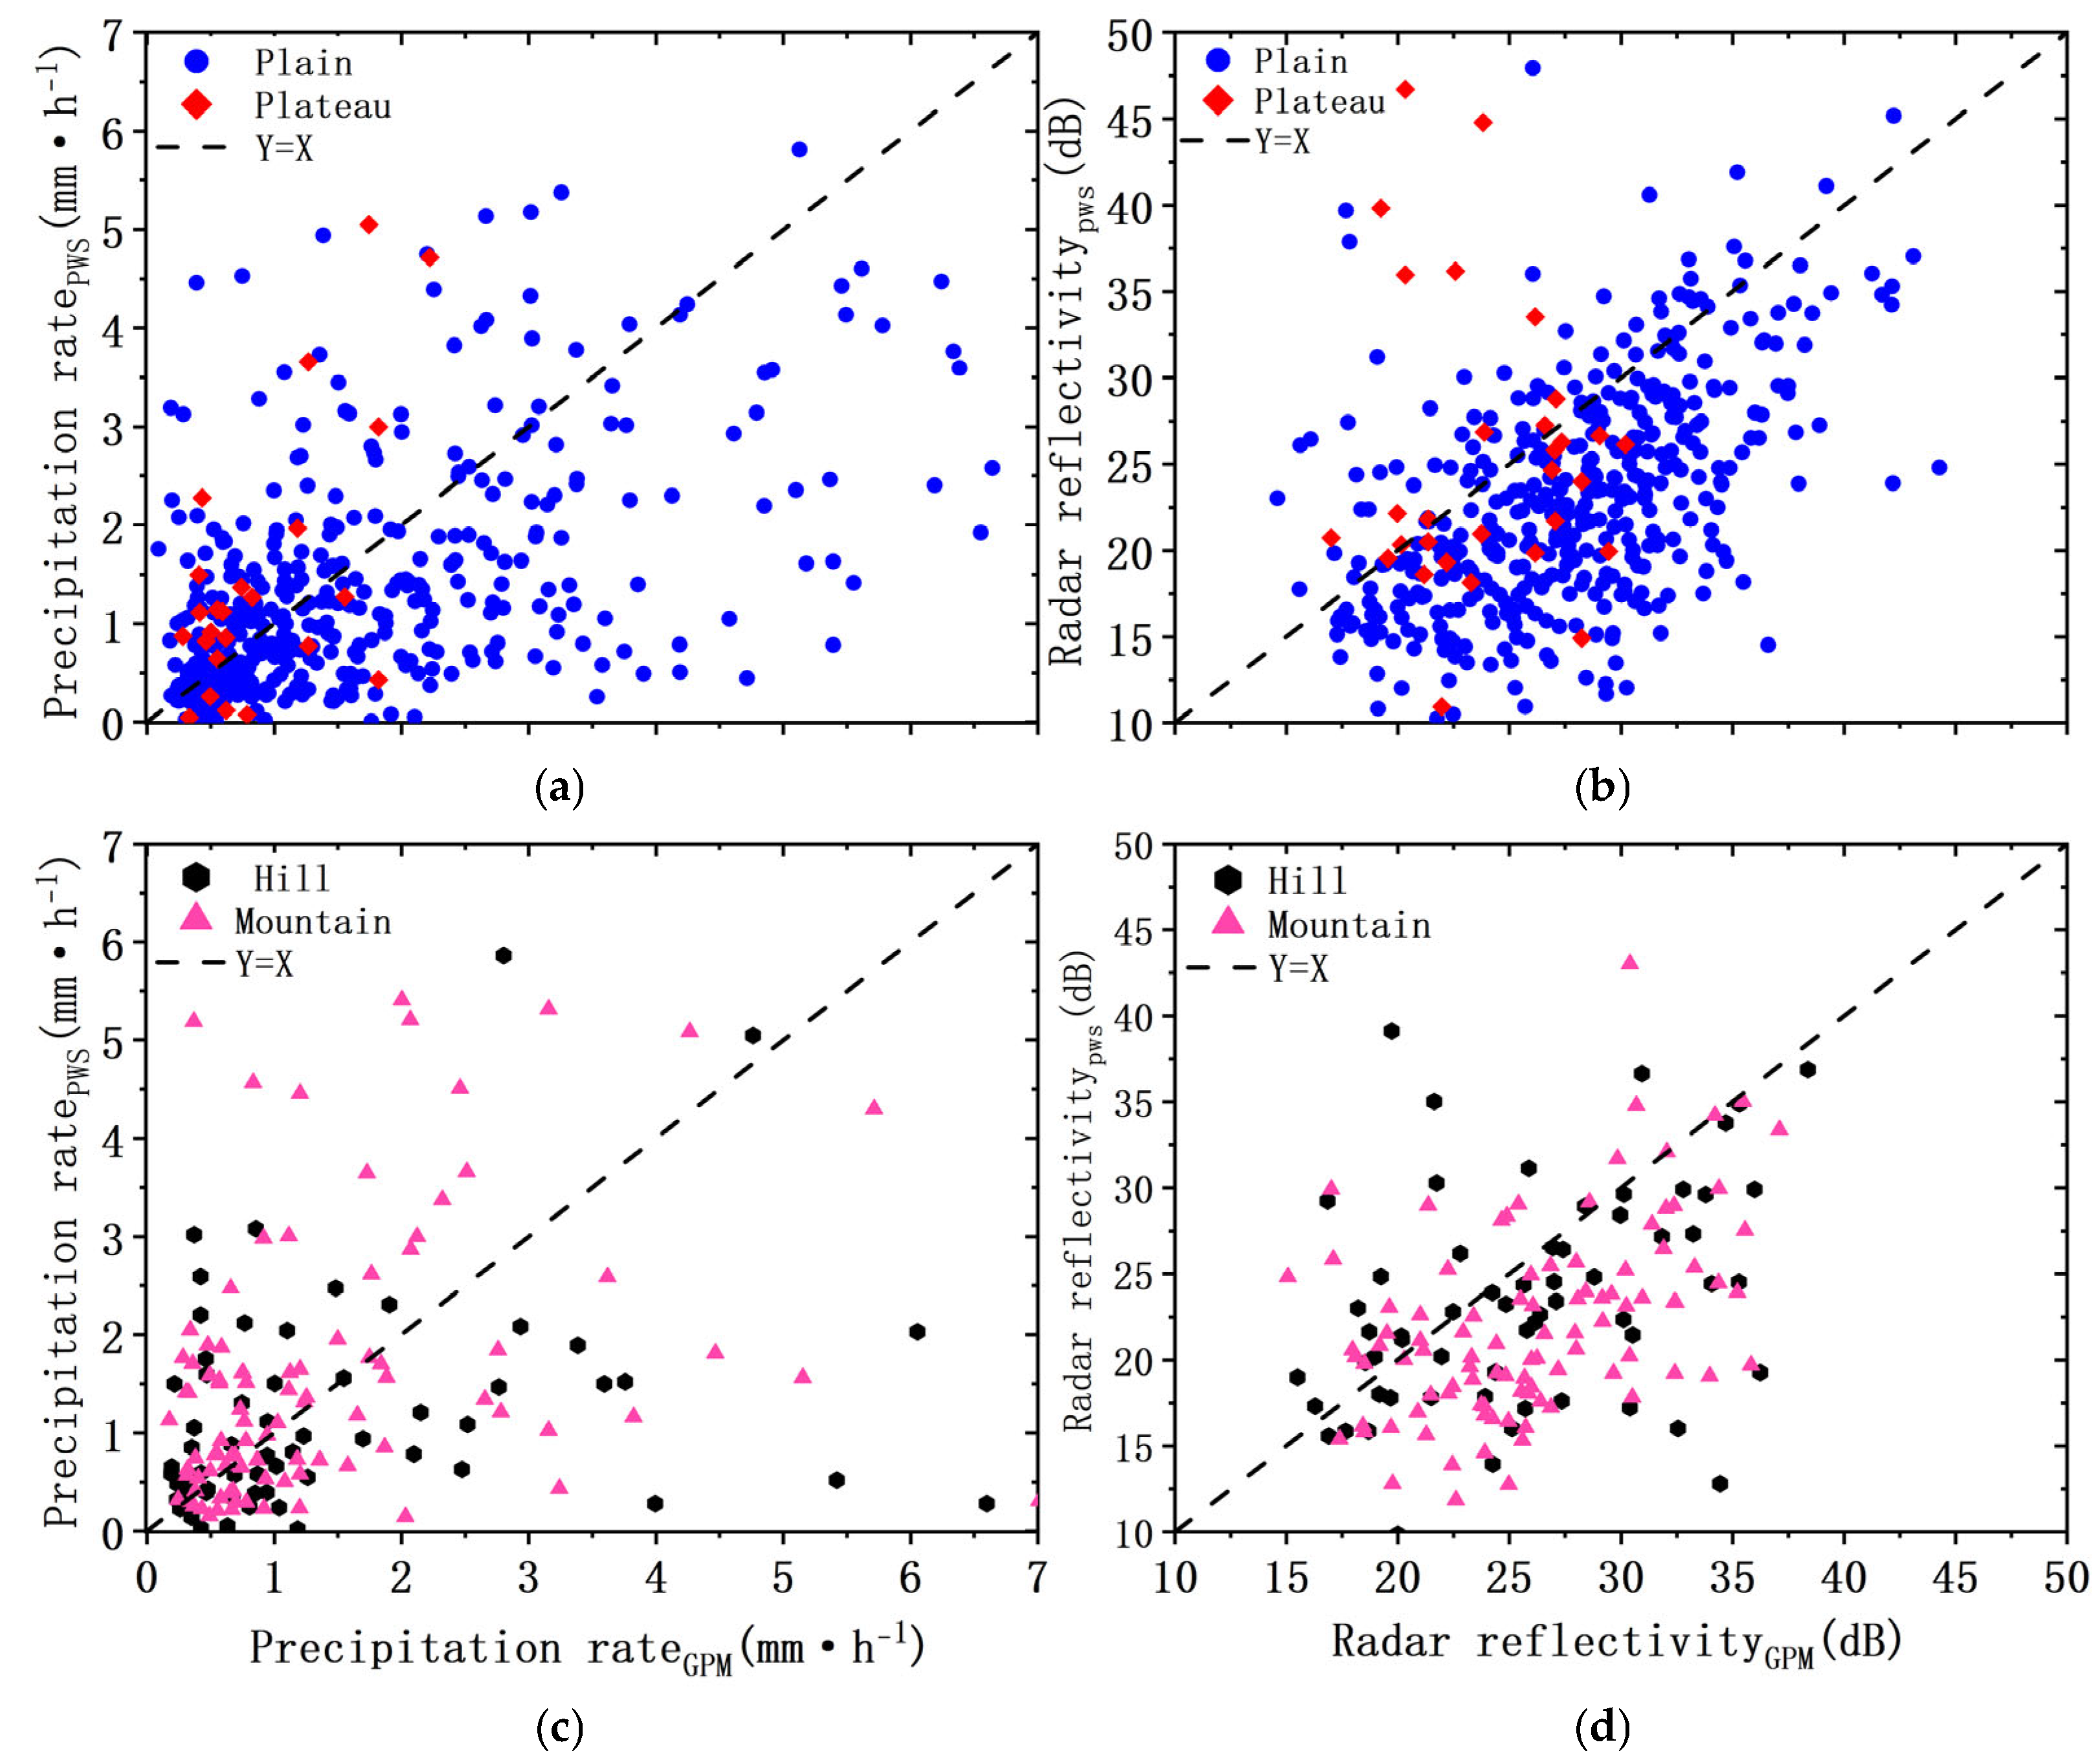
By dividing the data into these categories, the correlation between reflectivity derived from GPM-DPR (ZDPR) and that calculated from the ground-based PWS (ZPWS) is analyzed. This allows for an investigation into the accuracy and influencing factors of GPM-DPR retrievals under varying terrain and precipitation conditions.
4. Evaluation of Near-Surface Rainfall Rate After GPM Correction
4.1. Evaluation of Rainfall Rate Under the Original Empirical Model
This study applied the correction formula to GPM data from multiple stations nationwide to evaluate its applicability.
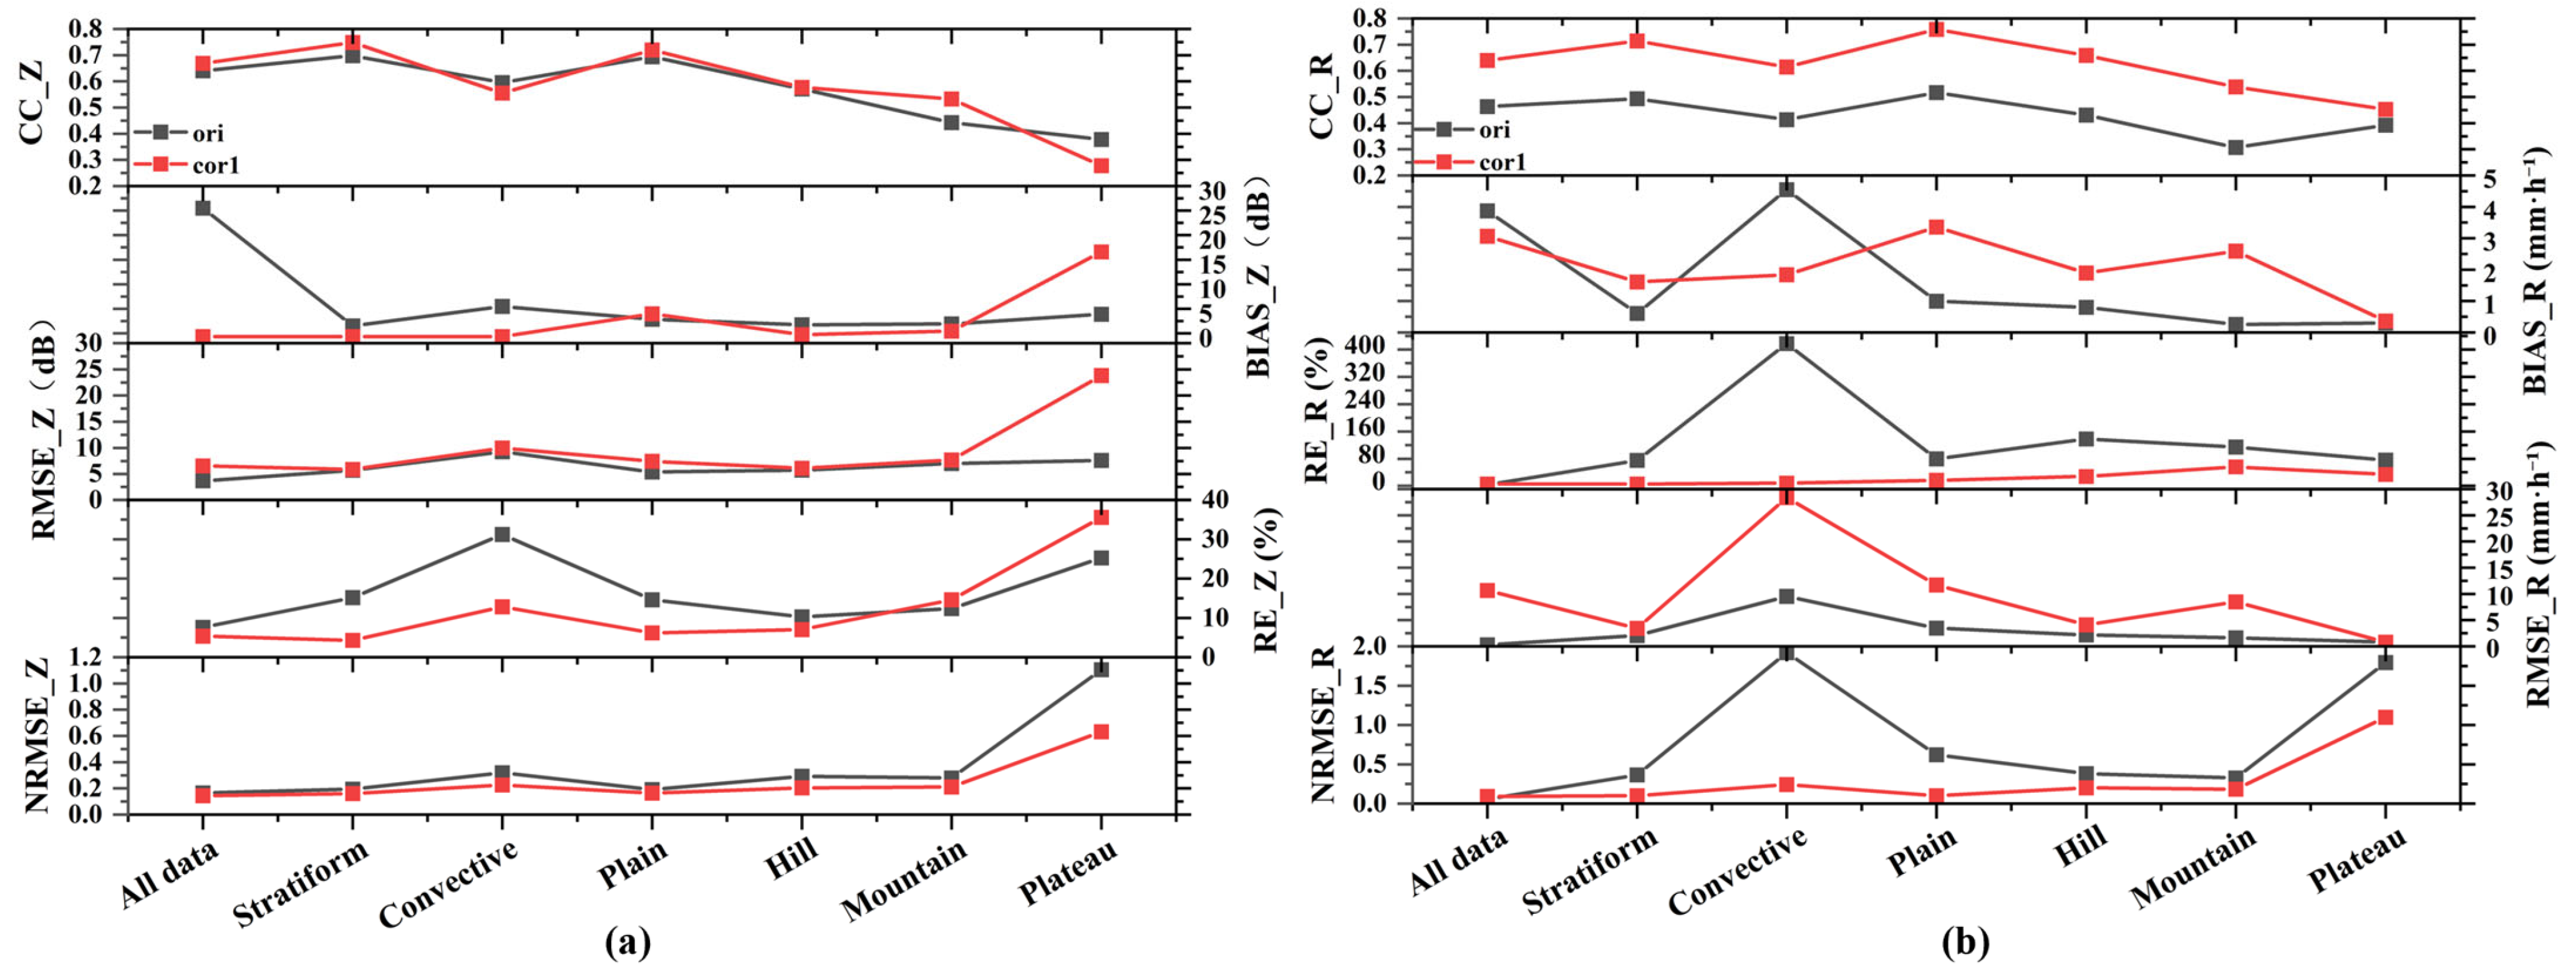
Figure 8 presents comparisons of the results before and after correction based on the original GPM Z–R relationship. After correction, the estimation accuracy of both reflectivity and rainfall rate improved significantly. The correlation coefficient of reflectivity (
CCZ) increased from 0.6408 to 0.6688, the mean bias (
BIASZ) decreased from +3.69 dBZ to −0.65 dBZ, and the root mean square error (
RMSEZ) was reduced from 3.69 to 3.54 dBZ. For rainfall rate, the correlation coefficient (
CCR) increased from 0.4632 to 0.6398, the relative error (
RER) dropped notably from 254.01% to 90.67%, and the normalized root mean square error (
NRMSER) decreased from 0.0552 to 0.0909.
The correction formula performed particularly well in stratiform cloud precipitation and plain areas. In stratiform precipitation, the reflectivity correlation increased from 0.698 to 0.7486, while the rainfall rate correlation improved from 0.493 to 0.7143. The relative error of rainfall rate dropped sharply from 74.97% to 3.42%, and NRMSER decreased from 0.365 to 0.1003. In plain regions, the reflectivity correlation improved from 0.694 to 0.7197, and the rainfall rate correlation increased from 0.517 to 0.7586. The normalized RMSE of rainfall rate fell significantly from 0.6214 to 0.0998, representing the best performance across all terrain types.
However, under convective precipitation and complex terrain conditions, the model exhibited relatively poor adaptability. In convective cases, although CCR improved from 0.413 to 0.6143 and the bias was reduced from +4.55 mm·h−1 to +1.84 mm·h−1, the rainfall rate NRMSE remained high (0.2418), and the relative error RER reached 28.36%, indicating substantial residual errors in estimating heavy rainfall. In hilly regions, the reflectivity correlation decreased slightly from 0.571 to 0.5765, while rainfall rate correlation improved from 0.431 to 0.6586. However, large negative biases were observed, and RER remained at 27.61%, suggesting a tendency to underestimate rainfall. In plateau regions, the correction effect was the weakest; CCZ dropped from 0.378 to 0.2777, REZ increased to 35.54%, and NRMSER remained high at 1.0985, highlighting significant systematic deviations.
These deviations can be attributed to three main factors. First, the static Z–R relationship fails to adapt to rapid changes in drop size distribution during convective precipitation, where microphysical processes are highly dynamic and heterogeneous. Second, radar signals are prone to distortion in complex terrains due to beam blockage, overshooting, and terrain-induced attenuation, leading to inaccurate reflectivity values. Third, plateau regions are dominated by deep convective clouds and ice-phase hydrometeors such as graupel and snow, which are not adequately accounted for in the current algorithm, thereby introducing significant systematic errors.
Overall, the correction formula proves effective in improving GPM retrievals for stratiform precipitation and plain areas, yet further refinement is necessary for convective systems and complex terrains. To address the above limitations, future work should explore dynamic Z–R relationships responsive to evolving raindrop microphysics, integrate terrain-aware correction schemes based on high-resolution digital elevation models, and incorporate ice-phase scattering effects in reflectivity simulations over high-altitude regions.
In summary, to further enhance the versatility and accuracy of GPM reflectivity products, a zonal correction model incorporating different precipitation and terrain types is proposed. By adjusting Z–R parameters in conjunction with dynamic physical processes, this approach aims to improve rainfall retrieval accuracy under complex terrain and severe convective weather conditions.
4.2. Rainfall Rate Evaluation Based on Classification Model
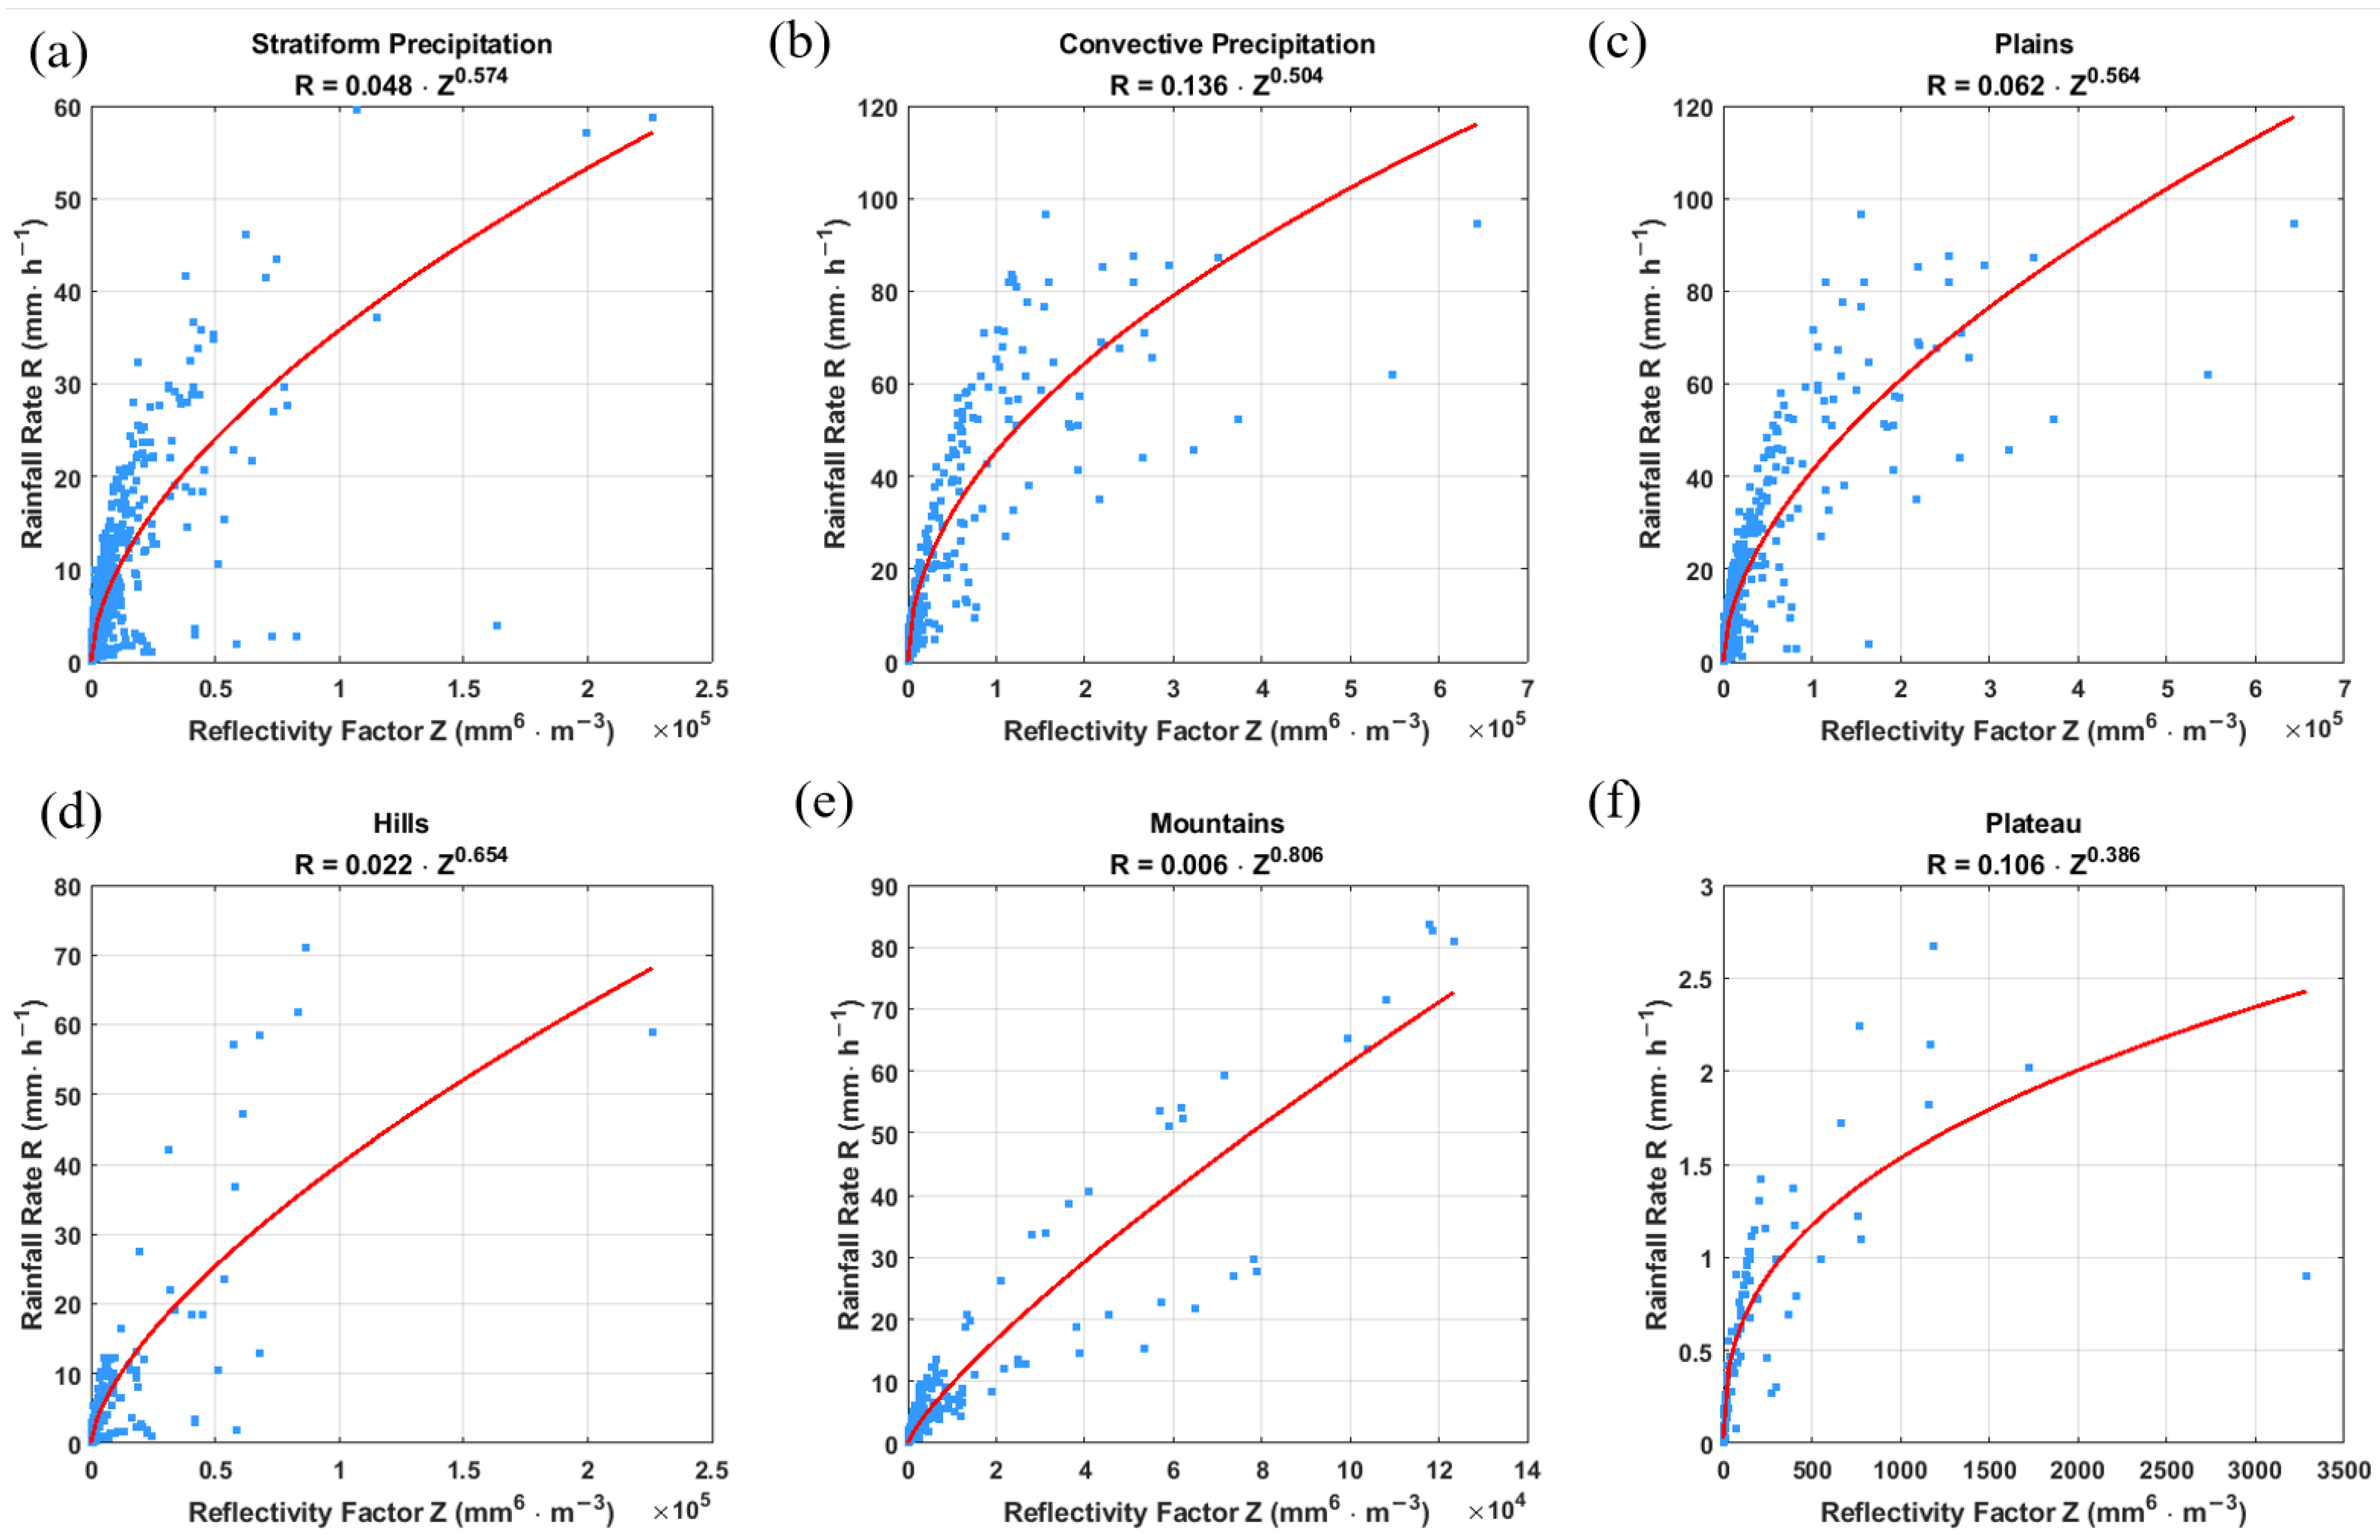
Figure 9 presents the calculated values of coefficients
a and
b under various classification models. Specifically, panels (a) and (b) represent the stratiform and convective precipitation models, respectively; panels (c) and (d) correspond to precipitation models for plains and hilly areas; and panels (e) and (f) show the models for mountainous and plateau regions.
Comparing different precipitation types reveals that the coefficient a for stratiform precipitation is smaller, while the exponent b is larger. In contrast, the a value for convective precipitation is approximately 2.8 times greater than that of stratiform precipitation, while its b value is about 12% lower. This indicates that convective precipitation is more strongly influenced by the concentration of raindrops rather than their size distribution. The relatively high a value in convective precipitation reflects a greater concentration of large drops, whereas the lower b value suggests a broader drop size distribution, which reduces the sensitivity of the Z-R relationship to changes in reflectivity.
Regarding the influence of terrain elevation, the coefficient a generally shows a decreasing trend from plains to mountainous regions, consistent with the reduction in rainwater content likely caused by enhanced evaporation or microphysical recycling processes in higher altitudes. However, this decrease is not strictly linear, as the plateau region exhibits a relatively higher a value compared to mountainous areas, possibly reflecting complex microphysical processes unique to plateau environments. The exponent b generally tends to increase from plains through hills to mountains, indicating a shift towards a steeper Z-R relationship, which could be attributed to the dominance of smaller droplets and altered size distributions caused by terrain-induced atmospheric dynamics. Nevertheless, the plateau region shows a notably lower b value compared to mountainous regions, suggesting a distinct precipitation microphysics possibly related to the presence of ice-phase particles or different scattering mechanisms.
Overall, the substantial differences in a and b parameters across precipitation types and terrain classifications highlight the importance of region- and type-specific Z-R relationships for improving radar-based rainfall estimation accuracy. These variations reflect the underlying microphysical characteristics and dynamic processes affecting drop size distributions, such as convective intensity, evaporation, and orographic effects.
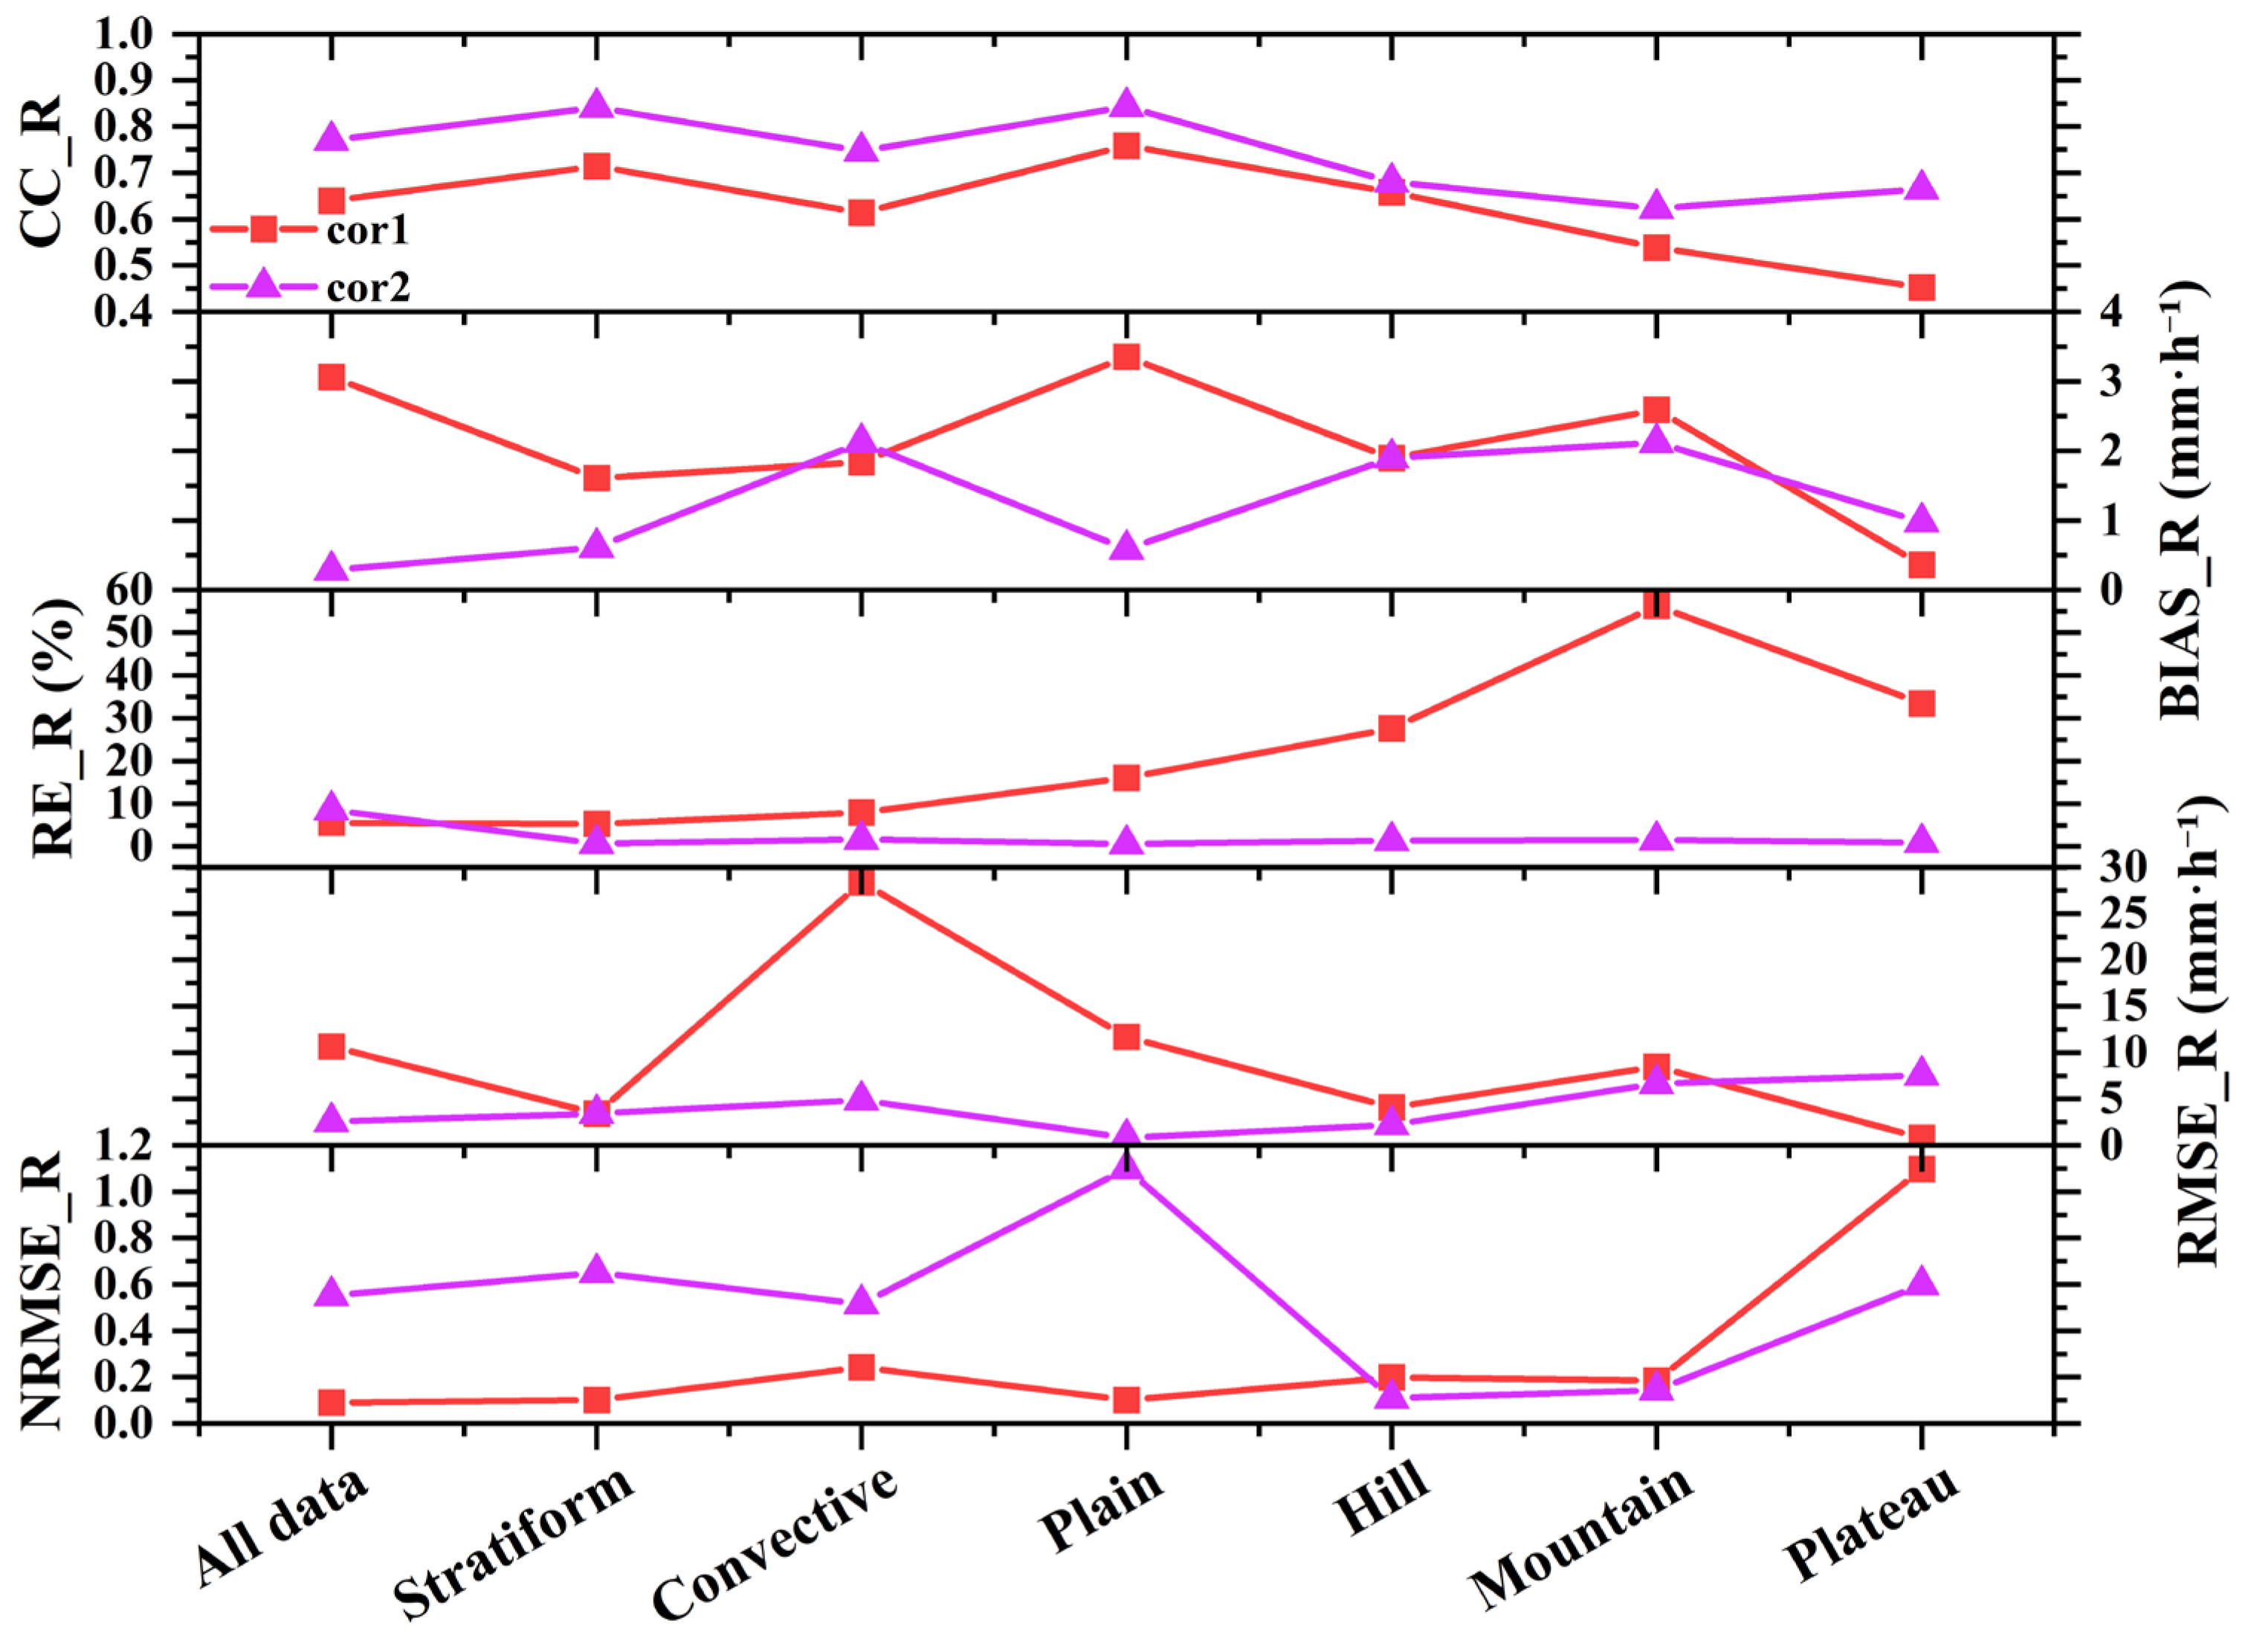
Figure 10 presents a quantitative comparison of rainfall rate (
R) retrieval accuracy before and after applying classification-based correction models. In this figure, the red solid line (cor1) represents R estimates based on GPM reflectivity (
Z) corrected by a linear model using the default Z–R relationship. In contrast, the purple solid line (cor2) shows
R values derived from classification-based correction models that incorporate precipitation type and terrain characteristics. As shown in the figure, the application of classification-based corrections significantly improves retrieval accuracy across multiple metrics. The correlation coefficient (
CC) increases notably in most cases, with improvements ranging from 0.10 to 0.13 in CC values. For example, in plain regions under stratiform precipitation, the
CC rises from 0.7143 (cor1) to 0.841 (cor2), indicating enhanced consistency likely due to the narrow raindrop size distribution in these areas.
Similarly, the root mean square error (RMSE) and relative error (RE) exhibit substantial reductions after classification correction. In mountainous regions, where radar beam blockage and terrain effects are pronounced, RMSE decreases dramatically from 10.67 mm∙h−1 to 2.54 mm∙h−1, and RE is reduced from 5.49% to 1.61%. This confirms the classification-based model’s effectiveness in compensating for terrain-induced distortions. For convective precipitation, characterized by large and variable drop sizes, RE decreases sharply from 56.25% to 1.46%, indicating improved performance in capturing intense rainfall events.
The mean bias (MB) also shows marked improvements. For instance, in plateau regions, MB reduces from 2.59 mm∙h−1 to 2.12 mm∙h−1, suggesting partial correction of overestimation caused by ice-phase scattering processes. However, a slight systematic overestimation remains, particularly in marginal zones. Conversely, in hilly regions, a persistent underestimation exists, with bias magnitude slightly increasing from −0.36 mm∙h−1 to −0.98 mm∙h−1, and RE remaining relatively high (33.45% vs. 0.84%), highlighting ongoing challenges in complex terrain. Lastly, normalized RMSE (NRMSE) values further confirm enhanced stability and accuracy of retrievals. For example, in representative terrains, NRMSE decreases from as high as 0.24 (cor1) down to approximately 0.10 (cor2), demonstrating improved relative error control across different precipitation and terrain conditions.
Collectively, these results underscore the importance of including precipitation type and terrain information in reflectivity correction models to obtain more precise and physically consistent rainfall retrievals from GPM observations.
5. Discussion
Using 2023 GPM-DPR satellite precipitation data over China combined with national ground-based observations, this study systematically evaluated satellite precipitation accuracy across four terrain categories—plains, hills, mountains, and plateaus—via a strict spatiotemporal matching framework. Results show clear terrain dependency: retrieval accuracy decreases with increasing topographic complexity. The strongest agreement occurred in plains, while mountainous and plateau regions exhibited lower correlations, likely due to radar beam blockage, spatial heterogeneity of precipitation, and orographic effects. Stratiform precipitation demonstrated significantly lower retrieval errors than convective precipitation, highlighting the influence of cloud microphysical characteristics on satellite retrieval performance. To accurately assess the temporal offset between satellite overpass and surface rainfall, we performed a minute-by-minute correlation analysis within a 10 min window around the satellite overpass time. The highest correlation (Pearson coefficient = 0.626) was observed 5 min after the satellite overpass, indicating a lag in surface precipitation relative to satellite observations and informing subsequent data matching.
To improve retrieval accuracy, we developed a reflectivity correction model based on stratiform rainfall data collected from seven disdrometer-equipped PWS stations in plain areas during 2021–2023, with Jinghe Station as representative. Both radar reflectivity and rainfall rate were independently derived from measured drop size distributions, avoiding reliance on empirical Z–R relationships. This microphysics-based approach allowed quantification and correction of systematic biases in satellite-derived reflectivity. Applying the default GPM Z–R relation to the corrected reflectivity resulted in moderate improvements, particularly under stratiform and flat terrain conditions, but showed limited enhancement in complex terrain or convective cases.
To increase physical representativeness and regional adaptability, localized Z–R relationships stratified by terrain and precipitation type were developed from PWS observations and applied to the corrected GPM reflectivity to obtain refined rainfall rate estimates. This sequential correction strategy—combining physical calibration with terrain- and regime-specific empirical adjustments—effectively improved both retrieval accuracy and interpretability.
Validation using millimeter-wave cloud radar data demonstrated that the corrected reflectivity profiles better captured key vertical precipitation features—including layer depth, peak echo height, and attenuation—especially in stratiform systems, confirming improved vertical retrieval consistency. Despite these improvements, retrieval performance remains suboptimal under convective precipitation and complex terrain conditions due to rapid temporal variability, hydrometeor diversity, and spatial heterogeneity, which challenge radar observation geometry and algorithm stability. Further validation with 2023 data from multiple terrain types confirmed the correction model’s effectiveness and generalizability in stratiform and plain regions. However, the sensitivity of rainfall estimates to fitted Z–R coefficients highlights the need for terrain- and precipitation-type-specific parameter optimization.
While this study adopts a linear correction model due to the limited availability of observational data, the results remain robust within this constraint. Future studies are encouraged to expand the calibration dataset and investigate more advanced retrieval methods—such as Bayesian inversion and machine learning—to better represent non-linear precipitation processes and improve adaptability under convective conditions. Additionally, the incorporation of dual-polarization radar and reanalysis data could further reduce uncertainties and contribute structural insights for algorithm refinement.
