1. Introduction
The atmospheric boundary layer (ABL) is the part of the troposphere that is influenced by the Earth’s surface (land and sea) the most. Several forcing mechanisms impact the ABL, determining its dynamics and evolution. In particular, the ABL exhibits a diurnal variability depending on the solar cycle [
1]. Additionally, the ABL thermodynamic stability plays an important role in regulating turbulence, convection, and precipitation, other than affecting the Earth–atmosphere exchange of heat, momentum, pollutants, and moisture [
1,
2]. In general, the ABL characteristics are strongly affected by the type of underlying surface. For example, the characteristics of the ABL developed over land are completely different with respect to the ones of an ABL developed over the sea [
3]. Even orography can determine the way in which the ABL can evolve.
Besides that, the ABL is also crucial for air quality, as it determines the available volume that anthropogenic pollutants emitted at the surface can occupy. Shallower ABL is typically observed when solar radiation is not enough to trigger convection and mixing events. Under such conditions, the concentration of pollutants trapped within the ABL can be quite high, strongly degrading air quality [
4]. For this reason, the ABL height (ABLH) is a fundamental complex key meteorological variable to improve the aerosol dispersion forecast and reanalysis [
5]. Accurate and dense ABLH measurements are important to tackle air-quality-related issues in highly urbanized environments and greater metropolitan areas because of their direct relation with pollution contents.
Despite its fundamental importance, ABLH measurements are far from having an adequate coverage, both spatially and temporally. The traditional way to monitor the evolution of the ABL is based on radiosoundings made at a global scale in the frame of the World Meteorological Organization (WMO) radiosounding global network. However, these measurements have critical limitations in terms of both space and time representativity. Typically, such measurements are highly concentrated within the most advanced Western countries in the Northern Hemisphere and are taken twice per day (00:00 and 12:00 UTC) without either providing an adequate temporal coverage or capturing the ABL diurnal cycle due to the different time zones [
6,
7].
In this context, remote sensing techniques can be quite useful in filling the ABL observational gaps described [
5,
8]. In principle, such techniques can be used to monitor the ABLH continuously at high resolution in both time and space. The considered approaches rely on the use of vertically resolved profiles of thermodynamic atmospheric variables, like temperature, humidity, wind fields, and attenuated backscatter from clouds and aerosols as a proxy to retrieve the ABLH. Consequently, commercial and quite widespread instruments like microwave radiometers, sodars, ceilometers, and lidars can be used to monitor the ABLH 24/7 [
4,
5]. Among all these remote sensing sensors, lidars are quite promising, as they can deliver uncorrelated vertically resolved profiles of thermodynamic atmospheric variables and of the optical and geometrical aerosol properties, with high spatial and temporal resolution. Even basic single-wavelength lidars can measure time series of attenuated aerosol backscatter profiles, which, being proportional to atmospheric aerosols, can be used to infer the ABLH. For this reason, remarkable efforts in developing automatic ABLH retrieval algorithms applied to lidar observations have been made by the scientific community during the past decades. Some of these algorithms are based on the detection of gradients in the first or second derivative of range-corrected elastic backscattered lidar signals [
9,
10,
11,
12]. Some alternative algorithms propose to retrieve the ABLH by applying the wavelet covariance transform (WCT) to the lidar signal [
13,
14,
15,
16]. A more detailed review with more information about the advantages and drawbacks of the reported algorithms can be found in [
4,
17]. Often, traditional approaches estimate ABLH relying on a single lidar profile, neglecting the time correlation between contiguous (in time) lidar signals, even when continuous lidar observations are available. Additionally, they require the proper setting of absolute threshold values, that usually need to be tuned for each lidar specifically, with obvious limitations on their applicability to networks composed of different lidar instruments, such as the European Aerosol Research Lidar Network (EARLINET) [
18].
Recently, a new and promising algorithm called MIPA [
19] (Morphological Image Processing Approach) has been developed to continuously retrieve the ABLH from lidar measurements carried out at different permanent observational sites, deployed in the frame of EARLINET and Aerosol, Clouds and Trace Gases Research Infrastructure (ACTRIS) [
18]. MIPA was successfully used to retrieve the ABLH from observations made by a non-EARLINET lidar system [
20]. The novelty of this approach is that it is based on a fully image-based methodology (2D): instead of analyzing the lidar observations profile by profile, the retrieval also considers the temporal dimension at very high resolution. MIPA requires as input a statistically significant temporal collection of the attenuated backscatter vertically resolved profiles. In [
19,
20], it is shown that in general MIPA performs better than other traditional algorithms in retrieving the ABLH from lidar observations because it relies on both time and space correlations of the input data and, moreover, it is less sensitive to the absolute intensity of input lidar signals. However, the study presented in [
19] used as an ABLH reference dataset the modelled values from the Numerical Weather Prediction (NWP) provided by the ECMWF Integrated Forecast System, as no co-located radiosoundings were available.
In this study, we perform a more robust assessment of the MIPA algorithm performance with respect to what is provided in [
19,
20], relying on a more solid ABLH reference dataset. To reach this goal, a dedicated measurement campaign was organized at the CNR-IMAA Atmospheric Observatory (CIAO) [
21,
22,
23,
24]. This observatory is the ideal infrastructure to study the ABL structure and its evolution in variable atmospheric conditions. CIAO is equipped with different active and passive remote sensing instruments capable of characterizing the ABL. Moreover, it is also equipped with two different radiosounding systems, allowing for frequent launches during specific intensive observational time periods and, consequently, the development of a robust ABLH reference dataset based solely on radiosoundings co-located (in both time and space) with remote sensing equipment.
Additionally, in this study we assess for the first time the applicability of MIPA across all the available elastic lidar wavelengths (namely 355 nm, 532 nm, and 1064 nm) whereas, until now, only 1064 nm was considered [
19,
20] due to the higher contrast of particle-to-molecular backscatter signal available at longer wavelengths.
The paper is organized as follows. In
Section 2, a brief overview of the CIAO ABLH measurement campaign is provided.
Section 3 is focused on the presentation of the three case studies selected to optimize and validate MIPA and the reference dataset used. The main characteristics of the MIPA algorithm are recalled in
Section 4, while
Section 5 is dedicated to MIPA validation. Finally, the conclusions are given in
Section 6.
2. CIAO ABLH Measurement Campaign
The CIAO ABLH measurement campaign took place at CNR-IMAA (40.60°N, 15.72°E, 760 m a.s.l. (above sea level)) from 15 April 2024 to 30 June 2024 and has been organized in the framework of Italian Integrated Environmental Research Infrastructures System ITINERIS (
https://itineris.cnr.it/, accessed on 6 August 2025). The main goal was to operate different types of remote sensing instruments simultaneously and continuously 24/7, together with frequent radiosondes launches, in order to establish a reference dataset for the ABLH retrieval. As different ABLH retrieval methods are based on different assumptions, the quite large number of instruments participating in the campaign is expected to be an added value to assess the impact of these assumptions under different atmospheric conditions. ABLH retrievals from lidar measurements, for example, use atmospheric aerosols as tracers of the ABL, which is assumed to be always well mixed. This assumption may show some limitations when the aerosol content is particularly low or in the case of low clouds and/or precipitation (when lidar measurements are not possible). Moreover, particularly low ABLHs (below the lidar full overlap height, which is about 200–350 m) are not detectable independently of the lidar-based retrieval algorithm. In addition, there are different conditions under which the ABL is formed (non-turbulent, cloud-driven, convective, wind shear, etc.), and, consequently, ABL retrieval from the lidar measurements should be evaluated for each of these cases. In this context, the use of sensors like Doppler lidar and cloud radar can help to identify the limitations of lidar and to provide useful ABL classification to correlate with ABLH retrieval results.
Concerning the remote sensing instruments, two Doppler radars (MIRA35 and MIRA35C by METEK, Elmshorn, Germany), a Doppler lidar (Stream LineXR by Halo Photonics/Lumibird, Lannion, France), three ceilometers (CL31 and CL51 by VAISALA, Vantaa, Finland, and CHM15k by Lufft, Fellbach, Germany), and a microwave radiometer (RPG-HATPRO-G5 by Radiometer Physics, Meckenheim, Germany) were operated continuously throughout the whole campaign period. Moreover, a fixed multi-wavelength Raman lidar (POLPO—POtenza Lidar for Particle Observations) and a mobile and more compact multi-wavelength Raman lidar (M3DUSA—Mobile 3-Depolarization Measurement System for Aerosols), both by Raymetrics, Athens, Greece, were operating continuously whenever the atmospheric conditions were suitable for lidar observations (no rain precipitation/low clouds). Both POLPO and M3DUSA lidars are ACTRIS reference systems.
During the campaign, radiosoundings were performed with high launching frequency (up to 8 launches per day) on several days selected according to specific atmospheric conditions described in the following. Such a high launch frequency is a crucial factor for the assessment of the MIPA algorithm, as the ABLH values derived from radiosoundings provide an appropriate reference against which to compare the ABLHs retrieved by MIPA. CIAO is the ideal site for performing this kind of experiment, as it is equipped with two radiosounding systems (by VAISALA, one of which is equipped with an automatic launcher), which are part of the GCOS Reference Upper Air Network (GRUAN). The exact scheduling of radiosondes’ launches was evaluated case by case based on high-resolution weather model forecasts, with denser launches typically performed in correspondence with ABL transition times and during special events like dust intrusions.
Additionally, a quite complete set of in situ instruments were operating continuously for the whole period, providing useful information for the aerosol characterization at ground level. In particular, data from an aethalometer (AE33 by Aerosol Magee Scientific, Ljubljana, Slovenia), nephelometer (Aurora 3000 by Acoem, Limonest, France), aerodynamic particle sizer (APS 3321 by TSI Incorporated, Shoreview, MN, USA), and particular matter (SWAM 5a Dual Channel Monitor by FAI Instruments, Rome, Italy) samplers were available.
All the remote sensing and in situ instruments used during the campaign are part of ACTRIS and are fully compliant with the corresponding ACTRIS requirements.
The dataset collected during the campaign is envisaged to be a valid testbed for the development and validation of new and existing ABLH retrieval algorithms (e.g., those based on machine learning approaches).
3. Selected Case Studies
As the primary goals of this study are the optimization and validation of MIPA, we describe here not all the observations collected during the whole campaign but only specific case studies. The case studies have been selected to meet, as much as possible, all the conditions required to ensure an optimal input dataset for MIPA. In this way, we expect to achieve an accurate optimization of all MIPA configuration parameters, which can then be applied to operate MIPA even under suboptimal conditions. The optimal input dataset to evaluate MIPA performance is composed of a timeseries of vertical profiles of any variable proportional to the concentration of the considered ABL tracers (e.g., aerosols or other atmospheric constituents like water vapor), meeting the following conditions:
as continuous and long as possible (ideally with no gaps, or only rare and small ones);
high vertical and temporal resolutions;
high/moderate signal-to-noise ratio (SNR).
Modern Aerosol High-power Lidars (AHLs) can easily provide a dataset with all these characteristics, as they can deliver continuous timeseries of attenuated backscatter (and/or range-corrected signal) with a temporal resolution under 1 min (typically from 10 s to 60 s), a vertical resolution of a few meters (typically from 3.75 m to 15 m), a relatively high SNR, and at different wavelengths. Considering that, in the elastically backscattered lidar signal, the longer the wavelength, the greater the contrast between the particle and molecular contributions, it is preferable to use the longest available wavelength (typically 1064 nm) to ensure an accurate ABLH determination.
It is possible that gaps occur in lidar observations, typically during rain events (when lidar measurements are not possible or very challenging) or while the lidar performs internal calibration measurements (for example, dark measurements or depolarization calibration cycles). In the latter case, the gaps are usually minimal (typically 10–20 min every 12–24 h) and, from a practical point of view, have no important effects on the MIPA retrieval.
Accordingly, we selected three case studies representing the longest and nearly continuous AHL observations available during the entire campaign:
Case Study 1: from 28 April 2024 03:00 UTC to 1 May 2024 00:00 UTC (69 h);
Case Study 2: from 15 April 2024 00:00 UTC to 16 April 2024 12:00 UTC (36 h);
Case Study 3: from 27 June 2024 19:00 UTC to 29 June 2024 19:00 UTC (48 h).
We intensified the radiosounding schedule during these case studies to assure the establishment of a representative ABLH reference dataset. Further details about the launches performed and the calculation of the reference ABLH values are provided in
Section 3.4.
It was not possible to select longer and continuous AHL datasets mainly because persistent or intermittent precipitation occurred over the measurement site.
3.1. Case Study 1
The Case Study 1 includes 69 h of almost continuous AHL observations made by POLPO.
It starts at 28 April 2024 03:00 UTC and ends on 1 May 2024 00:00 UTC because of incoming low rain clouds.
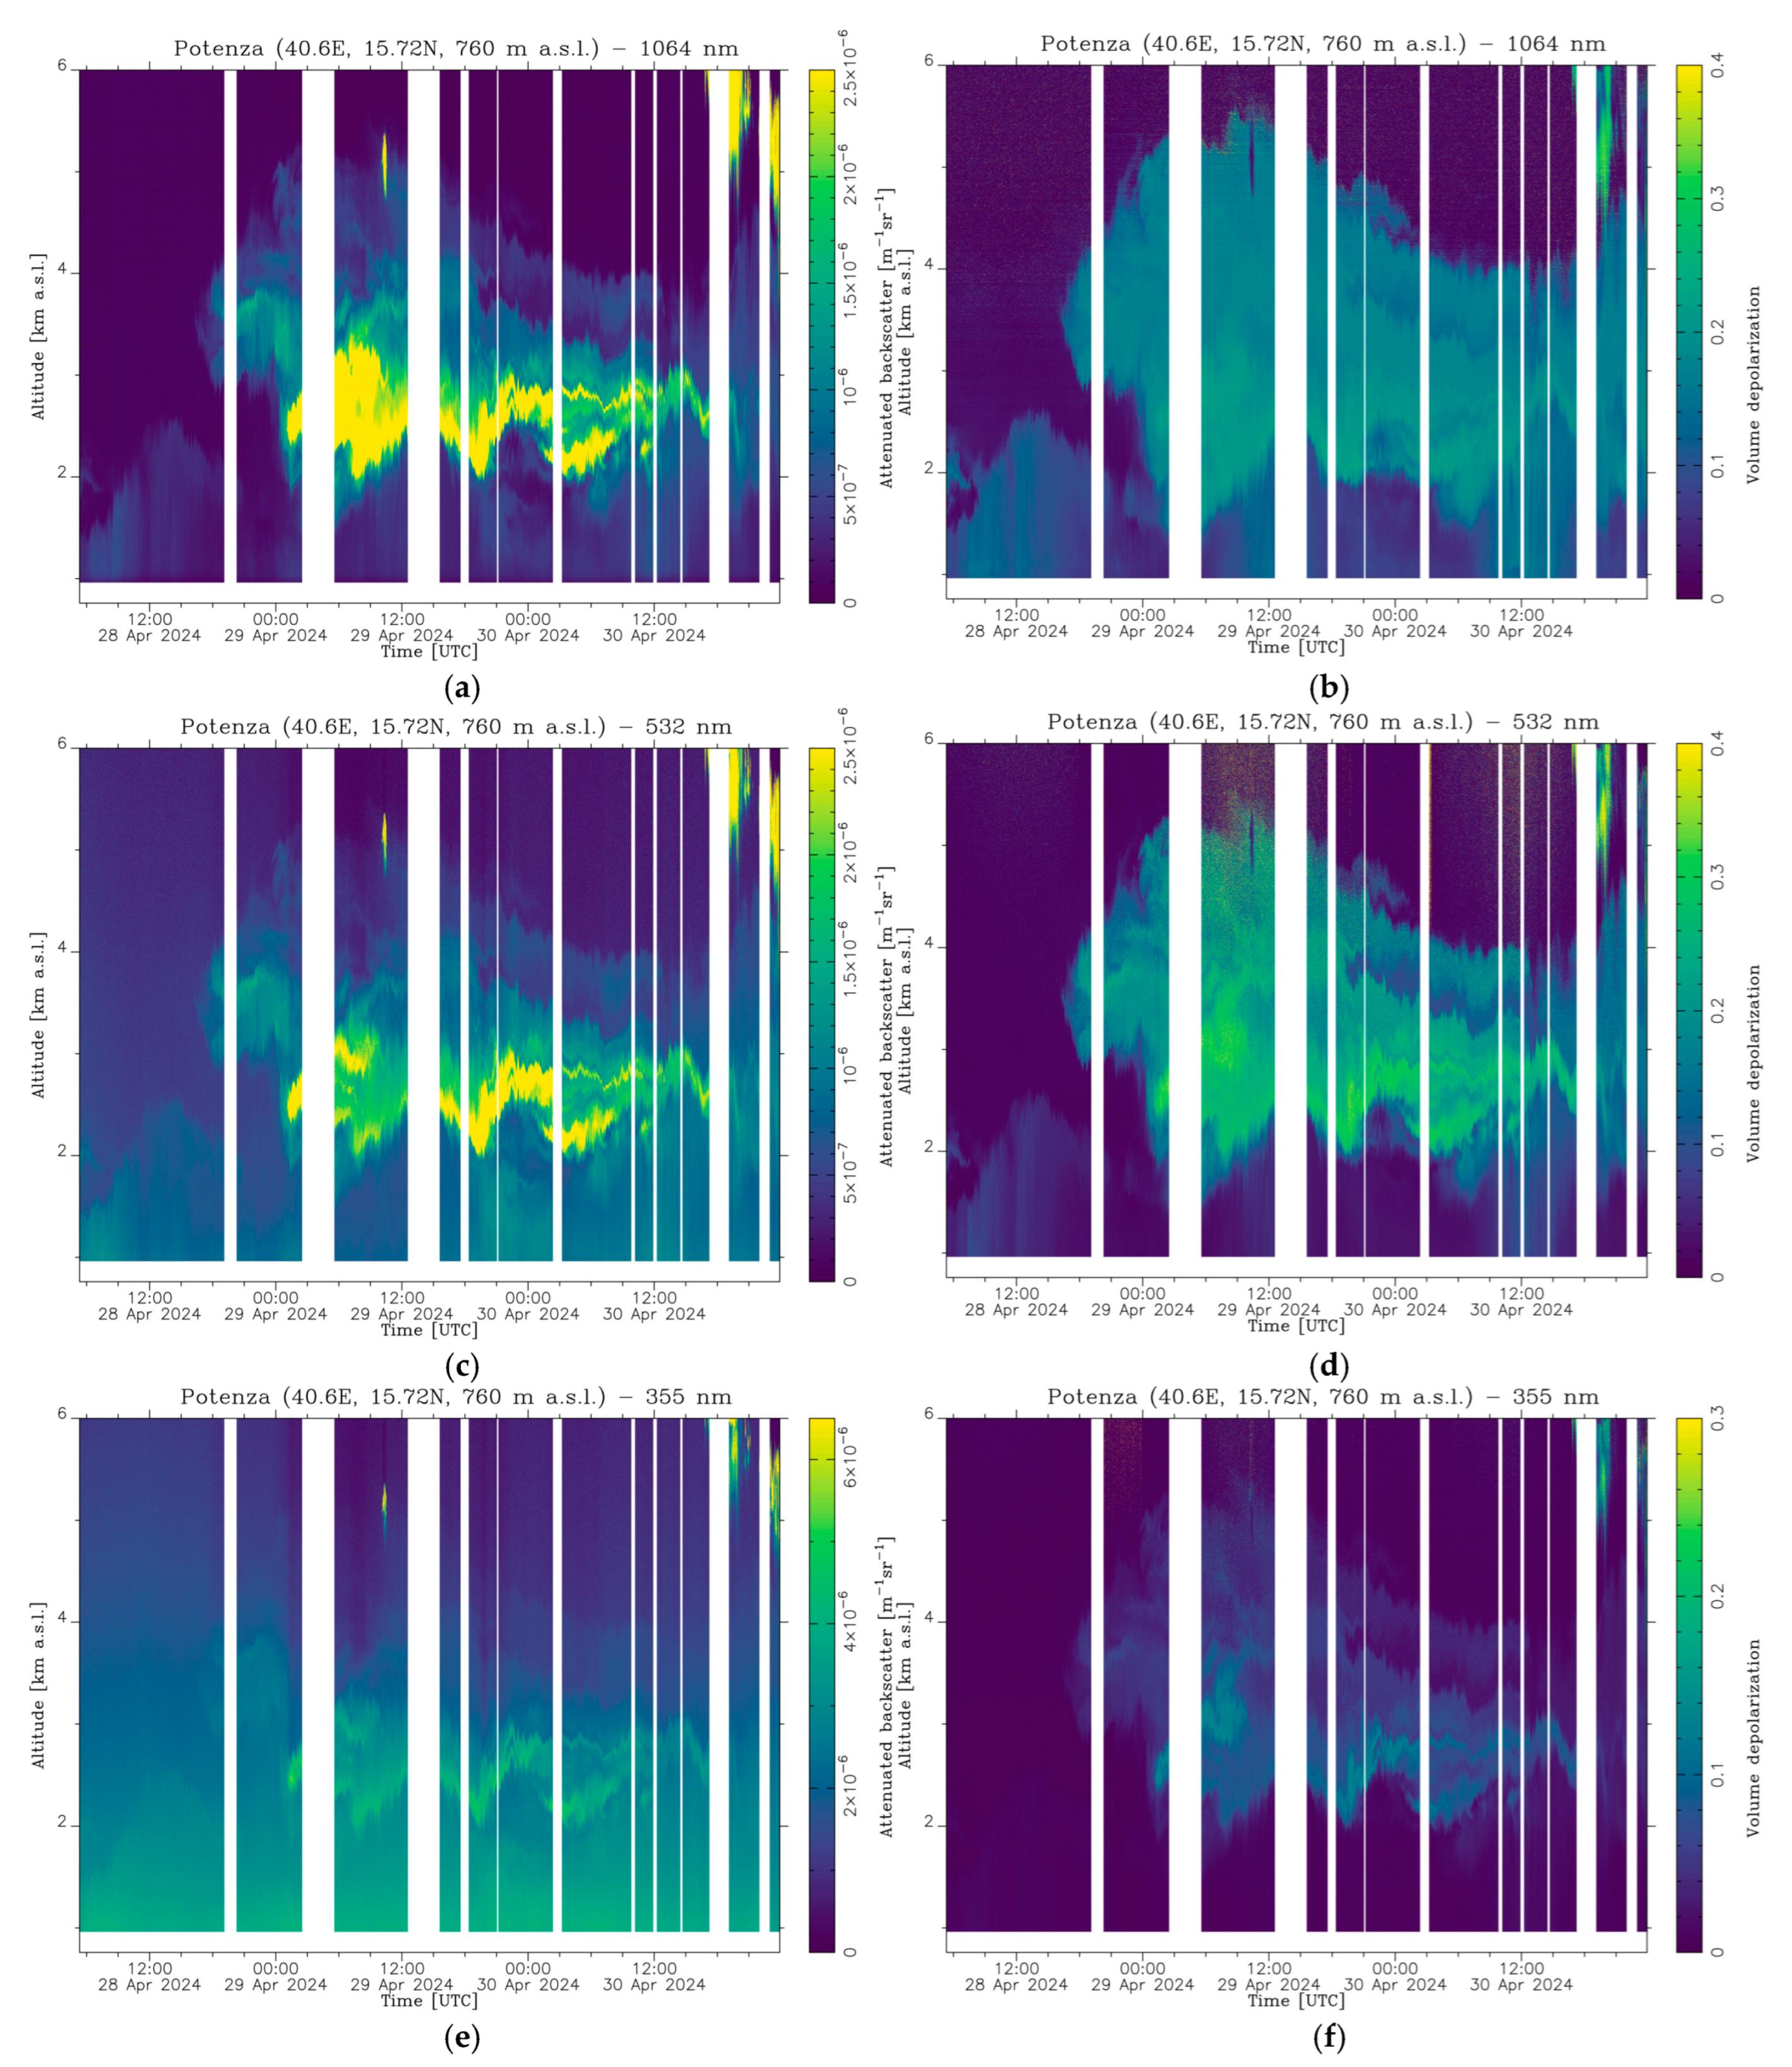
Figure 1 shows the timeseries of attenuated backscatter profiles (
Figure 1a,c,d) and volume linear depolarization ratio profiles (
Figure 1b,d,f) at 3 different elastic wavelengths (1064 nm, 532 nm, and 355 nm) as delivered by the Single Calculus Chain (SCC) [
25], the standard and quality assurance tool for the processing of raw lidar data of ACTRIS aerosol remote sensing observations. The measurement gaps (white strips in the figure) are due to internal calibration cycles (mainly dark measurements), switching between daytime and nighttime lidar configurations, and/or small instrumental issues.
Case Study 1 is quite interesting from many points of view.
On 28 April, the typical diurnal evolution of the ABL is clearly visible: with the sunrise, the ABLH starts to increase in the morning, and it reaches a maximum of about 2.5 km a.s.l. at around 15:00 UTC (the measurement site is located at 760 m a.s.l.), when the solar convective activity is maximum. Later, as expected, the ABLH decreases until reaching values below the lidar full overlap height after the sunset.
On 29 April, a similar behavior is observed, but at the same time a quite intense dust layer is also visible in the region above the ABL between 2 and 5 km a.s.l. (marked by the enhanced volume depolarization ratio in
Figure 1). However, the effect of this layer on the ABL dynamics is minimal, as its evolution looks quite similar to the one observed on the previous day. The situation changes drastically on 30 April, when the compressive effect of the dust layer becomes stronger, affecting the normal evolution of the ABL [
26,
27]. The formation of gravity waves, clearly visible in the maps within the dust layer, is a clear indication of two opposite regimes: convective pushing up due to solar activity and pulling down due to the dust layer gravity deposition, these phenomena taking place in stable stratified air conditions [
28,
29]. Moreover, while on 29 April the dust layer resides above the ABL without penetrating or penetrating it minimally, on 30 April it penetrates the ABL, and, consequently, dust is settled on the ground. This is confirmed also by the in situ near-surface observations reported in
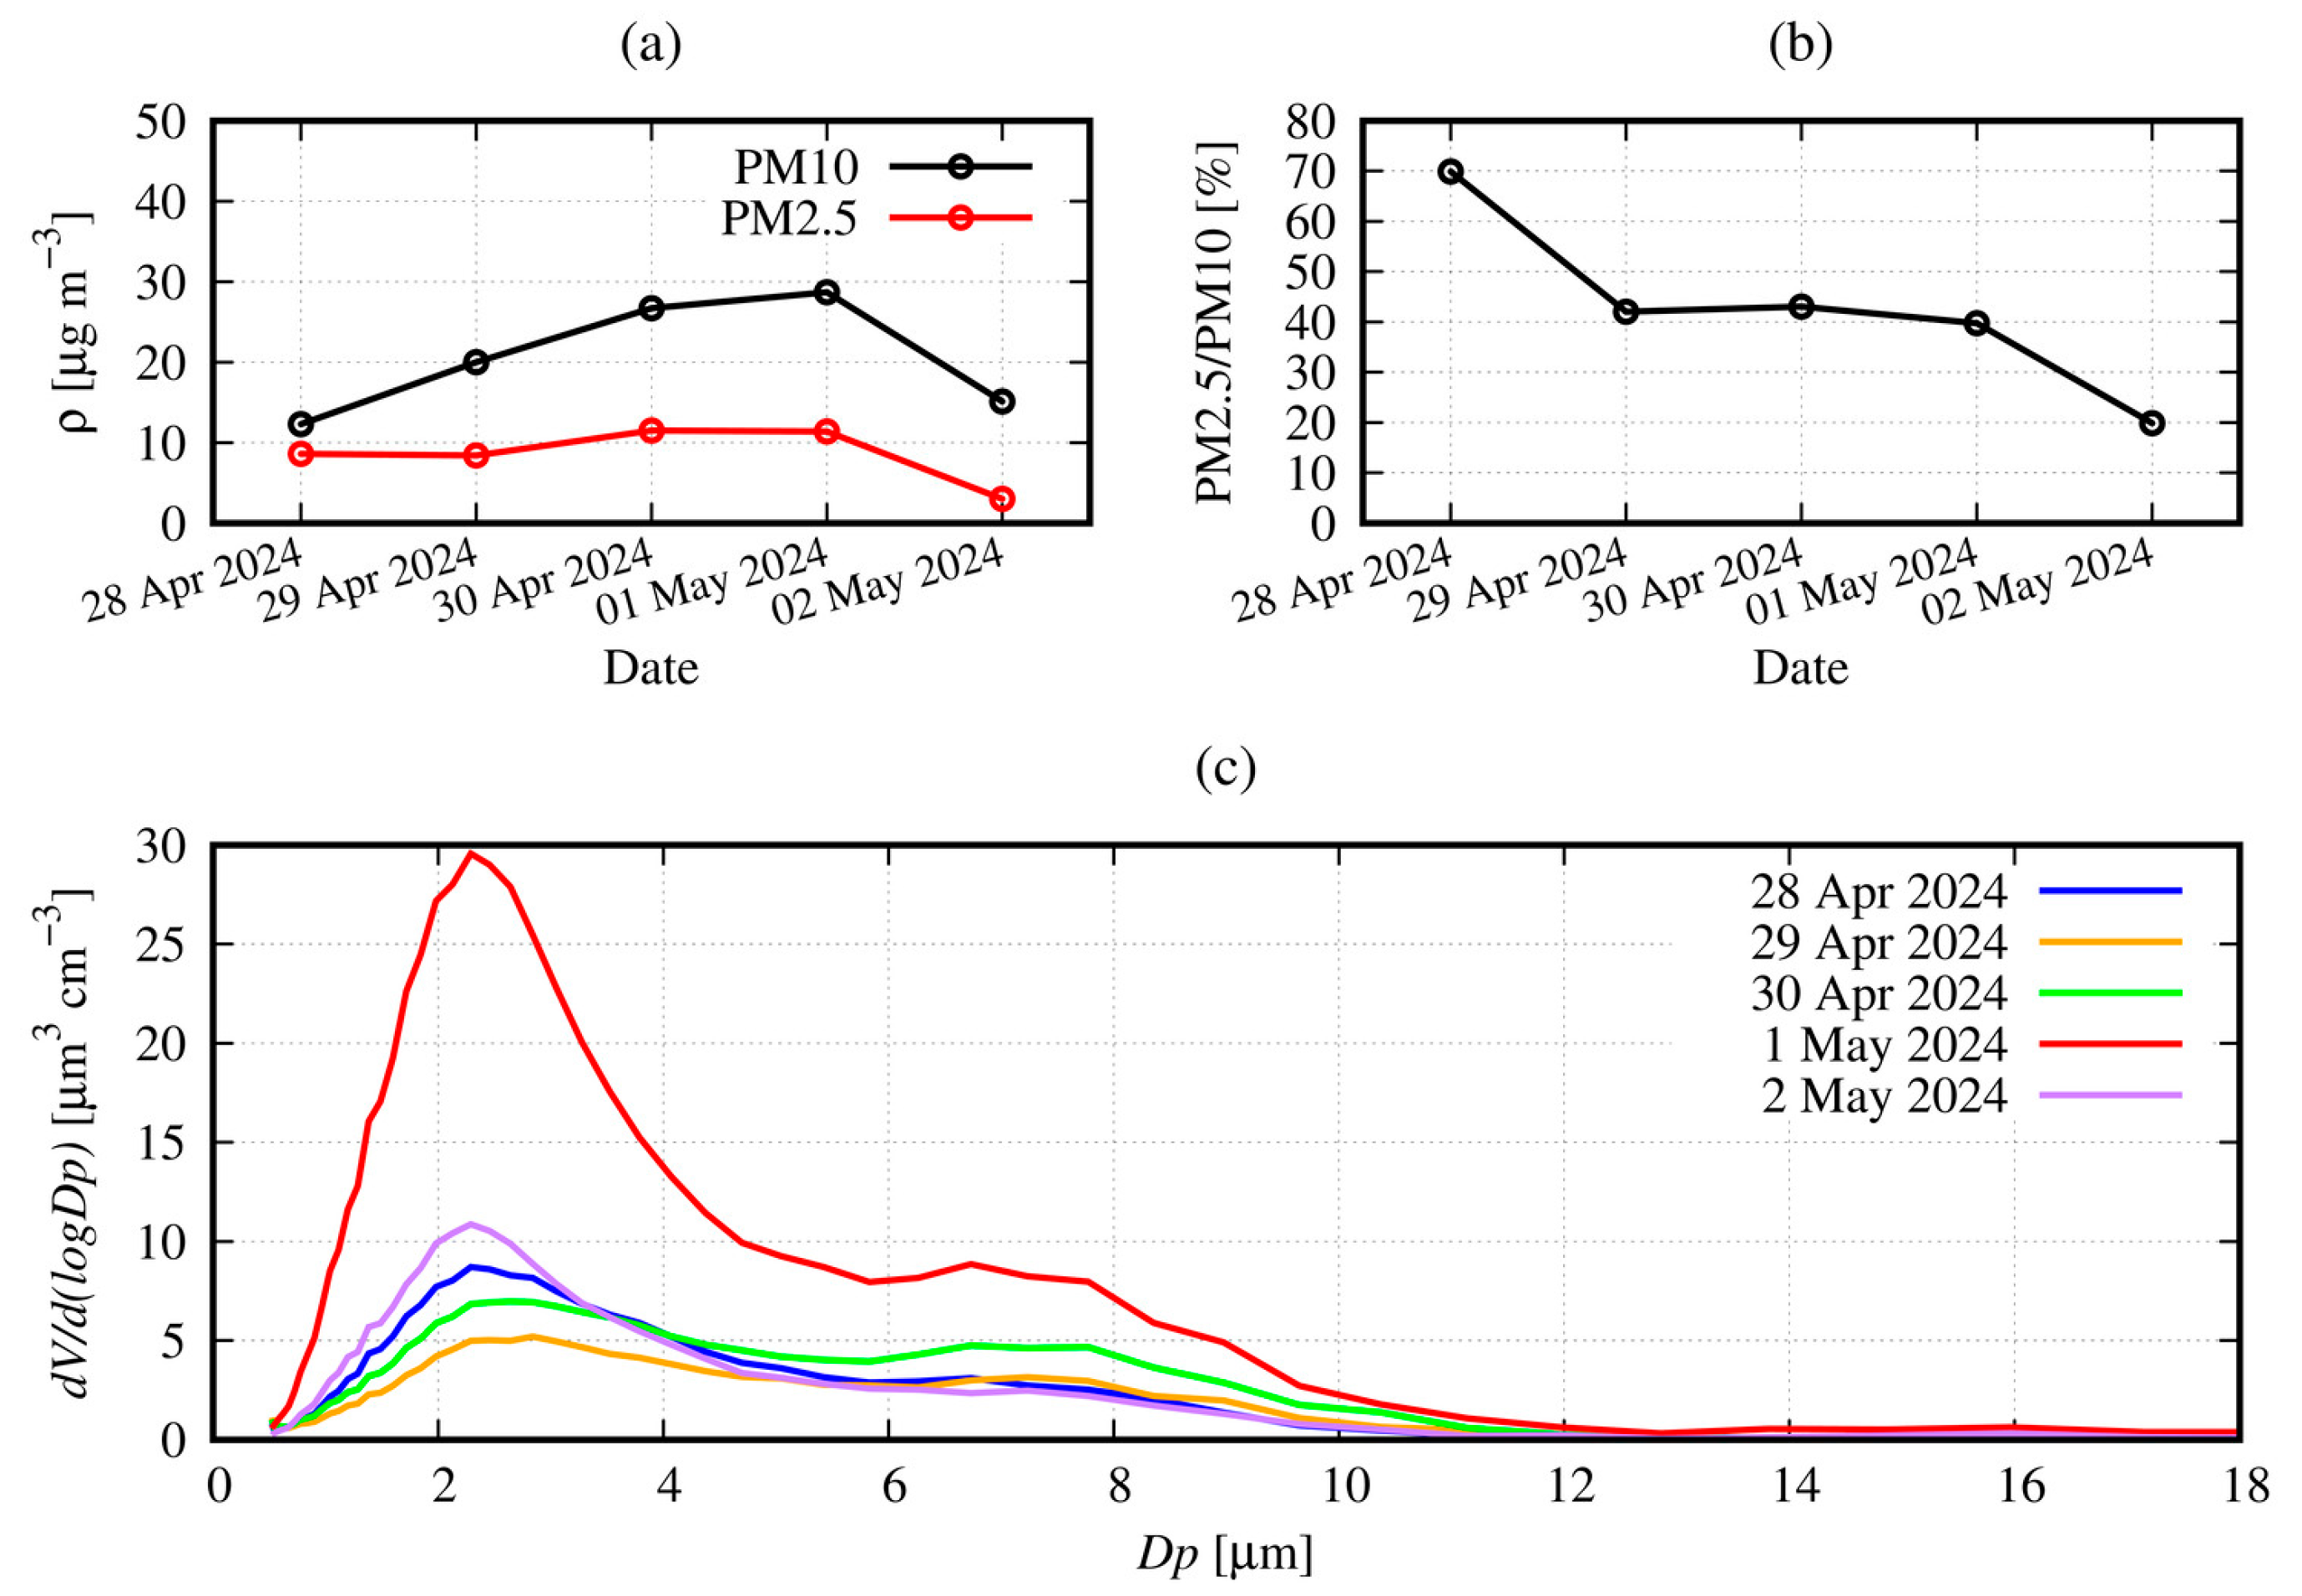
Figure 2.
In the period under consideration, aerosols at ground level were sampled on Teflon filters (Pall Life Science Teflon, W/RING 2 um 47 mm) using a SWAM 5a Dual Channel Monitor PMx sampler. This instrument was used for the simultaneous sampling on two independent lines (PM10 and PM2.5), with associated mass measurements.
In
Figure 2a, we report the temporal evolution of PM10 and PM2.5 concentrations from 28 April to 2 May, which shows a slow and continuous increase in PM10 values until reaching the maximum value on 1 May (28.7 µg m
−3). From
Figure 2b we can observe, in detail, the evolution of the percentage ratio (PM2.5/PM10) for the same period.
This trend is further confirmed by the APS spectrometer observations at ground level, providing high-resolution real-time aerodynamic measurements for the coarse fraction of the particle in the size range of 0.8 to 10 μm, thus playing a key role in dust studies.
Figure 2c shows the aerodynamic particle size (in terms of the particle diameter
Dp) distribution daily averages obtained by the APS from 28 April to 2 May and provides complementary information to that obtained through the PMx sampler. Indeed,
Figure 2c distinctly illustrates that there is a noticeable increase in the concentration of particles on 1 May compared to the previous and subsequent days. The in situ observations indicate that when the dust layer penetrates much further into the ABL, there is a greater return of coarse particles at the ground level.
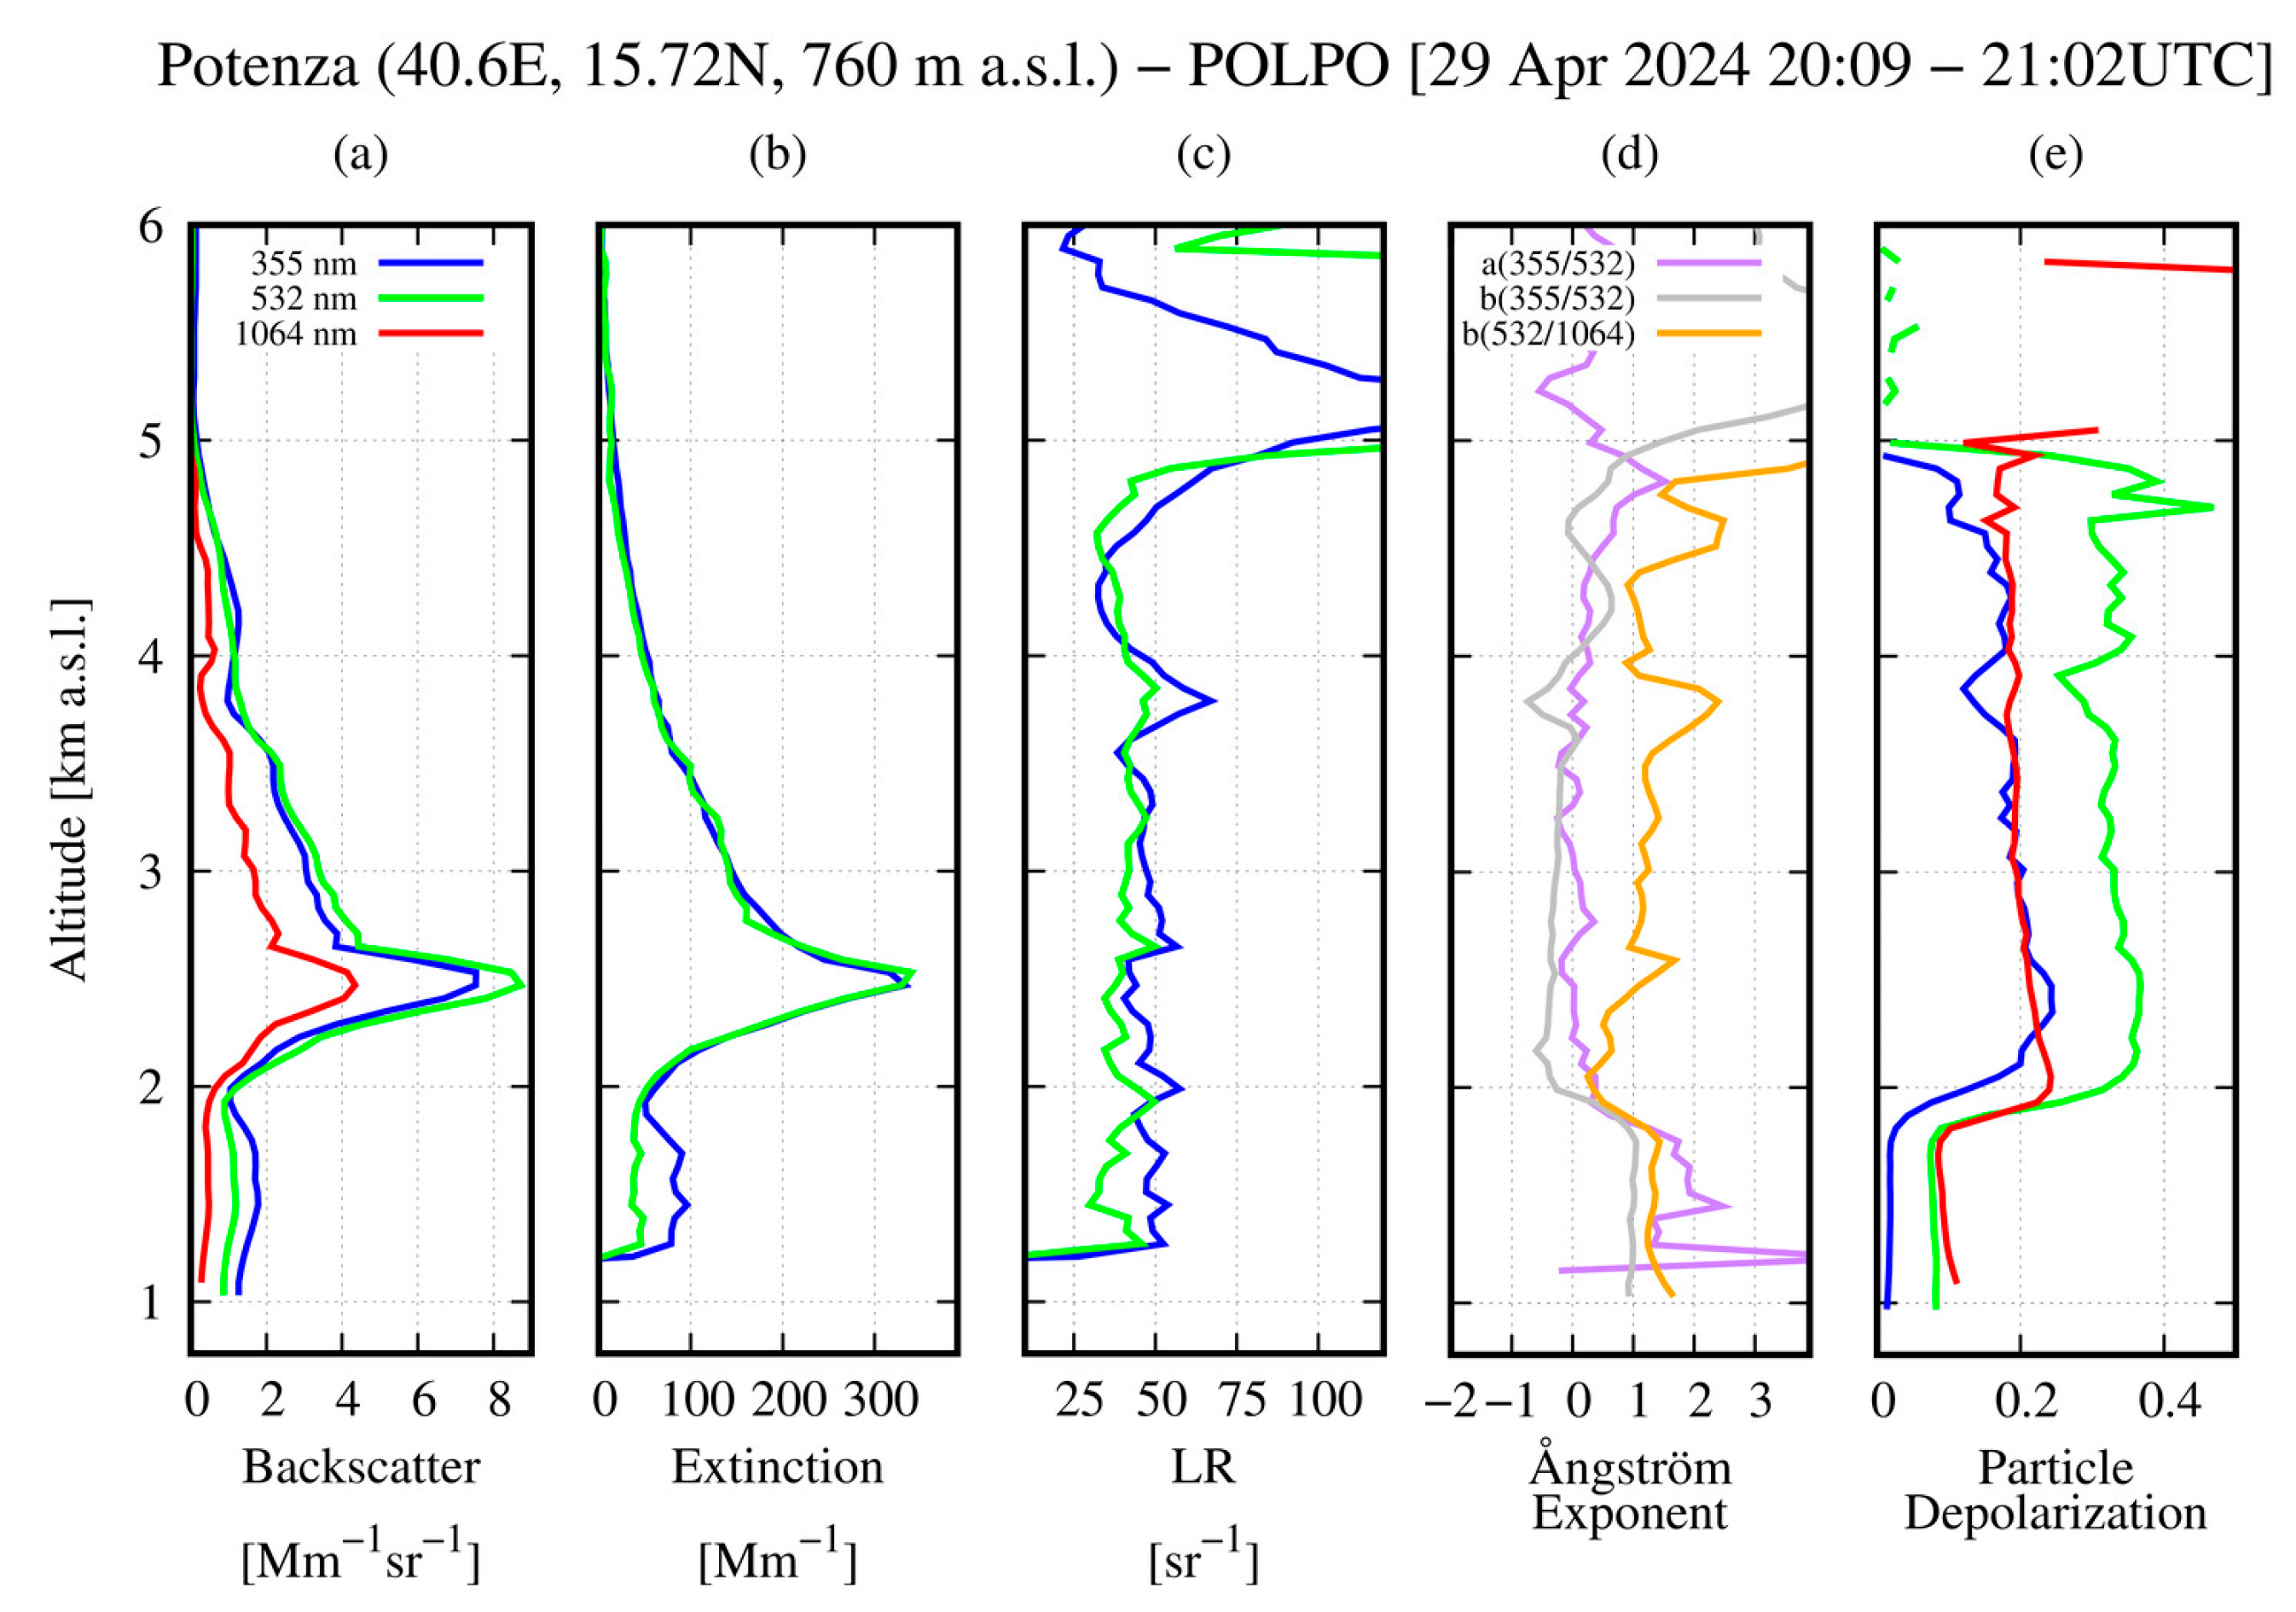
The inferred dust nature of the observed layer is supported by the vertical profiles in
Figure 3 illustrating multi-wavelength extensive (aerosol backscatter and extinction coefficients) and intensive (lidar ratio, extinction and backscatter-related Ångström exponents, and the particle linear depolarization ratio) aerosol optical properties as measured by POLPO. All the profiles have been obtained by averaging lidar measurements between 20:09 and 21:02 UTC on 29 April. The measured values of particle linear depolarization ratio (
Figure 3e), lidar ratio (
Figure 3c), and Ångström exponents (
Figure 3d) within the layer extending from 2 up to 5 km are typical for dust particles [
23,
30].
It is interesting to mention that the values of lidar ratio and Ångström exponent measured for the same layer on 28 April are slightly larger than the ones reported in
Figure 3. This appears to support the presence of slightly larger (and likely heavier) particles on 29 April compared to 28 April, which may explain why dust began intruding into the ABL more effectively on 29–30 April. Such a variation in dust layer properties could be due to a gradual decrease in mixing with smaller and lighter particles.
3.2. Case Study 2
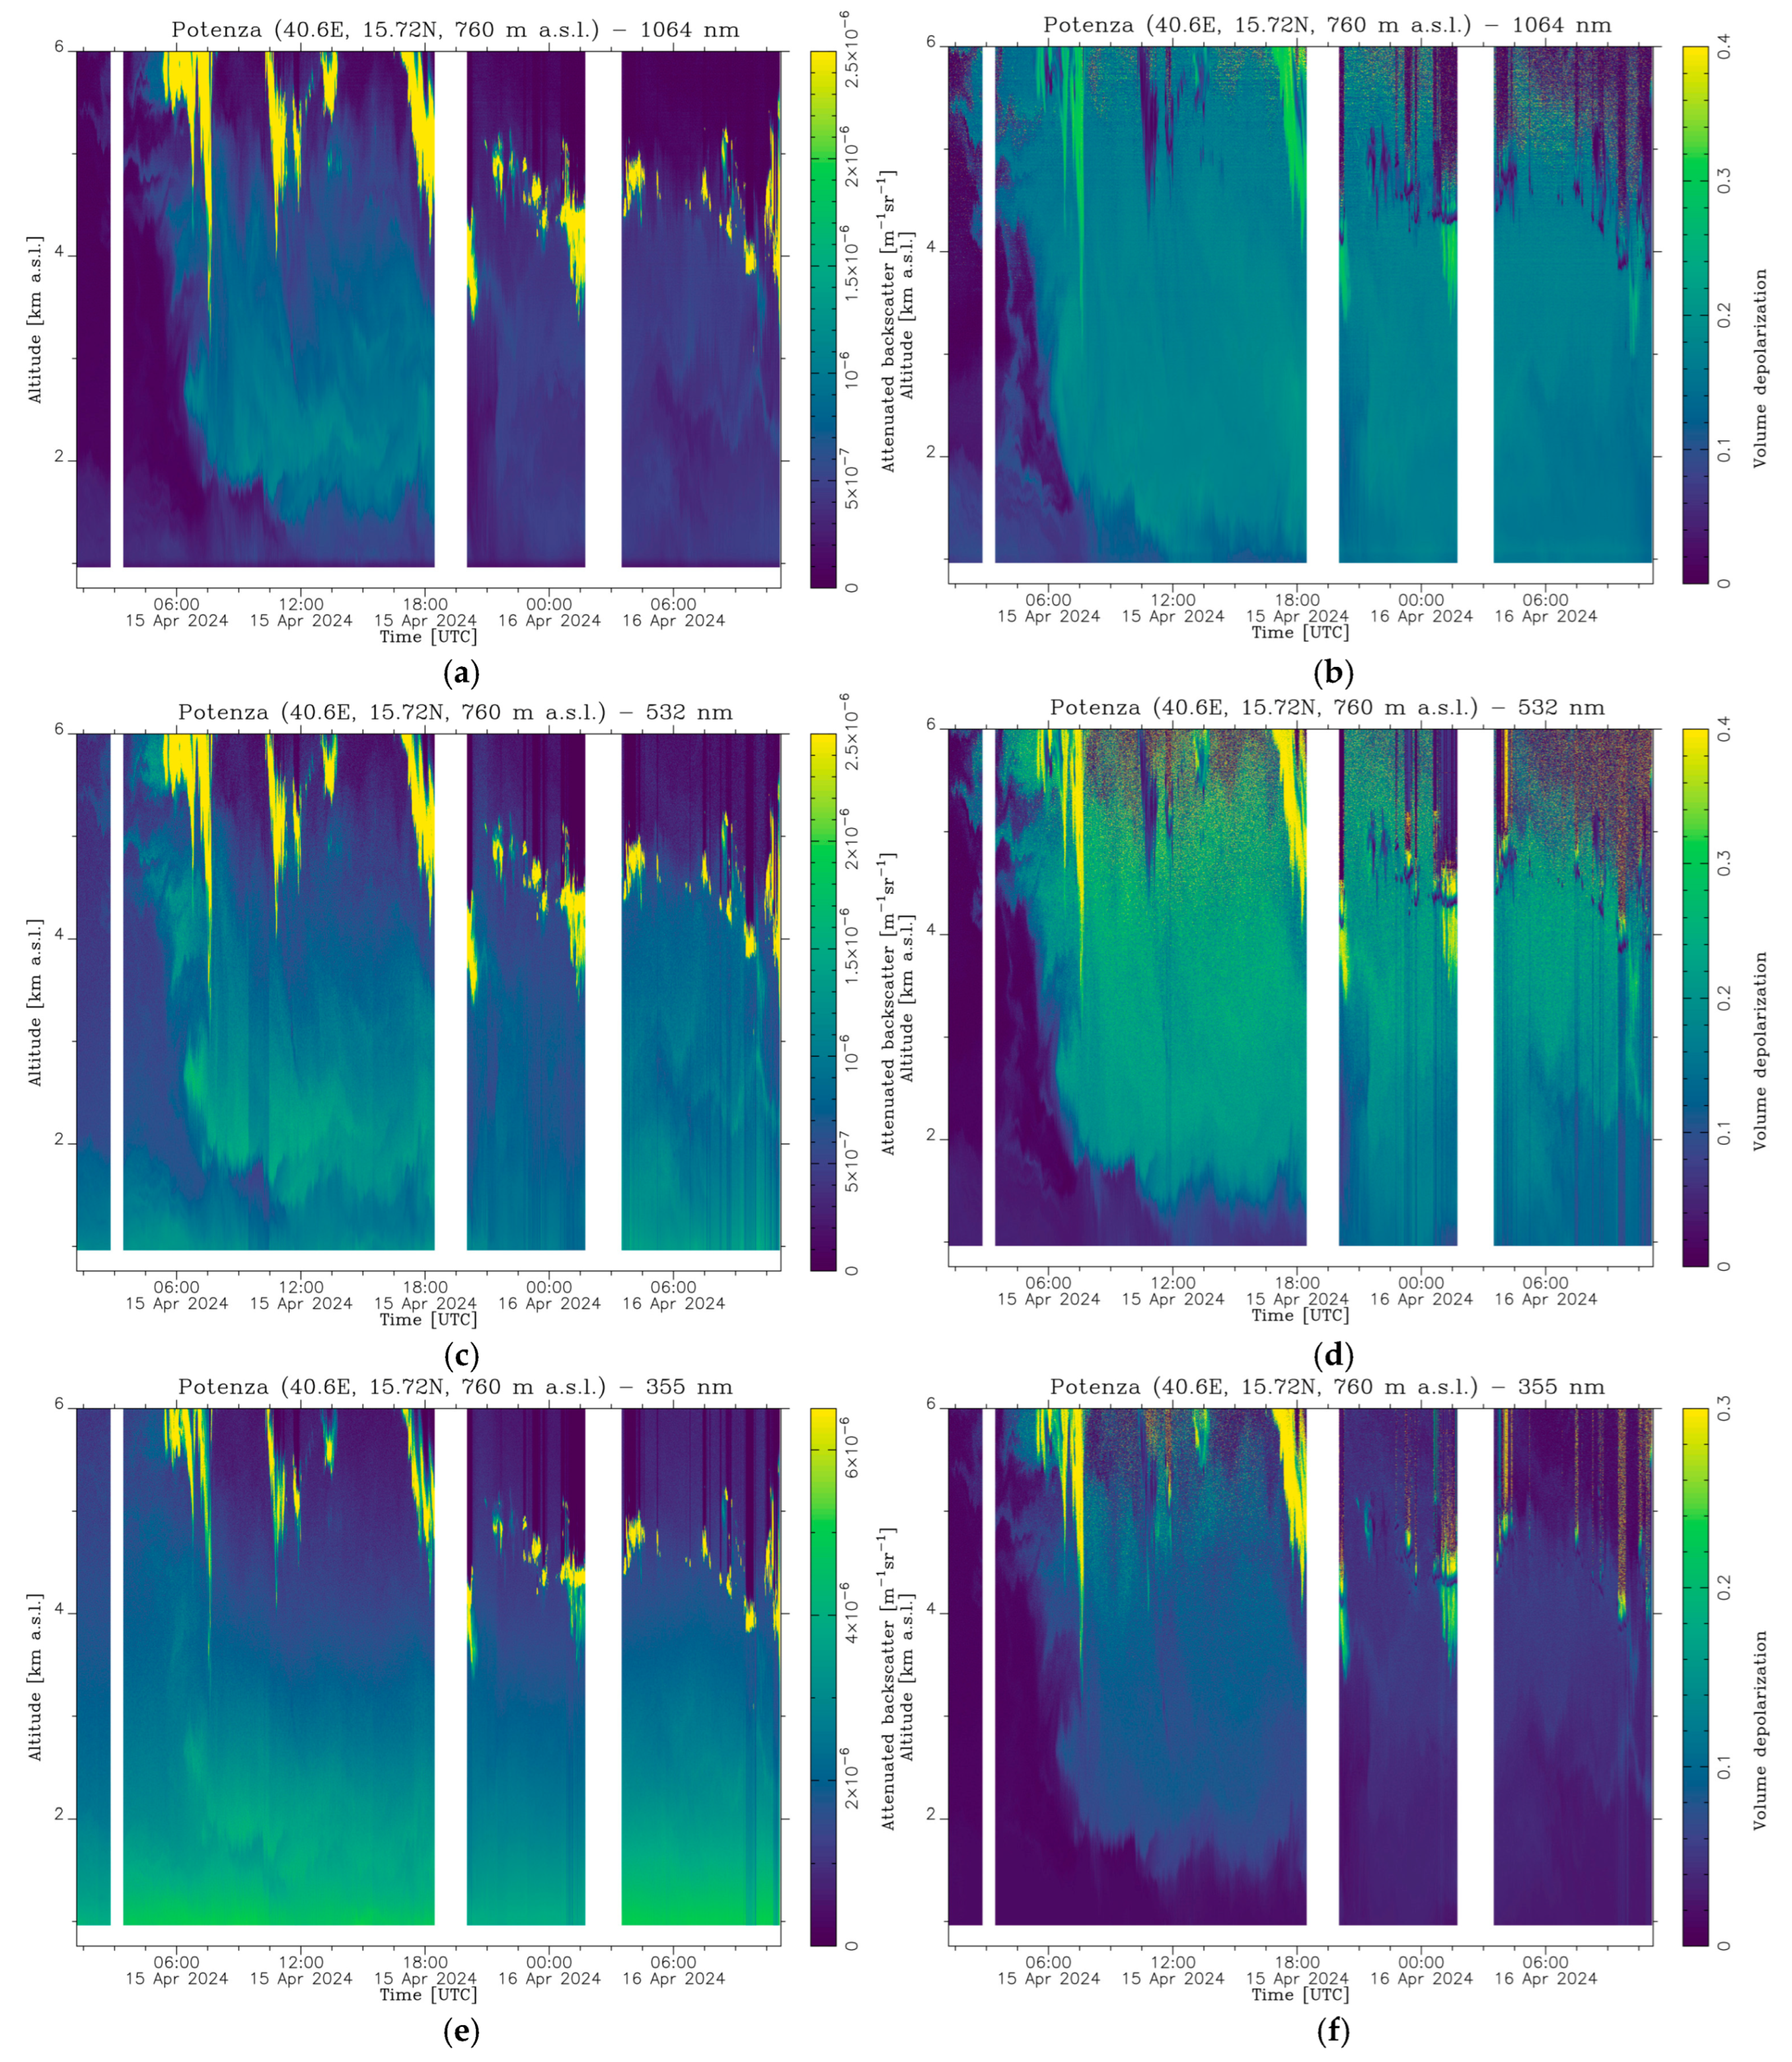
Case Study 2 focuses on 36 h of almost continuous AHL observations made by POLPO. It starts on 15 April 2024 at 00:00 UTC and ends on 16 April 2024 at 12:00 UTC.
Figure 4 shows the same quantities reported in
Figure 1, but for Case Study 2.
On 15 April, the plot shows a dust layer reaching the ground. This layer has a compressive effect on the ABL dynamics, as observed during Case Study 1, but with much stronger amplitude. This can be due to different dimensions of the particles included in the layer above the ABL in the two cases and/or to a less convective ABL regime. In this case, the presence of the layer does not allow the ABL to follow the typical diurnal evolution and consequently, it remains confined at heights below 1.5 km a.s.l. Additionally, the dust layer intrudes in the ABL, reaching the ground right after 12:00 UTC (this is particularly clear by looking at depolarization ratio values shown in
Figure 4). It is worth noting that during that day, dust was clearly visible at the measurement site, significantly reducing the visibility. During the next day (16 April), the dust layer was still present, but the concentration was reduced, and the ABL reached higher altitudes with respect to the previous day. In situ measurements reported in
Figure 5 support this hypothesis.
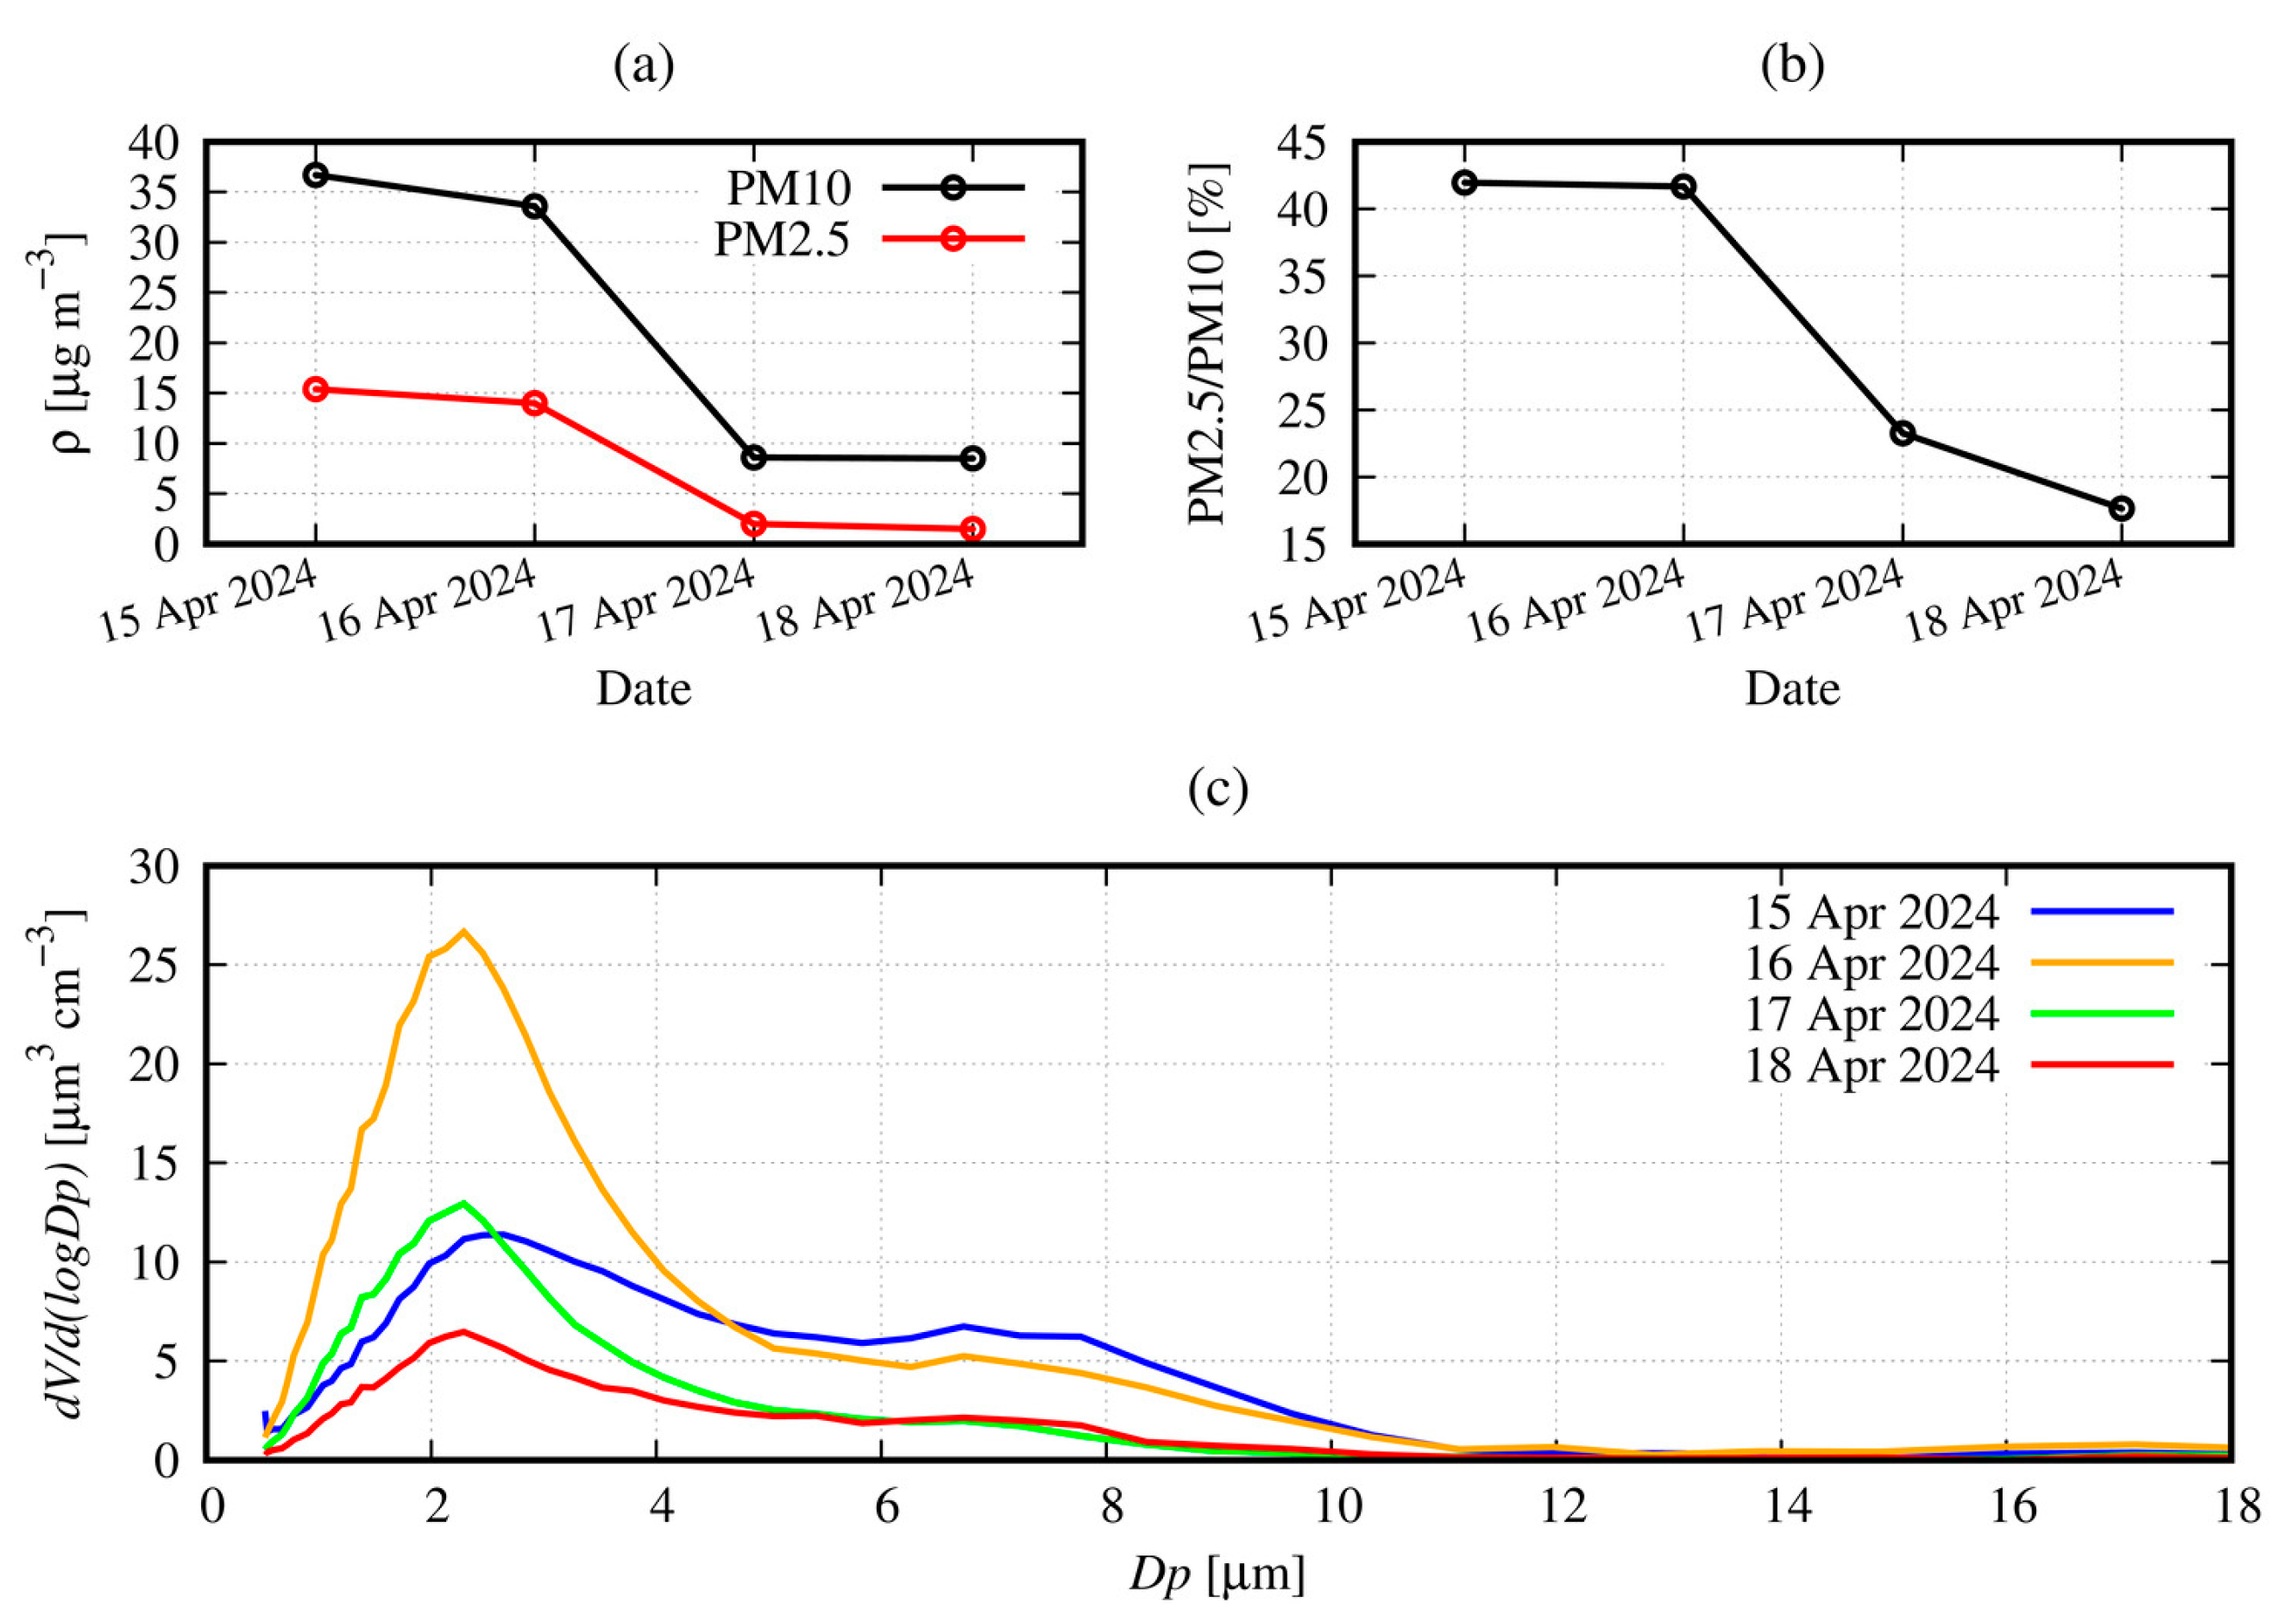
Figure 5a illustrates the timeseries of PM10 and PM2.5 concentrations from 15 April to 18 April, while
Figure 5b shows the percentage ratio of PM2.5/PM10 for the same period.
Figure 5a reveals the presence of higher PM concentrations on 15 April (PM10: 36.7 µg/m
3, PM2.5: 15.4 µg/m
3) and on 16 April (PM10: 33.6 µg/m
3, PM2.5: 14 µg/m
3) with respect to the following days, when the concentration of PM decreases significantly. Instead, in
Figure 5b it is interesting to note that the percentage ratio decreased from 42.0% on 15 April to 17.6% on 18 April. These results indicate that on 15 and 16 April there was a notable increase in both fine (<2.5 µm) and coarse (from 2.5 to 10 µm) particle concentrations. In the following days, even if the PM concentration decreased considerably, the contribution of coarse particles was larger than the one of fine particles, most likely due to a contribution of dust from higher levels of the atmosphere. This trend is confirmed by the daily averages of the aerodynamic particle size distribution obtained by the APS from 15 to 18 April, which are reported in
Figure 5c. The figure clearly illustrates that on 15 and especially on 16 April there was a notable increase in both fine and coarse particle concentration with respect to what happened during the following days.
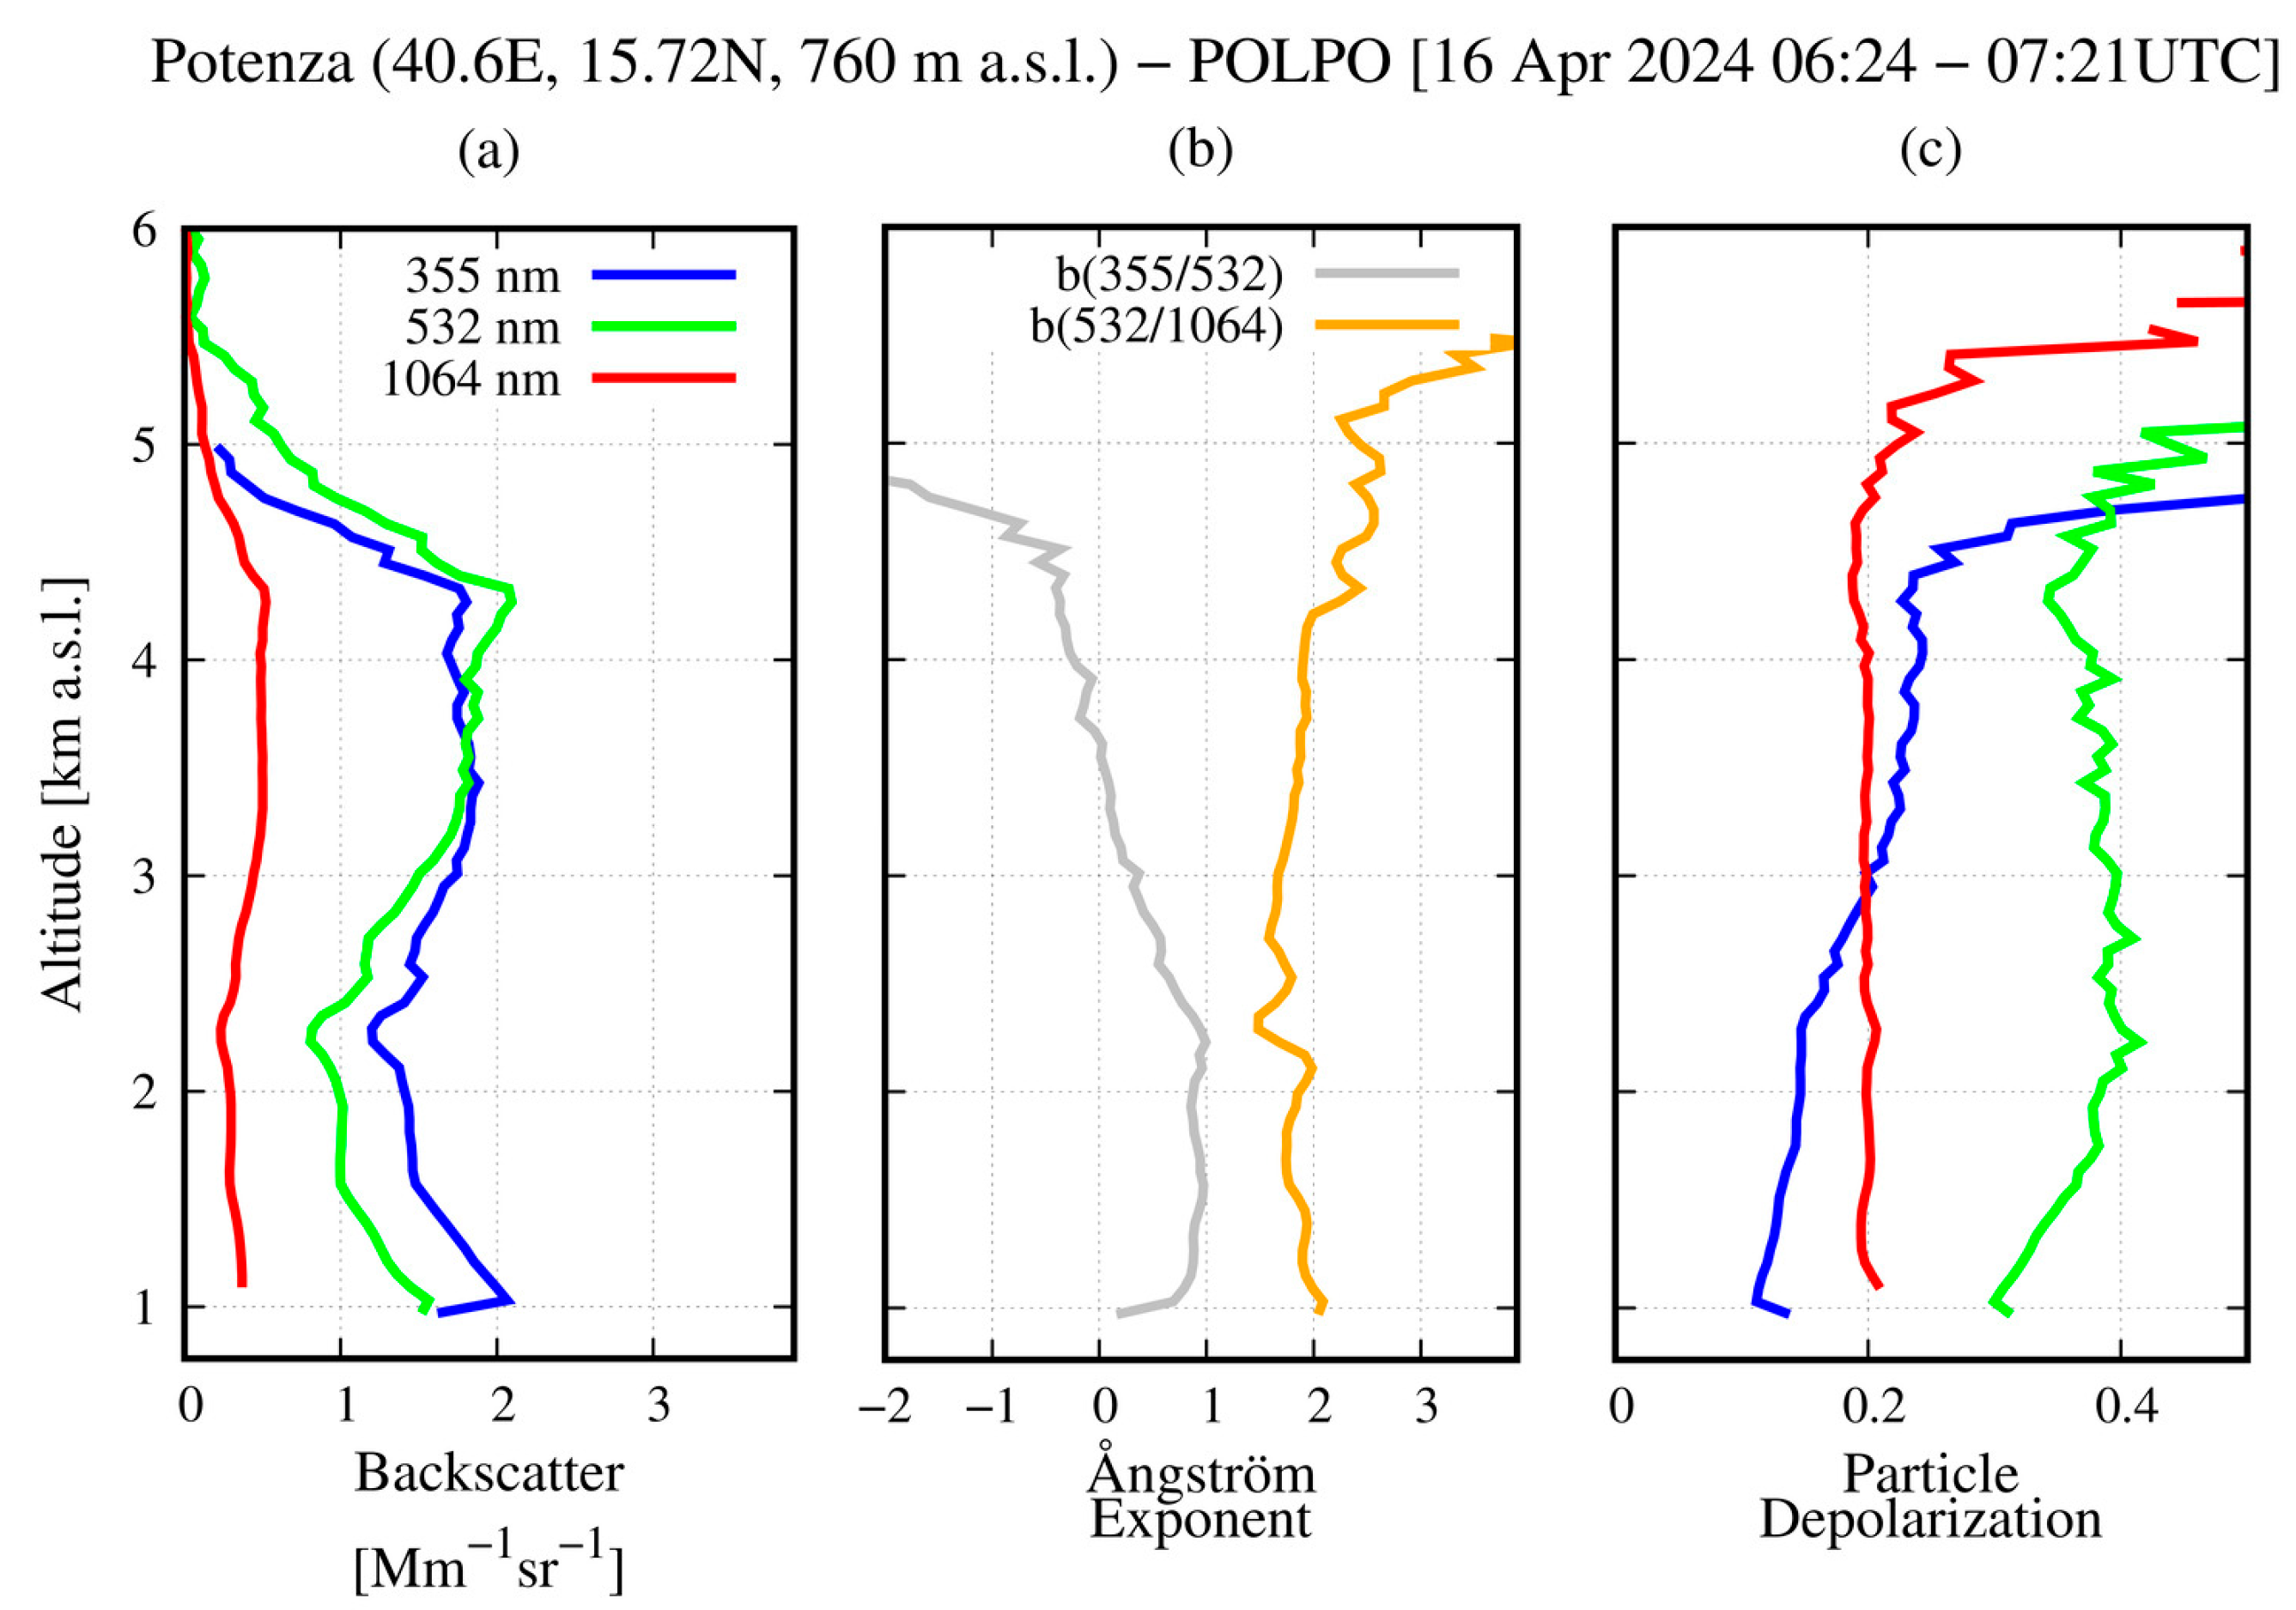
Furthermore, we report the intensive and extensive optical properties of the observed layer as measured by POLPO (
Figure 6) in daytime configuration (no Raman channels available). As before, the lidar observations indicate the presence of dust particles within the layer.
Finally,
Figure 4 indicates the presence of several clouds on the top of the dust layer, presumably formed by heterogeneous nucleation on dust particles [
31,
32]. Moreover, right below the clouds, there are regions where the attenuated backscatter values decrease temporarily (see, for example, region below 3.5 km a.s.l. at about 20:00 UTC on 15 April). These regions might be explained by scavenging induced by drizzle falling from clouds, which evaporates in the atmosphere. The aforementioned process is particularly interesting for the study of aerosol-cloud interactions [
33], which need further investigation beyond the scope of this report.
3.3. Case Study 3
Case Study 3 is characterized by different atmospheric conditions with respect to the previous case studies.
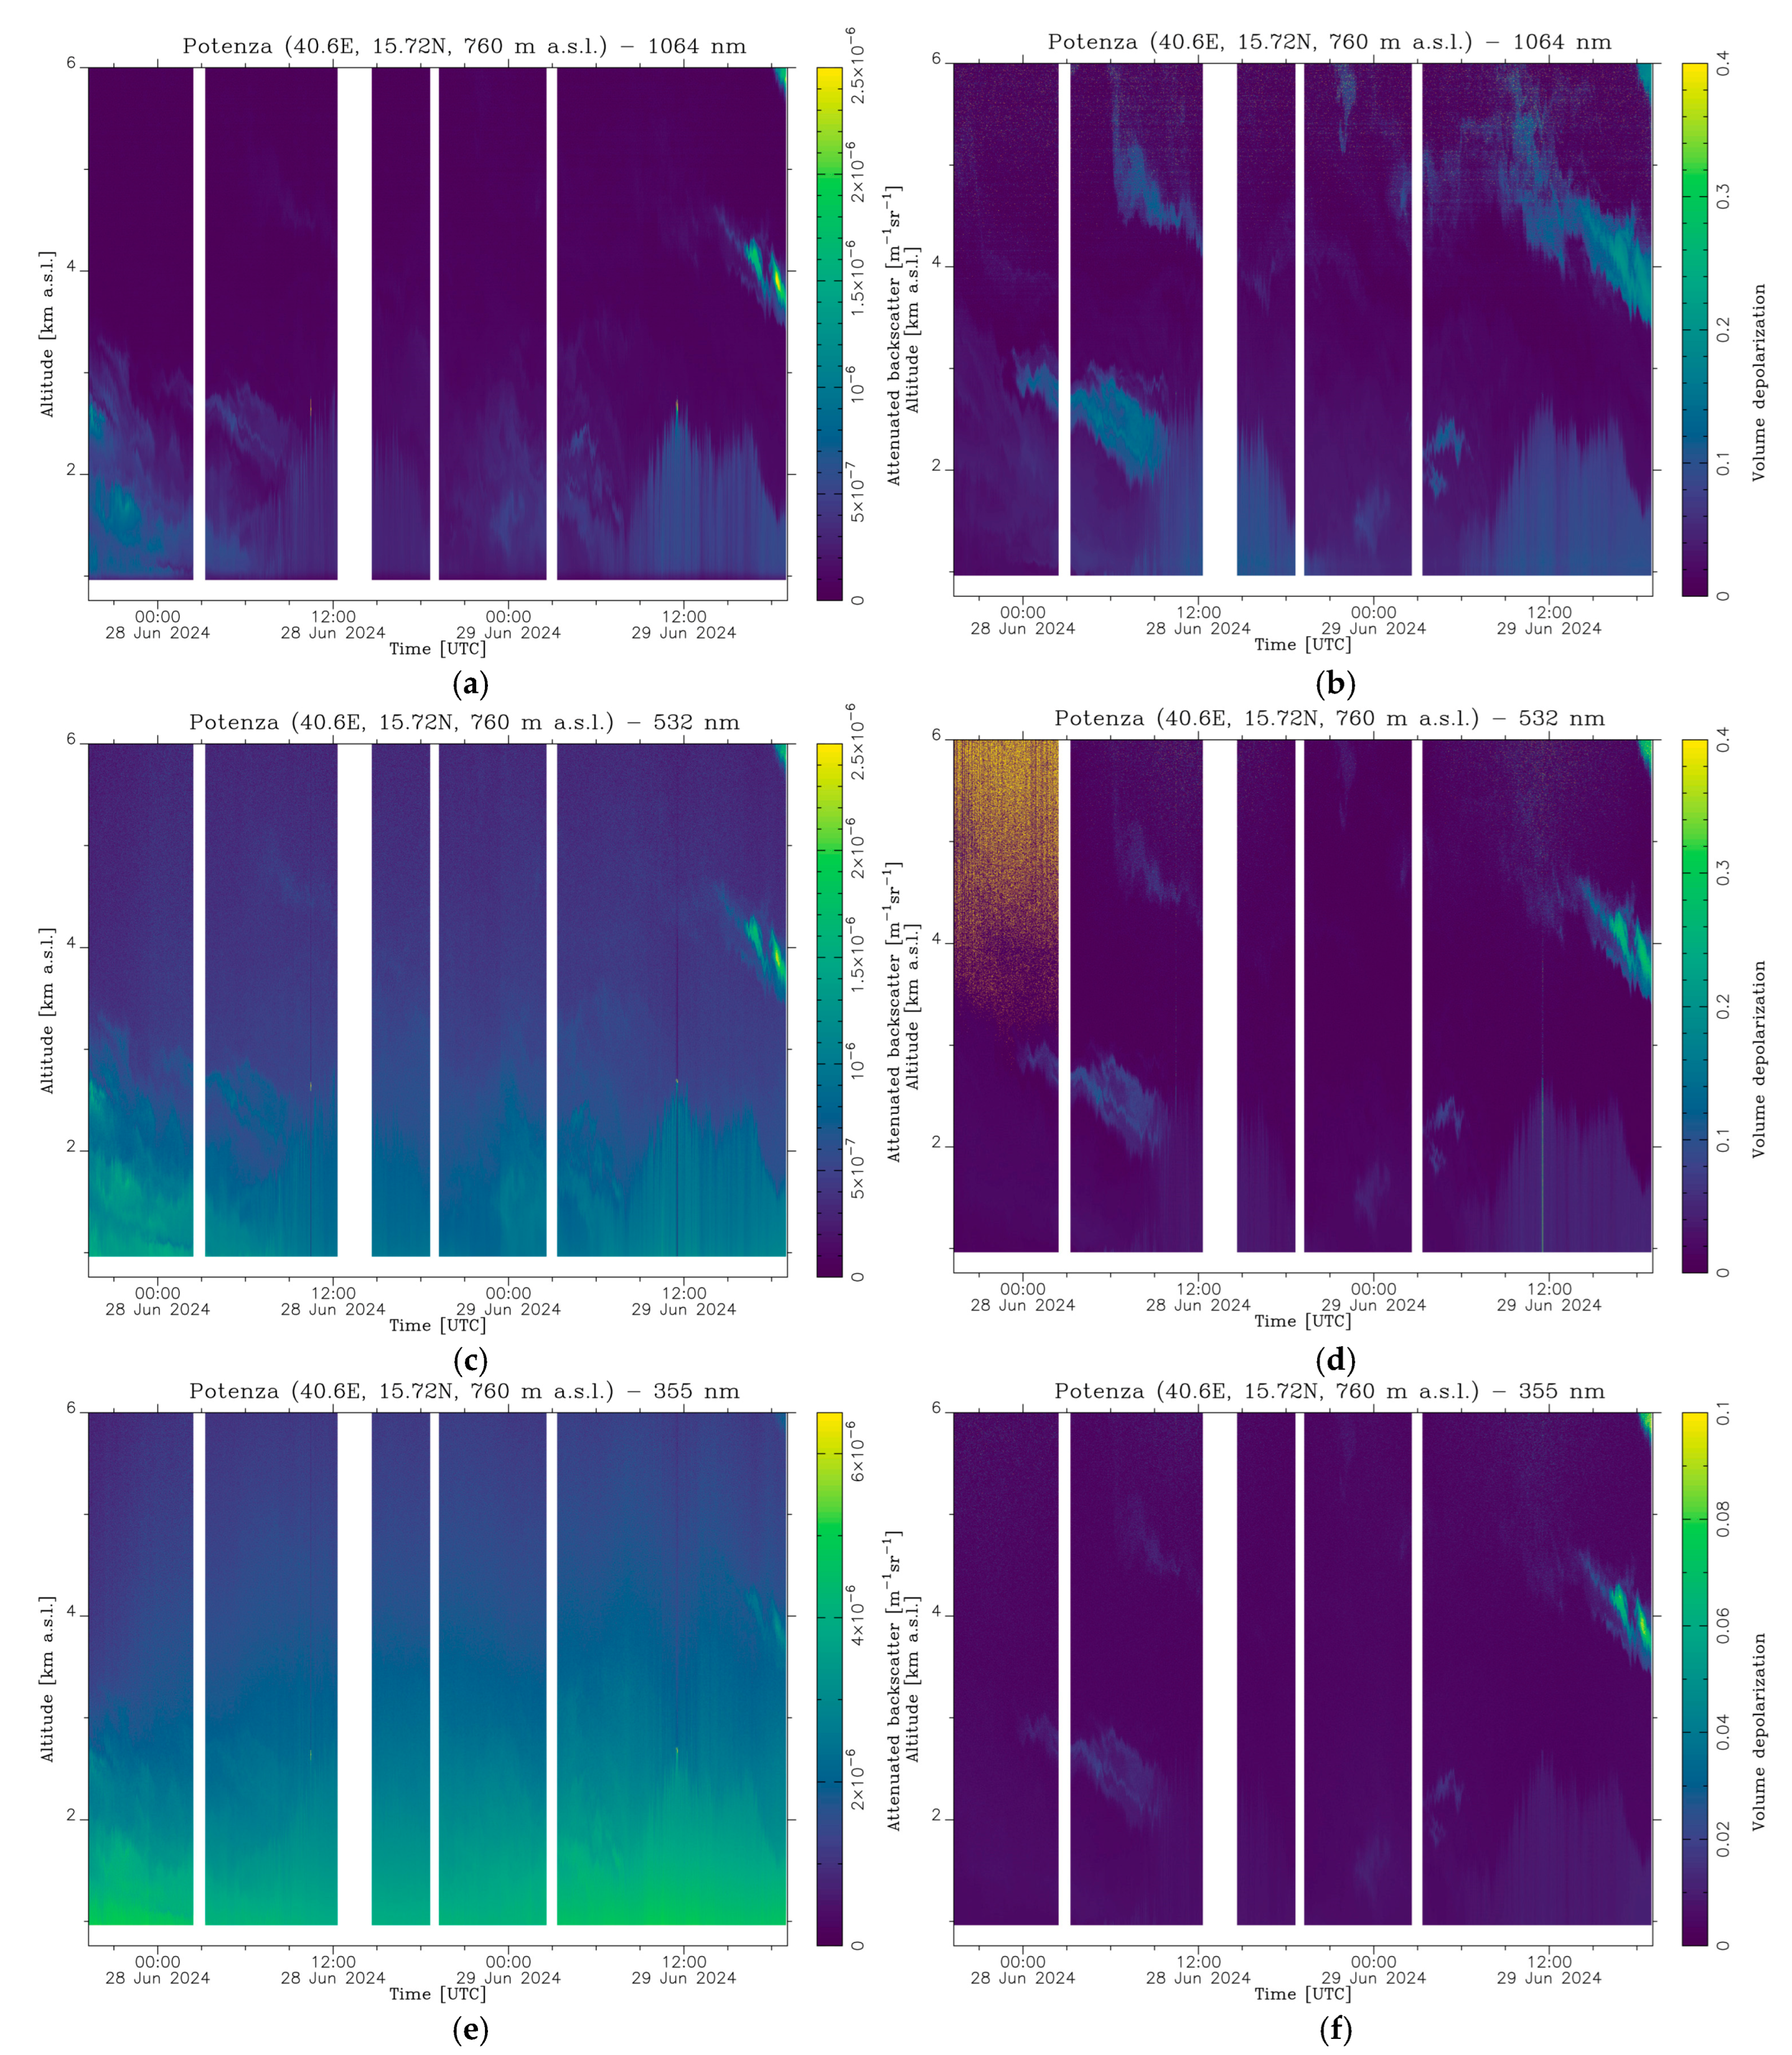
Figure 7 shows the timeseries of attenuated backscatter and of volume depolarization ratio profiles measured by POLPO at all available wavelengths. The typical diurnal development of ABL occurring during the two considered days (28 and 29 June) is less affected by the presence of aerosol layers located above the ABL, which is different from Case Study 1 and Case Study 2. As this case study is characterized by less complex atmospheric conditions, we do not provide a detailed description as we did for the previous ones. Additionally, Case Study 3 allows us to test the performance of MIPA in a cleaner atmosphere, in terms of aerosol load, compared to what we previously observed. This is particularly important because, on one hand, the estimation of the ABLH is expected to be less complex than the other two case studies due to fewer interactions between ABL and other aerosol layers; on the other hand, the aerosol content is generally lower. Consequently, Case Study 3 offers us the possibility to investigate the accuracy of the proposed methodology when the tracers used to characterize the ABLH are less abundant.
3.4. Reference Dataset
We use as reference the ABLH values derived from high vertical resolution (5 m) radiosonde data, computed using the algorithm presented in [
34], that relies on both potential temperature and horizontal wind vertical profiles. It is important to underline that this algorithm delivers ABLH on the basis of a thermodynamical definition of ABL. Basically, the algorithm first identifies the ABL regime by examining the near-surface thermal gradient (difference in potential temperature) between two pre-selected close levels. Using specific threshold values, three different regimes can be determined: unstable regime (convective boundary layer), stable regime (stable boundary layer), and neutral regime (neutral residual layer).
Depending on the regime, different procedures are applied to retrieve the ABLH.
For an unstable or neutral regime, the ABLH is determined at the height at which an air parcel rising adiabatically from the ground becomes neutrally buoyant (again considering potential temperature variation). This level is considered as a first guess and is subsequently refined by applying a threshold criterion to the first derivative of the potential temperature.
For the stable regime, the ABLH is determined by applying specific thresholds to both the first derivative of potential temperature and to horizontal wind differences.
Further details about this algorithm can be found in [
34].
In
Table 1, all radiosoundings performed in correspondence with the considered case studies are summarized. The soundings are grouped by day. For each day, the launch time (UTC) and the corresponding ABLH (m a.s.l.), calculated by applying the described algorithm, are reported. Consequently,
Table 1 provides the ABLH reference dataset we have used for the optimization/validation of MIPA.
4. MIPA Description
A full description of the MIPA (Morphological Image Processing Approach) algorithm for the ABLH retrieval is provided in [
19]. In this section, for completeness, we recall its main characteristics. The image on which MIPA is applied consists of the temporal sequence of vertically resolved attenuated backscatter lidar profiles. Attenuated backscatter vertical profiles can be computed from the measured lidar signals. More precisely, neglecting the overlap correction, the elastically backscattered lidar signal is given by [
35]:
where
λ is the elastic wavelength,
z the altitude above lidar station,
P the collected power measured by the lidar,
βp and
βm the particle and molecular backscattering coefficient, respectively,
T the atmospheric transmissivity considering extinction from both molecules and particles, and
C is a calibration constant related to the total (both optical and electronical) efficiency of the lidar channel.
By defining the attenuated backscatter (
ABS) as:
According to Equation (3), the ABS is obtained by computing the range-corrected lidar signal (i.e., multiplying the collected power for the corresponding square of the range) and dividing by the calibration constant C. Such a constant can be determined by imposing that in an aerosol-free region, the ABS is given by molecular contribution (which can be calculated using the Rayleigh theory).
From Equation (2), besides the transmissivity term, the ABS is given by the sum of particle and molecular backscatter coefficients, which in turn are proportional to the concentrations of atmospheric particles and molecules. As is usually the case, the atmospheric particle concentration varies much faster with the altitude z compared to the molecular concentration. Hence, as a good approximation, ABS can be considered as a proxy to trace aerosol presence, as in fact changes in ABS are primarily associated with changes in aerosol content. This makes the ABS an effective physical quantity to retrieve the ABLH from lidar observations, as it can be measured with high resolution in both time and space. Consequently, ABS has been used as the main input for MIPA.
It is important to recall that MIPA operates without any prior knowledge of the ABLH and relies on the following steps:
Dynamic range compression, performed by applying a clipping operation based on percentiles (typically between 95 and 99 for the upper limit), followed by normalization to scale the values between 0 and 1.
Vertical resolution reduction, applied only if the raw vertical spatial resolution is finer than 20 m.
Pre-processing of the lidar data exploiting mathematical morphology operations.
Edge detection using the Canny method [
36], applied to the pre-processed lidar data.
Post-processing, starting from the detected edges and based on both mathematical morphology and object-based analysis to extract the final ABLH estimate.
More precisely, the algorithm takes as input an image representing the timeseries of
ABS profiles measured by the lidar system. Such an image is a two-dimensional matrix, where the number of rows is related to the considered vertical interval and the spatial resolution of the system, whereas the number of columns is related to the temporal resolution, based on the interval at which lidar measurements are taken. The dynamic range of the input image is optimized by applying a clipping operation that uses the percentile
P as the upper limit. All pixels with intensity values larger than the percentile
P are set to the intensity value corresponding to the percentile
P. This ensures that edges associated with aerosol layers (i.e., the ones identifying possible ABLH candidates) produce gradient magnitudes within the range defined by the two fixed thresholds used in the Canny edge detector, enabling their identification as potential ABLH candidates. By clipping the intensity values of the input image, we limit the influence of very bright regions (typically clouds), preventing them from dominating the gradient magnitudes during subsequent edge detection and allowing the algorithm to better focus on edges of interest. The next step involves down-sampling, applied column by column, to reduce the vertical spatial resolution of the bins. This down-sampling operation is performed by applying a low-pass filter implemented as a moving average. The filter support (i.e., the length of the sliding window) is denoted by
R, which serves as the sole tunable parameter.
R is chosen to ensure that the spatial resolution is no finer than 20 m. This choice helps to avoid multiple edges corresponding to the same atmospheric layer, resulting in sharper and uniquely identifiable edges. Afterwards, the down-sampled image undergoes further processing through a low-pass morphological filter based on half-gradients, which corresponds to the semi-sum of morphological operators: dilation and erosion [
37]. This filter is applied using a horizontal line as the structuring element (SE), i.e., along the time axis, with length
lpre. This approach smooths the lidar image along the horizontal (i.e., temporal) direction, where the dynamic of the ABL is relatively slow, thereby reducing unwanted fluctuations along the horizontal axis, while preserving vertical edges that are crucial for the subsequent steps.
As a next step, an edge detector is applied to the pre-processed image. We employed Canny’s edge detector (the classical version available in commercial software such as MATLAB, vR2024b) to get the first (coarse) estimation of the edge map. The two thresholds (high threshold thh and low threshold thl) defined in the Canny algorithm have been kept fixed to the default values (thh = 0.7; thl = 0.4thh). Edges detected by the algorithm are indicated with 1, while the rest of the map (background) is labeled as 0. All the bins labeled as 1 are considered potential candidates for representing the ABLH.
Finally, the detected edge map is further analyzed using signal processing techniques:
Morphological filter post-processing: this processing step aims to remove unrealistic edges (i.e., edges that vary too fast with respect to the dynamics of the ABL). To achieve this, we apply a series of directional low-pass morphological filters. These filters are constructed by sequentially applying opening and closing operations, using a line-shaped SE with length lpost and orientation angle θ relative to the horizontal direction. The angle θ varies within the range of θmin to θmax.
Object-based post-processing: as mentioned earlier, detected edges are indicated with 1, while the rest of the map (background) is labeled as 0. We analyze these edges by extracting connected objects. The main concept relies on the connectivity within the edge map, i.e., how the bins labeled as “edge” are spatially related to their neighbors. A bin labeled as “edge” is considered 8-connected if at least one of its eight neighboring bins (adjacent vertically, horizontally, or diagonally) is also labeled as an edge. All bins that are 8-connected to each other form a connected object. Thus, several objects, obtained by clustering the bins declared as “edges”, are collected and analyzed. Specifically, we evaluate the spatial variability of these objects by comparing the absolute Euclidean distance between the mean height of each object and the mean height of the neighboring objects. If this distance exceeds a threshold, δpost, the object is removed from the pool of the solution set. Finally, the MIPA outcome, i.e., the estimated ABLH, is obtained by linearly interpolating the remaining objects in the edge map.
More details about MIPA can be found in [
19], where a flowchart of the algorithm is also available (see
Figure 1 in [
19]).
5. MIPA Validation
In this section, we discuss how MIPA has been validated and optimized considering the datasets corresponding to the three optimal case studies discussed in
Section 3. It is worth noting that the case studies meet all the technical requirements for MIPA applicability discussed in
Section 2. However, in Case Studies 1 and 2, the presence of intense dust intrusions presents a significant challenge for evaluating MIPA’s capability to accurately retrieve the ABLH under complex atmospheric conditions. Additionally, Case Study 3 refers to a low aerosol load situation, providing a common and representative scenario for the validation of MIPA.
To identify the optimal MIPA configuration, we varied all the parameters described in
Section 3 and calculated the differences between the ABLH values retrieved by MIPA and the corresponding reference values derived from the radiosoundings. We consider optimal the configuration that minimizes the mean square of such differences. This operation was performed separately for the wavelengths of 355 nm, 532 nm, and 1064 nm. The corresponding results are summarized in
Table 2.
As expected, the optimized maximum percentile used for clipping is very similar for the 1064 nm and 532 nm wavelengths, while it is slightly higher for the 355 nm wavelength. This is a consequence of the decreasing contrast of the particle-to-molecular lidar signal as the wavelength decreases. At 355 nm, where such contrast is the lowest, less clipping is required to get ABLH-related edges (i.e., edges produced from aerosol layers) that are compatible with default Canny threshold values. As described in
Table 2, the parameter
P is the only one for which the corresponding optimized value depends on the input wavelength.
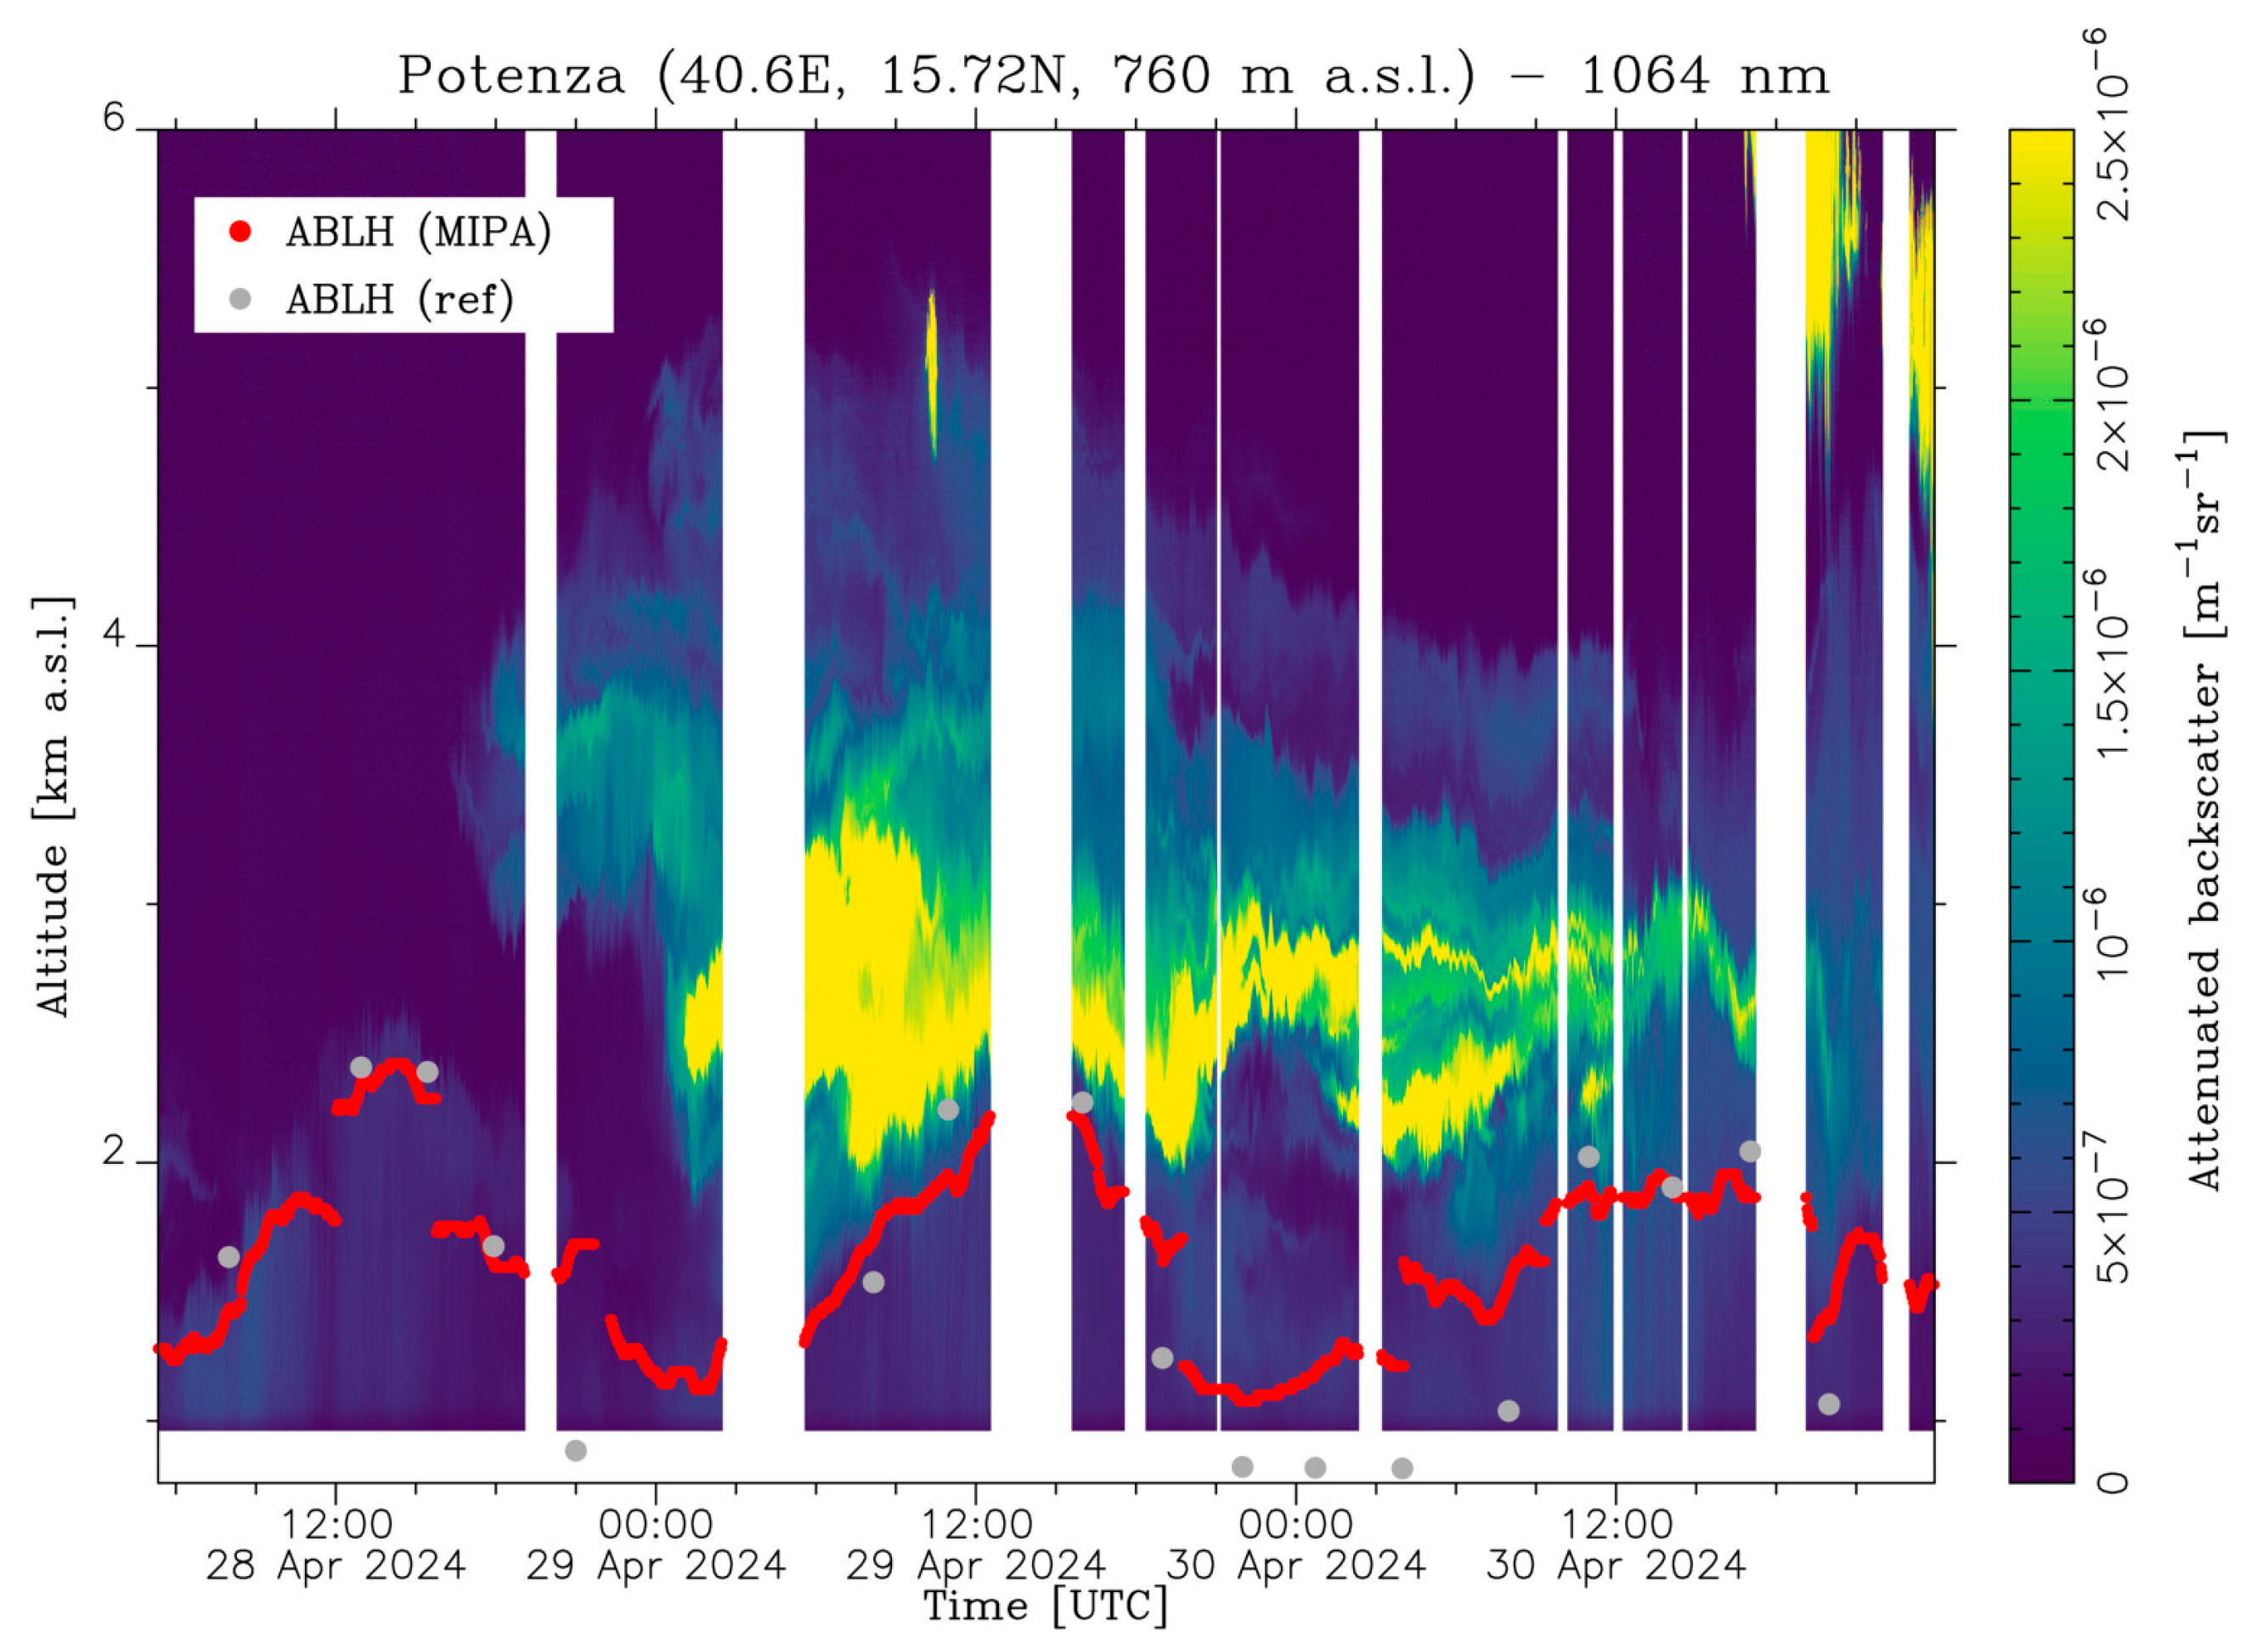
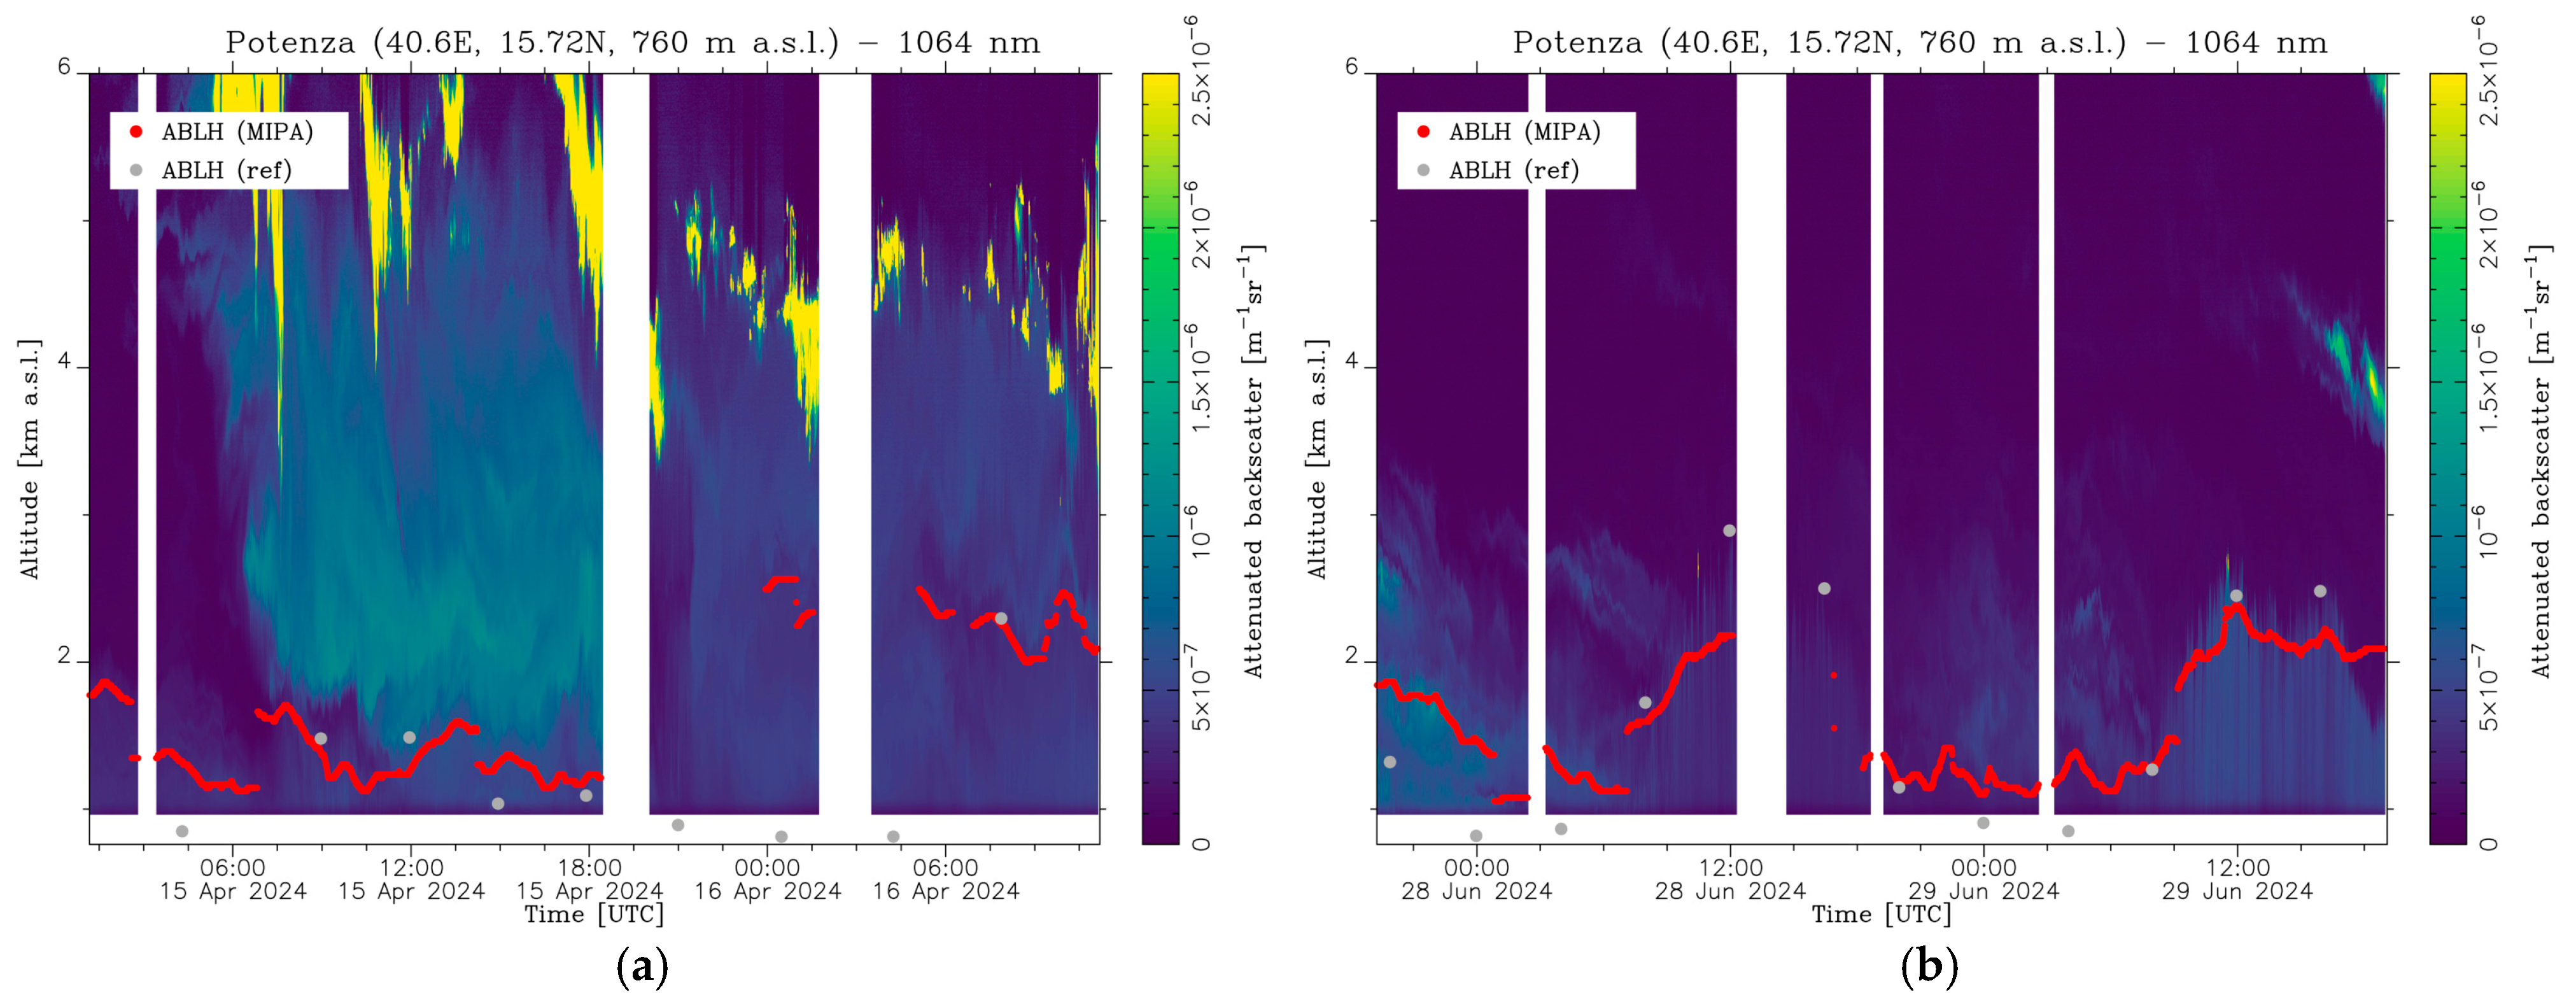
Figure 8 shows the ABLH retrieved by MIPA (red curve) when applied to the
ABS timeseries at 1064 nm for Case Study 1, which is also displayed in the figure as a colormap. It is worth noting that the results shown were obtained by MIPA using the optimized configuration parameters reported in
Table 2. Gray dots in
Figure 8 represent the reference ABLH dataset given in
Table 1, calculated according to the methodology described in
Section 3.4 using radiosonde data. Later in this session, MIPA performance is evaluated against this reference based on the computations of absolute differences (biases).
During the night, MIPA tends to overestimate ABLH values compared to the reference as a result of the considered approach. It is, in fact, to be recalled that MIPA retrieves the ABLH as the top of the first detected aerosol layer. This approach is valid only if the ABLH is located above the lidar full overlap region. Therefore, the algorithm identifies the ABLH as the first edge, the base of the layer close to the ABL top. Consequently, the overestimation observed during nighttime is due to a limitation of the input dataset rather than the algorithm itself, which would ideally provide ABLH estimates as accurate as during daytime if the lidar measurements covered the altitude regions closer to the ground.
Besides the elastic backscatter signal at 1064 nm, POLPO can also measure elastic backscatter signal at shorter wavelengths (355 nm and 532 nm). In general, the longer the wavelength, the better the accuracy of the retrieved ABLH, independently from the methodology/algorithm used. This is because molecular and particle scattering show different spectral dependence. According to the Rayleigh theory, the molecular scattering cross-section has a
λ−4 wavelength dependence [
35]. On the other hand, the particle scattering cross-section has a spectral dependence described by
λ−k, where
k is the Ångström exponent that depends mainly on particle size [
35]. Typical values of
k for atmospheric aerosols range from 0–1 (for large particles like dust or ash) to 2–3 (for smaller particles like pollution). Consequently, as the wavelength increases, the intensity of the scattered signal by molecules decreases faster than the one scattered by particles. Thus, according to Equation (2), the longer the wavelength, the higher the contribution of the particles in the
ABS with respect to molecules. Since the lidar ABLH retrieval methodology uses particles as tracers of the atmospheric boundary layer, the most accurate ABLH estimations are expected when the longest available lidar wavelength is used. However, in this study we do not limit the application of MIPA only to the longest wavelength (1064 nm), but we also evaluate the performance of MIPA on the other two available shorter wavelengths (355 nm and 532 nm). In this way, it is possible to evaluate the limit in terms of the spectral region where both the algorithm and the scientific methodology are suitable for accurately retrieving the ABLH. Additionally, assessing MIPA on wavelengths other than 1064 nm makes possible the use of the algorithm also for lidar systems that are not equipped with the 1064 nm channel.
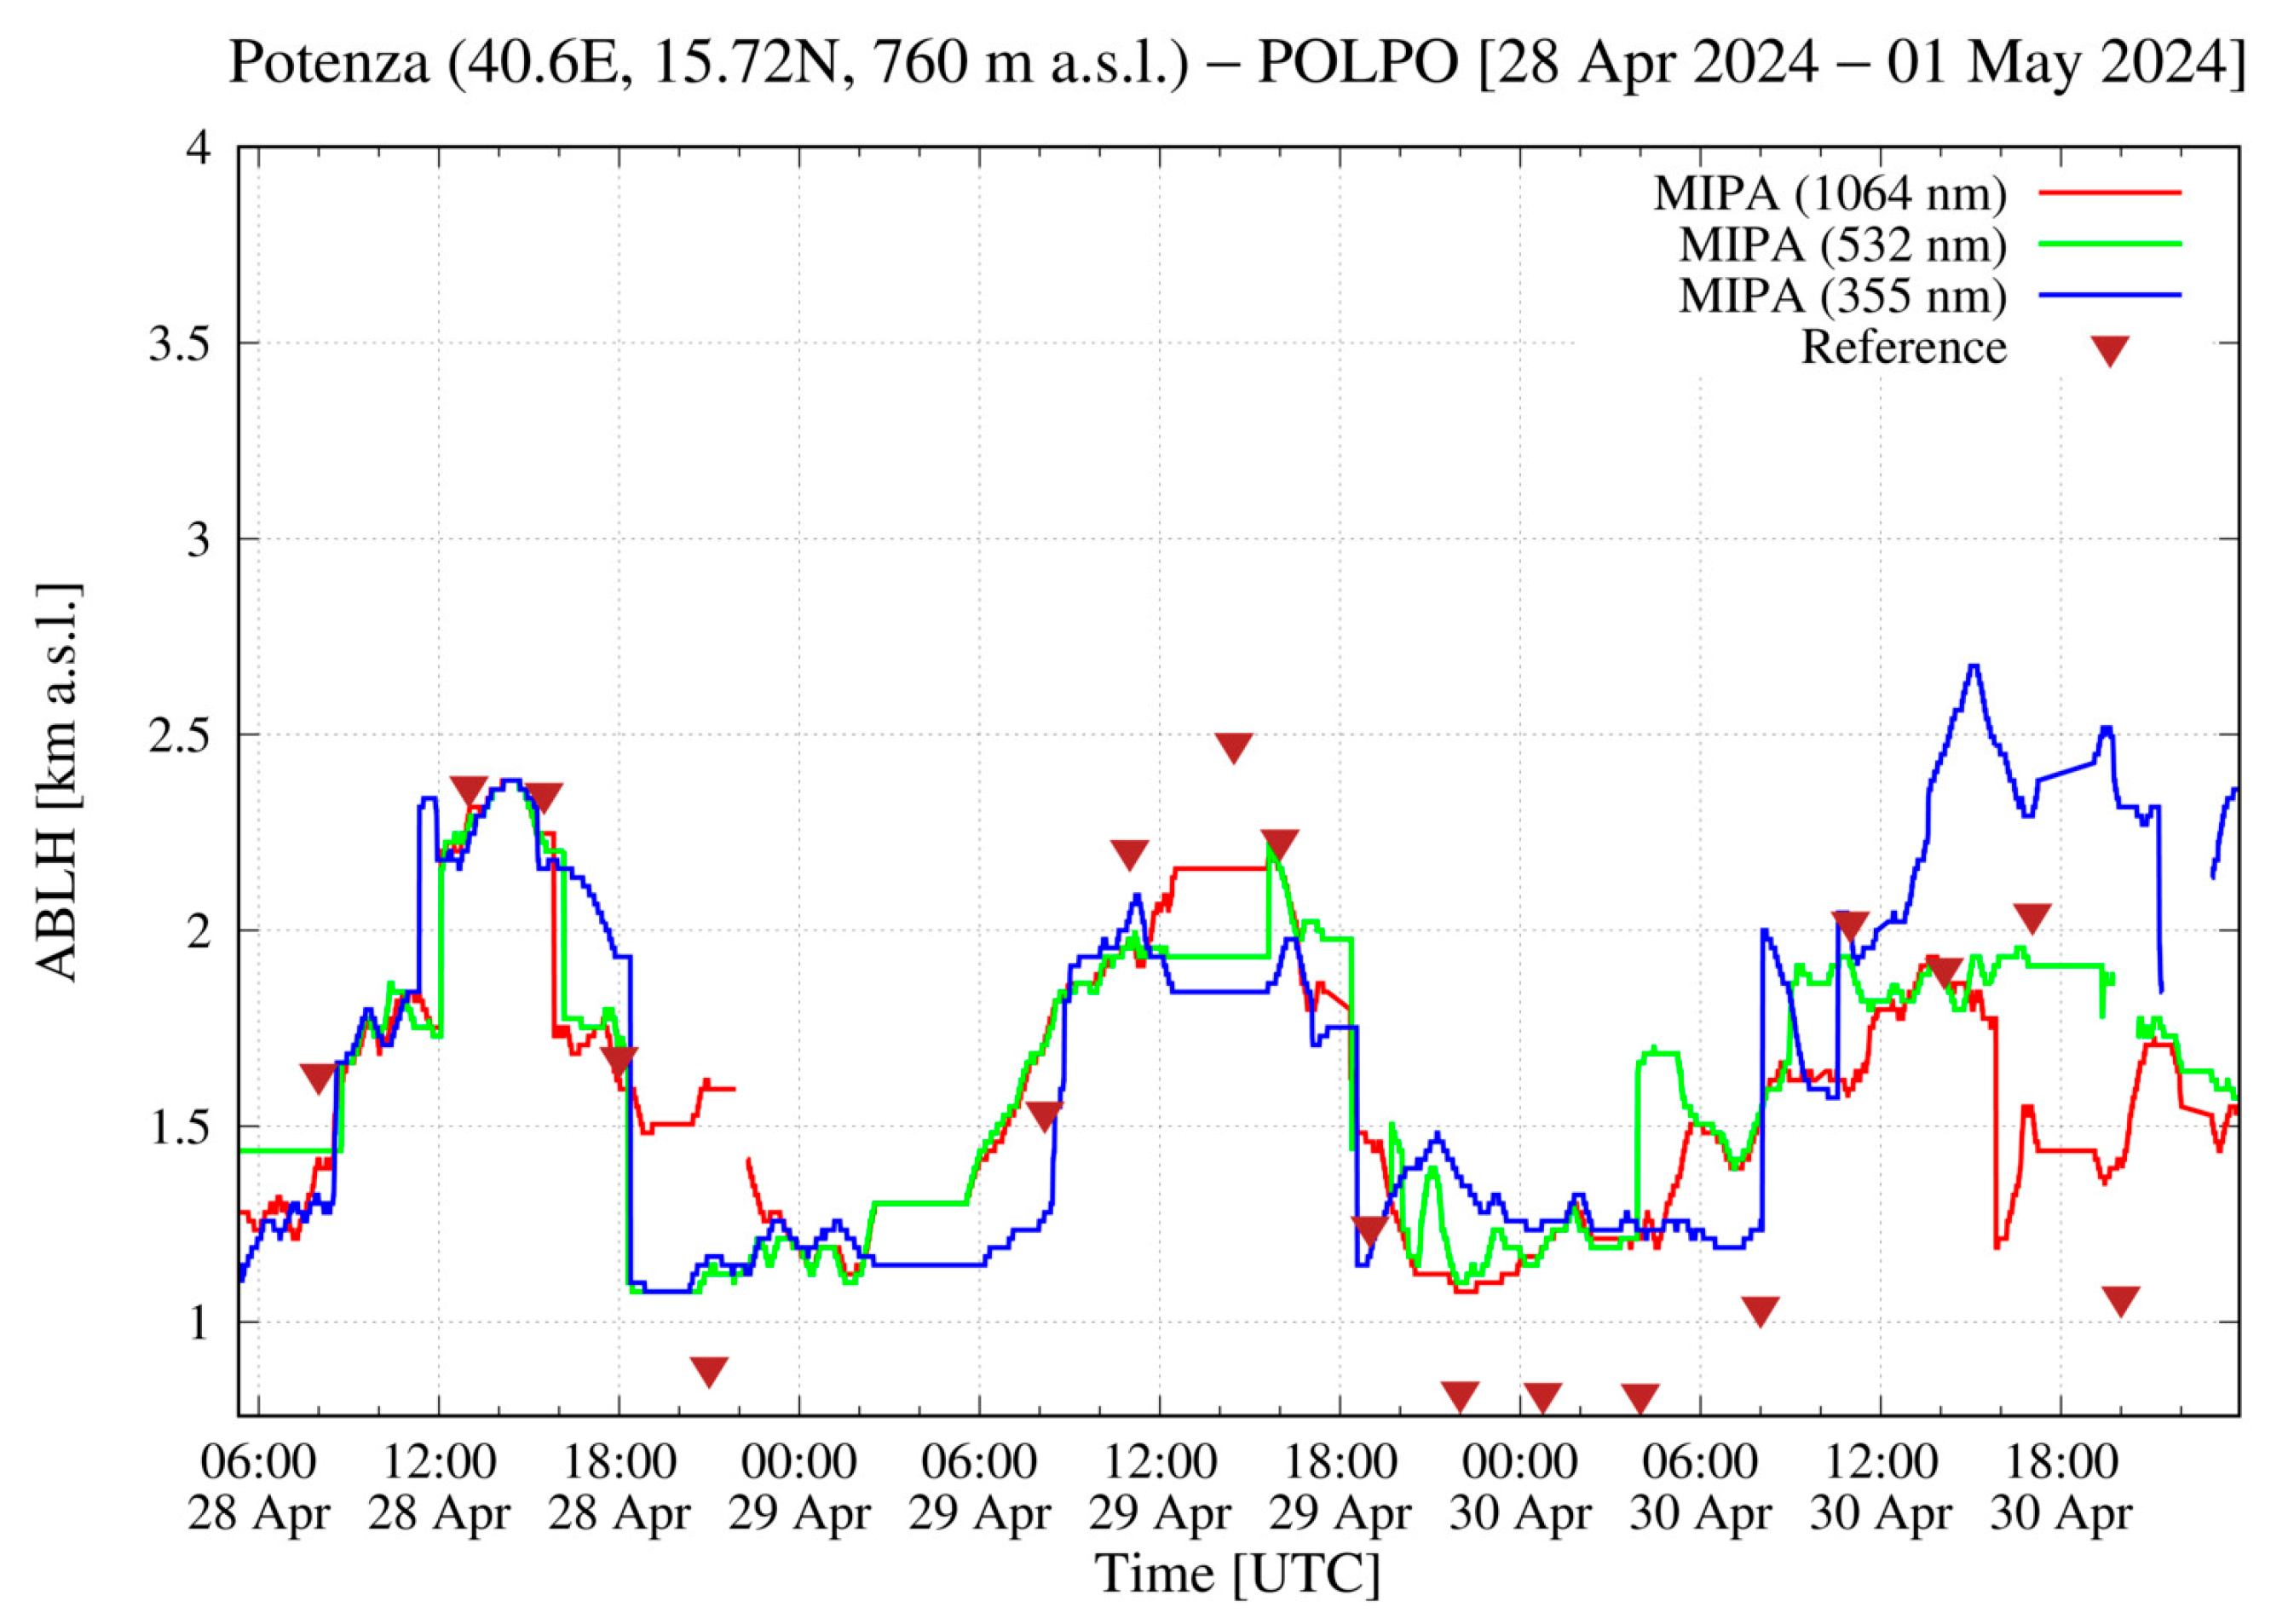
Figure 9 shows the ABLHs retrieved by MIPA when applied to the
ABS timeseries measured by POLPO at all three available elastic wavelengths for Case Study 1. In general, ABLHs retrieved by using
ABS at 355 nm and 532 nm (blue and green lines) show good agreement with those obtained using ABS at 1064 nm (red line). This indicates that even if the particle-to-molecular contrast in the lidar signal at 355 nm and 532 nm is lower than at 1064 nm, it remains sufficiently high to ensure reliable ABLH estimates. However, the limitations of retrieving the ABLH using the
ABS at 355 nm become apparent in the final period shown in
Figure 9. In particular, the discrepancies with respect to the results obtained using the other two wavelengths increase when the strong descending aerosol dust approaches the top of the layer. Starting from noon on 30 April, the dust layer above the ABL remains very close to the ABL top (see
Figure 8), and under these conditions, the estimation of the ABLH using elastic signal at 355 nm appears more challenging. This behavior can be explained by considering the particularly low particle-to-molecular contrast characterizing the lidar signals at 355 nm. Such contrast reduction prevents getting a clear separation between the edge representing the top of the ABL and the edges of the overlying dust layer. Consequently, under these conditions, the ABLH returned by MIPA does not provide useful information, as it is not related to the top of the ABLH but only to the structure of the layer above. Accordingly, the blue curve in
Figure 9 shows good agreement with the red and green curves when the dust layer and the ABL are well separated. Finally, for similar reasons, during nighttime conditions the blue curve overestimates more the reference values with respect to the red and green curves.
MIPA results for the other two case studies are shown in
Figure 10, which plots the same quantities as
Figure 8. Regarding Case Study 2, as discussed in
Section 3, right after 06:00 UTC on 15 April, an intense dust layer is clearly visible in the colormap. This strong layer reached the measurement site quite abruptly, preventing the ABL from evolving normally. This is confirmed by the very low values of ABLH retrieved by both MIPA and the radiosonde data between 09:00 and 18:00 UTC. After this period, the layer appeared less intense, and consequently, the ABL evolved to higher heights during the morning of the next day (16 April). In addition, the evident mismatch between the retrieved and the reference value starting from 19:00 on 15 April until 07:00 on 16 April is to be attributed to the lack of lidar observations in the vertical region where the ABLH is located. In general, as for Case Study 1, during daytime conditions, ABLHs retrieved by MIPA show good agreement with the reference ones, while during nighttime the retrieved ABLHs are overestimated due to the lidar overlap issue discussed earlier.
For Case Study 3, the evolution of the ABL is in general well captured when the
ABS at 1064 nm is used as input: the two diurnal cycles with a maximum occurring around noon on 28 and 29 June are clearly visible (
Figure 10). As for the other two case studies, larger deviations with respect to the reference are obtained during nighttime conditions, when the ABLH is typically below the full overlap height of POLPO.
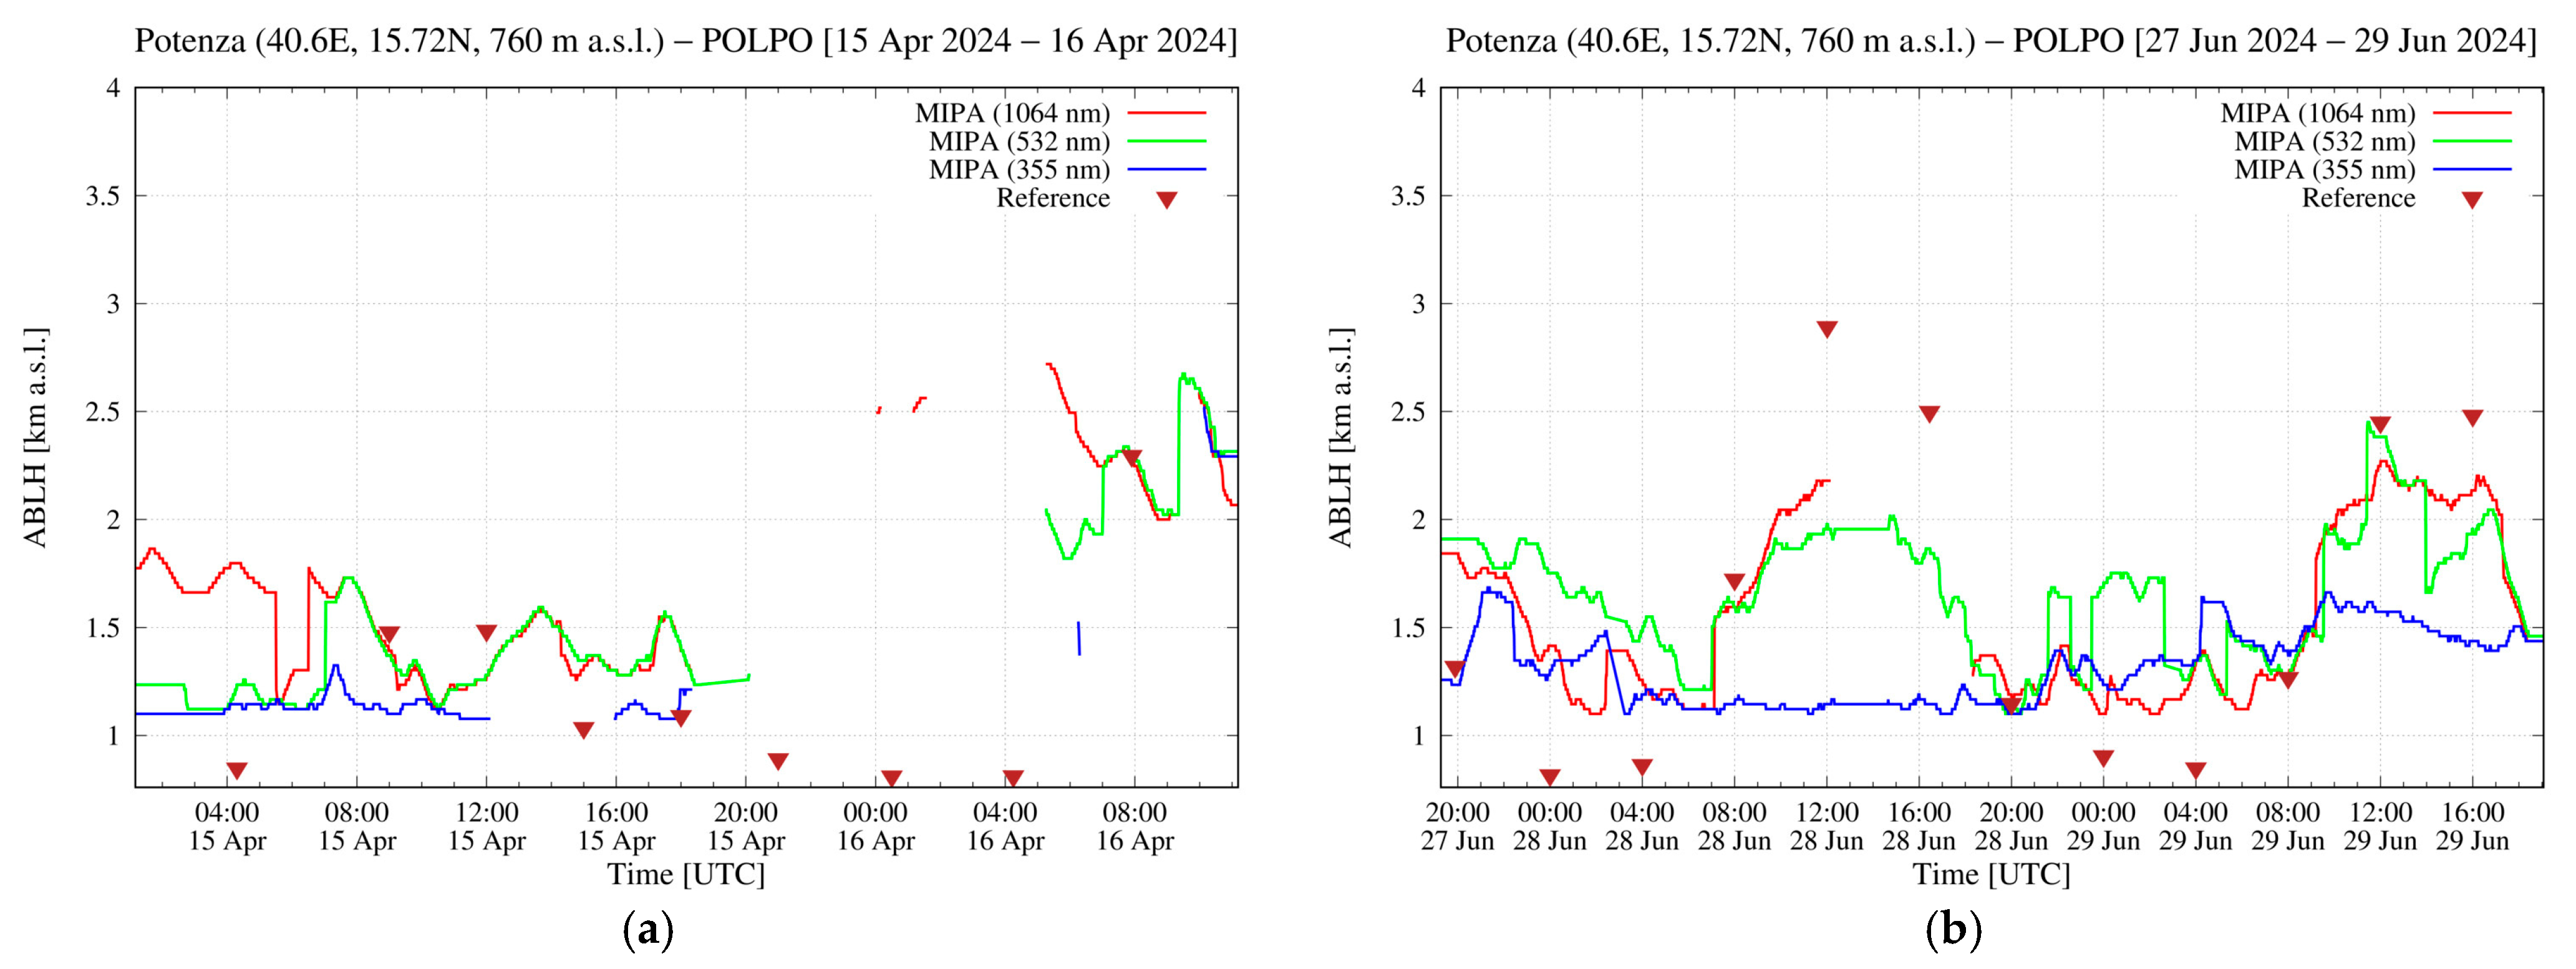
A comparison of ABLH estimates from MIPA, considering the
ABS timeseries at the three wavelengths, is given in
Figure 11 for Case Study 2 and 3. Similarly to the situation shown in
Figure 9, also here the ABLHs retrieved by MIPA using 532 nm and 1064 nm
ABS timeseries agree well with each other, while the results obtained by using the
ABS timeseries at 355 nm show larger discrepancies, especially in the last part of the measurement period for Case Study 2 and throughout the observational period during Case Study 3. As discussed in
Section 3, Case Study 3 refers to a cleaner situation in terms of aerosol load compared to the other two selected cases. The contrast of particle-to-molecular signal in the
ABS lidar signal plays a more crucial role when the aerosol content is low and, consequently, the use of shorter lidar wavelengths yields less accurate ALBH estimates. This is clearly evident in
Figure 11b, where the agreement between the MIPA-retrieved ABLH and the reference points is still good for 1064 nm and 532 nm but decreases considerably for 355 nm.
A statistical analysis of the absolute differences between ABLHs retrieved by MIPA and the corresponding radiosounding-retrieved ABLH is presented in
Table 3. This analysis covers all available elastic wavelengths and considers two cases separately: (1) all reference points listed in
Table 1 and (2) only those reference points above the full overlap height of POLPO, which is 1110 m a.s.l. for lidar channels at 1064 nm and 960 m a.s.l. for the ones at 355 nm and 532 nm. The larger full overlap height at 1064 nm with respect to the corresponding one at other wavelengths is mainly due to different characteristics of the two laser sources POLPO is equipped with. The laser used as a light source for infrared channels has a larger divergence with respect to the laser used for the other wavelengths.
Table 3 shows the mean (
Δmean), the median (
Δmed), the standard deviation (
ΔSD), the standard error (
ΔSE), the mean square difference (
Δ2mean), the minimum (
Δmin), and the maximum (
Δmax) of the differences between ABLH retrieved by MIPA and the corresponding reference points.
When all reference points are considered, a mean difference of 98, 101, and −51 m is found for the wavelengths 1064 nm, 532 nm, and 355 nm, respectively. The decrease of both ΔSD and Δ2mean at larger wavelengths indicates that the overall precision affecting the estimate of the ABLH increases with increasing wavelength. This is a quantitative confirmation that, in general, the longer the lidar wavelength, the better the quality of the ABLH retrieved by MIPA. However, the values obtained for these parameters for 1064 nm and 532 nm are quite similar, suggesting that these two wavelengths should be preferred for MIPA ABLH retrieval.
As already discussed earlier, during nighttime conditions, the input dataset we used to validate MIPA is not suitable for the detection of ABLH values below the full overlap height of the lidar. Consequently, the statistical analysis, including all the reference points, contains biases due to:
inversion algorithm (MIPA);
instrumental limitations (ABLH values below lidar full overlap height);
different ABL definitions (thermodynamic parameters in the case of the reference dataset; aerosols in the case of the lidar dataset).
For a proper MIPA validation, data points affected by the bias sources identified in entries 2 and 3 in the above list should be excluded from the statistical analysis, as they both do not apply to the specific inversion algorithm used to retrieve ABLH. Differences due to points 2 and 3 are related to instrumental limitations and methodology, respectively, which are present regardless of the specific inversion algorithm used to obtain lidar-based ABLH estimations. To eliminate the limitations within the full overlap region, we considered only the reference points above this region. Therefore, apart from removing instrumental limitations, we minimized contributions from the different ABL definitions (the two definitions are equivalent if the ABL is well developed and well mixed).
Statistical analysis restricted only to reference points above the full overlap height is provided in the last three columns of
Table 3. For the 532 and 1064 nm wavelengths, there is a general improvement of statistical indicators with an appreciable reduction in
Δ2mean when only reference points above full overlap heights are considered. This is a clear indication that the timeseries of
ABS at 532 nm and 1064 nm are particularly suitable to be used as input for MIPA. The same behavior is not observed for the 355 nm: in this case there is even a slight worsening of all the statistical parameters when switching from the full reference dataset to the ones containing only points above full overlap heights. Therefore, timeseries of
ABS at 355 nm are not particularly suitable for MIPA, at least for conditions where the aerosol load is low. These results prove that, using the optimized MIPA configuration summarized in
Table 2, it is possible to retrieve ABLH with a standard deviation of 266 m (326 m) and a standard error of 60 m (67 m) at 1064 nm (532 nm) in all the examined cases in which the lidar observations allow to capture the ABLH.
It is important to note that all the MIPA retrievals reported in this study were obtained using the same set of configuration parameters, summarized in
Table 2, even though the atmospheric conditions characterizing the three selected cases differed considerably from one another.
Concerning the applicability of MIPA to different sensors (such as other AHLs or ceilometers), the only parameters that may need tuning to achieve optimal results are
P and
R. All the other parameters, as shown in
Table 2, appear to be quite stable.
Such MIPA robustness opens the possibility to retrieve the ABLH by adopting a multi-sensor approach, in which both AHLs and ceilometer observations are used and eventually combined synergistically. In this way, some restrictions mentioned in this study, such as the low ABLH estimation accuracy during nighttime (due to full overlap height issues) and limited (in time) continuous measurements availability, can be mitigated.
6. Conclusions
In this study, we performed the assessment and optimization of the MIPA algorithm for the retrieval of ABLH from high-power lidar observations. To reach this goal, a dedicated measurement campaign was carried out at CIAO. During the campaign, several lidars were operating continuously, together with other atmospheric sensors and two radiosounding systems. Three case studies were selected for the validation of MIPA, which are characterized by an intensified radiosonde launching schedule to ensure the collection of a representative ABLH reference dataset. Additionally, the selected case studies offered the possibility to evaluate MIPA performance under different atmospheric conditions, ranging from intense dust events intruding into the ABL to cleaner atmospheric conditions. Using these case studies, we found the optimized configuration of MIPA as the one minimizing the discrepancies with respect to the reference dataset. In particular, the comparison among the ABLH retrieved by MIPA and the corresponding values obtained by radiosonde data (assumed as the truth) allowed us to estimate the accuracy of MIPA ABLH retrievals. In general, we found good agreement (median bias below 100 m) between MIPA and the reference values, especially under daytime conditions and when timeseries of ABS at 532 nm and 1064 nm wavelengths were used as input data. Timeseries of ABS at 355 nm showed larger discrepancies with respect to the reference values, especially in conditions where the aerosol load is low. Such discrepancies are due to the lower particle-to-molecular contrast characterizing the elastic lidar signals in the UV spectral region with respect to the corresponding ones in the visible or infrared. This finding suggests that, at least when using MIPA and under particularly clean observations, it is preferable to use timeseries of ABS at 532 nm and 1064 nm to retrieve the ABLH from lidar measurements. Therefore, the applicability of MIPA to timeseries of ABS at 355 nm should be considered with care, especially when the aerosol load is low.
In general, MIPA tends to overestimate the actual ABLH (at all considered wavelengths) during nighttime. However, the overestimation is not due to a limitation of the algorithm but rather to a lack of a reliable lidar signal below the full overlap height. Under nighttime conditions, it is quite likely that the ABLH is located in the altitude region of 100–200 m, which is below the full overlap height of the lidar. Consequently, under these conditions, the ABLHs estimated by MIPA correspond to the base of the first (in altitude) atmospheric layer. The statistical analysis on the differences between the ABLHs retrieved by MIPA and the reference dataset demonstrated a mean difference of −125 m (−68 m) and a median difference of −95 m (−82 m) at 1064 nm (532 nm). These values represent an estimate of the bias, and consequently of the accuracy, affecting the ABLH retrievals by MIPA at the two considered wavelengths.
It is to be pointed out that the lack of sensitivity of the MIPA algorithm within the overlap region is the result of a sensitivity lack of the lidar measurements (the number of collected backscattered photons in this region is sensitively smaller, leading to an abrupt increase of the statistical uncertainty affecting the elastic backscatter signals). Additionally, the application of the described clipping operation to reduce the dynamic range of the input image could lead to sub-optimal behavior of the MIPA algorithm in the presence of highly variable elastic backscatter signals.
Even though the usage of MIPA was only considered on AHLs, the results obtained for the three selected case studies (characterized by quite different atmospheric conditions) suggest a good degree of robustness of MIPA. Further and deeper evaluations of this aspect will be possible once the algorithm is applied to different types of sensors, such as ceilometers. In general, we expect that the optimized MIPA configuration identified in this study for AHL measurements will not change significantly when ceilometers are considered. Consequently, it will be possible to explore the applicability of MIPA on datasets obtained by the fusion of ALH and ceilometer observations with an expected significative improvement in monitoring the ABLH in both time and space. Ceilometer measurements can be used to fill the gaps between non-continuous lidar observations and/or to improve the accuracy of the retrieved ABLH during nighttime conditions. Finally, since ceilometers are generally more widespread than AHLs, a better characterization of the ABLH at continental and even global scales is possible when a multi-sensor approach is considered for MIPA.
