Article

An Improved InTEC Model for Estimating the Carbon Budgets in Eucalyptus Plantations

1
Fujian Provincial Key Laboratory for Subtropical Resources and Environment, Fujian Normal University, Fuzhou 350117, China
2
Institute of Geography, Fujian Normal University, Fuzhou 350007, China
3
Yuanling State Forestry Farm, Yunxiao County, Zhangzhou 363300, China
*
Author to whom correspondence should be addressed.
Remote Sens. 2025, 17(15), 2741; https://doi.org/10.3390/rs17152741
Submission received: 16 June 2025 / Revised: 31 July 2025 / Accepted: 4 August 2025 / Published: 7 August 2025

Abstract

Eucalyptus has become a major plantation crop in southern China, with a carbon sequestration capacity significantly higher than that of other species. However, its long-term carbon sequestration capacity and regional-scale potential remain highly uncertain due to commonly applied short-rotation management practices. The InTEC (Integrated Terrestrial Ecosystem Carbon) model is a process-based biogeochemical model that simulates carbon dynamics in terrestrial ecosystems by integrating physiological processes, environmental drivers, and management practices. In this study, the InTEC model was enhanced with an optimized eucalyptus module (InTECeuc) and a data assimilation module (InTECDA), and driven by multiple remote sensing products (Net Primary Productivity (NPP) and carbon density) to simulate the carbon budgets of eucalyptus plantations from 2003 to 2023. The results indicated notable improvements in the performance of the InTECeuc model when driven by different datasets: carbon density simulation showed improvements in R2 (0.07–0.56), reductions in MAE (5.99–28.51 Mg C ha−1), reductions in RMSE (8.1–31.85 Mg C ha−1), and improvements in rRMSE (12.37–51.82%), excluding NPPLin. The carbon density-driven InTECeuc model outperformed the NPP-driven model, with improvements in R2 (0.28), MAE (−8.15 Mg C ha−1), RMSE (−9.43 Mg C ha−1), and rRMSE (−15.34%). When the InTECDA model was employed, R2 values for carbon density improved by 0–0.03 (excluding ACDYan), with MAE reductions between 0.17 and 7.22 Mg C ha−1, RMSE reductions between 0.33 and 12.94 Mg C ha−1 and rRMSE improvements ranging from 0.51 to 20.22%. The carbon density-driven InTECDA model enabled the production of high-resolution and accurate carbon budget estimates for eucalyptus plantations from 2003 to 2023, with average NPP, Net Ecosystem Productivity (NEP), and Net Biome Productivity (NBP) values of 17.80, 10.09, and 9.32 Mg C ha−1 yr−1, respectively, offering scientific insights and technical support for the management of eucalyptus plantations in alignment with carbon neutrality targets.

1. Introduction

Extensive plantations across China play a vital role in carbon sequestration and contribute significantly to the nation’s climate change mitigation efforts [1]. Eucalyptus plantations exhibit carbon fixation rates 2.95 times higher than those of Pinus massoniana and 2.18 times higher than those of Cunninghamia lanceolata [2]. They represent 6.85% of China’s total plantation area and contribute over 17.96% to the national timber harvest [2]. Eucalyptus is typically managed under a short-rotation monoculture regime, with trees harvested every 5 to 9 years and all biomass removed from the ecosystem following harvest. This practice reduces residual carbon stock in the ecosystem, potentially lowering Net Biome Productivity (NBP) and even turning plantations into carbon sources [3]. Although eucalyptus plantations currently function as carbon sinks, the long-term effects of repeated short rotations on carbon storage remain poorly understood. The short-rotation management model introduces significant uncertainty into carbon stock estimates, complicating accurate assessments of their overall contribution to regional carbon sequestration.
Temporally, forest ecosystems may alternate between acting as carbon sinks and sources from year to year; however, they must function as net carbon sinks over longer timescales to contribute to long-term carbon sequestration [4]. Short-term or single-period carbon stock assessments (e.g., plot inventory and remote sensing estimation) are insufficient to accurately capture the carbon cycling dynamics in eucalyptus plantations. Spatially, the rapid growth of eucalyptus enables substantial CO2 fixation. However, harvesting leads to the direct removal of biomass carbon from the forest carbon pool, with the carbon either stored or released through forest products. According to the seventh and eighth national forest resource inventories, eucalyptus plantations demonstrated a strong carbon sequestration capacity, with an annual carbon increment of 9.96 Tg C—the largest increase in carbon density among major species [5]. However, a study in Guangxi Province—where eucalyptus occupies the largest plantation area in China—reported that eucalyptus contributes only 6.67% to the provincial carbon stock, ranking eighth in carbon density among ten major forest types [6]. Thus, whether eucalyptus plantations can enhance regional forest carbon sinks remains uncertain. Time-series remote sensing offers a robust data foundation for the continuous monitoring of the dynamic changes in eucalyptus plantations [7], while process-based ecosystem models provide a methodological framework for investigating their carbon sink/source characteristics over extended periods. Integrating time-series remote sensing with ecosystem model simulations provides a scientific basis for the quantitative assessment of eucalyptus plantations’ contribution to regional carbon sinks.
Process-based ecosystem models effectively characterize carbon transfer among pools in response to disturbances and facilitate integrated assessments of climate change impacts on biogeochemical cycles. The Integrated Terrestrial Ecosystem Carbon budget model (InTEC) is among the few process-based models that incorporate the effects of climate, stand age, and forest disturbances on carbon cycling, while being driven by remote sensing data [8]. It has been widely applied to simulate carbon budgets at both regional and national scales [9,10,11]. However, a key limitation of the InTEC model is that it can only account for a single disturbance event within a time series [12,13]. It also assumes that each pixel remains continuously forested throughout the simulation period, thereby ignoring temporal changes in land cover. This static assumption hinders the model’s ability to capture the dynamic changes in forest structure and composition under multiple disturbance regimes. Therefore, to accurately represent the spatiotemporal dynamics of eucalyptus plantations and their carbon budgets, it is essential to update the disturbance and land cover modules of the InTEC model.
At the same time, the InTEC model also heavily relies on the Net Primary Productivity (NPP) value from a designated reference year. This reference-year NPP is critical to ensuring the accurate and realistic simulation of carbon dynamics. However, the limited availability of high-resolution and reliable NPP data for eucalyptus plantations significantly constrains the model’s applicability. Existing NPP datasets [14,15] tend to underestimate the actual productivity of eucalyptus forests [16,17,18]. Recently, high-resolution biomass [19] and carbon density [20] datasets have become more reliable, representing promising alternatives for driving the InTEC model. Therefore, leveraging high-resolution and accurate biomass and carbon density data to optimize the InTEC model—thereby reducing its dependency on reference-year NPP—offers a direct and effective approach to enhancing its capacity to simulate regional-scale carbon budgets in eucalyptus plantations. As more time-series carbon and biomass products become available, developing strategies to integrate these datasets will be key to further improving simulation quality.
To address uncertainties in input data, data assimilation techniques can integrate multi-year remote sensing observations with the InTEC model to optimize parameterization and improve the agreement between model outputs and observational datasets [21,22,23,24], thereby enhancing the accuracy of regional-scale carbon budget simulations for eucalyptus plantations.
This study aims to enhance the InTEC model by optimizing key modules and to assess the impact of various remote sensing-derived carbon monitoring products on simulation performance. The overarching objective is to evaluate the spatiotemporal patterns of carbon sources and sinks in eucalyptus plantations at the regional scale. The specific objectives are (1) to optimize the eucalyptus and data assimilation modules within the InTEC model by considering short rotation and forest dynamics; (2) to compare model outputs driven by NPP- and carbon density-based products; and (3) to evaluate the spatiotemporal dynamics of carbon budgets in eucalyptus plantations at the regional scale.

2. Methods

2.1. Study Area and Data

2.1.1. Study Area

A subtropical region in Fujian Province, southeastern China, was selected as the study area. Yunxiao County, situated in Zhangzhou City, experiences a subtropical monsoon climate, with an average annual temperature of 21.2 °C, annual precipitation of 1730.6 mm, approximately 2000 h of sunshine annually, and a frost-free period exceeding 347 days (Figure 1). Eucalyptus in this area grows rapidly on a 5–7-year rotation, and most stands have been harvested once or twice (Figure 1a). The forest coverage rate in the county is 67.81%, with eucalyptus plantations covering approximately 300,000 acres, accounting for 29% of the total forest area (Figure 1b).

2.1.2. Data Collection and Preprocessing

The input data for the InTEC model include climate data, soil data, eucalyptus data (e.g., spatial distribution, clear-cutting, and planting years), atmospheric data (CO2 concentration and nitrogen deposition data), maximum leaf area index (LAI), reference-year NPP, and biomass/carbon density datasets. Detailed descriptions of these datasets are provided in Table 1. All datasets, except atmospheric data, were projected and resampled (bilinear interpolation) to a 30 m spatial resolution using the UTM coordinate system, ensuring consistency for input into InTEC model simulations.
(1) The relationship between Fnpp and age
In InTEC model simulations, the relationship between forest NPP and stand age plays a critical role. The model incorporates a normalized NPP–age relationship (Fnpp-age curve) as an input variable to adjust NPP calculations throughout the simulation process. In this study, the Fnpp–age relationship specific to eucalyptus plantations was derived by analyzing observed NPP data and corresponding stand age information reported in previous studies [17,28], following the empirical formulations described in Equations (1) and (2) [29].
Fnpp age   = NPP age NPP max
NPP age = a * 1 + b *   age c d   1 e age c
where age denotes the stand age of eucalyptus; Fnpp age represents the normalized NPP at that age; and NPP age indicates the actual NPP value corresponding to the same stand age. NPP max is the maximum NPP observed across all stand ages. The empirical coefficients a, b, c, and d were obtained by fitting the Levenberg–Marquardt nonlinear least-squares algorithm to NPP measurements from [28] for 0–6-year-old eucalyptus stands in Guangxi Province, China, and to NPP observations for the same species in stands older than 7 years from [17]. The resulting coefficients were 16.14, 0.55, 3.66, and 2.80 for a, b, c, and d, respectively.
(2) Carbon products for reference year
The InTEC model adjusts the initial NPP (NPP0) using reference-year NPP data to accurately simulate long-term NPP dynamics. To this end, five types of reference-year carbon datasets were compared for model calibration. Specifically, two NPP datasets are employed: the MODIS NPP dataset [14] (NPPMODIS, Figure 2a) and the NPP derived from the GPP product by Lin et al. (2022) [15] (NPPLin, Figure 2b). Additionally, three carbon density datasets are included: carbon density data from Jiang et al. (2023) [20] (CDJiang, Figure 2c), and aboveground carbon density data derived from Yang et al. (2023) [19] and Yan et al. (2023) [27] (ACDYang and ACDYan, Figure 2d,e).
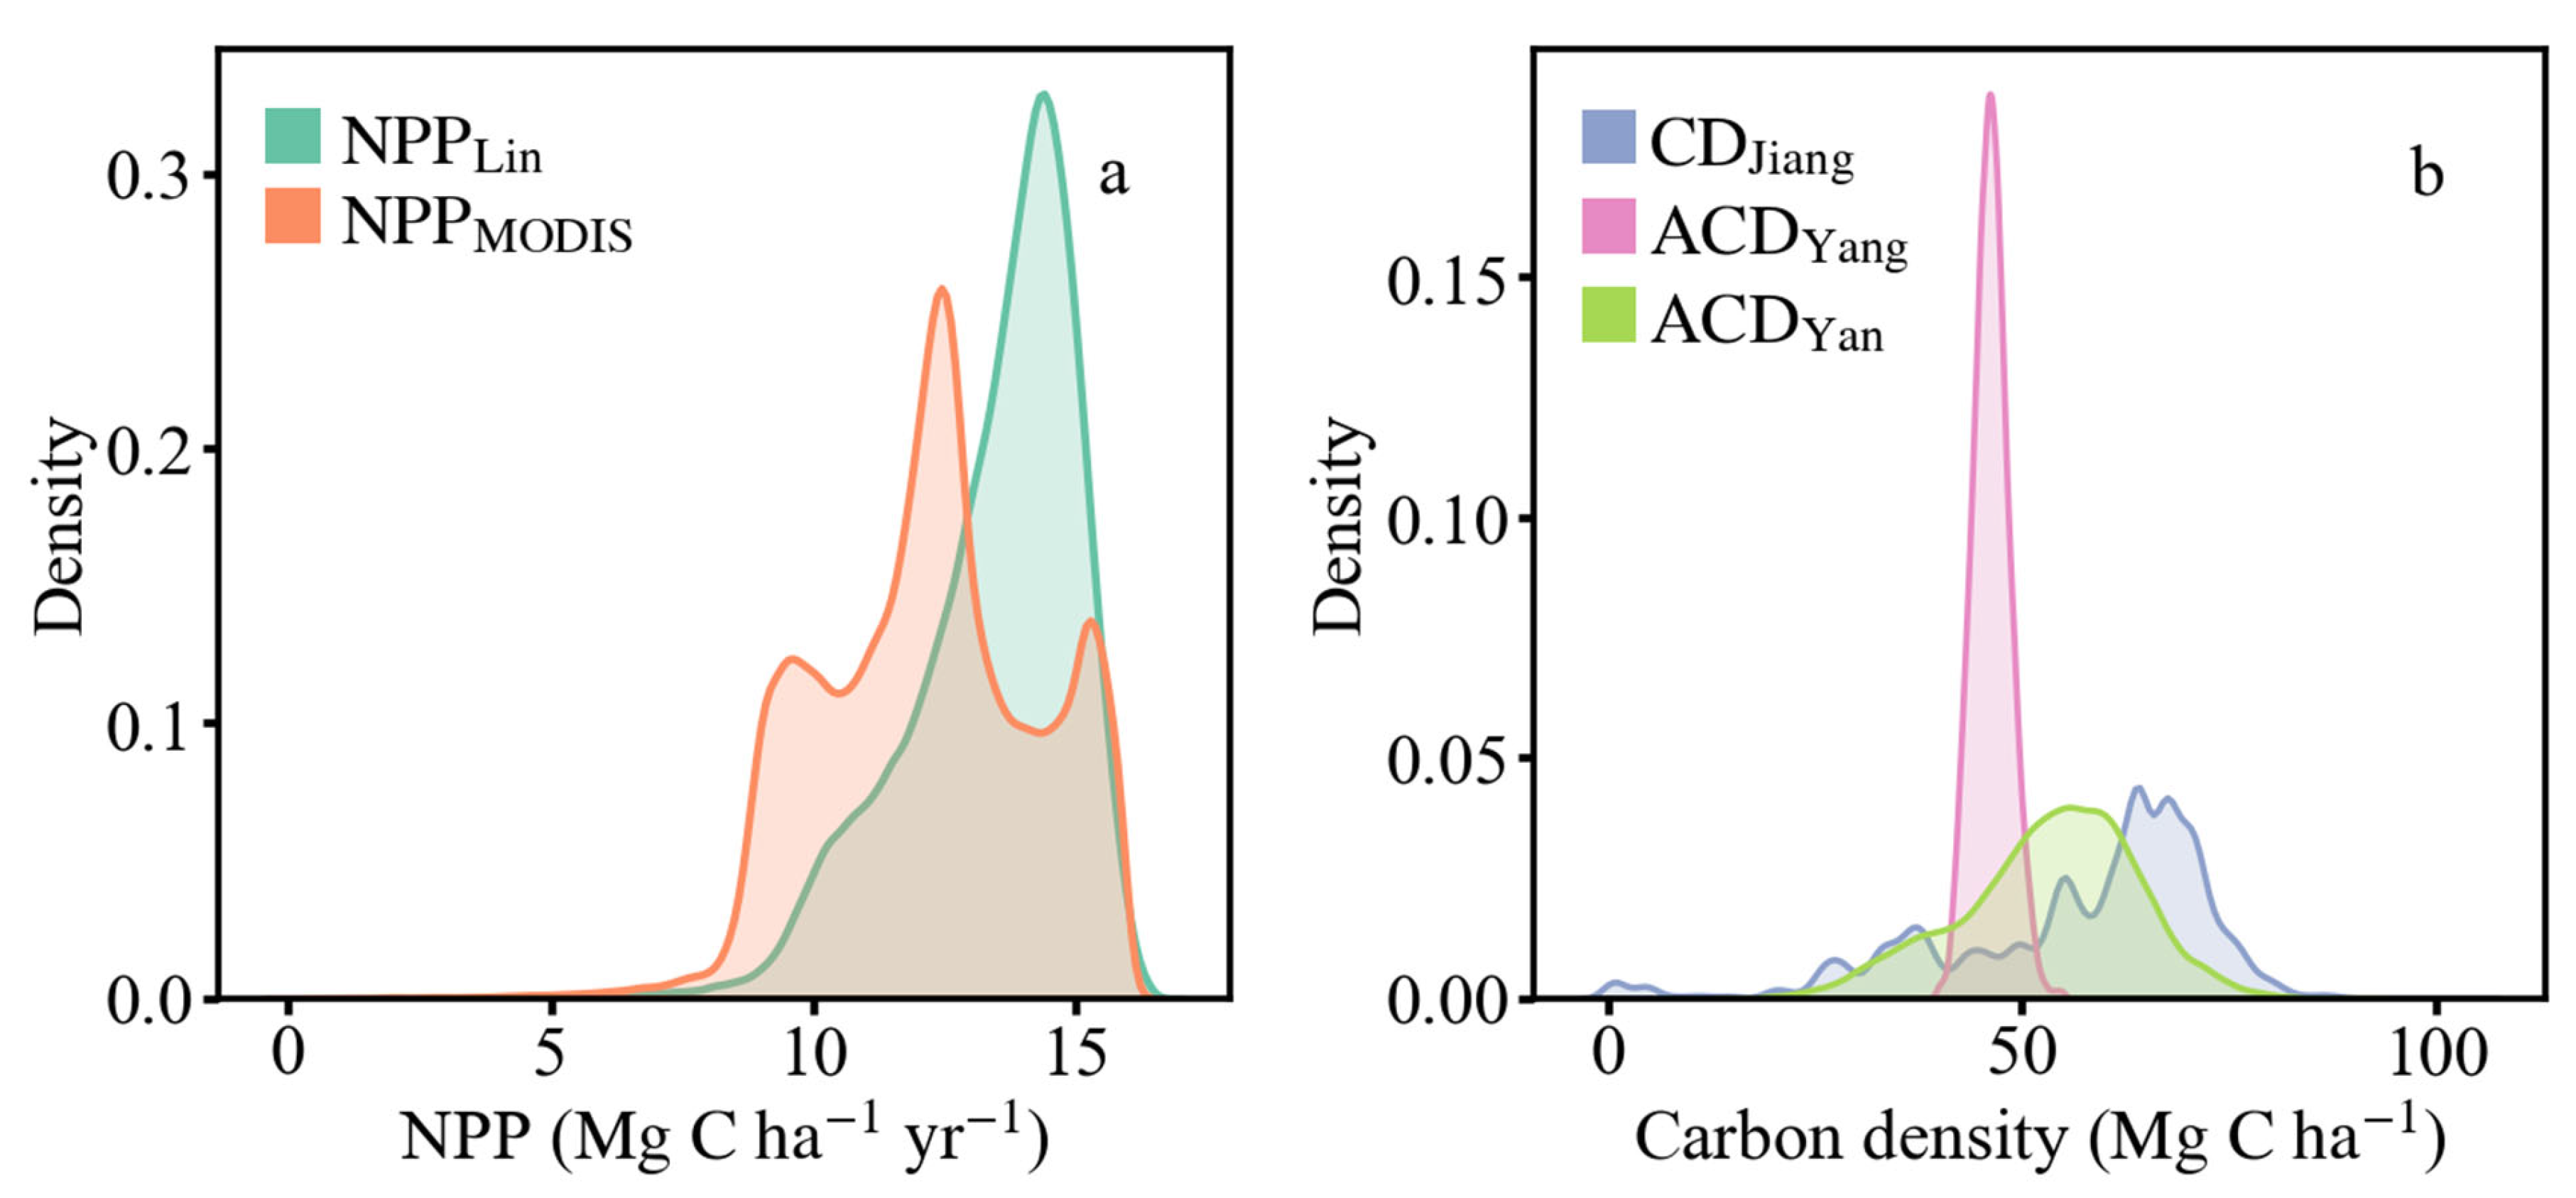
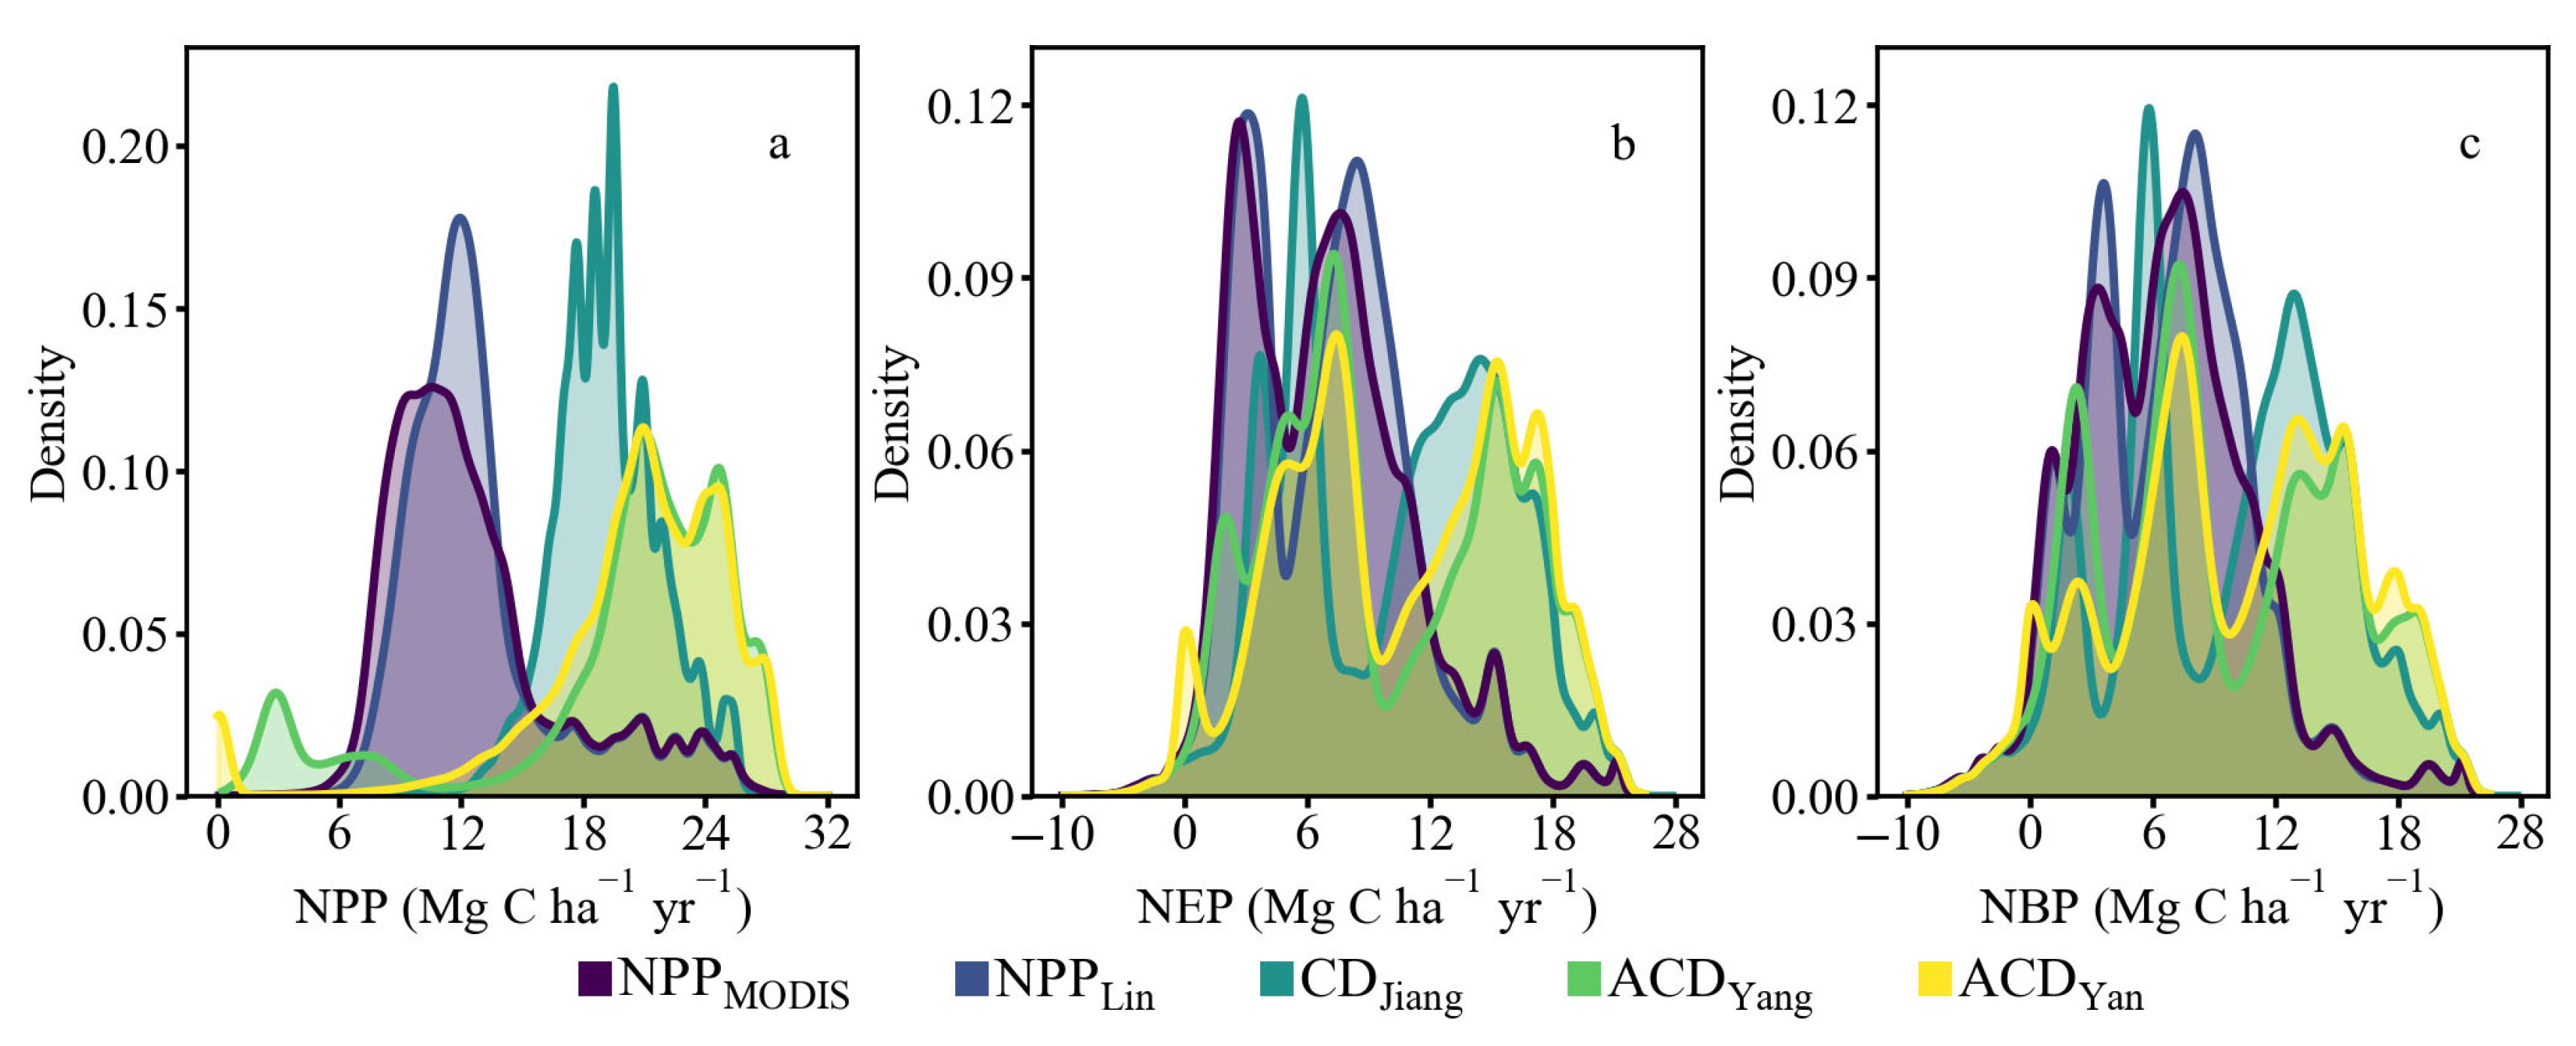
The study applied the following preprocessing steps to the input datasets: Lin’s GPP product was converted to NPP by applying a GPP-to-NPP conversion factor of 0.5 [30], while the aboveground biomass data from Yang and Yan were converted to aboveground carbon density using a biomass-to-carbon factor of 0.5 [31]. The NPPMODIS values were slightly lower than those of NPPLin (Figure 3a). The CDJiang dataset, which includes both aboveground and belowground carbon, ranges from 0 to 90 Mg C ha−1. ACDYang values are primarily concentrated between 40 and 56 Mg C ha−1, indicating relatively lower carbon densities. The ACDYan dataset spans a wider range, from 15 to 87 Mg C ha−1, and shows a considerable proportion of higher values (Figure 3b).

2.2. InTEC Model and Improvement

2.2.1. Basic Principles and Key Parameters of InTEC Model

The InTEC model is a biogeochemical process-based model that simulates forest carbon and nitrogen cycles by incorporating inputs such as climate, soil, vegetation, atmospheric CO2 concentration, and nitrogen deposition [32]. It incorporates multiple sub-models, including the Farquhar photosynthesis model, the CENTURY soil carbon and nitrogen model, a net nitrogen mineralization module, and the NPP–age relationship, to investigate the long-term impacts of climate change, atmospheric chemistry, forest disturbances, and regeneration on forest carbon and nitrogen dynamics [33]. Within this modeling framework, climate change and atmospheric chemical changes (e.g., CO2 enrichment and nitrogen deposition) are classified as non-disturbance factors, and their influences on the carbon cycle are defined as non-disturbance effects. Conversely, disturbances such as logging, fire, pest outbreaks, and forest regrowth are defined as disturbance factors, with their associated impacts on the carbon cycle referred to as disturbance effects. The InTEC model evaluates the effects of both disturbance and non-disturbance drivers on vegetation through a carbon pool framework, which partitions the vegetation carbon pool into leaf, stem, fine root, and coarse root components.
Prior to model parameterization, it is essential to clarify the hierarchy of carbon fluxes: Gross Primary Productivity (GPP) represents the total carbon fixed by vegetation via photosynthesis; NPP is the net carbon remaining after subtracting plant autotrophic respiration from GPP; NEP further deducts soil microbial and other respiratory losses from NPP; and NBP then subtracts carbon losses due to disturbances (e.g., fire, logging, pests, and diseases), yielding the final net carbon accumulation. Based on this framework, model parameterization follows the NPP allocation scheme proposed by D. Li et al. (2016) [7] to determine the partitioning coefficients and turnover rates for different vegetation carbon pools—leaves, stems, fine roots, and coarse roots (see Table 2 for details).

2.2.2. Optimizing Key Modules of InTEC Model

As a static vegetation model primarily driven by NPP data, the InTEC model traditionally accounts for only a single forest harvest event. Eucalyptus plantations, however, are managed under a short-rotation, monoculture system, for which existing NPP products often underestimate actual productivity or its dynamics (because NDVI saturates in high-LAI eucalyptus stands—typically above 0.8—preventing further increases in leaf area and photosynthetic activity from being captured in the light-use-efficiency model). To improve model fidelity, high-resolution and accurate carbon density datasets are therefore essential. In response to this limitation, we developed and integrated two key modules—a eucalyptus module and a data assimilation module—into the InTEC model, enabling a more accurate representation of the spatiotemporal dynamics and carbon budgets of eucalyptus plantations.
(1) The eucalyptus module (InTECeuc)
The InTEC model currently lacks the ability to adequately account for the impacts of multi-rotation harvest cycles and forest type transitions on the carbon budgets of eucalyptus plantations. To overcome this limitation, we developed the eucalyptus module that incorporates historical eucalyptus harvest records and classification data spanning from 1986 to 2021, enabling accurate simulation of plantation carbon dynamics. In addition, recent improvements in biomass and carbon density estimation were leveraged to integrate high-resolution carbon density data, thereby enhancing the accuracy of carbon budget simulations. Within this module, carbon pools (leaf, stem, fine root, and coarse root) are reset to zero following each harvest event. NPP is computed using Equations (3)–(5), and carbon pool dynamics are calculated with Equation (6), where NPP0 is determined via an iterative optimization process. After each iteration, convergence is evaluated using the criterion ( C t i     C ref   <   C ref * 0.01 ). If the condition is satisfied, the current NPP0 is accepted; otherwise, the value is adjusted and the process is repeated until convergence is achieved.
NPP t i = NPP 0 * φ NPPn t i *   φ NPP age t i * φ NPP cut t i , t f o r e s t   0 , t f o r e s t
where i denotes the simulation year and t represents the tree species type. NPP t i refers to the NPP for tree species t in the i -th year; and NPP 0 is the NPP in the initial year. φ NPPn t i represents the non-disturbance impact factor on NPP for tree species t in the i -th year, quantifying relative changes in NPP compared to the previous year due to variations in climatic conditions, atmospheric CO2 concentration, and nitrogen deposition, among other environmental drivers. This factor is calculated following the methodology described in Chen et al. (2000) [35]. φ NPP age t i denotes the effect of stand age on NPP for tree species t in the i -th year. φ NPP cut t i reflects the impact of harvesting events on NPP for tree species t in the i -th year. It is set to 0 in years when harvesting occurs—indicating a reset of productivity—and to 1 otherwise.
NPP 0 = NPP 0 , C t i     C ref < C ref * 0.01 NPP 0 * C ref C ref + C t i     C ref , C t i     C ref C ref * 0.01
where NPP 0 denotes the initialized NPP. i refers to the simulation year, which is specifically designated as the reference year in this context; and t represents the tree species type. C t ( i ) indicates the simulated vegetation carbon density for tree species t in the i -th year; and C ref is the input vegetation carbon density corresponding to the reference year.
φ NPP a ge t i   = Fnpp age t ( i ) Fnpp age max t  
where i denotes the simulation year; and t represents the tree species type. A ge t ( i ) refers to the stand age for tree species t in the i -th year and and age max t indicates the maximum stand age for tree species t . Fnpp age t ( i ) is the normalized NPP value (Fnpp) for tree species t at that stand age; and Fnpp age max t is the corresponding Fnpp value at the maximum stand age.
C j t i = C j t i     1 + f j t i NPP t i     k j t i C j t i   1 1 + k j t i     Cut j t i , t = f o r e s t 0 , t f o r e s t
where i denotes the simulation year; j indicates the specific vegetation carbon pool (e.g., leaf, stem, fine root, coarse root); and t represents the tree species type. C j t i and C j t i 1 denote the carbon stocks in vegetation pool j for tree species t in the i -th and ( i 1 )-th years, respectively. NPP t i is the NPP of tree species t in the i -th year. f j t i is the allocation coefficient of NPP allocated to vegetation carbon pool j for tree species t in the i -th year; and k j t i is the turnover rate of vegetation carbon pool j for tree species t in the i -th year. Cut j t i represents the carbon released from vegetation pool j by tree species t as a result of harvesting events occurring in the i -th year. This release is defined as the total carbon accumulated in pool j since the previous harvest.
(2) The data assimilation module (InTECDA)
The incorporation of single-year carbon density data in the InTECeuc model introduces notable uncertainty to simulation results. To mitigate this uncertainty, we developed a data assimilation module that integrates multi-year carbon density data and applies the four-dimensional variational assimilation (4DVar) [36] algorithm to optimize the key parameter, NPP0. This approach improves the accuracy of simulating carbon budgets in eucalyptus plantations. NPP0 is calculated based on Equations (7) and (8), where the optimization of NPP0 is achieved through iterative computation. After each iteration, the convergence criterion ( J x   =   J x min ) is evaluated. If this criterion is satisfied, the prevailing NPP0 value is accepted as the final result. Otherwise, NPP0 undergoes further adjustment, and the iterative procedure continues until convergence is achieved. Loss minimization (Equations (9) and (10)) proceeds in three simple stages: first, a global search using SCE-UA with 50 complexes over 50 iterations [37,38] to locate promising ranges; next, 50 “jumping” iterations of Simulated Annealing to prevent trapping in local minima; and finally, a single Nelder–Mead iteration [39] for efficient, gradient-free fine-tuning.
NPP 0 = NPP DA , J x = J x min NPP 0 + r a n d o m 2.0 ,   2.0 , J x   J x min
where NPP 0 represents the initial NPP; and NPP DA is the final optimized initial NPP obtained through simulations incorporating the 4DVar algorithm. J x denotes the cost function used in the 4DVar algorithm; and J x min indicates the minimum value of the cost function achieved during the optimization process. Random ( ) is the stochastic function used to generate random values, which is used to apply random perturbations to NPP 0 during the iterative optimization to explore a wider parameter space.
J x = 0.1 * NPP 0     NPP BG NPP SIGMA 2 +   i N W i * ( Sim i     Obs i * α i Obs SIGMA i ) 2
where J x denotes the cost function used in the 4DVar algorithm. NPP 0 is the initial NPP to be optimized; NPP BG represents the background (a priori) value of initial NPP; and NPP S IGMA signifies the standard deviation of the background error for the initial NPP. i is the simulation year; N represents the total number of simulated years; W i represents the weighting factor in the i -th year, determining the relative importance of observations in that year; while α i is the correction coefficient used to adjust the observations in the i th year. Sim i refers to the carbon density value simulated by the InTECeuc model in the i -th year; Obs i denotes the observed carbon density value in the i -th year; and Obs SIGMA i indicates the observation error (standard deviation) of the carbon density in the i -th year.
α i = E H coef , Obs i / Obs med > E HIGH RATIO H coef , HIGH RATIO < Obs i / Obs med E HIGH RATIO N coef     Obs i / Obs med   N HIGH RATIO HIGH RATIO     N HIGH RATIO * ( M coef     N coef ) , N HIGH RATIO < Obs i / Obs med HIGH RATIO N coef , Obs i / Obs med   N HIGH RATIO
where i is the simulation year; α i is the correction coefficient applied in the i-th year; Obs i denotes the observed carbon density in year i; Obs med represents the median of all observed carbon density values across the entire period; E H coef , H coef , M coef , and N coef are the correction coefficients corresponding to extreme overestimation, overestimation, normal values, and no correction, respectively; and E HIGH RATIO , HIGH RATIO , and N HIGH RATIO are the threshold coefficients used to classify extreme overestimation, overestimation, and normal fluctuation.
W i   =     1.0 ,       Obs i / Obs med   H I G H RATIO     2.0 ,       Obs i / Obs med <   H I G H RATIO  
where i is the simulation year; W i is the correction weight for the i-th year; Obs i denotes the observed carbon density in the i-th year; Obs med represents the median of all observed carbon density values; and HIGH RATIO is the threshold coefficient for identifying overestimation.
In employing an optimization algorithm to minimize the loss function, the parameters of the data assimilation module are adjusted based on the model’s input carbon density observations to identify an optimal initial state that both closely fits the measurements and avoids excessive deviation from the background field. The module’s key parameters include the background NPP bounds for the eucalyptus plantation ( NPP BG ) as specified in Refs. [17,28]; the initial NPP bounds ( NPP 0 ), the background NPP error standard deviations ( NPP SIGMA ), and the background carbon density observation error standard deviations ( Obs SIGMA ) all drawn from existing experiments (Model-input vs. field-measured carbon densities) and studies; and the experimentally calibrated correction coefficients ( E H coef , H coef , M coef , N coef ) along with their corresponding threshold values ( E HIGH RATIO , HIGH RATIO , N HIGH RATIO ). Specific parameter values are detailed in Table 3.
The loss-minimization procedure is carried out in three consecutive stages to ensure robust convergence without the need for gradient information. First, the SCE-UA algorithm is used to generate 50 candidate solutions (“complexes”) in parameter space, with random initialization of NPP 0 ,   NPP BG ,   NPP SIGMA , and Obs SIGMA . In each of 50 generations, the cost function is computed by comparing the carbon density simulated by the ecosystem model with the bias-corrected observed carbon density; candidates are then ranked in ascending order of cost, the top two elites are retained, and the remaining individuals are recombined via a strategy that couples simulated annealing with Nelder–Mead local search, thereby expanding global exploration while accelerating local convergence. Second, to avoid entrapment in local minima, the best solution from SCE-UA undergoes 50 “jump” simulated-annealing steps: at each step, small perturbations are added to NPP 0 ,   NPP BG ,   NPP SIGMA , and Obs SIGMA , the cost is re-evaluated, and the new solution is accepted based on improvement in fit or with Metropolis probability exp[(Δcost)/T] (initial temperature T = 100, decay factor α = 0.99 per step). Finally, a Nelder–Mead simplex reflection is performed: taking the centroid of the two lowest-cost points as a reference, the third point is reflected to a new position; if the reflected point yields a lower cost, it replaces the worst vertex. After completion of these iterations, the individual with the lowest cost in the entire complex is selected as the final calibration output.

2.3. Accuracy Evaluation

To evaluate the plot-scale accuracy of the modified InTECeuc and InTECDA models, we established 15 eucalyptus plots (20 m × 20 m) in Yunxiao County, Fujian Province, and conducted seven semi-annual DBH surveys from 2021 to 2024 to derive observed carbon densities (Mg C ha−1). Individual DBH measurements were converted to dry biomass using a regional allometric equation [40], summed per plot, normalized by plot area, and multiplied by a biomass-to-carbon factor of 0.5. Observed carbon densities from 2020 to 2023 were then matched one to one in space and time with the corresponding model outputs to ensure consistency. Finally, we calculated the coefficient of determination (R2; Equation (11)), mean absolute error (MAE; Equation (12)), root mean square error (RMSE; Equation (13)), and relative RMSE (rRMSE; Equation (14)), where RMSE quantifies the average prediction error in original units and rRMSE expresses the error as a percentage of the observed mean. All metrics were then used to evaluate the simulation results with the InTEC model to highlight the performance improvements from our improvements.
R 2 = 1     p = 1 n y p   y ^ p 2 p = 1 n y p   y - p 2
M A E = 1 n p = 1 n | y p   y ^ p |
RMSE = 1 n p = 1 n y p   y ^ p 2
rRMSE = 1 n p = 1 n y p   y ^ p 2 / p = 1 n y p n * 100 % = RMSE y - p   * 100 %
where p indicates the plot; n denotes the total number of field plots; y p represents the observed carbon density at plot p ; y - p is the mean observed carbon density across all plots; and y ^ p is the model’s simulated carbon density at plot p .

2.4. Spatiotemporal Variation Characteristics Analysis

This study investigates temporal trends in carbon budgets by calculating annual average values across eucalyptus plantations. NPP, Net Ecosystem Productivity (NEP), and NBP were selected as key indicators to represent carbon dynamics. The Kruskal–Wallis (KW) significance test [41] was subsequently employed to assess statistical differences in the temporal means of the carbon budgets and to evaluate the influence of different carbon-driving data sources. Spatially, carbon budget distributions were analyzed by calculating their mean values over the period 2003–2023.

3. Results

3.1. Evaluation of Simulation Result

3.1.1. Accuracy Evaluation of InTECeuc Model

The InTECeuc model, when driven by NPP and carbon density data, demonstrated a significant improvement in simulating both carbon density and changes in it compared to the original InTEC model. Overall, the simulation accuracy for carbon density improved, with R2 increasing by 0.07–0.56, MAE being reduced by 5.99–28.51 Mg C ha−1, RMSE decreasing by 8.1–31.85 Mg C ha−1, and rRMSE being improved by 12.37–51.82% (excluding NPPLin). The simulation error for carbon density change also decreased significantly, with R2 increasing by 0.26–0.46, MAE being reduced by 2.17–3.3 Mg C ha−1, RMSE decreasing by 2.0–4.3 Mg C ha−1, and rRMSE being improved by 27.54–48.2%. Compared to the NPP-driven InTECeuc model, the carbon density-driven model exhibited a superior performance.
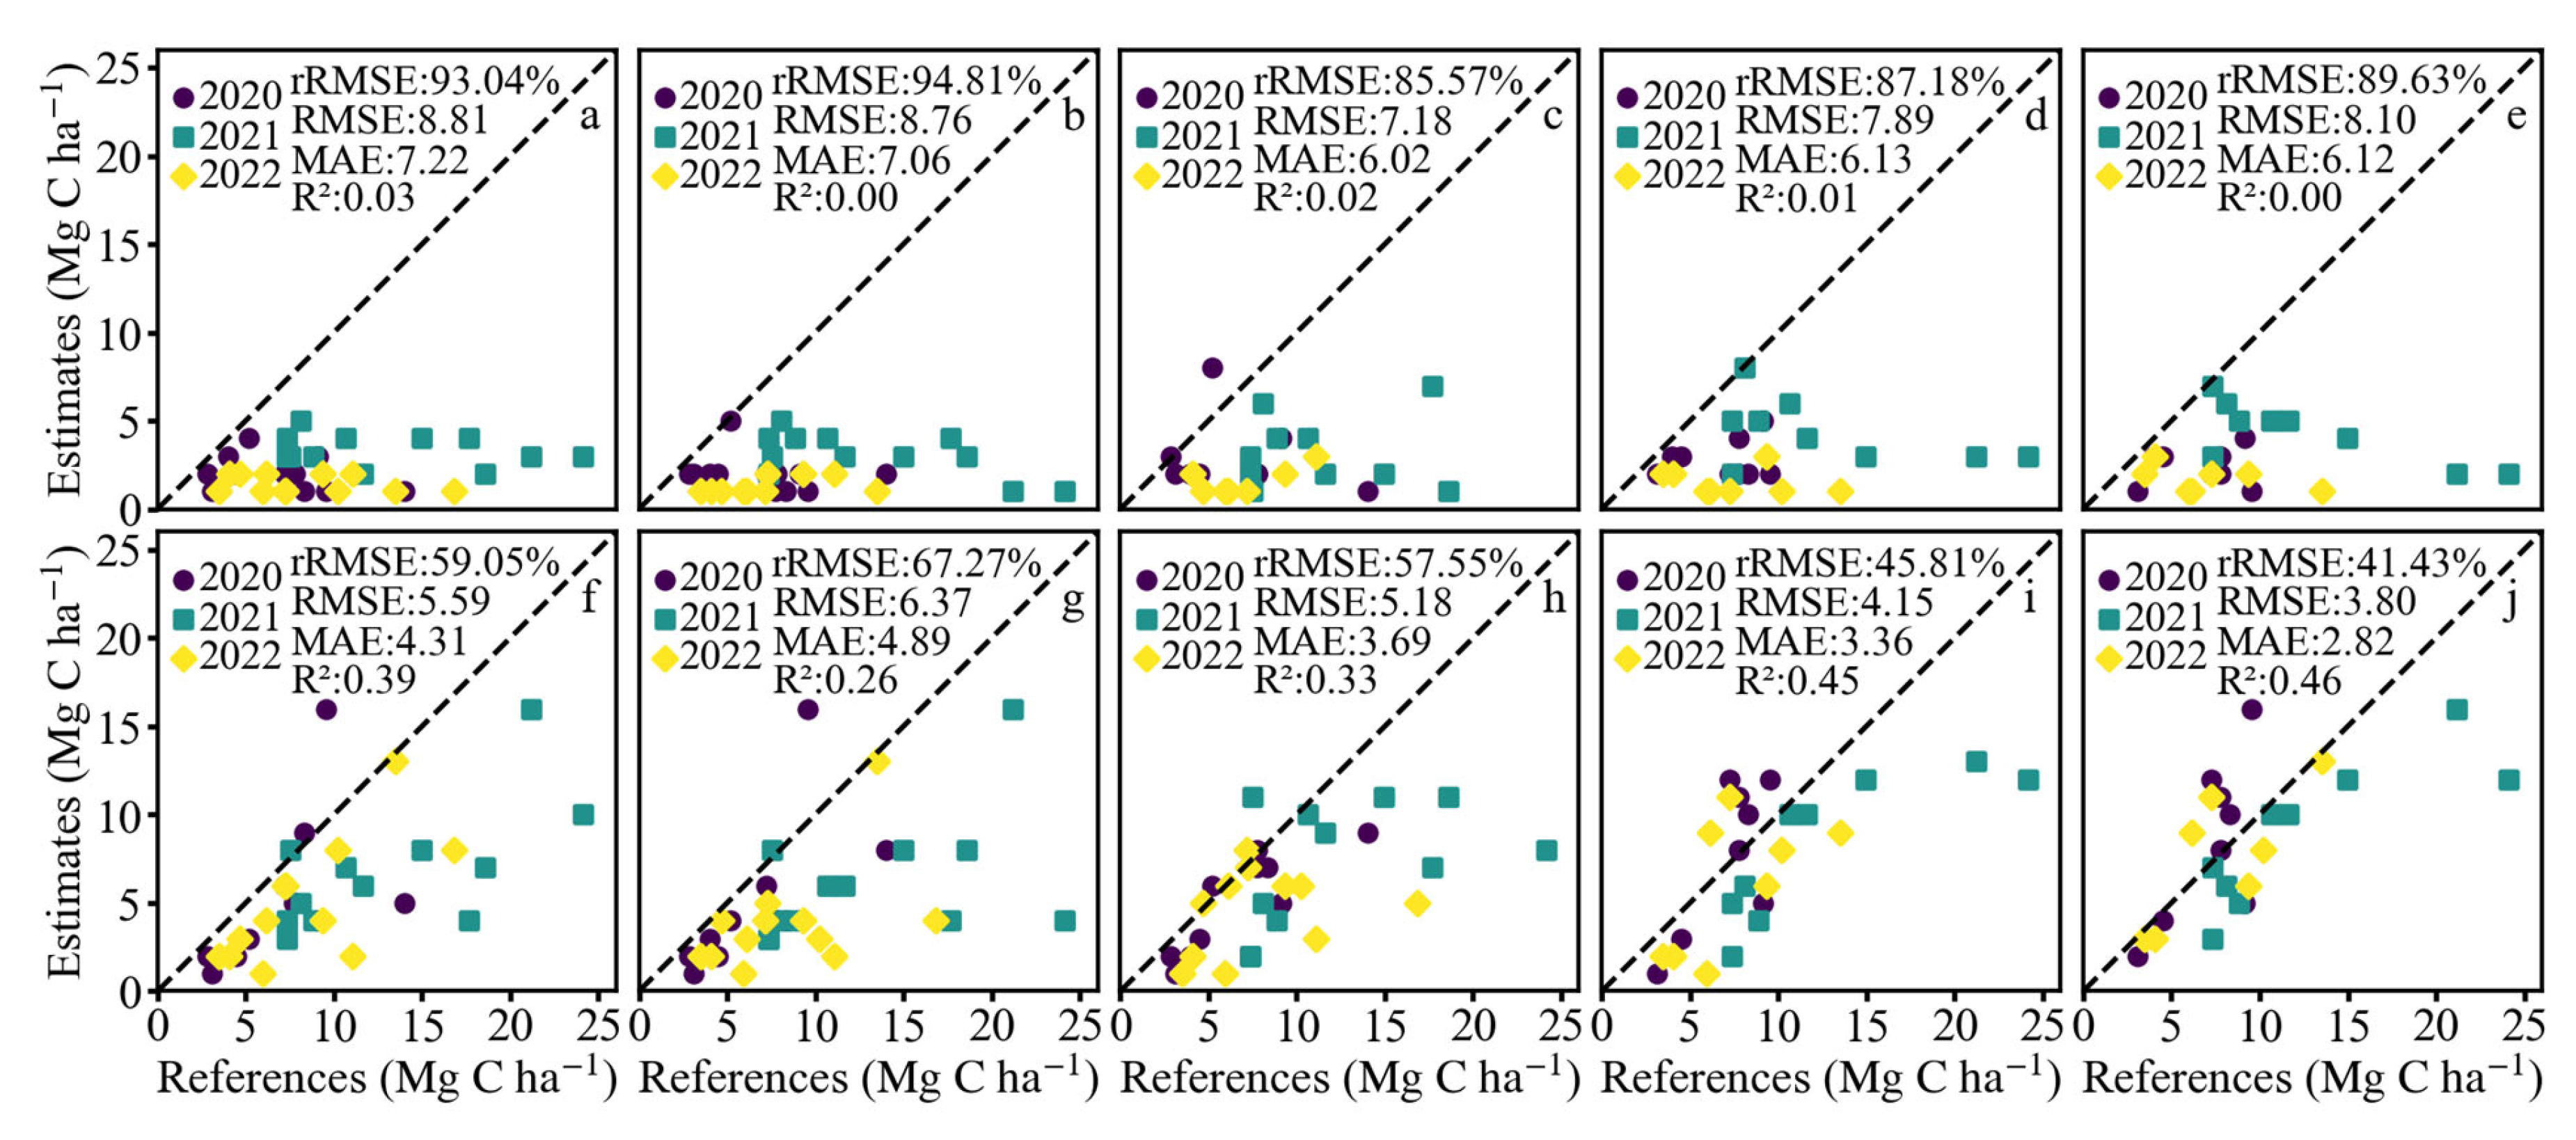
Simulation results from the original InTEC model generally overestimated the carbon density values observed in plot surveys, with notable differences arising from the influence of various drive data sources on these outcomes. Simulations driven by CDJiang demonstrated a significantly higher accuracy compared to those driven by both ACDYang and ACDYan, and also outperformed NPP-driven simulations. Furthermore, models using ACDYang and ACDYan exhibited lower accuracy relative to the NPP-driven simulations (Figure 4a–e). The InTECeuc model, in contrast, exhibited a distinct behavior: the NPP-driven simulations tended to slightly underestimate plot measurements, while carbon density-driven versions generally produced a mild overestimation. Nevertheless, the InTECeuc model substantially outperformed the original InTEC model. Notable improvements included NPPMODIS-driven results (R2 increased by 0.44, MAE reduced by 7.65 Mg C ha−1, RMSE decreased by 13.38 Mg C ha−1, and rRMSE improved by 21.94%) and ACDYang-driven outcomes (R2 increased by 0.56, MAE reduced by 28.51 Mg C ha−1, RMSE decreased by 31.85 Mg C ha−1, rRMSE improved by 51.82%) (Figure 4f–j).
In simulating carbon density change, the results of the InTEC model were significantly lower than the plot survey data (Figure 5a,b). However, the InTECeuc model demonstrated improvements in simulating carbon density change. Although some deviations remained, it represented a substantial advancement compared to the original InTEC model. In the NPP-driven InTECeuc model, the simulation accuracy improved significantly, particularly for simulations driven by NPPMODIS, where R2 increased by 0.36, MAE was reduced by 2.91 Mg C ha−1, RMSE decreased by 3.22 Mg C ha−1, and rRMSE was improved by 33.99% (Figure 5f,g). The carbon density-driven InTECeuc model also demonstrated significant improvement, especially for simulations driven by ACDYang and ACDYan. Specifically, R2 increased by an average of 0.45, MAE was reduced by 3.04 Mg C ha−1, RMSE decreased by 4.02 Mg C ha−1, rRMSE was improved by 44.79%, and the simulation performance clearly surpassed that of the NPP-driven InTECeuc model (Figure 5h–j).
The simulation results for carbon density, obtained from the NPP- and carbon density-driven InTEC and InTECeuc models, revealed distinct temporal trends. Specifically, the NPP- and carbon density-driven InTEC model exhibited continuous growth, whereas the InTECeuc model displayed fluctuating dynamics. For the NPP-driven InTEC model, the simulated carbon density ranged from 7 to 107 Mg C ha−1 (Figure 6a,b). The carbon density-driven InTEC model showed greater dispersion, particularly when driven by the ACDYang and ACDYan (resulting in a range of 8 to 153 Mg C ha−1). These higher values and greater dispersion were primarily attributed to differences in the carbon density range of the respective input data (Figure 6c–e). In comparison, the InTECeuc model demonstrated superior capabilities in capturing the dynamic changes in eucalyptus plantations. When driven by carbon density data, its simulated carbon density ranged from 0 to 138 Mg C ha−1, a range that was slightly broader and had a higher maximum than the 0 to 107 Mg C ha−1 range for the NPP-driven model (Figure 6f–j).

3.1.2. Accuracy Evaluation of InTECDA Model

The InTECDA model, driven by carbon density data, demonstrated improvement in simulating both carbon density and its change compared to the InTECeuc model (Figure 7). The simulation accuracy of carbon density improved overall, with R2 increasing by 0–0.03 (excluding ACDYan), MAE being reduced by 0.17–7.22 Mg C ha−1, RMSE decreasing by 0.33–12.94 Mg C ha−1, and rRMSE being improved by 0.51–20.22% (Figure 7a–d). The simulation error for carbon density change also decreased significantly, with R2 increasing by 0.01–0.05, MAE being reduced by 0.02–0.07 Mg C ha−1, RMSE decreasing by 0.12–0.18 Mg C ha−1, and rRMSE being improved by 1.19–1.91% (excluding ACDYan) (Figure 7e–h).
Compared to the InTECeuc model, the InTECDA model exhibited a significantly higher accuracy in simulating carbon density, with the results being more closely aligned with the plot survey data. The influence of different driving data on simulation performance was also evident. With the InTECDA model, simulations driven by CDPlots and CDJiang produced notably higher accuracy than those driven by ACDYan. Nonetheless, the performance of the ACDYan-driven simulation also improved relative to the InTECeuc model, with MAE being reduced by 7.22 Mg C ha−1, RMSE decreasing by 12.94 Mg C ha−1 and rRMSE being improved by 20.22% (Figure 4j or Figure 7d). In terms of simulating carbon density change, both the InTECeuc and InTECDA models underestimated the plot survey data. However, the InTECDA model showed clear improvements, particularly when driven by CDJiang, with R2 increasing by 0.05, MAE being reduced by 0.07 Mg C ha−1, RMSE decreasing by 0.18 Mg C ha−1, and rRMSE being improved by 1.91% (Figure 5h or Figure 7g). In contrast, simulations driven by ACDYan exhibited a slight decline in performance, with R2 decreasing by 0.04, MAE increasing by 0.51 Mg C ha−1, RMSE increasing by 0.88 Mg C ha−1, and rRMSE increasing by 10.29% (Figure 5j or Figure 7h).
Simulations using the carbon density-driven model (InTECeuc and InTECDA models) displayed fluctuating results, with CDPlots producing the most accurate outputs (Figure 8a–d). Simulations driven by CDPlots in both the InTECeuc and InTECDA models showed nearly identical ranges (0–102 Mg C ha−1), and those driven by CDJiang also showed nearly identical ranges (0–87 Mg C ha−1), but the plot-level simulated values varied, as seen in Plot05. The ACDYan-driven simulations showed marked changes in output range, including a 32 Mg C ha−1 decrease in the output range maximum values and pronounced plot-level variations, with InTECeuc producing 0–138 Mg C ha−1 and InTECDA 0–106 Mg C ha−1. The simulations driven by CDJiang produced slightly elevated outputs compared to those using CDPlots; ACDYan-driven InTECeuc model simulations substantially exceeded the CDPlots results, while the InTECDA simulations using the ACDYan data were modestly higher than the CDPlots results (Figure 8a–d).

3.2. Spatiotemporal Variation Characteristics of Eucalyptus Carbon Budgets with InTECeuc Model

3.2.1. Temporal Variation Characteristics of Carbon Budgets

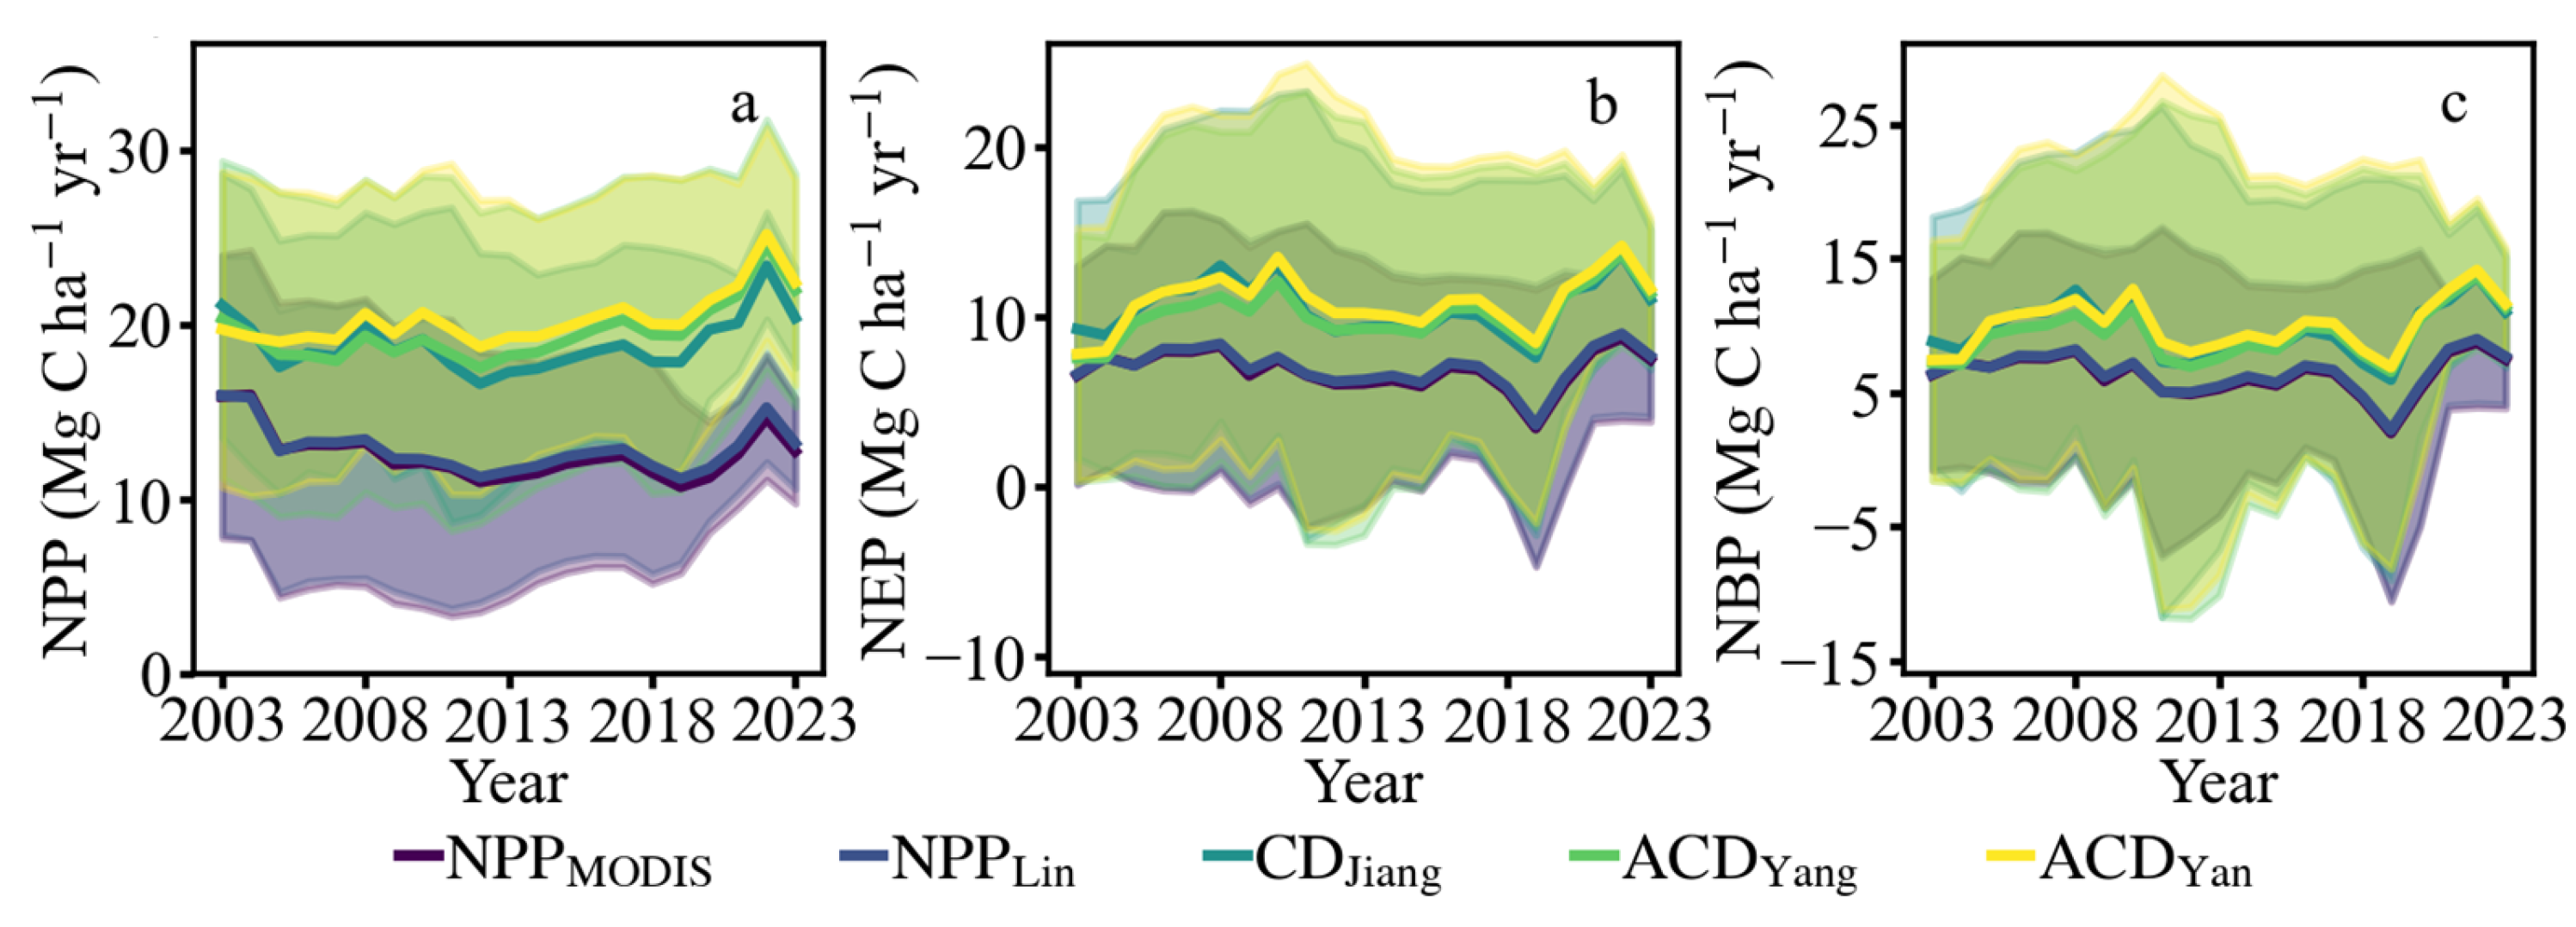
Over the past two decades, the eucalyptus plantations in our study area have exhibited a strong carbon sequestration capacity and have consistently functioned as carbon sinks. The simulation outcomes from the carbon density-driven InTECeuc model indicated upward trends in NPP, NEP, and NBP, whereas the NPP-driven InTECeuc model displayed decreased trends in NPP, with increases in both NEP and NBP (Figure 9). Specifically, under NPP data driving, the multi-year averages of NPP, NEP, and NBP were 12.71 Mg C ha−1 yr−1, 6.93 Mg C ha−1 yr−1, and 6.41 Mg C ha−1 yr−1, respectively. In contrast, when driven by carbon density data, these averages for NPP, NEP, and NBP increased to 19.56 Mg C ha−1 yr−1, 10.52 Mg C ha−1 yr−1, and 9.68 Mg C ha−1 yr−1, respectively. The results from the carbon density-driven InTECeuc model were generally higher and exhibited greater fluctuation, highlighting the significant impact of the driving data on the model output.
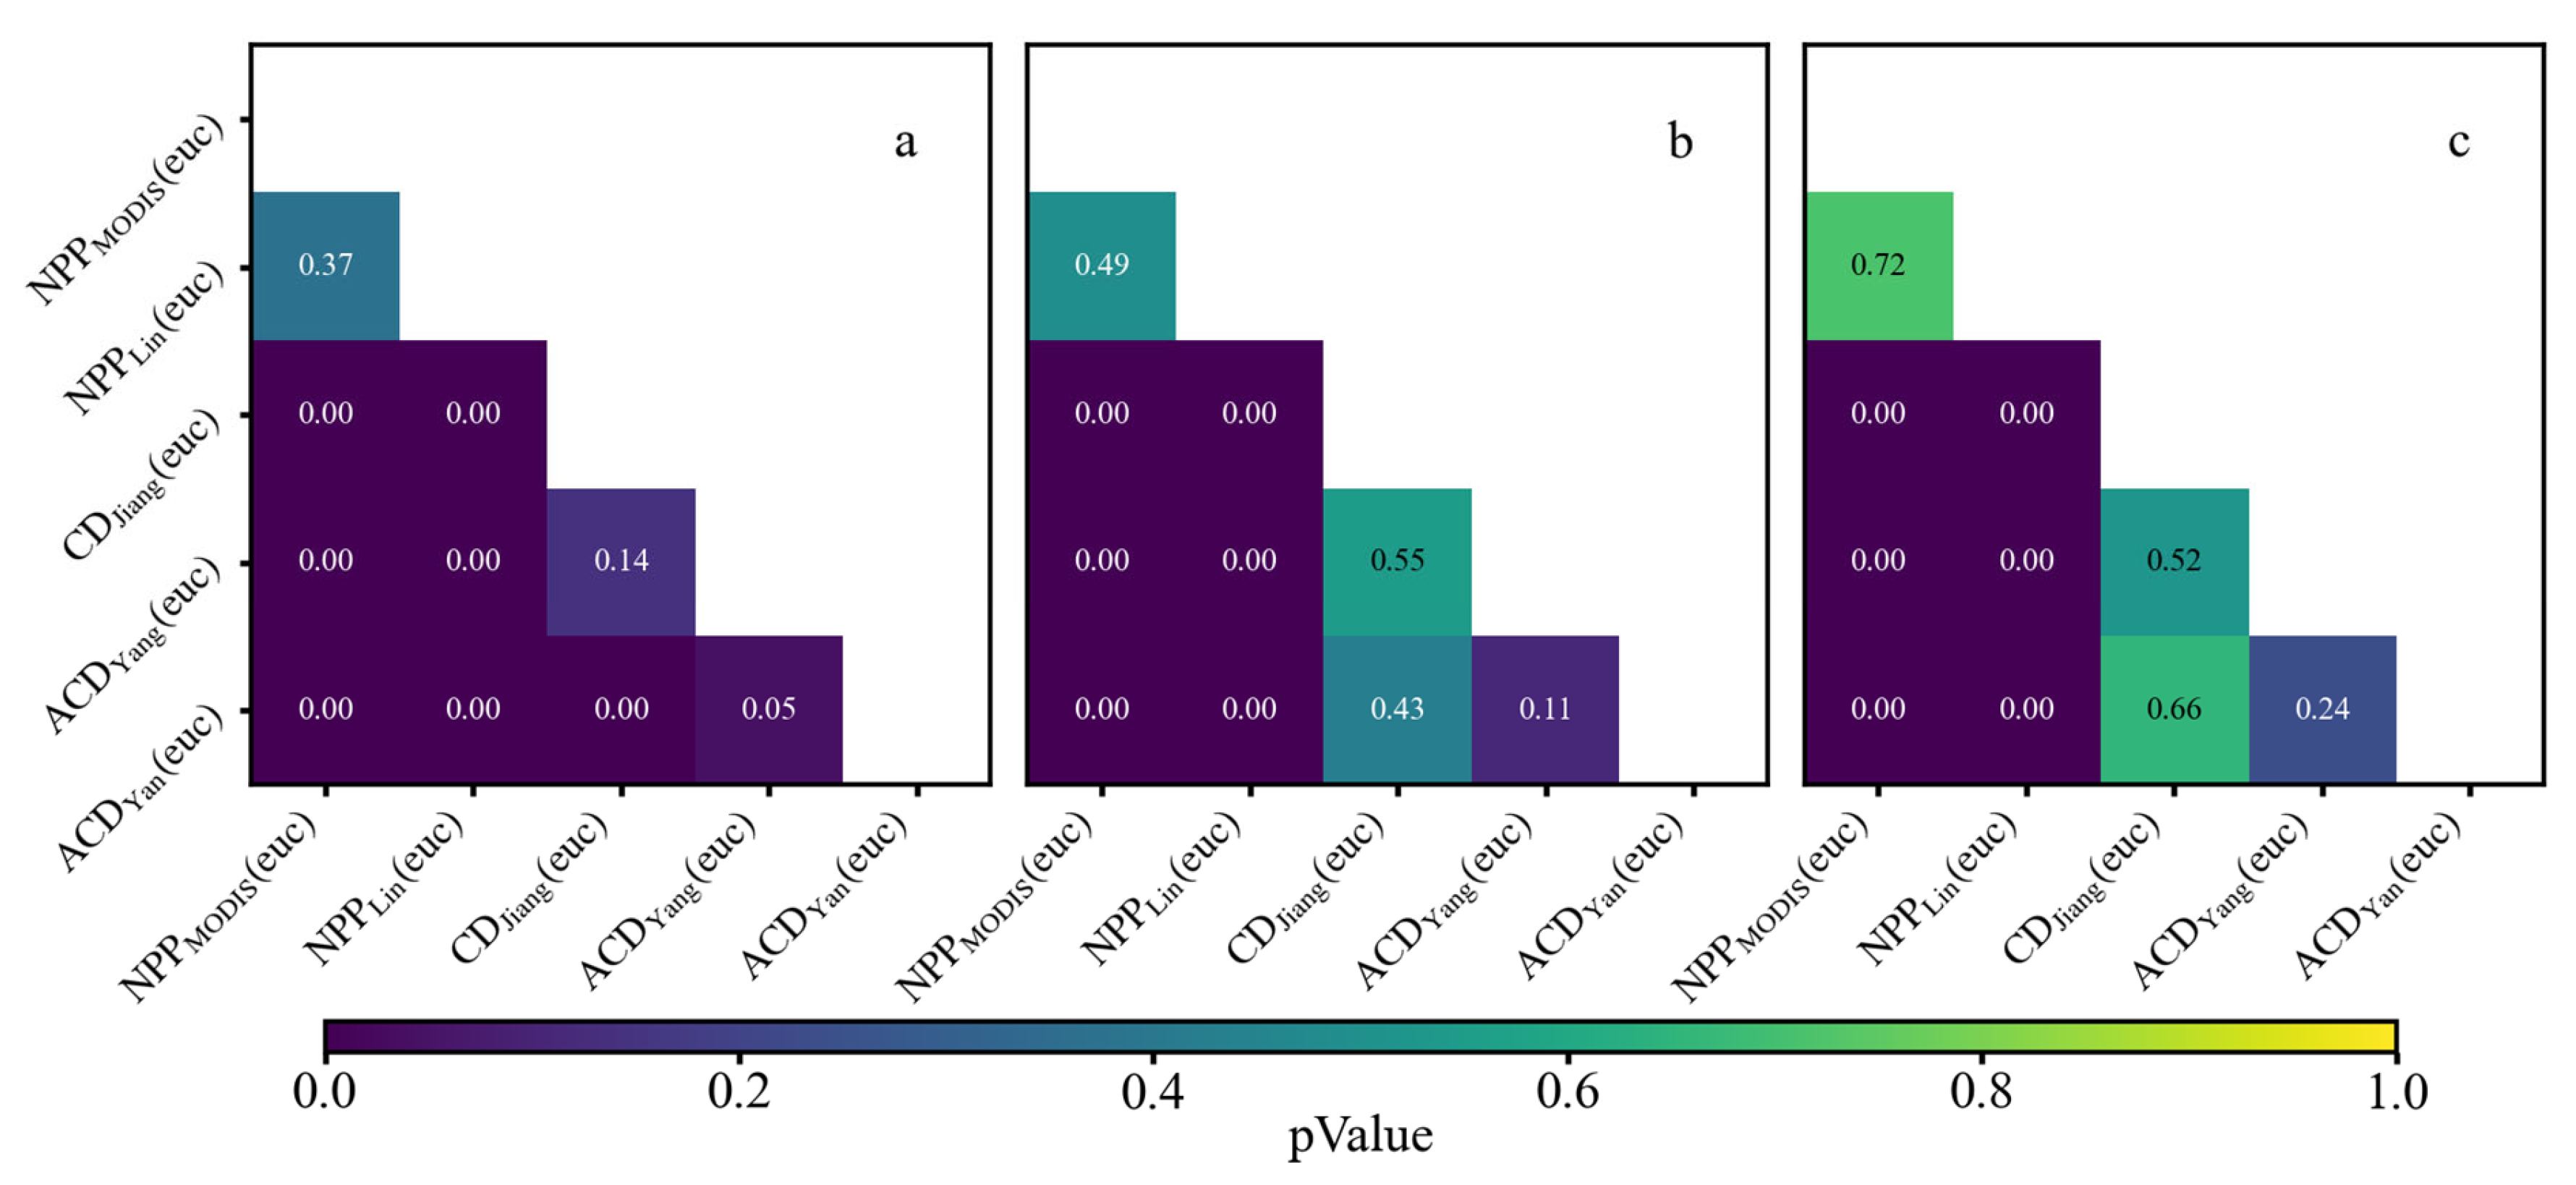
When using different data (NPP and carbon density) to drive the InTECeuc model for simulating carbon budgets on an annual scale, notable differences were observed in the results, particularly between the NPP- and carbon density-driven simulations (Figure 10). However, within the same data, the simulation results exhibited certain regularities. Specifically, the NPP, NEP, and NBP in the results driven by NPP showed strong intercorrelations, reflecting the intrinsic relationships within the same data driving set (NPP-driven data). Similarly, the NEP and NBP results driven by carbon density also demonstrated correlations. Furthermore, significant differences were observed between the simulated NPP results driven by CDJiang and ACDYang and those driven by ACDYan. Nonetheless, the NPP results from the CDJiang and ACDYang data still showed some correlation, attributable to the inherent relationships between these datasets (carbon density-driven data).

3.2.2. Spatial Variation Characteristics

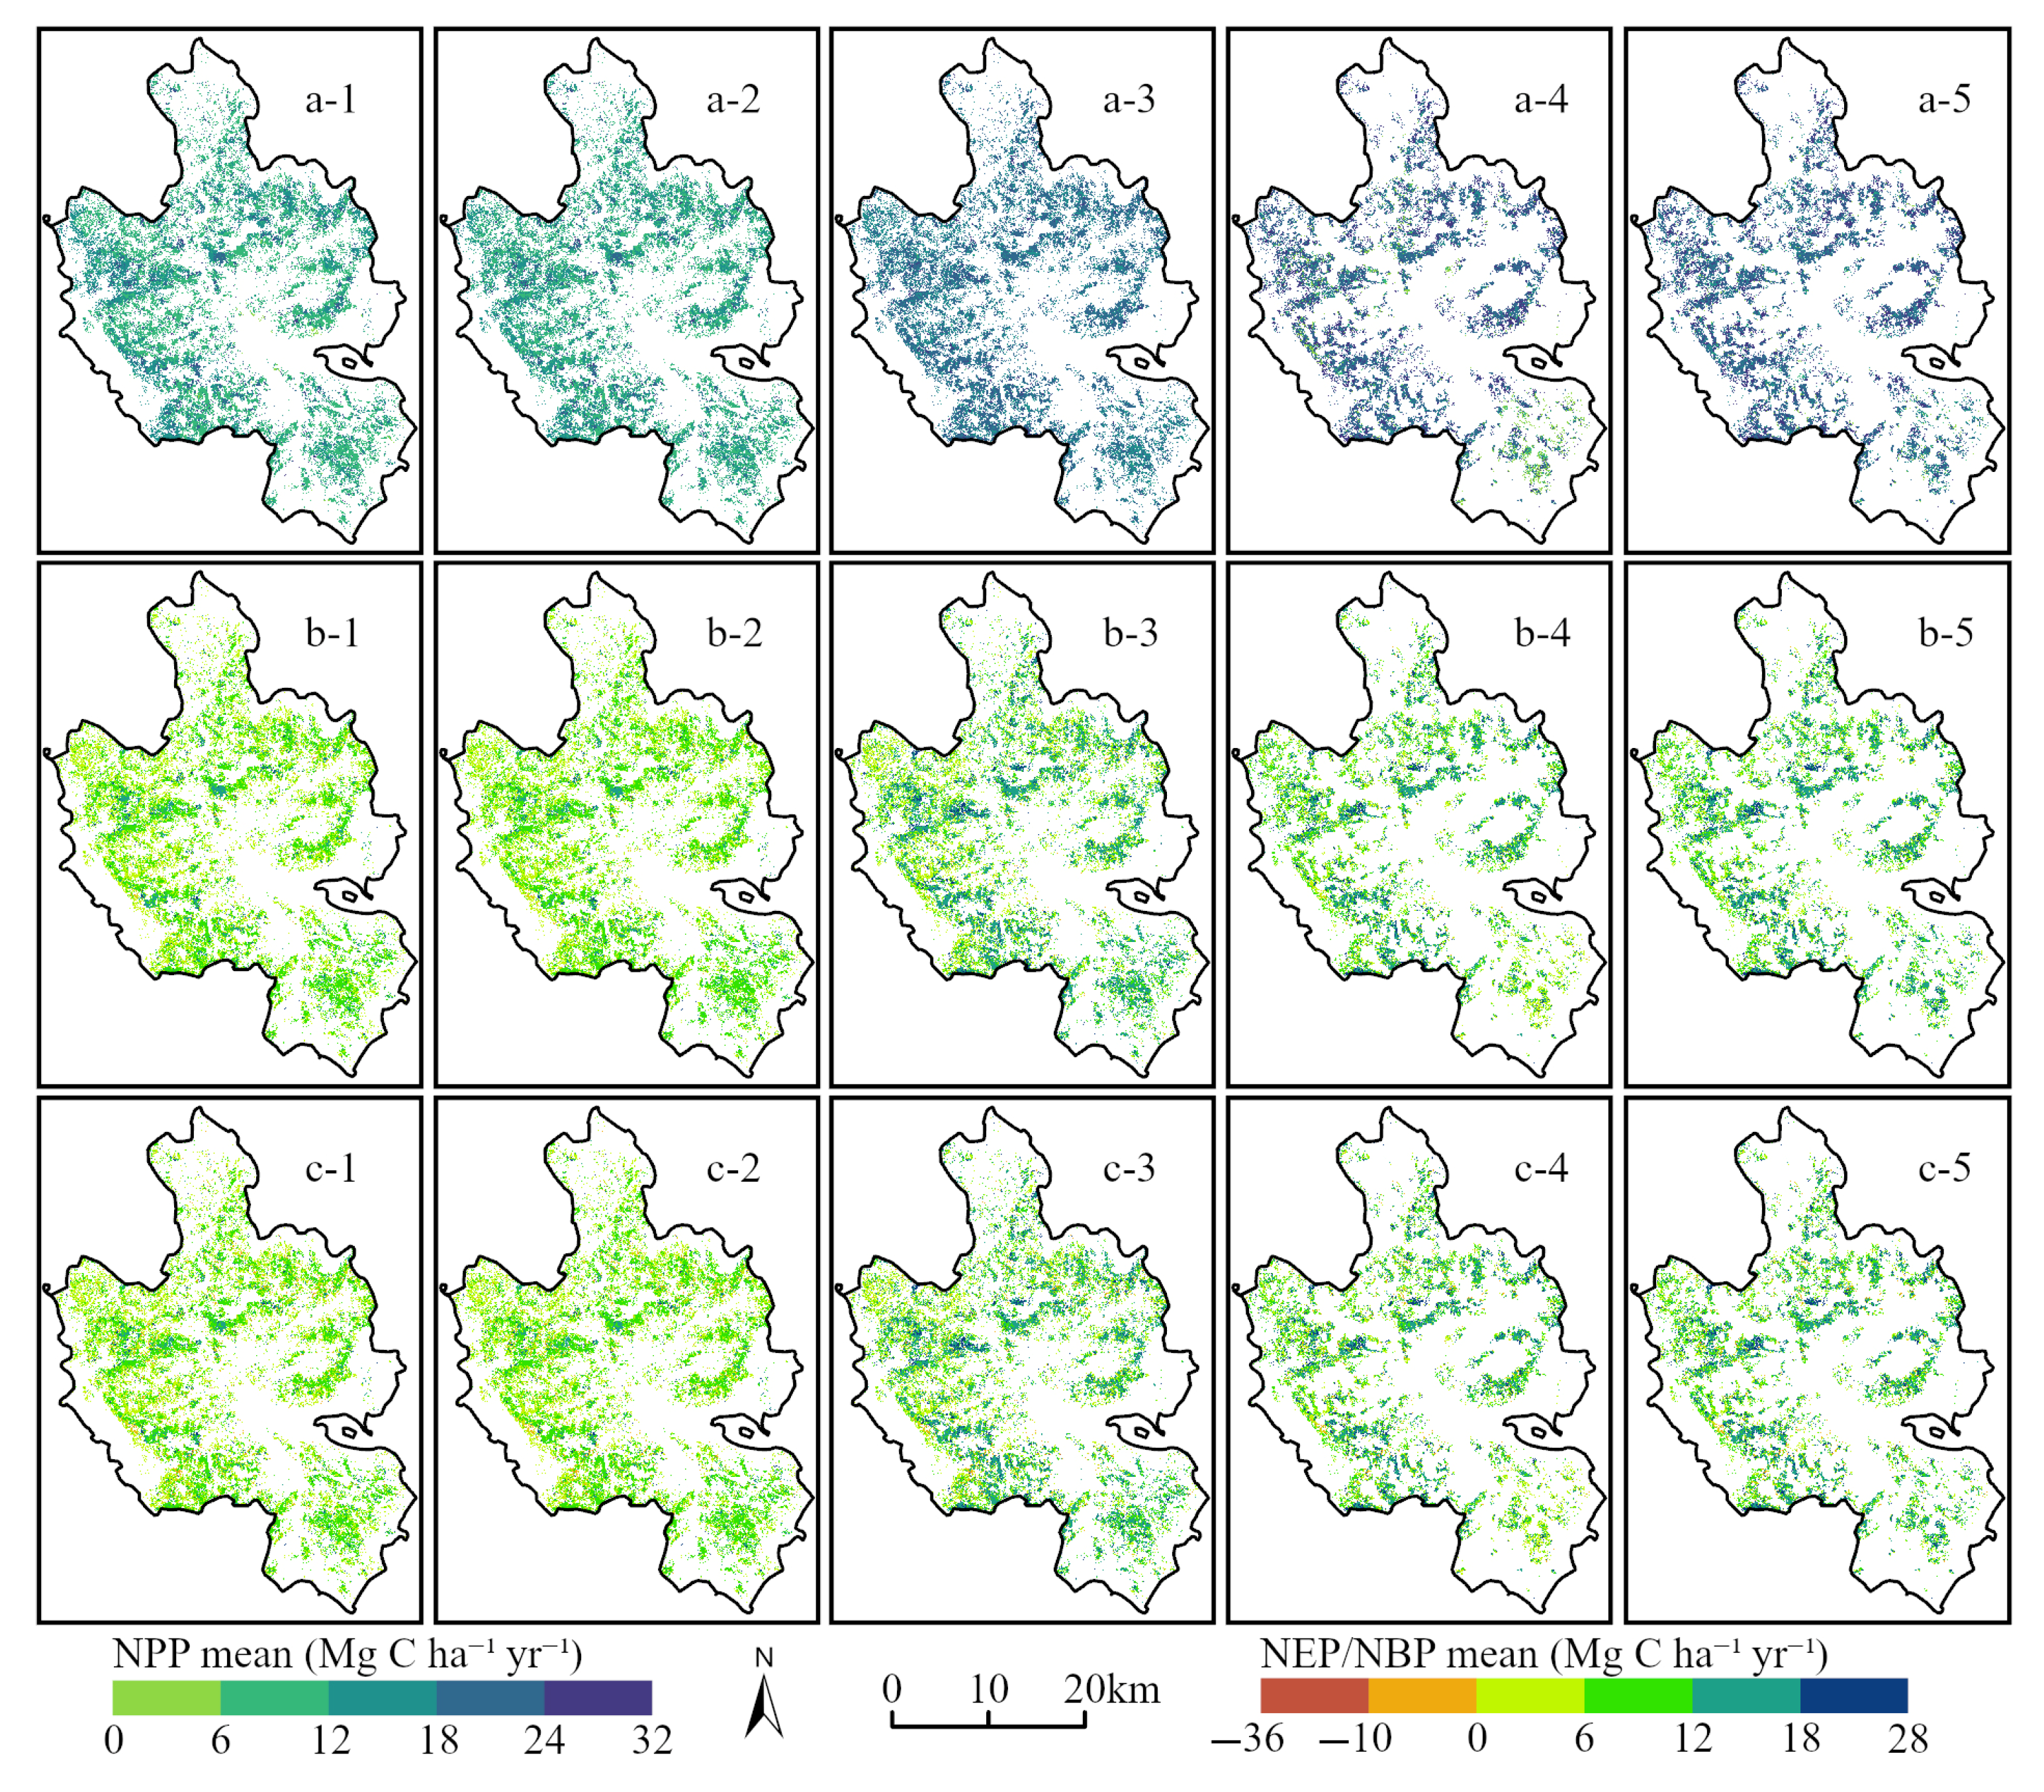
On the spatial scale, the eucalyptus plantations in our study area also exhibited a strong carbon sequestration capacity, although areas exhibiting carbon source phenomena were also observed. The carbon budget results (NPP, NEP, NBP) from the InTECeuc model driven by carbon density were generally higher than those from simulations driven by NPP, particularly in the simulation of NPP (Figure 11). Specifically, the results from the NPP-driven InTECeuc model indicated that spatially distributed NPP values were primarily concentrated in the range of 6 to 27 Mg C ha−1 yr−1, NEP values in the range of 0 to 18 Mg C ha−1 yr−1, and NBP values between −10 and 18 Mg C ha−1 yr−1. In contrast, the results from the carbon density-driven InTECeuc model showed that NPP values primarily concentrated in the range of 12 to 30 Mg C ha−1 yr−1, NEP values in the range of 0 to 24 Mg C ha−1 yr−1, and NBP values between −10 to 24 Mg C ha−1 yr−1.
The spatial distributions of carbon budgets from the InTECeuc model, when driven by carbon density data versus NPP data, showed a fundamental consistency. Regions of strong carbon sequestration (acting as high carbon sinks) and regions acting as high carbon sources were largely co-located and covered approximately 95% of the eucalyptus plantation area (Figure 12). The overall carbon sequestration capacity and the extent of carbon sink areas simulated by the NPP-driven InTECeuc model were significantly lower than those derived from carbon density. The NPP-driven results exhibited a more widespread spatial distribution, which can be attributed to the resolution (resampled from 250 m to 30 m) of the input NPP data and associated differences in forest classification.

3.3. Spatiotemporal Variation Characteristics of Eucalyptus Carbon Budgets with InTECDA Model

3.3.1. Temporal Variation Characteristics

Simulations using the InTECDA model, driven by carbon density data, revealed upward trends in NPP, NEP, and NBP, with multi-year averages of 17.80 Mg C ha−1 yr−1, 10.09 Mg C ha−1 yr−1, and 9.32 Mg C ha−1 yr−1, respectively (Figure 13). Prior to 2012, carbon budget results (mean values and standard deviations) from the InTECDA model when driven by the CDJiang data versus the ACDYan data exhibited significant discrepancies; however, after 2012, the metrics derived from these two data-driven datasets became nearly identical.
Annual-scale carbon budget simulations using carbon density data-driven models exhibited progressively enhanced correlations, with NPP results showing significant differences, while NEP and NBP outputs were significantly correlated (Figure 14). The CDJiang-driven models showed correlation in NPP simulations, contrasting with the significant discrepancies observed in ACDYan-based outputs.

3.3.2. Spatial Variation Characteristics of InTECDA Model

When the InTECDA model was driven by different carbon density data, the resulting distribution patterns of carbon budgets were similar to each other, yet retained variations in their amplitude extremes (Figure 15). The relatively smaller differences in overall carbon budget outcomes (NPP, NEP, NBP) observed when the InTECDA model was driven by these various carbon density data were attributed to the model’s methodology, where NEP and NBP were primarily determined by the simulated NPP (which was more consistently estimated by InTECDA across these different carbon density inputs due to data assimilation) and partitioning coefficients.
The spatial patterns from the carbon density-driven InTECDA model showed consistency with those from the InTECeuc model. The results also indicated that eucalyptus plantations with a high carbon sequestration capacity predominantly occurred in management-intensive areas (Figure 12 and Figure 16). Conversely, regions exhibiting lower carbon sequestration capacities were situated in areas receiving limited management interventions. While the spatial distribution of carbon sources showed no clear regularity, carbon sources were primarily concentrated where logging occurred after 2015, with these regions typically experiencing more than two deforestation events during the study period.

4. Discussion

4.1. The Performance of Improved InTEC Model

The NPP- and carbon density-driven InTEC models exhibited systematic overestimation and persistent growth trends in the simulated carbon density, coupled with underestimations of carbon density change, primarily due to unaccounted multi-rotation eucalyptus management cycles and discrepancies in input data accuracy. In contrast, the InTECeuc model driven by NPP and carbon density data demonstrated closer alignment with plot-surveyed eucalyptus carbon stocks. The NPP-driven simulations slightly underestimated actual carbon stocks due to NPP product underestimation biases in eucalyptus plantations [15,16,17]. The carbon density-driven simulations achieved a superior accuracy, particularly when utilizing CDJiang data that incorporates age and carbon density relationships through established allometric equations. Conversely, ACDYang and ACDYan data—employing random forest algorithms for aboveground biomass prediction without age considerations—produced substantial carbon density overestimations. The carbon density–driven InTECDA model demonstrated superior accuracy (e.g., when using CDJiang data), because during parameter optimization InTECDA not only accounts for input data uncertainty but also introduces a calibration function to attenuate heterogeneity among different data sources, thereby further improving model performance; however, due to substantial errors in the ACDYan dataset, the simulation accuracy remains somewhat constrained.
Baseline discrepancies in carbon density data directly influence the calibration of the NPP0 parameter, thereby altering the model’s carbon accumulation rate and overall budget trajectory. Although the InTECeuc model achieved significant gains in simulating harvested pixels, it continued to overestimate carbon density and underestimate its change in non-harvested pixels; these biases were effectively corrected in the InTECDA model by applying functions to adjust the input carbon density, establish a more accurate baseline, and recalibrate NPP0, markedly improving the precision and reliability of carbon budget simulations. Although the carbon density calculation carried out by the InTECDA model is relatively accurate, there are discrepancies in the growth rate of eucalyptus carbon density. For instance, Z. Yu et al. (2020) [42] reported eucalyptus carbon density growth ranging from 4.77 to 9.19 Mg C ha−1 yr−1 under different management intensities, while Wen et al. (2014) [43] found a range of 3.1 to 12.58 Mg C ha−1 yr−1, and Tao et al. (2011) [44] observed fluctuations between 2.68 and 31.62 Mg C ha−1 yr−1. The InTECDA model generally underestimates eucalyptus carbon density growth, particularly when the growth exceeds 15 Mg C ha−1 yr−1. This discrepancy may be attributed to site conditions, management practices, and measurement errors in eucalyptus plantations.
Compared to alternative models, the InTECDA model demonstrated superior performance in simulating carbon budgets for eucalyptus plantations at the plot scale, while maintaining robust spatial-scale predictive capabilities. Several process-based models have been used to simulate the carbon budgets of eucalyptus plantations, including the 3-PG model [45], the Forest-DNDC model [46], and the ECOSMOS model [47] (Table 4). Although validation datasets preclude direct model comparisons, the 3-PG model achieved the highest accuracy through region-specific parameterization of eucalyptus growth dynamics and the incorporation of thinning practices. Forest-DNDC and InTECDA simulations showed marginally lower accuracy than 3-PG, primarily due to the exclusion of thinning operations and the absence of calibrated species-specific growth parameters for InTECDA. Although the ECOSMOS model has developed a dedicated module and adjusted its parameters, its results still require further optimization. Despite lacking specialized parameter calibration or thinning regime integration, the InTECDA model effectively simulates eucalyptus plantation carbon budgets using essential spatial inputs, maintaining sufficient predictive accuracy for Chinese plantations.

4.2. Carbon Budgets of Eucalyptus

The carbon density-driven InTECeuc simulations (19.56 Mg C ha−1 yr−1) aligned closely with the measured NPP in Mozambican Manica eucalyptus plots (19.71 ± 1.30 Mg C ha−1 yr−1) [48], and were slightly lower than that in New South Wales, Australia (22.44 Mg C ha−1 yr−1) [17] while exceeding Guangxi plantation observations (16.89 Mg C ha−1 yr−1) [28]. The InTECDA simulations (17.80 Mg C ha−1 yr−1) moderately surpassed Guangxi’s field NPP values yet remained below both Mozambican Manica and New South Wales benchmarks. NPP-driven InTECeuc simulations systematically underestimated multi-year NPP due to inherent input data biases (NPP values < 17 Mg C ha−1 yr−1) compared to empirical measurements.
Carbon budgets are influenced not only by vegetation cover and LAI but also by the combined effects of forest management practices, soil properties, and climatic factors. Cleverly et al. (2020) [49] likewise demonstrated that variation in NEP is influenced by multiple factors, including species, climate, under-story composition, and management. In Brazilian eucalyptus plantations with a 6-year rotation period, NEP increased from 9.93 Mg C ha−1 yr−1 to 14 Mg C ha−1 yr−1 between the second and third years [50]. Australian eucalyptus plantations in Victoria transitioned from carbon sources to sinks approximately two years post-establishment [51]. Although the carbon density-driven InTECeuc and InTECDA simulations replicated NEP levels comparable to Brazilian observations and mirrored source–sink transition timelines similar to those in Victoria, under short-rotation harvest regimes NEP increases within individual rotations but declines markedly over successive rotations. In the short term, rapid return of residues—branches, leaves, and roots—temporarily enhances soil carbon inputs; however, frequent soil disturbances accelerate residue decomposition and carbon mineralization and amplify carbon losses via erosion and leaching, progressively undermining the soil’s carbon sequestration capacity and increasing soil carbon release [3,52]. This mechanism not only limits the sustained enhancement of long-term NEP but also constrains the growth of NBP. Simulated NBP consistently lagged behind NEP (by 0.84 Mg C ha−1 yr−1 for InTECeuc and 0.77 Mg C ha−1 yr−1 for InTECDA, respectively), primarily due to harvesting. Both InTECeuc and InTECDA identified multi-rotation eucalyptus plantations as persistent carbon sinks, aligning with findings by Tong et al. (2020) [53], who reported that forests with short rotation periods are carbon sinks. Eucalyptus plantations typically function as annual carbon sinks, though harvesting can reduce their carbon sink capacity, potentially transforming them into carbon sources, as noted by A. Rodrigues et al. (2011) [54].

4.3. Limitations and Potential Improvements

While the carbon density-driven InTECDA model’s outputs moderately aligned with field-measured eucalyptus carbon density, temporal changes in carbon stocks were consistently underpredicted. The observed biases originated from systemic inaccuracies in carbon density input data and potential flaws in data assimilation parameter configurations, collectively limiting the model’s ability to correct errors effectively. Previous studies have demonstrated that incorporating the Kalman filter algorithm can significantly improve soil respiration rate data accuracy, thereby enhancing the InTEC model’s performance in NEP estimation [55]. Future research should prioritize (1) establishing additional eucalyptus plots and eddy-covariance towers within the study area, integrating LiDAR point clouds and high-resolution UAV imagery to build a multi-scale, multi-source dataset, and performing systematic plot-to-regional scale validation to comprehensively improve the model’s applicability and generalizability and (2) integrating advanced data assimilation to refine biomass inputs and recalibrate InTECDA parameters based on data characteristics, thereby improving the accuracy of eucalyptus plantation carbon budget simulations (carbon density, NPP, NEP, NBP). (3) Although InTEC can simulate soil carbon dynamics, this study validated only aboveground carbon density, and future work should incorporate soil carbon monitoring data [56] and optimized the corresponding parameters [57] to fully evaluate the model’s performance in simulating the complete forest carbon budget.

5. Conclusions

We simulated the carbon budgets of eucalyptus plantations from 2003 to 2023 using distinct datasets (NPP and carbon density) to drive two models (InTECeuc and InTECDA). The results revealed significant discrepancies in simulated NPP, NEP, and NBP between the NPP- and carbon density-driven models, with the fluctuation range strongly dependent on the driving data. NPP-driven InTEC model systematically underestimated carbon budgets, whereas carbon density-driven implementations exhibited pronounced overestimation. The InTECeuc model partially mitigated these biases, with carbon density-driven model outperforming NPP-driven. InTECDA alleviated overestimation biases, achieving optimal carbon density simulations (R2 = 0.72, MAE = 9.93 Mg C ha−1, RMSE = 11.94 Mg C ha−1, rRMSE = 18.25%), and yielding derived NPP, NEP, and NBP values of 18.36, 10.50, and 9.68 Mg C ha−1 yr−1 respectively. The InTECDA model enables high-resolution carbon budget simulations of eucalyptus plantations (2003–2023), providing a scientific basis and technical support for sustainable management that is aligned with carbon neutrality targets.

Author Contributions

Conceptualization, D.L.; methodology, Z.L. and D.L.; software, Z.L.; validation, Z.L. and M.Z.; formal analysis, Z.L. and D.L.; investigation, Z.L., K.L. and Y.W.; resources, D.L.; data curation, Z.L. and D.L.; writing—original draft preparation, Z.L. and D.L.; writing—review and editing, D.L.; visualization, Z.L. and D.L.; supervision, D.L.; project administration, D.L.; funding acquisition, D.L. All authors have read and agreed to the published version of the manuscript.

Funding

This research was financially supported by the Natural Science Foundation of Fujian Province, grant number 2022J01640, National Natural Science Foundation of China, grant number 32371865.

Data Availability Statement

Due to confidentiality agreements, supporting data can only be made available to bona fide researchers subject to a nondisclosure agreement. Details of the data and how to request access are available from Dengqiu Li at Fujian Normal University.

Acknowledgments

The authors thank the reviewers for their help to improve our manuscript.

Conflicts of Interest

The authors declare no conflicts of interest.

References

  1. Cheng, K.; Yang, H.; Tao, S.; Su, Y.; Guan, H.; Ren, Y.; Hu, T.; Li, W.; Xu, G.; Chen, M.; et al. Carbon Storage through China’s Planted Forest Expansion. Nat. Commun. 2024, 15, 4106. [Google Scholar] [CrossRef]
  2. Zhang, Y.; Wang, X. Geographical Spatial Distribution and Productivity Dynamic Change of Eucalyptus Plantations in China. Sci. Rep. 2021, 11, 19764. [Google Scholar] [CrossRef] [PubMed]
  3. Li, X.; Ye, D.; Liang, H.; Zhu, H.; Qin, L.; Zhu, Y.; Wen, Y. Effects of Successive Rotation Regimes on Carbon Stocks in Eucalyptus Plantations in Subtropical China Measured over a Full Rotation. PLoS ONE 2015, 10, e0132858. [Google Scholar] [CrossRef] [PubMed]
  4. Keenan, T.F.; Williams, C.A. The Terrestrial Carbon Sink. Annu. Rev. Environ. Resour. 2018, 43, 219–243. [Google Scholar] [CrossRef]
  5. Li, Q.; Zhu, J.; Feng, Y.; Xiao, W. Carbon Stocks and Carbon Sequestration Capacity of the Main Plantations in China. J. Northwest For. Univ. 2016, 31, 1–6. [Google Scholar] [CrossRef]
  6. Lan, X.; Du, H.; Song, T.; Zeng, F.; Peng, W.; Liu, Y.; Fan, Z.; Zhang, J. Vegetation Carbon Storage in the Main Forest Types in Guangxi and the Related Influencing Factors. Acta Ecol. Sin. 2019, 39, 2043–2053. [Google Scholar] [CrossRef]
  7. Li, D.; Lu, D.; Wu, Y.; Luo, K. Retrieval of Eucalyptus Planting History and Stand Age Using Random Localization Segmentation and Continuous Land-Cover Classification Based on Landsat Time-Series Data. GIScience Remote Sens. 2022, 59, 1426–1445. [Google Scholar] [CrossRef]
  8. Zhao, J.; Liu, D.; Zhu, Y.; Peng, H.; Xie, H. A Review of Forest Carbon Cycle Models on Spatiotemporal Scales. J. Clean. Prod. 2022, 339, 130692. [Google Scholar] [CrossRef]
  9. Wang, S.; Zhou, L.; Chen, J.; Ju, W.; Feng, X.; Wu, W. Relationships between Net Primary Productivity and Stand Age for Several Forest Types and Their Influence on China’s Carbon Balance. J. Environ. Manag. 2011, 92, 1651–1662. [Google Scholar] [CrossRef]
  10. Yu, Y.; Fan, W.; Yang, X. Estimation of Forest NPP in Xiaoxing’an Mountains in 1901–2008. Sci. Silvae Sin. 2014, 50, 16–23. [Google Scholar]
  11. Zheng, J.; Mao, F.; Du, H.; Li, X.; Zhou, G.; Dong, L.; Zhang, M.; Han, N.; Liu, T.; Xing, L. Spatiotemporal Simulation of Net Ecosystem Productivity and Its Response to Climate Change in Subtropical Forests. Forests 2019, 10, 708. [Google Scholar] [CrossRef]
  12. Li, X.; Du, H.; Zhou, G.; Mao, F.; Zheng, J.; Liu, H.; Huang, Z.; He, S. Spatiotemporal Dynamics in Assimilated-LAI Phenology and Its Impact on Subtropical Bamboo Forest Productivity. Int. J. Appl. Earth Obs. Geoinf. 2021, 96, 102267. [Google Scholar] [CrossRef]
  13. Wang, J.; Wu, C.; Zhang, C.; Ju, W.; Wang, X.; Chen, Z.; Fang, B. Improved Modeling of Gross Primary Productivity (GPP) by Better Representation of Plant Phenological Indicators from Remote Sensing Using a Process Model. Ecol. Indic. 2018, 88, 332–340. [Google Scholar] [CrossRef]
  14. Running, S.; Zhao, M. MODIS/Terra Net Primary Production Gap-Filled Yearly L4 Global 500m SIN Grid V061 [Data Set]; NASA EOSDIS Land Processes Distributed Active Archive Center: Sioux Falls, SD, USA, 2021. [Google Scholar] [CrossRef]
  15. Lin, S.; Huang, X.; Zheng, Y.; Zhang, X.; Yuan, W. An Open Data Approach for Estimating Vegetation Gross Primary Production at Fine Spatial Resolution. Remote Sens. 2022, 14, 2651. [Google Scholar] [CrossRef]
  16. Turner, D.P.; Ritts, W.D.; Cohen, W.B.; Gower, S.T.; Running, S.W.; Zhao, M.; Costa, M.H.; Kirschbaum, A.A.; Ham, J.M.; Saleska, S.R.; et al. Evaluation of MODIS NPP and GPP Products across Multiple Biomes. Remote Sens. Environ. 2006, 102, 282–292. [Google Scholar] [CrossRef]
  17. Turner, J.; Lambert, M.J. Nutrient Cycling in Age Sequences of Two Eucalyptus Plantation Species. For. Ecol. Manag. 2008, 255, 1701–1712. [Google Scholar] [CrossRef]
  18. Rajab Pourrahmati, M.; Le Maire, G.; Baghdadi, N.; Alvares, C.A.; Stape, J.L.; Scolforo, H.F.; Campoe, O.C.; Nouvellon, Y.; Guillemot, J. Integrating MODIS-Derived Indices for Eucalyptus Stand Volume Estimation: An Evaluation of MODIS Gross Primary Productivity. Front. Remote Sens. 2025, 6, 1588387. [Google Scholar] [CrossRef]
  19. Yang, Q.; Niu, C.; Liu, X.; Feng, Y.; Ma, Q.; Wang, X.; Tang, H.; Guo, Q. Mapping High-Resolution Forest Aboveground Biomass of China Using Multisource Remote Sensing Data. GIScience Remote Sens. 2023, 60, 2203303. [Google Scholar] [CrossRef]
  20. Jiang, X.; Li, D.; Li, G.; Lu, D. Eucalyptus Carbon Stock Estimation in Subtropical Regions with the Modeling Strategy of Sample Plots—Airborne LiDAR—Landsat Time Series Data. For. Ecosyst. 2023, 10, 100149. [Google Scholar] [CrossRef]
  21. Li, X.; Liu, F.; Ma, C.; Hou, J.; Zheng, D.; Ma, H.; Bai, Y.; Han, X.; Vereecken, H.; Yang, K.; et al. Land Data Assimilation: Harmonizing Theory and Data in Land Surface Process Studies. Rev. Geophys. 2024, 62, e2022RG000801. [Google Scholar] [CrossRef]
  22. Li, X.; Ma, H.; Ran, Y.; Wang, X.; Zhu, G.; Liu, F.; He, H.; Zhang, Z.; Huang, C. Terrestrial Carbon Cycle Model-Data Fusion: Progress and Challenges. Sci. China Earth Sci. 2021, 64, 1645–1657. [Google Scholar] [CrossRef]
  23. Liu, L.; Song, B. Calculating the Carbon Sequestration Rate of Terrestrial Ecosystems: Methods, Progress and Challenges. Trans. Atmos. Sci. 2022, 45, 321–331. [Google Scholar]
  24. Zhu, H.; Wu, M.; Jiang, F.; Vossbeck, M.; Kaminski, T.; Xing, X.; Wang, J.; Ju, W.; Chen, J.M. Assimilation of Carbonyl Sulfide (COS) Fluxes within the Adjoint-Based Data Assimilation System—Nanjing University Carbon Assimilation System (NUCAS v1.0). Geosci. Model Dev. 2024, 17, 6337–6363. [Google Scholar] [CrossRef]
  25. Cheng, W.; Dan, L.; Deng, X.; Feng, J.; Wang, Y.; Peng, J.; Tian, J.; Qi, W.; Liu, Z.; Zheng, X.; et al. Global Monthly Gridded Atmospheric Carbon Dioxide Concentrations under the Historical and Future Scenarios. Sci. Data 2022, 9, 83. [Google Scholar] [CrossRef] [PubMed]
  26. Gao, Y.; Zhou, F.; Ciais, P.; Miao, C.; Yang, T.; Jia, Y.; Zhou, X.; Klaus, B.-B.; Yang, T.; Yu, G. Human Activities Aggravate Nitrogen-Deposition Pollution to Inland Water over China. Natl. Sci. Rev. 2020, 7, 430–440. [Google Scholar] [CrossRef]
  27. Yan, S.; He, G.; Zhang, X. Forest Aboveground Biomass Products in China, 2013–2021. Sci. Data Bank 2023, 118, 103275. [Google Scholar] [CrossRef]
  28. Du, H.; Zeng, F.; Wang, K.; Song, T.; Wen, Y.; Li, C.; Peng, W.; Liang, H.; Zhu, H.; Zeng, Z. Dynamics of Biomass and Productivity of Three Major Plantation Types in Southern China. Acta Ecol. Sin. 2014, 34, 2712–2724. [Google Scholar] [CrossRef]
  29. He, L.; Chen, J.M.; Pan, Y.; Birdsey, R.; Kattge, J. Relationships between Net Primary Productivity and Forest Stand Age in U.S. Forests. Global Biogeochem. Cycles 2012, 26, GB3009. [Google Scholar] [CrossRef]
  30. Zhang, Y.; Xu, M.; Chen, H.; Adams, J. Global Pattern of NPP to GPP Ratio Derived from MODIS Data: Effects of Ecosystem Type, Geographical Location and Climate. Glob. Ecol. Biogeogr. 2009, 18, 280–290. [Google Scholar] [CrossRef]
  31. Krug, J.; Koehl, M.; Riedel, T.; Bormann, K.; Rueter, S.; Elsasser, P. Options for Accounting Carbon Sequestration in German Forests. Carbon Balance Manag. 2009, 4, 5. [Google Scholar] [CrossRef]
  32. Chen, W.; Chen, J.; Cihlar, J. An Integrated Terrestrial Ecosystem Carbon-Budget Model Based on Changes in Disturbance, Climate, and Atmospheric Chemistry. Ecol. Modell. 2000, 135, 55–79. [Google Scholar] [CrossRef]
  33. Ju, W.M.; Chen, J.M.; Harvey, D.; Wang, S. Future Carbon Balance of China’s Forests under Climate Change and Increasing CO2. J. Environ. Manag. 2007, 85, 538–562. [Google Scholar] [CrossRef]
  34. Li, D.; Zhang, C.; Ju, W.; Liu, L. Forest Net Primary Productivity Dynamics and Driving Forces in Jiangxi Province, China. Chin. J. Plant Ecol. 2016, 40, 643–657. [Google Scholar] [CrossRef]
  35. Chen, W.; Chen, J.; Liu, J.; Cihlar, J. Approaches for Reducing Uncertainties in Regional Forest Carbon Balance. Global Biogeochem. Cycles 2000, 14, 827–838. [Google Scholar] [CrossRef]
  36. Le Dimet, F.-X.; Talagrand, O. Variational Algorithms for Analysis and Assimilation of Meteorological Observations: Theoretical Aspects. Tellus A Dyn. Meteorol. Oceanogr. 1986, 38, 97–110. [Google Scholar] [CrossRef]
  37. Hogue, T.S.; Sorooshian, S.; Gupta, H.; Holz, A.; Braatz, D. A Multistep Automatic Calibration Scheme for River Forecasting Models. J. Hydrometeorol. 2000, 1, 524–542. [Google Scholar] [CrossRef]
  38. Rahnamay Naeini, M.; Yang, T.; Sadegh, M.; AghaKouchak, A.; Hsu, K.; Sorooshian, S.; Duan, Q.; Lei, X. Shuffled Complex-Self Adaptive Hybrid EvoLution (SC-SAHEL) Optimization Framework. Environ. Model. Softw. 2018, 104, 215–235. [Google Scholar] [CrossRef]
  39. Kangrang, A.; Prasanchum, H.; Sriworamas, K.; Ashrafi, S.M.; Hormwichian, R.; Techarungruengsakul, R.; Ngamsert, R. Application of Optimization Techniques for Searching Optimal Reservoir Rule Curves: A Review. Water 2023, 15, 1669. [Google Scholar] [CrossRef]
  40. Zheng, X.; Weng, X.; OU, L.; REN, Y. Allometric Equation and Biomass Estimation of Eucalyptus in Fujian. J. Univ. Chin. Acad. Sci. 2024, 41, 321–333. [Google Scholar]
  41. McKight, P.E.; Najab, J. Kruskal-Wallis Test. In The Corsini Encyclopedia of Psychology; John Wiley & Sons: Hoboken, NJ, USA, 2010; p. 1. ISBN 9780470479216. [Google Scholar]
  42. Yu, Z.; Zhou, G.; Liu, S.; Sun, P.; Agathokleous, E. Impacts of Forest Management Intensity on Carbon Accumulation of China’s Forest Plantations. For. Ecol. Manag. 2020, 472, 118252. [Google Scholar] [CrossRef]
  43. Wen, L.; Wang, K.; Zeng, F.; Peng, W.; Du, H.; Li, S.; Song, T. Carbon Storage and Its Distribution in Eucalyptus Urophylla×E.Grandis Plantations at Different Stand Ages. Acta Bot. Boreali-Occident. Sin. 2014, 34, 1676–1684. [Google Scholar] [CrossRef]
  44. Tao, Y.; Feng, J.; Ma, L.; Long, W.; Cao, S. Carbon Storage and Distribution of Massion Pine, Chinese Fir and Eucalyptus Plantations at Liuzhou, Guangxi Province. Ecol. Environ. 2011, 20, 1608–1613. [Google Scholar]
  45. Zhang, Y.; Lu, D.; Jiang, X.; Li, Y.; Li, D. Forest Structure Simulation of Eucalyptus Plantation Using Remote-Sensing-Based Forest Age Data and 3-PG Model. Remote Sens. 2023, 15, 183. [Google Scholar] [CrossRef]
  46. Miehle, P.; Livesley, S.J.; Feikema, P.M.; Li, C.; Arndt, S.K. Assessing Productivity and Carbon Sequestration Capacity of Eucalyptus Globulus Plantations Using the Process Model Forest-DNDC: Calibration and Validation. Ecol. Modell. 2006, 192, 83–94. [Google Scholar] [CrossRef]
  47. Colmanetti, M.A.A.; Cuadra, S.V.; Lamparelli, R.A.C.; Bortolucci, J., Jr.; Cabral, O.M.R.; Campoe, O.C.; de Castro Victoria, D.; Barioni, L.G.; Galdos, M.V.; Figueiredo, G.K.D.A.; et al. Implementation and Calibration of Short-Rotation Eucalypt Plantation Module within the ECOSMOS Land Surface Model. Agric. For. Meteorol. 2022, 323, 109043. [Google Scholar] [CrossRef]
  48. Guedes, B.S.; Olsson, B.A.; Sitoe, A.A.; Egnell, G. Net Primary Production in Plantations of Pinus Taeda and Eucalyptus Cloeziana Compared with a Mountain Miombo Woodland in Mozambique. Glob. Ecol. Conserv. 2018, 15, e00414. [Google Scholar] [CrossRef]
  49. Cleverly, J.; Vote, C.; Isaac, P.; Ewenz, C.; Harahap, M.; Beringer, J.; Campbell, D.I.; Daly, E.; Eamus, D.; He, L.; et al. Carbon, Water and Energy Fluxes in Agricultural Systems of Australia and New Zealand. Agric. For. Meteorol. 2020, 287, 107934. [Google Scholar] [CrossRef]
  50. Cabral, O.M.R.; Gash, J.H.C.; Rocha, H.R.; Marsden, C.; Ligo, M.A.V.; Freitas, H.C.; Tatsch, J.D.; Gomes, E. Fluxes of CO2 above a Plantation of Eucalyptus in Southeast Brazil. Agric. For. Meteorol. 2011, 151, 49–59. [Google Scholar] [CrossRef]
  51. Silva, M.R.F.; McHugh, I.; Peixoto Neto, A.M.L.; Pauwels, V.R.N.; Cartwright, I.; Daly, E. Trading a Little Water for Substantial Carbon Gains during the First Years of a Eucalyptus Globulus Plantation. Agric. For. Meteorol. 2022, 318, 108910. [Google Scholar] [CrossRef]
  52. Walter, K.; Don, A.; Flessa, H. No General Soil Carbon Sequestration under Central European Short Rotation Coppices. GCB Bioenergy 2015, 7, 727–740. [Google Scholar] [CrossRef]
  53. Tong, X.; Brandt, M.; Yue, Y.; Ciais, P.; Rudbeck Jepsen, M.; Penuelas, J.; Wigneron, J.-P.; Xiao, X.; Song, X.-P.; Horion, S.; et al. Forest Management in Southern China Generates Short Term Extensive Carbon Sequestration. Nat. Commun. 2020, 11, 129. [Google Scholar] [CrossRef]
  54. Rodrigues, A.; Pita, G.; Mateus, J.; Kurz-Besson, C.; Casquilho, M.; Cerasoli, S.; Gomes, A.; Pereira, J. Eight Years of Continuous Carbon Fluxes Measurements in a Portuguese Eucalypt Stand under Two Main Events: Drought and Felling. Agric. For. Meteorol. 2011, 151, 493–507. [Google Scholar] [CrossRef]
  55. Jia, K.; Yu, Y.; Yang, X.; Fan, W. Assimilation and NEP Estimation of Soil Respiration Rate by Ensemble Kalman Filter Algorithm. J. Northeast For. Univ. 2024, 52, 77–84. [Google Scholar] [CrossRef]
  56. Rossi, F.S.; Della-Silva, J.L.; Teodoro, L.P.R.; Teodoro, P.E.; Santana, D.C.; Baio, F.H.R.; Morinigo, W.B.; Crusiol, L.G.T.; La Scala, N.; da Silva, C.A. Assessing Soil CO2 Emission on Eucalyptus Species Using UAV-Based Reflectance and Vegetation Indices. Sci. Rep. 2024, 14, 20277. [Google Scholar] [CrossRef] [PubMed]
  57. Fernandez-Tschieder, E.; Marshall, J.D.; Binkley, D. Carbon Budget at the Individual-Tree Scale: Dominant Eucalyptus Trees Partition Less Carbon Belowground. New Phytol. 2024, 242, 1932–1943. [Google Scholar] [CrossRef]
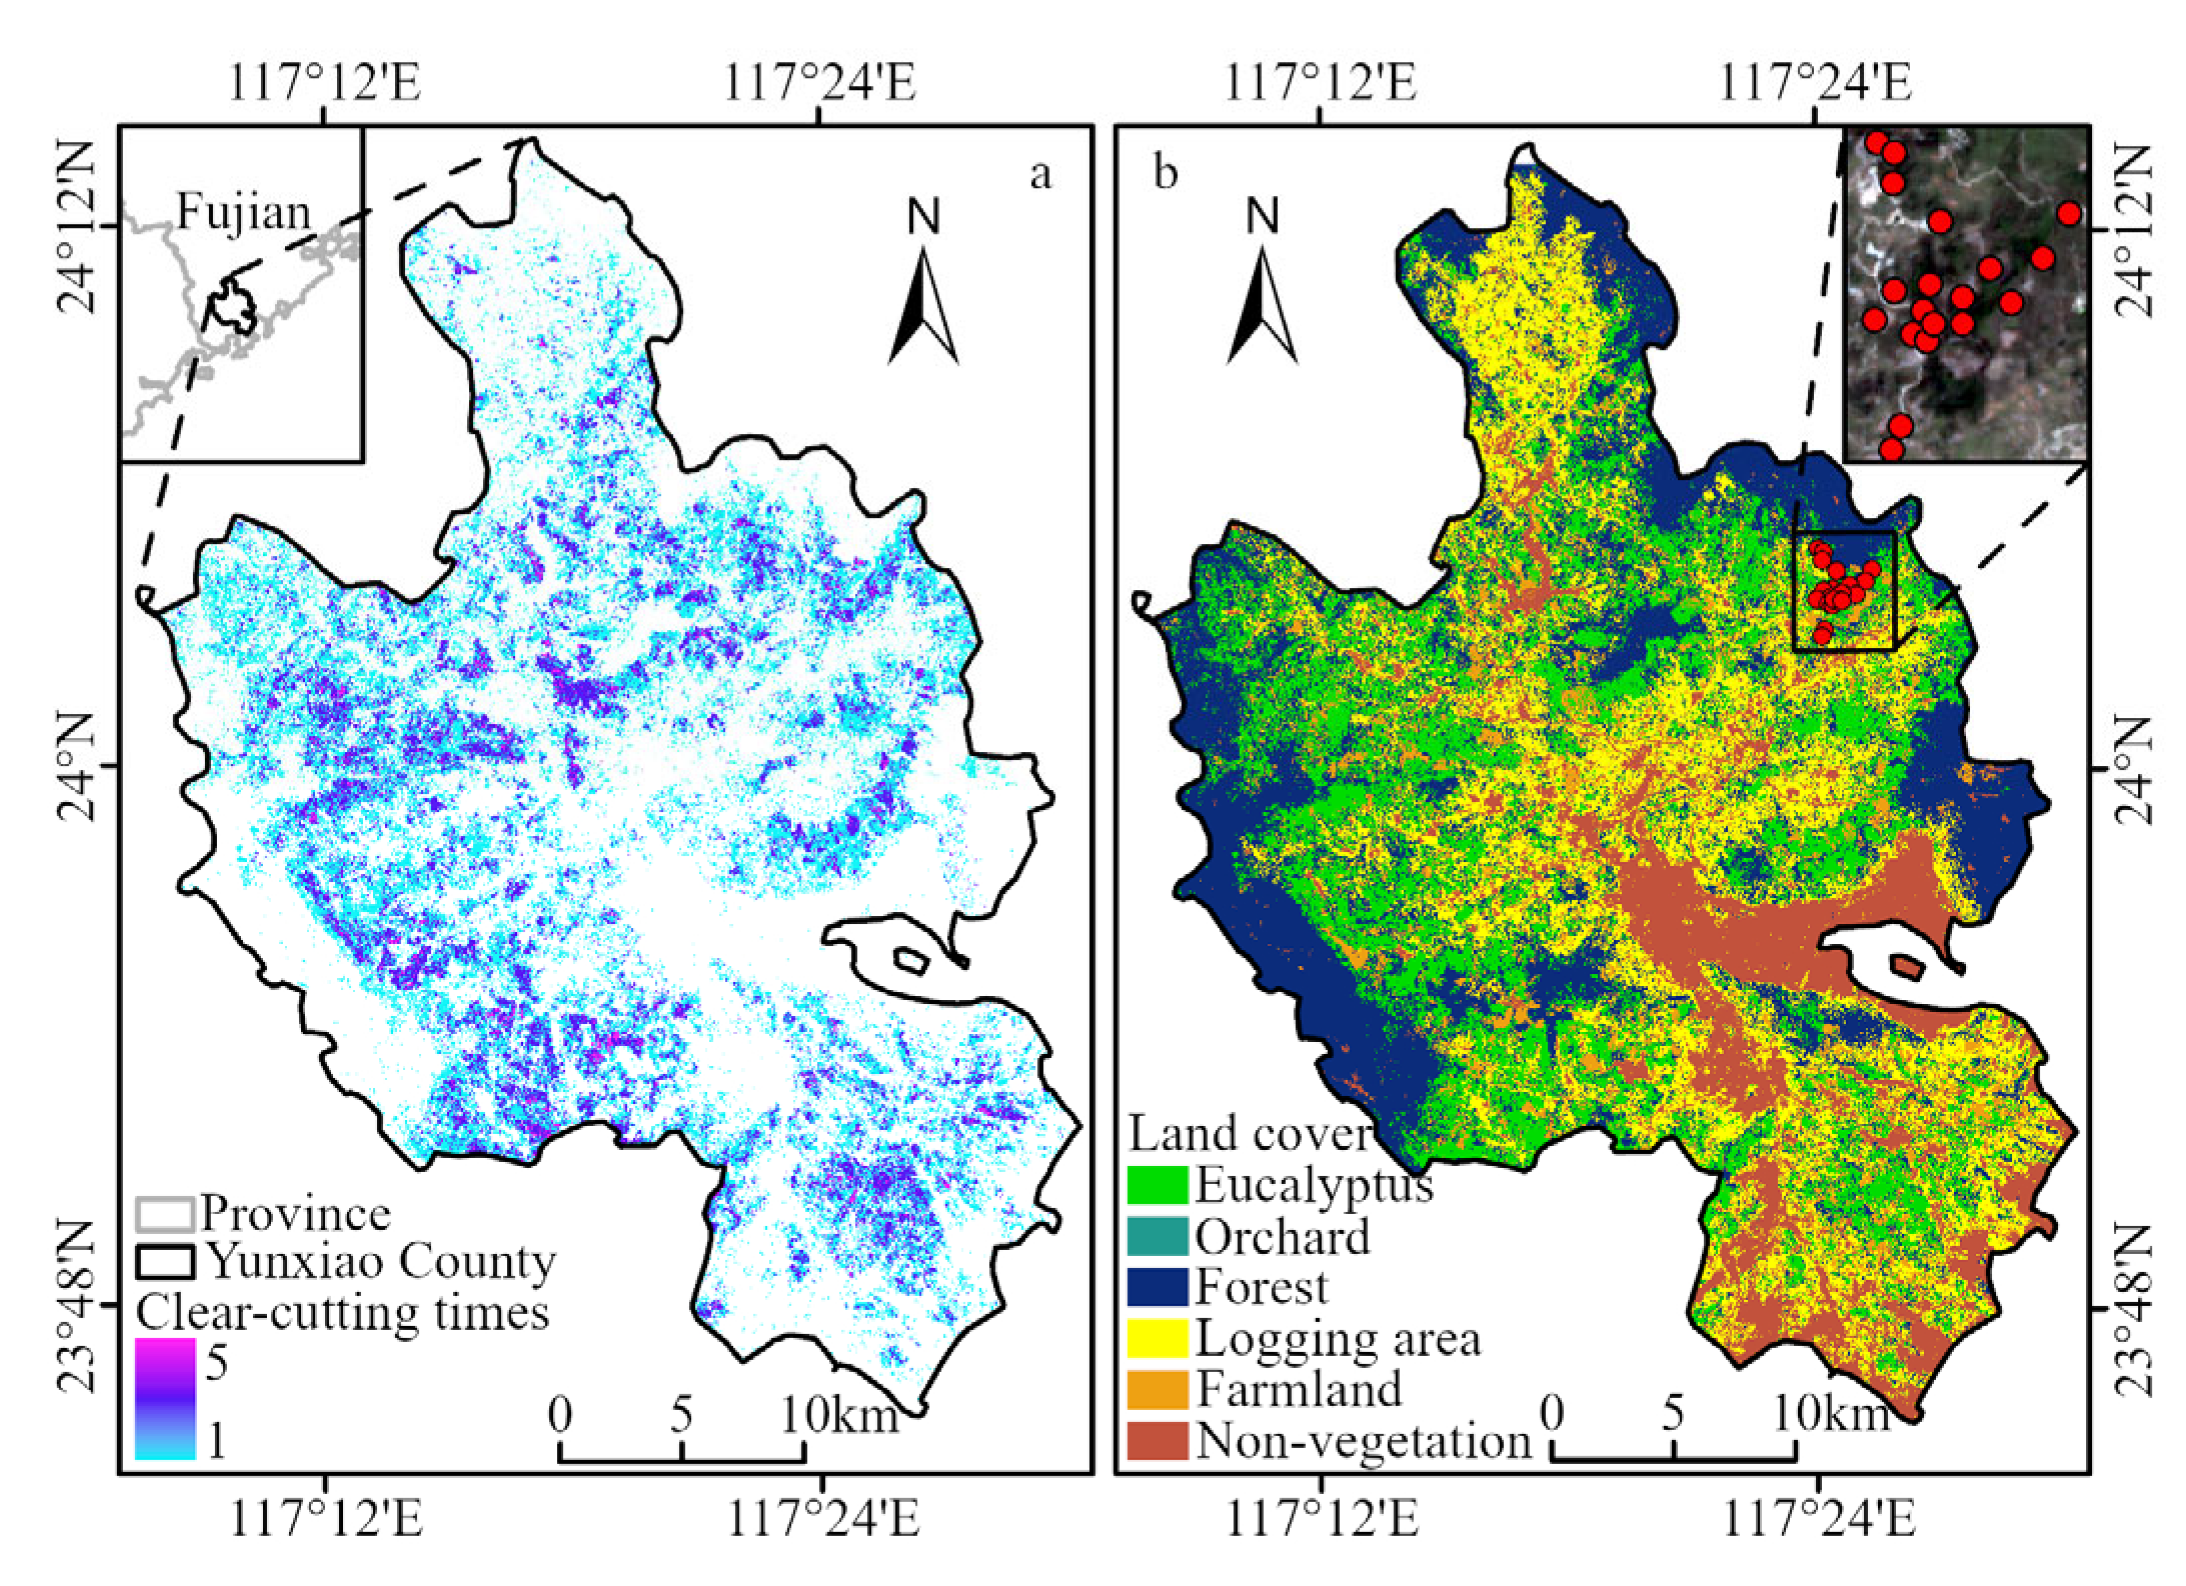
Figure 1. Study area—Yunxiao County, Fujian Province. (a) Number of harvest cycles for eucalyptus plantations before 2021. (b) Land cover types (2021) [7] and locations of eucalyptus plantation sample plots.
Remotesensing 17 02741 g001
Figure 2. Spatial distribution map of NPP and carbon density for the reference year in the eucalyptus plantation region of Yunxiao County. (a) The 2020 NPP data derived from the MODIS product (NPPMODIS), (b) the 2020 NPP dataset generated based on Lin et al.’s data (NPPLin), (c) the 2020 carbon density data from Jiang et al. (CDJiang), (d) the 2019 aboveground carbon density data provided by Yang et al. (ACDYang), and (e) the 2020 aboveground carbon density data provided by Yan et al. (ACDYan).
Remotesensing 17 02741 g002
Figure 3. NPP and carbon density data for the reference year in the eucalyptus region of Yunxiao County; Panel (a) shows NPPMODIS and NPPLin (2020); panel (b) shows CDJiang (2020), ACDYang (2019), and ACDYan (2020) data, where CDJiang represents whole-plant carbon stock, and ACDYang and ACDYan represent aboveground carbon density.
Remotesensing 17 02741 g003
Figure 4. Validation of model-simulated carbon density in the eucalyptus plots compared to field survey results. Panels (ae) show results driven by NPPMODIS, NPPLin, CDJiang, ACDYang, and ACDYan for the InTEC model; panels (fj) show results driven by the same data for the InTECeuc model.
Remotesensing 17 02741 g004
Figure 5. Validation of model-simulated change in carbon density in eucalyptus plots compared to field survey results. Panels (ae) show results driven by NPPMODIS, NPPLin, CDJiang, ACDYang, and ACDYan data for the InTEC model; panels (fj) show results driven by the same data for the InTECeuc model.
Remotesensing 17 02741 g005
Figure 6. Model-simulated carbon density in eucalyptus plots from 2003 to 2023. Panels (ae) show results driven by NPPMODIS, NPPLin, CDJiang, ACDYang, and ACDYan data for the InTEC model; panels (fj) show results driven by the same data for the InTECeuc model.
Remotesensing 17 02741 g006
Figure 7. Validation of model-simulated carbon density (ad) and its change (eh) in eucalyptus plots compared to field survey results. Panels a and e show results driven by CDPlots for the InTECeuc model; panels (bd) and (fh) show results driven by CDPlots, CDJiang and ACDYang for the InTECDA model.
Remotesensing 17 02741 g007
Figure 8. Model-simulated carbon density in eucalyptus plots from 2003 to 2023. Panel (a) shows results driven by CDPlots for the InTECeuc model; panels (bd) show results driven by CDPlots, CDJiang, and ACDYang for the InTECDA model.
Remotesensing 17 02741 g008
Figure 9. Mean and standard deviation of carbon budgets in the eucalyptus region of Yunxiao County from 2003 to 2023 simulated by the InTECeuc model driven by different data. Panels (ac) show results for NPP, NEP, and NBP.
Remotesensing 17 02741 g009
Figure 10. Statistical test of significant differences in the mean carbon budgets for the eucalyptus region of Yunxiao County from 2003 to 2023 simulated by the InTECeuc model driven by different data. Panels (ac) show results for NPP, NEP, and NBP.
Remotesensing 17 02741 g010
Figure 11. Mean carbon budgets for the eucalyptus region of Yunxiao County from 2003 to 2023 simulated by the InTECeuc model driven by different data. Panels (ac) show results for NPP, NEP, and NBP.
Remotesensing 17 02741 g011
Figure 12. Mean carbon budgets for the eucalyptus region of Yunxiao County from 2003 to 2023 simulated by the InTECeuc model driven by different data. Panels (a-1a-5), (b-1b-5), and (c-1c-5) show mean values for NPP, NEP, and NBP simulated using NPPMODIS, NPPLin, CDJiang, ACDYang, and ACDYan.
Remotesensing 17 02741 g012
Figure 13. Mean and standard deviation of carbon budgets in the eucalyptus region of Yunxiao County from 2003 to 2023 simulated by the InTECDA model driven by different data. Panels (ac) show results for NPP, NEP, and NBP.
Remotesensing 17 02741 g013
Figure 14. Statistical test of significant differences in the mean carbon budgets for the eucalyptus region of Yunxiao County from 2003 to 2023 simulated by the InTECeuc and InTECDA models driven by different data. Panels (ac) show results for NPP, NEP, and NBP.
Remotesensing 17 02741 g014
Figure 15. Mean carbon budgets for the eucalyptus region of Yunxiao County from 2003 to 2023 simulated by the InTECDA model driven by different data. Panels (ac) show results for NPP, NEP, and NBP, respectively.
Remotesensing 17 02741 g015
Figure 16. Mean carbon budgets for the eucalyptus region of Yunxiao County from 2003 to 2023 simulated by the InTECDA model driven by different data. Panels (a-1a-3) and (b-1b-3) show mean values for NPP, NEP, and NBP simulated using CDJiang and ACDYan, respectively.
Remotesensing 17 02741 g016
Table 1. Input data for the InTEC model.
DataNameDescriptionTimeResolutionSource
Model Input DataClimate DataMonthly average temperature, total monthly precipitation, average monthly radiation, average monthly vapor pressure1960–202330 mThis Study
Soil DataSoil depth, soil texture data-1 kmNational Qinghai–Tibet Plateau Science Data Center
Wetness index, Water table-30 mThis Study
Eucalyptus DataEucalyptus distribution, harvest frequency, and harvest timing data1986–202130 m[7]
CO2 ConcentrationStation observation data2013–2022-https://www.gml.noaa.gov
accessed on 12 February 2024
Satellite Data Inversion1850–2013[25]
Nitrogen DepositionSimulated Data1980–20130.5°[26]
LAICalculated using Sentinel-2 data202030 mThis Study
Reference-year NPPMODIS NPP (NPPMODIS)2020500 m[14]
Lin GPP (NPPLin)202030 m[15]
Reference-year Biomass/Carbon DensityAboveground carbon density from Yang et al. (ACDYang)201930 m[19]
Aboveground carbon density from Yan et al. (ACDYan)2013–202130 m[27]
Carbon density from Jiang et al. (CDJiang)2020–202130 m[20]
Validation DataPlot survey data (CDPlots)15 plots, collected semi-annually2021–2024--
Table 2. Allocation coefficients of NPP to leaf, stem, fine root, and coarse root carbon pools, and the turnover rates of the corresponding carbon pools [34].
Carbon Allocation Turnover Rate
Allocation coefficient to stem0.4624Wood turnover rate0.0288
Allocation coefficient to coarse root0.2226Coarse root turnover rate0.0448
Allocation coefficient to leaf0.1190Leaf turnover rate0.2948
Allocation coefficient to fine root0.1960Fine root turnover rate1.0000
Table 3. Parameter settings in the data assimilation module [17,28].
ParameterCDPlotsCDJiangACDYanParameterCDPlotsCDJiangACDYan
NPP SIGMA
(Mg C ha−1 yr−1)
[10, 500][10, 500][10, 500] E H coef 1.01.00.2
Obs SIGMA
(Mg C ha−1)
[0, 1][1, 10][1, 10] H coef 1.01.00.3
NPP BG
(Mg C ha−1 yr−1)
[1000, 3000][1000, 3000][1000, 3000] M coef 1.01.00.8
NPP 0
(Mg C ha−1 yr−1)
[100, 2500][100, 2500][100, 2500] N coef 1.01.01.0
E HIGH RATIO 3.03.03.0 HIGH RATIO 2.02.02.0
N HIGH RATIO 1.01.01.0
Table 4. Comparison of the ability of four process-based models to predict carbon stock in eucalyptus plantations (rRMSE).
ModelValidated VariablerRMSE (%)
3-PGAboveground carbon stocks15.70
Forest-DNDCTotal aboveground C17.88
InTECDACarbon density18.25
ECOSMOSTotal stem biomass29.57
Disclaimer/Publisher’s Note: The statements, opinions and data contained in all publications are solely those of the individual author(s) and contributor(s) and not of MDPI and/or the editor(s). MDPI and/or the editor(s) disclaim responsibility for any injury to people or property resulting from any ideas, methods, instructions or products referred to in the content.