Article

A Framework to Retrieve Water Quality Parameters in Small, Optically Diverse Freshwater Ecosystems Using Sentinel-2 MSI Imagery

by
Matheus Henrique Tavares
1,*,
David Guimarães
1,
Joana Roussillon
1,
Valentin Baute
1,
Julien Cucherousset
2,
Stéphanie Boulêtreau
2 and
Jean-Michel Martinez
1
1
Géosciences Environnement Toulouse (GET), UMR5563, Institut de Recherche pour le Développement (IRD)/Centre National de la Recherche Scientifique (CNRS)/Université de Toulouse, 14 Avenue Edouard Belin, 31400 Toulouse, France
2
Centre de Recherche sur la Biodiversité et l’Environnement (CRBE), IRD/CNRS/Université de Toulouse/Institut National Polytechnique de Toulouse, 118 Route de Narbonne, 31400 Toulouse, France
*
Author to whom correspondence should be addressed.
Remote Sens. 2025, 17(15), 2729; https://doi.org/10.3390/rs17152729
Submission received: 22 June 2025 / Revised: 28 July 2025 / Accepted: 3 August 2025 / Published: 7 August 2025
(This article belongs to the Section Remote Sensing in Geology, Geomorphology and Hydrology)

Abstract

Small lakes (<10 km2) provide a range of ecosystem services but are often overlooked in both monitoring efforts and limnological studies. Remote sensing has been increasingly used to complement in situ monitoring or to provide water colour data for unmonitored inland water bodies. However, due to spatial, radiometric, and spectral constraints, it has been heavily focused on large lakes. Sentinel-2 MSI is the first sensor with the capability to consistently retrieve a wide range of essential water quality variables, such as chlorophyll-a concentration (chl-a) and water transparency, in small water bodies, and to provide long time series. Here, we provide and validate a framework for retrieving two variables, chl-a and turbidity, over lakes with diverse optical characteristics using Sentinel-2 imagery. It is based on GRS for atmospheric and sun glint correction, WaterDetect for water detection, and inversion models that were automatically selected based on two different sets of optical water types (OWTs)—one for each variable; for chl-a, we produced a blended product for improved spatial representation. To validate the approach, we compared the products with more than 600 in situ data from 108 lakes located in the Adour–Garonne river basins, ranging from 3 to ∼5000 ha, as well as remote sensing reflectance (Rrs) data collected during 10 field campaigns during the summer and spring seasons. Rrs retrieval (n = 65) was robust for bands 2 to 5, with MAPE varying from 15 to 32% and achieving correlation from 0.74 up to 0.92. For bands 6 to 8A, the Rrs retrieval was much less accurate, being influenced by adjacency effects. Glint removal significantly enhanced Rrs accuracy, with RMSE improving from 0.0067 to 0.0021 sr−1 for band 4, for example. Water quality retrieval showed consistent results, with an MAPE of 56%, an RMSE of 11.4 mg m−3, and an r of 0.76 for chl-a, and an MAPE of 47%, an RMSE of 9.7 NTU, and an r of 0.87 for turbidity, and no significant effect of lake area or lake depth on retrieval errors. The temporal and spatial representations of the selected parameters were also shown to be consistent, demonstrating that the framework is robust and can be applied over lakes as small as 3 ha. The validated methods can be applied to retrieve time series of chl-a and turbidity starting from 2016 and with a frequency of up to 5 days, largely expanding the database collected by water agencies. This dataset will be extremely useful for studying the dynamics of these small freshwater ecosystems.

1. Introduction

Lakes provide a series of essential ecosystem services, and are considered sentinels of environmental changes at local to larger scales [1,2]. Small lakes (<10 km2) contribute substantially to this, for instance, by providing essential habitat for biodiversity, carbon and nutrient cycling, and water storage [3,4]. Recent research has demonstrated that small impoundments sequester nutrients through sediment burial, particularly those located near agricultural areas, having a significant large-scale impact on nutrient cycles [5]. Monitoring is essential to assess these ecological services and how they may shift in response to climate change and anthropic stressors. Despite their importance, they are frequently overlooked in both monitoring efforts and limnological studies, as large water bodies are prioritized due to their perceived greater significance and cost-effectiveness (monitoring larger areas with similar human and financial resources) [4]. For example, the European Union’s Water Framework Directive, which aims to protect water resources across Europe, requires monitoring for all lakes over 50 ha, thereby excluding small water bodies from their monitoring and assessment efforts [6].
Remote sensing has been increasingly used in recent decades for complementing in situ monitoring or for providing water colour data to unmonitored water bodies, bringing increased temporal frequency and spatialisation of water quality parameters such as chlorophyll-a concentration (chl-a)—a proxy for phytoplankton biomass and an important indicator of ecosystem trophic state—and water transparency [7]. Most studies in this subject have focused on assessing and reducing the many uncertainties in optical remote sensing. Some have investigated the effect of the atmosphere on the signal measured by the sensor (atmospheric correction); meanwhile, others have evaluated how the high variability of water spectral response, a function of the concentrations of the optically active water constituents, impacts large-scale estimation of parameters [8]. For example, some have used the typologies of water, such as optical water types (OWTs), as a means to automatically select the most suitable chl-a algorithm in each case—for instance, this approach was validated by Neil et al. [9] based on the typology developed by Spyrakos et al. [10], further refined, for example, by Liu et al. [11]. With these recent advances, efforts have aimed to produce open-access datasets of large-scale, remote sensing-derived limnological data, such as water colour data for large lakes from MODIS data [12], and the Lakes Dataset in the Ocean Colour product from the European Space Agency’s Climate Change Initiative (ESA CCI), which uses data from the MERIS, MODIS and Sentinel-3 OLCI sensors [13]. These datasets, however, still have uncertainties and limitations, for instance related to the variability of the parameters on the euphotic zone that is measured by the satellite sensor [14]. In addition, due to limitations in the spatial, radiometric and spectral resolutions of satellite sensors, these studies are largely restricted to large lakes.
The Sentinel-2 MSI constellation of satellites, with its first mission launched in 2015, is the first with the capabilities for remote monitoring of various bio-optical variables in small water bodies. Recent efforts have focused on validating the remote sensing reflectance (Rrs) derived from different atmospheric correction processors [15,16], as well as the water quality parameters further retrieved from it, such as chl-a and total suspended sediments [17,18,19,20,21]. They highlighted that uncertainties persist not only in the inversion models used for estimating the parameters of interest from the Rrs, but also in the Rrs itself, as it is affected by atmospheric, sun glint—the reflection of the Sun on the water surface—and adjacency effects (signal contribution from the surrounding land caused by atmospheric scattering [22]). The latter in particular are among the least studied and are especially important in small water bodies, as the strength of this signal is directly related to the distance from land [23]. Other challenges in the remote sensing of small lakes are the increased possibility of bottom effect, when the water signal is mixed with the substrate at the bottom of the lake, as a result of shallow depth, and the detection of water-only pixels, since the proportion of land–water mixed pixels is much higher than that of large lakes [24]. In addition, research has also shown the limitations of retrieving water quality parameters at a regional scale using a single calibrated algorithm for each parameter due to the different concentrations of optically active water constituents and the assumptions and simplifications of the inversion algorithms. Thus, the potential of pre-selecting algorithms based on OWT classification was subsequently demonstrated, making it possible to automatically select the best models in each case based only on the water spectral response [9,10,11]. Specifically for small lakes, a few studies (e.g., [25]) have evaluated methods to be applied for them using this constellation of satellites; however, there is still a lack of frameworks for consistently retrieving water quality parameters in these ecosystems over large scales, in the shape of what is available for MERIS and Sentinel-3 OLCI [13], for example; such frameworks could potentially provide data for understanding the ongoing changes in such small lacustrine environments.
Therefore, this work aims to validate a framework for retrieving two water quality parameters, chlorophyll-a concentration and turbidity, from small water bodies with variable characteristics, located in the Garonne and Adour river basins in Southwest France. Specifically, we achieved the following: (a) conducted an evaluation of the accuracy of remote sensing reflectance derived from Sentinel-2 MSI in small lakes, and the possible impacts of adjacency effects on these retrievals; (b) we assessed the performance of inversion models based on optical water types (OWTs) in retrieving water quality parameters across lakes with diverse water optical characteristics; and (c) we demonstrate the consistency of the method in capturing the spatial and temporal variability in these two parameters. The research questions we aimed to answer were as follows: (a) How do the adjacency effects alter Rrs over small lakes, and do they hinder the retrieval of water quality parameters in these cases? (b) Can the Sentinel-2 MSI sensors consistently retrieve water quality parameters in small lakes in a regional scale, with no models being tuned specifically for one or a certain number of lakes? (c) What is the accuracy and consistency of retrieving turbidity using optical water types?

2. Methods

2.1. Study Area and In Situ Data

The study area is located in Southwest France, within the Garonne and Adour river basins (Figure 1). This region is considered one of the most vulnerable in Europe in terms of water resources due to a drier climate and frequent drought episodes, which have been intensifying with climate change [6]. To mitigate this, numerous water reservoirs have been built to store part of the runoff during the wet season in order to face the dry season, to ensure water supply for drinking and irrigation. However, very few of these reservoirs are monitored, limiting the comprehension of water quality dynamics and the impacts of droughts on their ecosystem health.
The Garonne river is France’s third longest river, originating in the Spanish Pyrenees mountains and discharging into the Atlantic Ocean at the Gironde Estuary near Bordeaux. It has a drainage area of approximately 84,000 km2 which includes major tributaries such as the Ariège, Lot, and Tarn rivers. Geographically, the Garonne basin is divided into three main regions: the plains, surrounded by the Pyrenees to the south and the Massif Central to the north-east. The Adour river, a smaller catchment, drains an area of about 17,000 km2, and also originates in the Pyrenees and flows into the Atlantic Ocean. Both river basins host numerous dams that store water for the dry season, which typically lasts from summer to early autumn. The climate in these watersheds is composed of Mediterranean climate on the Mediterranean coast, a continental type in the south, and an oceanic climate along the Atlantic coast. Rainfall is more concentrated between May and June, with an average annual precipitation of approximately 900 mm. Land use in these regions is predominantly agricultural, particularly in the plains, while forests are more common around the Massif Central.
To validate our methods, we used two independent datasets collected in these watersheds: the data from the local water agency, the Adour Garonne Water Agency (AEAG), and a dataset originating from an ecological monitoring of gravel pit lakes located along the Garonne and the Ariège rivers. The AEAG dataset follows the European Union Water Framework Directive, monitoring all lakes larger than 50 ha in the basin, but also includes many smaller lakes. It comprises seasonal data from 91 lakes with varied characteristics, reflecting the diverse geography, soil types, and land uses in the basin. Most of these lakes are artificial, formed as a result of dams, with sizes ranging from 5 to 5660 ha (median of 60 ha), of which 4 have an area larger than 1000 ha (threshold for being considered a small lake). These lakes have a mean depth of 14.1 m, and average chl-a values of 11.5 mg/m3, a turbidity of 10.8 NTU, and a water transparency (Secchi disk depth) of 1.7 m. In these lakes, in addition to the measurements made from a boat with multi-parameter probe and Secchi disk, chl-a was measured by sampling water at the euphotic zone and storing it following the phytoplankton monitoring protocols established under the French Water Framework Directive [26]. The samples were homogenized and filtered using a vacuum pump (manual or electric), after the homogenisation of the sample, on a glass fibre or cellulose acetate filters with 0.7 µm pores (Whatman GF/F type). The concentration of chlorophyll-a was then determined in the laboratory following standardized protocols [27,28]. Turbidity was also measured in the laboratory from water samples using nephelometry, according to the ISO 7027 [29].
The second consists of gravel pits filled by the water table after the extraction of gravel (or sand) in the river floodplains [30]. These lakes are disconnected from the rest of the hydrographic network. In these lakes, water level fluctuations are driven by evaporation, precipitation, and the level of the water table. These lakes also have variable environmental conditions as a result of a gradient of ecosystem maturity (age since the end of gravel extraction, Colas et al. [31]). This database is composed of 19 gravel pit lakes, ranging from 3 to 21 ha, with a mean depth of 5.3 m. Overall, average chl-a was 7.0 mg/m3, turbidity was 3.9 NTU, and water transparency was 1.8 m; these were measured seasonally. The database includes two lakes that are also monitored by the AEAG, lakes Bocage and Grand Lamartine. In these gravel pit lakes, in addition to the measurements made with multi-parameter probe and Secchi disk, chl-a concentration was measured directly at the water surface (0.5 m deep) from a boat via fluorescence using a portable fluorescence photometer (AlgaeTorch, BBE-Moldaenke, Schwentinental, Germany), with turbidity also being measured by this probe for simultaneous turbidity compensation during chl-a measurement, as suspended particles in the water can affect the chl-a determination by fluorescence.
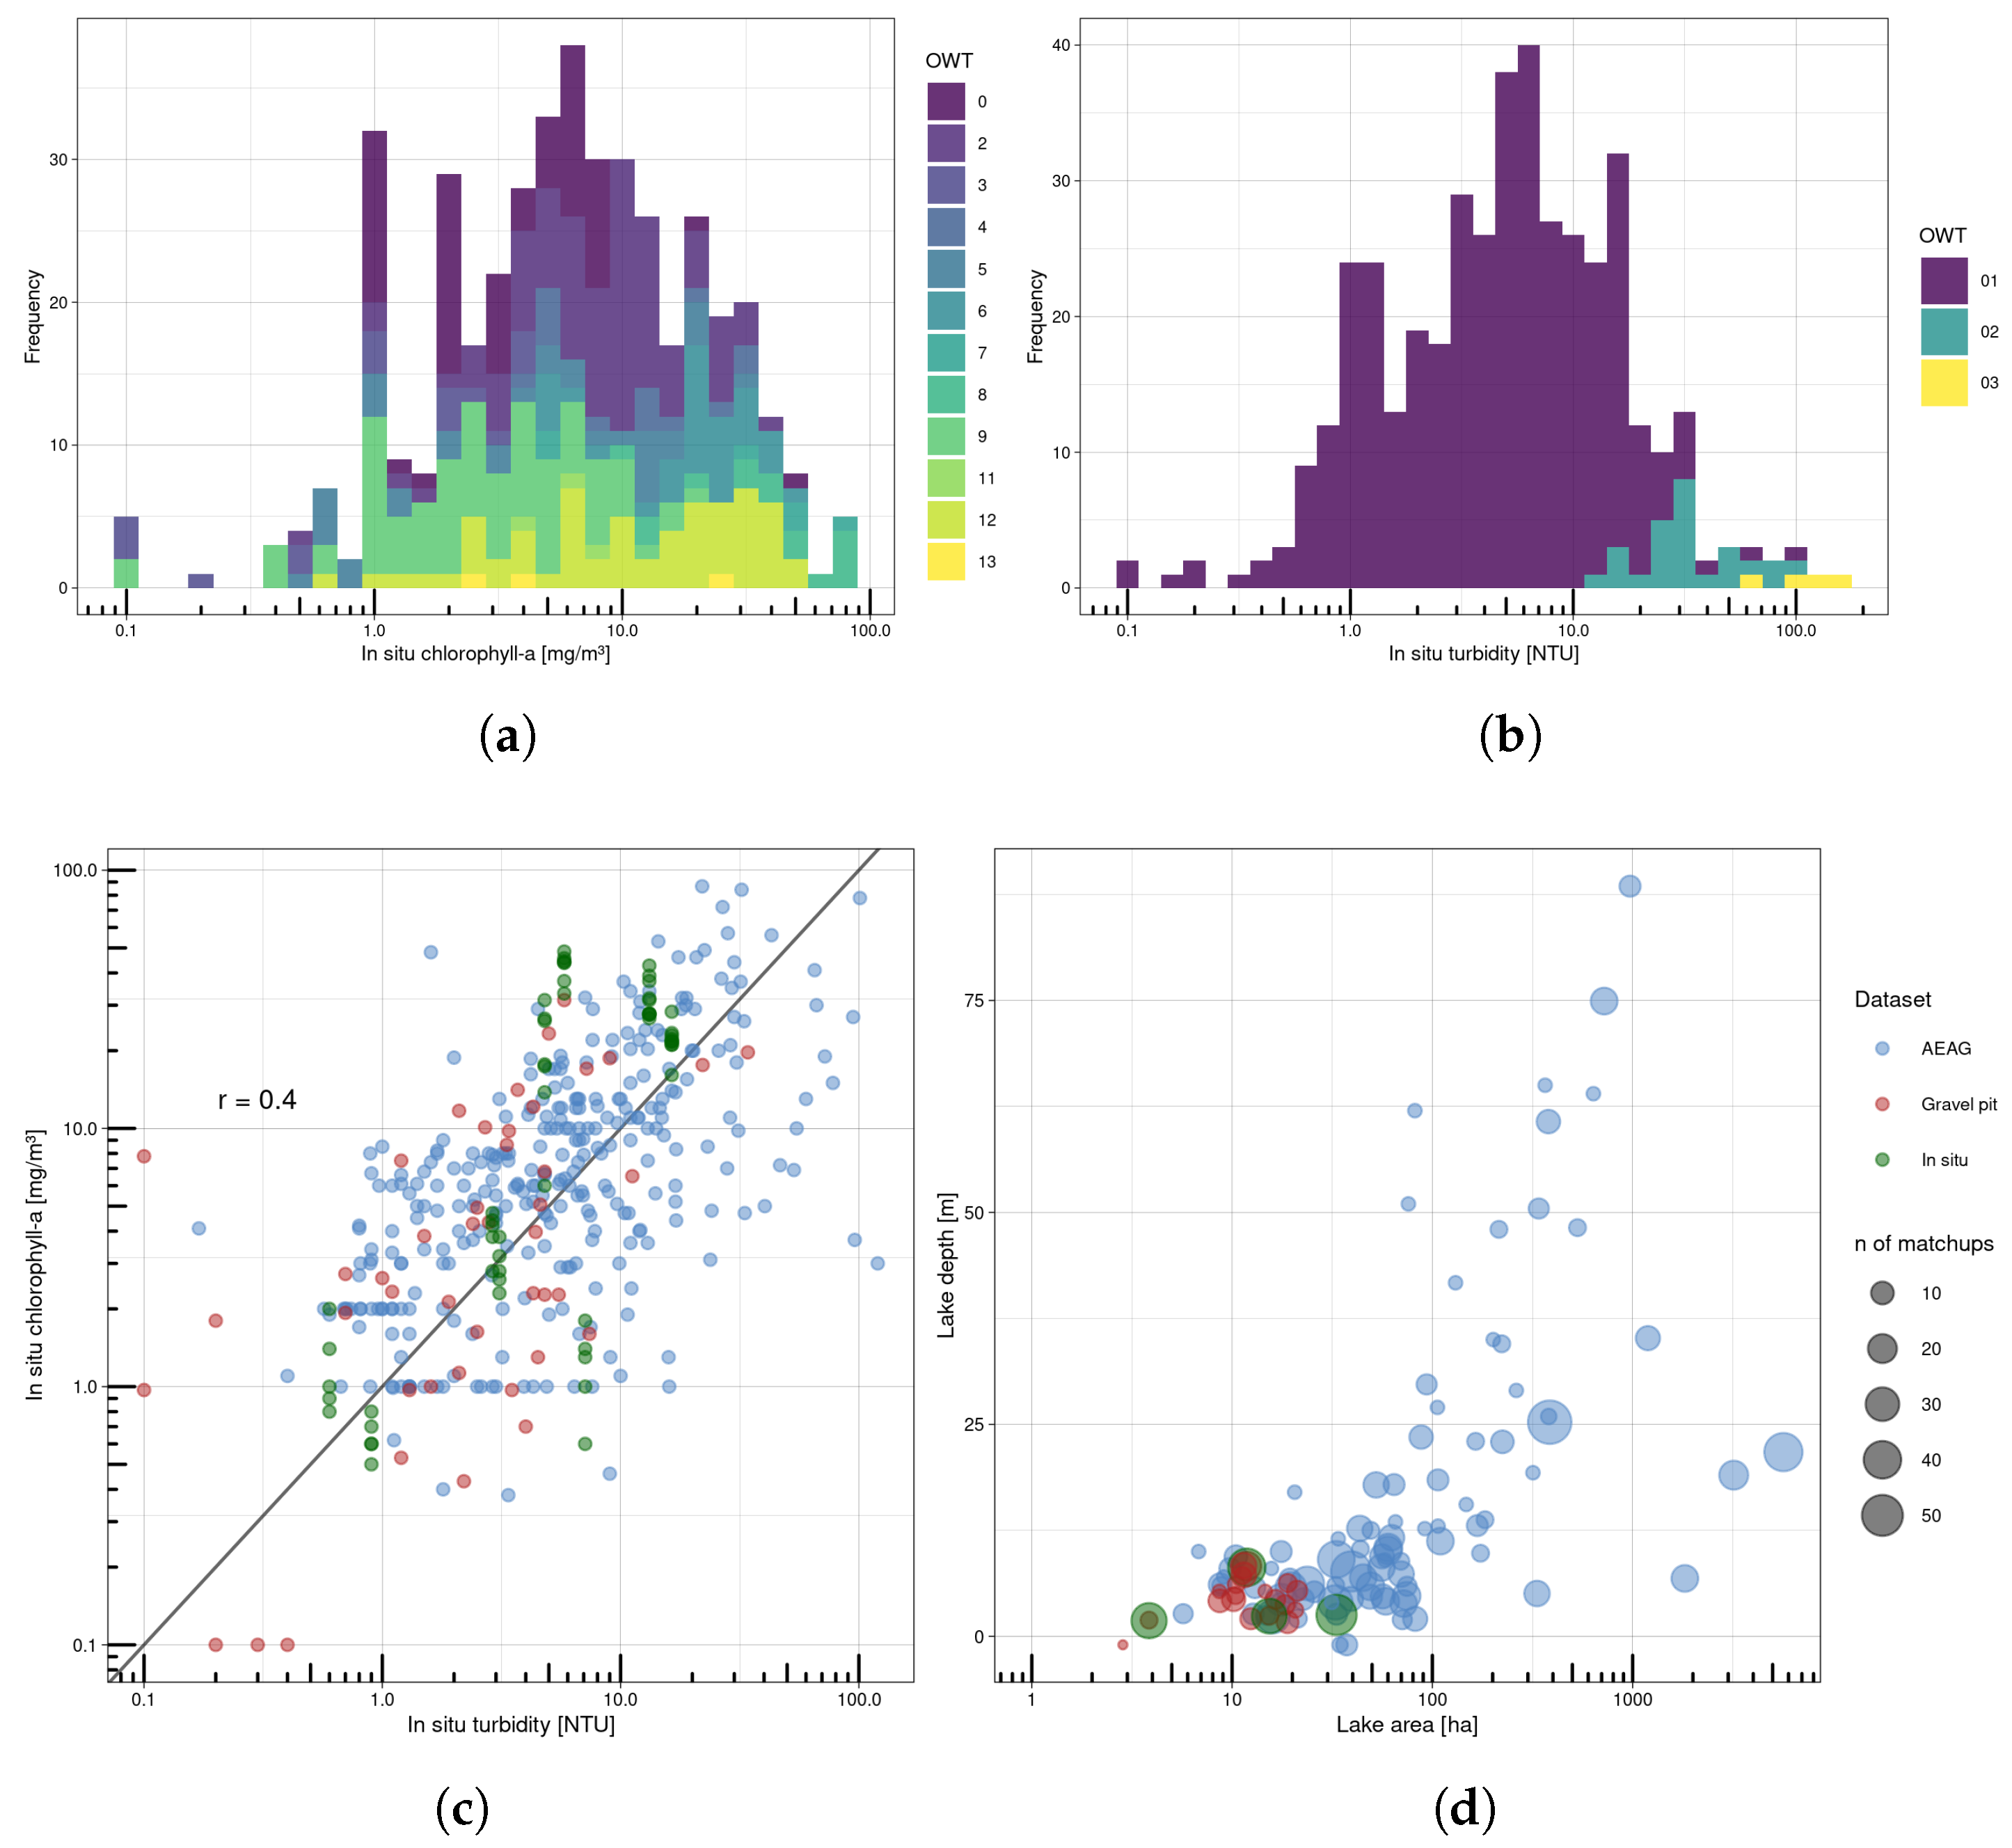
Chl-a and turbidity values of the ensemble of these datasets are seen in Figure 2. For processing the data for these lakes, we obtained the polygon of each lake from the database of French water bodies registered in the IGEDD (Inspection Générale de l’Environnement et du Développement Durable).

2.2. Field Campaigns for Validation and Assessment of Adjacency Effect

In addition, we conducted fieldwork campaigns in four gravel pit lakes to validate the Rrs derived from Sentinel-2 imagery, specifically for assessing the impact of adjacency on small lakes and further validation of chl-a and turbidity. These lakes, shown in Figure 1, are Bocage (mesotrophic lake with cyanobacteria presence and an area of 29 ha), Cabane (oligotrophic deep with an area of 12 ha), and the two Lamartine lakes, i.e., the Grand to the west (eutrophic with frequent algal blooms and an area of 22 ha), and the Petit to the east (oligotrophic and with an area of 4 ha).
We conducted 7 campaigns between March and July 2024. To estimate the effect of adjacency during the seasons when it is expected to be stronger (spring and summer), we conducted measurements along transects over the lakes, as indicated in Figure 1. Chl-a was measured at the water surface (0.5 m deep) via fluorescence using a portable fluorescence photometer (AlgaeTorch, BBE-Moldaenke), Schwentinental, Germany and turbidity was measured in the laboratory using a turbidimeter (Turb 555 IR, WTW, Weilheim, Germany) from water samples collected in 100 mL bottles at 0.2 m below the water surface. The average measured chl-a was 16.9 mg/m3, turbidity was 8.3 NTU, and water transparency was 1.0 m.
The above-water reflectance was measured using a set of hyperspectral radiometers (RAMSES, TriOS, Rastede, Germany), operating in the range 320–950 nm, with a spectral resolution of approximately 3.3 nm. More precisely, an irradiance sensor was used to measure downwelling irradiance above the water surface ( E d ( λ ) ) and two radiance sensors (with a 7° field of view) were used to measure upwelling radiance above the water surface ( L u ( λ ) ), as well as the incident sky radiance ( L d ( λ ) ) that was used to correct for the skylight reflection effect at the air–water interface. The remote sensing reflectance R r s ( λ ) was calculated as:
R r s ( λ ) = L w ( λ ) E d ( λ ) = L u ( λ ) ρ L d ( λ ) E d ( λ )
where ρ is a proportionality factor, as provided by Mobley [32], for which the standard value of 0.028 was used.

2.3. Processing Sentinel-2 MSI L1C Images

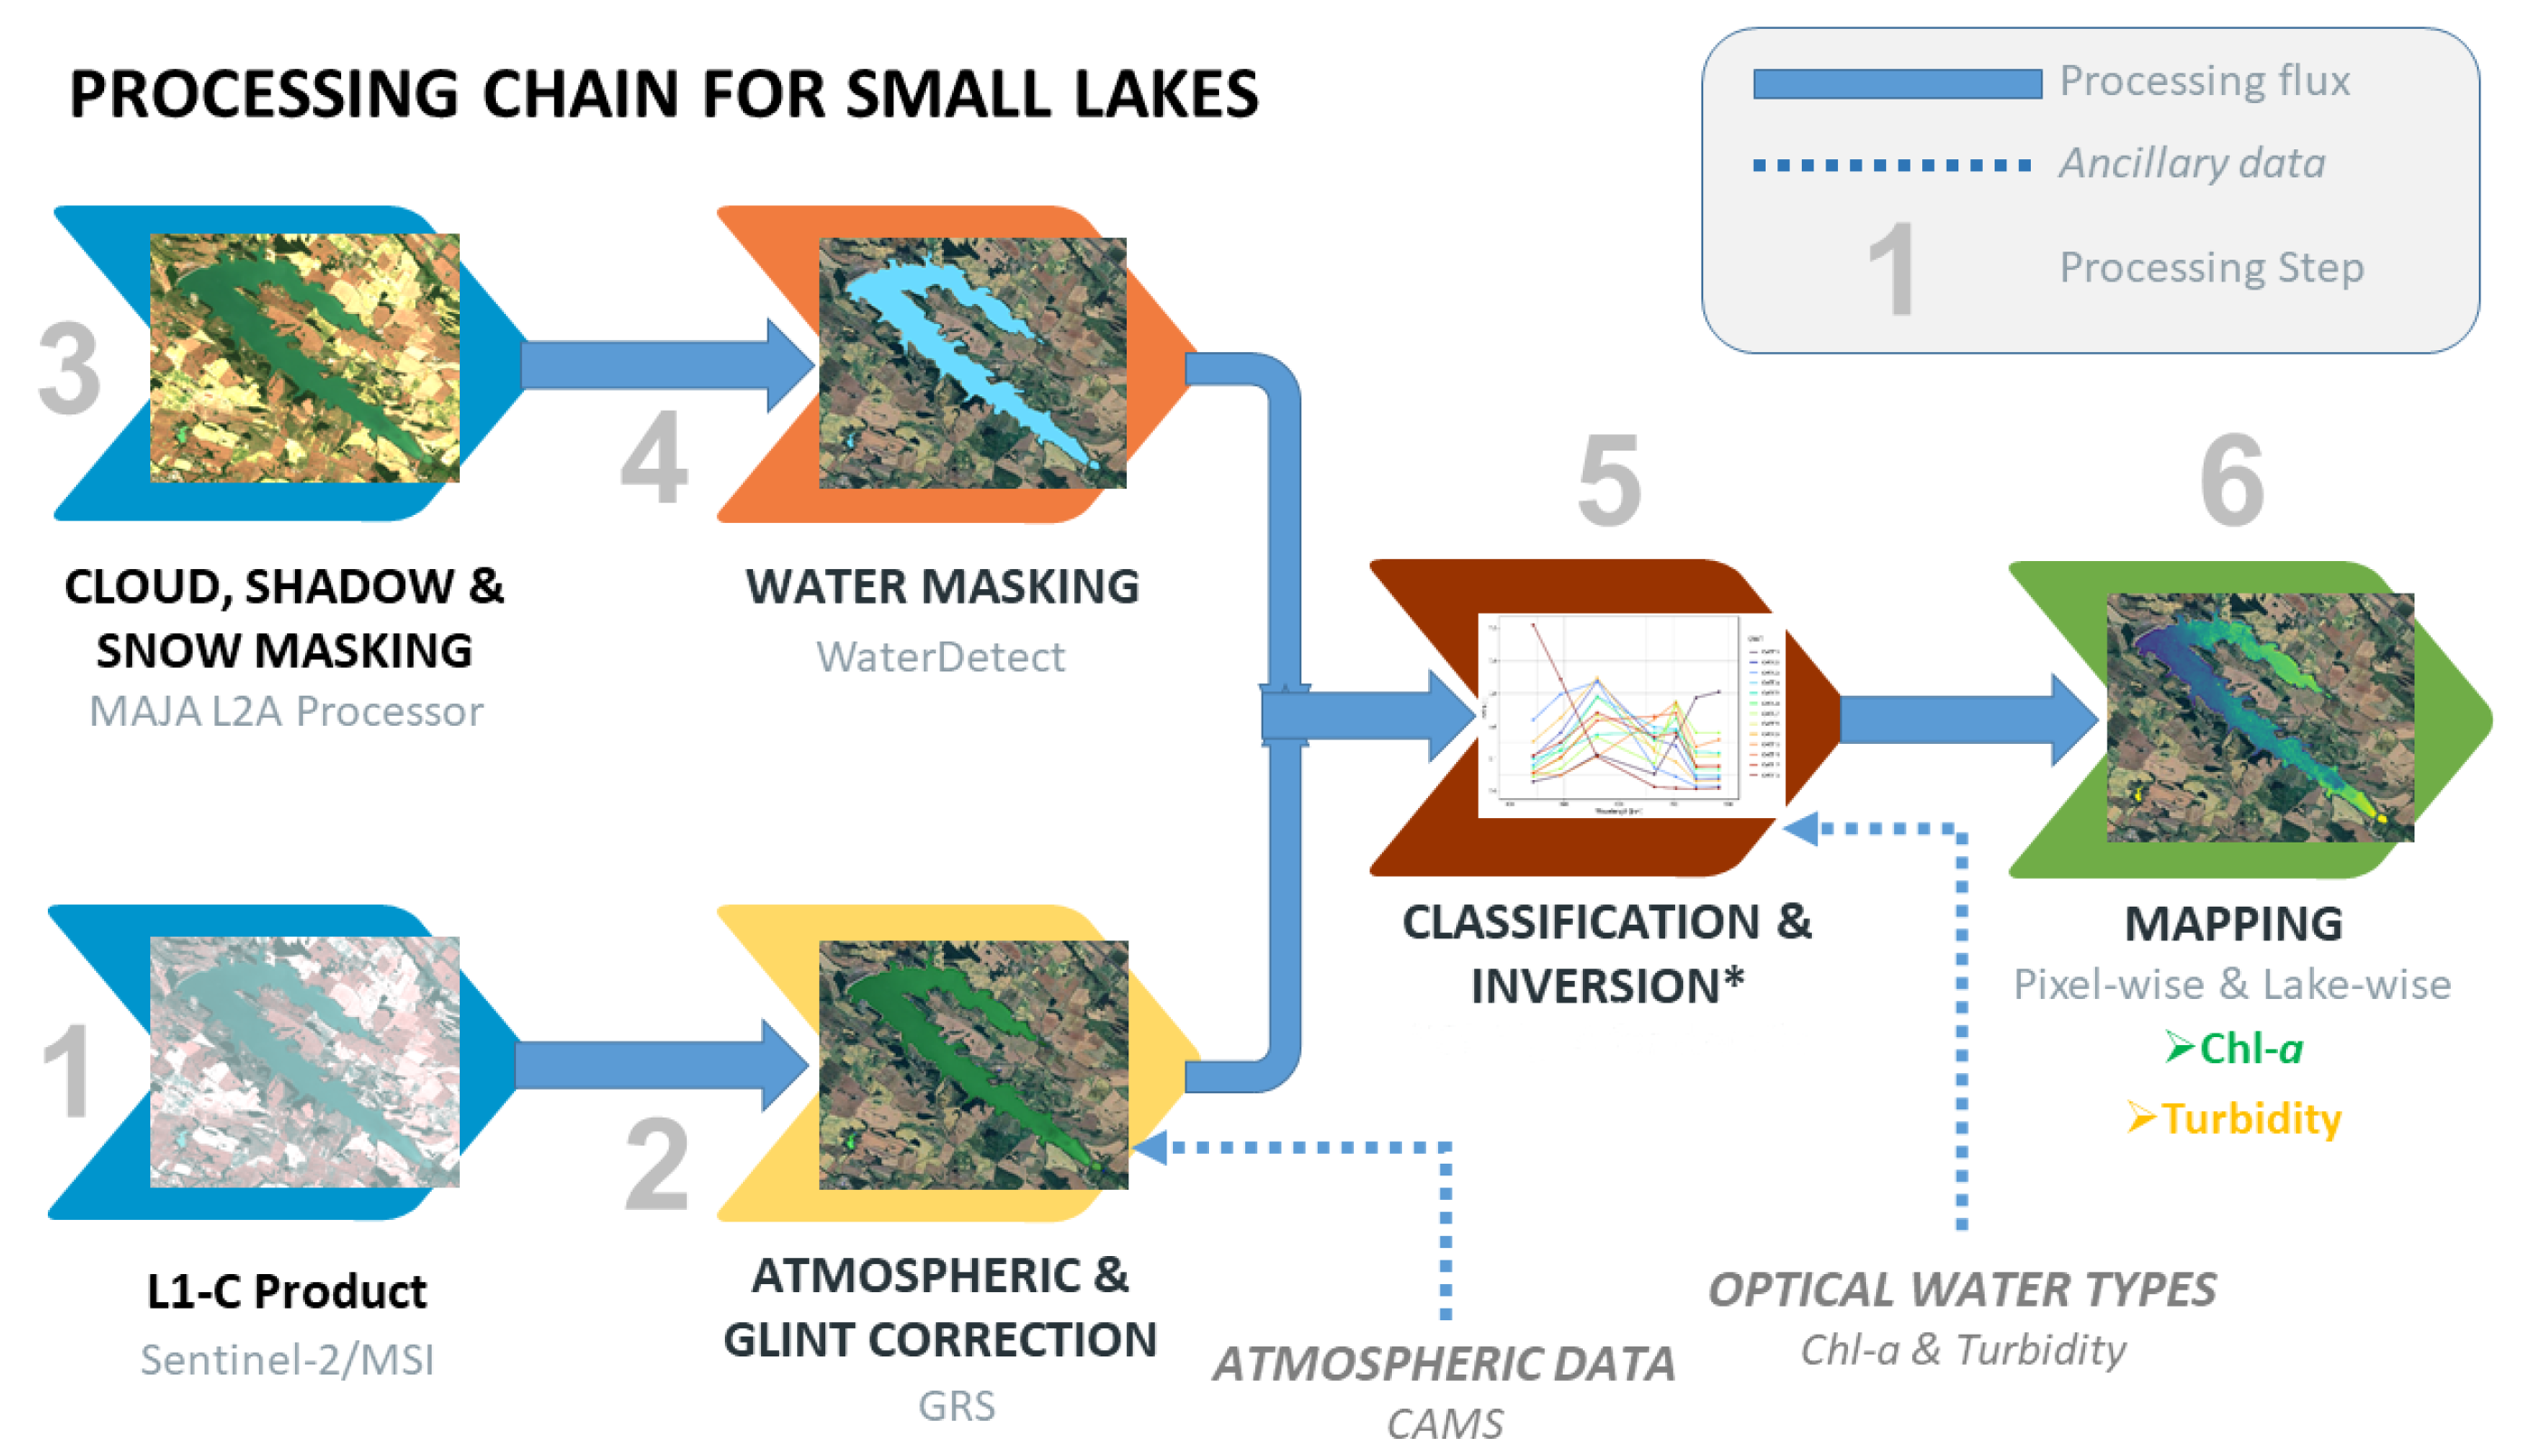
The processing of the satellite images is illustrated in the flowchart in Figure 3.
To correct for sun glint and atmospheric effects, we applied glint removal for the Sentinel-2 like sensors (GRS version 2.0.6, [33]). We selected this model because of their consistent performance, such as in turbid [19] and dark waters [34], and for being one of the few atmospheric processors that can perform sun glint correction, which has been shown to be essential for water quality applications [19]. In GRS, gas absorption correction is performed with the SMAC software [35], for which gas concentrations are retrieved from interpolation from the Copernicus Atmosphere Monitoring Service dataset (CAMS). Spectral radiances are corrected for diffuse sky light and its reflection on the air–water interface, and diffuse radiance is estimated for the viewing geometry from LUTs generated by the radiative transfer model OSOAA [36] for fine and coarse aerosol models, with the aerosol optical depth also retrieved from CAMS. Sun glint is estimated from the residual radiance in the SWIR bands and calculation of the BRDF, then extrapolated to the other bands considering the BRDF spectral dependence.
To detect the relative water extent in each reservoir, we used the WaterDetect algorithm developed by Cordeiro et al. [24] also for Sentinel-2 like sensors. This algorithm has been tested in other studies [37], showing high efficiency in detecting even small water bodies, being much more consistent than applying only spectral indices such MNDWI, for example. WaterDetect uses a multidimensional agglomerative clustering algorithm on a subsample of the scene’s pixels (10% by default) for automatically grouping and classifying the pixels as water. WaterDetect was run using its default configuration (based on the indices MNDWI and NDWI, and Rrs at band 11) with MAJA L2A surface reflectance images as L2A input [38] to take advantage of its robust, multi-temporal algorithm for masking clouds, cloud shadows, and snow, which proved to be highly efficient in a recent comparative study [39]. All the processing was conducted at a spatial resolution of 20 m, as the bands at this resolution (5 to 7 and 8A) are required for the subsequent water quality retrieval step. Band 1 was resampled from 60 m to 20 m using cubic interpolation, as performed automatically by GRS.
The intersection between GRS-derived remote sensing reflectance (Rrs) and the water mask results in the final water colour L2A product. To remove pixels with poor Rrs—caused by issues in sensor acquisition or atmospheric correction—all pixels with negative Rrs in the red spectrum were removed, as this band often has low Rrs but is widely used in inversion models. Additionally, pixels flagged as having extremely low Rrs were removed, defined as the pixels where the maximum Rrs from bands 1 to 6 was smaller than 0.002 sr−1, considered too low for the inversion models to perform reliably. Processing of the L2A imagery to L2B was performed using GET-Pak (version 0.0.7, https://github.com/hybam-dev/get-pak, accessed on 2 August 2025), a Python library designed for producing water quality parameters from Sentinel-2 and Sentinel-3 imagery [40].

2.4. Satellite-Derived Chlorophyll-a Concentration

To retrieve chl-a from satellite imagery, we followed the approach of Liu et al. [11], which utilized MERIS/OLCI imagery to estimate chl-a in inland waters based on the OWTs derived by Spyrakos et al. [10], and using a fuzzy logic method [41] to produce a weighted mean of chl-a. As illustrated in Figure 4, this method assigns specific chl-a algorithms to each OWT, applying them according to the membership of the pixels in each class. Subsequently, a weighted mean is calculated to produce a blended product, enhancing spatial consistency while maintaining accuracy despite variability in water color.
The first step is to classify each pixel into optical water types. For chl-a, we also classified them according to the OWTs derived by Spyrakos et al. [10], which have been shown to perform well for this parameter [9,11]. To achieve this, we first multiplied the hyperspectral Rrs for each of the 13 OWTs by the Spectral Response Function of Sentinel-2A, and again normalised the data to generate the OWTs values for each band. To assign the scores of each OWTs to each pixel, several tests were conducted (Section 3.2), but the spectral angle mapper (SAM) was ultimately used. SAM is a metric to assess the spectral similarity between two spectra. It considers the retrieved and measured reflectance spectra as vectors, and the similarity is based on the angle between these two vectors in a vector space with b dimensions, where b is the number of bands analysed. It is calculated as follows:
SAM = arccos E · M E · M = arccos i = 1 b E i M i i = 1 b E i 2 i = 1 b M i 2
where E is the vector of the Rrs of each pixel, and M is the vector of the Rrs of each OWT. Due to the spectral resolution of Sentinel-2 MSI, we used bands 1 to 7 for the classification of the OWTs. For the pixels at the border of water—that is, the pixels for which B1 is composed of a mixture of land and water (due to its coarser resolution)—the classification was applied considering only bands 2 to 7.
Figure 4. (a) Flowchart illustrating the process for generating satellite-derived chl-a and turbidity products for each pixel. Note that different sources of OWTs, shown in (b) [10] and (c) [42], are used for each parameter.
Remotesensing 17 02729 g004
With the membership scores (i.e., the spectral similarity) for each pixel, the three highest-scoring classes are used to create the blended product, with the exception of OWT 1, which is excluded when it is the dominant class (further explained in Section 2.7). To calculate the weights, a normalisation step applied due to the low variability in spectral similarity among the classes, which results in similar weights when methods rely solely on the values of the distance metric. To address this, a linear interpolation is used to calculate the weights, ranging from 1 to 0, where 1 corresponds to the highest score (first OWT) and 0 corresponds to the score of the fourth-ranking OWT. These weights are then applied to the chl-a values retrieved by the respective OWT algorithm to produce the blended product. For selecting the best algorithms for each OWT, we conducted tests based on the results of Neil et al. [9] and Liu et al. [11]. We did not attempt to recalibrate the algorithms; instead, we tested them using their original coefficients or the coefficients recalibrated by Neil et al. [9] for each OWT in their comparative study, in order to increase their potential of generalisation.
The exception for this are dark lakes, or those with low Rrs for other reasons (such as excessive sun glint correction and overcorrection of atmospheric effects, for example, due to issues with surface pressure in high-altitude environments), which yielded poor results due to the difficulty in classifying them into OWTs using normalised Rrs. This caused substantial artificial spatial variability as a function of variable OWT classification (and thus, variable algorithm use). To address this, we established a criteria to select the pixels with where the maximum Rrs in bands 1 to 6 (bands 7 and 8A were not included due to sensitivity to adjacency effects) were smaller than 0.005 sr−1 (therefore, with maximum Rrs between 0.002 and 0.005), which were named OWT 0 and treated differently. For OWT 0, no blended product was generated, but rather a single algorithm was applied to each pixel. In this case, we tested only algorithms specifically designed for low chl-a concentrations, based on the assumption that lakes with low Rrs values generally have low chl-a.

2.5. Satellite-Derived Turbidity

For turbidity, however, studies have shown that using normalised Rrs reduces the efficiency of optical classification methods. This is because the amplitude of reflectance in the dominant spectra—ranging from blue to green in clear waters and from red to NIR in sediment-laden waters—is directly related to the concentration of suspended solids [42]. Consequently, using classification methods such as the one derived by Spyrakos et al. [10] has been rendered less effective than those that consider the amplitude of Rrs. Therefore, as an exercise to show this, we tested the framework proposed by Carrea et al. [13], with three algorithms selected for the 13 OWTs of Spyrakos et al. [10], with the results included in the Supplementary Materials.
As a measure to overcome this limitation, in this study, we adopted the classification scheme proposed by Cordeiro [42], specifically designed for the retrieval of turbidity and suspended solids. This scheme, illustrated in Figure 4, is based on over 1000 collocated hyperspectral and water quality measurements from tropical water bodies, with suspended particulate matter (SPM) concentrations ranging from 0.1 to 1800 mg/L. By testing different grouping techniques and metrics, it resulted in 4 OWTs grouped by k-means clustering. These groupings incorporate additional information from the NIR spectrum (bands 8 and 8A in Sentinel-2 MSI) as sediment-laden waters can exhibit high reflectance even at wavelengths longer than 800 nm. Furthermore, the author concluded that this classification scheme is well-suited for Sentinel-2 MSI, as using a discrete set of bands did not result in a significant loss of classification accuracy.
Since the classification resulted in only four OWTs, we did not use a blended algorithm for retrieving turbidity; rather, the output of a single algorithm was assigned to each OWT. In our tests, this approach did not produce significant spatial discrepancies, which are often observed with chl-a retrievals. To assign a turbidity algorithm to each pixel, the OWT was determined based on the minimum Euclidean distance between the pixel’s Rrs and the reference Rrs values of the OWTs, as illustrated in Figure 4. For testing the turbidity algorithms, we selected a range of algorithms based on Carrea et al. [13] and widely used algorithms from the literature, such as those developed by Nechad et al. [43] and Dogliotti et al. [44], using their original coefficients without further recalibration, again to increase their potential of generalisation. Most of these algorithms were developed for retrieving SPM, but were tested for retrieving turbidity without further modifications, as performed, for example, in [13].

2.6. Accuracy Assessment

To generate the match-ups between both in situ Rrs and water quality with satellite observations, we used a spatial window of 3 × 3 pixels around the measurement point and a temporal window of ±5 days between in situ measurement and satellite overpass. This approach increased the number of match-ups and has been shown not to significantly impact the results of validation [20,45]. For the Rrs data, we used bands 1 to 7 and 8A, which are the bands used in the water quality algorithms. For the match-ups, the in situ Rrs data were first resampled to the Sentinel-2 MSI bands using the Spectral Response Function of Sentinel-2A, and then compared to the satellite-derived Rrs.
In total, we obtained 65 match-ups of Rrs data, 618 match-ups of chl-a data (481 from the AEAG dataset, 78 from the gravel pit dataset, and 59 from our in situ samplings), and 608 match-ups of turbidity data (489 from the AEAG dataset, 60 from the gravel pit dataset, and 59 from our in situ samplings). For validation, we used the following metrics: median absolute percentage error (MAPE), the root mean squared error (RMSE), the root mean squared log error (RMSLE), and the coefficient of correlation. For the Rrs data, we also calculated the normalized bias (%Bias) to assess the over- or underestimation of Rrs by GRS.

2.7. Time Series of the Water Quality Variables

Another form of validation for the method is to produce the time series of the parameters and to compare them with the available in situ data. Therefore, we produced time series for the two water quality parameters for the AEAG lakes and the reservoirs sampled for both Rrs and water quality for further validating our approach. For summarising, however, we present results only for two of the AEAG lakes. To process the data, the L2B products were clipped by the polygons of the water bodies with an inward buffer of 30 m (to further avoid the effects of mixed pixels, especially during the low-water periods). As an initial screening test, we examined each pixel in the images for possible effects of adjacency, macrophyte occurrence, bottom effects, and mixed pixels. Pixels classified as OWT 1 in the classification scheme proposed by Spyrakos et al. [10], which has a much higher response in the NIR red-edge part of the spectrum, were removed from the analysis as a conservative approach, as these pixels were generally a result of artefacts in the surface reflectance. Indeed, this is a conservative approach as pixels containing scum of algae blooms can be classified as OWT 1; however, we found in our tests (and in the field validation, Section 2.1) that it is an efficient method to remove pixels contaminated by such artefacts, and is especially relevant for small lakes, which have a low number of available pixels and are thus more susceptible to contamination. Additionally, Liu et al. [11] found no waters classified as OWT 1 in their database, further demonstrating the specificity of this class.
Next, pixels identified as outliers for each parameter were removed from all analysis. This was performed first by excluding negative values, and pixels with chl-a > 500 mg/m3 and turbidity > 2000 NTU (values exceeding the calibration limits of the models). We then applied a box-plot approach, removing values outside the quartiles ± 1.5 × the interquartile range. For processing the data for each date, we used the median of all remaining pixels, considering a minimum of 9 pixels [46,47] and at least 20% of all possible pixels in each water body.

3. Results

3.1. Validation of Rrs Data

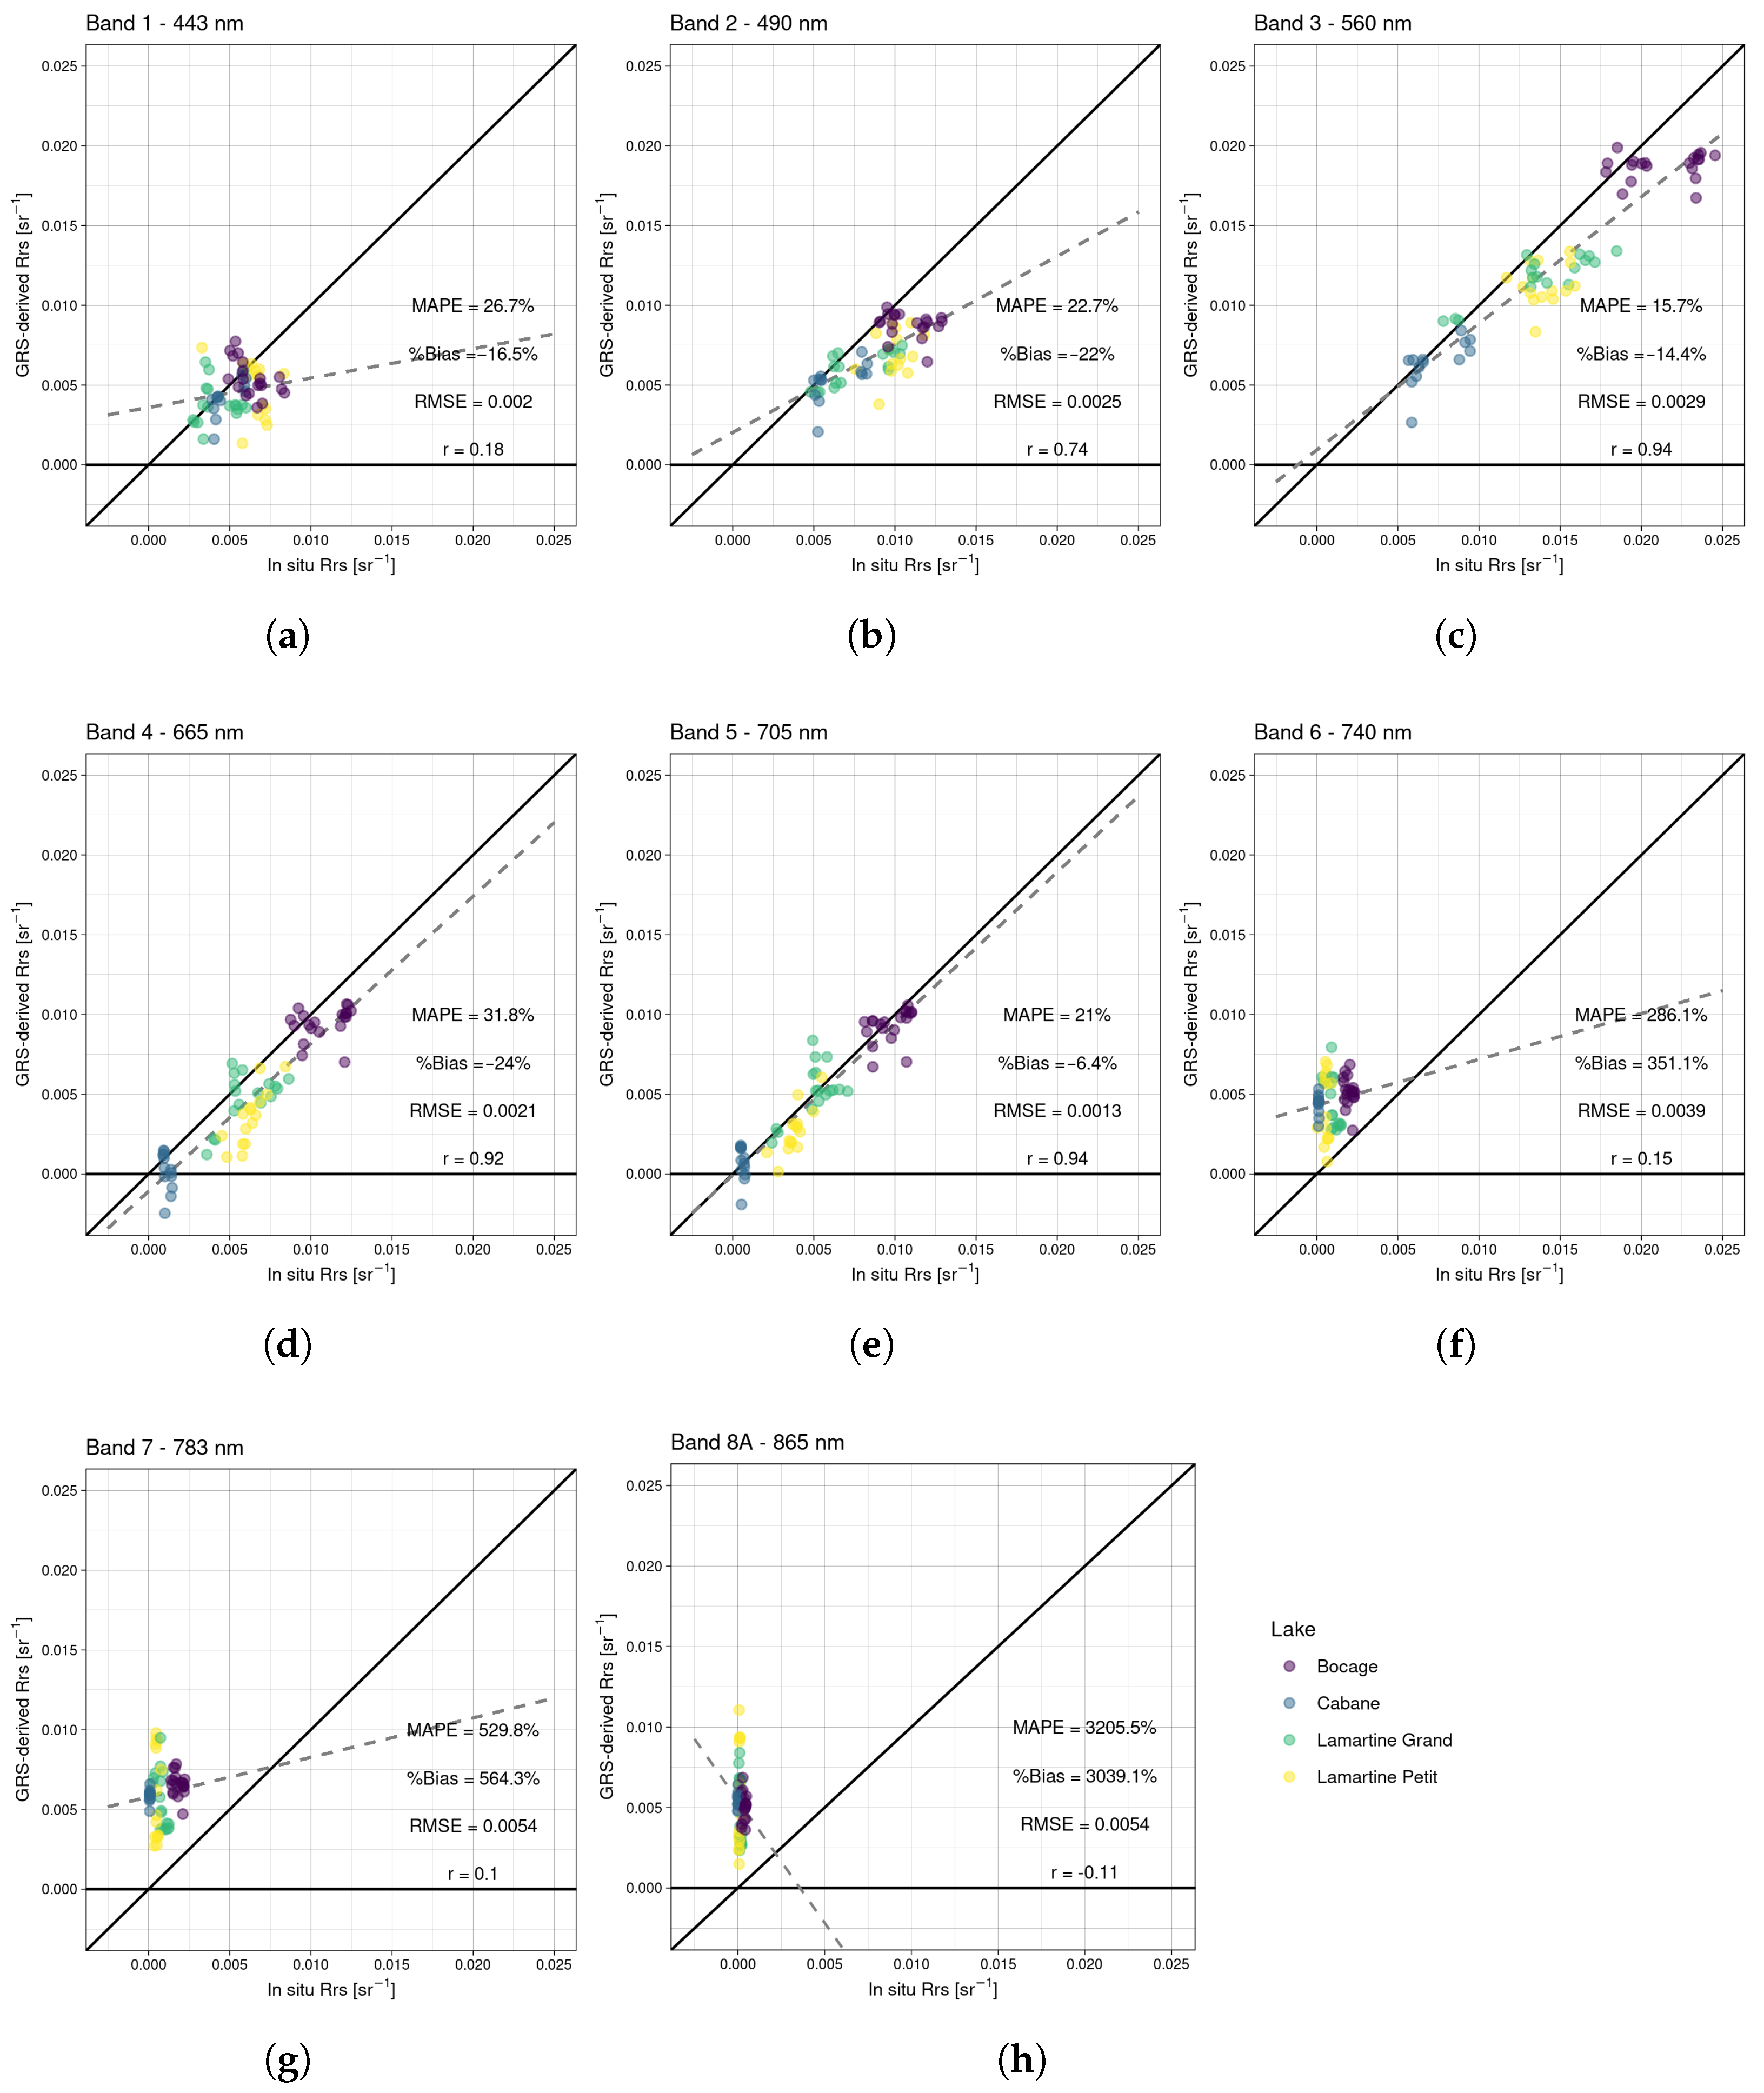
Figure 5 shows the validation of Rrs derived from GRS for the 4 lakes where we conducted in situ monitoring of the transects, for bands 1 to 8A. In total, we found 10 match-up dates for the 4 lakes, resulting in a total of 65 data points. GRS retrieved robust Rrs values for bands 3 (green), 4 (red), and 5 (red-edge), with MAPE ranging from 16 to 32% and r ranging from 0.92 to 0.94, despite some underestimation, as indicated by %Bias ranging from −6 to −24%. The results for band 2 (blue) are also satisfactory, with MAPE of 23%, %Bias of −22%, and r = 0.74. These results are quite significant, since these are the most-used bands in the algorithms employed to retrieve the water quality parameters.
For band 1 (coastal/aerosols), the satellite-derived Rrs generally agree with the in situ data, although there is a larger dispersion around the 1:1 line. For bands 6, 7, and 8A, however, we observe significant overestimation of the Rrs, for which the in situ values are very low (all smaller than 0.002 sr−1), probably due to the adjacency effect. As a result, the metrics for these bands are poor, particularly for bands 7 and 8A.
We also highlight the importance of sun glint correction in retrieving consistent Rrs from these lakes. Even though the results are not shown in Figure 5 for the purpose of better visualisation, they improved for all bands, including those strongly affected by adjacency. For example, for band 4, without sun glint correction the errors increase from an MAPE of 32% to 67% and an RMSE of 0.0021 to 0.0067, and for band 5, from an MAPE of 21% to 91%, and an RMSE of 0.0013 to 0.0079, showcasing the effectiveness of the GRS algorithm in correcting both atmospheric effects and sun glint.

3.2. Chl-a

We tested multiple configurations of algorithms and OWTs, with the best results found using the chl-a algorithms assigned as shown in Table 1. It is important to note that no calibration was performed, and the best coefficients for each case are also presented in Table 1. The selected models were the following: the Ocean Color 2 (OC2) algorithm [48] for dark and clear waters, the semi-analytical NIR-Red band algorithm [49] for medium turbid, mesoeutrophic waters, the Normalised Difference Chlorophyll Index (NDCI) [50] for turbid, oligo–mesotrophic waters, and a NIR-Red band ratio algorithm [51] for mesoeutrophic waters dominated by phytoplankton. For the general classes 2 and 12—which have medium turbidity and balanced composition of optical active constituents (OACs)—we proposed a switching algorithm from NDCI for oligotrophic pixels, to the NIR-Red band ratio for mesoeutrophic pixels, based on the fact that the algorithm proposed by Gilerson et al. [51] does not work well for chl-a values below 20 mg m−3, based on incorrect calibration of the coefficient of specific absorption by phytoplankton for these low values [51]. Therefore, we stipulated a switching threshold of 20 mg m−3 estimated by NDCI for these two classes, which significantly improved the results for both oligo and mesotrophic waters. In most cases, the original coefficients performed better, except for the OC2 algorithm in clear waters (classes 3, 9, and 13), where using the coefficients calibrated by Neil et al. [9] significantly improved the accuracy of the estimations in oligotrophic lakes. Additionally, OC2 was found to work well with the low Rrs lakes (OWT 0). A better description of the selected models can be found in the Supplementary Materials, as well as the other algorithms that were also tested. The results also showcases the consistency of the method to retrieve chl-a for both types of in situ monitoring techniques applied for the field data (lab measurements and fluorescence).
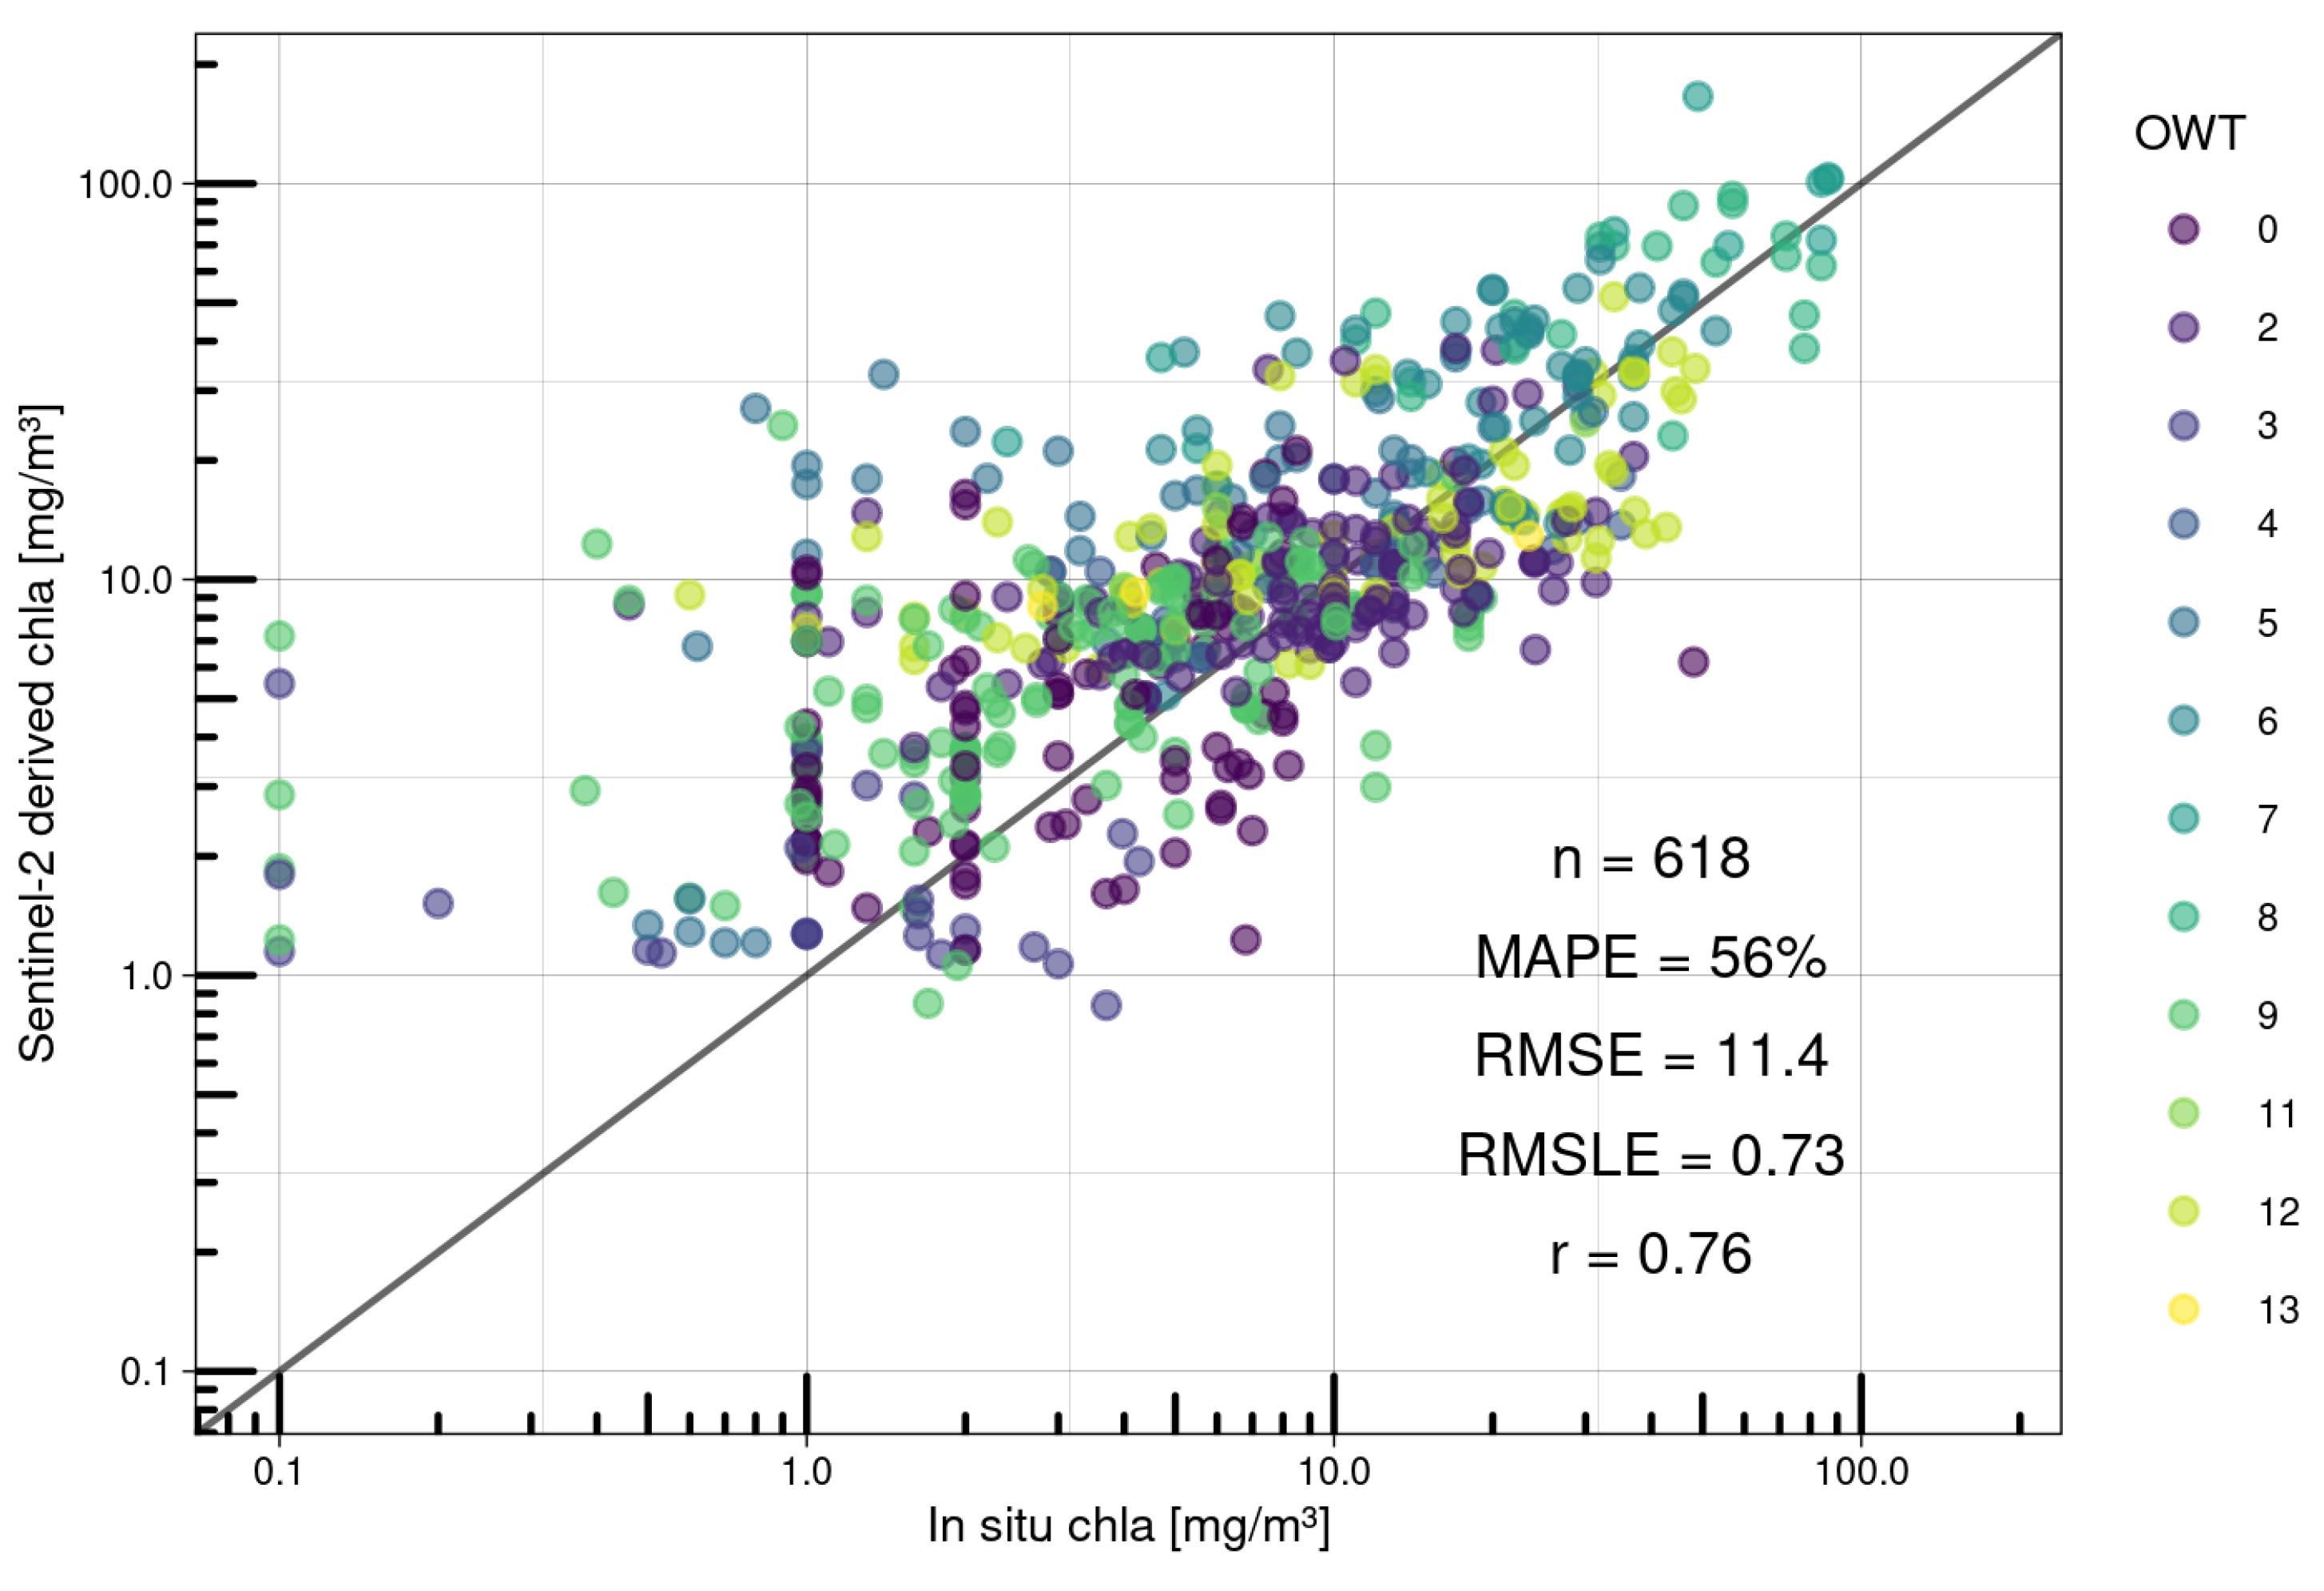
Figure 6 presents the validation of chl-a, comparing the in situ with satellite-derived chl-a. The method is consistent, with alignment of the data points with the 1:1 line. The metrics found were MAPE of 56%, RMSE of 11.4 mg m−3, RMSLE of 0.73, and r of 0.76. For the different datasets, the metrics are similar: for the AEAG dataset, we found an MAPE of 55%, an RMSE of 11.7 mg m−3, an RMSLE of 0.70, and an r of 0.79, and for the gravel lakes dataset, we found an MAPE of 61%, an RMSE of 7.1 mg m−3, an RMSLE of 0.64, and an r of 0.66. This shows that the method is consistent across the two different data acquisition types. The metrics are also consistent across the different temporal window sizes (Table S2), with a small decrease in the MAPE (from 56% to 48%) when considering only same-day acquisitions. In addition, there is no visible influence of OWT on the accuracy, i.e., the method is robust across all OWTs found in the lakes, with the exception of OWTs 10, 11, and 13 for which very few match-ups (none for class 10) were found, so there is a higher uncertainty over the applicability of the selected models. There is a slight tendency to overestimate small values, which are hard to estimate due to all the uncertainties in the remote sensing data. Some outliers were also observed, estimated mostly using the NIR-Red band ratio algorithms.
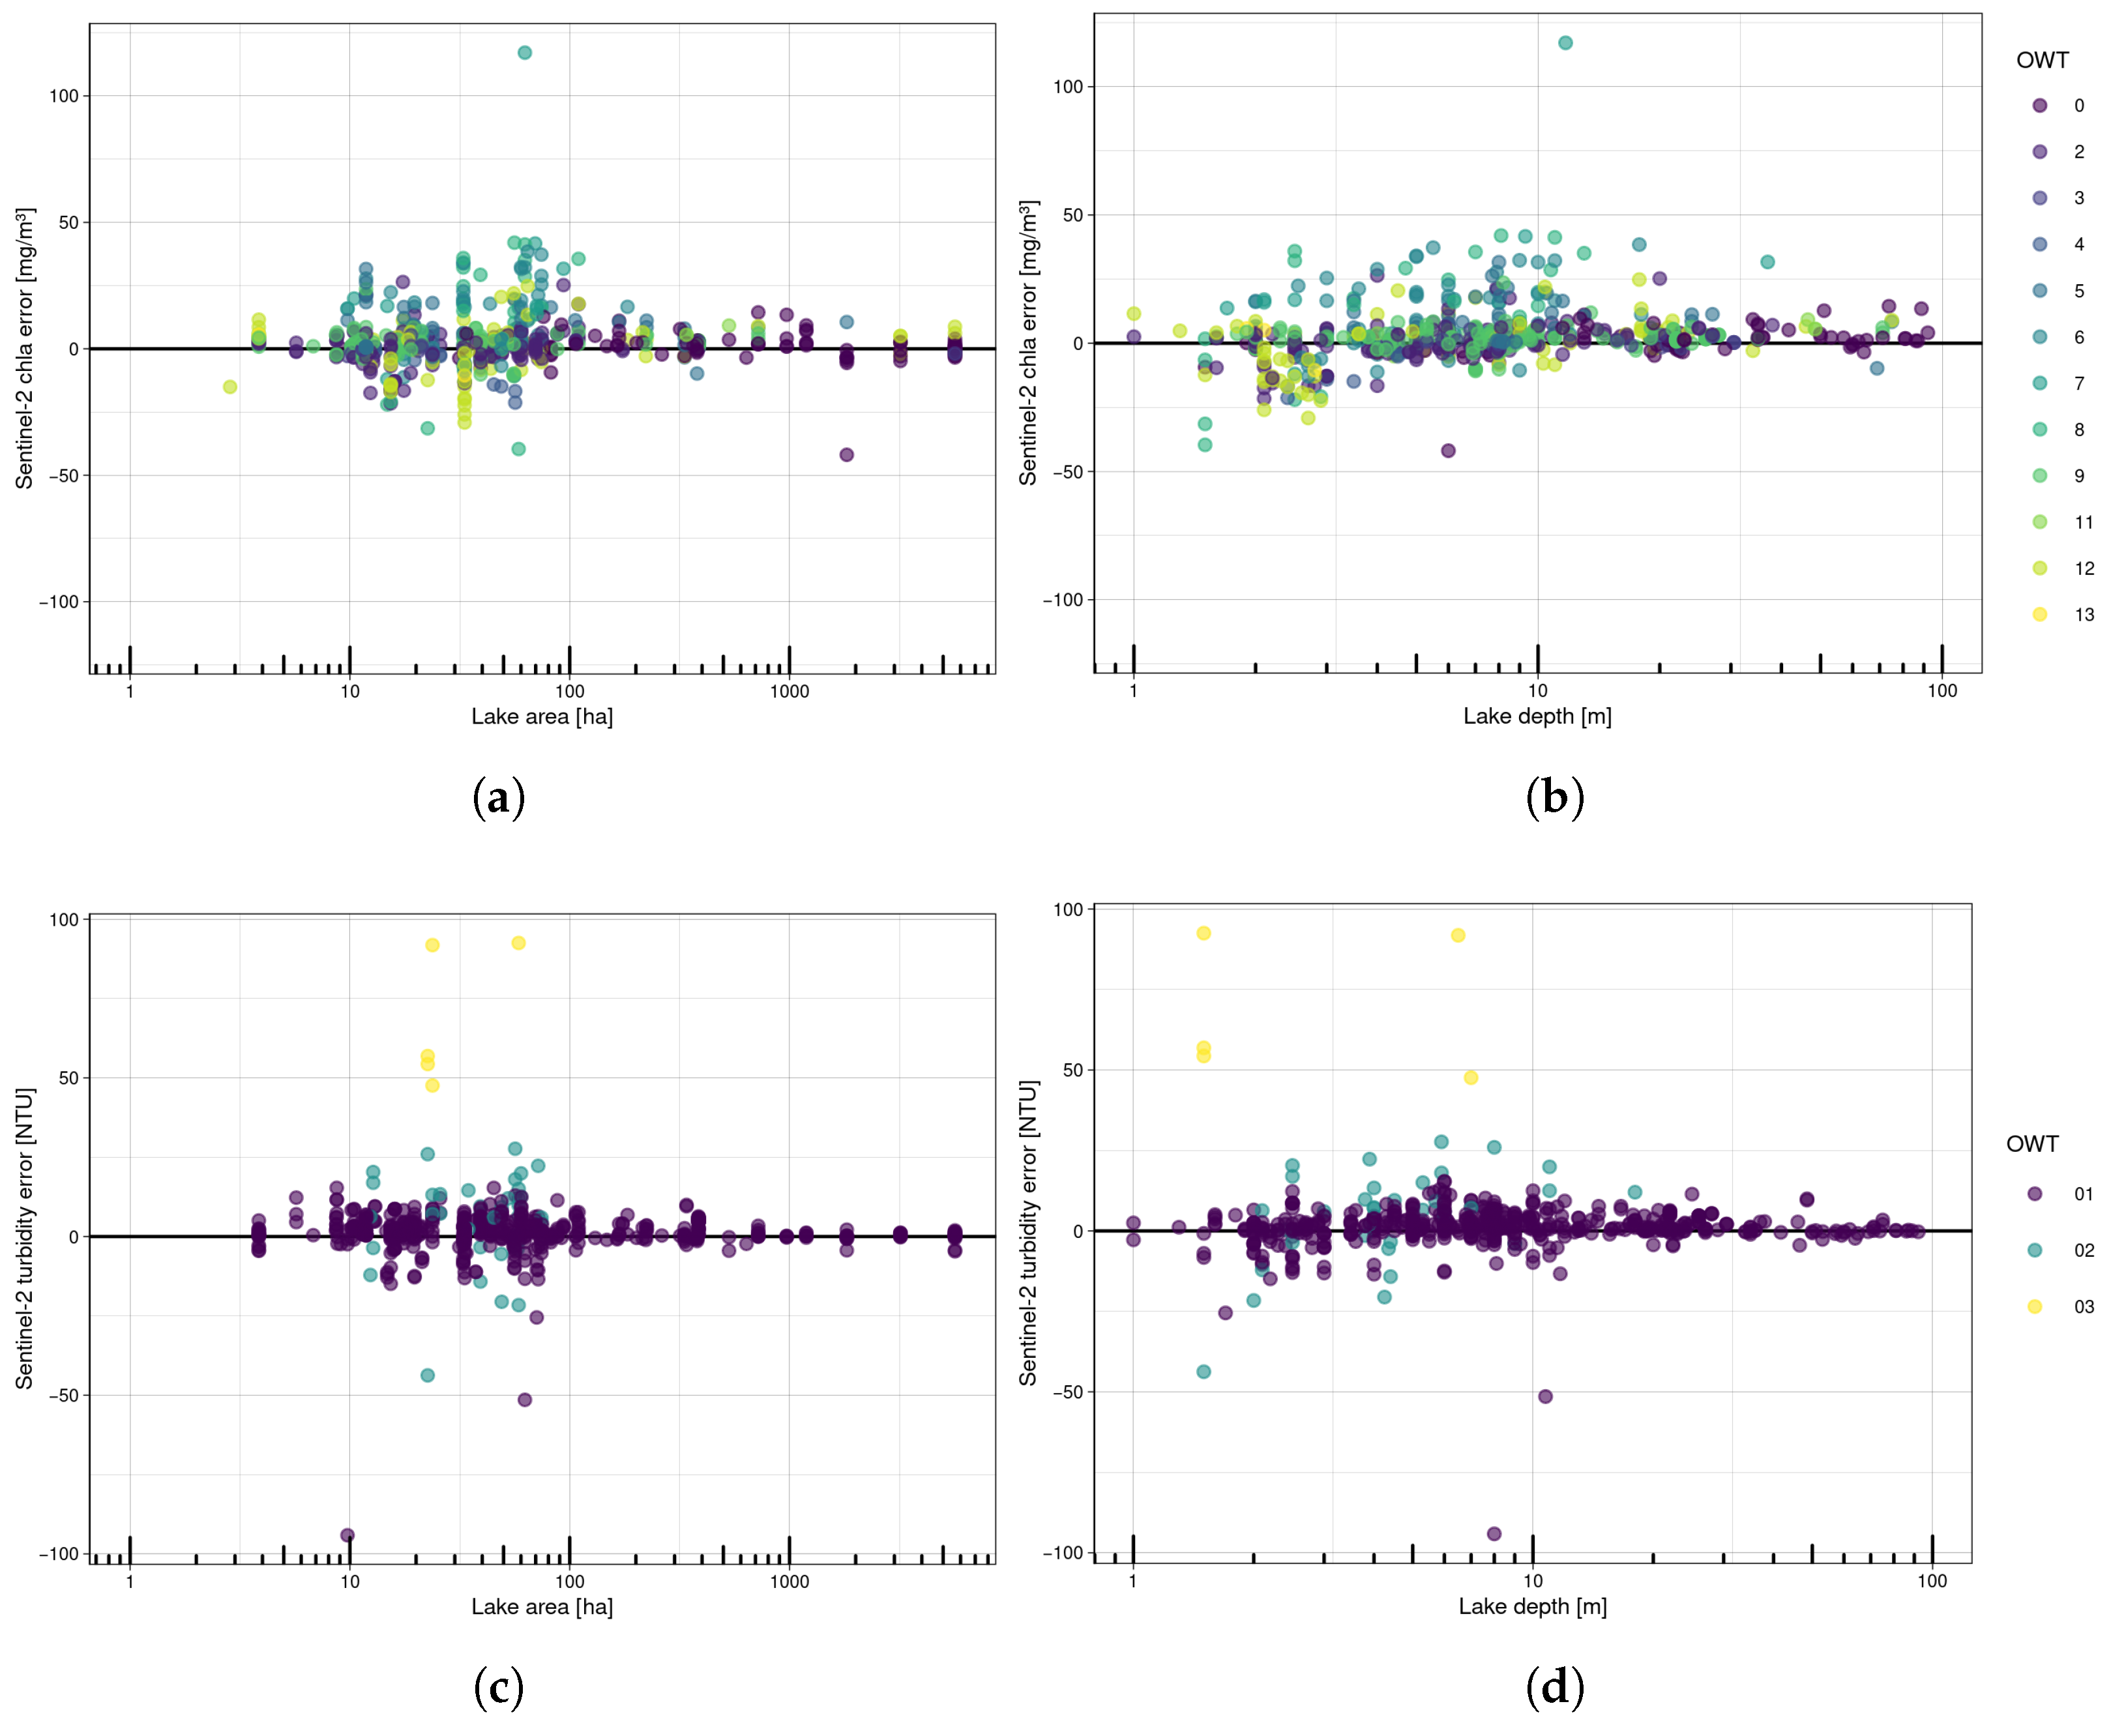
In addition, no visible effect of lake area or lake depth on the retrieval errors was observed, as shown in Figure 7a,b (regression lines not significant at the 95% confidence level, R2 = 0.01), showing that the framework is robust and suitable for application over small lakes with varying water colours.
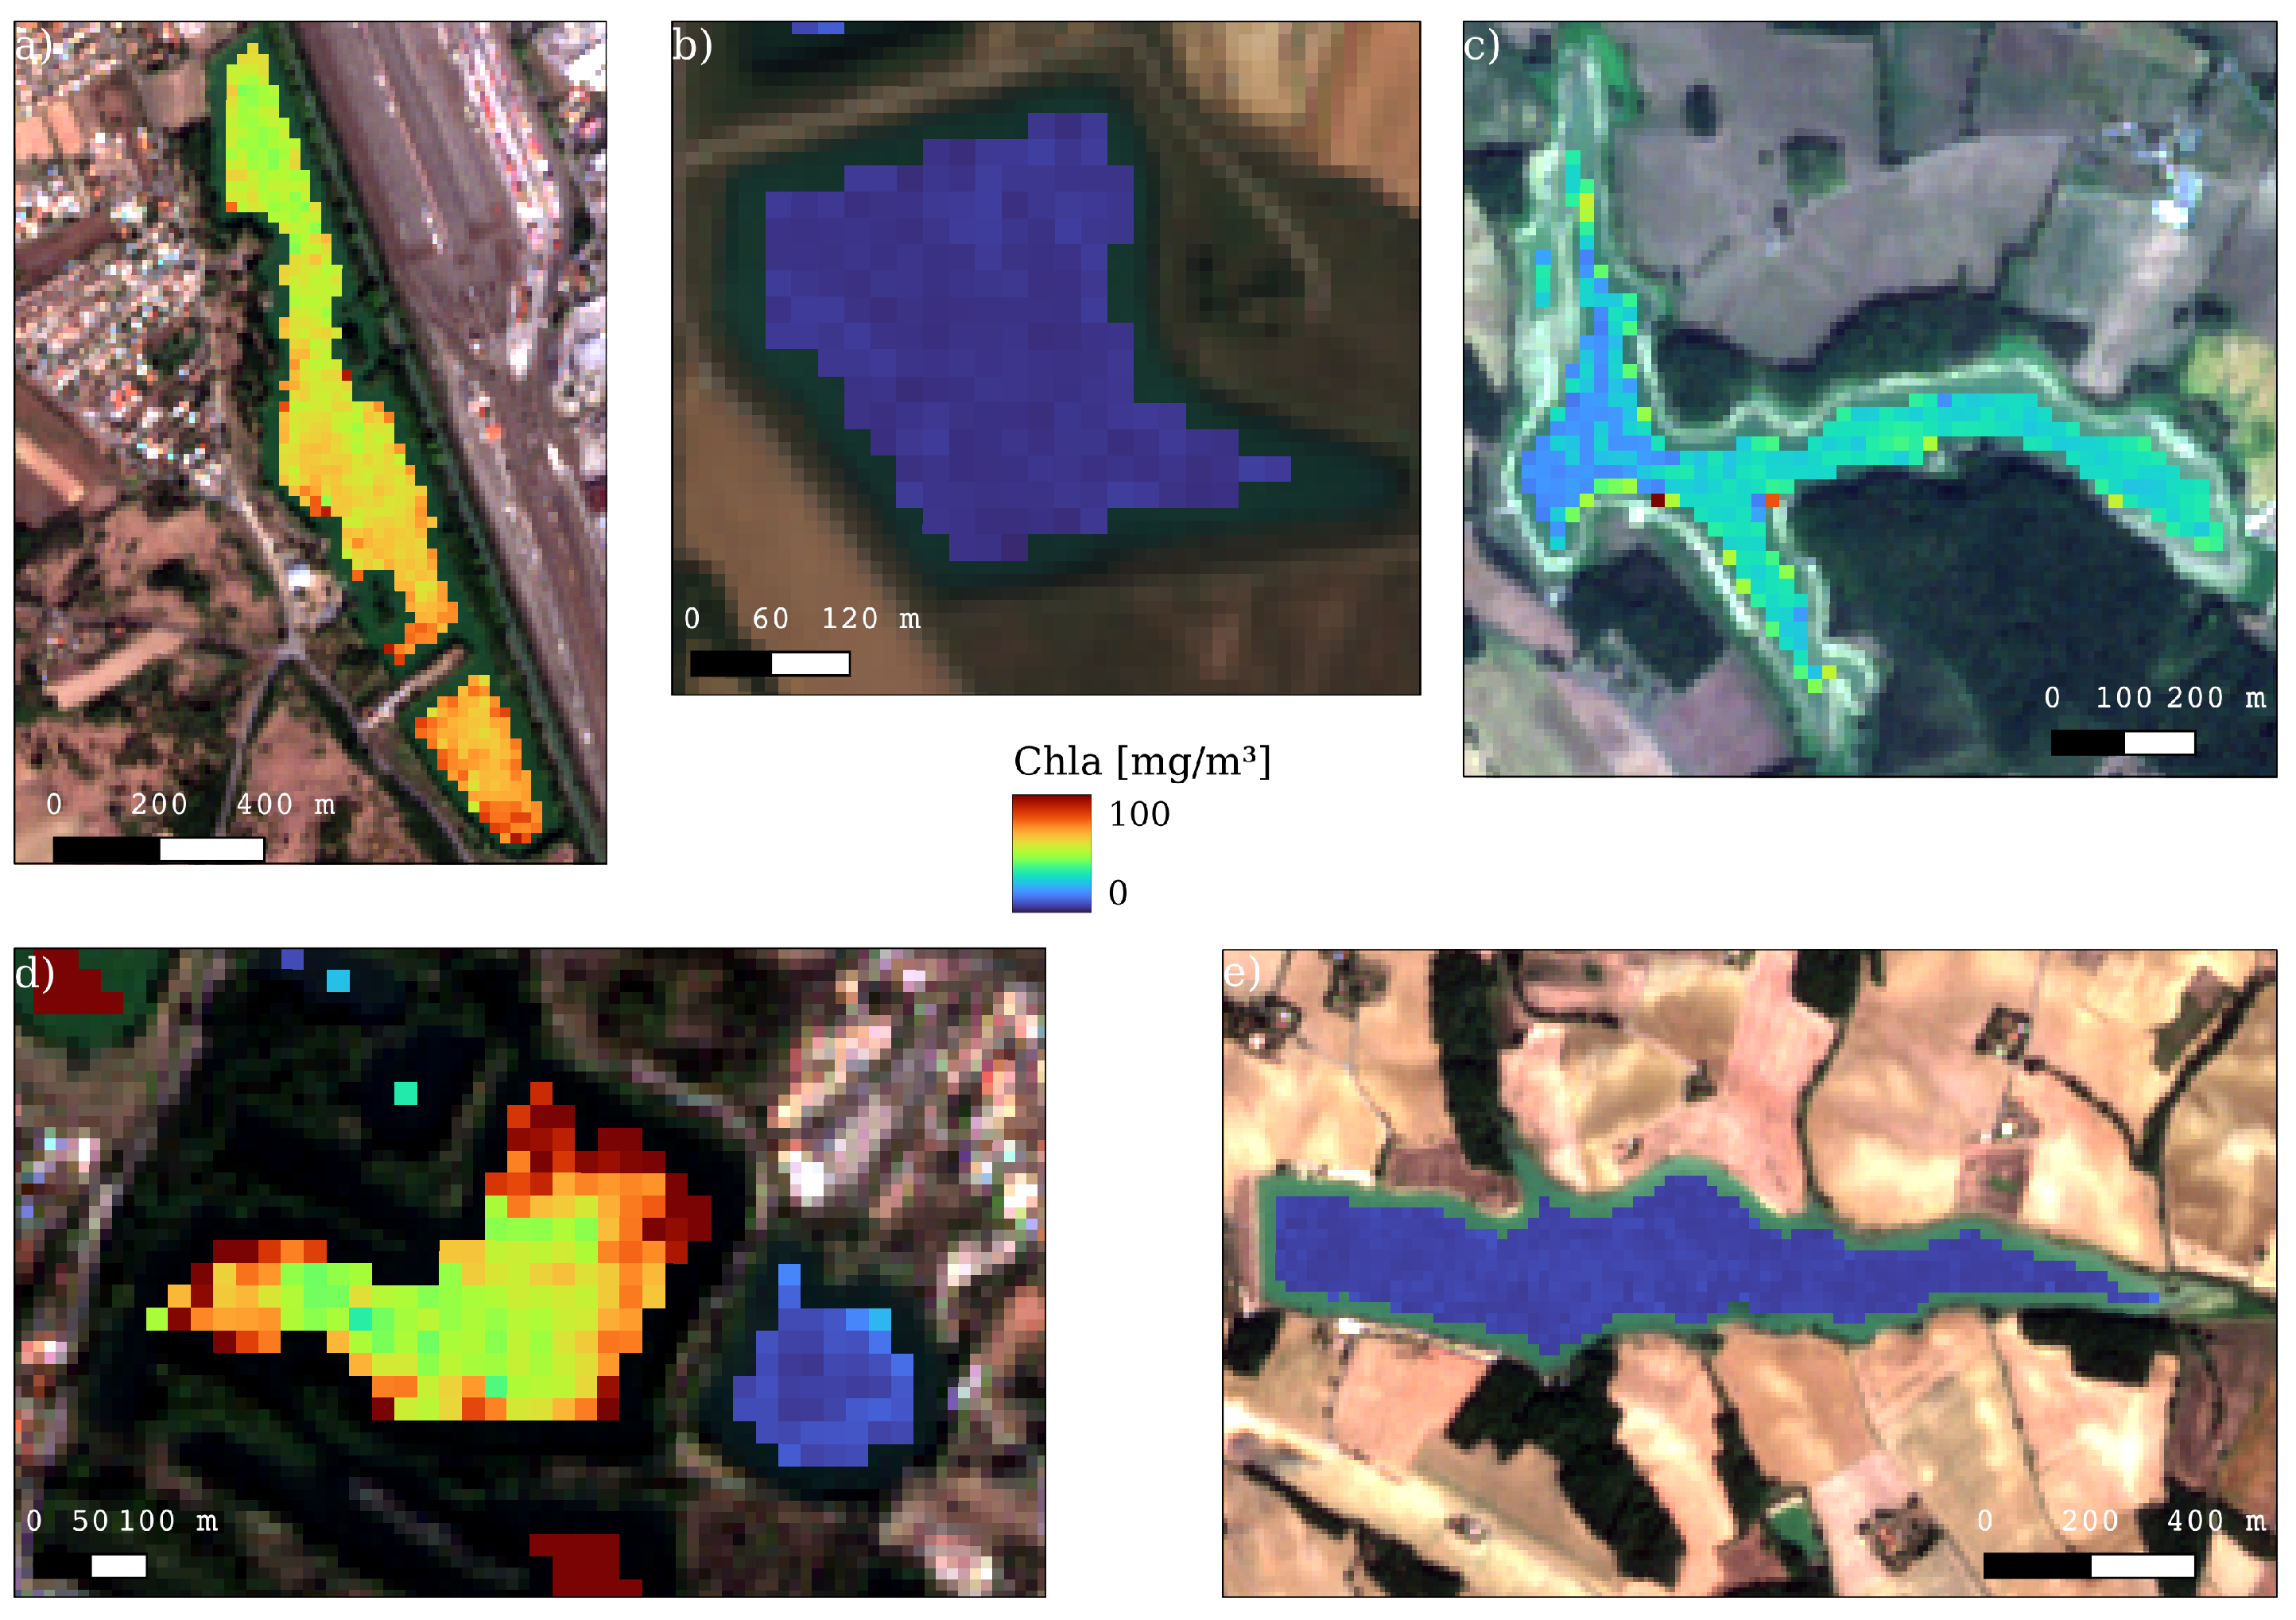
In terms of spatial representation and consistency, Figure 8 shows chl-a maps over the 6 selected lakes. The pixels show robust spatial consistency, with chl-a gradients accurately represented for lakes Bocage, Lamartine Grand, and Graoussettes, and uniformity over lakes Cabane, Lamartine Petit, and Laragou; while some outliers appear, particularly along the lake borders, the overall spatial representation is successfully achieved with the methodology applied in our study.
Table 1. Selected chl-a algorithms for the 13 optical water types [10] and for the class for low Rrs (OWT 0).
AlgorithmOWTsTypologyCoefficients
Ocean Color 2 [48]0Dark water pixels/lakesOriginal
Semi-analytical NIR-Red band algorithm [49]1, 6, 10Medium turbid, mesoeutrophic waters with high absorption in short wavelengthsOriginal
Ocean Color 2 [48]3, 9, 13Clear waters dominated by phytoplanktonCalibrated by Neil et al. [9] for each OWT
Normalised Difference Chlorophyll Index [50]4, 5, 11Turbid, oligo–mesotrophic watersOriginal
NIR-Red band ratio [51]7, 8mesoeutrophic waters dominated by phytoplanktonOriginal
* Switching NDCI [50]/
NIR-Red band ratio [51]
2, 12Medium turbid, oligo–mesotrophic waters with balanced OACsOriginal
* for OWTs 2 and 12, which are two common case waters, the algorithm is switched from NDCI to the NIR-Red band ratio based on a threshold of 20 mg m−3 estimated by NDCI.

3.3. Turbidity

The turbidity algorithms were assigned to the turbidity OWTs according to Table 2. For this parameter, only the original coefficients were used. The algorithm—proposed by Jiang et al. [52], and adapted by Jiang et al. [53] for Sentinel-2 MSI—successfully retrieved turbidity when using only the green and red bands for the two less turbid water classes. We tested using only the methodology proposed by Jiang et al. [53], but we found that its classification scheme (OWT) did not work effectively with Sentinel-2 data, leading to a very irregular spatial distribution of turbidity. In addition, the models using the red-edge and NIR bands overestimated turbidity, and thus other models were tested for the turbid waters of OWT 3, resulting in the selection of the model developed by Zhang et al. [54]. For OWT 4, designed for SPM between 200 and 2000 mg L−1, no occurrence was found in our match-ups, and therefore no model was implemented. The equations of the selected models are described in the Supplementary Materials.
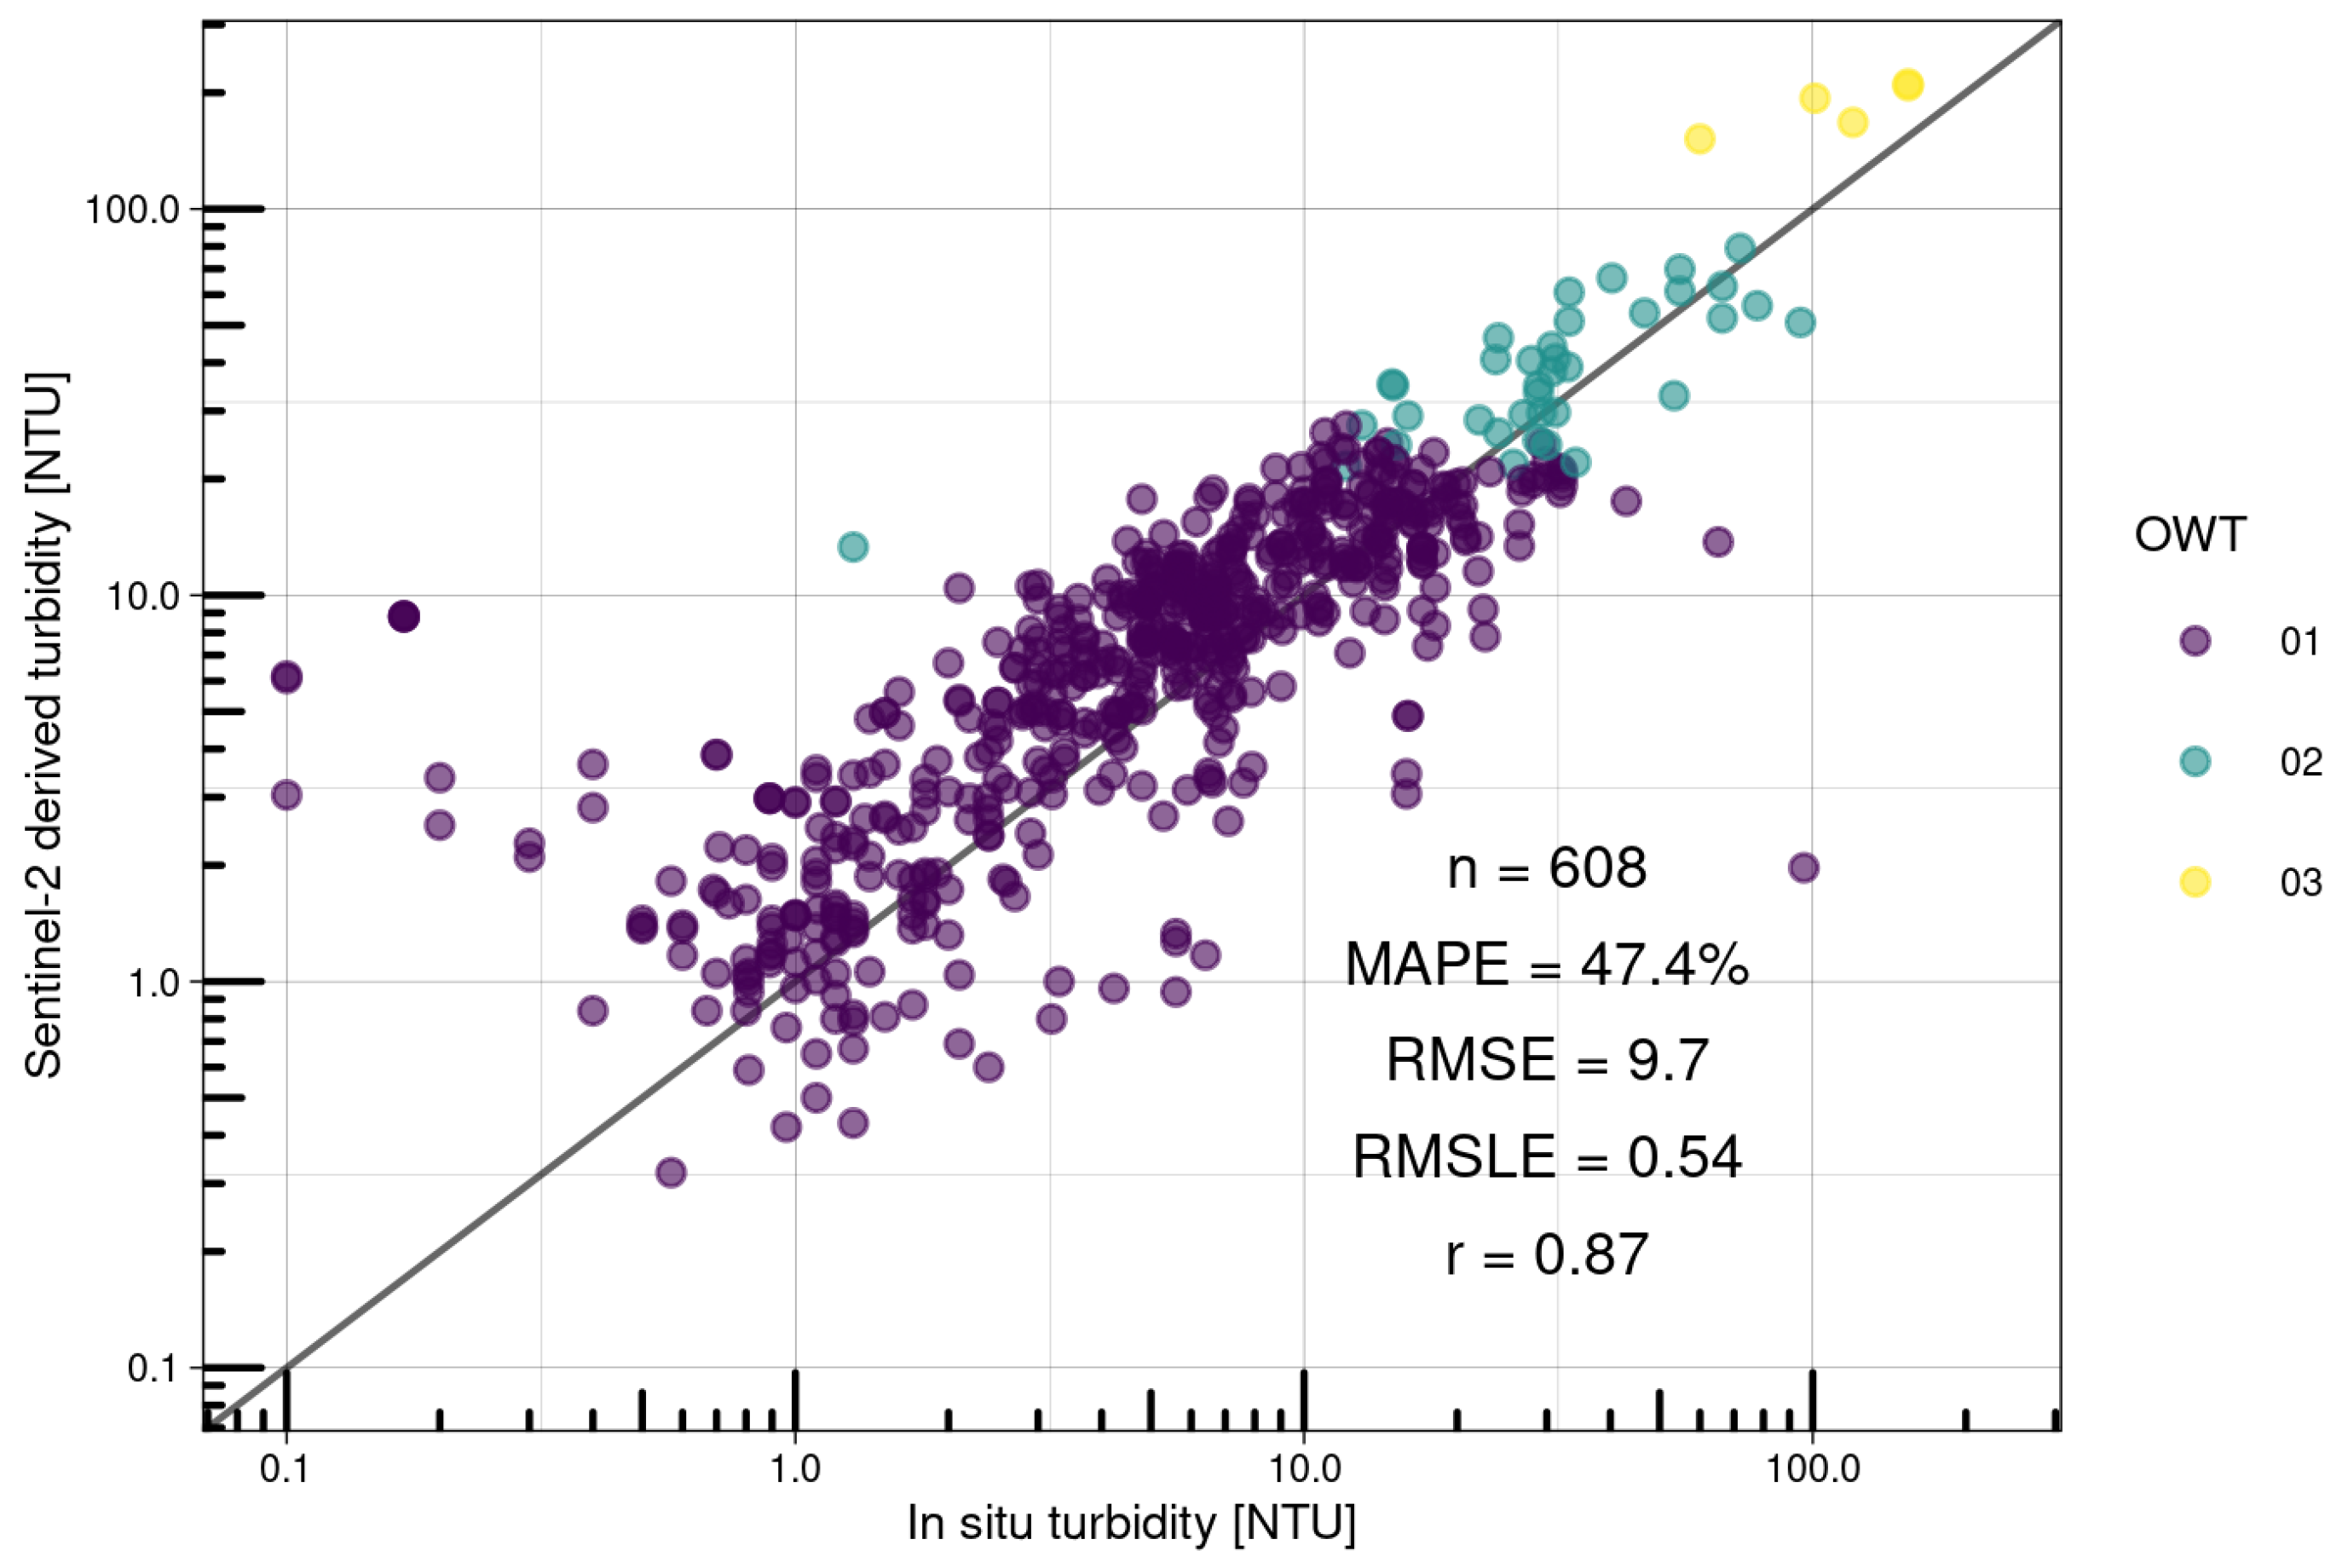
Figure 9 shows the comparison between in situ and satellite-derived turbidity. The method is consistent, with an even better alignment of the data points to the 1:1 line in comparison to chl-a, and very few outliers, mostly caused by overestimation of small values. However, there is one data point where the classification scheme failed, resulting in a significant underestimation. The metrics found were MAPE of 47%, RMSE of 9.7 NTU, RMSLE of 0.54, and r of 0.87. For the different datasets, the metrics are a bit different as a function of the different water transparencies found in each dataset (the gravel pit lakes have generally clear waters): for the AEAG dataset, we found an MAPE of 44%, an RMSE of 10.7 NTU, an RMSLE of 0.54, and an r of 0.87, and for the gravel lakes dataset, we found an MAPE of 87%, an RMSE of 3.9 NTU, an RMSLE of 0.72, and an r of 0.85. The results demonstrate that the method for turbidity is also consistent over the two different data acquisition types. Unfortunately, however, very few match-ups were found for OWT 3 (designed for SPM between 50 and 500 mg L−1), making it difficult to fully assess the accuracy of this model. The metrics are also consistent across the different temporal window sizes (Table S3), with a progressive decrease in RMSE (from 9.7 to 7.7 NTU for same-day acquisition) which results mostly from a reduction in the number of samples with higher turbidity.
The test performed using the algorithms selected by Carrea et al. [13] for the OWTs proposed by Spyrakos et al. [10], in Figure S1, shows a significant decrease in performance when compared with the method using the OWTs of Cordeiro [42], with a similar MAPE, but increased RMSE of 14.0 NTU, and decreased r of 0.59. Although this could also be an effect of a lower efficiency of the algorithms that were applied (for example, the algorithm by Binding et al. [55] which relies solely on Rrs(B6), which is potentially contaminated by adjacency effects), it showcases the improvements of using OWTs designed for SPM and turbidity retrievals over those using normalised Rrs.
Similarly to chl-a, we did not detect any dependency of the turbidity retrieval results on lake area or depth, as seen in Figure 7c,d (regression lines not significant at the 95% level, R2 = 0.01), demonstrating that the framework for turbidity is also robust and can also be applied to small lakes.
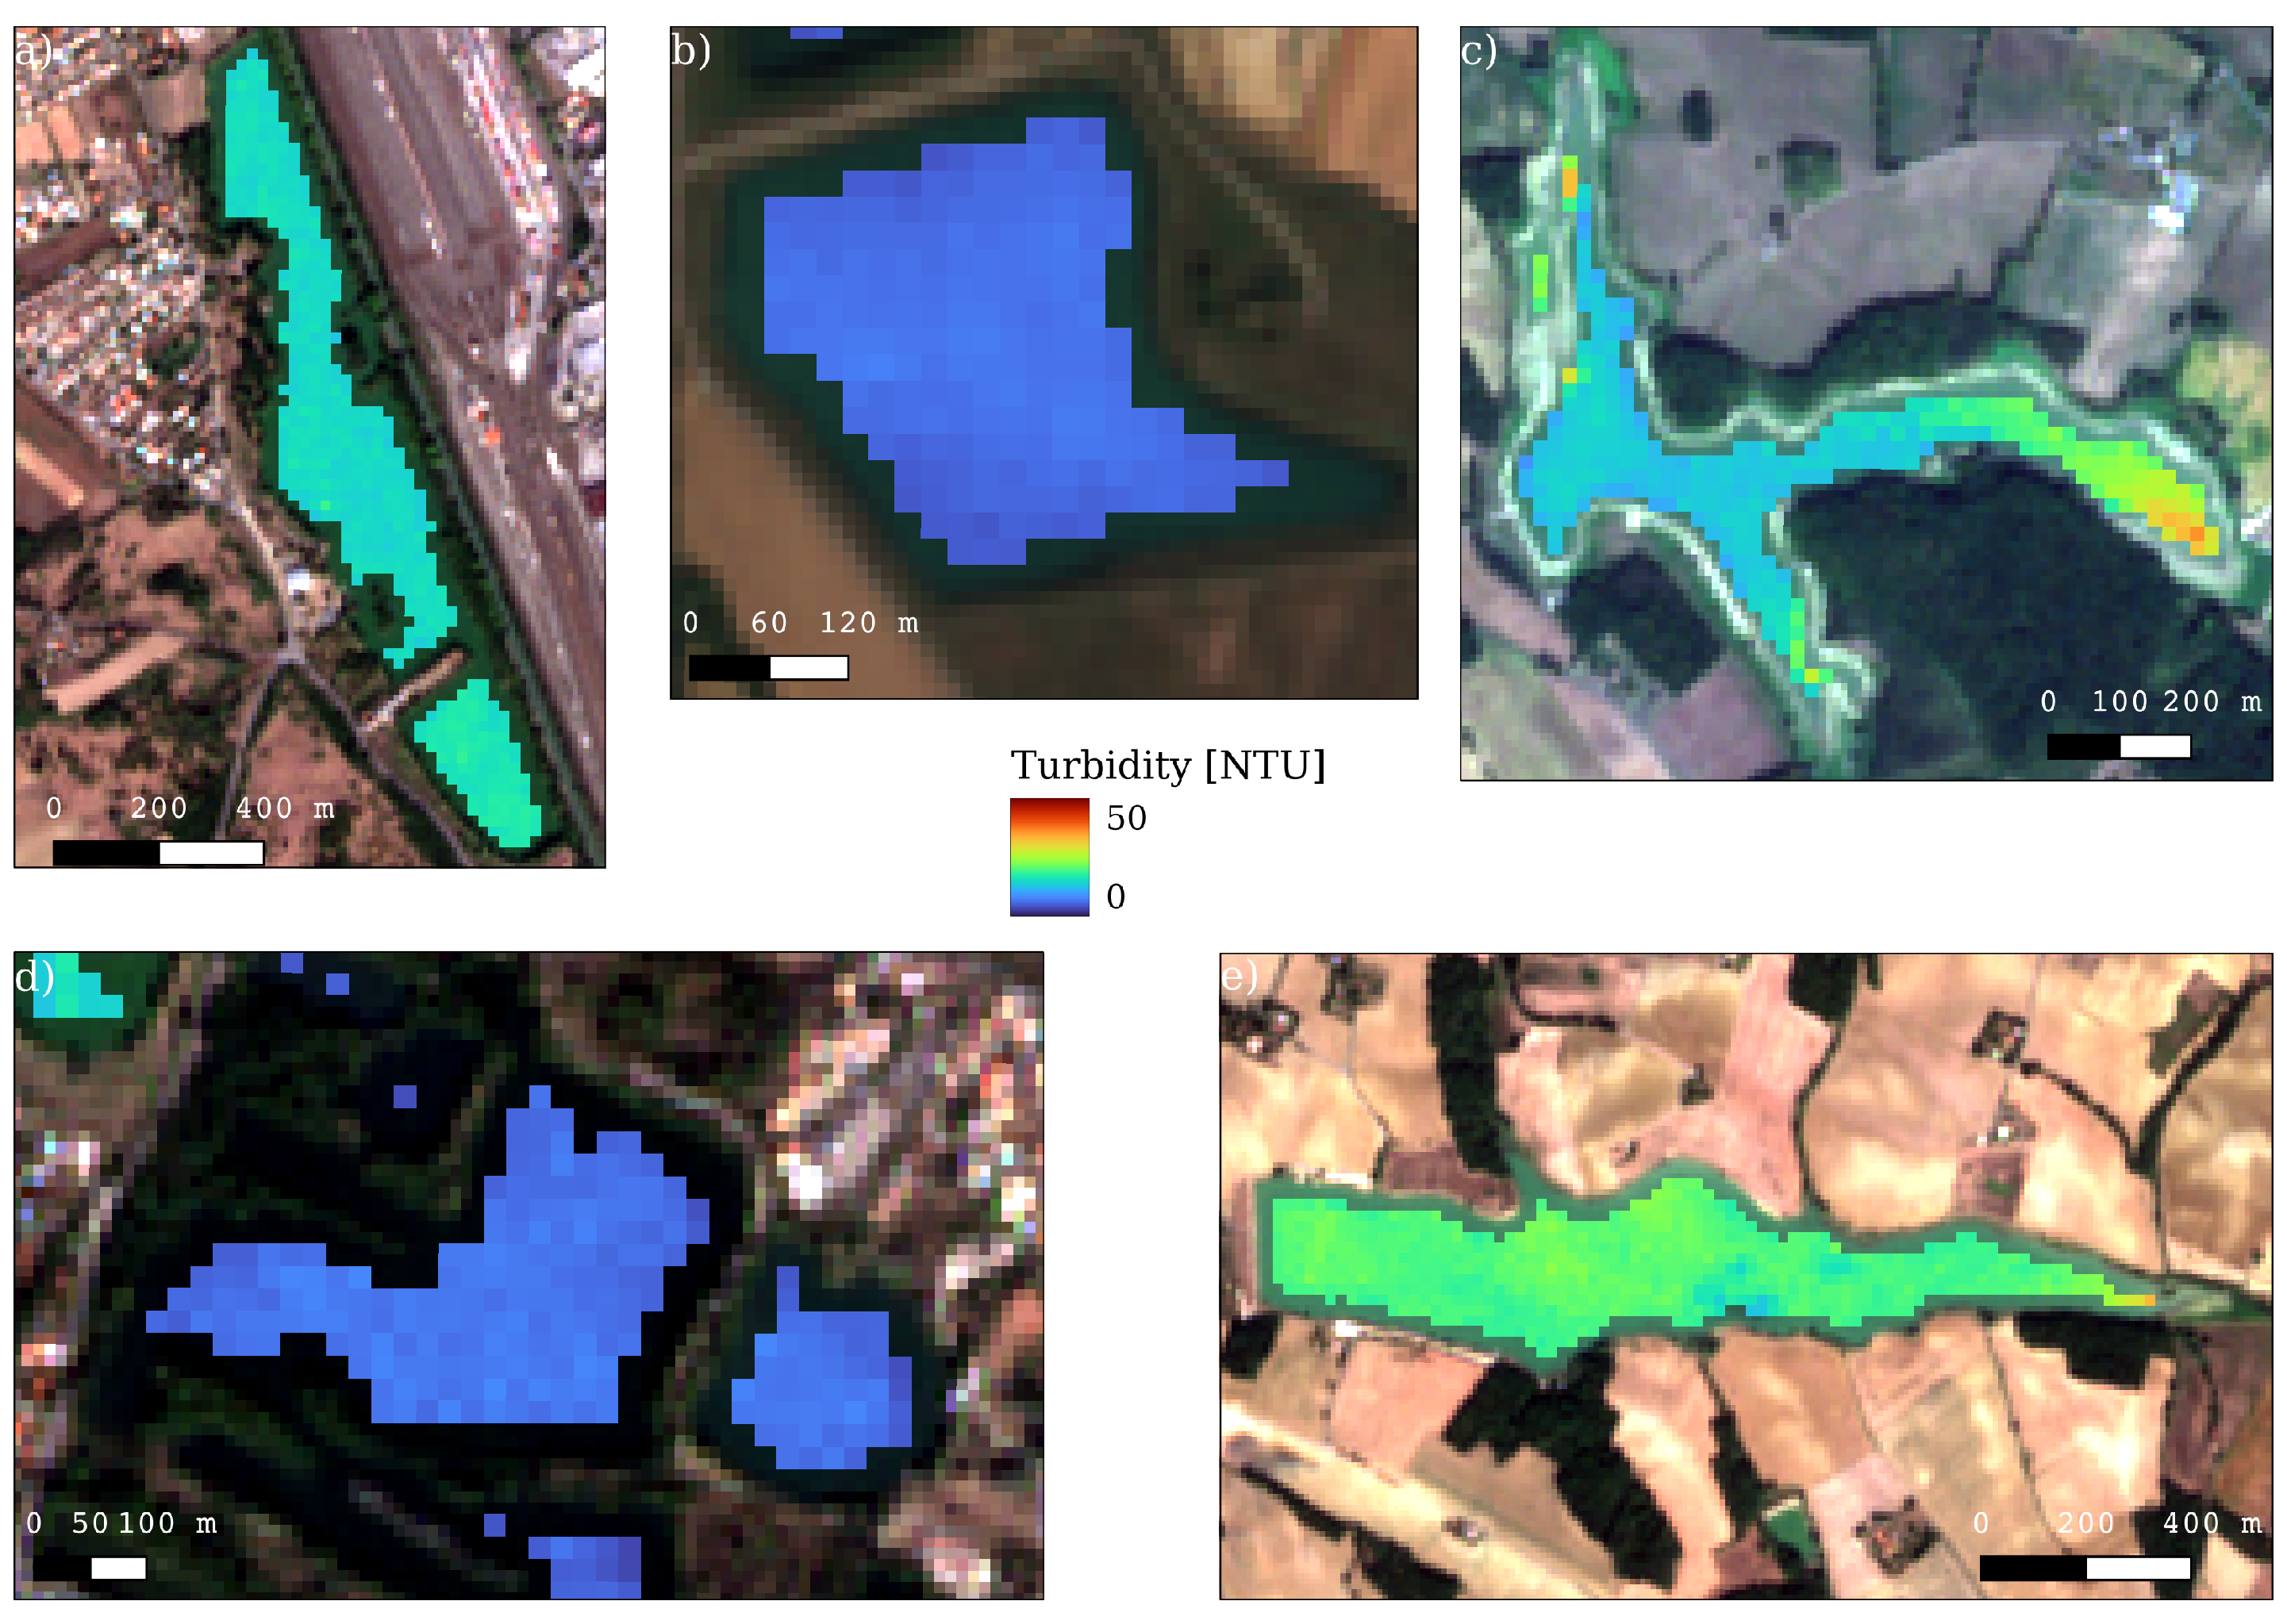
Figure 10 shows the retrieved turbidity maps over the 6 different lakes. Most lakes exhibit low values and a rather uniform turbidity distribution over the water bodies. A turbidity gradient was observed in lake Graoussettes, corresponding to the sediment inputs from the upstream river that forms the reservoir. The turbidity maps show fewer outliers, illustrating the ability of the proposed methodology to deliver spatially consistent maps, regardless of lake size and turbidity level.

3.4. Time Series of the Selected Lakes

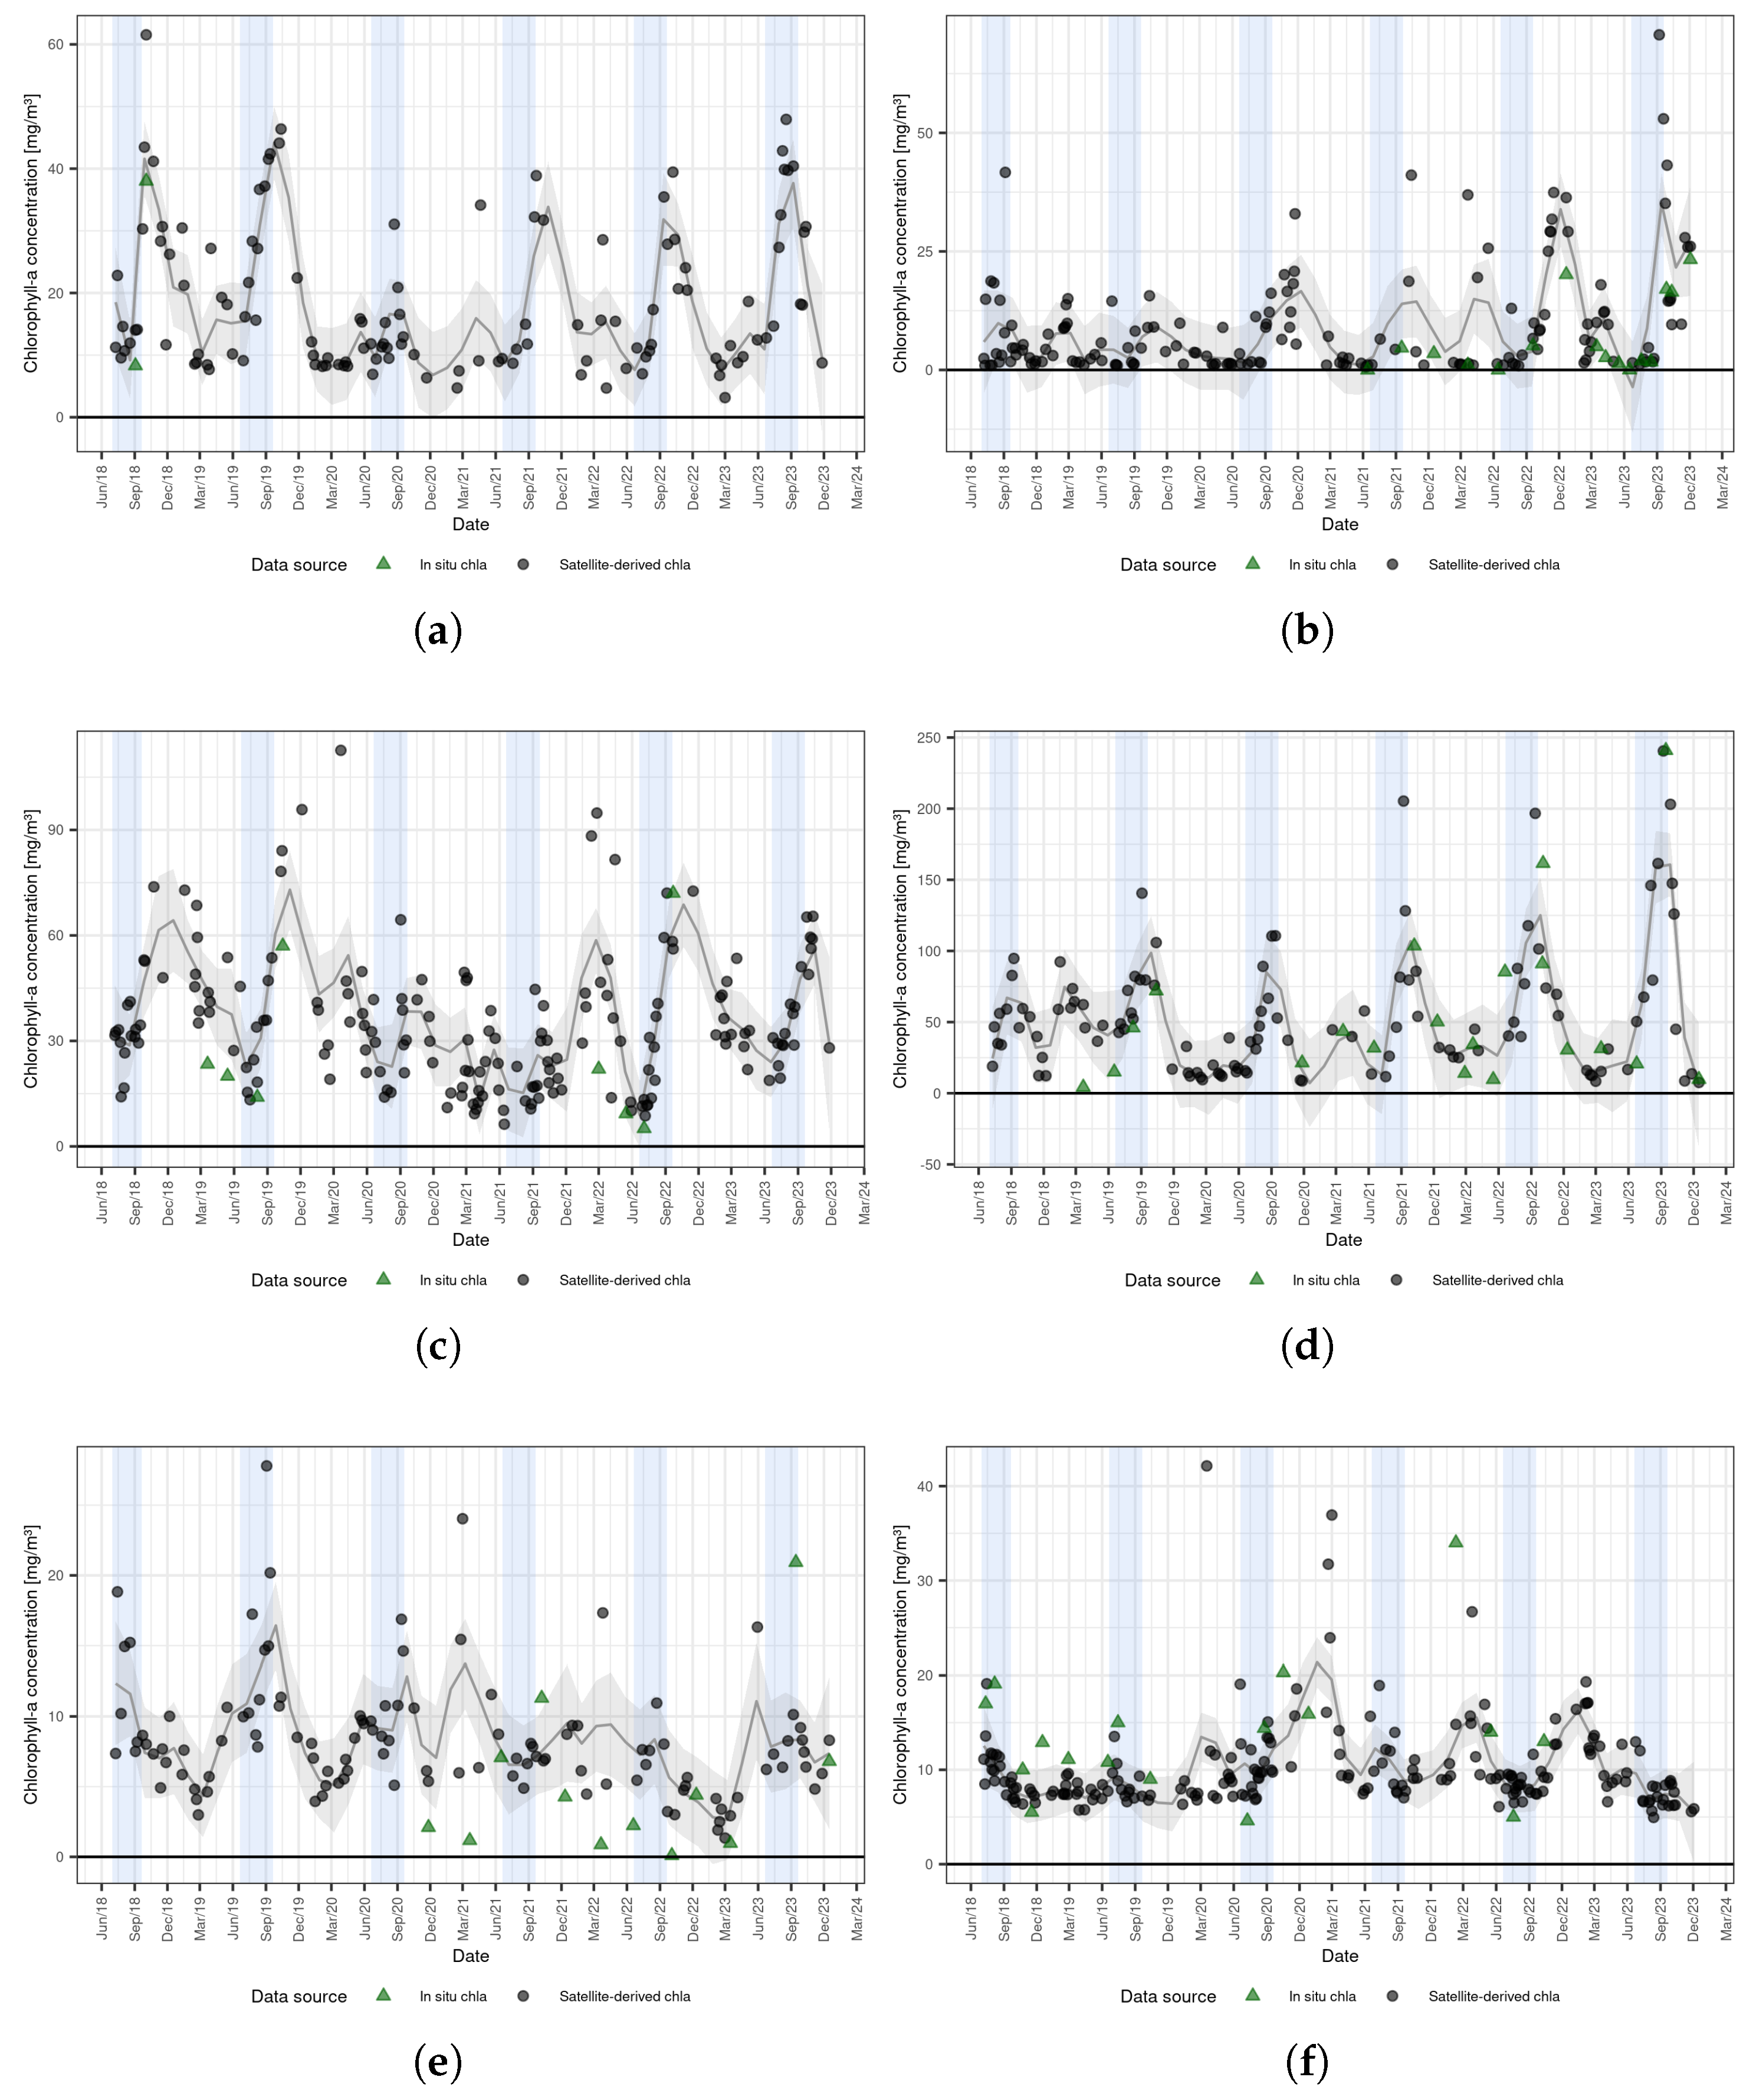
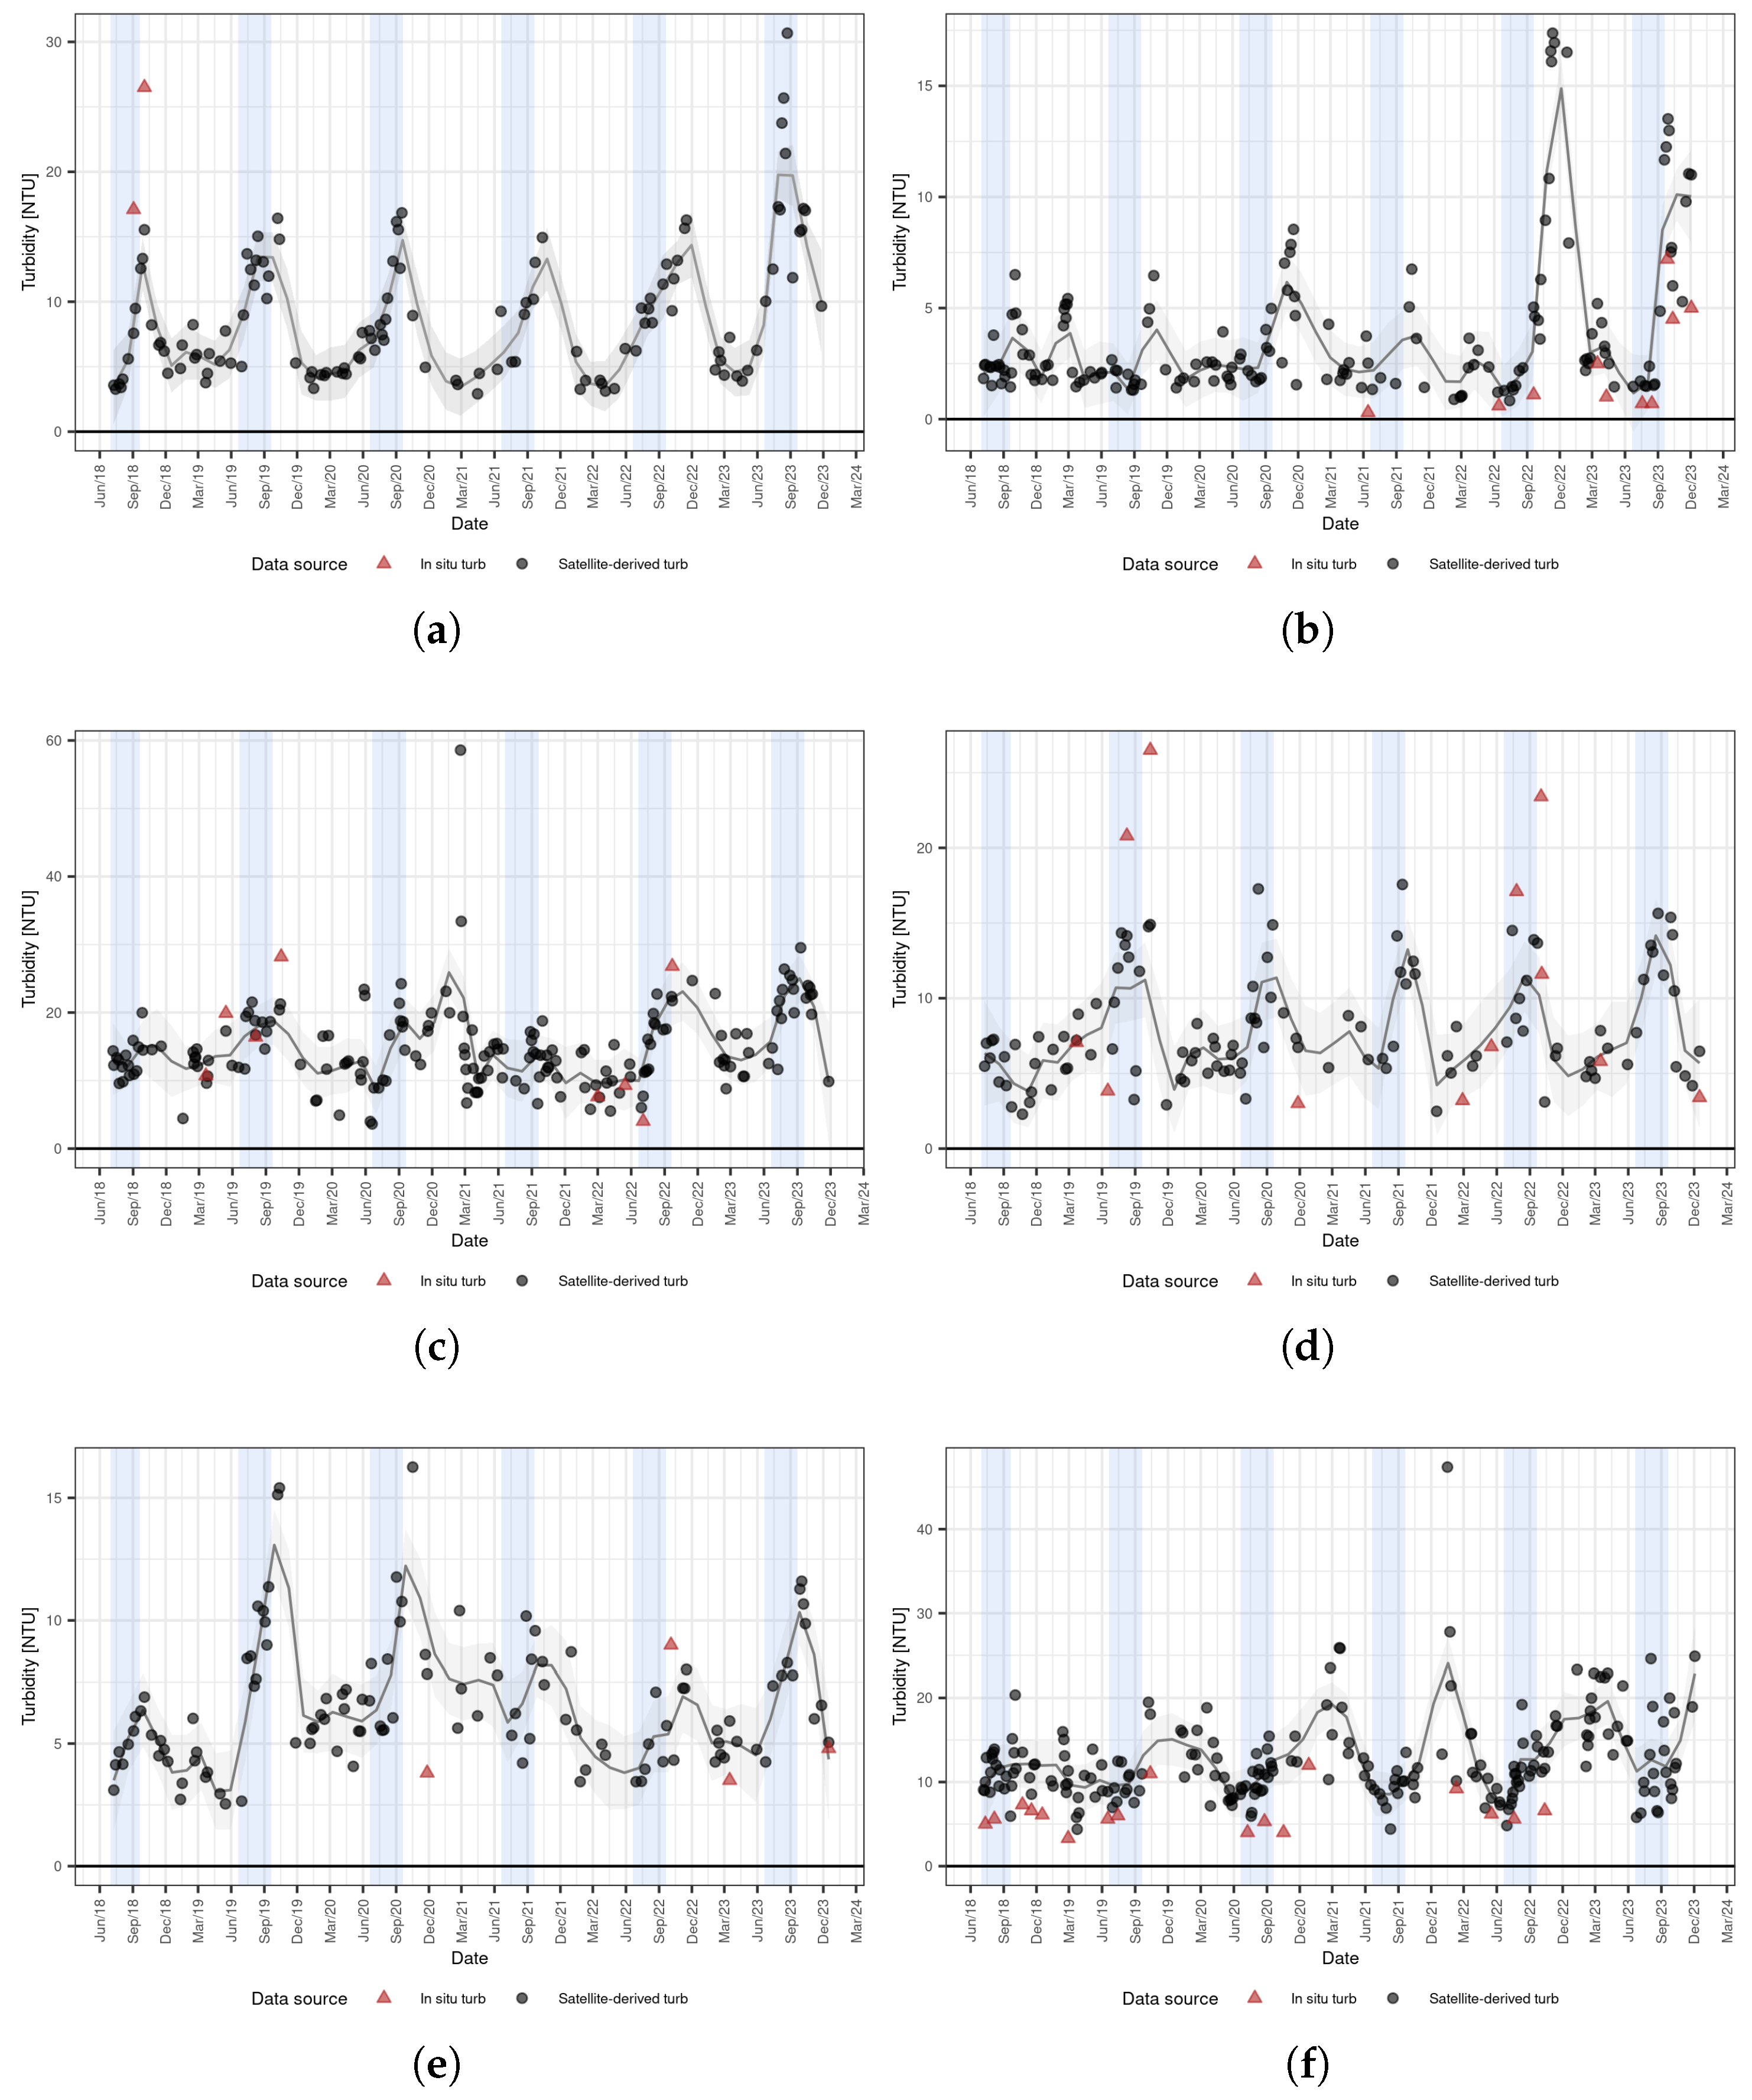
Figure 11 and Figure 12 show the time series of satellite-derived chl-a and turbidity from July 2018 to December 2023 for the six different lakes compared with the time series of the in situ measured data. The satellite-derived time series evidence the seasonal eutrophication processes, which typically begin from mid-summer to early autumn, and cease during the late autumn, with also some peaks during spring, and low chl-a concentration level during winter. The temporal dynamics of turbidity generally follow those of chl-a (especially on the gravel pit lakes where chl-a is often the sole driver of turbidity), but it can often begin earlier and less abruptly, as a result of the rains that start in May which bring particulate and dissolved material.
Most of the time series show a strong agreement with the in situ data, with the remote sensing data successfully reproducing the peaks and troughs observed in each lake; however, there is some underestimation for a few peaks, which is possibly due to time difference between field measurements and cloud-free satellite acquisitions. We also see some outliers on the series, especially in winter and early spring, which can be actual values, as a result of heat waves, for example, but can also be a result of some artefacts such as bottom effect. The time series also evidence the ability of the produced data to greatly increase the frequency of observations for the AEAG lakes, compared to conventional monitoring, highlighting how it can be applied to better understand their temporal dynamics.

4. Discussion

4.1. Satellite-Derived Remote-Sensing Reflectance

Using the field radiometric records collected for this study, we were able to assess the accuracy of Level 2A data generated using GRS. The atmospheric correction showed consistent retrieval of Rrs, especially for bands 2 to 5, which are the most commonly used in the water quality models. For band 1, the results were more scattered, but this band is known for being challenging to retrieve, offering coarser spatial resolution (60 m) and being strongly affected by Rayleigh scattering [16]. For bands 6 to 8A, a significant overestimation of satellite-derived Rrs was detected, likely caused by the adjacency effect. The validation period matched the vegetation growth season (i.e., from April to July), which surrounds most of the lakes (forest or grassland), with high albedo at the NIR spectrum. This can strongly affect NIR retrievals, even over waters with moderate sediment content [23,56]. In our case, where the waters generally have low turbidity and thus very low Rrs on the NIR spectrum, this effect was even more pronounced, particularly given the small size of the lakes and their mostly elongated shape (Figure 8 and Figure 10), which results in a short distance from land. The adjacency effect may also contribute to enhanced Rrs level in the SWIR bands. As GRS uses SWIR bands to assess glint effects, assuming that water fully absorbs radiation in this spectrum, adjacency can lead to over-correction of the glint, which in turn causes some negative Rrs observed in the visible and red-edge bands. We emphasize, nonetheless, the importance of sun glint correction in retrieving accurate Rrs and the efficiency in GRS in this task, as highlighted here and in previous studies [19,33,57].
For this matter, we found that using the OWT 1 as a proxy for detecting the adjacency effect was effective, despite this class being originally designed for algal scum and aquatic vegetation [10]. In fact, we tested other schemes for detecting it—namely the adjacency-specific classes developed by Jiang et al. [58]—to flag pixels strongly affected by this effect. Despite this, these contaminated pixels were mostly flagged as OWT 1 rather than these proposed classes, likely because these new classes were developed for the MERIS/OLCI sensors using POLYMER, another atmospheric correction processor. In our case, the filters for contaminated pixels removed about 33% of all pixels we processed (on average, 24% of pixels removed due to negative R r s ( r e d ) , 1% of pixels removed due low Rrs— R r s < 0.002 from B1 to B6, and 8% of pixels removed for being classified as OWT 1, in most cases at the borders of lakes). These filters were particularly important for processing the time series of the parameters, as they reduced errors associated with these artefacts, maintaining only the higher-quality pixels in the processing. They also removed dates when the low quality of Rrs hindered the estimation of the parameters. Regarding specifically the negative Rrs(red), we found that it is probably related to overcorrection of sun glint, when the pixel is affected by adjacency effects, and the altitude, since the changes in surface pressure are not taken into account by GRS from the input data from CAMS (Copernicus Atmosphere Monitoring Service), the atmospheric model used by GRS, and this mismatch impacted the correction due to differences in the concentration of gases and calculation of Rayleigh scattering [33]. A future version of GRS will incorporate the surface relief as input data, correcting for this mismatch and reducing the number of pixels with negative Rrs.
Nonetheless, the results show that techniques for detecting and removing adjacency effects are necessary for improving the accuracy of the results, especially for small lakes such as those found in our study. This is particularly important given how errors in Rrs can propagate into the retrievals of water quality parameters [16]. Despite demanding high processing power, techniques such as the SIMEC [59], embedded in iCOR [60], and the recently published code by Wu et al. [61] have shown potential for use with Sentinel-2 MSI, and will be tested in the future.

4.2. Validation of Satellite-Derived Parameters

Our framework demonstrated robust retrieval of the two water quality parameters, chl-a and turbidity, across small lakes with diverse optical characteristics, covering 108 lakes over an area of about 80,000 km2. We found consistency in both spatial and temporal modelling of the parameters when compared to in situ observations, validating this approach; while some studies have investigated the suitability of Sentinel-2 to retrieve water water quality parameters from small lakes individually [25], to our knowledge, this is the first successful attempt to retrieve water quality parameters from small lakes at such a large scale, confirming the capabilities of the Sentinel-2 MSI constellation for limnological applications in agricultural landscapes.
The errors in reflectance retrieval propagate into the retrieval of the parameters, but we demonstrated that the parameters were well retrieved in small lakes using GRS-derived Rrs. The use of the models with their original coefficients, or with those calibrated by Neil et al. [9] for each OWT, in the case of clear waters, increases the generalisation of the methodology, and its potential to be applied over different study areas.
The chl-a retrieval errors assessed here are similar to those found by Liu et al. [11] in their validation of the blended chl-a product (r = 0.81, nRMSE = 78%, compared to r = 0.76 and nRMSE = 99%), but using MERIS and Sentinel-3 OLCI, which offer superior radiometric and spectral resolutions in comparison to Sentinel-2 MSI, and for larger lakes, limiting the impact of adjacency effects. Regarding turbidity retrieval accuracy, very few studies have addressed large scale assessment. Relying exclusively on field radiometric data, Balasubramanian et al. [62] achieved an MAPE of 49% and a RMSLE of 0.32 when validating their machine-learning-based model for retrieving SPM, which are similar to our results obtained with satellite data (MAPE of 47%, RMSLE of 0.54). For Sentinel-2 MSI data, but using only 40 same-day match-ups Jiang et al. [53], found an MAPE of 42% and an RMSLE of 0.34; meanwhile, with a larger dataset, Condé et al. [63] obtained an RMSE of 9.5 NTU for 138 points using MODIS 250-meter mode over large lakes in Southern Brazil, an accuracy level very close to the present study assessment (RMSE of 9.7 NTU).
For chl-a, we tested multiple configurations of algorithms and OWTs, first using the algorithms employed by Liu et al. [11] and by Neil et al. [9], but these did not always produce satisfactory results. We also tested classifying the entire water body instead of performing pixel-wise estimations, since the lakes are mostly small and homogeneous. However, lake-wise processing limited the efficiency in removing contaminated pixels and did not always effectively represent the spatial variability of chl-a within the lakes. We also tested excluding B1 from the OWT classification, given its coarser resolution (60 m) and the larger uncertainty associated with atmospheric correction (e.g., Pahlevan et al. [16]). However, excluding B1 reduced the number of input channels for OWT classification, decreasing the classification accuracy, particularly for clearer waters. Even with the inclusion of B1, some misclassifications still occurred, leading to incorrect model selections and contributing to some of the outliers observed in the validation. In spite of this, we consider that, even with only 7 bands—compared to 12 in MERIS/OLCI—the classification proposed by Spyrakos et al. [10] worked well with Sentinel-2 data, and was suitable in the selection of the chl-a models.
For turbidity, the same OWT scheme used for chl-a did not produce satisfactory results. Due to light scattering by suspended solids, the amplitude of the Rrs spectra is also important, meaning that normalized Rrs are not an effective descriptor of the sediment-laden optical diversity. The OWTs proposed by Cordeiro [42] proved to be very useful for selecting the best algorithms for turbidity, although very few high concentration match-ups were found, limiting the validation of this method under such conditions. The models relies mostly on the algorithm developed by Jiang et al. [53]; however, we found that their scheme of classifying OWTs, and thus selecting the turbidity/SPM model, often resulted in very irregular spatial distribution of turbidity inside the lakes due to the small thresholds in their OWT selection scheme. With the OWT classification of Cordeiro [42], the results showed significant improvement, with the model by Zhang et al. [54] proposed for moderately turbid waters (OWT 3). It is interesting to highlight that even though these three algorithms were developed for retrieving SPM, they were consistent here for the retrievals of turbidity, but we recommend the further testing of this relationship nonetheless.
Considering the impact of Rrs assessment accuracy and of adjacency effect, we found that the latter’s influence on chl-a retrieval is not only related to its effect on the Rrs values used as inputs for the retrieval models, but also altering the spectral shape of the water, eventually leading to incorrect OWT classification and wrong model enforcement, as observed for example in lake Cabane. For turbidity, the impact of adjacency is the possible over-correction of the sun glint, caused by an enhanced Rrs level at SWIR bands, leading to lower Rrs in the visible and red-edge bands. This affects the performance of the models and the OWT classification, which is dependent on the amplitude of the signal, evidenced, for example, by the largest outlier found in the validation (Figure 9), where a data point of nearly 100 NTU was classified as OWT 1. Furthermore, due to the size of lakes, and particularly due to the elongate shape of the reservoirs, which compose the majority of the lakes in our dataset, we observed that the intensity of this effect did not vary as a function of distance to the margins, but rather had an homogeneous effect over the lakes that is dependant mostly on seasonality (due to vegetation) and atmospheric conditions [61]. This is reflected in the absence of relationship between lake area and the errors in the estimations of both parameters.

4.3. Perspectives and Limitations

Our study showed the feasibility of estimating chl-a and turbidity in lakes as small as 3 ha on large scale using Sentinel-2 MSI imagery. In the context of global lake indicator databases, the ESA CCI has already produced a worldwide database of chl-a and turbidity using MERIS, MODIS, and Sentinel-3 OLCI data [13]. However, due to spatial resolution limitations, this database is restricted to 2000 large lakes. In contrast, our study proposed an adapted methodology for the Sentinel-2 constellation of satellite focused on small lakes, which are often overlooked in monitoring programs. Despite its different spatial and temporal resolutions, inferior spectral and radiometric resolutions, and different algorithm of atmospheric correction, when compared to the ESA CCI product, we showed that it can produce robust time series of these parameters for over 3000 small lakes in Southwest France, showing the potential of this approach to be used in large scale assessments. In addition, we found that, for turbidity, the OWT classes proposed by Spyrakos et al. [10] are incompatible with this parameter, as it depends not only on the spectral shape of Rrs but also on the amplitude, and that using the classes developed by Cordeiro et al. [24] specifically for SPM and turbidity greatly improved the estimations.
However, we identified limitations in our study. First, the impact of adjacency effect on the NIR spectrum, as discussed above. Second, the removal of pixels classified as OWT 1 (i.e., vegetation-like Rrs) from the processing as a measure to identify and remove the pixels strongly affected by adjacency, which in our validation efforts was never a result of an algae bloom, but we understand that removing this class can limit the identification of strong algae bloom events with formation of scum (for example in strongly anthropised reservoirs). However, here, this option had a significant impact filtering these heavily impacted pixels and increasing the consistency of the results, as the tests with the OWTs designed for this purpose [58] did not work well with Sentinel-2 imagery, and because no scum-forming algae blooms were detected in our study. Third, the implementation of a OWT 0 for chl-a for low Rrs pixels, resulting from the difficulty in correctly classifying the OWT of these lakes as a result of the normalisation of the Rrs, which otherwise resulted in artificial intra-lake spatial differences resulting from different algorithms being applied for similar conditions (since small variations in Rrs resulted in different OWT classes and often different algorithms being applied). This OWT 0 class insured a more consistent spatial reconstruction of chl-a, but we understand that a specific model needs to be developed in such cases, as this type of lake is challenging to model due to its low-water signal [34,64]. Furthermore, lastly, the use of algorithms designed for SPM for retrieving turbidity, which did not hinder their application (given the results here and in [13]), but that might not be the case in other areas; therefore, further testing is recommended.
Research on water quality with Sentinel-2 MSI has focused on validating atmospheric correction [15,16] and water quality algorithms [17], with some studies on the propagation of these errors onto water quality estimation [18,19]. However, few studies have focused on small water bodies (e.g., [21]). Our study validated an approach for two watersheds in Southern France, which can provide a dataset for over 3000 lakes (larger than 3 ha), to be used for understanding processes affecting the water quality of these understudied water bodies [65], for example, providing a broader view of the outcomes of the efforts of the European Water Framework Directive to restore the water quality in France [6], and the impacts of extreme events like droughts, which are common in the Southern Europe [66]. Future work will further validate our framework (with both Rrs and the water quality parameters) in smaller lakes (∼1 ha) and in other regions, such as in tropical and subtropical areas, where we expect, for instance, variability in the performance of the atmospheric correction method due to variability in the concentration of gases and aerosols, and of the chl-a algorithms due to increased light availability and chl-a concentrations, and the packaging effect [67]. We also recommend further studies to validate Rrs retrievals from satellite imagery over lakes with diverse areas and shapes and possibly in rivers, where remote sensing retrievals are even more challenging. We also recommend, when possible, that samplings are conducted over transects, to evaluate how distance to land impacts the adjacency effect and to assess its impacts on the retrieval of parameters. Future research should also investigate the synergy of Sentinel-2 with the new generation of cubesats that have potential for water quality retrievals, such as SuperDove [25].

5. Conclusions

This study is the first to use remote sensing data to accurately retrieve water quality parameters from small lakes (<1000 ha) at a regional scale using Sentinel-2 MSI data. This constellation of satellites provides robust imagery, with adequate resolutions for mapping long-term water quality from water bodies as small as 3 ha. To achieve this, we employed a framework for generating per-pixel chlorophyll-a concentration and turbidity maps, combining two different sets of OWTs and different algorithms for each parameter. We validated the methods with a large dataset of small lakes in Southern France, demonstrating the robustness of the framework.
The Rrs retrieved using GRS, correcting for both atmospheric and sun glint effects, was found to be consistent in our case studies. However, we observed artefacts caused by adjacent land, particularly a strong signal in the NIR spectrum; while this did not hinder the retrieval of parameters due to the filters employed to detect contaminated pixels, correcting for this effect remains a priority for improving product quality. Therefore, we recommend future studies focused on further understanding and correcting for this effect in small lakes to enhance Rrs retrievals, as well as additional validation of the framework used in our study.
The methods validated here can be applied to retrieve time series of chl-a and turbidity starting from 2016, with a frequency of up to 5 days, largely expanding the database collected by water agencies that follow the European Union Water Framework Directive of seasonal monitoring of water bodies. In the future, the time series produced from this work will be made available via the French Centre for Space Studies (Centre National d’Études Spatiales—CNES) platform, Hydroweb.next (https://hydroweb.next.theia-land.fr, accessed on 2 August 2025). This dataset will be useful for studying the dynamics of these small freshwater ecosystems, which are often overlooked in limnological studies.

Supplementary Materials

The following supporting information can be downloaded at: https://www.mdpi.com/article/10.3390/rs17152729/s1, Table S1: Coefficients of the OC2 algorithm for the different OWTs; Figure S1: Comparison of the modelled and measured turbidity values by the normalised OWT. Field measurements originate from the AEAG dataset (n = 502), the gravel pit lakes (n = 59) and the lakes sampled for this work (n = 50) over the 2018–2024 period; Table S2: Metrics of validation of chl-a for the different temporal window sizes; Table S3: Metrics of validation of turbidity for the different temporal window sizes. References [9,10,13,43,44,48,49,50,51,52,53,54,55,63,68,69,70,71,72,73,74,75,76,77,78] are cited in the supplementary materials.

Author Contributions

Conceptualization, J.-M.M.; methodology, M.H.T. and J.-M.M.; software, M.H.T., D.G., and J.R.; validation, M.H.T., V.B., and J.-M.M.; formal analysis, M.H.T. and J.-M.M.; investigation, M.H.T. and J.-M.M.; resources, J.C., S.B., and J.-M.M.; data curation, M.H.T., D.G., J.R., V.B., J.C., S.B., and J.-M.M.; writing—original draft preparation, M.H.T.; writing—review and editing, D.G., J.R., V.B., J.C., S.B., and J.-M.M.; visualization, M.H.T. and J.-M.M.; supervision, J.C. and J.-M.M.; project administration, J.C. and J.-M.M.; funding acquisition, J.C. and J.-M.M. All authors have read and agreed to the published version of the manuscript.

Funding

This work was developed under the scope of the XTREM-QUALITY project (https://www.spaceclimateobservatory.org/xtremquality, accessed on 2 August 2025), funded by the Adour Garonne Water Agency (Funding 2022-01027) and co-funded by the French Centre for Space Studies. The work on the gravel pit lakes was supported by the project STABLELAKE funded by the Office Français de la Biodiversité (OFB) and is part of the long-term Studies in Ecology and Evolution(SEE-Life) program of the CNRS.

Data Availability Statement

Water quality data from the Adour–Garonne Water Agency are freely available at https://adour-garonne.eaufrance.fr/catalogue/ (accessed on 2 August 2025). Water quality data from the gravel pit lakes are available on request. The original in situ data presented in this study are available on request from the corresponding author, while the water quality data processed for the Garonne river basin are are expected to be freely available in the future at https://oad-magellium.com/xtremquality (accessed on 2 August 2025).

Acknowledgments

We would like to thank CNES for their support and for providing the MAJA dataset, Tristan Harmel for their assistance with the use of GRS, and the agents of the AEAG Thibault Feret, Amélie Cossais et Jean-Pierre Rebillard for their support with the database and field work.

Conflicts of Interest

The authors declare no conflicts of interest.

References

  1. Williamson, C.E.; Dodds, W.; Kratz, T.K.; Palmer, M.E. Lakes and streams as sentinels of environmental change in terrestrial and atmospheric processes. Front. Ecol. Environ. 2008, 6, 247–254. [Google Scholar]
  2. Adrian, R.; O’Reilly, C.M.; Zagarese, H.; Baines, S.B.; Hessen, D.O.; Keller, W.; Livingstone, D.M.; Sommaruga, R.; Straile, D.; Donk, E.V.; et al. Lakes as sentinels of climate change. Lymnology Oceanogr. 2009, 54, 2283–2297. [Google Scholar]
  3. Downing, J.A. Emerging global role of small lakes and ponds: Little things mean a lot. Limnetica 2010, 29, 9–24. [Google Scholar]
  4. Biggs, J.; Von Fumetti, S.; Kelly-Quinn, M. The importance of small waterbodies for biodiversity and ecosystem services: Implications for policy makers. Hydrobiologia 2017, 793, 3–39. [Google Scholar] [CrossRef]
  5. Jones, J.R.; Pope-Cole, K.; Obrecht, D.V.; Harlan, J.; Knoll, L.B.; Downing, J.A. Carbon and nutrient sequestration in small impoundments: A regional study with global implications. Inland Waters 2023, 13, 374–387. [Google Scholar] [CrossRef]
  6. EEA Report. European waters—Assessment of Status and Pressures 2018. 2018. Available online: https://www.eea.europa.eu/publications/state-of-water (accessed on 5 August 2025).
  7. Dörnhöfer, K.; Oppelt, N. Remote sensing for lake research and monitoring–Recent advances. Ecol. Indic. 2016, 64, 105–122. [Google Scholar] [CrossRef]
  8. Mouw, C.B.; Greb, S.; Aurin, D.; DiGiacomo, P.M.; Lee, Z.; Twardowski, M.; Binding, C.; Hu, C.; Ma, R.; Moore, T.; et al. Aquatic color radiometry remote sensing of coastal and inland waters: Challenges and recommendations for future satellite missions. Remote Sens. Environ. 2015, 160, 15–30. [Google Scholar]
  9. Neil, C.; Spyrakos, E.; Hunter, P.D.; Tyler, A.N. A global approach for chlorophyll-a retrieval across optically complex inland waters based on optical water types. Remote Sens. Environ. 2019, 229, 159–178. [Google Scholar] [CrossRef]
  10. Spyrakos, E.; O’Donnell, R.; Hunter, P.D.; Miller, C.; Scott, M.; Simis, S.G.; Neil, C.; Barbosa, C.C.; Binding, C.E.; Bradt, S.; et al. Optical types of inland and coastal waters. Limnol. Oceanogr. 2018, 63, 846–870. [Google Scholar] [CrossRef]
  11. Liu, X.; Steele, C.; Simis, S.; Warren, M.; Tyler, A.; Spyrakos, E.; Selmes, N.; Hunter, P. Retrieval of Chlorophyll-a concentration and associated product uncertainty in optically diverse lakes and reservoirs. Remote Sens. Environ. 2021, 267, 112710. [Google Scholar] [CrossRef]
  12. Wang, S.; Li, J.; Zhang, W.; Cao, C.; Zhang, F.; Shen, Q.; Zhang, X.; Zhang, B. A dataset of remote-sensed Forel-Ule Index for global inland waters during 2000–2018. Sci. Data 2021, 8, 26. [Google Scholar] [CrossRef]
  13. Carrea, L.; Crétaux, J.F.; Liu, X.; Wu, Y.; Calmettes, B.; Duguay, C.R.; Merchant, C.J.; Selmes, N.; Simis, S.G.; Warren, M.; et al. Satellite-derived multivariate world-wide lake physical variable timeseries for climate studies. Sci. Data 2023, 10, 30. [Google Scholar] [CrossRef]
  14. Bonnier, M.; Anneville, O.; Woolway, R.I.; Thackeray, S.J.; Morin, G.P.; Reynaud, N.; Soulignac, F.; Tormos, T.; Harmel, T. Assessing ESA Climate Change Initiative data for the monitoring of phytoplankton abundance and phenology in deep lakes: Investigation on Lake Geneva. J. Great Lakes Res. 2024, 50, 102372. [Google Scholar] [CrossRef]
  15. Pereira-Sandoval, M.; Ruescas, A.; Urrego, P.; Ruiz-Verdú, A.; Delegido, J.; Tenjo, C.; Soria-Perpinyà, X.; Vicente, E.; Soria, J.; Moreno, J. Evaluation of atmospheric correction algorithms over Spanish inland waters for Sentinel-2 Multi Spectral Imagery data. Remote Sens. 2019, 11, 1469. [Google Scholar] [CrossRef]
  16. Pahlevan, N.; Mangin, A.; Balasubramanian, S.V.; Smith, B.; Alikas, K.; Arai, K.; Barbosa, C.; Bélanger, S.; Binding, C.; Bresciani, M.; et al. ACIX-Aqua: A global assessment of atmospheric correction methods for Landsat-8 and Sentinel-2 over lakes, rivers, and coastal waters. Remote Sens. Environ. 2021, 258, 112366. [Google Scholar] [CrossRef]
  17. Ansper, A.; Alikas, K. Retrieval of chlorophyll a from Sentinel-2 MSI data for the European Union water framework directive reporting purposes. Remote Sens. 2019, 11, 64. [Google Scholar] [CrossRef]
  18. Warren, M.A.; Simis, S.G.; Martinez-Vicente, V.; Poser, K.; Bresciani, M.; Alikas, K.; Spyrakos, E.; Giardino, C.; Ansper, A. Assessment of atmospheric correction algorithms for the Sentinel-2A MultiSpectral Imager over coastal and inland waters. Remote Sens. Environ. 2019, 225, 267–289. [Google Scholar] [CrossRef]
  19. Tavares, M.H.; Lins, R.C.; Harmel, T.; Fragoso Jr, C.R.; Martinez, J.M.; Motta-Marques, D. Atmospheric and sunglint correction for retrieving chlorophyll-a in a productive tropical estuarine-lagoon system using Sentinel-2 MSI imagery. ISPRS J. Photogramm. Remote Sens. 2021, 174, 215–236. [Google Scholar] [CrossRef]
  20. Alves e Santos, D.R.; Martinez, J.M.; Olivetti, D.; Zumak, A.; Guimarães, D.; Aniceto, K.; Severo, E.; Ferreira, O.; Harmel, T.; Cordeiro, M.; et al. Sentinel-2 MSI image time series reveal hydrological and geomorphological control of the sedimentation processes in an Amazonian hydropower dam. Int. J. Appl. Earth Obs. Geoinf. 2024, 128, 103786. [Google Scholar] [CrossRef]
  21. Diehl, R.M.; Underwood, K.L.; Watt, R.; Hamshaw, S.D.; Pahlevan, N. Evaluating opportunities for broad-scale remote sensing of total suspended solids on small rivers. Remote Sens. Appl. Soc. Environ. 2024, 35, 101234. [Google Scholar] [CrossRef]
  22. Moses, W.J.; Sterckx, S.; Montes, M.J.; De Keukelaere, L.; Knaeps, E. Atmospheric correction for inland waters. In Bio-optical Modeling and Remote Sensing of Inland Waters; Mishra, D.R., Ogashawara, I., Gitelson, A.A., Eds.; Elsevier: Amsterdam, The Netherlands, 2017; pp. 69–100. [Google Scholar] [CrossRef]
  23. Bulgarelli, B.; Zibordi, G. On the detectability of adjacency effects in ocean color remote sensing of mid-latitude coastal environments by SeaWiFS, MODIS-A, MERIS, OLCI, OLI and MSI. Remote Sens. Environ. 2018, 209, 423–438. [Google Scholar] [CrossRef]
  24. Cordeiro, M.C.; Martinez, J.M.; Peña-Luque, S. Automatic water detection from multidimensional hierarchical clustering for Sentinel-2 images and a comparison with Level 2A processors. Remote Sens. Environ. 2021, 253, 112209. [Google Scholar] [CrossRef]
  25. Atton Beckmann, D.; Spyrakos, E.; Hunter, P.; Jones, I.D. Widespread phytoplankton monitoring in small lakes: A case study comparing satellite imagery from planet SuperDoves and ESA Sentinel-2. Front. Remote Sens. 2025, 6, 1549119. [Google Scholar] [CrossRef]
  26. Laplace-Treyture, C.; Barbe, J.; Dutartre, A.; Druart, J.; Rimet, F.; Anneville, O. Protocole Standardisé D’échantillonnage, de Conservation, D’observation et de Dénombrement du Phytoplancton en Plan D’eau Pour la Mise en Oeuvre de la DCE: Version 3.3.1; Cemagref: Bordeaux, France, 2009; 44p. [Google Scholar]
  27. NF T 90-117. Qualité de L’eau, Dosage de la Chlorophylle a et D’un Indice Phéopigments; AFNOR: Paris, France, 1999; 11p. [Google Scholar]
  28. Arar, E. Method 446.0—In vitro Determination of Chlorophylls a, b, c1 + c2 and Pheopigments in Marine and Freshwater Algae by Visible Spectrophotometry, Revision 1.2; National Exposure Research Laboratory, Office of Research and Development U.S.EPA: Cincinnati, OH, USA, 1997; 26p. [Google Scholar]
  29. ISO 7027; Water Quality. Determination of Turbidity. International Standards Organization: Geneva, Switzerland, 1990.
  30. Garcia, F.; Paz-Vinas, I.; Gaujard, A.; Olden, J.D.; Cucherousset, J. Multiple lines and levels of evidence for avian zoochory promoting fish colonization of artificial lakes. Biol. Lett. 2023, 19, 20220533. [Google Scholar] [CrossRef]
  31. Colas, F.; Baudoin, J.M.; Bonin, P.; Cabrol, L.; Daufresne, M.; Lassus, R.; Cucherousset, J. Ecosystem maturity modulates greenhouse gases fluxes from artificial lakes. Sci. Total Environ. 2021, 760, 144046. [Google Scholar] [CrossRef]
  32. Mobley, C.D. Estimation of the remote-sensing reflectance from above-surface measurements. Appl. Opt. 1999, 38, 7442–7455. [Google Scholar] [CrossRef]
  33. Harmel, T.; Chami, M.; Tormos, T.; Reynaud, N.; Danis, P.A. Sunglint correction of the Multi-Spectral Instrument (MSI)-SENTINEL-2 imagery over inland and sea waters from SWIR bands. Remote Sens. Environ. 2018, 204, 308–321. [Google Scholar] [CrossRef]
  34. Marinho, R.R.; Harmel, T.; Martinez, J.M.; Filizola Junior, N.P. Spatiotemporal dynamics of suspended sediments in the Negro River, Amazon Basin, from in situ and Sentinel-2 remote sensing data. ISPRS Int. J. Geo-Inf. 2021, 10, 86. [Google Scholar] [CrossRef]
  35. Rahman, H.; Dedieu, G. SMAC: A simplified method for the atmospheric correction of satellite measurements in the solar spectrum. Int. J. Remote Sens. 1994, 15, 123–143. [Google Scholar] [CrossRef]
  36. Chami, M.; Lafrance, B.; Fougnie, B.; Chowdhary, J.; Harmel, T.; Waquet, F. OSOAA: A vector radiative transfer model of coupled atmosphere-ocean system for a rough sea surface application to the estimates of the directional variations of the water leaving reflectance to better process multi-angular satellite sensors data over the ocean. Opt. Express 2015, 23, 27829–27852. [Google Scholar] [CrossRef]
  37. Peña-Luque, S.; Ferrant, S.; Cordeiro, M.C.; Ledauphin, T.; Maxant, J.; Martinez, J.M. Sentinel-1&2 multitemporal water surface detection accuracies, evaluated at regional and reservoirs level. Remote Sens. 2021, 13, 3279. [Google Scholar] [CrossRef]
  38. Hagolle, O.; Huc, M.; Villa Pascual, D.; Dedieu, G. A multi-temporal and multi-spectral method to estimate aerosol pptical thickness over land, for the atmospheric correction of FormoSat-2, LandSat, VENμS and Sentinel-2 images. Remote Sens. 2015, 7, 2668–2691. [Google Scholar] [CrossRef]
  39. Skakun, S.; Wevers, J.; Brockmann, C.; Doxani, G.; Aleksandrov, M.; Batič, M.; Frantz, D.; Gascon, F.; Gómez-Chova, L.; Hagolle, O.; et al. Cloud Mask Intercomparison eXercise (CMIX): An evaluation of cloud masking algorithms for Landsat 8 and Sentinel-2. Remote Sens. Environ. 2022, 274, 112990. [Google Scholar] [CrossRef]
  40. Guimarães, D.; Tavares, M.H. GET-Pak, 2024. Available online: https://doi.org/10.5281/zenodo.10782669 (accessed on 2 August 2025).
  41. Moore, T.S.; Campbell, J.W.; Feng, H. A fuzzy logic classification scheme for selecting and blending satellite ocean color algorithms. IEEE Trans. Geosci. Remote Sens. 2001, 39, 1764–1776. [Google Scholar] [CrossRef]
  42. Cordeiro, M.C.R. Optical water type classification for suspended particulate matter retrieval over inland tropical waters. In Use of Data Science Tools for Assessing Inland Water Surface and Quality on Regional Scales Through High-Resolution Sentinel-2 Remote Sensing Images. Ph.D. Thesis, Université Paul Sabatier-Toulouse III, Toulouse, France, 2022; pp. 94–142. [Google Scholar]
  43. Nechad, B.; Ruddick, K.G.; Park, Y. Calibration and validation of a generic multisensor algorithm for mapping of total suspended matter in turbid waters. Remote Sens. Environ. 2010, 114, 854–866. [Google Scholar] [CrossRef]
  44. Dogliotti, A.I.; Ruddick, K.; Nechad, B.; Doxaran, D.; Knaeps, E. A single algorithm to retrieve turbidity from remotely-sensed data in all coastal and estuarine waters. Remote Sens. Environ. 2015, 156, 157–168. [Google Scholar] [CrossRef]
  45. Schröder, T.; Schmidt, S.I.; Kutzner, R.D.; Bernert, H.; Stelzer, K.; Friese, K.; Rinke, K. Exploring spatial aggregations and temporal windows for water quality match-up analysis using Sentinel-2 MSI and Sentinel-3 OLCI Data. Remote Sens. 2024, 16, 2798. [Google Scholar] [CrossRef]
  46. Verpoorter, C.; Kutser, T.; Tranvik, L. Automated mapping of water bodies using Landsat multispectral data. Limnol. Oceanogr. Methods 2012, 10, 1037–1050. [Google Scholar] [CrossRef]
  47. Verpoorter, C.; Kutser, T.; Seekell, D.A.; Tranvik, L.J. A global inventory of lakes based on high-resolution satellite imagery. Geophys. Res. Lett. 2014, 41, 6396–6402. [Google Scholar] [CrossRef]
  48. O’Reilly, J.E.; Maritorena, S.; O’Brien, M.; Siegel, D.; Toole, D.; Menzies, D.; Smith, R.; Mueller, J.; Mitchell, B.G.; Kahru, M.; et al. SeaWiFS postlaunch calibration and validation analyses, part 3. NASA Tech. Memo 2000, 206892, 3–8. [Google Scholar]
  49. Gons, H.J.; Rijkeboer, M.; Ruddick, K.G. Effect of a waveband shift on chlorophyll retrieval from MERIS imagery of inland and coastal waters. J. Plankton Res. 2005, 27, 125–127. [Google Scholar] [CrossRef]
  50. Mishra, S.; Mishra, D.R. Normalized difference chlorophyll index: A novel model for remote estimation of chlorophyll-a concentration in turbid productive waters. Remote Sens. Environ. 2012, 117, 394–406. [Google Scholar] [CrossRef]
  51. Gilerson, A.A.; Gitelson, A.A.; Zhou, J.; Gurlin, D.; Moses, W.; Ioannou, I.; Ahmed, S.A. Algorithms for remote estimation of chlorophyll-a in coastal and inland waters using red and near infrared bands. Opt. Express 2010, 18, 24109–24125. [Google Scholar] [CrossRef]
  52. Jiang, D.; Matsushita, B.; Pahlevan, N.; Gurlin, D.; Lehmann, M.K.; Fichot, C.G.; Schalles, J.; Loisel, H.; Binding, C.; Zhang, Y.; et al. Remotely estimating total suspended solids concentration in clear to extremely turbid waters using a novel semi-analytical method. Remote Sens. Environ. 2021, 258, 112386. [Google Scholar] [CrossRef]
  53. Jiang, D.; Matsushita, B.; Pahlevan, N.; Gurlin, D.; Fichot, C.G.; Harringmeyer, J.; Sent, G.; Brito, A.C.; Brotas, V.; Werther, M.; et al. Estimating the concentration of total suspended solids in inland and coastal waters from Sentinel-2 MSI: A semi-analytical approach. ISPRS J. Photogramm. Remote Sens. 2023, 204, 362–377. [Google Scholar] [CrossRef]
  54. Zhang, Y.; Shi, K.; Liu, X.; Zhou, Y.; Qin, B. Lake topography and wind waves determining seasonal-spatial dynamics of total suspended matter in turbid Lake Taihu, China: Assessment using long-term high-resolution MERIS data. PLoS ONE 2014, 9, e98055. [Google Scholar] [CrossRef]
  55. Binding, C.; Jerome, J.; Bukata, R.; Booty, W. Suspended particulate matter in Lake Erie derived from MODIS aquatic colour imagery. Int. J. Remote Sens. 2010, 31, 5239–5255. [Google Scholar] [CrossRef]
  56. Martins, V.; Barbosa, C.; Carvalho, L.; Jorge, D.; Lobo, F.; Novo, E. Assessment of atmospheric correction methods for Sentinel-2 MSI images applied to Amazon floodplain lakes. Remote Sens. 2017, 9, 322. [Google Scholar] [CrossRef]
  57. Vanhellemont, Q. Adaptation of the dark spectrum fitting atmospheric correction for aquatic applications of the Landsat and Sentinel-2 archives. Remote Sens. Environ. 2019, 225, 175–192. [Google Scholar] [CrossRef]
  58. Jiang, D.; Scholze, J.; Liu, X.; Simis, S.G.; Stelzer, K.; Müller, D.; Hunter, P.; Tyler, A.; Spyrakos, E. A data-driven approach to flag land-affected signals in satellite derived water quality from small lakes. Int. J. Appl. Earth Obs. Geoinf. 2023, 117, 103188. [Google Scholar] [CrossRef]
  59. Sterckx, S.; Knaeps, S.; Kratzer, S.; Ruddick, K. SIMilarity Environment Correction (SIMEC) applied to MERIS data over inland and coastal waters. Remote Sens. Environ. 2015, 157, 96–110. [Google Scholar] [CrossRef]
  60. De Keukelaere, L.; Sterckx, S.; Adriaensen, S.; Knaeps, E.; Reusen, I.; Giardino, C.; Bresciani, M.; Hunter, P.; Neil, C.; Van der Zande, D.; et al. Atmospheric correction of Landsat-8/OLI and Sentinel-2/MSI data using iCOR algorithm: Validation for coastal and inland waters. Eur. J. Remote Sens. 2018, 51, 525–542. [Google Scholar] [CrossRef]
  61. Wu, Y.; Knudby, A.; Pahlevan, N.; Lapen, D.; Zeng, C. Sensor-generic adjacency-effect correction for remote sensing of coastal and inland waters. Remote Sens. Environ. 2024, 315, 114433. [Google Scholar] [CrossRef]
  62. Balasubramanian, S.V.; Pahlevan, N.; Smith, B.; Binding, C.; Schalles, J.; Loisel, H.; Gurlin, D.; Greb, S.; Alikas, K.; Randla, M.; et al. Robust algorithm for estimating total suspended solids (TSS) in inland and nearshore coastal waters. Remote Sens. Environ. 2020, 246, 111768. [Google Scholar] [CrossRef]
  63. Condé, R.d.C.; Martinez, J.M.; Pessotto, M.A.; Villar, R.; Cochonneau, G.; Henry, R.; Lopes, W.; Nogueira, M. Indirect assessment of sedimentation in hydropower dams using MODIS remote sensing images. Remote Sens. 2019, 11, 314. [Google Scholar] [CrossRef]
  64. Kutser, T.; Paavel, B.; Verpoorter, C.; Ligi, M.; Soomets, T.; Toming, K.; Casal, G. Remote sensing of black lakes and using 810 nm reflectance peak for retrieving water quality parameters of optically complex waters. Remote Sens. 2016, 8, 497. [Google Scholar] [CrossRef]
  65. Joffre, M.; Tavares, M.; Roussillon, J.; Santos, V.; Chevalier, P.; Cakir, R.; Martinez, J.M.; Sauvage, S. A regional framework for spatio-temporal assessment of lake eutrophication using Sentinel-2 imagery. Submitted to Ecological Indicators on 01 March 2025. 2025. [Google Scholar]
  66. Caballero, Y.; Voirin-Morel, S.; Habets, F.; Noilhan, J.; LeMoigne, P.; Lehenaff, A.; Boone, A. Hydrological sensitivity of the Adour-Garonne river basin to climate change. Water Resour. Res. 2007, 43. [Google Scholar] [CrossRef]
  67. Alcântara, E.; Watanabe, F.; Rodrigues, T.; Bernardo, N. An investigation into the phytoplankton package effect on the chlorophyll-a specific absorption coefficient in Barra Bonita reservoir, Brazil. Remote Sens. Lett. 2016, 7, 761–770. [Google Scholar] [CrossRef]
  68. Buiteveld, H.; Hakvoort, J.; Donze, M. Optical properties of pure water. Ocean Optics XII 1994, 2258, 174–183. [Google Scholar] [CrossRef]
  69. Dall’Olmo, G.; Gitelson, A.A.; Rundquist, D.C. Towards a unified approach for remote estimation of chlorophyll-a in both terrestrial vegetation and turbid productive waters. Geophys. Res. Lett. 2003, 30. [Google Scholar] [CrossRef]
  70. Gitelson, A.A.; Gritz, Y.; Merzlyak, M.N. Relationships between leaf chlorophyll content and spectral reflectance and algorithms for non-destructive chlorophyll assessment in higher plant leaves. J. Plant Physiol. 2003, 160, 271–282. [Google Scholar] [CrossRef]
  71. Gitelson, A.A.; Kondratyev, K.Y. Optical models of mesotrophic and eutrophic water bodies. Int. J. Remote Sens. 1991, 12, 373–385. [Google Scholar] [CrossRef]
  72. Gurlin, D.; Gitelson, A.; Moses, W.J. Remote estimation of chl-a concentration in turbid productive waters — Return to a simple two-band NIR-red model? Remote Sens. Environ. 2011, 115, 3479–3490. [Google Scholar] [CrossRef]
  73. Lee, Z.; Carder, K.L.; Arnone, R.A. Deriving inherent optical properties from water color: A multiband quasi-analytical algorithm for optically deep waters. Appl. Opt. 2002, 41, 5755–5772. [Google Scholar] [CrossRef]
  74. Moses, W.J.; Gitelson, A.A.; Berdnikov, S.; Povazhnyy, V. Satellite estimation of chlorophyll-a concentration using the red and NIR bands of MERIS—The Azov sea case study. IEEE Geosci. Remote Sens. Lett. 2009, 6, 845–849. [Google Scholar] [CrossRef]
  75. Vantrepotte, V.; Loisel, H.; Mériaux, X.; Neukermans, G.; Dessailly, D.; Jamet, C.; Gensac, E.; Gardel, A. Seasonal and inter-annual (2002-2010) variability of the suspended particulate matter as retrieved from satellite ocean color sensor over the French Guiana coastal waters. J. Coast. Res. 2011, 1750–1754. [Google Scholar]
  76. Gons, H.J.; Rijkeboer, M.; Ruddick, K.G. A chlorophyll-retrieval algorithm for satellite imagery (Medium Resolution Imaging Spectrometer) of inland and coastal waters imagery of inland and coastal waters. J. Plankton Res. 2002, 24, 947–951. [Google Scholar] [CrossRef]
  77. Nechad, B.; Dogliotti, A.; Ruddick, K.; Doxaran, D. Particulate backscattering and suspended matter concentration retrieval from remote-sensed turbidity in various coastal and riverine turbid waters. In Proceedings of the Living Planet Symposium, Prague, Czech Republic, 9–13 May 2016; Volume 114, pp. 9–13. [Google Scholar]
  78. O’Reilly, J.E.; Maritorena, S.; Mitchell, B.G.; Siegel, D.A.; Carder, K.L.; Garver, S.A.; Kahru, M.; McClain, C. Ocean color chlorophyll algorithms for SeaWiFS. J. Geophys. Res. 1998, 103, 24937–24953. [Google Scholar] [CrossRef]
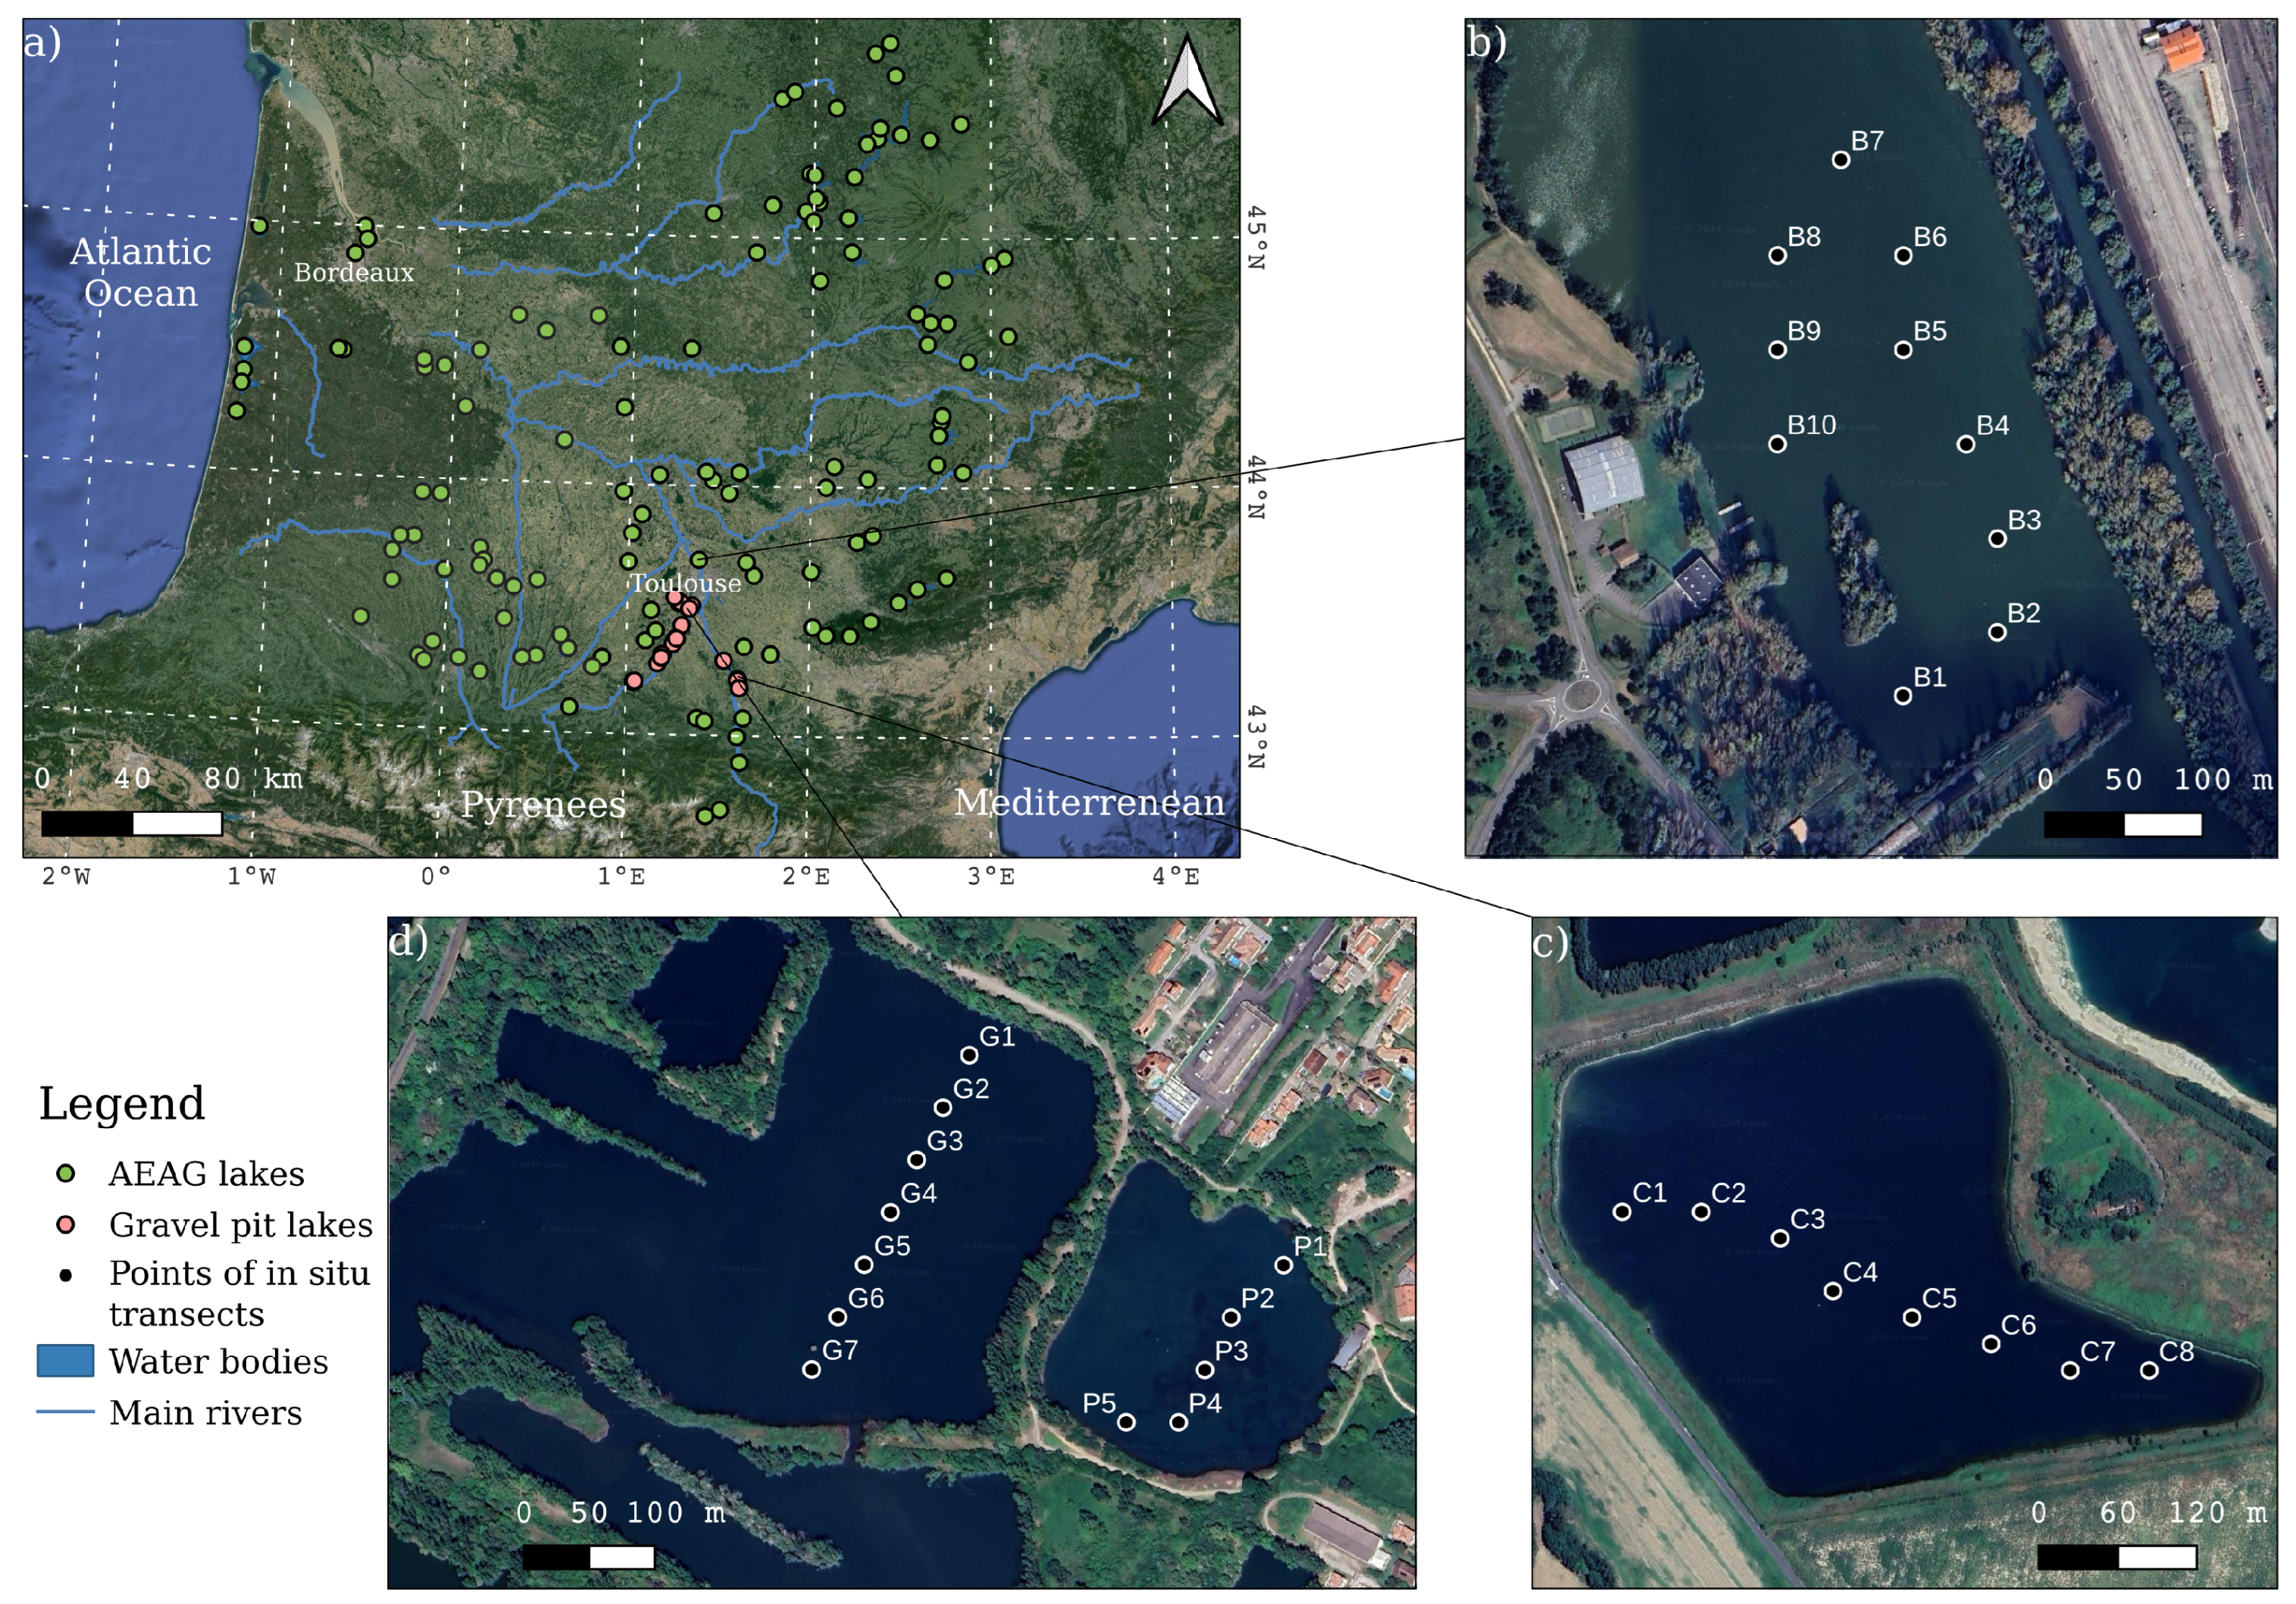
Figure 1. (a) Map of the study area, showing the lakes from the two datasets used to validate the framework. The map also shows the orientation of transects in the four lakes monitored for validation of Rrs derived from GRS and further validation of chl-a and turbidity: (b) Lake Bocage, (c) Lake Cabane, and (d) the Grand and Petit Lamartine Lakes.
Remotesensing 17 02729 g001
Figure 2. Distribution of (a) chlorophyll-a concentration and (b) turbidity, according to the classification of optical water type. (c) Relationship between chl-a and turbidity. (d) Distribution of lake size and depth in the datasets.
Remotesensing 17 02729 g002
Figure 3. Flowchart illustrating the processing workflow for Sentinel-2 MSI images, from Level-1C (L1C) to Level-2B (L2B). For step 5*, a more detailed explanation is available in Figure 4.
Remotesensing 17 02729 g003
Figure 5. Validation of GRS-derived Sentinel-2 Rrs with the in situ Rrs measurements collected over the four lakes (n = 65) from March to July 2024, from band 1 to band 8A (ah).
Remotesensing 17 02729 g005
Figure 6. Comparison of modelled and measured chl-a values by OWT. Field measurements originate from the AEAG dataset (n = 481), the gravel pit lakes (n = 78) and the lakes sampled for this work (n = 59) over the 2018–2024 period.
Remotesensing 17 02729 g006
Figure 7. Retrieval errors for (a,b) chlorophyll-a concentration and (c,d) turbidity as a function of lake area (a,c) and depth (b,d).
Remotesensing 17 02729 g007
Figure 8. Spatial maps of chlorophyll-a concentration for lakes (a) Bocage (on 3 October 2018), (b) Cabane (on 3 October 2018), (c) Graoussettes (on 17 September 2020), (d) Lamartine Grand and Lamartine Petit (on 3 October 2018), and (e) Laragou (on 3 October 2018). The chl-a products were clipped by the polygons of the water bodies with an inward buffer of 30 m to avoid the effects of mixed pixels, and are superimposed on the original Sentinel-2 images from the same date.
Remotesensing 17 02729 g008
Figure 9. Comparison of the modelled and measured turbidity values by OWT. Field measurements originate from the AEAG dataset (n = 489), the gravel pit lakes (n = 60), and the lakes sampled for this work (n = 59) over the 2018–2024 period.
Remotesensing 17 02729 g009
Figure 10. Spatial maps of turbidity for lakes (a) Bocage (on 3 October 2018), (b) Cabane (on 3 October 2018), (c) Graoussettes (on 17 September 2020), (d) Lamartine Grand and Lamartine Petit (on 3 October 2018), and (e) Laragou (on 3 October 2018). The turbidity products were clipped by the polygons of the water bodies with an inward buffer of 30 m to avoid the effects of mixed pixels, and are superimposed on the original Sentinel-2 images from the same date.
Remotesensing 17 02729 g010
Figure 11. Time series of satellite-derived lake mean chlorophyll-a concentration and in situ measured data for the four monitored lakes in this study and the two additional lakes: (a) Lake Bocage, (b) Lake Cabane, (c) Lake of Graoussettes, (d) Lake Lamartine Grand, (e) Lake Lamartine Petit, and (f) Lake Laragou. The curve with shaded areas represents a filtered time series calculated using an LOESS function (locally estimated scatter plot smoothing, n = 50, α = 0.1), and the blue bars indicate the duration of summer. Note the different scales for each plot.
Remotesensing 17 02729 g011
Figure 12. Time series of lake-mean satellite-derived turbidity and in situ measured data for the four monitored lakes in our study and the two additional lakes: (a) Lake Bocage, (b) Lake Cabane, (c) Lake of Graoussettes, (d) Lake Lamartine Grand, (e) Lake Lamartine Petit, and (f) Lake Laragou. The curve with shaded areas represent a filtered time series calculated using an LOESS function (locally estimated scatter plot smoothing, n = 50, α = 0.1), and the blue bars indicate the duration of summer. Note the different scales for each plot.
Remotesensing 17 02729 g012
Table 2. Selected turbidity algorithms for the 4 optical water types [42].
AlgorithmOWTsCoefficients
Quasi-analytical algorithm using the green spectrum [52]1Original
Quasi-analytical algorithm using the red spectrum [52]2Original
Power function of red-edge band [54]3Original
Disclaimer/Publisher’s Note: The statements, opinions and data contained in all publications are solely those of the individual author(s) and contributor(s) and not of MDPI and/or the editor(s). MDPI and/or the editor(s) disclaim responsibility for any injury to people or property resulting from any ideas, methods, instructions or products referred to in the content.