Article

Monitoring the Early Growth of Pinus and Eucalyptus Plantations Using a Planet NICFI-Based Canopy Height Model: A Case Study in Riqueza, Brazil

by
Fabien H. Wagner
1,*,
Fábio Marcelo Breunig
2,3,
Rafaelo Balbinot
2,
Emanuel Araújo Silva
2,
Messias Carneiro Soares
2,
Marco Antonio Kramm
2,
Mayumi C. M. Hirye
1,4,5,
Griffin Carter
1,
Ricardo Dalagnol
1,
Stephen C. Hagen
1 and
Sassan Saatchi
1,4,6
1
CTrees, Pasadena, CA 91105, USA
2
Department of Forestry, Federal University of Santa Maria (UFSM FW), Frederico Westphalen 98400-000, RS, Brazil
3
Department of Geography, Federal University of Paraná (UFPR), Curitiba 80060-000, PR, Brazil
4
Institute of the Environment and Sustainability, University of California, Los Angeles, CA 90095, USA
5
Quapá Lab, Faculty of Architecture and Urbanism, University of São Paulo—USP, São Paulo 05508-900, SP, Brazil
6
NASA-Jet Propulsion Laboratory, California Institute of Technology, Pasadena, CA 91109, USA
*
Author to whom correspondence should be addressed.
Remote Sens. 2025, 17(15), 2718; https://doi.org/10.3390/rs17152718
Submission received: 20 June 2025 / Revised: 2 August 2025 / Accepted: 3 August 2025 / Published: 6 August 2025

Abstract

Monitoring the height of secondary forest regrowth is essential for assessing ecosystem recovery, but current methods rely on field surveys, airborne or UAV LiDAR, and 3D reconstruction from high-resolution UAV imagery, which are often costly or limited by logistical constraints. Here, we address the challenge of scaling up canopy height monitoring by evaluating a recent deep learning model, trained on data from the Amazon and Atlantic Forests, developed to extract canopy height from RGB-NIR Planet NICFI imagery. The research questions are as follows: (i) How are canopy height estimates from the model affected by slope and orientation in natural forests, based on a large and well-balanced experimental design? (ii) How effectively does the model capture the growth trajectories of Pinus and Eucalyptus plantations over an eight-year period following planting? We find that the model closely tracks Pinus growth at the parcel scale, with predictions generally within one standard deviation of UAV-derived heights. For Eucalyptus, while growth is detected, the model consistently underestimates height, by more than 10 m in some cases, until late in the cycle when the canopy becomes less dense. In stable natural forests, the model reveals seasonal artifacts driven by topographic variables (slope × aspect × day of year), for which we propose strategies to reduce their influence. These results highlight the model’s potential as a cost-effective and scalable alternative to field-based and LiDAR methods, enabling broad-scale monitoring of forest regrowth and contributing to innovation in remote sensing for forest dynamics assessment.

1. Introduction

In the past year, reforestation projects in tropical regions have gained increased global importance, as forest regrowth is widely recognized as one of the most effective natural climate solutions for mitigating rising atmospheric CO2 levels [1,2,3,4]. The global objective for reforestation aims to restore at least 350 million hectares of degraded land by 2030, as committed under international initiatives such as the New York Declaration on Forests and the Bonn Challenge [5,6]. One of the foundational principles of natural climate solutions is measurability, and there is a need to develop more accurate and cost-effective monitoring of carbon stocks and recovery rates in restoration projects and secondary forests, whether natural or plantation, that can be scaled and provide detailed information on forest structure and related CO2 equivalents [7,8,9,10]. Understanding how these forests grow is essential for assessing their ecological function, carbon storage potential, and contribution to landscape restoration [2,10,11,12,13,14,15].
In recent decades, the global monitoring of tropical forests has expanded beyond tracking forest cover and deforestation to include the dynamics of secondary forest regrowth, whether through natural regeneration or plantations [13,14,16,17,18]. Changes in tropical forest cover—from deforestation, degradation, or regeneration—at regional to global scales using optical data are mostly detected through semantic segmentation of the object at each date (e.g., forest cover or fire) and subsequent analysis of the time series of the classified pixels [13,14,16,17,18,19,20,21,22]. In most regrowth analyses, canopy height is not used, and algorithms rely on forest cover classification. For example, if a pasture is classified as forest and remains classified as forest for the next 10 years, the pixel is considered a 10-year regenerating secondary forest [13,18,22]. This age can then be used to compute CO2 absorption using models or maps. Forest biomass can be derived from canopy height and particularly in young plantations [8,23,24,25], but to date, there is no method of estimated height growth from satellite data.
Currently, possible methods to monitor regrowing forest include field measurements, airborne LiDAR, and UAV-based LiDAR or 3D reconstruction. Field surveys provide detailed ground information but are labor-intensive, spatially limited, and often infeasible for large plantations or frequent monitoring. Airborne LiDAR is the gold standard, offering broader coverage and high accuracy, but it is costly and typically collected only once. UAV-based LiDAR and 3D reconstruction methods provide high-resolution data and flexibility, and are more cost-effective than airborne platforms [8,26], but are constrained by flight range, battery life, and sensitivity to weather and terrain. On the other hand, optical or radar satellite imagery enables consistent, large-scale, and repeated observation. Recently, paired with LiDAR datasets and in combination with machine learning and deep learning, satellite imagery has emerged as a solution to estimate canopy tree height over large areas; and among these solutions, the most accurate models are based on deep learning [27,28,29,30,31,32,33,34,35,36,37]. Deep learning models can learn complex spatial and spectral features directly from data [38], enabling accurate, scalable, and cost-effective height mapping without extensive field or airborne campaigns. Satellite-based monitoring can reduce costs by more than 90% compared to UAV. Moreover, deep learning models of tree height could potentially help monitor forest growth dynamics over time, when satellite data are available, something rarely achieved with field, airborne, or drone surveys.
Recently, a deep learning canopy height model at 5 m spatial resolution was developed for the Amazon forest, with training samples from both the Amazon and Atlantic forests [36]. This work offers the best accuracy obtained so far for canopy height estimation in tropical forests. It uses data from Norway’s International Climate and Forest Initiative (NICFI, https://www.nicfi.no/) [39], which provides multispectral images—including red, green, blue, and near-infrared bands—with a spatial resolution of 4.78 m for the Normalized Analytic Basemaps covering tropical and subtropical forest regions. Monthly Planet NICFI images are mostly cloud-free, as each image is a mosaic composite of the best daily acquisitions within that month. The absolute radiometric accuracy is not guaranteed for the normalized surface reflectance basemaps [40]; however, this does not impede the extraction of accurate information using deep learning methods, which rely more on pixel context and multiple levels of abstraction [38]. For example, it has been shown that with deep learning models such as U-Net [41], tree cover [19,42], degradation from logging, fire, or roads [20], and forest tree height [36] can be accurately mapped in the tropics using Planet NICFI images.
The subtropical region of South America contains extensive areas of native forests and commercial plantations. In particular, southern Brazil provides a suitable setting to test the model’s capacity to estimate time series of canopy height, as several states in the region have experienced both native forest regrowth and the expansion of pine and Eucalyptus plantations [16,43]. Additionally, southern Brazil is well suited for NICFI-based analysis due to generally low cloud cover over the region. Repeated LiDAR data for monitoring natural vegetation regeneration are rare and uncommon, and we do not have access to such data; consequently, we used Pinus and Eucalyptus plantations as a case study for height estimation of growing forest. Eucalyptus, one of the fastest-growing plantation tree species globally [44], presents a challenging scenario for height estimation, whereas pine, with its slower growth rate and shorter stature, is expected to be more suitable to accurate modeling.
This work is designed to analyze the potential of RGB-NIR-based deep learning canopy height models as an alternative tool for large-scale monitoring of forest regrowth. First, we analyze temporal changes in height estimates in natural forests in relation to terrain factors such as slope and aspect to understand potential seasonal artifacts in height time series. Second, we test the model’s ability to track growth patterns of Pinus and Eucalyptus plantations over eight years by comparing estimates to field measurements of canopy height collected via UAV drone, using eight pastures and eight natural forests as controls, in the Riqueza region of Santa Catarina, Brazil.

2. Materials and Methods

2.1. Study Site

The studied plantations of Pinus and Eucalyptus are located in the municipality of Riqueza-SC, Brazil. The larger studied region, which is the extent of the Planet NICFI quad 0720-0864, covers a ∼20 × 20 km square of the Atlantic forest domain that includes the plantations and portions of the Brazilian states of Santa Catarina and Paraná. The region is composed of a mosaic of natural forests, planted forests, agriculture, rivers, and urban infrastructures (Figure 1a). The vegetation is characterized by semi-deciduous subtropical forest. The elevation range from 200 to 610 m and the landscape is composed of hills. The climate is subtropical Cfa according to Köpen–Geiger classification, with annual precipitation of 1919 mm and average temperatures of 18 °C [45,46].
In order to study the seasonal variation of the estimated height in forests, we select only the pixels that were classified as forest by our tree cover algorithm over the entire time series [19], and erode this mask by a 7 × 7 pixels square structuring element (kernel) to avoid pixels near the forest fragment borders (equivalent of a negative buffer operation on a polygon but with raster data) (Figure 1b). Nearby the plantations, we also selected 8 pastures and 8 natural forests to be used as controls in our study of height (Figure 1c). Pastures were used as controls as they are non-forested areas with vegetation height close to zero, so we expect the model to predict zero height, and any deviation would be an error from the model. For the forests, we tried to encompass different orientations. The plantations were initially designed to follow and analyze the growth of 9 Pinus species (27.03646799°S, 53.36746861°W) planted in June 2017 (Figure 1d) and 10 Eucalyptus species (27.0216395°S, 53.3591155°W) planted in November 2016 (Figure 1e). We kept the design for the analysis of Eucalyptus, where each parcel consists of pure plantations. For Pinus, the parcels were simplified into eight larger units that showed similar height and crown patterns in the UAV flight of August 2019 (Figure 1d,e). Consequently, the Pinus parcels contain one or more species, with up to five species in parcel 8. Both plantations are located on flat to gentle slopes (≤5°) with south-east exposure. In the analysis, we only compared the growth pattern at the genus level, i.e., Pinus and Eucalyptus.

2.2. Point Cloud Data

The UAV data were acquired using the Phantom 4 and Matrice 100 platforms, both of which were equipped with RGB cameras. For the Pinus plantation, data were acquired at a height of 100 m, and for the Eucalyptus plantation, at a height of 150 m. Different flight altitudes were used to account for terrain variation, surrounding vegetation and the greater expected height of mature Eucalyptus (≥35 m) compared to Pinus. In all cases, the longitudinal and lateral overlay was set to 80% with camera viewing at nadir. No ground control points (GCPs) were used, resulting in UAV default positional error (estimated at around 1.5 m), which has limited impact in this study, as we computed the median height at the parcel level. The UAV data were processed in Metashape (Agisoft, Inc., St. Petersburg, Russia) at the highest quality level. The following sequential processing workflow was adopted: photograph alignment; creation of a dense cloud; creation of a digital surface model; creation of an orthomosaic; classification of ground points; creation of a digital terrain model; and elaboration of a canopy height model (CHM). For the CHM, we used the default Metashape settings to filter the dense point cloud and extract ground points. All points were considered using a maximum angle of 15°, as the region is relatively flat, and a one-meter distance. The maximum terrain slope was set to zero, also due to the near-flat relief. The cell size was set to 50 m, considering that some areas have dense canopies with no ground points. The erosion radius was kept at zero. The eight campaigns were realized the same day for Pinus and Eucalyptus plantation: 1 June 2017, 1 August 2017, 1 November 2017, 1 September 2018, 1 August 2019, 1 June 2021, 1 September 2022, and 1 May 2025, but the Eucalyptus data for 2022 were lost. Early campaigns were spaced by 2–3 months for training and testing with the UAV system, while later ones were scheduled annually in winter to avoid rain, with occasional delays due to weather and logistics. The latest campaign was carried out as soon as possible to add another time point for this study. Spatial resolutions ranged from 0.028 to 0.084 m. For the analysis, the mean and standard deviation of the CHM were aggregated at the parcel level using CHM at the original resolution. To remove high values caused by processing or acquisition artifacts, the following errors were excluded: Eucalyptus on 1 August 2019 with CHM ≥ 22 m; Pinus on 1 November 2017 with CHM ≥ 15 m; Pinus on 1 May 2025 with CHM ≥ 20 m; and Eucalyptus before 2025 with CHM ≥ 25 m. The thresholds were defined as strictly higher than the highest observed point that could be reasonably attributed to real tree height.

2.3. Planet NICFI Satellite Images of Riqueza, Santa Catarina—Brazil

Planet NICFI quad 0720-0864 imagery (∼20 × 20 km, ∼4.78 m resolution, Figure 1a) was obtained via Planet API https://api.planet.com/basemaps/v1/mosaics (accessed on 9 June 2025) and PlanetNICFI R package [47] for 67 available dates [39]. The temporal coverage included biannual observations (1 December 2015 to 1 June 2020) and monthly acquisitions (1 September 2020 to 1 May 2025). Raw 12-bit digital numbers from Red (0.650–0.682 μm), Green (0.547–0.585 μm), Blue (0.464–0.517 μm), and NIR (0.846–0.888 μm) bands [48] were processed by truncating RGB bands to 0–2540 and scaling NIR bands (divided by 3.937). All bands were then converted to 8-bit (0–255) through division by 10 to create the RGB-NIR composite. A 128-pixel mirrored border was added for deep learning predictions and removed afterward. Atmospheric correction was not applied, as it is not required for deep learning models like U-Net, which rely on pixel context rather than absolute reflectance values.

2.4. Canopy Height U-Net Model

Here, we used a U-Net model adapted for regression to map the mean tree canopy height from Planet NICFI images at ∼4.78 m spatial resolution [36]. This U-Net model was trained using canopy height models computed from aerial LiDAR data for Amazon and Atlantic forests, containing mostly natural but also planted forests as a reference, along with their corresponding Planet NICFI images. The mean error of the U-Net model on the validation sample in their study was 3.68 m. The full description of the model architecture, training procedure, and hyperparameters is available in our previous work [36]. An encouraging initial result was obtained for monitoring height changes in regenerating forests (see point 6 in Figure 9 of [36]), which led to this work.

2.5. Predicting Canopy Height and Forest Cover

The time series of the Planet NICFI tile 0720-0864 was processed using a pipeline developed by Ctrees.org, designed to generate predictions of tree cover, tree height, cloud cover, and water surface masks from Planet NICFI imagery [19,42] and fully described (i.e., model architecture, training procedure, and hyperparameters) in [36]. These masks are predicted at each date of the time series (67 dates, 1 December 2015 to 1 May 2025), and the pipeline further generates land cover composites on the following classes: stable forest (always classified as forest), non-forest (always classified as non-forest), deforestation (first date detected as non-forest of a previously forested pixel, confirmed with 3 next values) and regeneration (first data detected as tree cover and that still remain tree cover on the last date). The pipeline also separately computes the mean and maximum height composite on the time series. For the seasonal analysis, the mean and standard deviation of the predicted CHM in the natural forest were aggregated for the classes of slope × exposition, and at the parcel level for the time series analysis and comparison with the field CHM. The predicted and observed CHM values were statistically compared using 95% confidence intervals around the mean. Specifically, if the observed mean fell within ±1.96 times the standard deviation (SD) of the predicted CHM, the difference was not considered statistically significant. In the time series figure, we display ±1 SD around the predicted mean for visualization; the 95% confidence interval corresponds approximately to twice this value.

2.6. SRTM Model

To test for artifacts in canopy height predictions with slope and orientation in stable forest, elevation data from the Shuttle Radar Topography Mission (SRTM) at the 1 arc-second (∼30 m) spatial resolution were used [49] (https://dwtkns.com/srtm30m/, accessed on 13 May 2025). Orientation and slope were computed with the 8 adjacent neighbors, then orientation was classified into 8 classes (North, North-East, East, South-East, South, South-West, West and North-West) and slope into 6 classes (<5°, ≥5 and <10°, ≥10 and <15°, ≥15 and <20°, ≥20 and <25°, and ≥25 and <30°). The data were then warped using Planet NICFI at 4.78 m spatial resolution.

2.7. Seasonal Height Analysis in Stable Forests

To assess the seasonal artifacts potentially linked to topographic effects on canopy height estimates, we modeled the observed canopy height seasonal signal as a function of the day of year (DOY), slope, and orientation. Specifically, we used a Fourier-based linear model, as shown in Equation (1).
median_height sin 2 π · DOY 365  ×  slope_class  ×  orientation_class + cos 2 π · DOY 365  ×  slope_class  ×  orientation_class + ϵ e r r o r
where median_height is the median height computed at each date and for each of the 48 combinations of slope and orientation classes. The error term, ϵ e r r o r , represents Gaussian residuals, and the model was fitted using ordinary least squares. This approach captures the annual periodicity in the height measurements using the first harmonic of the Fourier series (sine and cosine terms of DOY), while allowing interaction effects with categorical slope and orientation classes. The interaction terms enable the model to account for variations in both the amplitude and phase of the seasonal pattern as a function of topographic configuration. To balance our sample, we use 14,884 pixels randomly selected in each of the 48 combinations of orientation × slope classes. The value 14,884 corresponds to the number of pixels of the combination with the lowest number of pixels. The total number of stable forest pixels used in this analysis is 714,432 pixels. Furthermore, this analysis was conducted during the period 1 May 2021 to 1 April 2025 (included) to have the same amount of pixels per month.

2.8. Statistical Analysis

To analyze temporal changes in canopy height, we calculated the mean predicted canopy height from our model across all pixels within each parcel at each time step, along with the corresponding standard deviation (SD) to capture spatial variability within parcels. Field observations of canopy height, derived from UAV-based Canopy Height Models (CHMs), were similarly aggregated at the parcel level by computing the mean and SD of the measurements. To reduce seasonal noise and emphasize growth trends, a 12-month rolling mean was applied to the predicted canopy heights, aligned with the central date of each rolling window. Pixels affected by cloud contamination were identified and flagged in the time series to account for potential data quality issues.
To assess prediction performance with quantitative metrics, we compared model height predictions to field-measured average heights per parcel, grouped by plantation type and date. For each field observation date, we computed quantitative metrics including Mean Absolute Error (MAE), Root Mean Square Error (RMSE), bias (mean difference), and conducted paired t-tests to assess the significance of the bias. Model predictions were averaged over model dates within ±3 months of the field date to account for temporal mismatches and lower intra-annual variability of predictions.

2.9. Open Source Software and Tools

All analyses were made using R [50] and GDAL [51] and with the R packages terra [52], raster [53], sf [54,55], zoo [56], keras and tensorflow [57,58,59,60]. QGIS was used to visualize the data [61].

3. Results

3.1. Seasonal Variation in Canopy Height Estimates with Slope and Orientation

For the stable forest in the Planet NICFI 0720-0864 tile across all orientations, a seasonal variation of canopy height estimation is observed and follows a unimodal trend Figure 2. Note that we assume that there is no significant growth over the period for the stable forest. The amplitude appears modulated with the slopes, with the largest positive or negative variations almost always observed for the highest slopes (slope classes ≥ 20°). Conversely, the lowest variations are always observed for the lowest slopes (slope classes < 10°). The effect of the slope on the timing of the peaks and pits does not seems really important and is only marginally observed, for example in the east-facing orientation, where the peak in lowest slopes seems slightly delayed.
The most visible trends are a high overestimation of height of approximately 3 m on the south-facing slopes around day of the year (DOY) 150 to 250, which corresponds to winter in the Southern Hemisphere, i.e., the latitude of the Planet tile is approximately 27° south. This is the period when shading is at its highest on south-exposed slopes. At the same time, on the north-oriented slopes, a large underestimation of height is observed, reaching more than −3 m for the steepest slopes. The other combinations of slope and orientation appear to show a transition between the two extreme artifacts of south-facing and north-facing slopes.
The R2 of the fitted seasonal model is very high, with a value of 0.8227 for all slope × orientation combinations. This indicates that the seasonal values have an artifact linked to the date of the satellite image capture. Overall, most of this effect can be attenuated by using a 12-month moving average, and in the following, we use the moving average in the visualization to limit the effect of this artifact on the height estimation of the planted Pinus and Eucalyptus trees.

3.2. Geometric Distortion of the NICFI

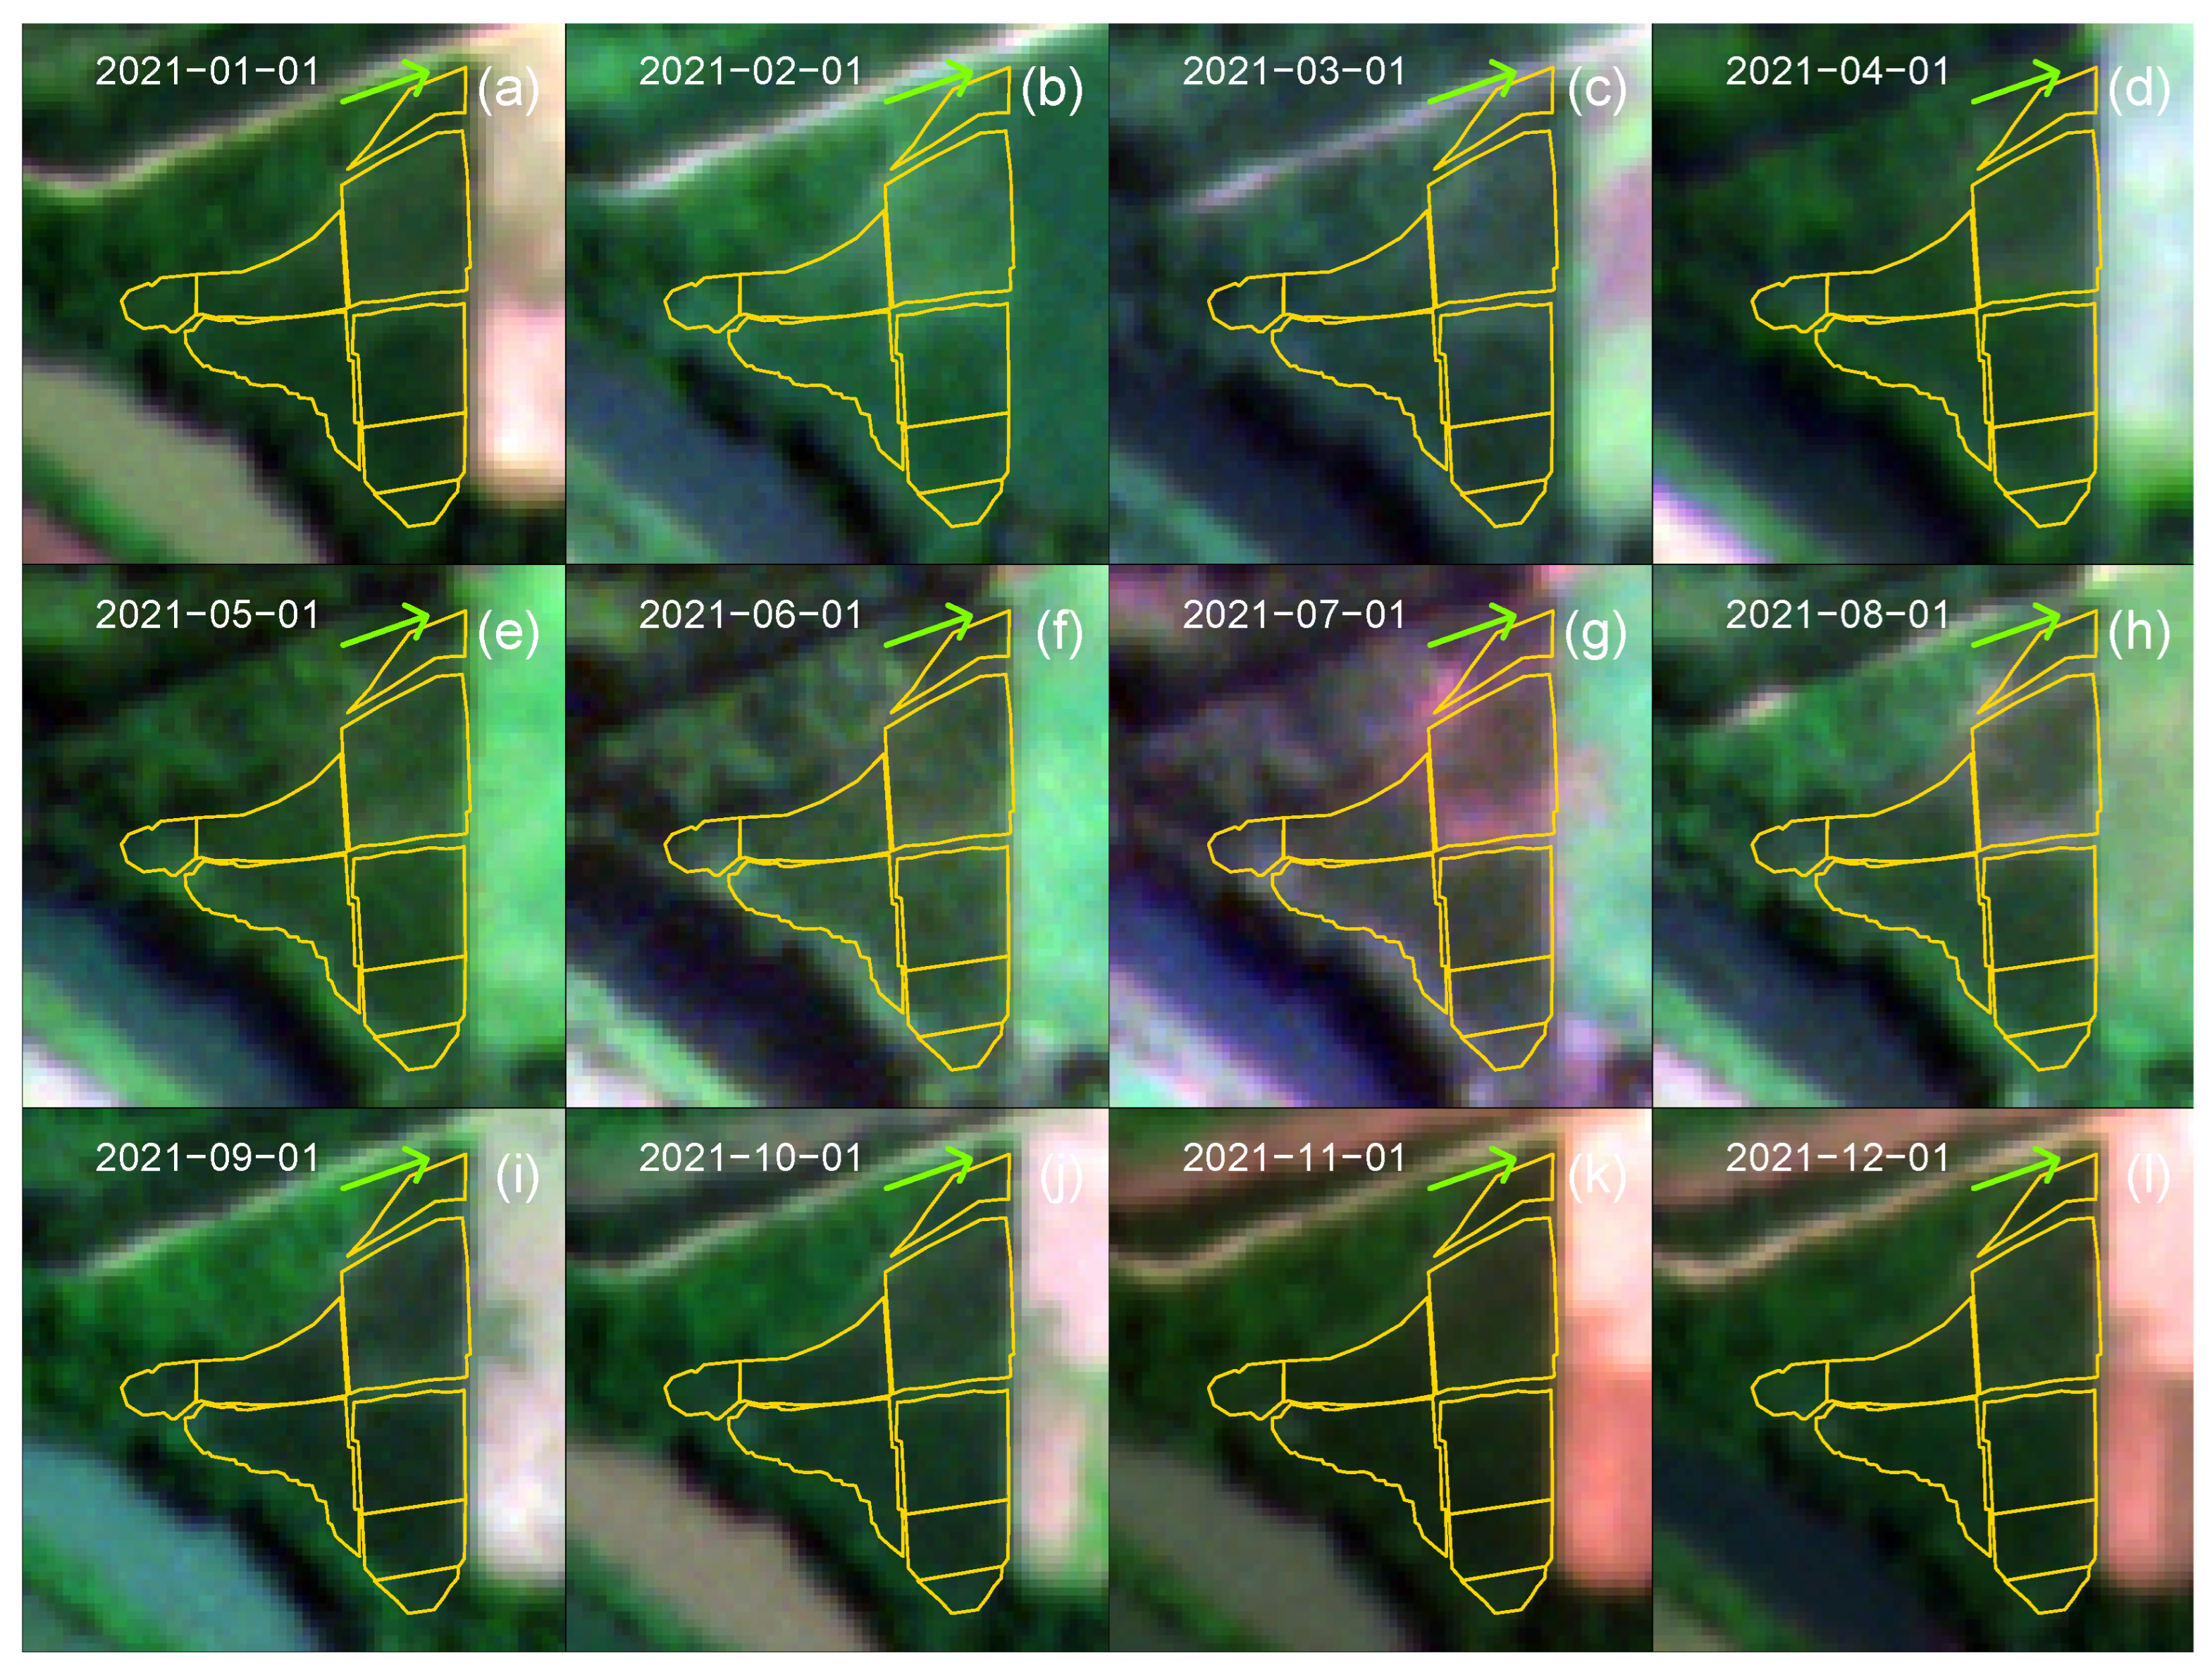
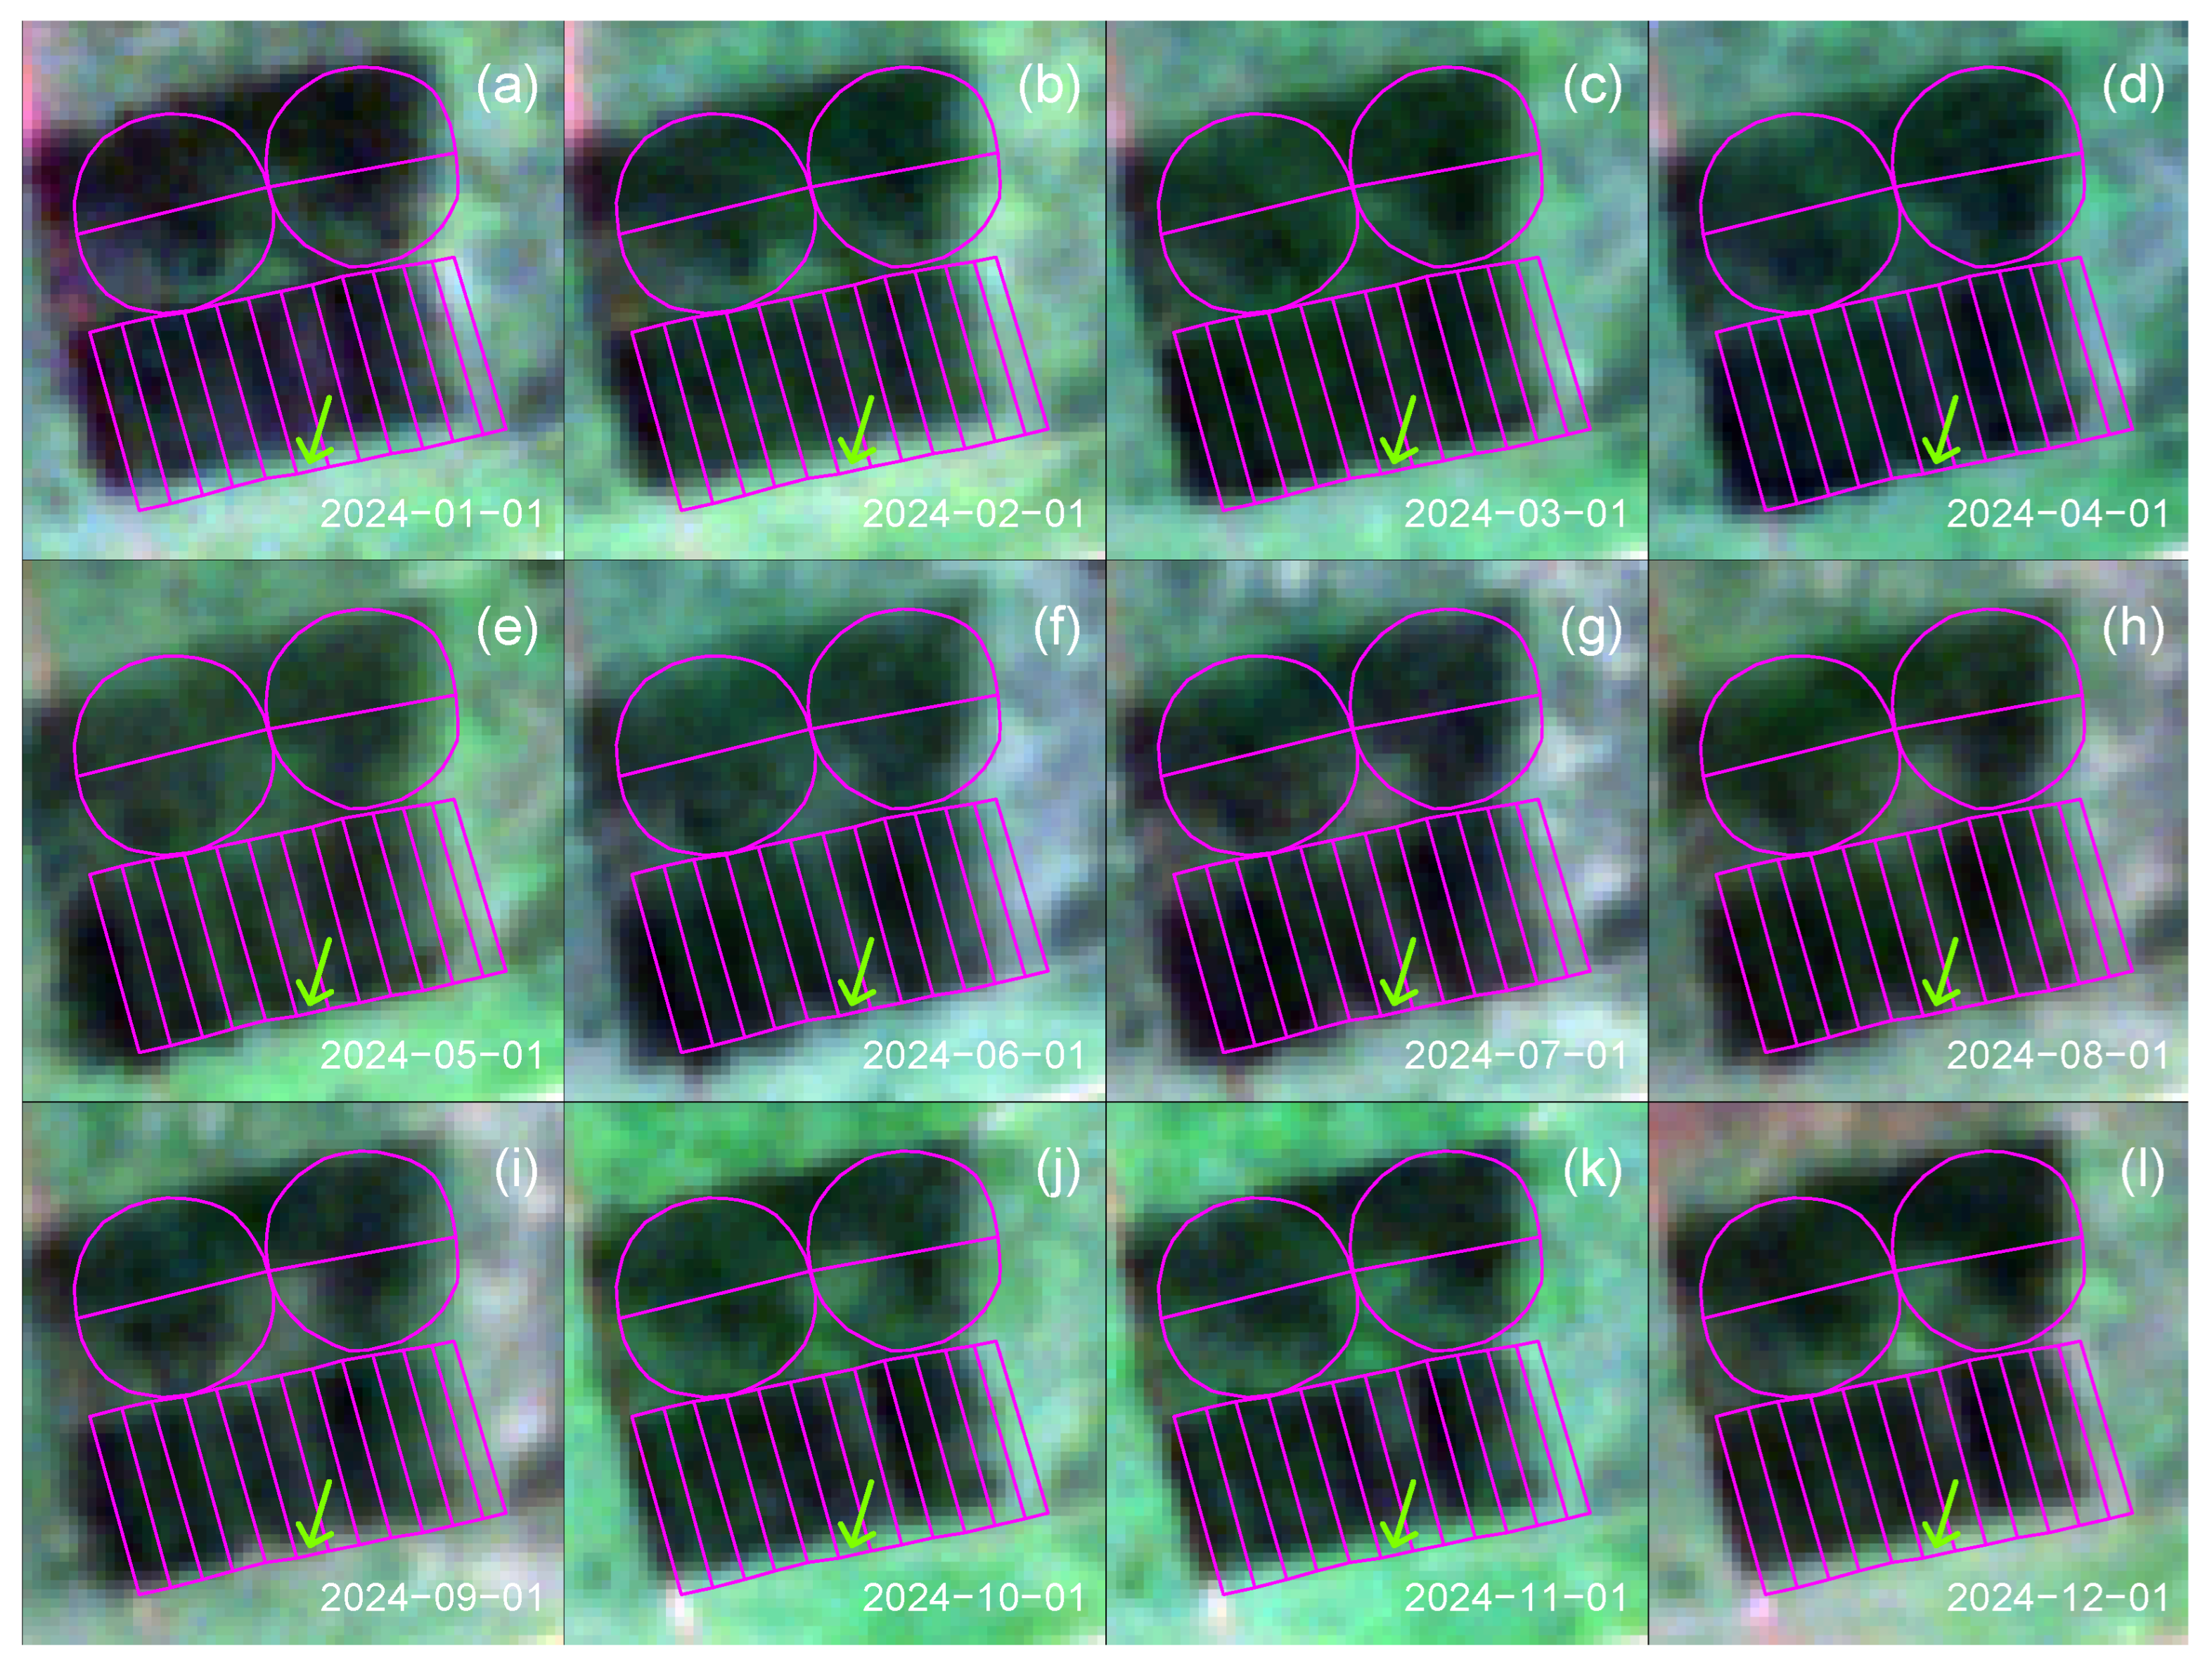
Registration shifts and small distortions appeared in the NICFI images throughout the monthly time series (Figure 3 and Figure 4).
For the Pinus plantation (Figure 3), which is located on flat terrain, seasonal changes in shading are visible, with taller shadows observed in June in the Planet NICFI images. A registration shift is noticeable near the top of the polygon, between the polygon’s upper boundary and the adjacent road. The road in March intersects the polygon of the Pinus plantation, while for other dates, it appears at slightly different positions above the northern tip of the polygon. The distortion is due to registration shifts of no more than four NICFI pixels, but this translates to a shift of approximately 20 m, which can hinder tracking of individual trees. Regarding the RGB time series, some variations are observed during the year 2021, with a dry month in July/August when the soil appears in some parcels, and the darkest green color seems to occur in November. Regarding the RGB time series, some variations are observed during the year 2024; the darkest green color seems to occur in January and December. Lighter green appears in May and June, when the sun is lower in the sky and shadows are the largest.
For the Eucalyptus plantation (Figure 4), which is on a gentle slope facing south, distortions are mainly visible along the southern border of the polygon. In months near June, the area overlaps forest, while in others (near January), it overlaps pasture. This shift is around two NICFI pixels, ∼10 m. While this may partly result from shading, it cannot be entirely attributed to it, since the shape files were derived from highly accurate, drone-registered data. This is more likely a distortion due to the orthorectification of the original images. In this particular case, it means that all polygons on the lower part will include some height equal to zero because of the pasture inclusion in the polygons. Once again, the monthly image distortion can hinder the monitoring of individual tree height, and it can also include height values from different land cover types in the direct vicinity of the parcel in the parcel-level estimates.

3.3. Observed Canopy Height for the Plantations

Looking at the overall growth of the Pinus plantation data (Figure 5a–h), we can see that the Pinus planted in July 2017 grows slowly and starts to reach 5 m around June 2021 (Figure 5f). After this, growth continues, and crowns are still individually visible. Some parcels (4 and 8) show more growth rates than others. The 95th percentile of annual height growth at the parcel level observed for the Pinus plantation was 2.73 m per year. For the Eucalyptus, which were planted in November 2016 (Figure 5i–p), the growth is faster than for the Pinus, with trees reaching over 10 m in two years (Figure 5l). In 2021 (Figure 5n), the height of trees can exceed 20 m with a crown diameter of only ∼3 m, such as the tallest tree in the circles of the plantation, and the canopy layer is extremely dense, with almost no points reaching the ground between the trees. Within these densely packed crowns, the minimum height is close to the maximum height. On the last date (Figure 5p), most trees are isolated, and points reach the ground between them. Only one plantation parcel (Eucalyptus 17) remains densely packed. Plantation 20 is entirely dead or harvested in 2025, as is most of plantation 19. The 95th percentile of annual height growth at the parcel level observed for the Eucalyptus plantation was 7.16 m per year. In Figure 5c,m, some unusually high points are artifacts from UAV data capture and processing and have been removed for the subsequent parcel-level estimates. As detailed in the Methods Section 2.2, unusually high artifacts in the UAV-derived CHM were excluded using thresholds defined as strictly higher than the maximum height reasonably attributable to real tree growth.

3.4. Time Series of Parcel-Level Average Canopy Height

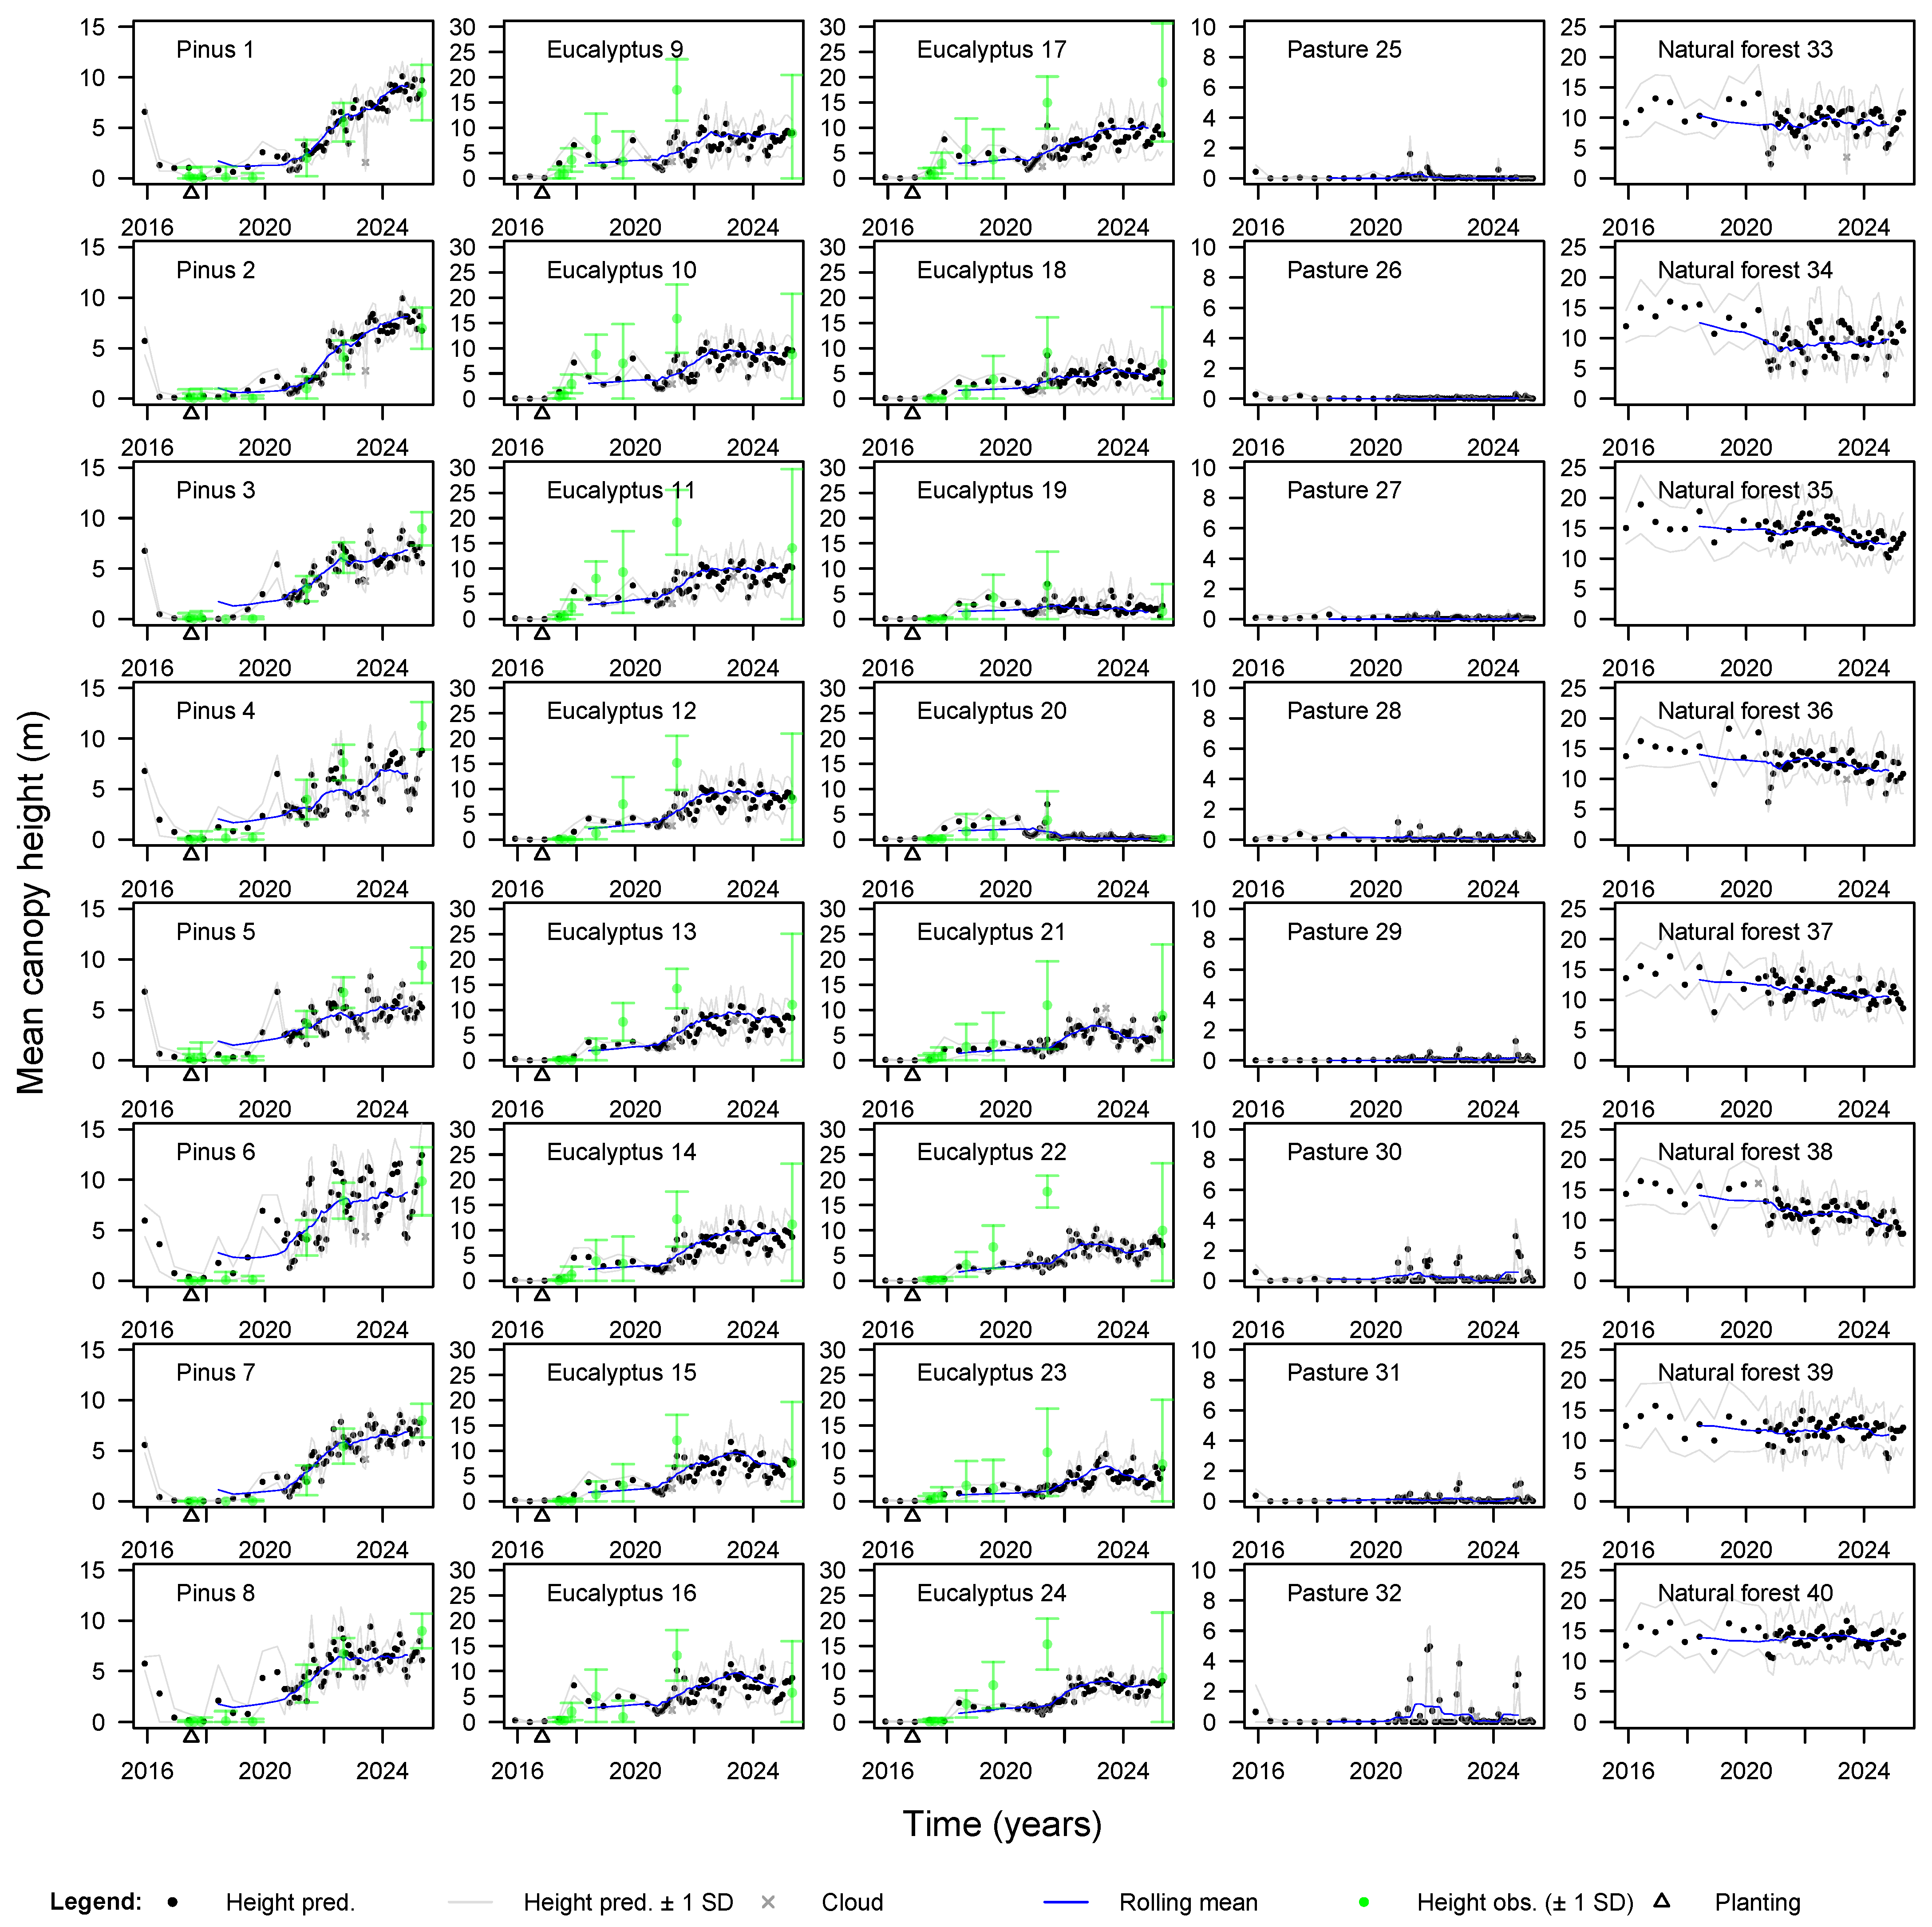
The estimated canopy heights show consistent and coherent patterns across different land cover types (Figure 6). For the planted parcels that were still alive in 2025, the model predicted gradual growth patterns that differed significantly from zero.
For the Pinus plantation (Figure 6, first column), the model captured well the average parcels growth over time, and the estimation is relatively close to the observed growth. The estimates of height are close to the field measurements for most of the time, remaining within less than one standard deviation of the UAV height estimates. Even though the curves show intra-annual variation, all of them show significant growth; that is, most of the points are more than 2 standard deviations from zero, which would be considered as not different from zero (1.96 × standard deviation is the 95% confidence threshold). When growth is first detected, a peak occurs in December and June 2020; these two dates are the last biannual dates in the NICFI dataset. After these first detection peaks, the dataset became monthly, and the height pattern returned closer to the field measurements and improved in consistency. Between 2021 and 2023, growth accelerates and, aside from Pinus 4 and 5, this growth pattern is very well predicted by the model estimates. For Pinus 4 and 5, the acceleration in growth is observed, but the observation is closer to the highest prediction rather than to the mean prediction. For the last date, most predictions in the two months closest to the observation are included within one standard deviation around the mean observation, except for Pinus 5. Regarding intra-date variations, they exist in all the curves but are more pronounced in the smallest parcels (Pinus 4 and Pinus 6), and in the one that shares a long border with tall forest (Pinus 8). For the inter-date variations, they seem autocorrelated; we observe more gradual changes that persist over two or more dates, rather than large shifts from one month to the next. Quantitative comparisons between model predictions and field-measured average heights (Table 1) confirm the previous observations. For Pinus, the model achieved low errors during early stages, with MAE values below 0.4 m and non-significant biases (p > 0.05) before 2018. From 2018 onward, errors increased, with MAE reaching 1.51 m in 2019 and 2.00 m in 2025, although the bias for the latter date was not statistically significant (p = 0.0785). Significant biases were observed in 2018 and 2019 (p < 0.01), while other years remained non-significant. Overall, the model captured the growth patterns of Pinus plantations well, with moderate and mostly significant deviations at some points.
For the Eucalyptus (Figure 6, second and third column), the model estimates presented significant growth (zero not included in 1.96 × the standard deviation), but failed to predict most of the field-estimated average height values until the last date, particularly during the fast growth phase of Eucalyptus (2019 and 2021 measurements). The Eucalyptus reached very tall heights, even with crowns smaller than 3 m in diameter, in just a few years, with some pixels above 20 m in approximately 5 years and very few pixels on the ground, i.e., very densely packed high-height pixels (Figure 5n). For the last date, the average height is well predicted by the model, and the only polygon where the prediction is very far from the observed is Eucalyptus 17, which is the only plantation band that still shows densely packed height pixels in 2025 (Figure 5p). For all the other Eucalyptus plantations on the last date, when more ground pixels are visible (Figure 5p), the model can provide an estimate close to the average height, i.e., the measured mean height is within one standard deviation of the estimated height (Figure 6, second and third column). The largest parcels, i.e., Eucalyptus 21, 22, 23, and 24, show smaller standard deviations in the estimates than the other Eucalyptus parcels. Eucalyptus 20, where all the planted Eucalyptus have died or been cut, shows a height of zero. For the inter-date variations, just like in the Pinus plantation, we observe more gradual changes that persist over two or more dates rather than large shifts from one month to the next. Regarding quantitative metrics for Eucalyptus (Table 1), the model tended to significantly overestimate heights during the early growth phase (June 2017–November 2017), with MAE values between 0.40 and 2.06 m and p-values below 0.05, indicating statistically significant biases. In 2021, the model strongly underestimated height (bias = −8.32 m, p < 0.001), corresponding to the period of most rapid growth. Although prediction accuracy improved in 2025, a non-significant negative bias of −1.38 m remained. These results suggest that the model struggled to capture the fast vertical development of Eucalyptus plantations, mainly during the rapid growth phase.
To analyze the impact of geolocation on our height estimates at the parcel level, we compared the standard deviation of height in the original parcels to that in parcels with a 5 m negative buffer. A reduction in standard deviation was observed in 96.8% of Pinus and 91.0% of Eucalyptus parcels, with mean decreases of 0.35 m and 0.30 m, respectively, indicating that using a negative buffer helps reduce errors caused by geolocation shifts, that is, mostly the inclusion of zero values from neighboring pastures and high values from neighboring forests in our particular case.
For pasture, used as a control, the estimated height is almost always zero (Figure 6, fourth column). The occasional false detections of height observed in pasture areas correspond to seasonal crops of unknown type, which appear as dark green in the images. For example, the height peak observed in Pasture 32 at the end of 2022 can be explained by this effect: in September 2022, the field was bare soil; from October to December 2022, a dark green seasonal crop of unknown type was present; and by January 2023, the field returned to bare soil. At other times of the year, the field can exhibit varying green appearances or appear as bare soil, and the predicted height remains zero. The same phenomenon occurs in Pasture 30, where a dark green seasonal crop is observed from October to December 2024, and all other errors in the pasture are also due to seasonal crops. This seasonal crop signal appears to mislead the algorithm, triggering false detections of height, but it is not observed to last more than 3 months.
The natural forest, also used here as a tall control reference, first demonstrates that the model in this region can predict average heights exceeding those observed in plantations, with some average heights reaching more than 15 m. Second, the height in natural forest areas appears stable or slightly decreasing. We do not have field data to determine whether the apparent height decrease observed in natural forest 35–38 reflects real changes or artifacts; however, the only trends we would expect are stagnation or slight decreases, as significant height growth in natural forests is not expected. Most of the highest values appear in the earliest dates, when the Planet NICFI image composites were biannual, possibly due to differences in the image generation algorithm. The time series shows seasonal variations in the mean as expected from slope angle and exposure, and the coefficient of variation ( C V = S D m e a n × 100 ) for the natural forests is 26.3%. Height estimates obtained from the biannual NICFI data are higher than those from the monthly estimates.

4. Discussion

4.1. Monitoring Height from Planet NICFI Images

Here, we show that the canopy height model predicted gradual growth patterns that differed significantly from zero, even though this was not the original intended application of the model, which was designed to estimate the height of old-growth tropical forests [36]. To our knowledge, this is the first time that a canopy height model derived from remote sensing optical imagery is used for this purpose. The absolute radiometric accuracy is not guaranteed for NICFI images [40], but the model still manages to extract relatively consistent canopy height information. The detection of early growth is an encouraging result, as it could help identify natural or planted forest regrowth and estimate plantation performance on large scales, without relying on LiDAR data or traditional field-based inventories, which remain the gold standard [26].

4.2. Pinus and Eucalyptus Specific Performance

For the value of the predicted growth in our case study, the results differ depending on the planted species. The model performed well in capturing the average growth of planted Pinus parcels over time (Figure 6). The Pinus plantation grew more slowly and regularly than the Eucalyptus, with maximum growth rate observed for Pinus of 2.7 m per year. Despite growing more slowly than Eucalyptus, the productivity of Pinus in southern Brazil is among the highest in the world [62]. In most cases, model predictions and field data estimates showed strong agreement, with the predicted canopy height remaining within one standard deviation of the UAV-derived field measurements. Intra-annual variations were present and tended to be more pronounced in smaller parcels, likely due to edge effects and local environmental heterogeneity, such as the direct vicinity of taller forest. The observed growth patterns exhibit temporal autocorrelation, possibly attributed to more similar image characteristics such as reflectance and shading between two consecutive dates than between non-adjacent ones. For this growth curve and the Eucalyptus curve, a 12-month moving average effectively reduced seasonal artifacts. In future work, we will validate on a larger scale our deep learning canopy height models for monitoring the growth of Pinus plantations, which represent a major component of Brazil’s planted forests, covering 1.93 million hectares, just after Eucalyptus with 7.53 million hectares, the main planted tree genus [63].
In contrast, for Eucalyptus plantations, the model underestimates average parcel height during rapid growth phases, particularly when canopies are dense, isotropic, with reduced spatial variability in reflectance, and ground pixels are no longer visible. This limitation becomes apparent when comparing model predictions with field measurements during the fast growth phases of Eucalyptus (2019 and 2021 measurements; Figure 6). The maximum growth rate observed for Eucalyptus was about 7.2 m per year, highlighting why Eucalyptus is ranked among the fastest-growing tree species globally [44]. Such high growth rates are commonly achieved under experimental conditions with thorough soil preparation and nutrient management, as demonstrated by multiple eucalyptus plantation trials in Brazil [64,65]. However, the model’s performance improves significantly when canopies become less dense in 2025 and ground pixels become visible (Figure 5p), as shown by the closer match between observed and predicted average heights for the last measurement. Eucalyptus are known for their fast growth and high water demand, which can lead to rapid biomass accumulation under favorable conditions but also increase their vulnerability to water stress. Between 2021 and 2025, intense droughts and heavy rainfall events likely caused mortality episodes in the Eucalyptus plantation, but other stressors were also observed, such as frost and leaf-cutting ants, which affected the crowns of some individual trees or small tree clusters. The occurrence or combination of these stressors may partly explain the apparent thinning and the average reduction in canopy height and growth. As with Pinus, larger Eucalyptus parcels (21–24) show more consistent estimates with smaller standard deviations, highlighting the influence of parcel size on estimation accuracy.
The main assumption underlying the discrepancy between early growth modeling of Pinus and Eucalyptus is that Pinus growth resembles that of a natural forest, with a crown/height ratio and shading likely similar to the small tree present in the model training, and maintaining sufficient contextual information for the model to estimate height effectively. In contrast, Eucalyptus reaches greater heights and has higher planting densities that fall well outside the trained model’s canopy textures and crown/height ratios, with crowns of 3 m occurring at heights of up to 20 m in extremely dense stands. The density of Eucalyptus plantations and small crown size may also reduce the availability of contextual information, as the canopy appears more like a continuous surface in the UAV CHM, whereas in Pinus stands, individual crowns remain visible throughout growth (Figure 5h,n). This type of artifact was also observed in California with a similar canopy height model, where the tallest forests showed similar canopy textures because they only grew in height while the crown size and shape remained the same [35]. The lower performance may be due to the homogeneous appearance of young Eucalyptus plantations in the imagery, limiting the model’s ability to extract relevant features for height estimation; however, we currently lack sufficient data to assess how crown size and density contribute to this limitation. The underestimation observed in the height estimates for Eucalyptus is consistent with limitations already reported by [27,31] who point out challenges for models based on optical data in high-density forests with homogeneous canopies. When the Eucalyptus crowns become more distinguishable (Figure 5p, in 2025), the model improves in estimating mean height, as observed at the end of the time series. The only curve that remains far outside the model’s height estimation is that of Eucalyptus plantation 17 (Figure 5p and Figure 6), where crowns are still extremely densely packed even on the last field date. Access to local LiDAR data could further improve the model by refining predictions for both tree height and background, and, in further work, we will determine whether early Eucalyptus underestimation can be corrected by adding more samples to the training or if the images simply lack enough context to estimate Eucalyptus height accurately.

4.3. Performance of the Model in Control Areas

For control areas, the model demonstrates different characteristics. Most of the time, our model performs well in predicting zero height in pasture areas (Figure 6), but some seasonal plantations are falsely detected as forest with a height. In this region, this does not pose a significant problem, as these crops appear only during a short period of the year, typically no more than 2 to 3 consecutive months, and are bordered by periods of bare soil, so they could be easily filtered. For example, by removing areas with height peaks that are not consistent over time, i.e., are followed by several months with a height of 0. In future work, we plan to explicitly include seasonal plantations as a background class with zero height in the model training to further reduce such misclassifications. Natural forest control areas demonstrate the model’s capability to predict heights exceeding 15 m in this region, with a generally stable or slightly decreasing trend over time. The coefficient of variation (CV) of 26.3% observed in natural forests reflects moderate variability, consistent with the expected behavior of mature forest ecosystems, and may be influenced by seasonal artifacts and the phenology of these semi-deciduous forests, which shed leaves during the Southern Hemisphere winter in this region [66,67]. Our CV (26.3%) aligns with the 25–50% proportion of deciduous species reported for this type of subtropical forest [67,68,69]. For natural forests, using annual estimates would be recommended to reduce noise in the signal. Furthermore, for an unknown reason, possibly related to NICFI processing, height estimates are higher in the biannual data, and we recommend using data from the monthly time series, starting in October 2020.

4.4. Seasonal Effects Artifacts and Geometric Distortions

The estimates of canopy height in stable forest in the 20 × 20 km region that includes the plantations vary with exposure and slope (Figure 2). The seasonal signal is consistent, and the seasonal model incorporating slope and orientation explains 82% of the variance, indicating a strong fit. Seasonal artifacts tend to increase with slope. This predictable artifact likely reflects the model’s dependence on tree shadows for height estimation, with seasonal changes in shading across different slopes and orientations creating systematic artifacts in the canopy height. The largest artifact occurs on south-facing slopes during the Southern Hemisphere winter, precisely where the greatest tree shading is expected. Some dominant species shed leaves in winter and could contribute partly to this artifact; however, the deciduousness never appears in the NICFI images, where natural forest looks evergreen all year long. While these effects are large, with around 25% of the mean value, they can be diminished but computing annual values or 12-months moving average. A potential solution to correct these artifacts would be to apply a correction factor based on a Bidirectional Reflectance Distribution Function (BRDF) as a function of latitude, slope, and exposure, following approaches such as [70], or by explicitly incorporating these variables into the height model. However, implementing BRDF at 4.78 m resolution is challenging due to the high structural variability in this diverse subtropical forest. Moreover, Planet NICFI imagery now requires a subscription, and the number of available images may not be sufficient to reliably estimate BRDF parameters. Consequently, we suggest a simpler approach, such as applying a moving average, as a feasible alternative to reduce topographic effects in the signal.
In a hilly region such as this area of South Brazil, achieving precise georeferencing for each image is challenging. While overall scene alignment can be improved, for example by computing the best correlation with different translation coefficients, terrain-induced distortions like those illustrated in Figure 4 will persist. With a long time series, a multi-year mean could be computed to reduce the impact of slight georeferencing errors between images, as applied in the Amazon canopy height map developed with the same model [36]. The consequence of geolocation errors and distortions is that they impede tracking the height of individual trees. For plantations, the most effective approach is likely to monitor mean height at the parcel level. For operational monitoring of plantations, reforestation, and afforestation projects using satellite data, it is advisable to design large parcels, since the 5 to 10 m border around each parcel can exhibit substantial variation due to geolocation and distortion errors.

4.5. Limitations of the Current Approach

This study presents the first demonstration of a tree height model applied to regenerating forests using a monthly time series, and several limitations remain. For Eucalyptus, it remains to be determined whether height during the rapid growth phase can be accurately estimated, or if the underestimation is due to the lack of training samples or the canopy texture that may impede the model to perform well. The model has only been tested in one tropical region and on one species mix. Its performance in other ecological or climatic contexts remains to be assessed. Furthermore, while the analysis clearly shows the existence of seasonal artifacts, the exact mechanisms behind these variations remain partly unexplained and may be linked to phenological or topographic effects. In addition, an effective method to remove these artifacts has yet to be developed. The model also depends on high-quality RGB-NIR imagery and reliable reference data for training, which may not be available in all regions. Future work should aim to generalize the approach to other forest types and test its robustness across a broader range of topographic and seasonal conditions.

5. Conclusions

In this study, we evaluated a deep learning-based method to monitor canopy height dynamics using Planet NICFI monthly basemaps. The model, originally developed to estimate the height of mature tropical forests, was able to capture gradual growth in planted forests, with predicted height values showing consistent patterns across time and land cover types. For Pinus plantations, model estimates remained within one standard deviation of UAV-derived measurements. For Eucalyptus, performance was lower during the rapid growth phase, which may be related to dense canopies potentially obscuring the ground, but improved as crowns became more distinguishable. In natural forests, the model was relatively stable as expected. Limitations include seasonal artifacts in monthly estimates, likely due to shading effects and the impossibility to track individual trees because of geolocation/distortion error. But this error can be mitigated using moving average over 12 months and estimating average growth at the parcel level. Overall, the model provides interesting results, offering a promising and scalable tool for monitoring growth, reforestation, and afforestation projects in near real-time, where LiDAR data are unavailable. This approach is low-cost, effective, and scalable. To ensure accurate predictions in a cost-effective way, future work should expand training datasets to cover more plantation types, ages, and backgrounds, and also use near real-time satellite images to reduce the need for costly field or airborne data, which would enable reliable and scalable monitoring.

Author Contributions

Conceptualization, F.H.W., F.M.B. and S.S.; methodology, F.H.W., F.M.B., R.B., E.A.S., G.C. and R.D.; software, F.H.W., F.M.B., G.C. and R.D.; validation, F.H.W., and F.M.B.; formal analysis, F.H.W., F.M.B. and M.C.M.H.; investigation, F.H.W. and F.M.B.; resources, F.M.B., S.C.H. and S.S.; data curation, F.H.W., F.M.B., R.B., E.A.S., M.C.S. and M.A.K.; writing—original draft preparation, F.H.W. and F.M.B.; writing—review and editing, R.B., E.A.S., M.C.S., M.A.K., M.C.M.H., G.C., R.D., S.C.H. and S.S.; visualization, F.H.W. and M.C.M.H.; supervision, F.H.W. and F.M.B.; project administration, F.M.B., S.C.H. and S.S.; funding acquisition, F.M.B., S.C.H. and S.S. All authors have read and agreed to the published version of the manuscript.

Funding

This work was supported by the Conselho Nacional de Desenvolvimento Científico e Tecnológico (CNPQ), grant number 305452/2023-1, and Fundação de Amparo à Pesquisa do Estado do Rio Grande do Sul (FAPERGS), grant number 23830.388.22048.19092016.

Data Availability Statement

Most of the data presented in this study are available on request from the corresponding author. Our canopy height map is a derivative product of Planet-NICFI and follows the same licence: https://planet.widen.net/s/zfdpf8qxwk/participantlicenseagreement_nicfi_2024 (accessed on 9 June 2025). The Planet NICFI data are available commercially from the Planet tropical forest observatory https://www.planet.com/tropical-forest-observatory/, (accessed on 9 June 2025).

Acknowledgments

Part of this work was carried out at the Jet Propulsion Laboratory, California Institute of Technology, under a contract with the National Aeronautics and Space Administration (NASA). We are grateful to Maguh Florestal for allowing the experiments in their private area, and to the field work team.

Conflicts of Interest

The authors declare no conflicts of interest.

References

  1. Griscom, B.W.; Adams, J.; Ellis, P.W.; Houghton, R.A.; Lomax, G.; Miteva, D.A.; Schlesinger, W.H.; Shoch, D.; Siikamäki, J.V.; Smith, P.; et al. Natural climate solutions. Proc. Natl. Acad. Sci. USA 2017, 114, 11645–11650. [Google Scholar] [CrossRef] [PubMed]
  2. Bastin, J.F.; Finegold, Y.; Garcia, C.; Mollicone, D.; Rezende, M.; Routh, D.; Zohner, C.M.; Crowther, T.W. The global tree restoration potential. Science 2019, 365, 76–79. [Google Scholar] [CrossRef] [PubMed]
  3. Cook-Patton, S.C.; Leavitt, S.M.; Gibbs, D.; Harris, N.L.; Lister, K.; Anderson-Teixeira, K.J.; Briggs, R.D.; Chazdon, R.L.; Crowther, T.W.; Ellis, P.W.; et al. Mapping carbon accumulation potential from global natural forest regrowth. Nature 2020, 585, 545–550. [Google Scholar] [CrossRef] [PubMed]
  4. Friedlingstein, P.; O’sullivan, M.; Jones, M.W.; Andrew, R.M.; Hauck, J.; Landschützer, P.; Le Quéré, C.; Li, H.; Luijkx, I.T.; Olsen, A.; et al. Global carbon budget 2024. Earth Syst. Sci. Data Discuss. 2024, 2024, 1–133. [Google Scholar] [CrossRef]
  5. UN Climate Summit. New York Declaration on Forests. 2014. Available online: https://forestdeclaration.org (accessed on 12 June 2025).
  6. IUCN. Bonn Challenge: Progress on Forest Landscape Restoration. 2020. Available online: https://www.bonnchallenge.org (accessed on 12 June 2025).
  7. Ellis, P.W.; Page, A.M.; Wood, S.; Fargione, J.; Masuda, Y.J.; Carrasco Denney, V.; Moore, C.; Kroeger, T.; Griscom, B.; Sanderman, J.; et al. The principles of natural climate solutions. Nat. Commun. 2024, 15, 547. [Google Scholar] [CrossRef]
  8. Almeida, D.; Broadbent, E.N.; Zambrano, A.M.A.; Wilkinson, B.E.; Ferreira, M.E.; Chazdon, R.; Meli, P.; Gorgens, E.; Silva, C.A.; Stark, S.C.; et al. Monitoring the structure of forest restoration plantations with a drone-lidar system. Int. J. Appl. Earth Obs. Geoinf. 2019, 79, 192–198. [Google Scholar] [CrossRef]
  9. Brancalion, P.H.; Chazdon, R.L. Beyond hectares: Four principles to guide reforestation in the context of tropical forest and landscape restoration. Restor. Ecol. 2017, 25, 491–496. [Google Scholar] [CrossRef]
  10. Smith, C.C.; Espírito-Santo, F.D.; Healey, J.R.; Young, P.J.; Lennox, G.D.; Ferreira, J.; Barlow, J. Secondary forests offset less than 10% of deforestation-mediated carbon emissions in the Brazilian Amazon. Glob. Change Biol. 2020, 26, 7006–7020. [Google Scholar] [CrossRef]
  11. Chazdon, R.L.; Broadbent, E.N.; Rozendaal, D.M.; Bongers, F.; Zambrano, A.M.A.; Aide, T.M.; Balvanera, P.; Becknell, J.M.; Boukili, V.; Brancalion, P.H.; et al. Carbon sequestration potential of second-growth forest regeneration in the Latin American tropics. Sci. Adv. 2016, 2, e1501639. [Google Scholar] [CrossRef]
  12. Lennox, G.D.; Gardner, T.A.; Thomson, J.R.; Ferreira, J.; Berenguer, E.; Lees, A.C.; Mac Nally, R.; Aragão, L.E.; Ferraz, S.F.; Louzada, J.; et al. Second rate or a second chance? Assessing biomass and biodiversity recovery in regenerating Amazonian forests. Glob. Change Biol. 2018, 24, 5680–5694. [Google Scholar] [CrossRef]
  13. Heinrich, V.H.; Dalagnol, R.; Cassol, H.L.; Rosan, T.M.; de Almeida, C.T.; Silva Junior, C.H.; Campanharo, W.A.; House, J.I.; Sitch, S.; Hales, T.C.; et al. Large carbon sink potential of secondary forests in the Brazilian Amazon to mitigate climate change. Nat. Commun. 2021, 12, 1785. [Google Scholar] [CrossRef]
  14. Heinrich, V.H.; Vancutsem, C.; Dalagnol, R.; Rosan, T.M.; Fawcett, D.; Silva-Junior, C.H.; Cassol, H.L.; Achard, F.; Jucker, T.; Silva, C.A.; et al. The carbon sink of secondary and degraded humid tropical forests. Nature 2023, 615, 436–442. [Google Scholar] [CrossRef]
  15. Poorter, L.; Craven, D.; Jakovac, C.C.; Van Der Sande, M.T.; Amissah, L.; Bongers, F.; Chazdon, R.L.; Farrior, C.E.; Kambach, S.; Meave, J.A.; et al. Multidimensional tropical forest recovery. Science 2021, 374, 1370–1376. [Google Scholar] [CrossRef]
  16. Hansen, M.C.; Potapov, P.V.; Moore, R.; Hancher, M.; Turubanova, S.A.; Tyukavina, A.; Thau, D.; Stehman, S.V.; Goetz, S.J.; Loveland, T.R.; et al. High-Resolution Global Maps of 21st-Century Forest Cover Change. Science 2013, 342, 850–853. [Google Scholar] [CrossRef]
  17. MapBiomas. Project MapBiomas, Collection 8.0 of Brazilian Land Cover & Use Map Series; Technical Report; MapBiomas: São Paulo, Brazil, 2024. [Google Scholar]
  18. Vancutsem, C.; Achard, F.; Pekel, J.F.; Vieilledent, G.; Carboni, S.; Simonetti, D.; Gallego, J.; Aragao, L.E.; Nasi, R. Long-term (1990–2019) monitoring of forest cover changes in the humid tropics. Sci. Adv. 2021, 7, eabe1603. [Google Scholar] [CrossRef]
  19. Wagner, F.H.; Dalagnol, R.; Silva-Junior, C.H.L.; Carter, G.; Ritz, A.L.; Hirye, M.C.M.; Ometto, J.P.H.B.; Saatchi, S. Mapping Tropical Forest Cover and Deforestation with Planet NICFI Satellite Images and Deep Learning in Mato Grosso State (Brazil) from 2015 to 2021. Remote Sens. 2023, 15, 521. [Google Scholar] [CrossRef]
  20. Dalagnol, R.; Wagner, F.H.; Galvão, L.S.; Braga, D.; Osborn, F.; da Conceição Bispo, P.; Payne, M.; Junior, C.S.; Favrichon, S.; Silgueiro, V.; et al. Mapping tropical forest degradation with deep learning and Planet NICFI data. Remote Sens. Environ. 2023, 298, 113798. [Google Scholar] [CrossRef]
  21. Csillik, O.; Kumar, P.; Mascaro, J.; O’Shea, T.; Asner, G.P. Monitoring tropical forest carbon stocks and emissions using Planet satellite data. Sci. Rep. 2019, 9, 17831. [Google Scholar] [CrossRef]
  22. de Jong, J.; Poorter, L.; de Jong, W.; Bongers, F.; Lohbeck, M.; Veenendaal, E.; Meave, J.A.; Jakovac, C.C.; Brancalion, P.H.; Amissah, L.; et al. Dissecting forest transition: Contribution of mature forests, second-growth forests and tree plantations to tree cover dynamics in the tropics. Land Use Policy 2025, 153, 107545. [Google Scholar] [CrossRef]
  23. Asner, G.P.; Mascaro, J. Mapping tropical forest carbon: Calibrating plot estimates to a simple LiDAR metric. Remote Sens. Environ. 2014, 140, 614–624. [Google Scholar] [CrossRef]
  24. Lim, K.; Treitz, P.; Wulder, M.; St-Onge, B.; Flood, M. LiDAR remote sensing of forest structure. Prog. Phys. Geogr. 2003, 27, 88–106. [Google Scholar] [CrossRef]
  25. De Almeida, D.R.A.; Broadbent, E.N.; Ferreira, M.P.; Meli, P.; Zambrano, A.M.A.; Gorgens, E.B.; Resende, A.F.; de Almeida, C.T.; Do Amaral, C.H.; Dalla Corte, A.P.; et al. Monitoring restored tropical forest diversity and structure through UAV-borne hyperspectral and lidar fusion. Remote Sens. Environ. 2021, 264, 112582. [Google Scholar] [CrossRef]
  26. de Almeida, D.R.; Vedovato, L.B.; Fuza, M.; Molin, P.; Cassol, H.; Resende, A.F.; Krainovic, P.M.; de Almeida, C.T.; Amaral, C.; Haneda, L.; et al. Remote sensing approaches to monitor tropical forest restoration: Current methods and future possibilities. J. Appl. Ecol. 2025, 62, 188–206. [Google Scholar] [CrossRef]
  27. Lang, N.; Schindler, K.; Wegner, J.D. Country-wide high-resolution vegetation height mapping with Sentinel-2. Remote Sens. Environ. 2019, 233, 111347. [Google Scholar] [CrossRef]
  28. Potapov, P.; Hansen, M.C.; Kommareddy, I.; Kommareddy, A.; Turubanova, S.; Pickens, A.; Adusei, B.; Tyukavina, A.; Ying, Q. Landsat analysis ready data for global land cover and land cover change mapping. Remote Sens. 2020, 12, 426. [Google Scholar] [CrossRef]
  29. Tolan, J.; Yang, H.I.; Nosarzewski, B.; Couairon, G.; Vo, H.V.; Brandt, J.; Spore, J.; Majumdar, S.; Haziza, D.; Vamaraju, J.; et al. Very high resolution canopy height maps from RGB imagery using self-supervised vision transformer and convolutional decoder trained on aerial lidar. Remote Sens. Environ. 2024, 300, 113888. [Google Scholar] [CrossRef]
  30. Song, H.; Zhang, X.; Hu, T.; Liu, J.; Xu, B. Seasonal Tree Height Dynamic Estimation Using Multi-source Remotely Sensed Data in Shenzhen. J. Remote Sens. 2025, 5, 0379. [Google Scholar] [CrossRef]
  31. Astola, H.; Seitsonen, L.; Halme, E.; Molinier, M.; Lönnqvist, A. Deep neural networks with transfer learning for forest variable estimation using sentinel-2 imagery in boreal forest. Remote Sens. 2021, 13, 2392. [Google Scholar] [CrossRef]
  32. Fayad, I.; Ciais, P.; Schwartz, M.; Wigneron, J.P.; Baghdadi, N.; de Truchis, A.; d’Aspremont, A.; Frappart, F.; Saatchi, S.; Pellissier-Tanon, A.; et al. Vision Transformers, a new approach for high-resolution and large-scale mapping of canopy heights. arXiv 2023, arXiv:2304.11487. [Google Scholar]
  33. Barreras, A.; Alanís de la Rosa, J.A.; Mayorga, R.; Cuenca, R.; Moreno-G, C.; Godínez, C.; Delgado, C.; Soriano-Luna, M.d.l.Á.; George, S.; Aldrete-Leal, M.I.; et al. Spatial predictions of tree density and tree height across Mexico forests using ensemble learning and forest inventory data. Ecol. Evol. 2023, 13, e10090. [Google Scholar] [CrossRef] [PubMed]
  34. Turubanova, S.; Potapov, P.; Hansen, M.C.; Li, X.; Tyukavina, A.; Pickens, A.H.; Hernandez-Serna, A.; Arranz, A.P.; Guerra-Hernandez, J.; Senf, C.; et al. Tree canopy extent and height change in Europe, 2001–2021, quantified using Landsat data archive. Remote Sens. Environ. 2023, 298, 113797. [Google Scholar] [CrossRef]
  35. Wagner, F.H.; Roberts, S.; Ritz, A.L.; Carter, G.; Dalagnol, R.; Favrichon, S.; Hirye, M.C.; Brandt, M.; Ciais, P.; Saatchi, S. Sub-meter tree height mapping of California using aerial images and LiDAR-informed U-Net model. Remote Sens. Environ. 2024, 305, 114099. [Google Scholar] [CrossRef]
  36. Wagner, F.H.; Dalagnol, R.; Carter, G.; Hirye, M.C.; Gill, S.; Takougoum, L.B.S.; Favrichon, S.; Keller, M.; Ometto, J.P.; Alves, L.; et al. High Resolution Tree Height Mapping of the Amazon Forest using Planet NICFI Images and LiDAR-Informed U-Net Model. arXiv 2025, arXiv:2501.10600. [Google Scholar]
  37. Schwartz, M.; Ciais, P.; Ottlé, C.; De Truchis, A.; Vega, C.; Fayad, I.; Brandt, M.; Fensholt, R.; Baghdadi, N.; Morneau, F.; et al. High-resolution canopy height map in the Landes forest (France) based on GEDI, Sentinel-1, and Sentinel-2 data with a deep learning approach. Int. J. Appl. Earth Obs. Geoinf. 2024, 128, 103711. [Google Scholar] [CrossRef]
  38. LeCun, Y.; Bengio, Y.; Hinton, G. Deep learning. Nature 2015, 521, 436–444. [Google Scholar] [CrossRef]
  39. Planet Team. Planet Application Program Interface: In Space for Life on Earth; Planet Team: San Francisco, CA, USA, 2017. [Google Scholar]
  40. Pandey, P.; Kington, J.; Kanwar, A.; Curdoglo, M. Addendum to Planet Basemaps. Product Specifications; NICFI Basemaps. v02; NICFI Basemaps: Oslo, Norway, 2021. [Google Scholar]
  41. Ronneberger, O.; Fischer, P.; Brox, T. U-Net: Convolutional Networks for Biomedical Image Segmentation. arXiv 2015. [Google Scholar] [CrossRef]
  42. CTrees.org. REDD+AI: Tree Cover Loss and Degradation from Logging, Fire and Roads in Tropical Forests—v 1.0. 2024. Available online: https://ctrees.org/REDDAI (accessed on 5 August 2025).
  43. da Rosa, P.A.; Breunig, F.M.; de Almeida, C.M.; Balbinot, R. Dinâmica de fragmentos florestais no noroeste do Rio Grande do Sul. Geogr. Ensino Pesqui. 2017, 21, 177–189. [Google Scholar] [CrossRef]
  44. Turnbull, J.W. Eucalypt plantations. New For. 1999, 17, 37–52. [Google Scholar] [CrossRef]
  45. Alvares, C.A.; Stape, J.L.; Sentelhas, P.C.; Gonçalves, J.d.M.; Sparovek, G. Köppen’s climate classification map for Brazil. Meteorol. Z. 2013, 22, 711–728. [Google Scholar] [CrossRef]
  46. Beck, H.E.; Zimmermann, N.E.; McVicar, T.R.; Vergopolan, N.; Berg, A.; Wood, E.F. Present and future Köppen-Geiger climate classification maps at 1-km resolution. Sci. Data 2018, 5, 180214. [Google Scholar] [CrossRef] [PubMed]
  47. Mouselimis, L. PlanetNICFI: Processing of the ‘Planet NICFI’ Satellite Imagery Using R; R Package Version 1.0.4; Planet Labs Inc.: San Francisco, CA, USA, 2022. [Google Scholar]
  48. Planet. Planet Imagery Product Specifications; Planet Labs: San Francisco, CA, USA, 2021; p. 91. [Google Scholar]
  49. Farr, T.G.; Rosen, P.A.; Caro, E.; Crippen, R.; Duren, R.; Hensley, S.; Kobrick, M.; Paller, M.; Rodriguez, E.; Roth, L.; et al. The shuttle radar topography mission. Rev. Geophys. 2007, 45, 1–33. [Google Scholar] [CrossRef]
  50. R Core Team. R: A Language and Environment for Statistical Computing; R Foundation for Statistical Computing: Vienna, Austria, 2025. [Google Scholar]
  51. GDAL/OGR Contributors. GDAL/OGR Geospatial Data Abstraction Software Library; Open Source Geospatial Foundation: Beaverton, OR, USA, 2025. [Google Scholar]
  52. Hijmans, R.J. terra: Spatial Data Analysis. R Package Version 1.7-46. 2023. Available online: https://CRAN.R-project.org/package=terra (accessed on 9 June 2025).
  53. Hijmans, R.J. raster: Geographic Data Analysis and Modeling. R Package Version 3.0-2. 2019. Available online: https://CRAN.R-project.org/package=raster (accessed on 9 June 2025).
  54. Pebesma, E.; Bivand, R. Spatial Data Science: With Applications in R; Chapman and Hall/CRC: London, UK, 2023. [Google Scholar] [CrossRef]
  55. Pebesma, E. Simple Features for R: Standardized Support for Spatial Vector Data. R J. 2018, 10, 439–446. [Google Scholar] [CrossRef]
  56. Zeileis, A.; Grothendieck, G. zoo: S3 Infrastructure for Regular and Irregular Time Series. J. Stat. Softw. 2005, 14, 1–27. [Google Scholar] [CrossRef]
  57. Chollet, F. Keras. 2015. Available online: https://keras.io (accessed on 5 August 2025).
  58. Allaire, J.; Chollet, F. keras: R Interface to ‘Keras’. R Package Version 2.13.0.9000. 2016. Available online: https://tensorflow.rstudio.com/ (accessed on 9 June 2025).
  59. Allaire, J.; Tang, Y. tensorflow: R Interface to ‘TensorFlow’. R Package Version 2.13.0. 2023. Available online: https://CRAN.R-project.org/package=tensorflow (accessed on 9 June 2025).
  60. Abadi, M.; Agarwal, A.; Barham, P.; Brevdo, E.; Chen, Z.; Citro, C.; Corrado, G.S.; Davis, A.; Dean, J.; Devin, M.; et al. TensorFlow: Large-Scale Machine Learning on Heterogeneous Systems. 2015. Available online: https://www.tensorflow.org/ (accessed on 5 August 2025).
  61. QGIS Development Team. QGIS Geographic Information System; Open Source Geospatial Foundation: Beaverton, OR, USA, 2025. [Google Scholar]
  62. Pinto, C.B.; Marques, R.; Dalmaso, C.A.; de Souza Kulmann, M.S.; Deliberali, I.; Schumacher, M.V.; de Oliveira Junior, J.C. Relationship between edaphoclimatic attributes and productivity of loblolly pine (Pinus taeda L.) in southern Brazil. For. Ecol. Manag. 2023, 544, 121162. [Google Scholar] [CrossRef]
  63. IBÁ. Relatorio Anual 2022; Relatorio; Industria Brasileira de Arvores: São Paulo, Brazil, 2022. [Google Scholar]
  64. Laclau, J.P.; Almeida, J.C.; Gonçalves, J.L.M.; Saint-Andre, L.; Ventura, M.; Ranger, J.; Moreira, R.M.; Nouvellon, Y. Influence of nitrogen and potassium fertilization on leaf lifespan and allocation of above-ground growth in Eucalyptus plantations. Tree Physiol. 2009, 29, 111–124. [Google Scholar] [CrossRef]
  65. Da Silva, R.M.L.; Hakamada, R.E.; Bazani, J.H.; Otto, M.S.G.; Stape, J.L. Fertilization Response, Light Use, and Growth Efficiency in Eucalyptus Plantations across Soil and Climate Gradients in Brazil. Forests 2016, 7, 117. [Google Scholar] [CrossRef]
  66. Lisi, C.S.; Fo, M.T.; Botosso, P.C.; Roig, F.A.; Maria, V.R.; Ferreira-Fedele, L.; Voigt, A.R. Tree-ring formation, radial increment periodicity, and phenology of tree species from a seasonal semi-deciduous forest in southeast Brazil. Iawa J. 2008, 29, 189–207. [Google Scholar] [CrossRef]
  67. Di Francescantonio, D.; Villagra, M.; Goldstein, G.; Campanello, P.I. Leaf phenology and water-use patterns of canopy trees in Northern Argentinean subtropical forests. Tree Physiol. 2018, 38, 1841–1854. [Google Scholar] [CrossRef]
  68. Pennington, R.T.; Lavin, M.; Oliveira-Filho, A. Woody plant diversity, evolution, and ecology in the tropics: Perspectives from seasonally dry tropical forests. Annu. Rev. Ecol. Evol. Syst. 2009, 40, 437–457. [Google Scholar] [CrossRef]
  69. Leite, P.F.; Klein, R.M. Vegetação. Geogr. Bras. Reg. Sul 1990, 2, 113–150. [Google Scholar]
  70. Schaaf, C.B.; Gao, F.; Strahler, A.H.; Lucht, W.; Li, X.; Tsang, T.; Strugnell, N.C.; Zhang, X.; Jin, Y.; Muller, J.P.; et al. First operational BRDF, albedo nadir reflectance products from MODIS. Remote Sens. Environ. 2002, 83, 135–148. [Google Scholar] [CrossRef]
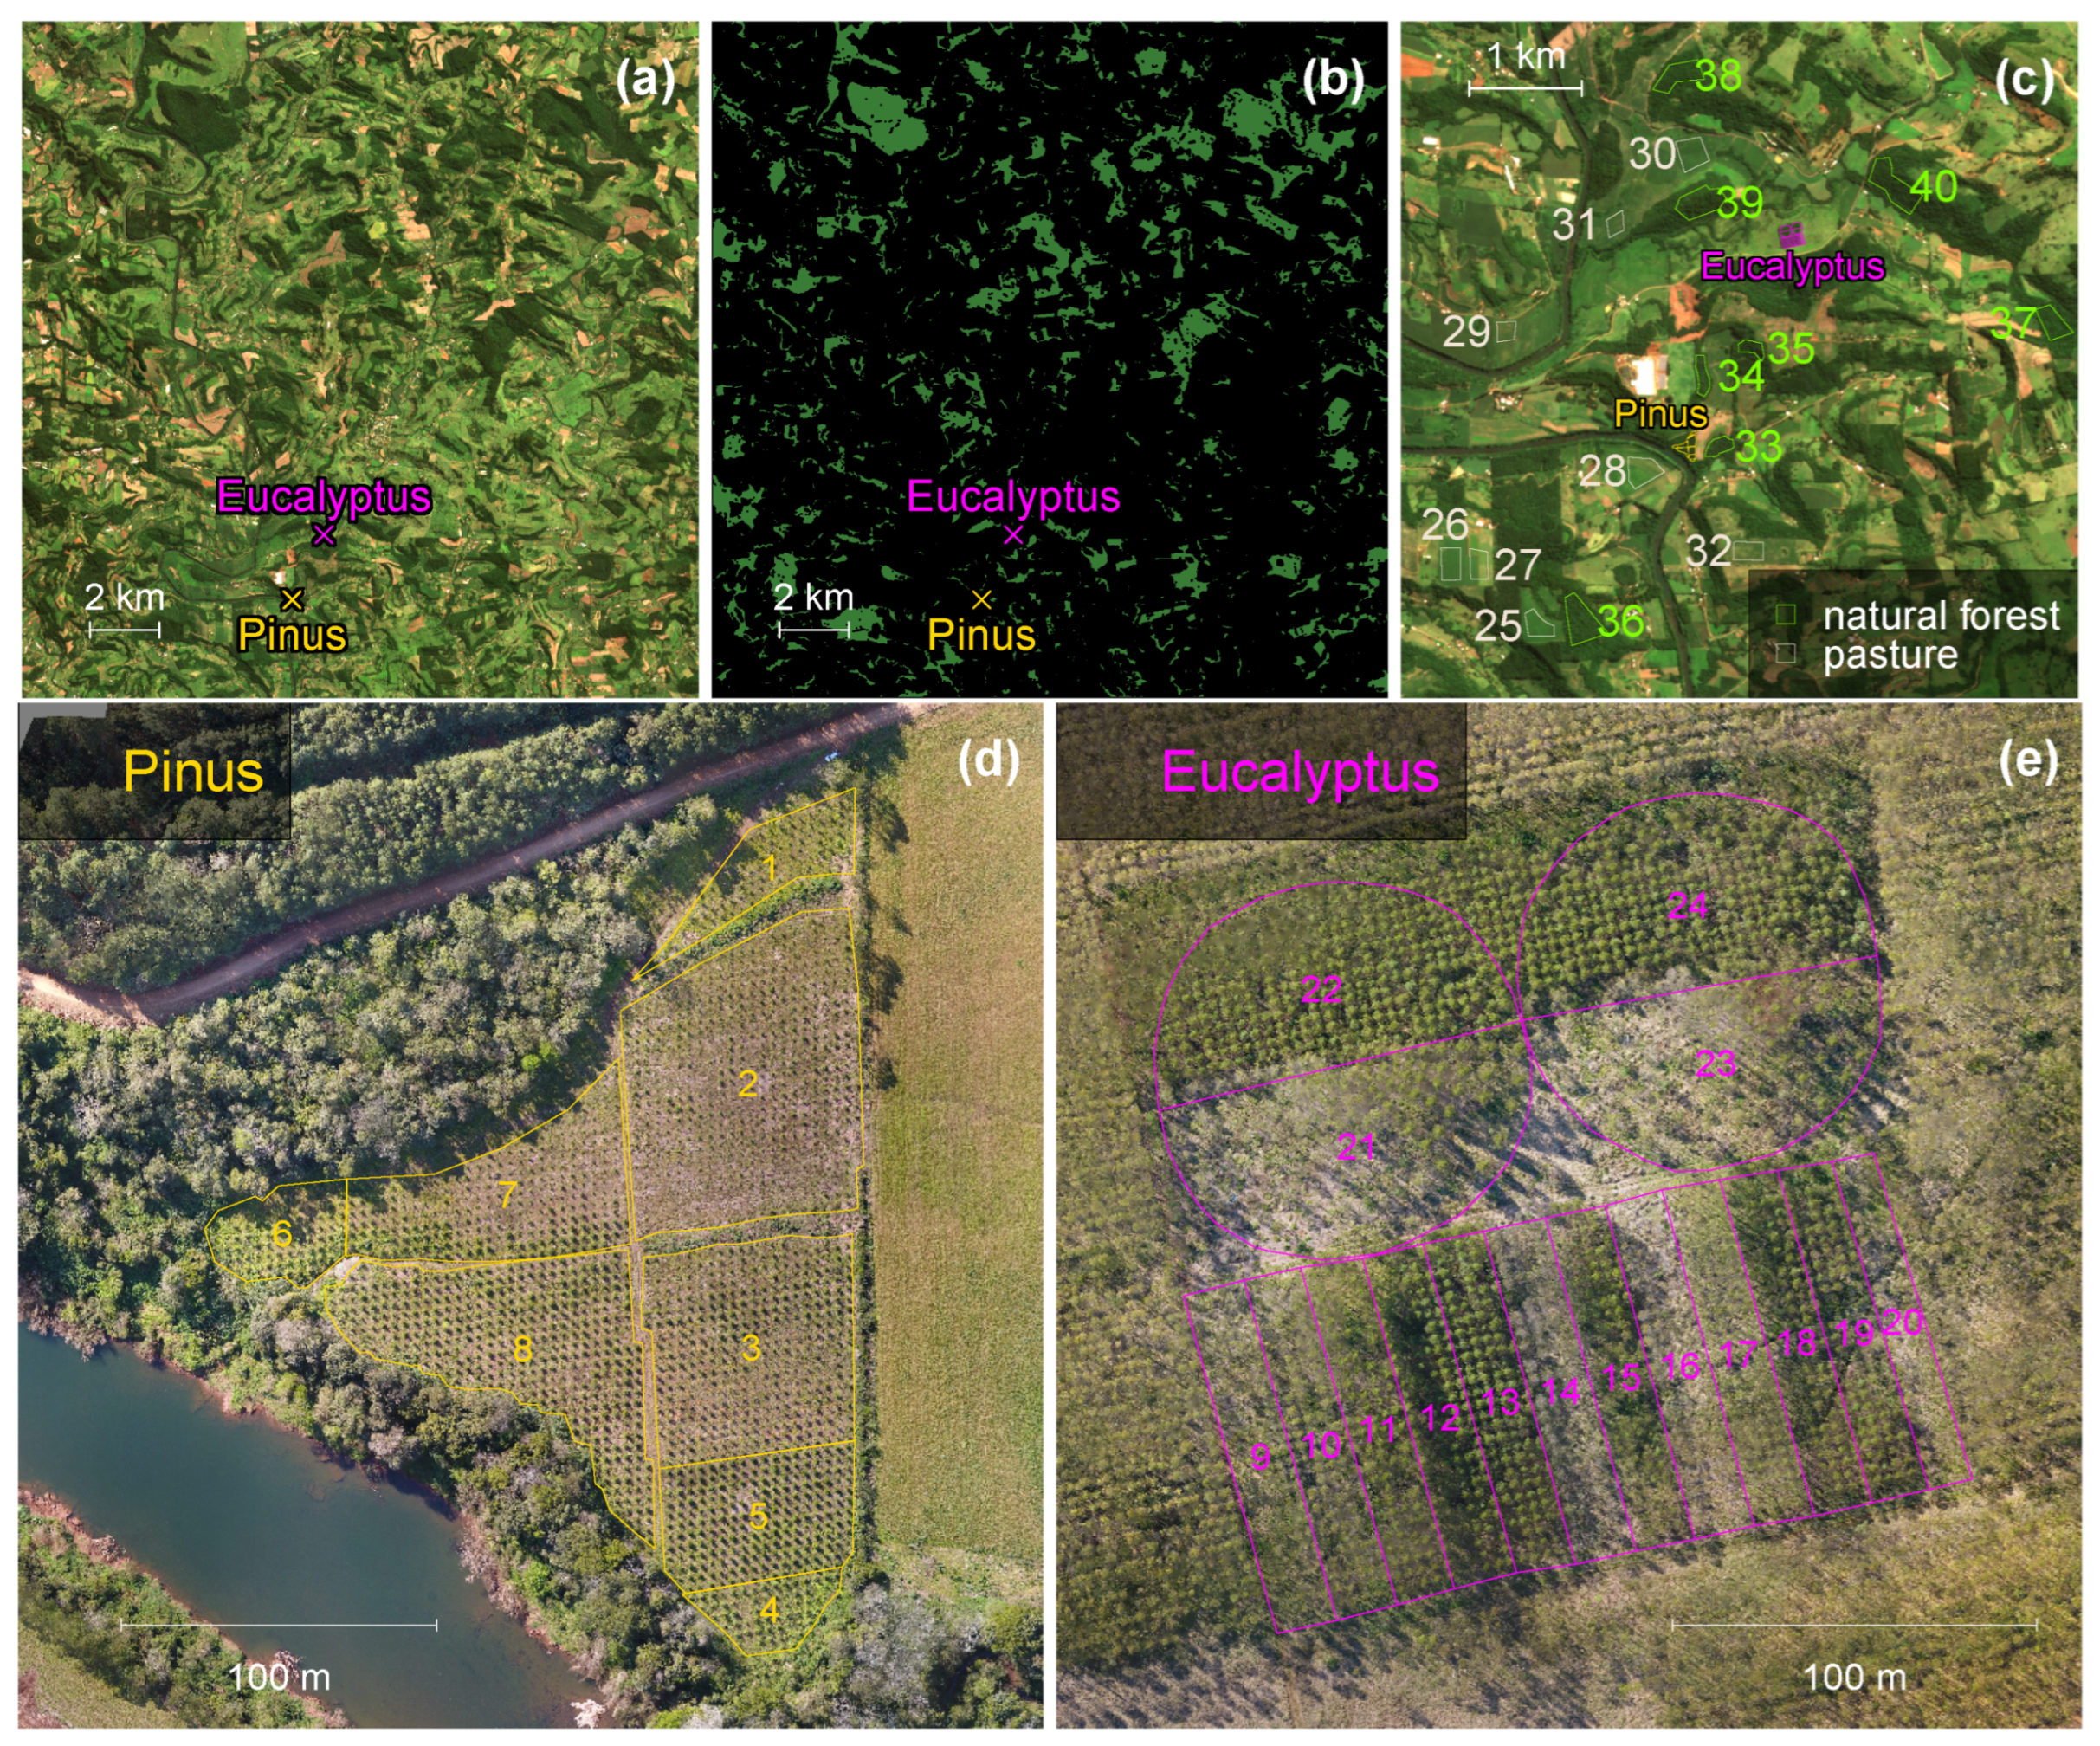
Figure 1. Planet quad 0720–0864 covering the region of interest (a). Forests present throughout the entire NICFI time series from December 1, 2015 to May 1, 2025 with a buffer of −15 m are shown in dark green (b). Sub-image corresponding of the square in (a,b) showing selected areas of pasture, natural forest, their IDs, and the two planted study sites (c). IDs of the individual planted Pinus polygones (d) and Eucalyptus polygones (e) overlayed on the UAV images adquired on 28 August 2019.
Remotesensing 17 02718 g001
Figure 2. Seasonal variation in canopy height by slope and orientation for stable forest for the monthly canopy height observation on the period 1 May 2021 to 1 April 2025. Each panel represents one of the eight compass-based orientation classes. Colored lines show fitted seasonal trends in median height for each slope class. Points represent observed median height values per acquisition date. Each sub-figure (slope × orientation classes) contains 14,884 pixels. The R2 of the fitted seasonal model is 0.8225.
Remotesensing 17 02718 g002
Figure 3. Monthly time series for the year 2021 of the Planet NICFI RGB band composite at 5 m spatial resolution for the Pinus plantations. Each panel (al) corresponds to a different month from January to December 2021. For visualization purposes, the same equalization with min–max stretching between 0 and 255 for each RGB band was applied. Note that the resolution of the image is the original 4.78 m Planet NICFI image that is used to predict the canopy height. Green arrows indicate a region affected by registration shift, and yellow polygons are the Pinus plantation parcels.
Remotesensing 17 02718 g003
Figure 4. Monthly time series for the year 2024 of the Planet NICFI RGB band composite at 5 m spatial resolution for the Eucalyptus plantations. Each panel (al) corresponds to a different month from January to December 2024. For visualization purposes, the same equalization with min-max stretching between 0 and 255 for each RGB band was applied. Note that the resolution of the image is the original 4.78 m Planet NICFI image that is used to predict the canopy height. Green arrows indicate a region affected by registration shift, and magenta polygons are the Eucalyptus plantation parcels.
Remotesensing 17 02718 g004
Figure 5. Observed canopy height model obtained from the UAV flights for the Pinus plantations (ah) and Eucalyptus plantations (ip). Eucalyptus data for 2022 (o) were lost.
Remotesensing 17 02718 g005
Figure 6. Time series of mean canopy height (m) from 1 December 2015 to 1 May 2025 across 40 parcels of Pinus (plots 1–8), Eucalyptus (plots 9–24), pasture (plots 25–32), and natural forest (plots 33–40). Black points with error bars show mean ± 1 SD of model-predicted canopy height, while green points indicate mean ± 1 SD of field observations of canopy height. Triangles indicate planting dates. Gray crosses denote the presence of clouds. The blue line represents the rolling mean of predictions using 12-month and aligned with the central date.
Remotesensing 17 02718 g006
Table 1. Comparison of model height predictions and field observations by plantation type and date at the parcel level. Meanfield is the mean of the field value and Meanmodel is the mean of the estimated value using a ±3-month window to account for variability. Quantitative metrics include number of samples (n), mean observed and predicted height (Meanfield and Meanmodel), Mean Absolute Error (MAE), Root Mean Square Error (RMSE), bias (mean difference), paired t-test statistic (t) and p-value. Significant biases (p < 0.05) are in bold. The null hypothesis (H0) states that the mean difference between model and field estimates is zero, and a p-value below 0.05 indicates a significant bias, allowing rejection of H0.
Forest TypeField DatenMeanfieldMeanmodelMAERMSEBiastp-Value
Pinus1 June 201780.070.270.230.350.201.860.105
Pinus1 August 201780.010.270.260.410.262.110.073
Pinus1 November 201780.100.100.120.160.000.070.945
Pinus1 September 201880.070.680.620.770.623.500.010
Pinus1 August 201980.061.050.991.110.995.190.001
Pinus1 June 202182.973.600.771.010.642.150.069
Pinus1 September 202286.286.050.791.05−0.23−0.590.575
Pinus1 May 202588.997.442.002.52−1.55−2.060.079
Eucalyptus1 June 2017160.210.670.460.690.463.430.004
Eucalyptus1 August 2017160.300.670.400.620.372.890.011
Eucalyptus1 November 2017161.103.162.062.612.064.980.000
Eucalyptus1 September 2018163.763.211.942.44−0.55−0.900.383
Eucalyptus1 August 2019164.653.482.343.03−1.17−1.620.127
Eucalyptus1 June 20211613.004.658.328.96−8.32−9.64<0.001
Eucalyptus1 May 2025168.627.241.932.97−1.38−2.030.061
Disclaimer/Publisher’s Note: The statements, opinions and data contained in all publications are solely those of the individual author(s) and contributor(s) and not of MDPI and/or the editor(s). MDPI and/or the editor(s) disclaim responsibility for any injury to people or property resulting from any ideas, methods, instructions or products referred to in the content.