Article

An Underground Goaf Locating Framework Based on D-InSAR with Three Different Prior Geological Information Conditions

1
Key Laboratory of Land Environment and Disaster Monitoring, Ministry of Natural Resources (MNR), China University of Mining and Technology (CUMT), Xuzhou 221116, China
2
School of Environment Science and Spatial Informatics, China University of Mining and Technology (CUMT), Xuzhou 221116, China
3
State Key Laboratory of Intelligent Construction and Healthy Operation and Maintenance of Deep Underground Engineering, China University of Mining and Technology (CUMT), Xuzhou 221116, China
4
Guizhou First Institute of Surveying and Mapping, Guiyang 550001, China
*
Author to whom correspondence should be addressed.
Remote Sens. 2025, 17(15), 2714; https://doi.org/10.3390/rs17152714
Submission received: 1 July 2025 / Revised: 1 August 2025 / Accepted: 2 August 2025 / Published: 5 August 2025

Abstract

Illegal mining operations induce cascading ecosystem degradation by causing extensive ground subsidence, necessitating accurate underground goaf localization for effectively induced-hazard mitigation. The conventional locating method applied the synthetic aperture radar interferometry (InSAR) technique to obtain ground deformation to estimate underground goaf parameters, and the locating accuracy was crucially contingent upon the appropriateness of nonlinear deformation function models selection and the precision of geological parameters acquisition. However, conventional model-driven underground goaf locating frameworks often fail to sufficiently integrate prior geological information during the model selection process, potentially leading to increased positioning errors. In order to enhance the operational efficiency and locating accuracy of underground goaf, deformation model selection must be aligned with site-specific geological conditions under varying cases of prior information. To address these challenges, this study categorizes prior geological information into three different hierarchical levels (detailed, moderate, and limited) to systematically investigate the correlations between model selection and prior information. Subsequently, field validation was carried out by applying two different non-linear deformation function models, Probability Integral Model (PIM) and Okada Dislocation Model (ODM), with three different prior geological information conditions. The quantitative performance results indicate that, (1) under a detailed prior information condition, PIM achieves enhanced dimensional parameter estimation accuracy with 6.9% reduction in maximum relative error; (2) in a moderate prior information condition, both models demonstrate comparable estimation performance; and (3) for a limited prior information condition, ODM exhibits superior parameter estimation capability showing 3.4% decrease in maximum relative error. Furthermore, this investigation discusses the influence of deformation spatial resolution, the impacts of azimuth determination methodologies, and performance comparisons between non-hybrid and hybrid optimization algorithms. This study demonstrates that aligning the selection of deformation models with different types of prior geological information significantly improves the accuracy of underground goaf detection. The findings offer practical guidelines for selecting optimal models based on varying information scenarios, thereby enhancing the reliability of disaster evaluation and mitigation strategies related to illegal mining.

1. Introduction

The total global coal production surpassed 9 billion tons in 2024, with China contributing over 52% of the total output [1]. This underscores coal’s persistent dominance as the primary global energy resource and the substantial economic incentives driving mining activities. This phenomenon explains why illegal mining activities are globally prevalent, particularly in China [2]. According to official data released by the Ministry of Natural Resources of the People’s Republic of China (MNR), over 20 illegal mining incidents have been documented in recent years, resulting in fatalities and large-scale ground subsidence accompanied by land collapse [3,4,5]. The particular concern is not only active illegal mining areas but also numerous unrecorded historic closed underground goaves, which pose a significant environmental threat globally as well. A peer-reviewed study in ‘Nature’ revealed that more than 56% of global underground goaves remain unrecorded in official documents [6]. Consequently, it is a critical imperative to detect and locate underground goaves, especially unrecorded ones.
Traditional approaches for underground space detection predominantly rely on geophysical and geochemical methodologies, such as microgravimetric analysis [7], electromagnetic induction [8], ground-penetrating radar [8], noble gas monitoring, and thermometric techniques. While these methods achieve high precision accuracy in spatial coordinate determination and cavity dimension characterization, their practical implementation faces three critical constraints: (1) limited scalability in intellectualization, (2) elevated labor intensity, and (3) temporal inefficiency during extended surveys. Significantly, recent investigations reveal that numerous unrecorded underground goaves are extensively distributed widely across mining industrial areas [6]. Consequently, the geospatial mapping of these unrecorded underground goaves across multi-kilometer scales through conventional geophysical/geochemical methodologies presents prohibitively resource-intensive processes, particularly when operationalizing field activity under constrained temporal budgets.
In contrast with these traditional approaches, satellite-based Interferometric Synthetic Aperture Radar (InSAR) technology enables continuous large-area monitoring with superior operational efficiency and cost-effectiveness [9]. These technical advantages have established InSAR as a pre-eminent tool for detecting and analyzing diverse geohazards, ranging from seismic events and volcanic activity to slope instability, underground mining-induced deformation, and coal fire recognition [10,11,12,13,14,15,16].
The current InSAR-based underground goaf locating framework can be summarized in two steps. First, the InSAR technique is used to estimate the line-of-sight (LOS) ground displacement [17]. Then some studies directly use spatial geometric relationships to roughly locate underground goaf [17,18] and show significant computational efficiency. However, these methods are poorly robust and are not applicable under supercritical extraction conditions due to over-reliance on the extraction and analysis of subsidence profile information. Addressing this limitation, a theoretical model-driven methodology for goaf localization is established. This category of methods locates underground goaf through constructing a nonlinear theoretical model, generally based on mathematical or mechanical principles, to fit the relationship between underground goaf and ground deformation and applying intelligent optimization algorithms to iteratively minimize the fit effect. The optimal parameters after iteration are considered as the final locating result [19]. To make this framework applicable to more situations, many studies improved the theoretical model. Wang et al. integrated probability density functions with probabilistic integral models (PIMs), developing a new improved probabilistic integral model (IPIM) to adapt to deep small deformation cases [20]. Zhang et al. considered that the probabilistic integral model requires too many geological parameters and applied the Okada Dislocation Model (ODM) for underground goaf locating, successfully locating the underground goaf [21,22].
However, existing InSAR-based model-driven underground goaf locating frameworks have demonstrated significant limitations in adequately integrating prior geological information during the model selection process. Additionally, these frameworks often lack a comprehensive theoretical performance evaluation under varying geological conditions, leading to locating errors. Actually, it is essential to note that the two theoretical models are both constrained by geological conditions. Specifically, PIM necessitates multi-dimensional geologic parameters as references, while ODM simplifies the coal overlying strata into a single, homogeneous unit [23,24]. This highlights the performance disparity between the two models under different prior geological information conditions. Consequently, a robust and quantitative evaluation of the model’s applicability under diverse geological conditions is imperative. In response to this challenge, we systematically evaluated the performance of PIM and ODM under three distinct levels of prior geological information, namely, detailed, moderate, and limited, within the InSAR-based model-driven framework.
Specifically, in this study, the framework was implemented following the steps outlined below: (1) selection of two typical mining working faces with comprehensive drilling data as the study area; (2) application of the Differential InSAR (D-InSAR) technique to capture mining-induced ground deformation; (3) definition of the azimuth values and range of geometric parameters for underground goaf based on the InSAR-derived deformation data; and (4) application of both PIM and ODM models for goaf location using a Genetic Algorithm-Particle Swarm Optimization (GA-PSO [25]) method, under the three levels of prior geological information conditions (detailed, moderate, and limited). Based on the related quantitative experiments, the main innovations of this study are summarized as follows:
(1) Quantitative evaluation for model applicability in different prior information. Quantifying the suitability of these two models under different conditions is fundamental for ensuring their reliability in operational applications. To this end, this study uses an InSAR-derived deformation dataset and theoretical-model-driven underground goaf locating framework to systematically quantify the performance of different models under three different prior information conditions in real situations, which indicates that PIM performs better in the detailed information condition, while ODM performs better in the limited information condition, and the two models perform similarly in the moderate condition. The validation results further establish a reference for an underground goaf locating problem.
(2) Systematic performance analysis of critical factors. In order to evaluate the performance of the underground goaf locating framework applied in this paper, three critical operational factors are quantitatively investigated: the impact of SAR spatial resolution on goaf locating accuracy, the influence of determining azimuth in advance, and comparisons of non-hybrid optimization algorithms.
This manuscript adopts the following organizational structure: Section 2 delineates the geographical context and data sources, while Section 3 elucidates the methodological framework. Section 4 systematically examines experimental outcomes derived from both simulated environments and empirical observations. The culminating Section 5 and Section 6 respectively provide a critical synthesis of findings and overarching summative conclusions.

2. Study Area and Datasets

As shown in Figure 1, the investigations were conducted in the Fengfeng Coalfield, located in Southern Hebei Province (113°15′–114°30′E, 36°03′–36°50′N), China. Area I corresponds to the 132,610 working faces and Area II corresponds to the 15,325 working faces. (In China, these numbers represent the spatial coding of the working faces. The coding rules follow the sequence: mining area, sub-mining area, coal seam, section, serial number). Both study areas were processed using the same series of SAR image orbits, as they are sufficiently close to be covered by identical imaging swaths. The Fengfeng Coalfield is situated within the North China coalfield, where the primary coal seams include the Shanxi and Taiyuan Formations, with an annual raw coal production exceeding 15 million tons. This region has been extensively mined, resulting in numerous abandoned goaves. Additionally, the study area is characterized by faults and other geological structures influenced by the Taihang Mountain fault zone. Specifically, the following geometric parameters (strike length, dip length, thickness, depth, azimuth, and inclination) of Area I and II are presented as follows: ({291 m, 165 m, 4.5 m, 774 m, 169°, 31°} ∈ Area I and {493 m, 142 m, 4.5 m, 740 m, 236°, 13°} ∈ Area II).
Previous studies have demonstrated that high-precision ground deformation data are essential for accurate underground goaf localization [20]. Furthermore, the spatial resolution of SAR data is a critical factor influencing the quality of InSAR deformation monitoring. RADARSAT-2, a C-band commercial SAR sensor with a spatial resolution of 3 m, is particularly effective for monitoring small-scale deformations in mining areas. Consequently, RADARSAT-2 data were utilized in this study. As presented in Table 1, six temporally sequential ascending RADARSAT-2 acquisitions (13 October 2015 to 5 March 2016; their orbit IDs are as follows: 427956, 433878, 439472, 444822, 450248, 461088) encompassing the active coal mining interval were applied to interferometric processing for ground deformation estimation. The 30 m resolution SRTM Digital Elevation Model was applied for topographic phase removal during data processing. Atmospheric phase distortions were considered insignificant due to the constrained spatial coverage of the monitored area. Systematic orbital phase errors were mitigated through rigorous orbit corrections compliant with RADARSAT-2’s operational calibration protocols. Phase unwrapping was subsequently implemented using the minimum cost flow algorithm to obtain the deformation phases. The derived displacement signals were ultimately transformed into georeferenced products aligned with the WGS-84 geographic reference framework.

3. Technical Principles

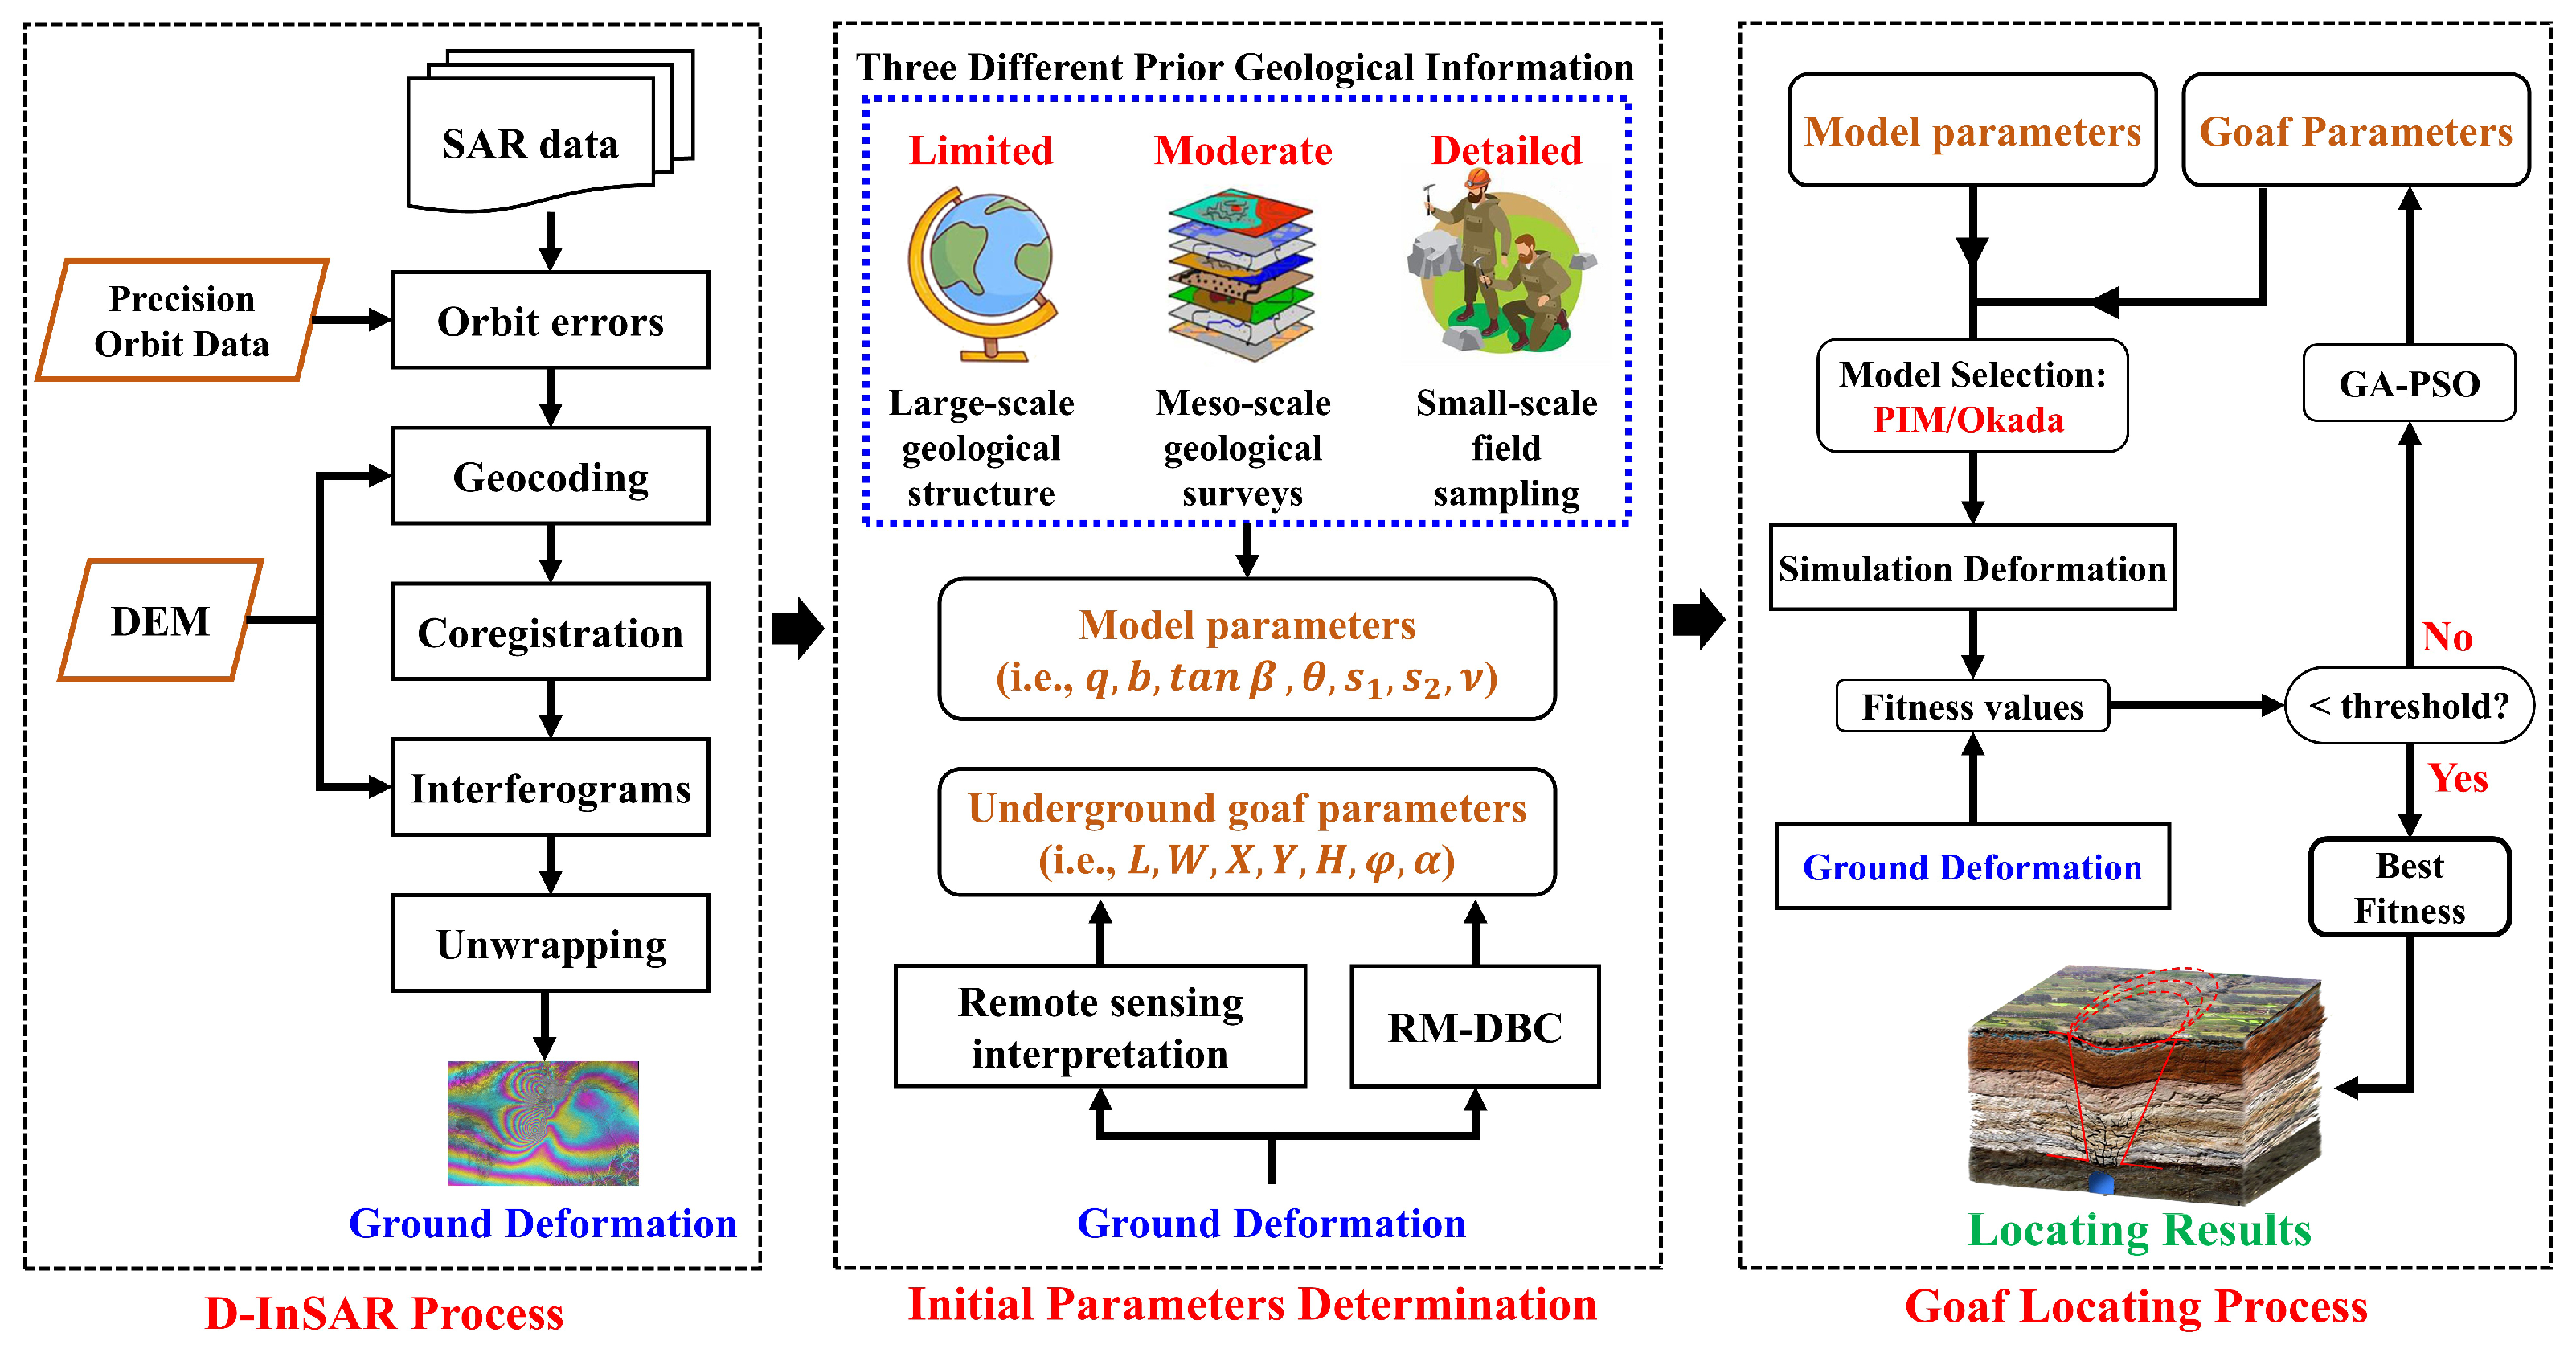
Figure 2 depicts the multi-stage locating framework comprising four principal computational phases:
  • Time-series line-of-sight (LOS) deformation retrieval through D-InSAR process (Differential Interferometric Synthetic Aperture Radar);
  • Model parameter definition under three different prior geological information conditions (detailed/moderate/limited);
  • Use the RM-DBC for estimating azimuth and establishing constraint boundaries of PIM and ODM;
  • Estimate other parameters by using the GA-PSO algorithm to estimate goaf parameters.
In the proposed locating framework, the inversion mechanism operates through iterative discrepancy minimization between InSAR-derived deformation fields (serving as ground truth reference) and forward-modeled deformation generated by PIM/ODM simulations with different model parameters under three different prior information conditions.

3.1. Differential InSAR

This investigation employs Differential InSAR (D-InSAR) to monitor surface deformation through sequential SAR image analysis. The methodology leverages satellite-based synthetic aperture radar (SAR) systems that systematically acquire single-look complex (SLC) imagery over target areas at fixed temporal intervals [26]. Interferometric processing involves cross-multiplying co-registered SLC pairs to generate phase-difference maps, where the resultant interferometric phase φ encapsulates five constituent components [27], as follows:
φ = φ d e f + φ t o p + φ f l t + φ a t m + φ n o i
Here, φ d e f quantifies line-of-sight (LOS) deformation, φ t o p corresponds to residual topography, φ f l t denotes flat-earth geometric effects, φ a t m arises from atmospheric delays, and φ n o i represents stochastic noise. The D-InSAR workflow isolates deformation signals by computationally mitigating the latter four non-deformation phase terms.

3.2. Probability Integral Model

The Probability Integral Model (PIM), grounded in stochastic medium mechanics, establishes an analytical framework for simulating subsidence dynamics in mining environments. This approach conceptualizes particulate motion (e.g., fragmented rock or sand) as a spatially uncorrelated stochastic process, enabling subsidence predictions through superposition of differential unit effects. Specifically, the total subsidence is derived by integrating incremental deformations across infinitesimal extraction units within the underground goaf.
For a rectangular goaf defined by the geometric parameters length L, width D, mining height m, dip angle δ , azimuth angle φ , mining depth H, and central geodetic coordinates ( X , Y ) , the three-dimensional ground surface displacements induced by coal mining along the direction of vertical d u ( x , y ) , north d n ( x , y ) , and east d e ( x , y ) at the point ( x , y ) can be formulated as
d u ( x , y ) = W 0 ( x ) W 0 ( y ) m q cos δ , d e ( x , y , α ) = U 0 ( x ) W 0 ( y ) cos α + U 0 ( y ) W 0 ( x ) sin α m q cos δ , d n ( x , y , φ ) = U 0 ( x ) W 0 ( y ) cos φ + U 0 ( y ) W 0 ( x ) sin φ m q cos δ .
with
W 0 ( x ) = m q cos δ 2 erf π tan β H x erf π tan β H ( x l 1 ) , W 0 ( y ) = m q cos δ 2 erf π tan β H 1 y erf π tan β H 2 ( y l 2 ) , U 0 ( x ) = b · m q cos δ · exp π ( tan β ) 2 H 1 2 x 2 exp π ( tan β ) 2 H 2 ( x l 1 ) 2 , U 0 ( y ) = b · m q cos δ · exp π ( tan β ) 2 H 1 2 y 2 exp π ( tan β ) 2 H 2 2 ( y l 2 ) 2 cot θ 0 · W 0 ( y ) .
l 1 = L 2 s 3 , l 2 = ( D s 1 s 2 ) sin ( θ 0 + δ ) sin θ 0 .
erf ( x ) = 2 π 0 x e u 2 d u
where q represent the subsidence factor, b corresponds to the horizontal displacement factor, θ 0 accounts for the mining propagation angle, β encapsulates the mining major influence and propagation angle, s 3 is the strike offsets to inflection points, and s 2 , s 1 are the goaf lower ribside and upper ribside ones [19,20]. W 0 ( x ) , W 0 ( y ) represent vertical displacements induced by finite extractions along the strike/dip directions, while U 0 ( x ) , U 0 ( y ) characterize horizontal movements.

3.3. Okada Dislocation Model

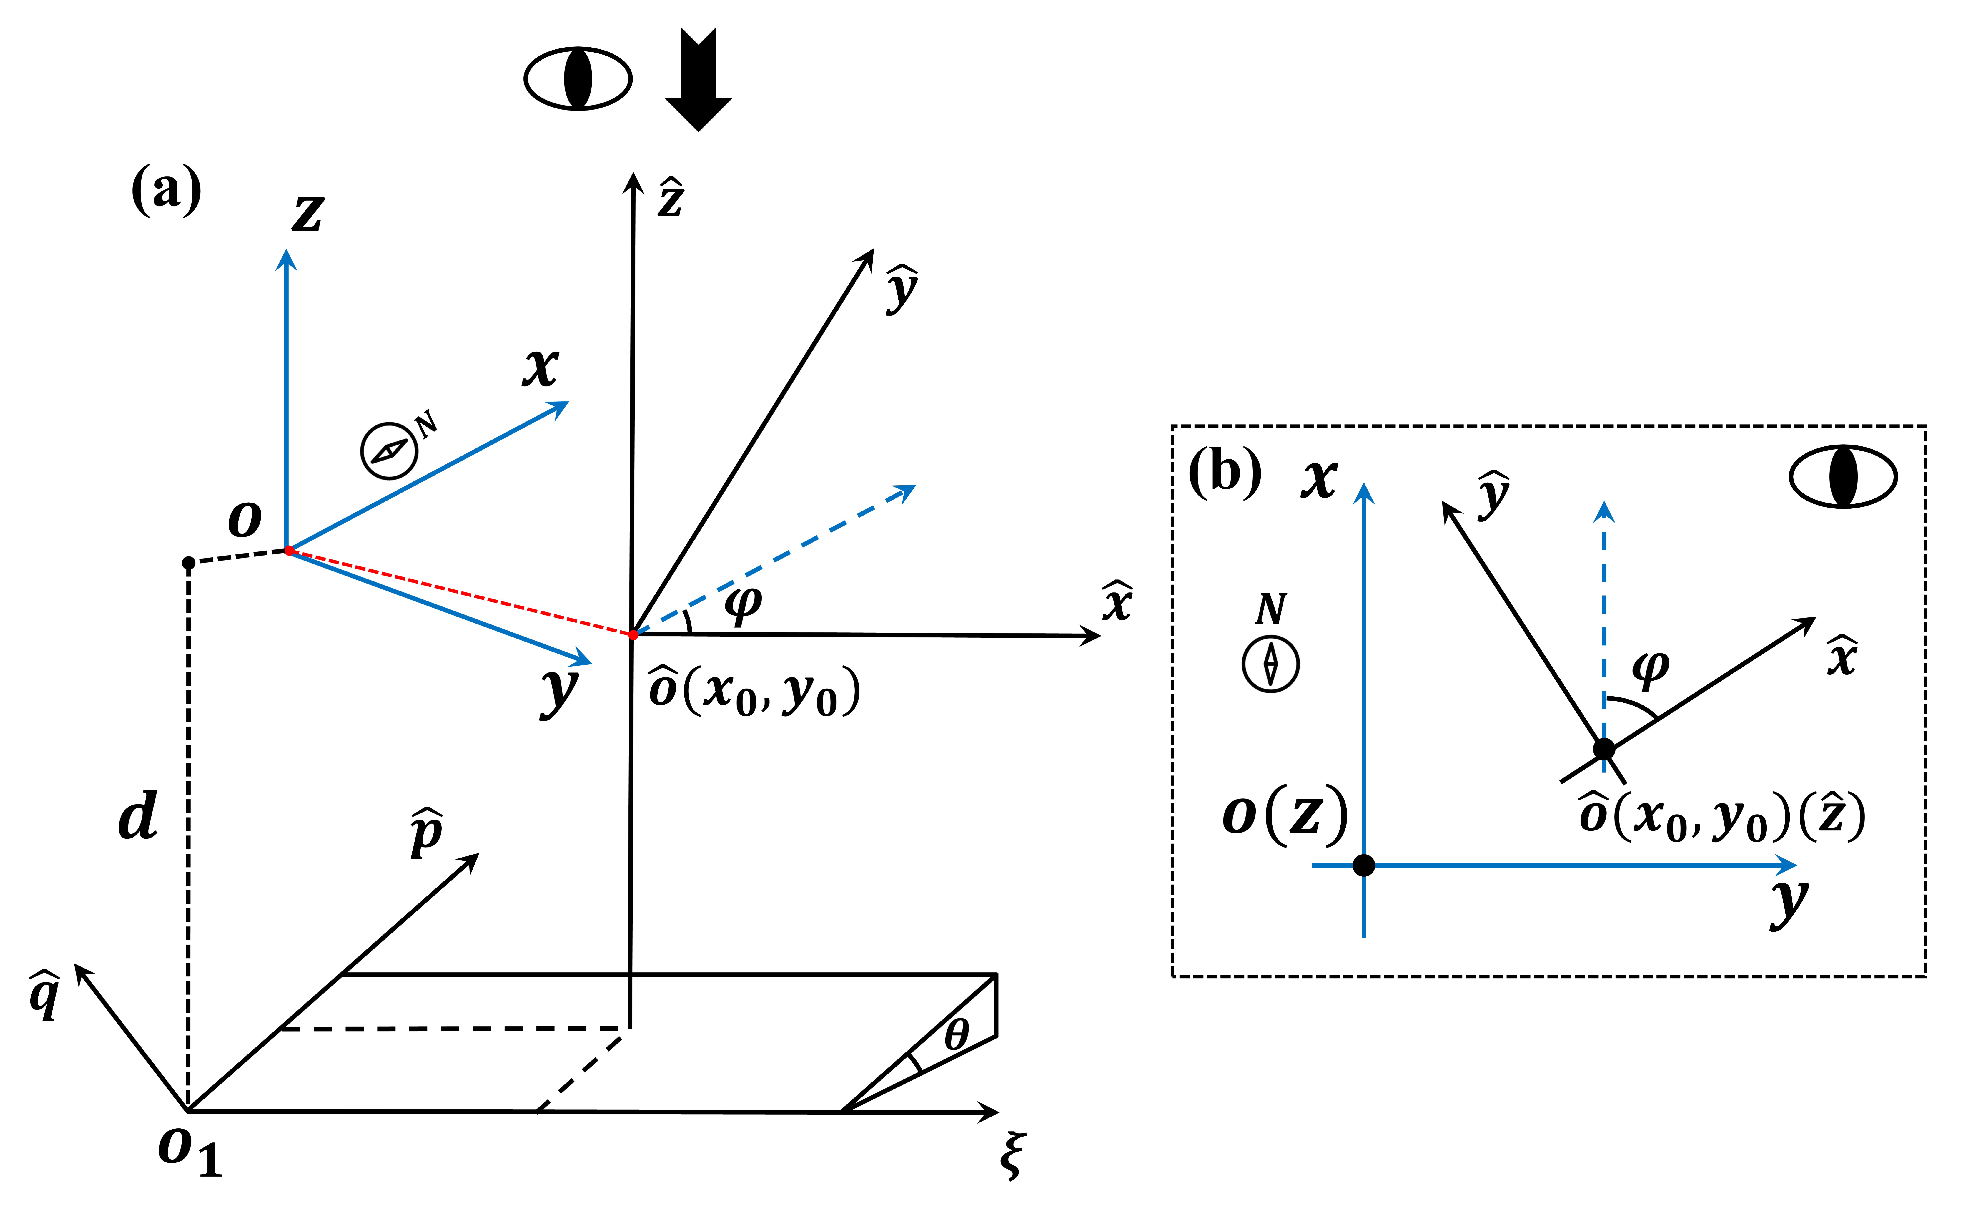
The Okada Dislocation Model (ODM) has become an essential tool for geophysical deformation analysis, particularly in volcanic and seismic investigations [28]. To optimize computational performance, this approach approximates the geological strata as an elastic half-space constrained by free-surface boundary conditions [29]. Given that underground space can be effectively approximated by rectangular dislocation sources, the rectangular-source Okada Dislocation Model is selected in this research. The mapping relationships among multiple coordinate systems for the model computation are illustrated in Figure 3.
The primary geodetic coordinate system ( 0 x y z ) employs a localized Cartesian framework where the x-axis is aligned along a true north, the y-axis is oriented eastward, and the z-axis is defined as vertically upward normal to the xy-plane. The source-oriented ground coordinate system ( o ^ x ^ y ^ z ^ ) maintains specific geometric relationships: its x ^ -axis corresponds to the strike direction of the dislocation, the y ^ -axis aligns with the dip direction, and the z ^ -axis preserves vertical orientation. This system originates at ( x 0 , y 0 ) within ( 0 x y z ) , with angular displacement φ quantifying the azimuthal rotation between the x ^ -axis and the primary geodetic x-axis.
The underground coordinate system o 1 ξ p ^ q ^ characterizes the three-dimensional dislocation geometry through orthogonal axes: the ξ -axis extends along the strike direction, the p ^ -axis follows the dip direction, and the q ^ -axis remains normal to the dislocation plane, where parameter δ specifies the dip angle.
Coordinate transformation between surface systems follows the rotational relationship, as follows:
x ^ , y ^ , z ^ = x x 0 , y y 0 , 0 cos φ sin φ 0 sin φ cos φ 0 0 0 1
For subsurface mapping applications, the origin of o 1 ξ p ^ q ^ corresponds to the bottom-left corner of the underground goaf space at depth d. The corresponding coordinate transformation is derived through geometric projection accounting for both rotational and translational components.
ξ , p , q = x ^ , y ^ , d 1 0 0 0 cos δ sin δ 0 sin δ cos δ
The surface deformation field generated by underground coal mining can be mathematically described through a set of displacement components. Following the Okada dislocation framework, the east–west d e , north–south d n , and vertical d u displacements are expressed as superposition integrals of rectangular dislocation elements [29], as follows:
d e = f x p , q f x p , q W f x p L , q f x p L , q W d n = f y p , q f y p , q W f y p L , q f y p L , q W d u = f z p , q f z p , q W f z p L , q f z p L , q W
with
f x ( x ^ , y ^ ) = U 2 π q 2 R ( R + y ^ ) I 2 sin δ 2 f y ( x ^ , y ^ ) = U 2 π [ y ^ sin δ q cos δ q R ( R + x ^ ) sin δ x ^ q R ( R + y ^ ) tan 1 x ^ y ^ q R ] I 1 sin δ 2 f z ( x ^ , y ^ ) = U 2 π [ ( y ^ sin δ q cos δ ) q R ( R + x ^ ) + cos δ ( x ^ q R ( R + y ^ ) t a n 1 x ^ y ^ q R ) ] I 4 sin δ 2
I 1 = μ λ + μ 1 cos δ ξ R + ( η sin δ q cos δ ) sin δ cos δ I 4 I 2 = μ λ + μ 1 cos δ y ^ cos δ + q sin δ R + ( y ^ sin δ q cos δ ) ln ( R + y ^ ) + sin δ cos δ I 3 I 3 = μ λ + μ 1 cos δ ln ( R + ( y ^ sin δ q cos δ ) ) sin δ ln ( R + y ^ ) I 4 = μ λ + μ 2 cos δ tan 1 y ^ ( X q cos δ ) + X ( R + X ) sin δ x ^ ( R + X ) cos δ
p = y cos δ + d sin δ q = y sin δ + d cos δ R = ξ 2 + p 2 + q 2 X = ξ 2 + q 2 μ = E 2 ( 1 + ν ) λ = E ν ( 1 2 ν ) ( 1 + ν )
where E and ν denote the elastic modulus and Poisson’s ratio of the overburden, respectively. The parameter U quantifies the vertical dislocation magnitude, physically corresponding to the subsidence induced by underground space [21].

3.4. Underground Goaf Locating

3.4.1. Geologic Parameter Acquisition

The accessibility of priori geologic information is variable in practical underground goaf locating cases, leading to different approaches to estimating the geological parameters. To address this challenge, parameters are estimated using different methods under three different prior information conditions (detailed, moderate, limited). This method enables quantitative assessment of information completeness on goaf localization accuracy. As Section 3.2 and Section 3.3 show, the critical geological parameters required for these two models are [ q ,   b ,   β ,   θ 0 ,   ν ] . These parameters are derived through rock-weighted composite evaluation factor P, as follows:
P = i = 1 n m i Q i i = 1 n m i
where m denotes the thickness of the rock layer along the normal direction, and Q represents rock property parameters, which were established as shown in Table 2.
Furthermore, the geological parameters can be defined as follows:
q = 0.5 ( 0.9 + P ) tan β = ( D r o c k + 0.0032 H ) ( 1 0.0038 δ )
where D r o c k is the rock influence coefficient, which maps from a rock-weighted composite evaluation factor, as shown in Table 3.
Specifically, the detailed prior information refers to the availability of the ‘Coal Resource Exploration and Geological Report’, which includes comprehensive geologic drilling data, stratigraphic histograms, and the thickness of each rock stratum from the coal seam to the ground surface, which can be obtained. Such detailed data allow for the application of distinct parameters to different strata, thereby improving the accuracy of the model fit.
Moderate prior information, in contrast, occurs when the ‘Coal Resource Exploration and Geological Report’ is unavailable. In this case, geological references can be derived from regional geological surveys, such as the ‘Regulations for Coal Pillars Preservation and Coal Mine Extraction under Buildings, Water Bodies, Railways, and Major Mine Shafts conditions’, an official report issued by the National Energy Administration of China that provides regional geological data on typical coalfields across the country. Under this scenario, the distribution of the rock strata can be approximated to define the geologic parameters.
Limited prior information indicates the absence of both detailed and regional geological reports for the study area. In such cases, model parameters are typically estimated based on open-source, global-scale geological maps, such as the 1:50,000-scale geological map from the ‘Atlas of China’s Natural Geography’.

3.4.2. Mining Azimuth Estimation

In multi-face mining systems, old goaf frequently envelops active coal seams, inducing subsidence superposition that biases deformation vectors toward historical working faces. Addressing this challenge, we develop the Ray Method with Deformation Binary Conversion (RM-DBC)—a novel approach leveraging time-series InSAR deformation patterns for robust orientation detection (Figure 4) [21]. The workflow comprises the following four critical stages:
  • Select a stable region (considered to be deformation-free) from the InSAR-derived accumulated deformation results, and establish adaptive thresholds according to the average value of this region;
  • Convert LOS displacement maps into binary matrices based on the thresholds to highlight subsidence features;
  • Define the the maximum subsidence point as the origin, and then 1°-stepped ray projections from the origin point were applied for accumulating activated pixel counts along each azimuthal path;
  • The direction with the highest sum of pixel values is regarded as the azimuth angle.

3.4.3. Goaf Parameters Estimation

The InSAR-derived line-of-sight (LOS) projection of 3D ground deformations ( W ,   d e ,   d n ) is expressed as
D L O S = W cos θ s sin θ s d n cos α s + d n sin α s
where θ s denotes the radar incidence angle and α s is the satellite heading angle. By integrating the mechanics and mathematics principles of mining-induced subsidence from both PIM and Okada models, the physically constrained equation linking subsurface deformation with InSAR observations can be established, as follows:
D L O S = W cos θ s s i n θ s f N ( L ,   W ,   H ,   φ ) cos α s + f E ( L ,   W ,   H ,   φ ) sin α s
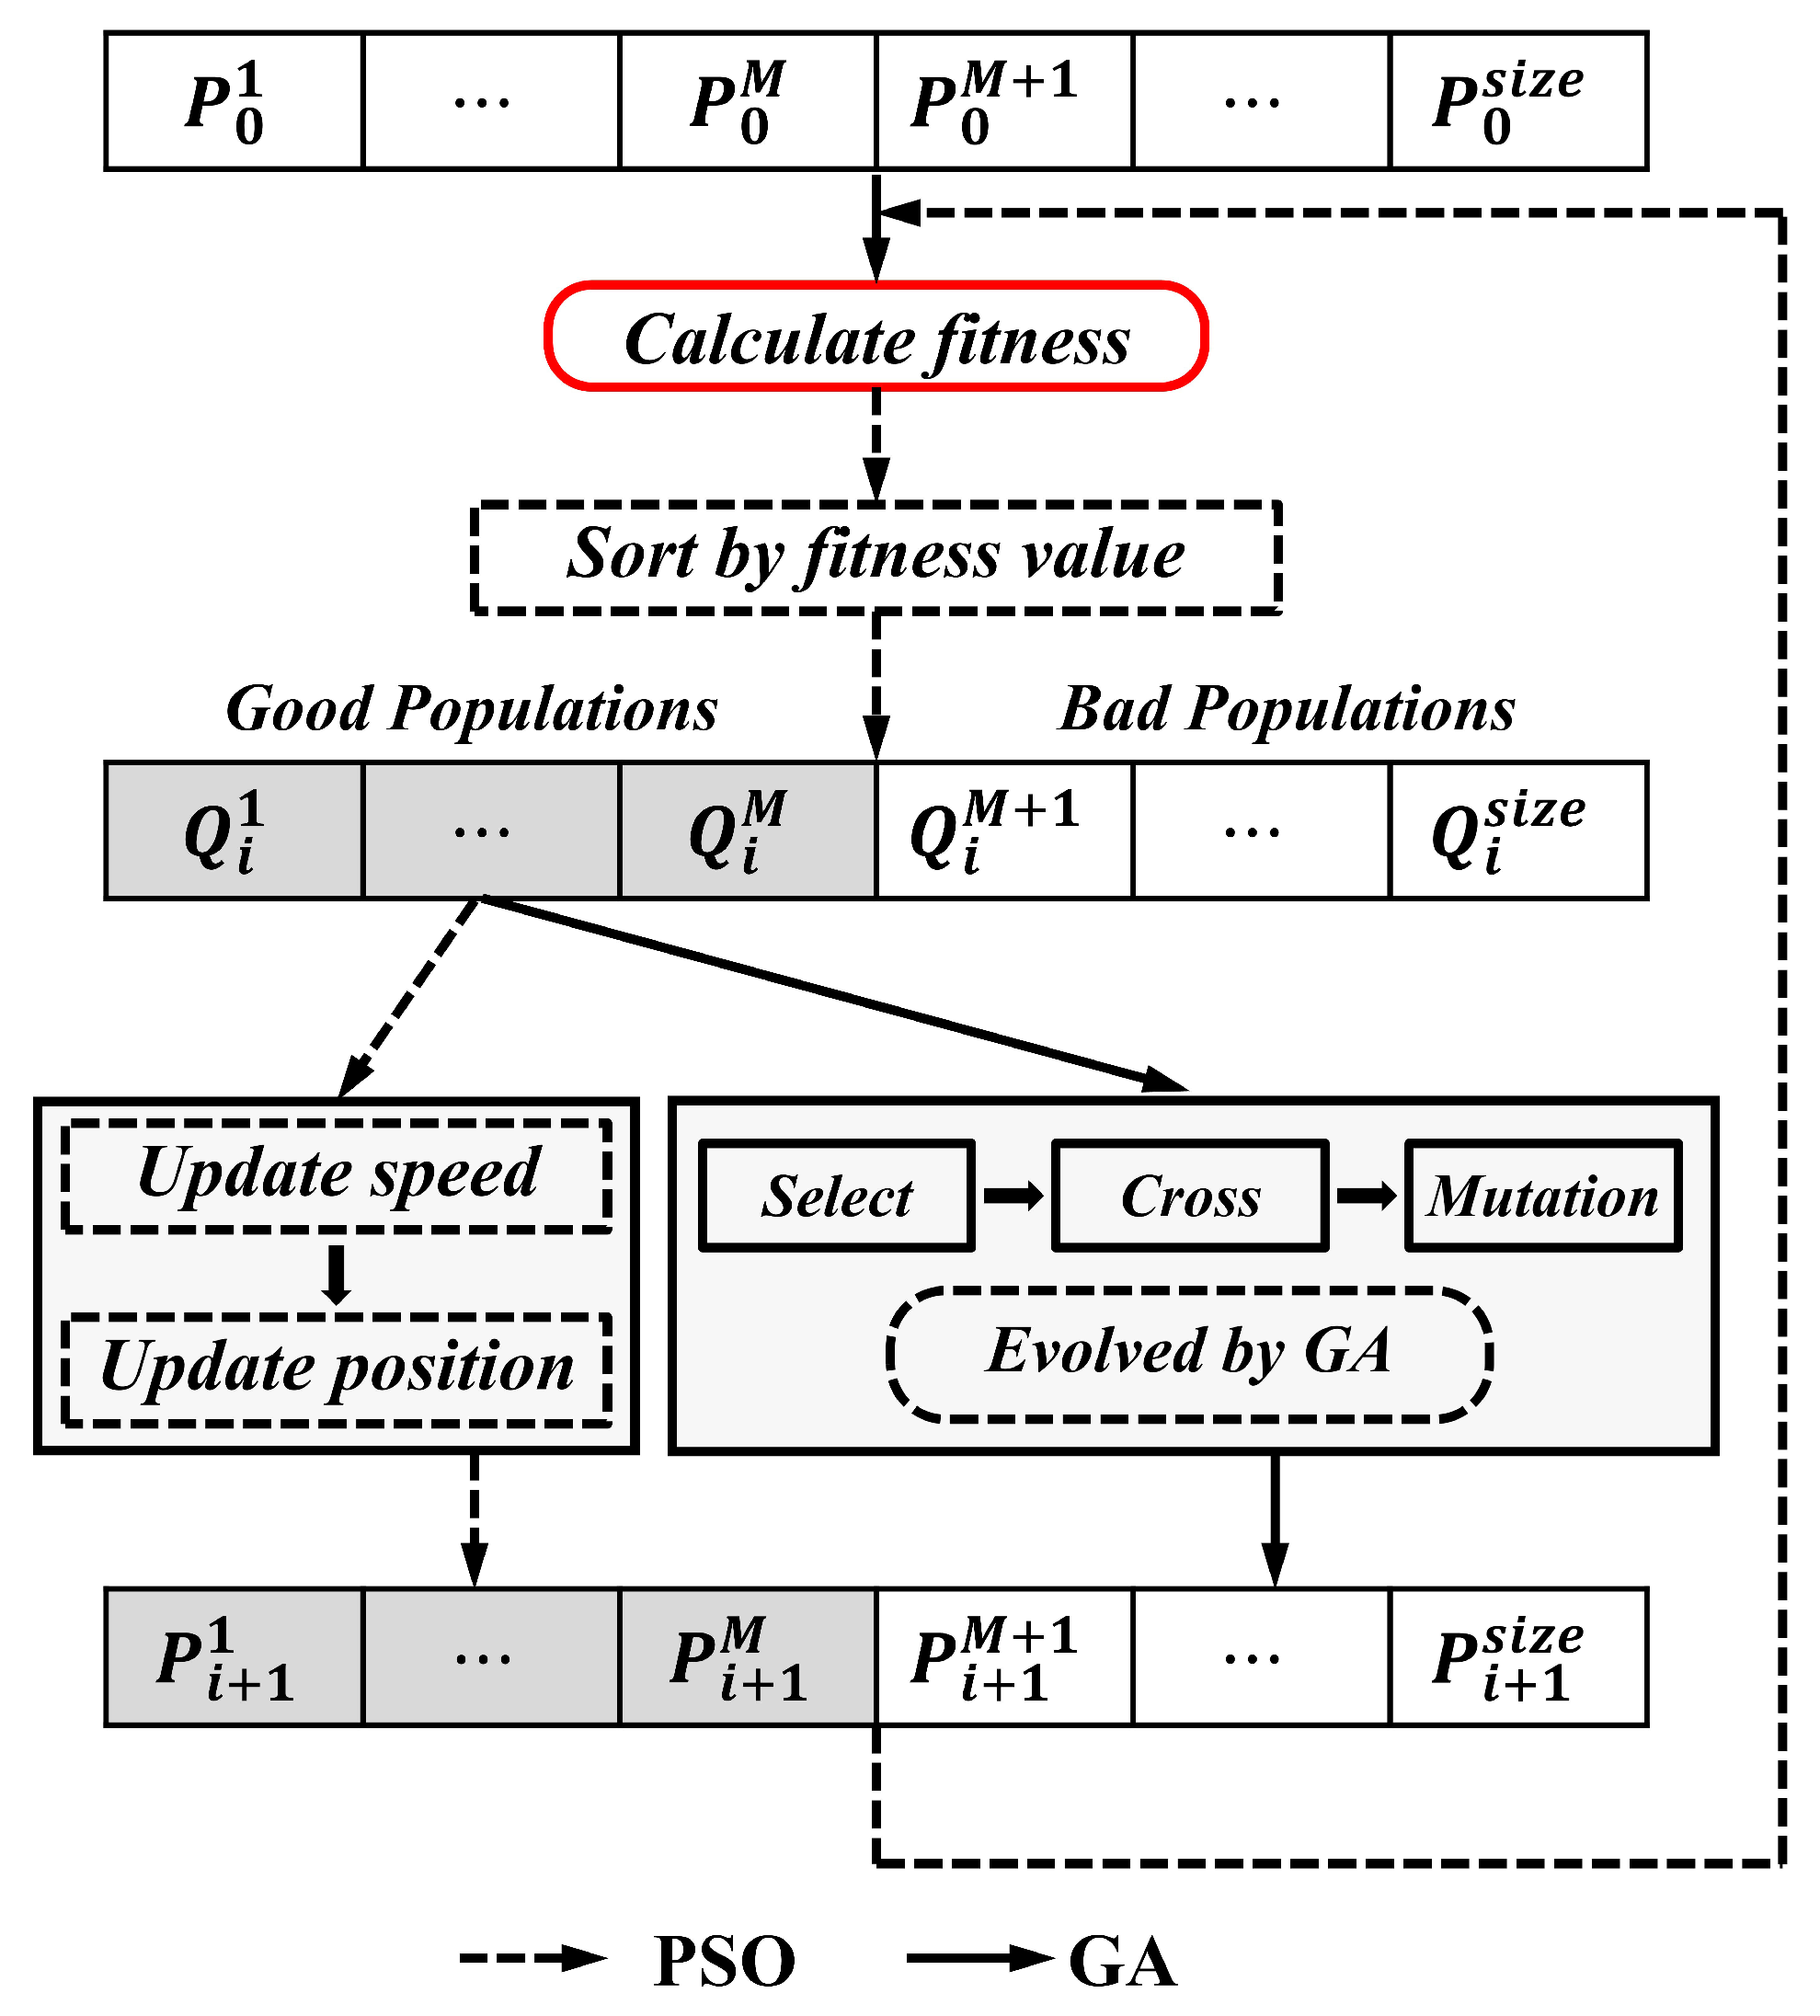
The equation employs nine crucial dimensions to solve this eight-dimensional (strike length, dip length, depth, mining height, central geodetic coordinates, dip angle, and azimuth angle: L ,   W ,   H ,   h ,   X ,   Y ,   δ ,   φ ) nonlinear inverse problem. We applied a Genetic Algorithm-Particle Swarm Optimization (GA-PSO) algorithm (Figure 5), which exhibits enhanced convergence properties for rapid computation and optimal parameter search globally.
The optimization function minimizes the root mean square error (RMSE) between InSAR observations D L O S j and model predictions D l o s j , as follows:
f i t = i = 1 n D L O S i D l o s i 2 n
where f i t serves as the particle fitness metric driving directional exploration in parameter space. Finally, The optimal parameter after iteration is considered as the final locating result [19]. To make this framework applicable to more situations, many studies improved the theoretical model [20,21].

4. Results Analysis

4.1. InSAR-Derived Deformation Result

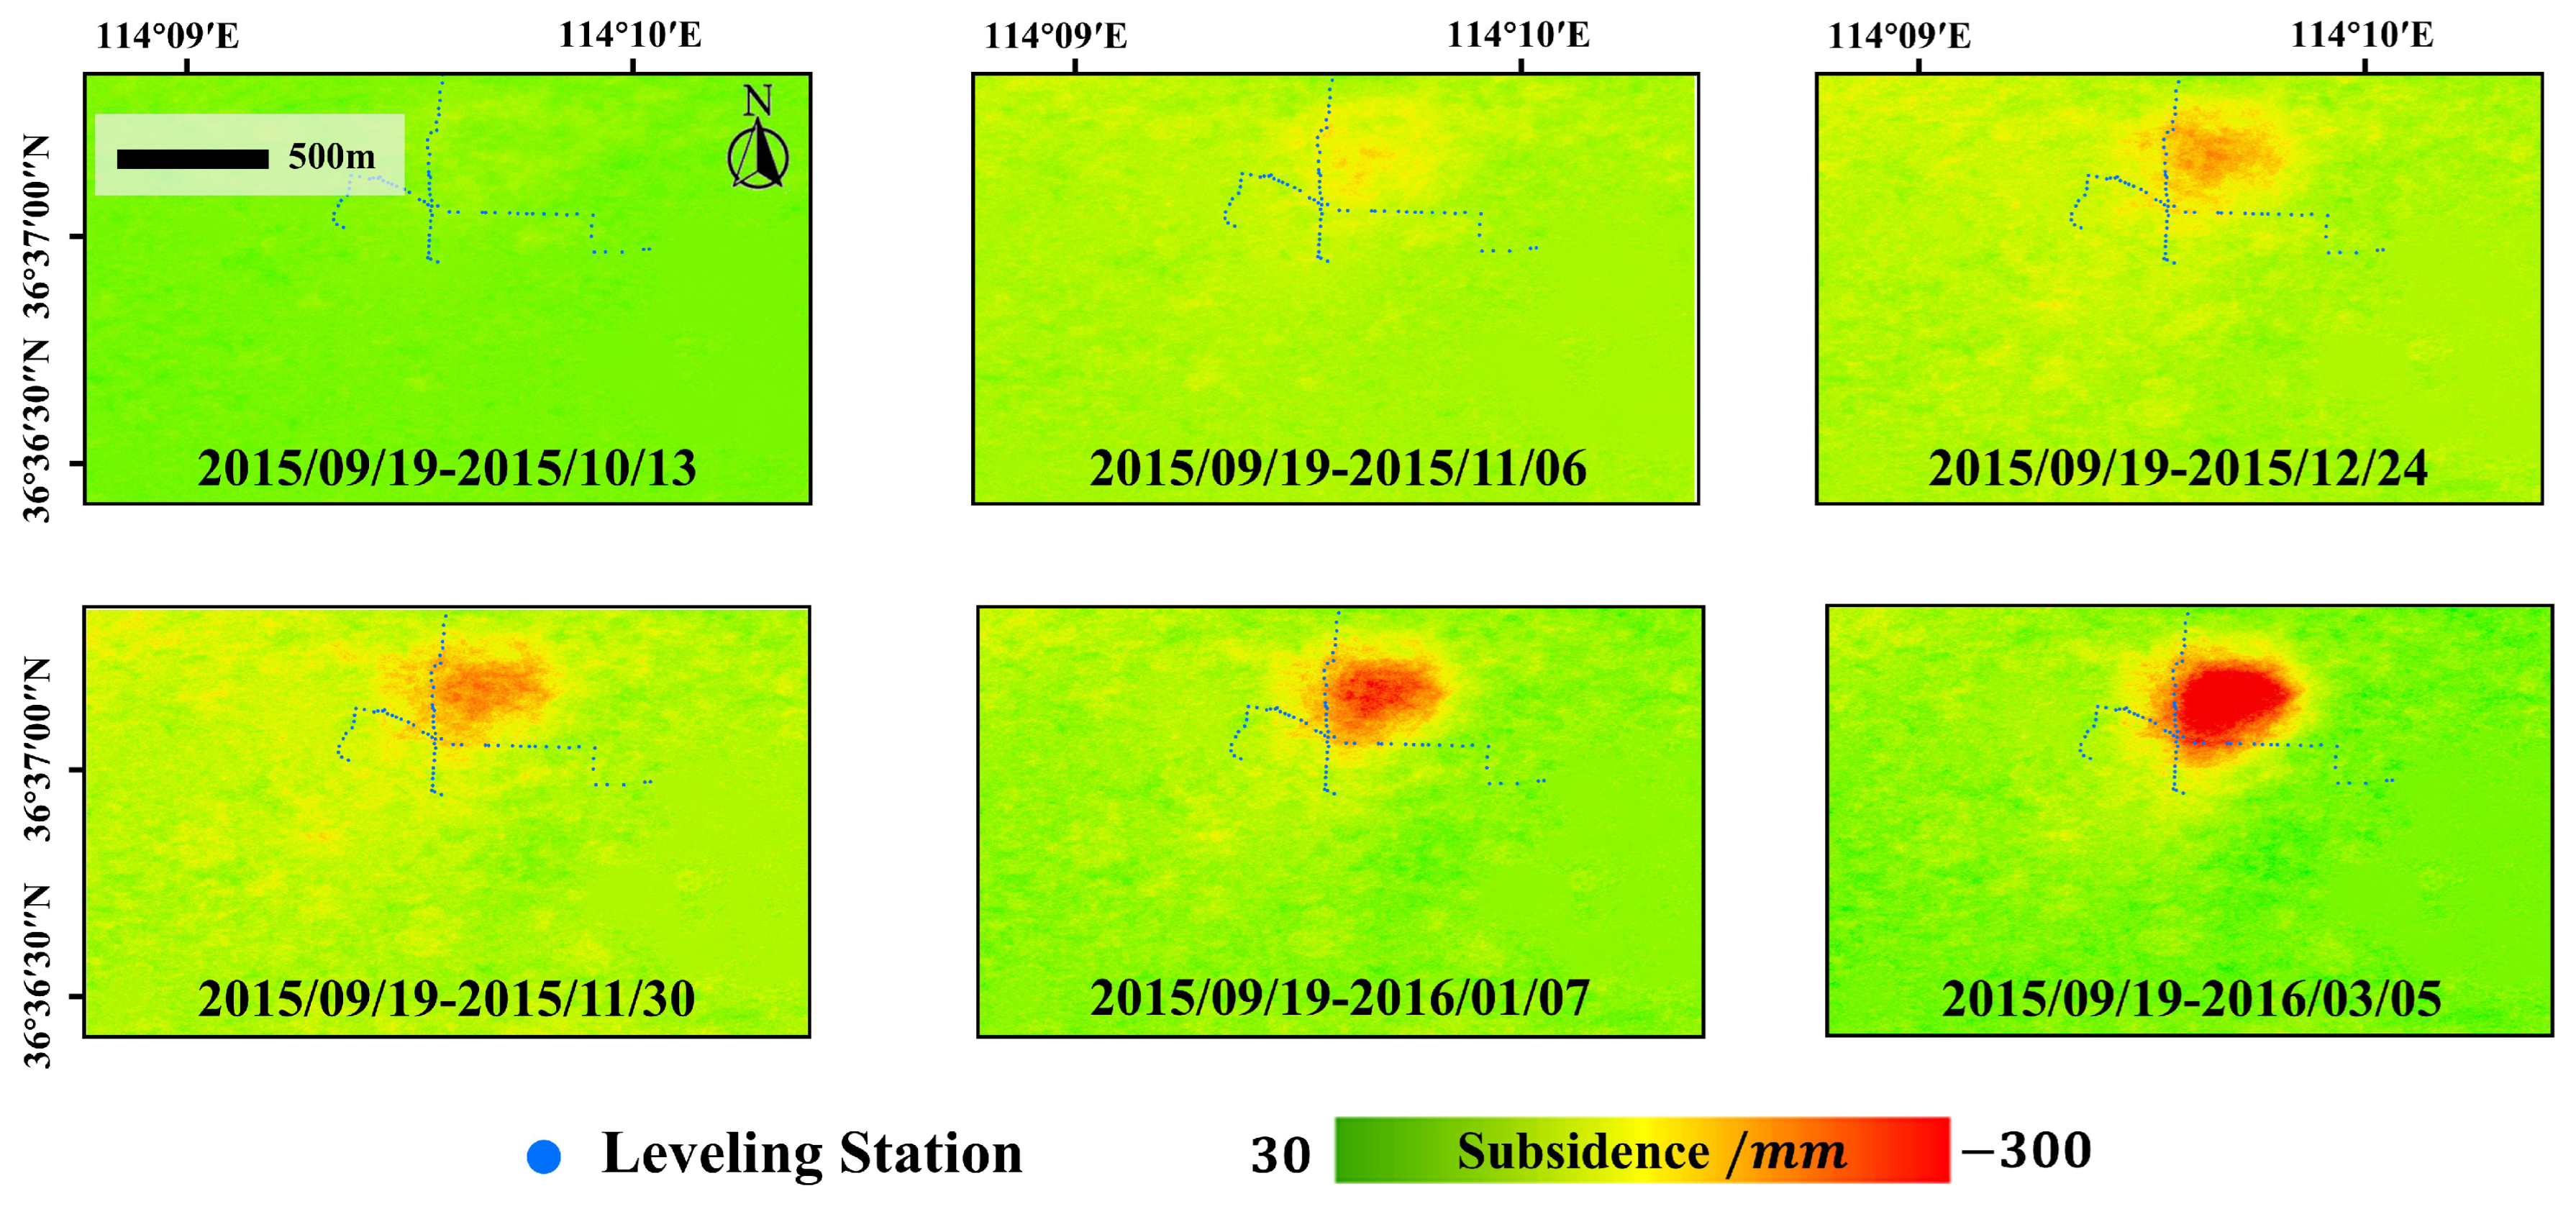
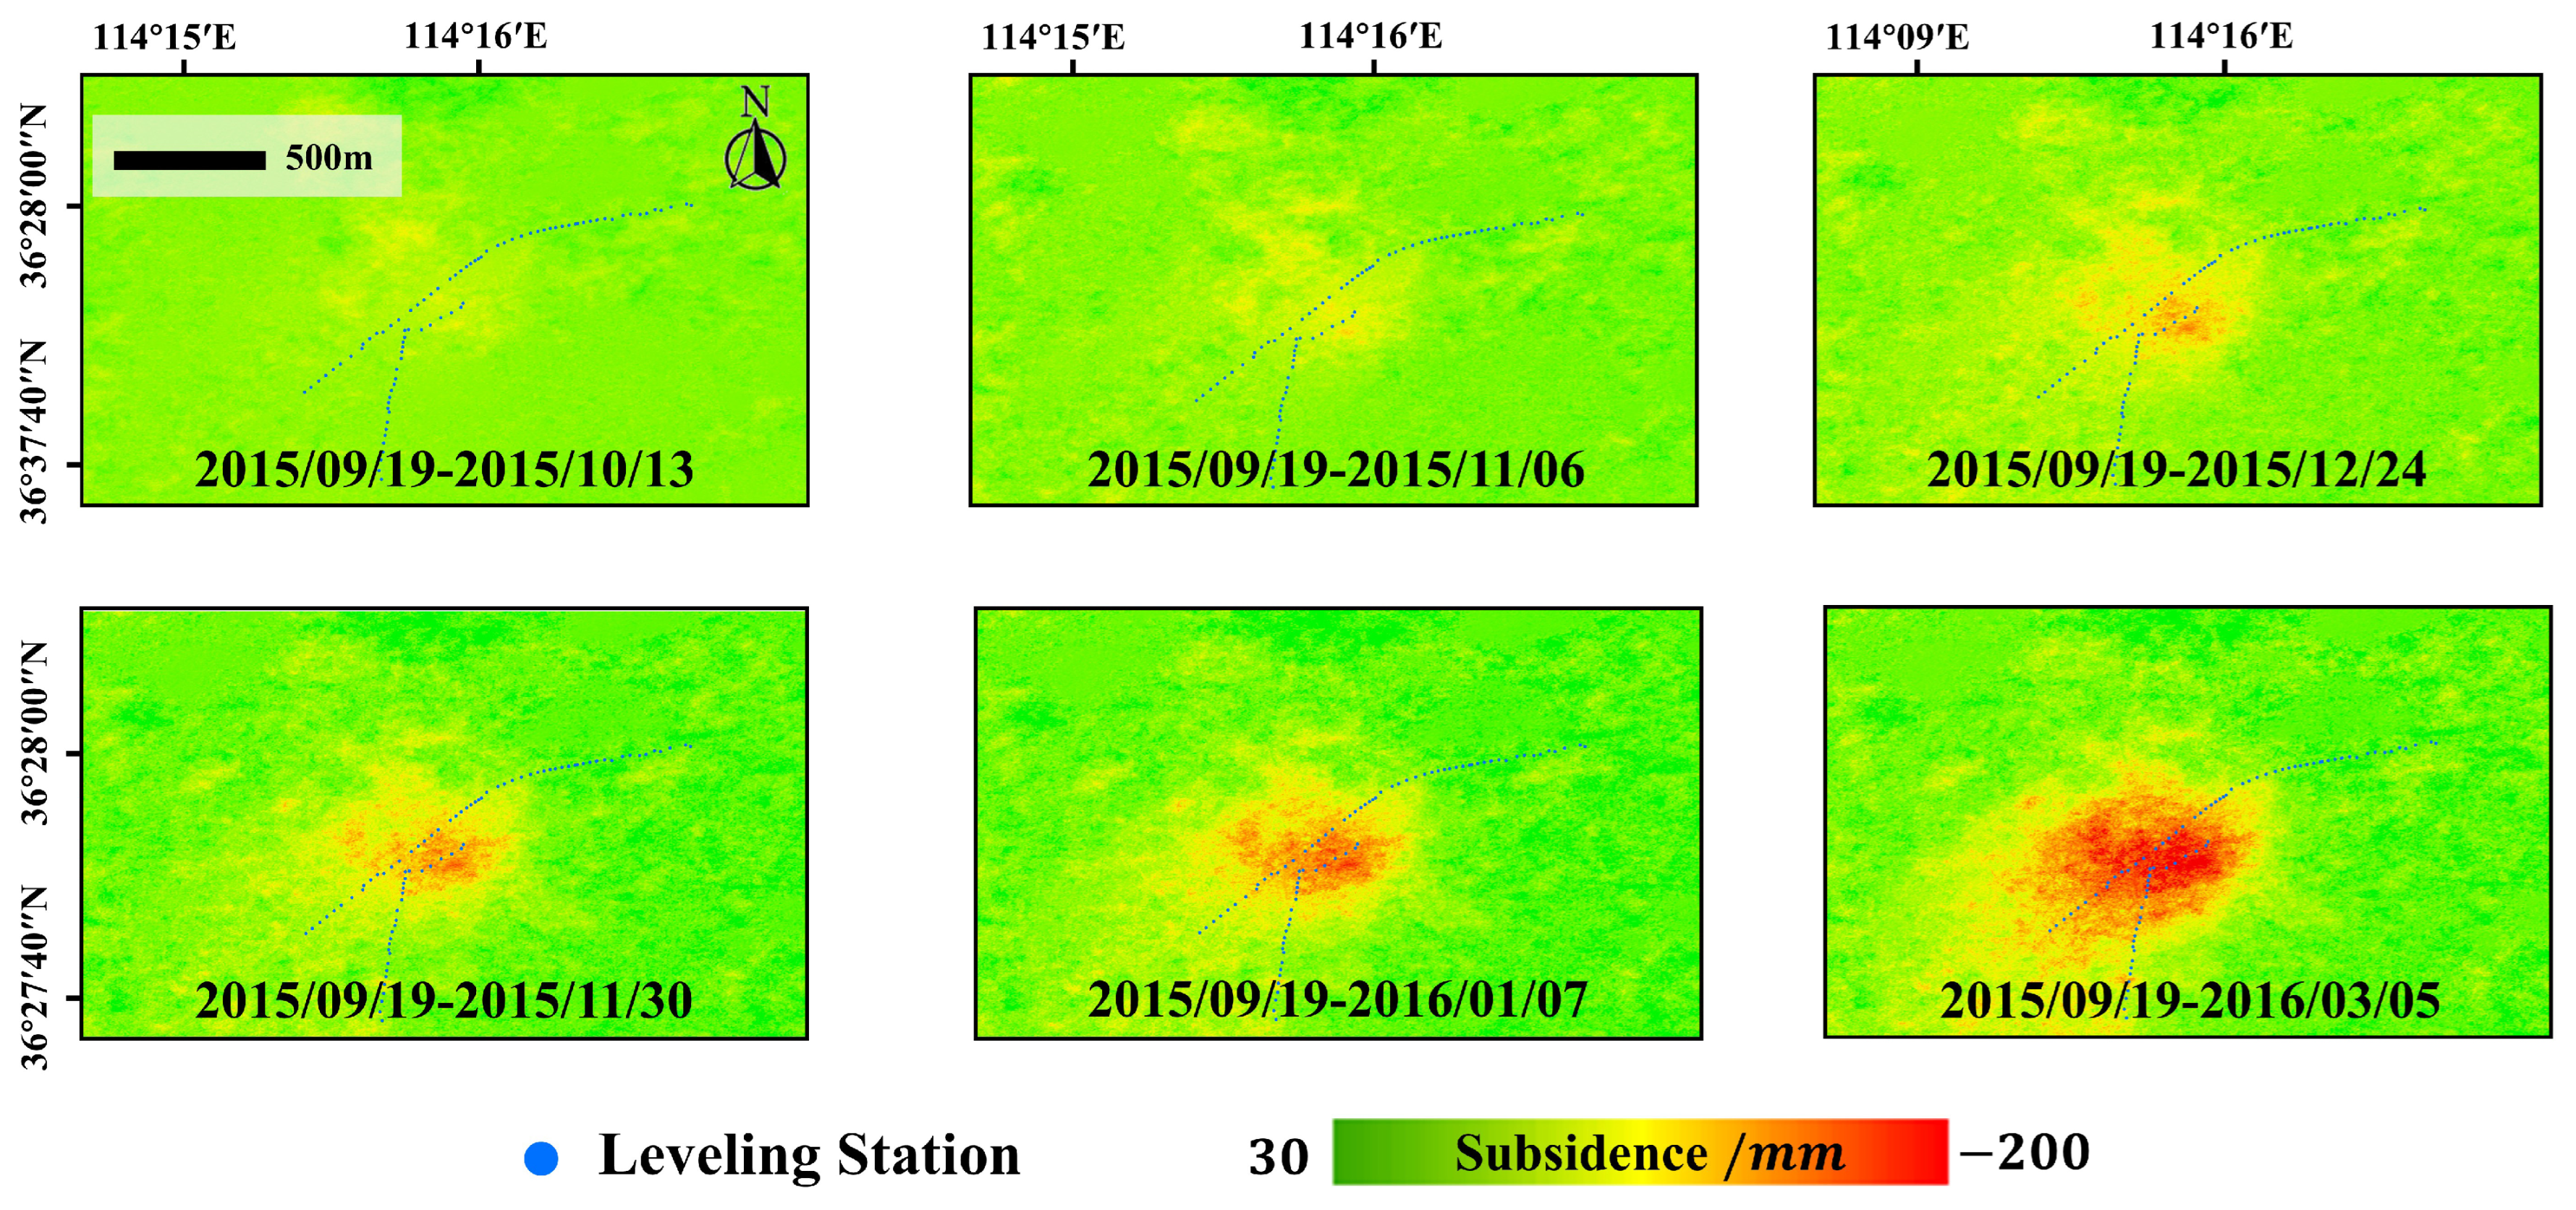
In this study, the mining-induced ground deformation in Area I and the Area II was derived through multi-temporal D-InSAR processing, as Figure 6 and Figure 7 present.
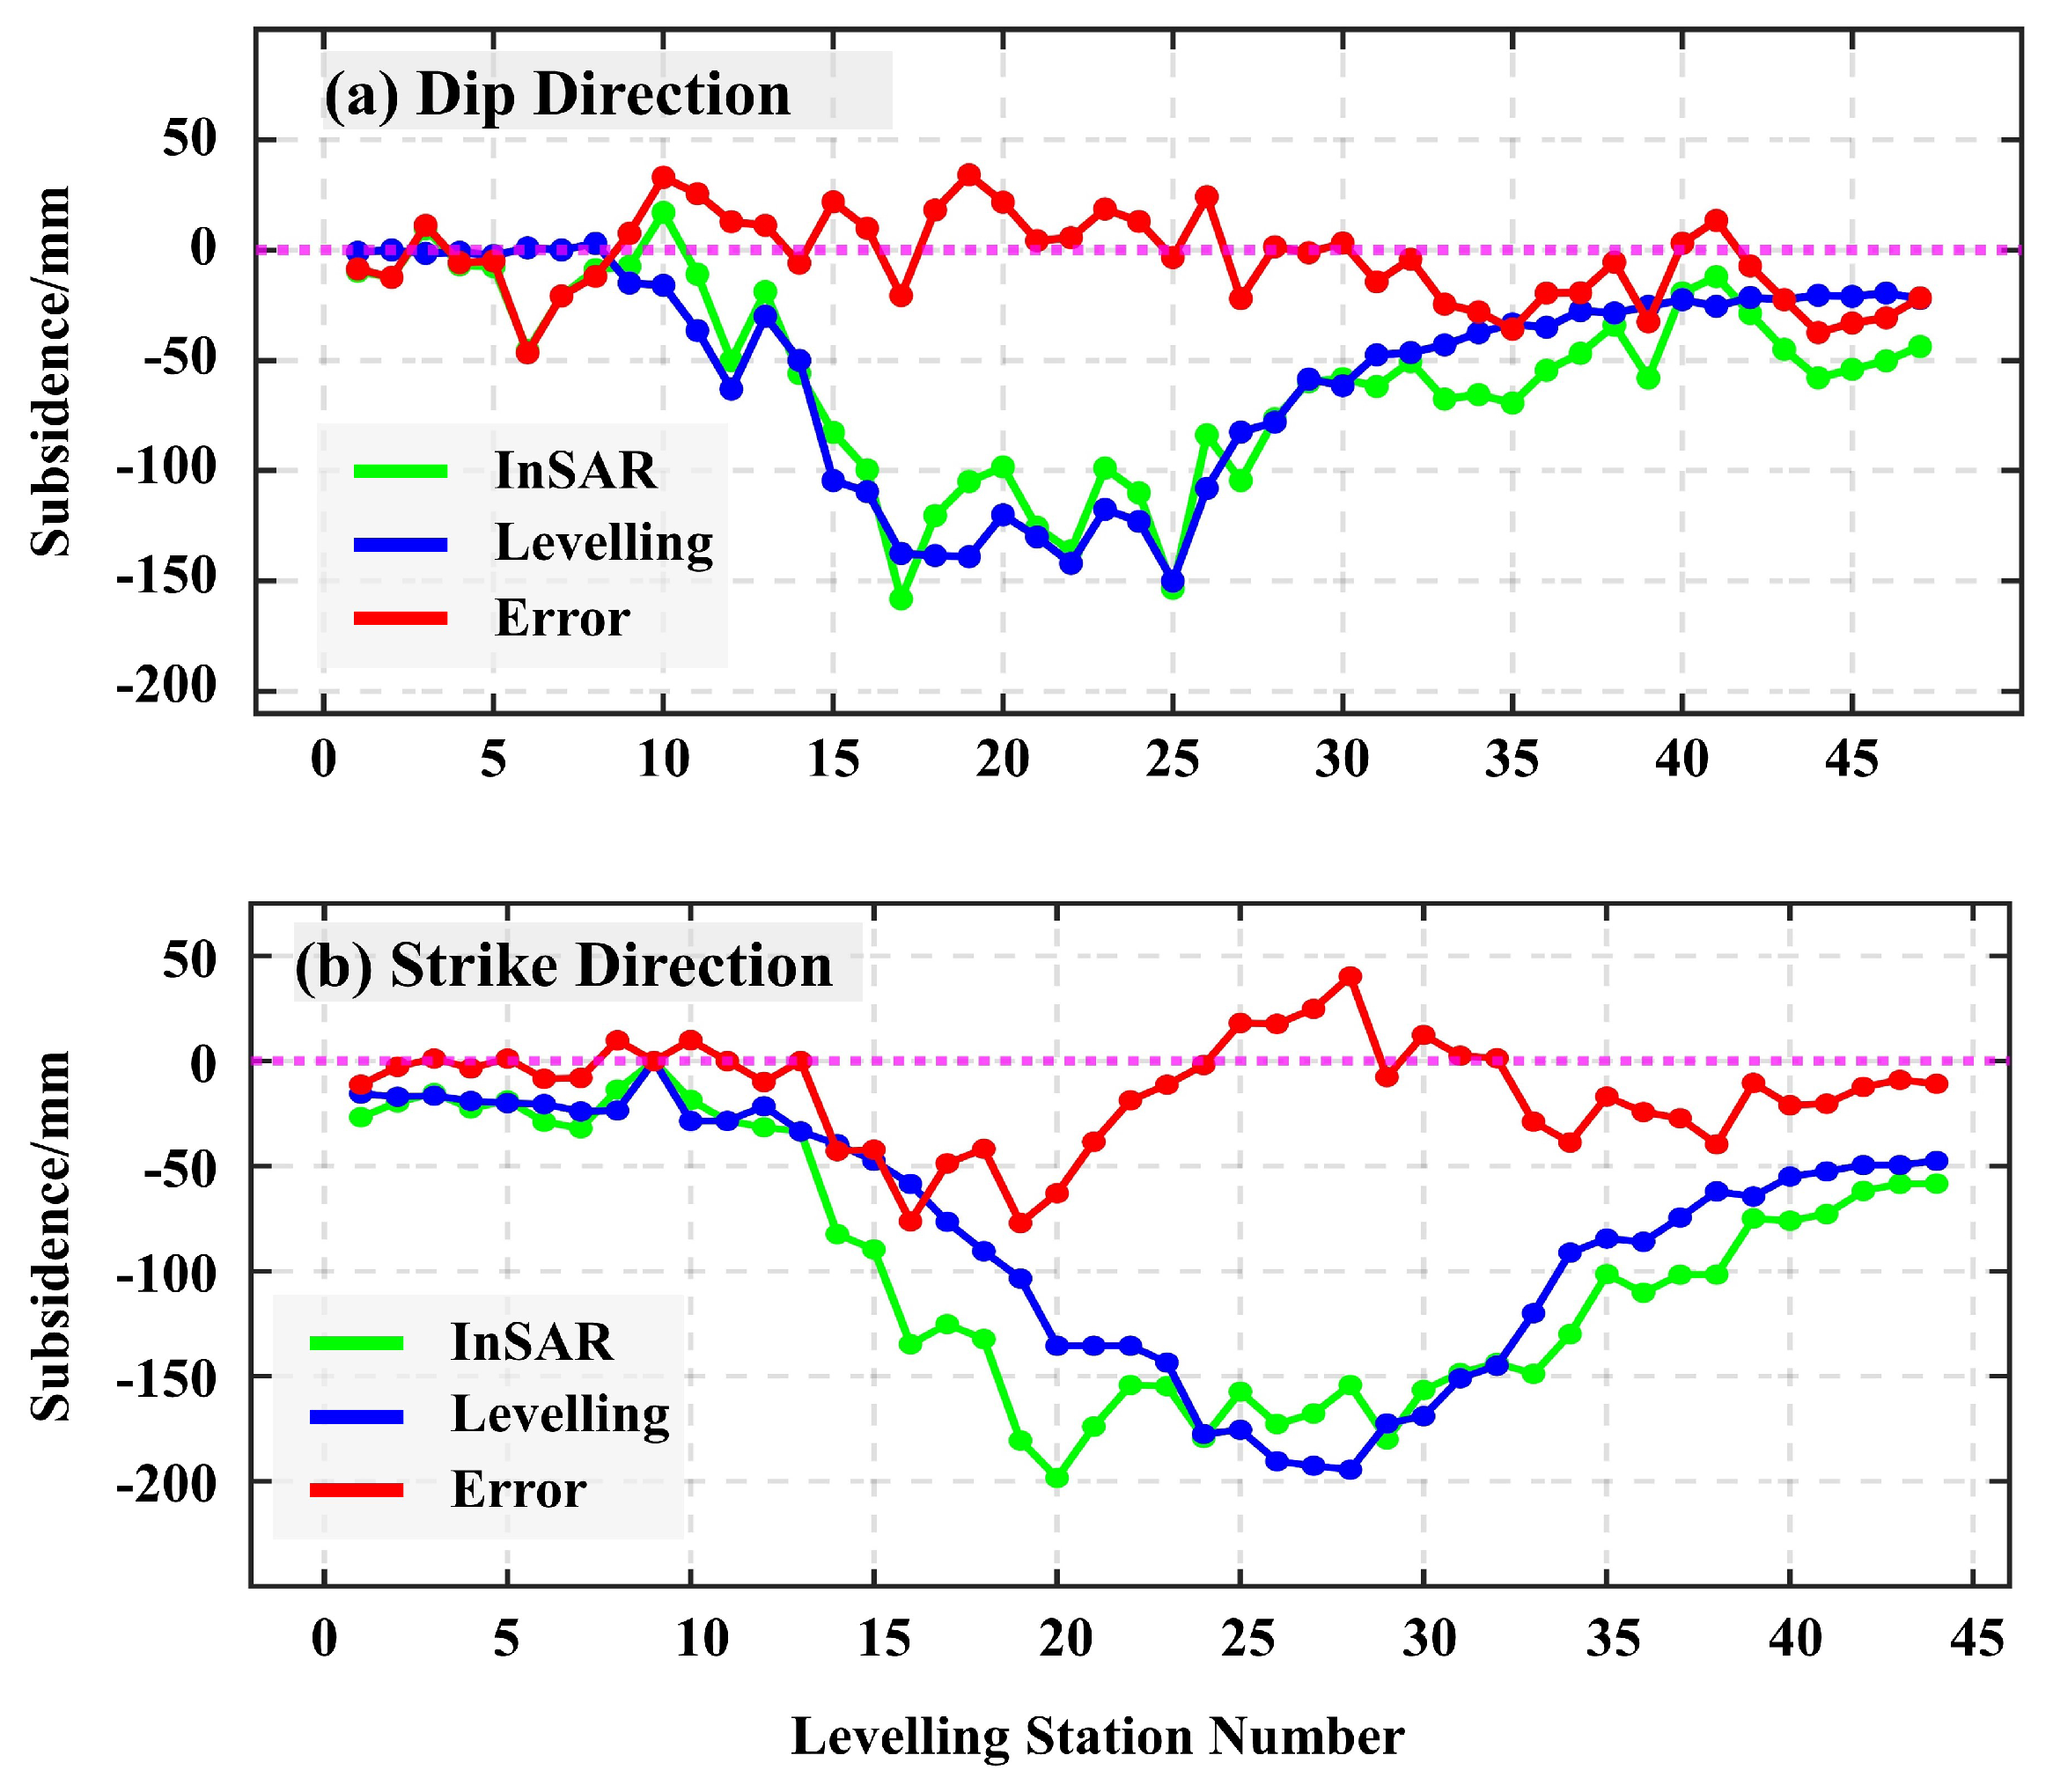
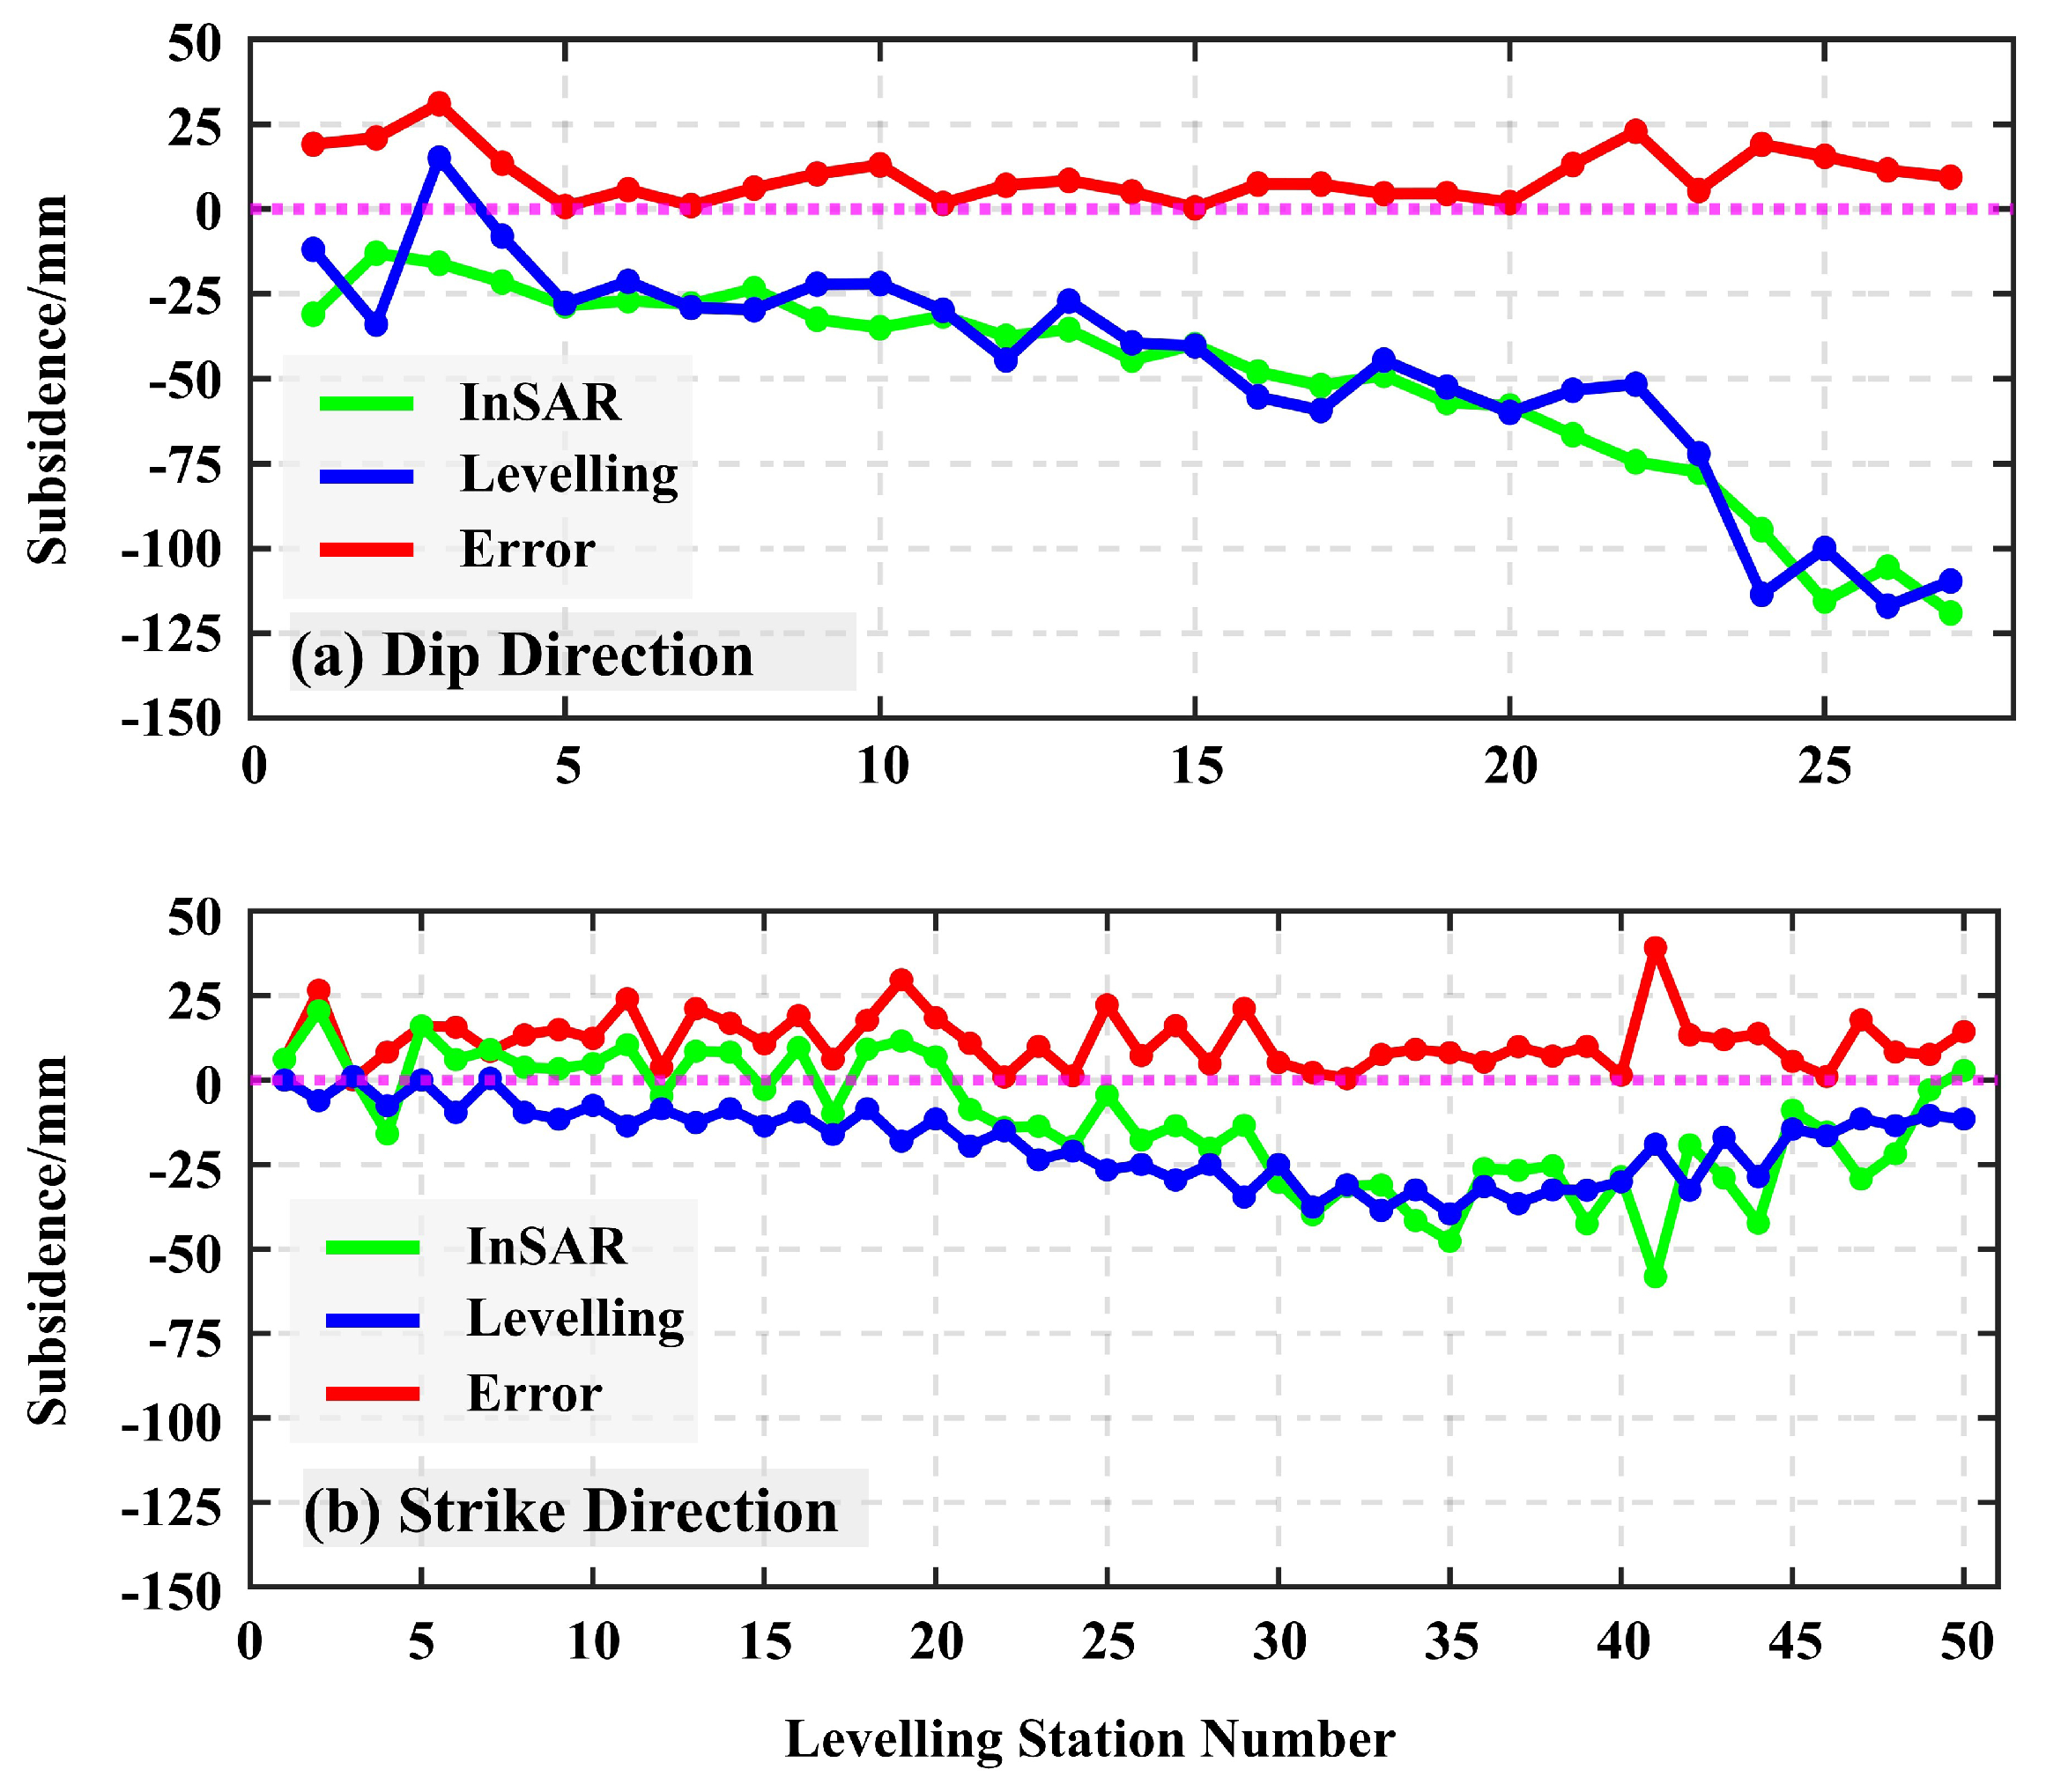
From Figure 6 and Figure 7, the displacement field exhibits southwestward and southeastward propagation patterns in Area I and Area II, respectively. The maximum subsidence values reached −442 mm in Area I and −267 mm in Area II. To assess measurement accuracy, 168 leveling points, arranged along the strike and dip directions of 2 working faces, were cross-validated against contemporaneous InSAR observations. Specifically, 91 leveling points were deployed in Area I, and 77 in Area II. The results of the quantitative monitoring comparison are presented in Figure 8 and Figure 9.
According to the comparison, the root mean square errors (RMSEs) between InSAR observations and leveling measurements are 20.265 mm and 28.575 mm in the dip and strike directions, respectively, for Area I and 12.386 mm and 14.167 mm for Area II. These results confirm the operational reliability of InSAR-derived deformation for quantifying mining-induced hazards. It is important to note that, prior to comparing InSAR-derived deformation with leveling measurements, the leveling data were projected from the vertical to the line-of-sight (LOS) direction to align with the InSAR deformation results based on the satellite’s incidence angle and heading.

4.2. Azimuth Estimation and Model Parameters Selection

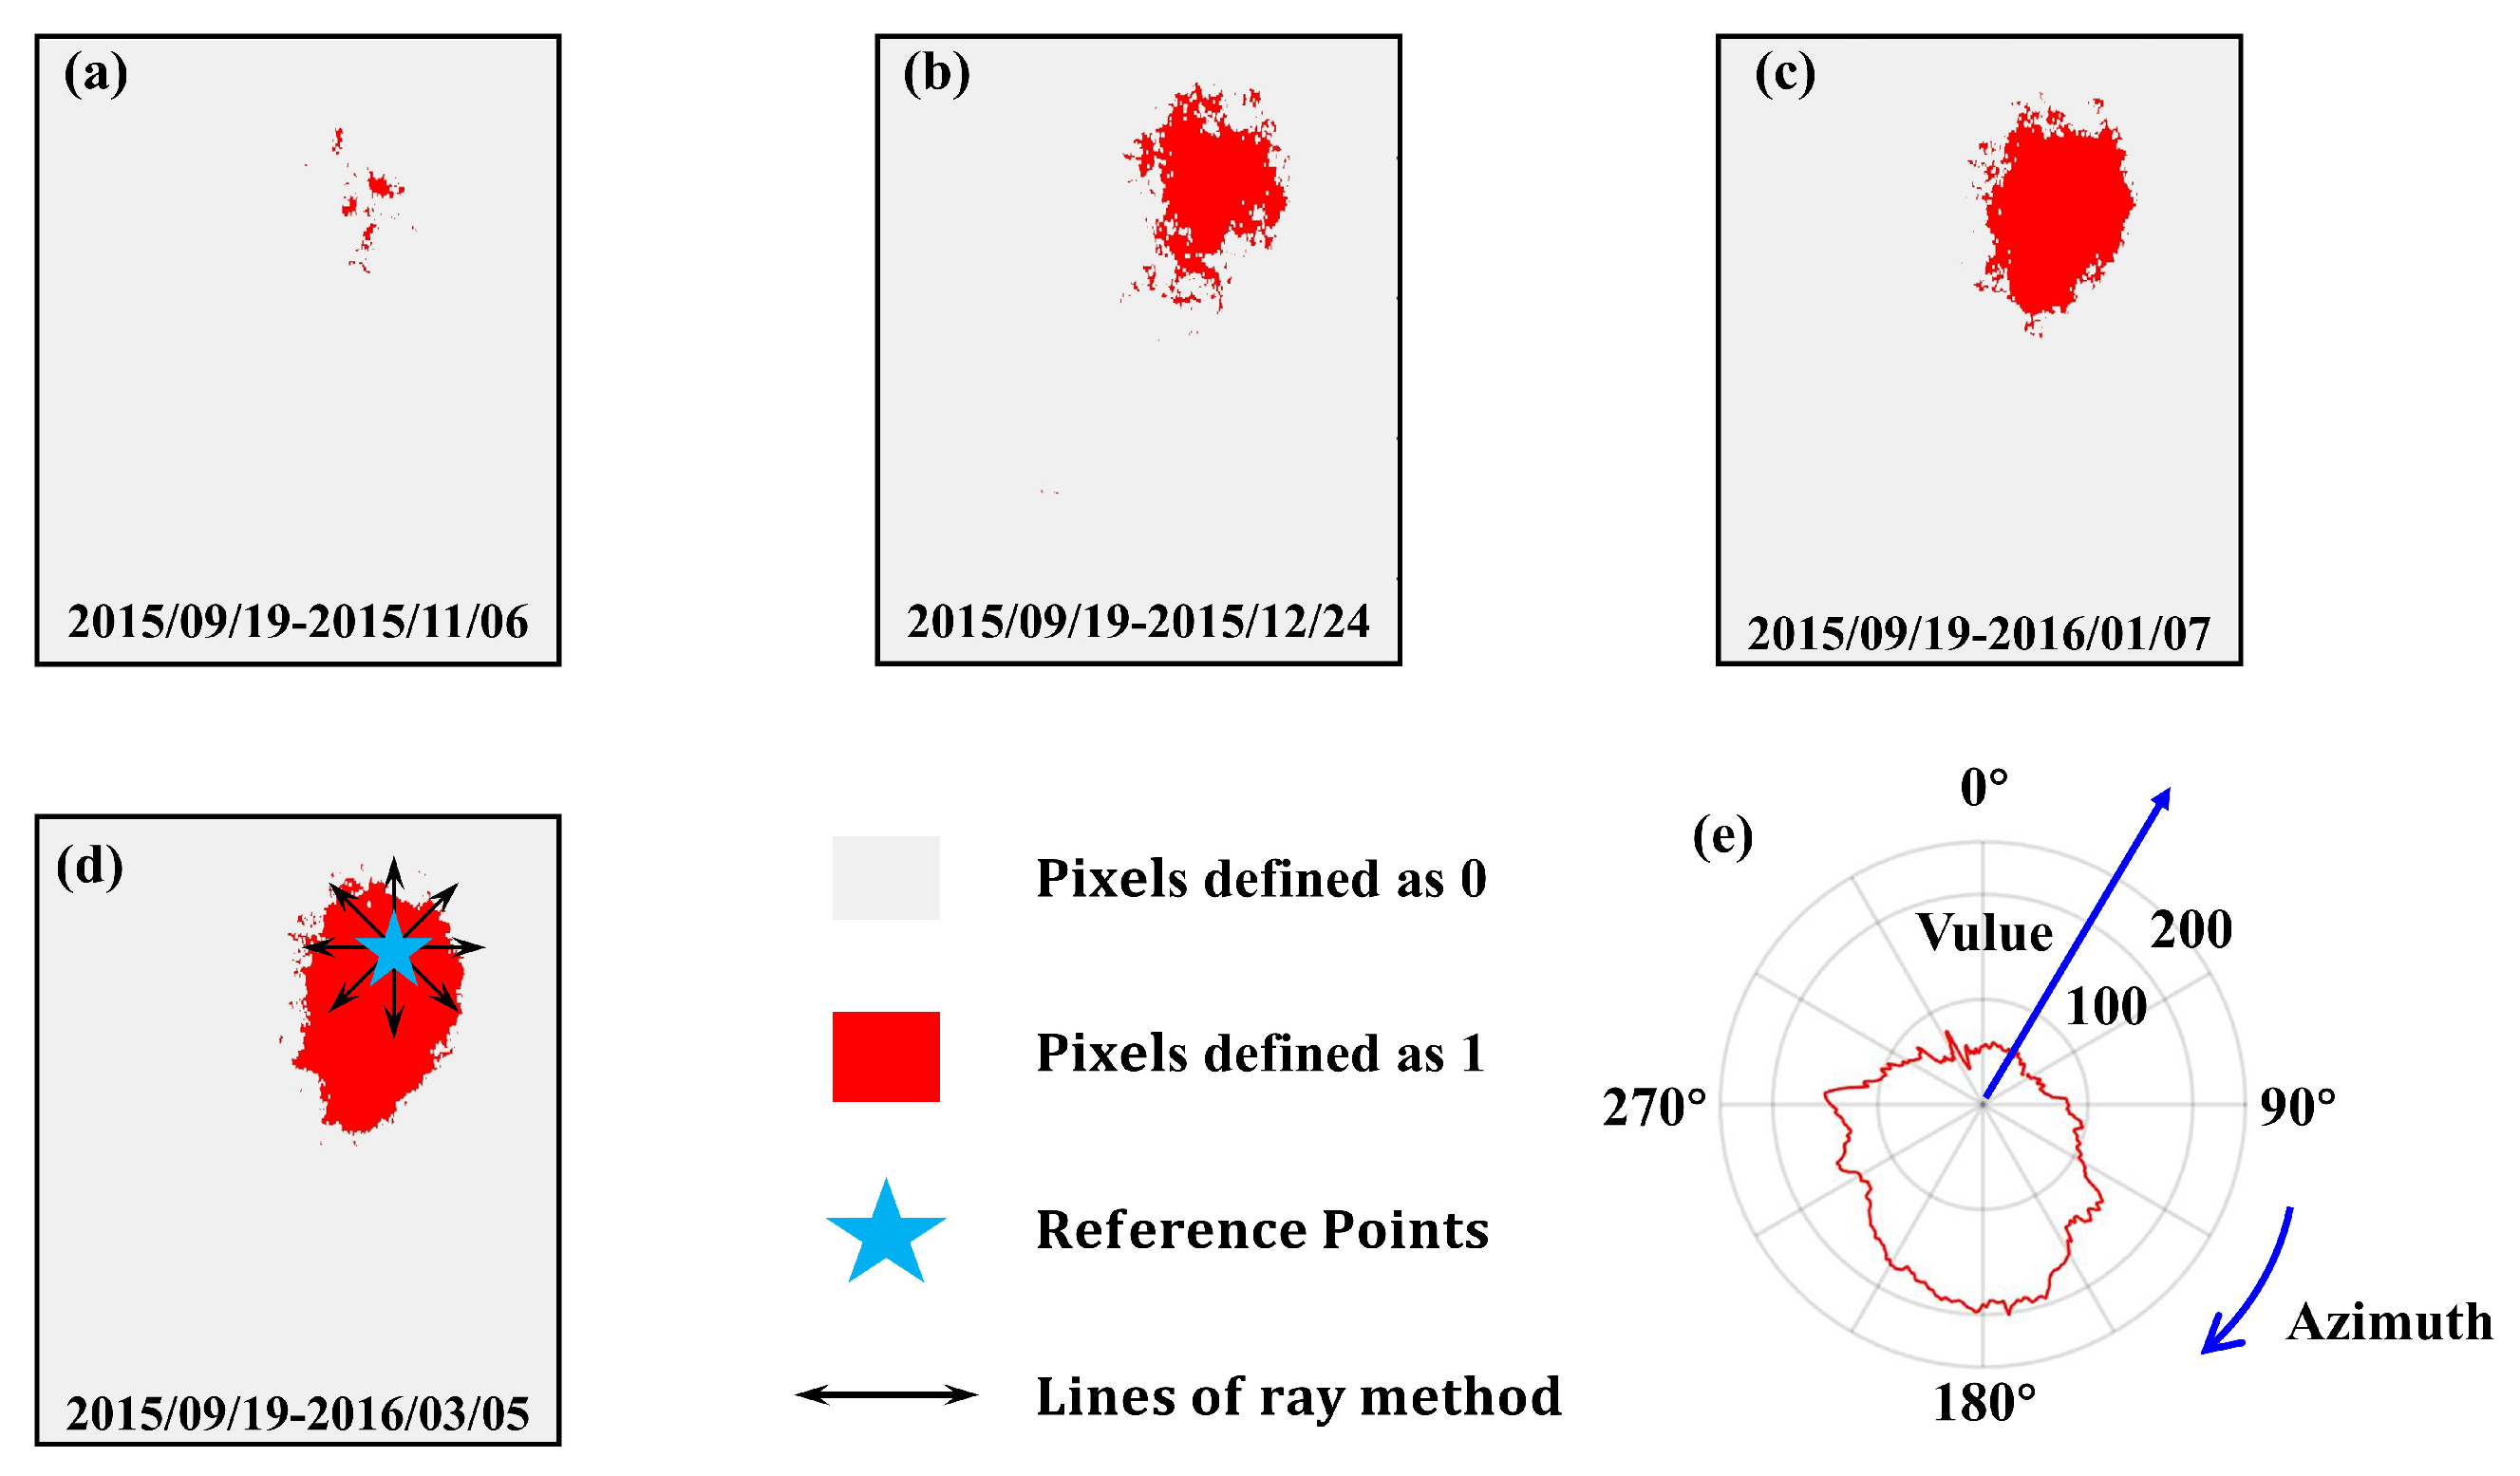
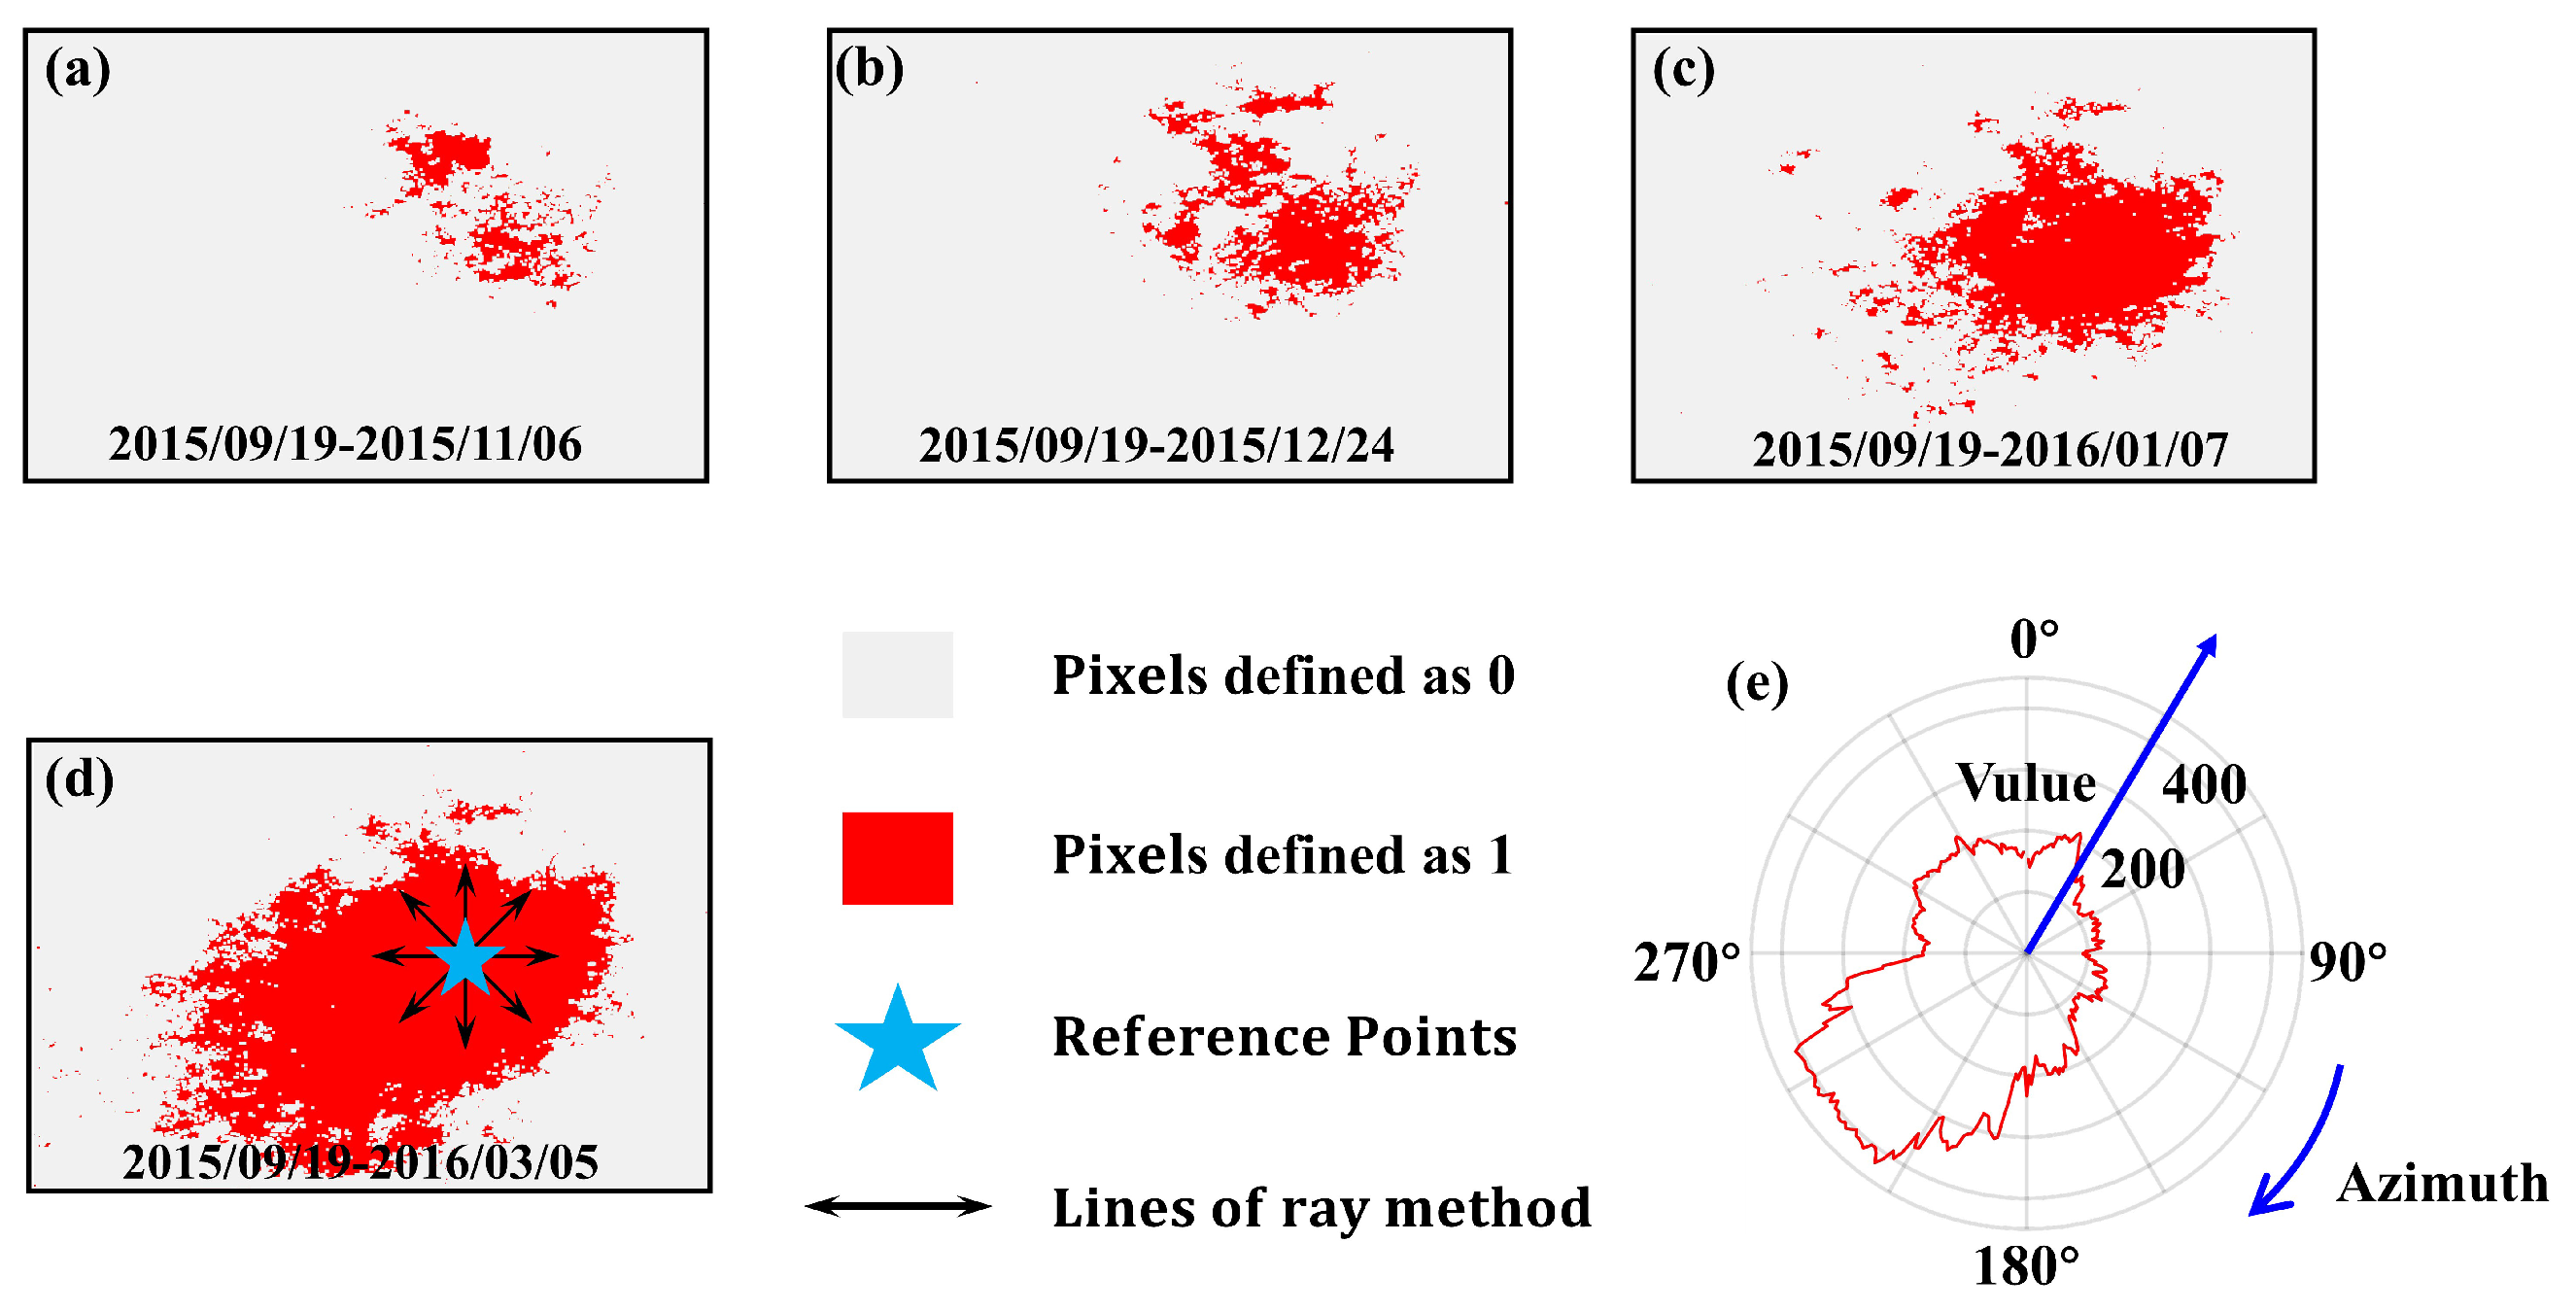
Before the underground goaf locating process, the azimuth was estimated by using RM-DBC. First, a binary filter (threshold = 5.6 mm in Area I and threshold = 2.6 mm in Area II) was applied to RM-DBC based on the average value of a stable region without mining-induced subsidence. Then according to the ground deformation results at the time series approaching the beginning of mining, a reference point can be established. Finally, the azimuth of both areas was estimated. The process is shown in Figure 10 and Figure 11.
As described in Figure 10 and Figure 11, the highest sum of pixel values occurred at the direction 167° and 234° in Area I and Area II, respectively. This means that the azimuths of the two study areas were estimated as 167° and 234° using RM-DBC.
For the study area, we actually have a detailed engineering geology report (including detailed geologic drilling data and stratigraphic histograms). However, in order to analyze the underground goaf localization accuracy under different priori information conditions, we use the methods corresponding to the different prior information conditions to obtain the parameters.
Given that both study areas are located within the Fengfeng Coalfield and are geographically close, the same high-resolution drilling data were used to characterize the stratigraphic distribution, with only minor numerical differences. Specifically, under the detailed prior information condition, the drilling data revealed a three-layered structure: (1) a 20 m quaternary overburden, consisting of unconsolidated topsoil (identical for both Area I and Area II); (2) a 400 m intermediate stratum, composed of alternating sandy mudstone and siltstone (again, the same for both areas); and (3) a basal formation of 354 m in Area I and 320 m in Area II, dominated by sandstone–sandy mudstone interbeds. The quantitative lithological parameters, including Young’s modulus, Poisson’s ratio, and density distributions, are systematically cataloged in Table 4.
As show in Table 4, the model geological parameters [ q ,   b ,   t a n β ,   θ 0 ,   ν ] in the detailed information condition were calculated as [0.512, 0.25, 1.98, 85, 0.16].
For moderate prior information, regional analogs from the Shanxi-Taiyuan Formation coal measures were employed, extracting characteristic parameter ranges from the North China Coalfield Engineering Manual. Based on this, the model geological parameters [ q ,   b ,   t a n β ,   θ 0 ,   ν ] in the moderate condition can be set as [0.4, 0.25, 1.79, 85, 0.28].
In limited prior information, according to the global-scale geologic map, the two study areas are formed by Carboniferous–Permian strata, mainly consisting of sandstones and sandy mudstones, which are defined as having medium hardness. Based on this, the model geological parameters [ q ,   b ,   t a n β ,   θ 0 ,   ν ] in the limited information condition can be set as [0.35, 0.25, 2.37, 85, 0.22].

4.3. Goaf Locating Under Different Priori Information

Geological parameters for all a priori information conditions are determined in Section 4.2. Consequently, the underground goaf can be inverse using the process proposed in Section 3.4.3 with the geological parameters. The results are presented in Figure 12 and Figure 13 and Table 5 and Table 6.
As shown in Table 5 and Table 6, the accuracy of underground goaf locating improves with the abundance of priori geological information. Specifically, in a detailed information condition, the maximum relative errors of dimensional parameters (length, width, and depth) in the two areas using PIM and ODM are 7.9% (length of Area I) and 14.8% (width of Area II). In a moderate information condition, the results are 12.4% (length of Area I) and 13.4% (width of Area II). Additionally, in a limited information condition, the results are 19.0% (width of Area II) and 15.6% (length of Area II). It should be noticed that the maximum center point locating errors of three different information conditions are all distributed around 25 m (25.24 m, 27.47 m, and 23.36 m) in Area I and around 32 m (32.45 m, 31.89 m, and 33.39 m) in Area II, which demonstrates the weak correlation between the center point locating and the priori geological information conditions. Additionally, the absolute error of depth in a detailed information condition is 0 since the applied field drilling data can accurately measure the depth of the coal seam. The estimated errors in the azimuth are consistent among all cases since they were all obtained through the RM-DBC proposed in Section 3.4.2.
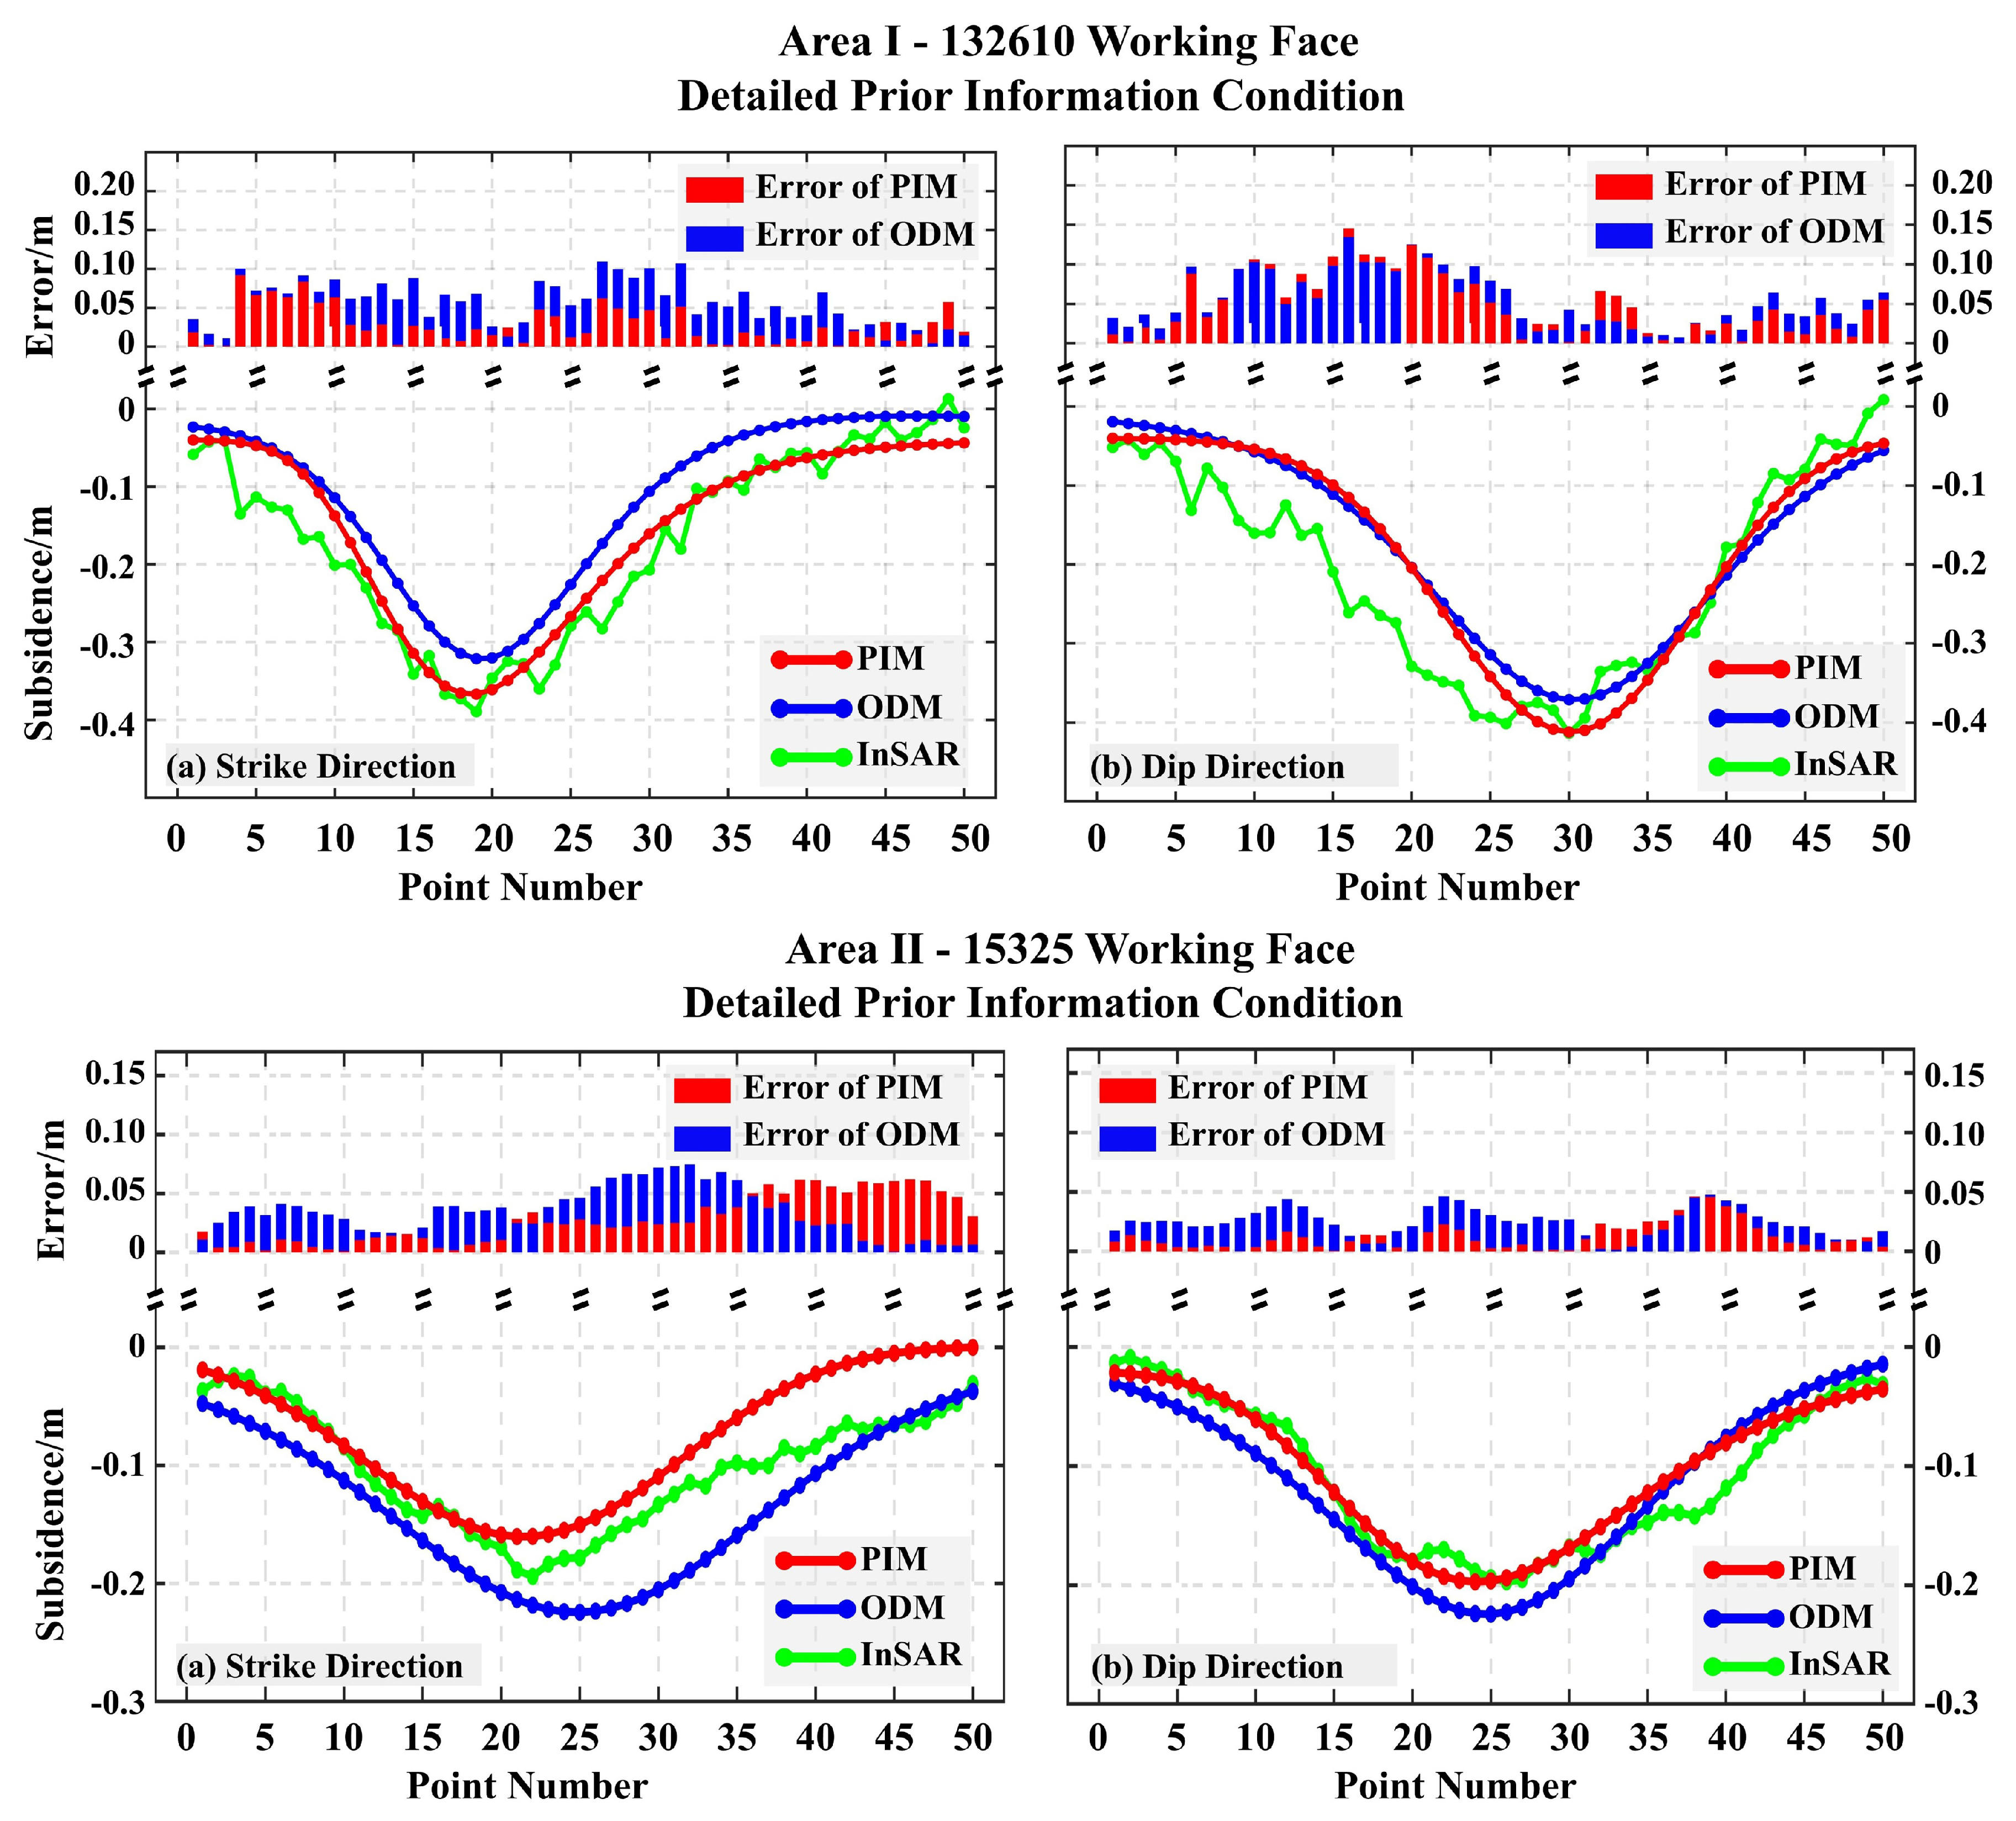
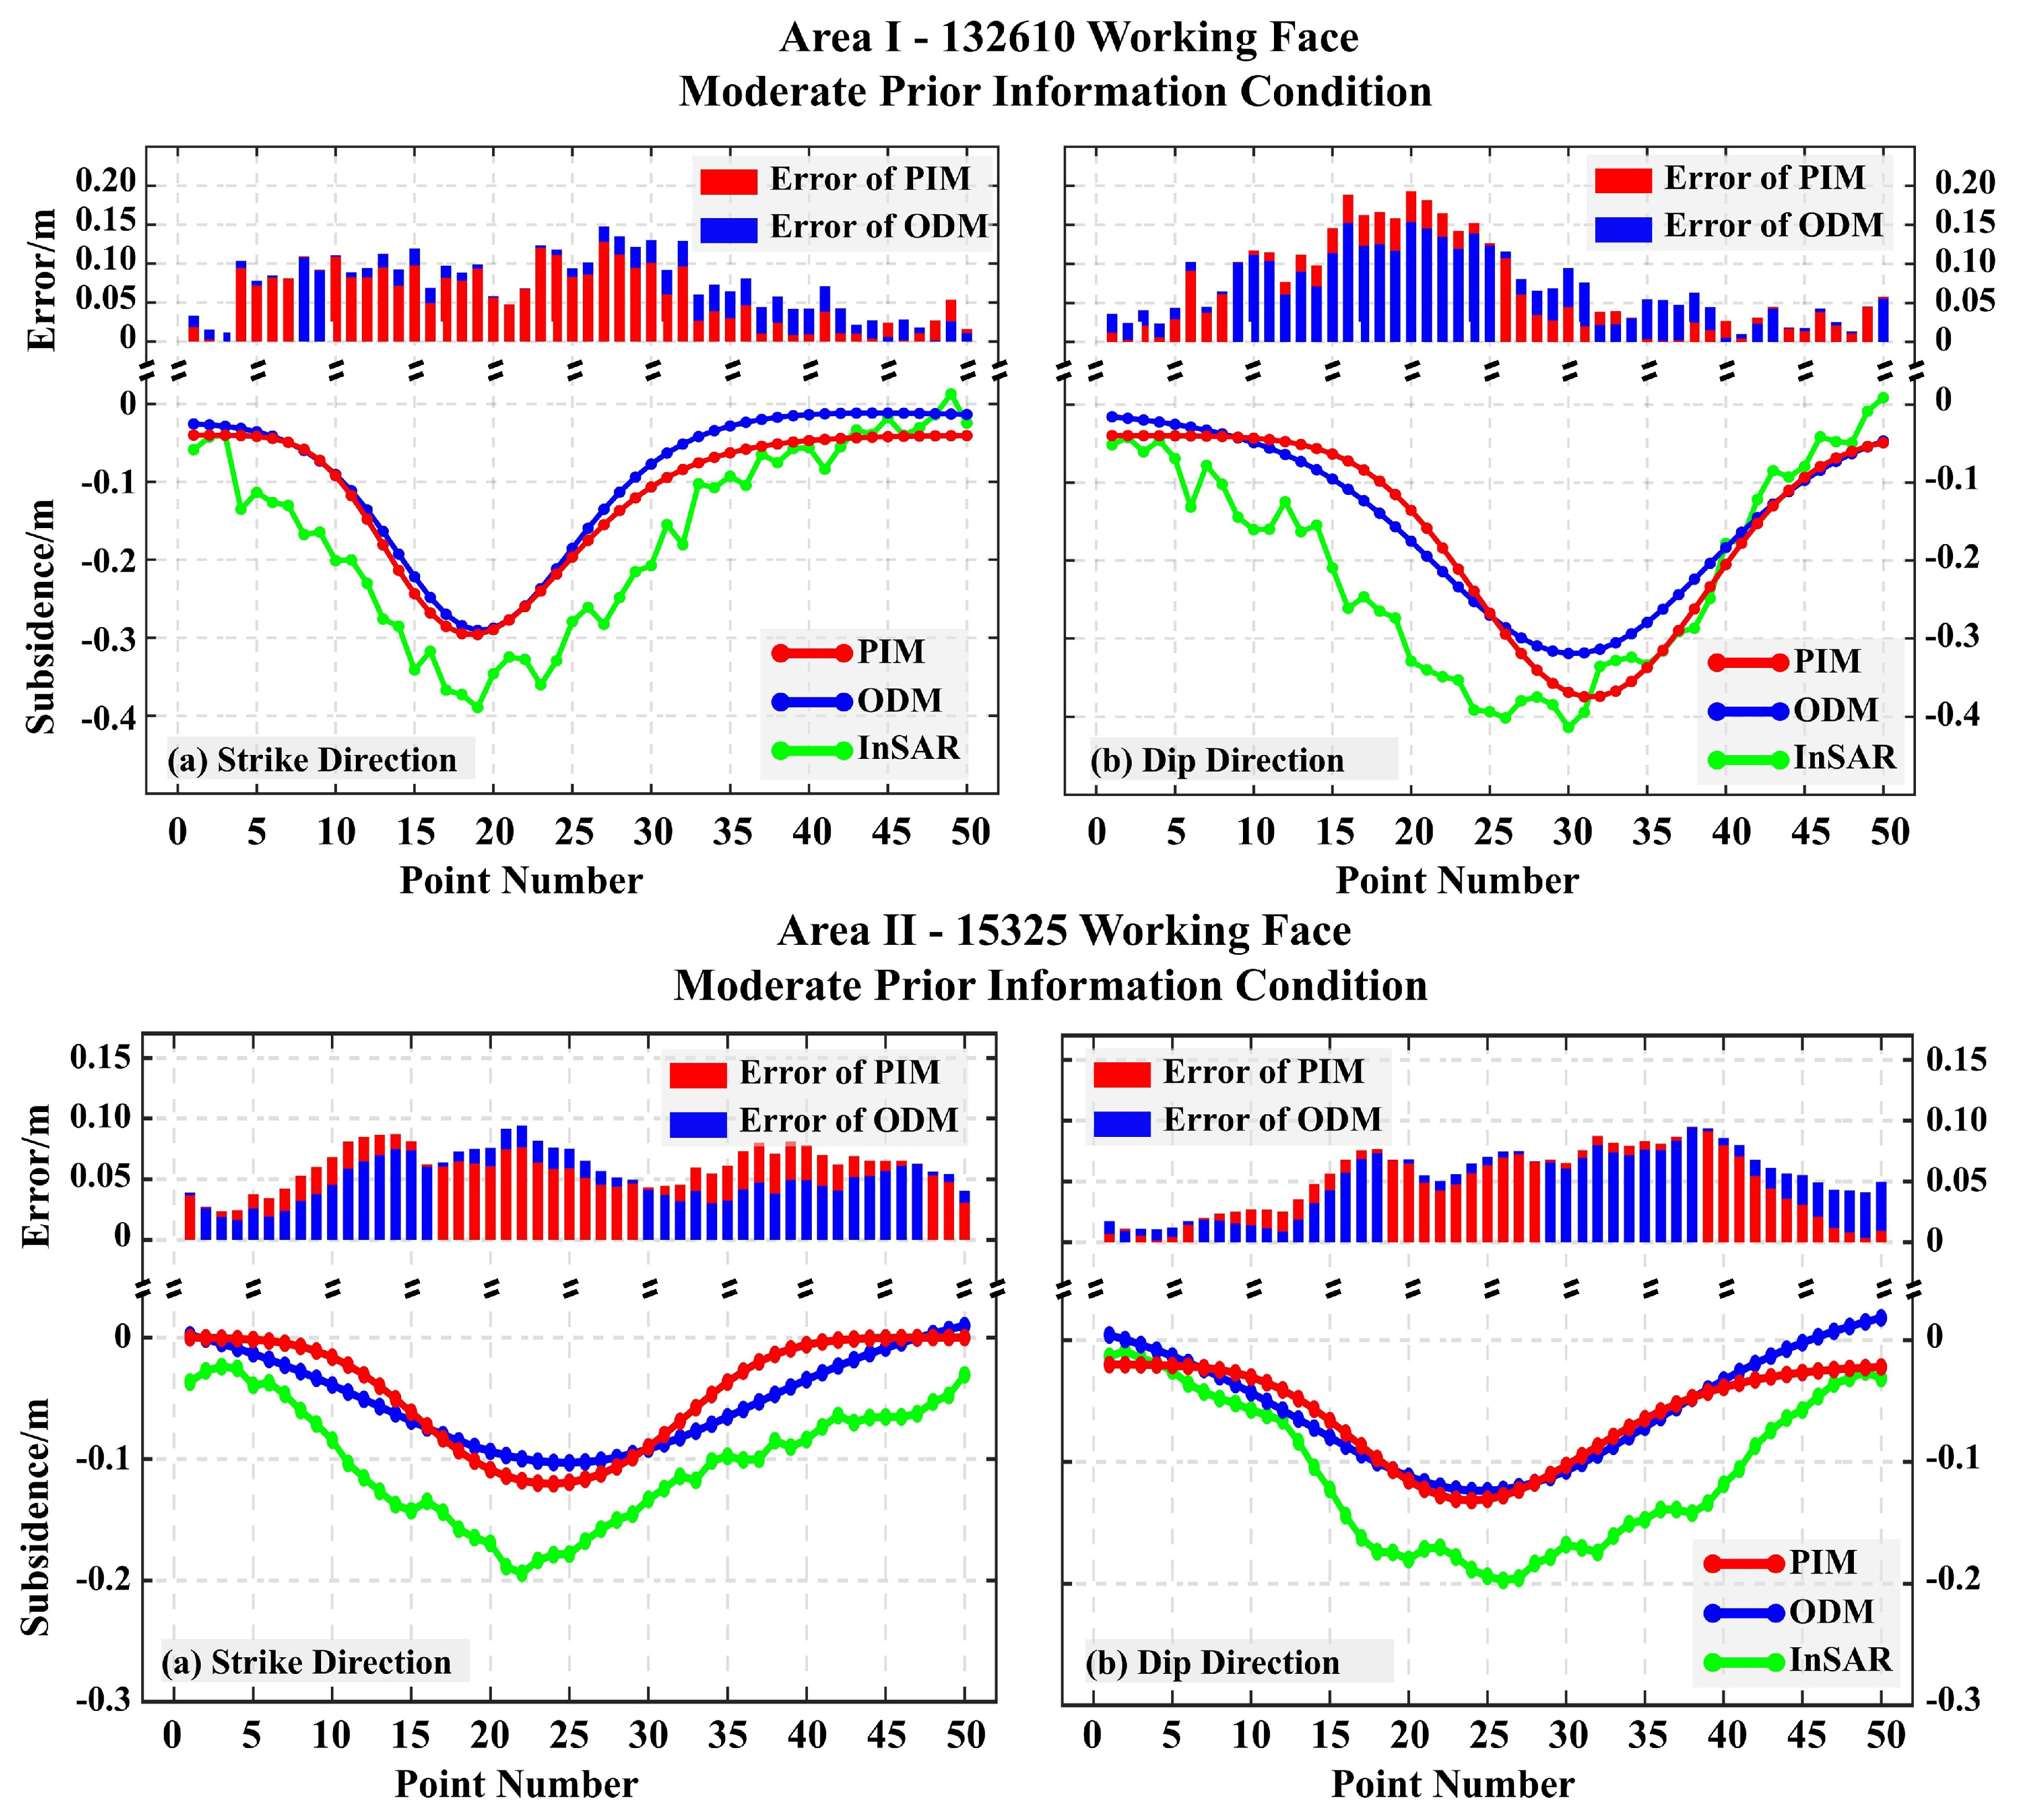
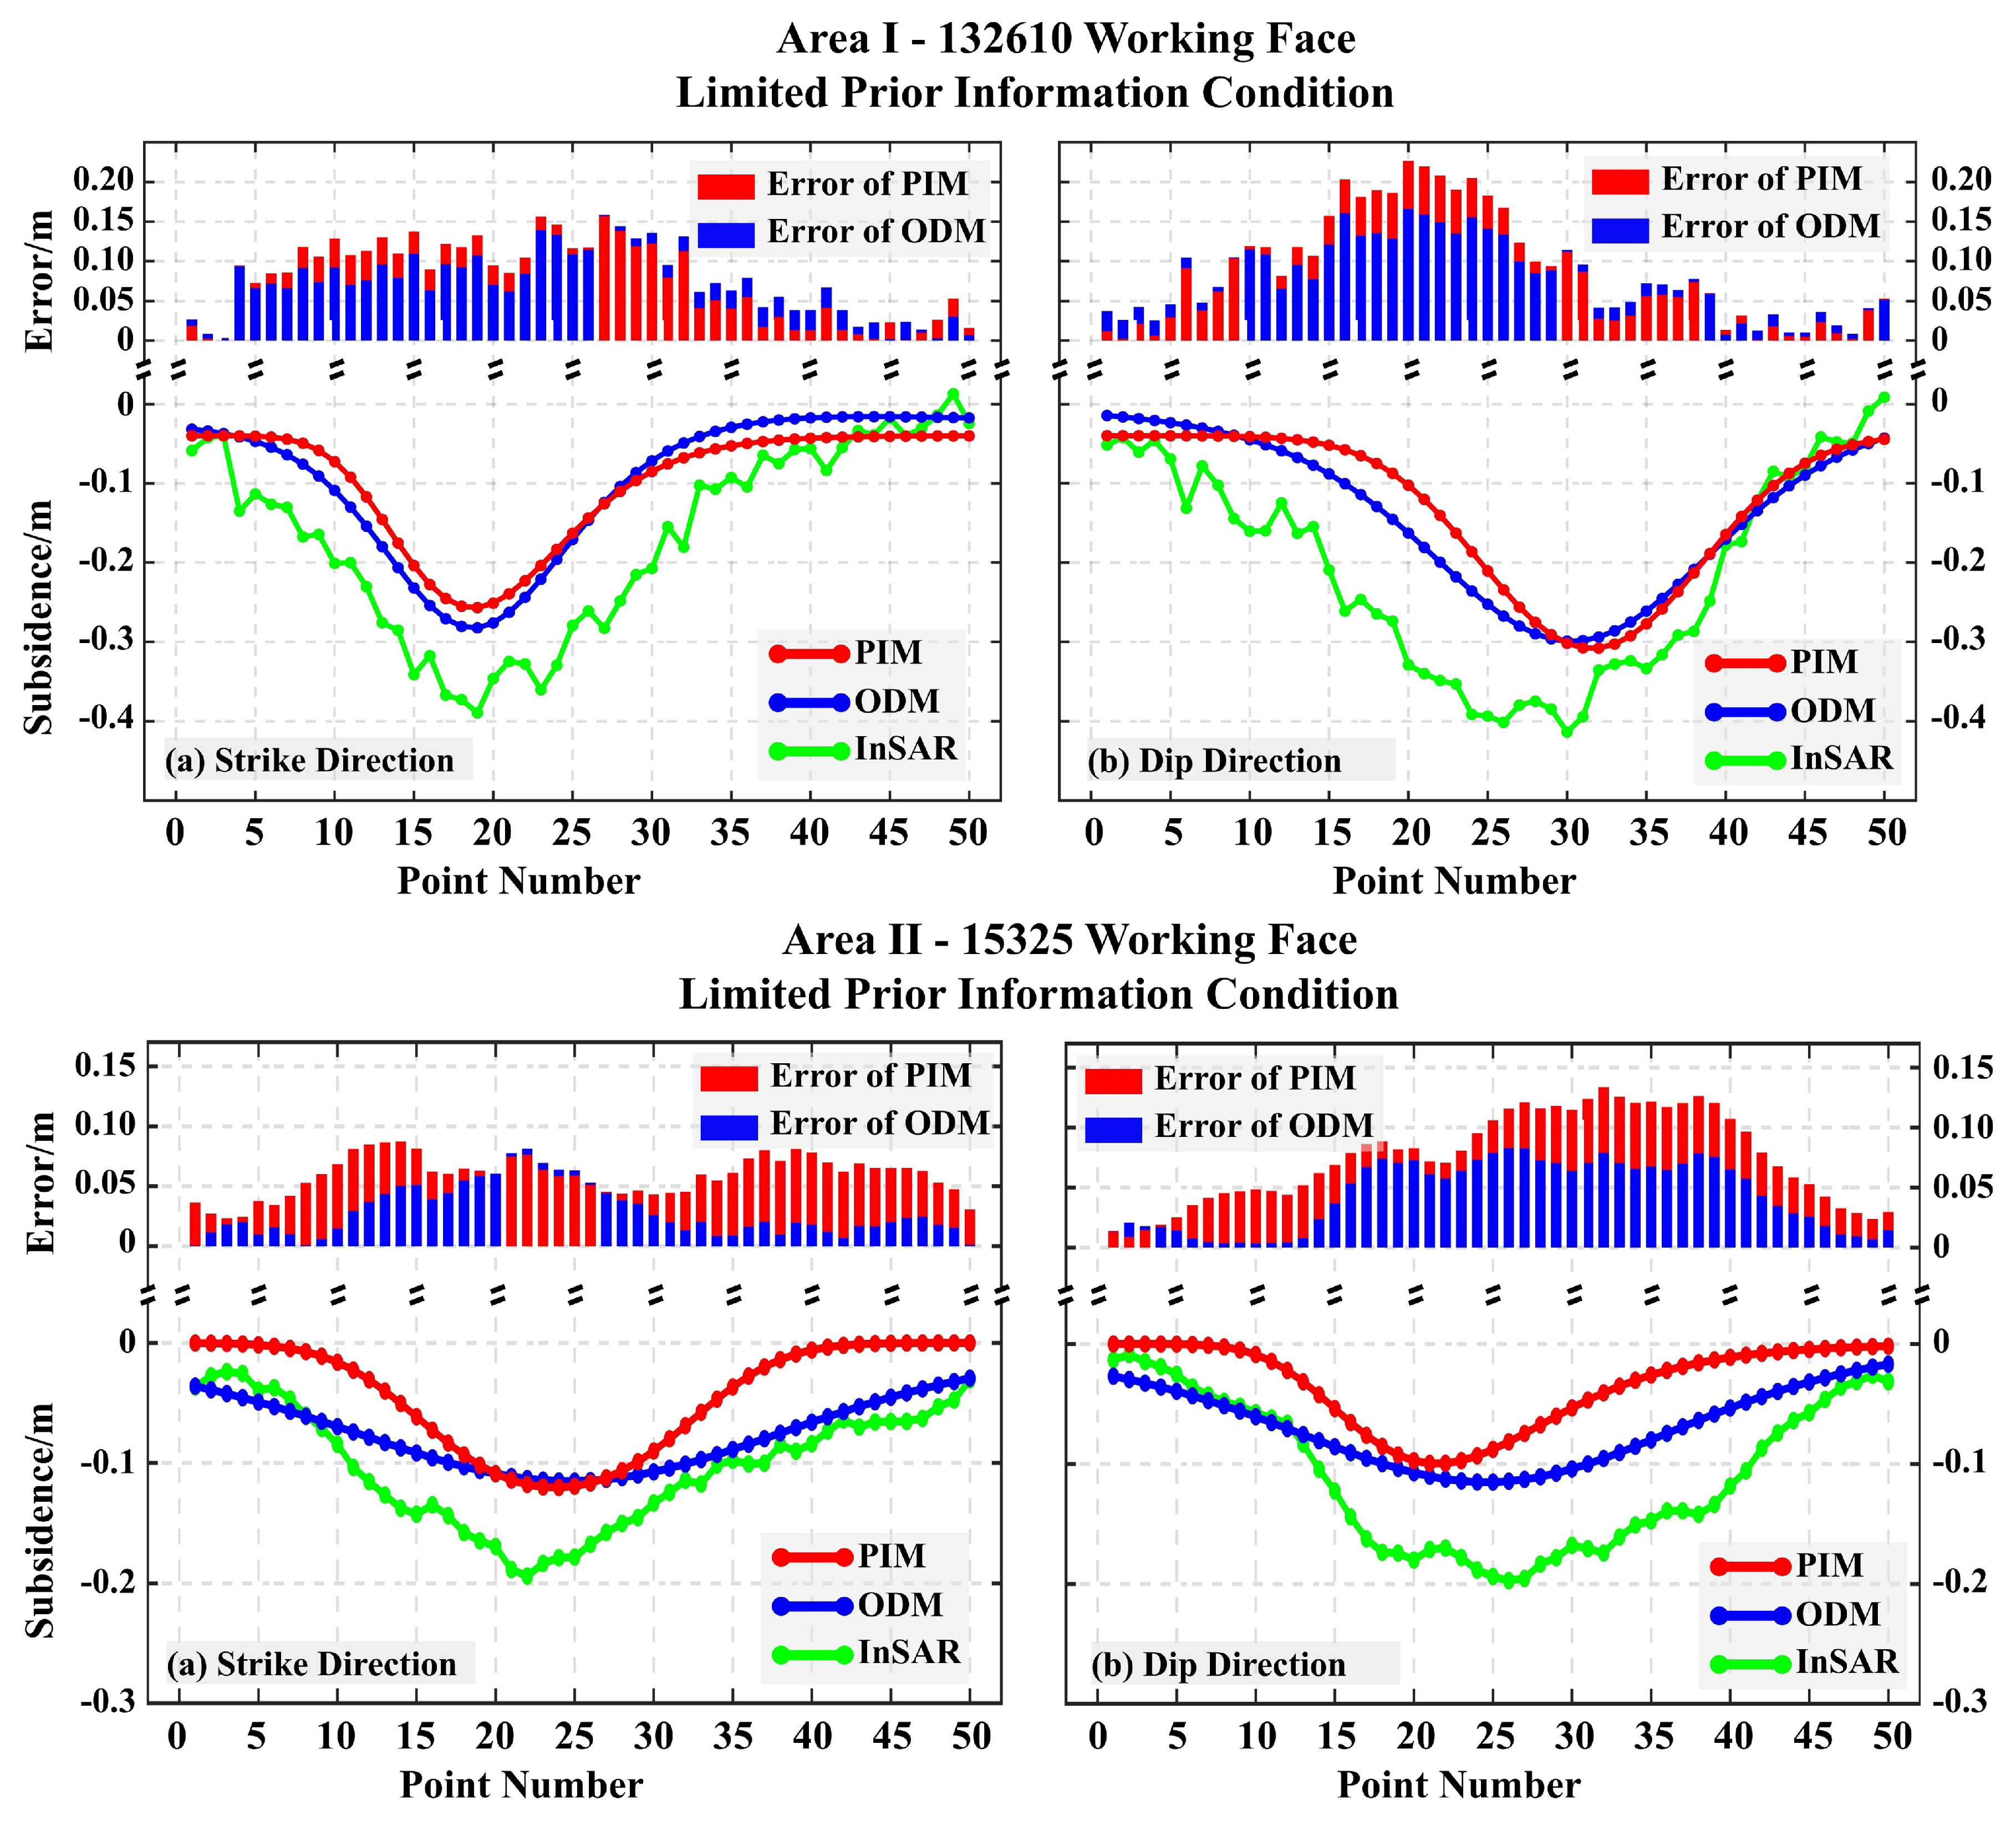
Furthermore, the core aspect of the proposed underground locating methods is the congruence between models (PIM and ODM) and InSAR-derived deformation. To explicitly quantify this relationship, synthetic displacement fields were generated using three-dimensional geometric parameters (as shown in Section 2) and condition-specific geomechanical parameters (as shown in Section 4.3). Subsequently, the simulation results were compared with InSAR-derived deformation in both Area I and Area II of both strike and dip direction under different priori geological information conditions. Figure 14, Figure 15 and Figure 16 present spatially resolved comparisons between simulated and observed deformation under three prior information conditions in the two areas.
Detailed information condition analysis (Figure 14) reveals superior PIM performance with an average RMSE of 4.97 cm in Area I and 1.78 cm in Area II, compared with ODM, which yields RMSEs of 7.21 cm in Area I and 3.77 cm in Area II. This improvement is attributed to PIM’s ability to capture subsidence gradients more effectively. The 31.07% and 52.79% RMSE reductions in the two areas highlight the critical importance of high-resolution lithological constraints for improving PIM performance.
In the moderate information conditions (Figure 15), we demonstrate a convergent model performance with PIM achieving average RMSE values of 8.02 cm in Area I and 5.63 cm in Area II, and ODM producing RMSEs of 7.98 cm in Area I and 5.65 cm in Area II, suggesting equivalent predictive capability of PIM and ODM under regional-scale geological priors.
Under limited information constraints (Figure 16), ODM achieves 14.09% and 39.06% precision enhancement in the two study areas (average RMSEs of PIM are 10.08 cm in Area I and 7.22 cm in Area II, while those of ODM are 8.66 cm in Area I and 4.40 cm in Area II), highlighting its robustness in priori geological information-scarce environments. This inversion stability stems from ODM’s elasticity physics principle, which can minimize reliance on complex geological constraints.
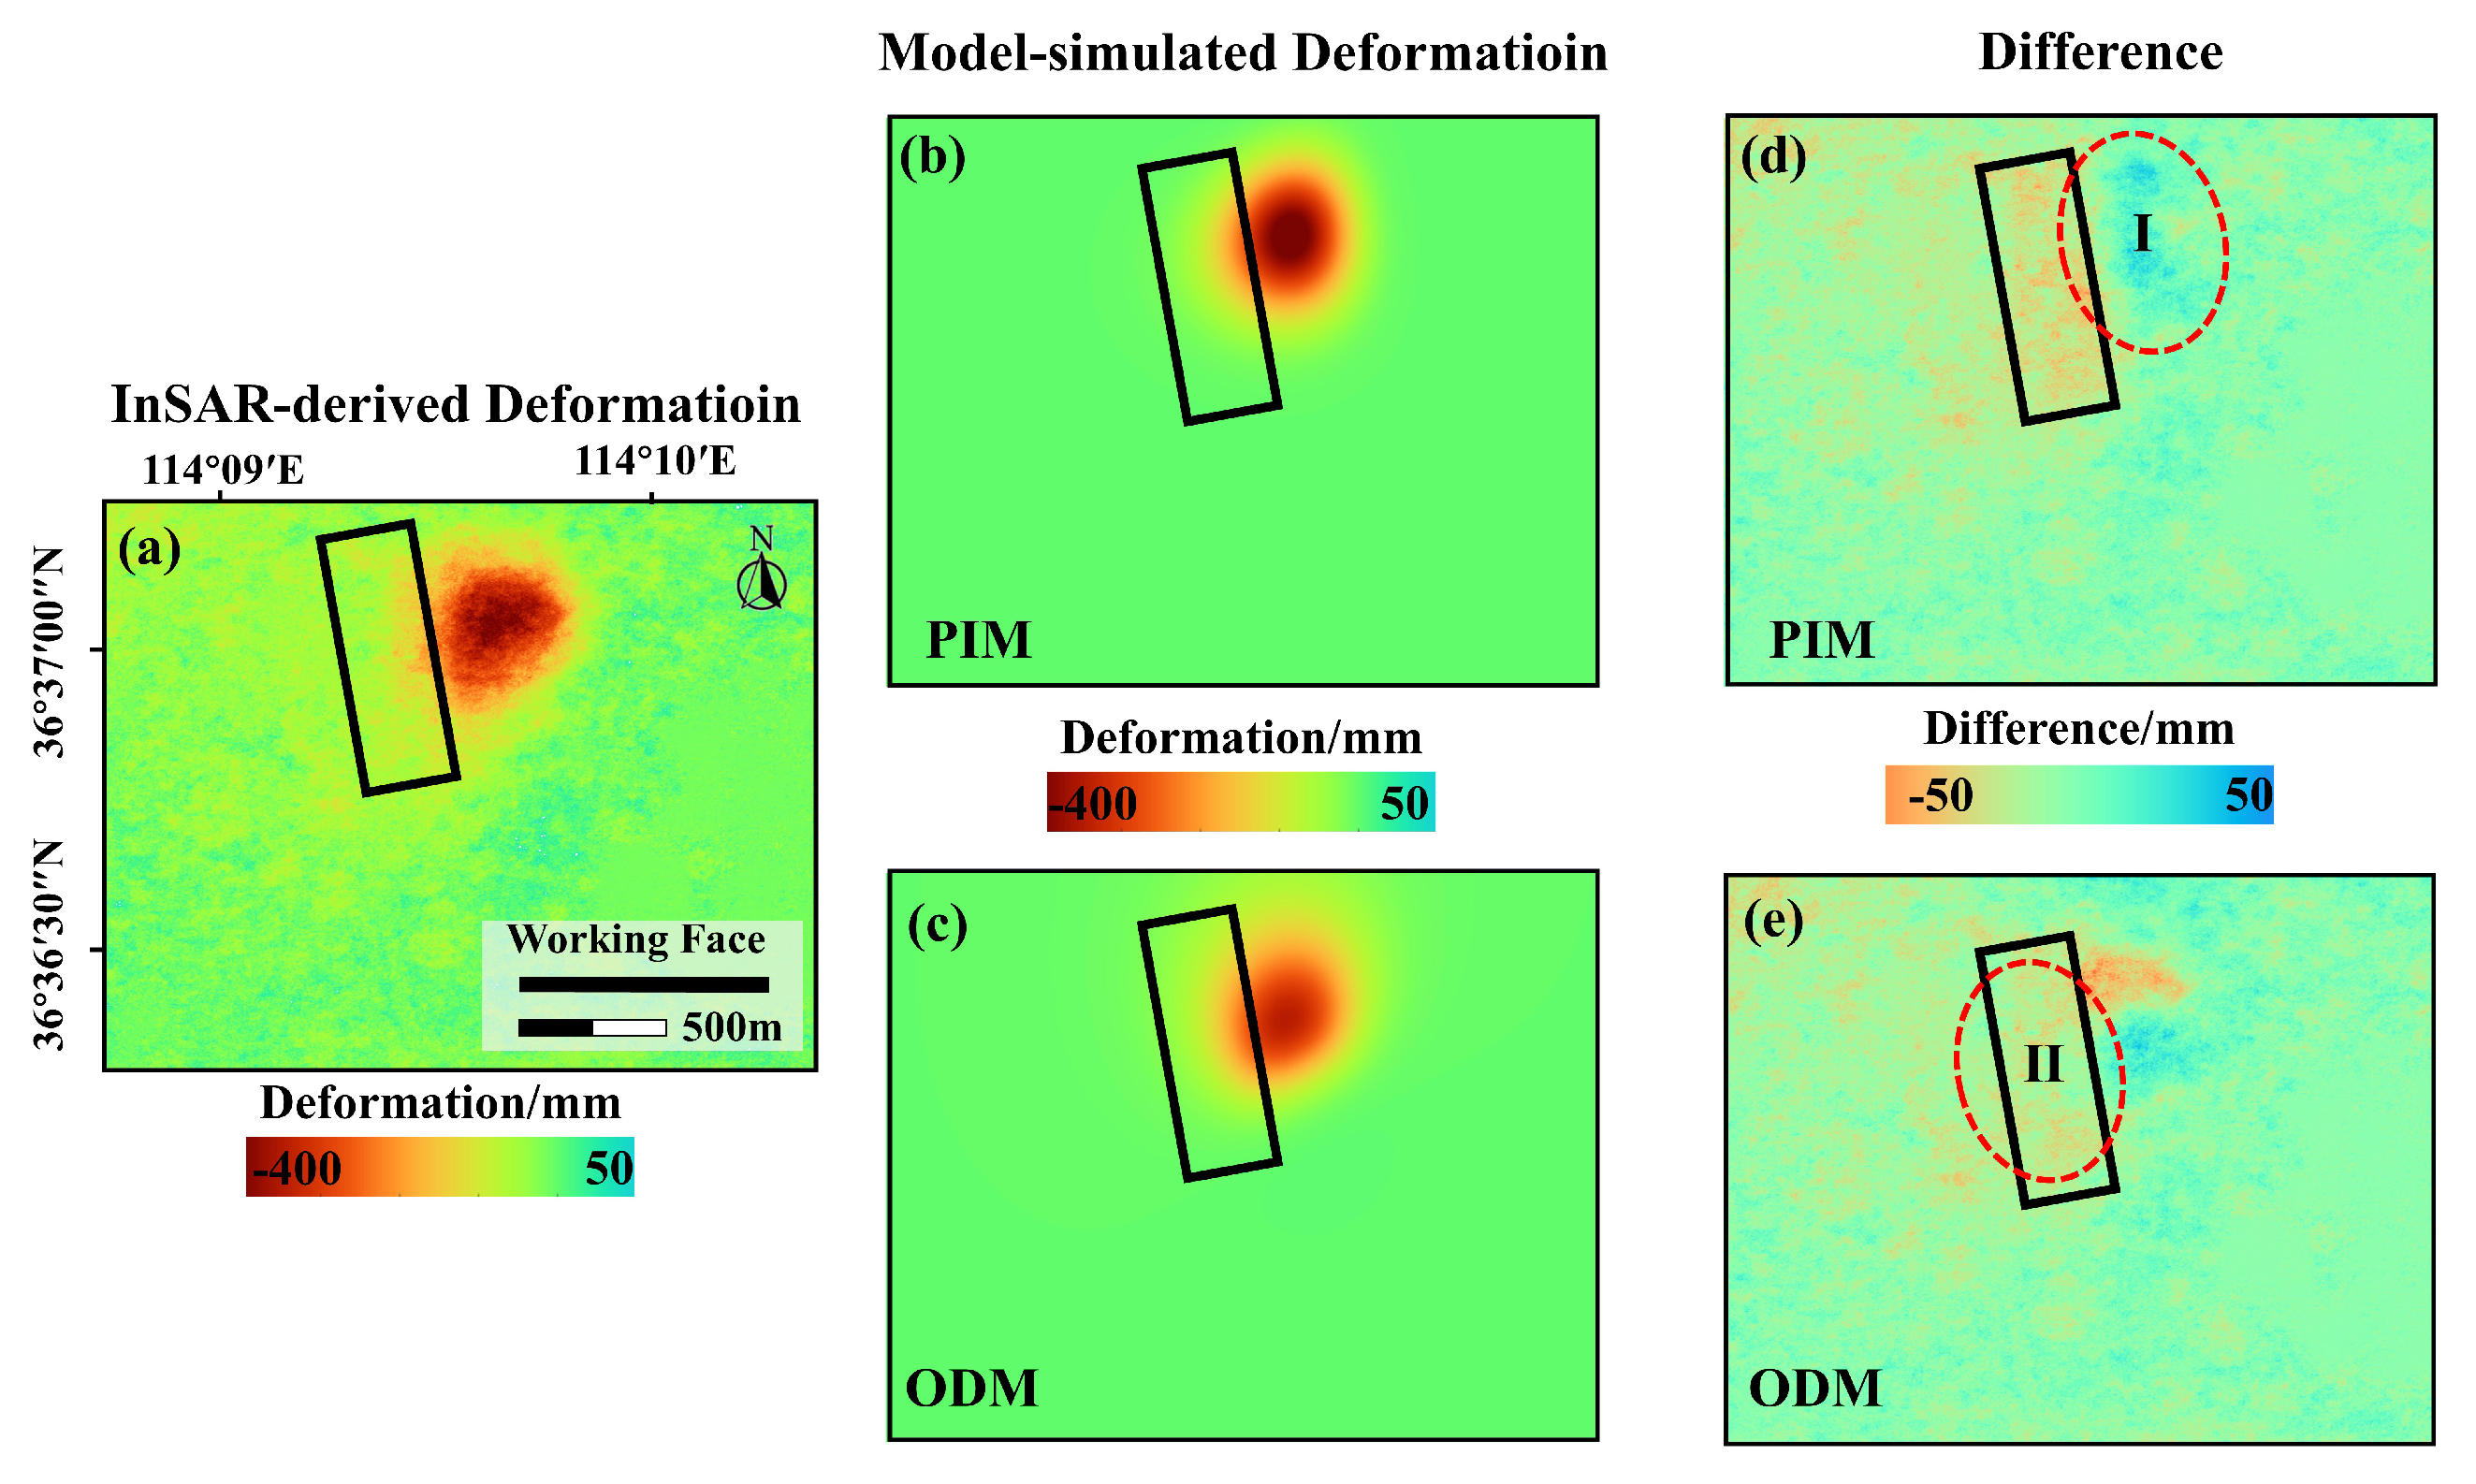
Furthermore, to more effectively demonstrate the fitness between the model-forward simulations and the observed ground deformation, we calculated the residuals between the InSAR-derived observations and the forward simulation results (obtained using the actual geometric parameters and detailed prior information) for Area I, expressed as root mean square error (RMSE). The results are presented in Figure 17. Specifically, the full-pixel RMSE values for Area I are 38.56 mm (for PIM) and 73.15 mm (for ODM), indicating that both models can effectively capture mining-induced ground deformation. Notably, Figure 17 reveals relatively large residuals for both models in the western part of the study area. This discrepancy is attributed to the presence of old goaf in that direction, which induces residual deformation affecting the target area. Region I (red) demonstrates that PIM provides a better fit to the subsidence center, as its underlying mechanism aligns more closely with the coal mining process. Conversely, Region II shows that the simulated deformation influence range of ODM is more extensive. This occurs because ODM treats the overlying strata as a single elastic unit, enabling deformation to propagate over a wider area.
Collectively, the comparative analysis reveals distinct performance characteristics of PIM and ODM across varying prior information availabilities. Under detailed information conditions, where high-resolution stratigraphic constraints are accessible, PIM demonstrates superior accuracy in parameter estimation. Conversely, in a limited information condition, characterized only by global-scale geologic data, ODM exhibits enhanced precision. A moderate information condition, with regional geological investigations data, exhibits comparable performance of the two models.

5. Discussion

5.1. Impact of SAR Spatial Resolution on Goaf Locating Accuracy

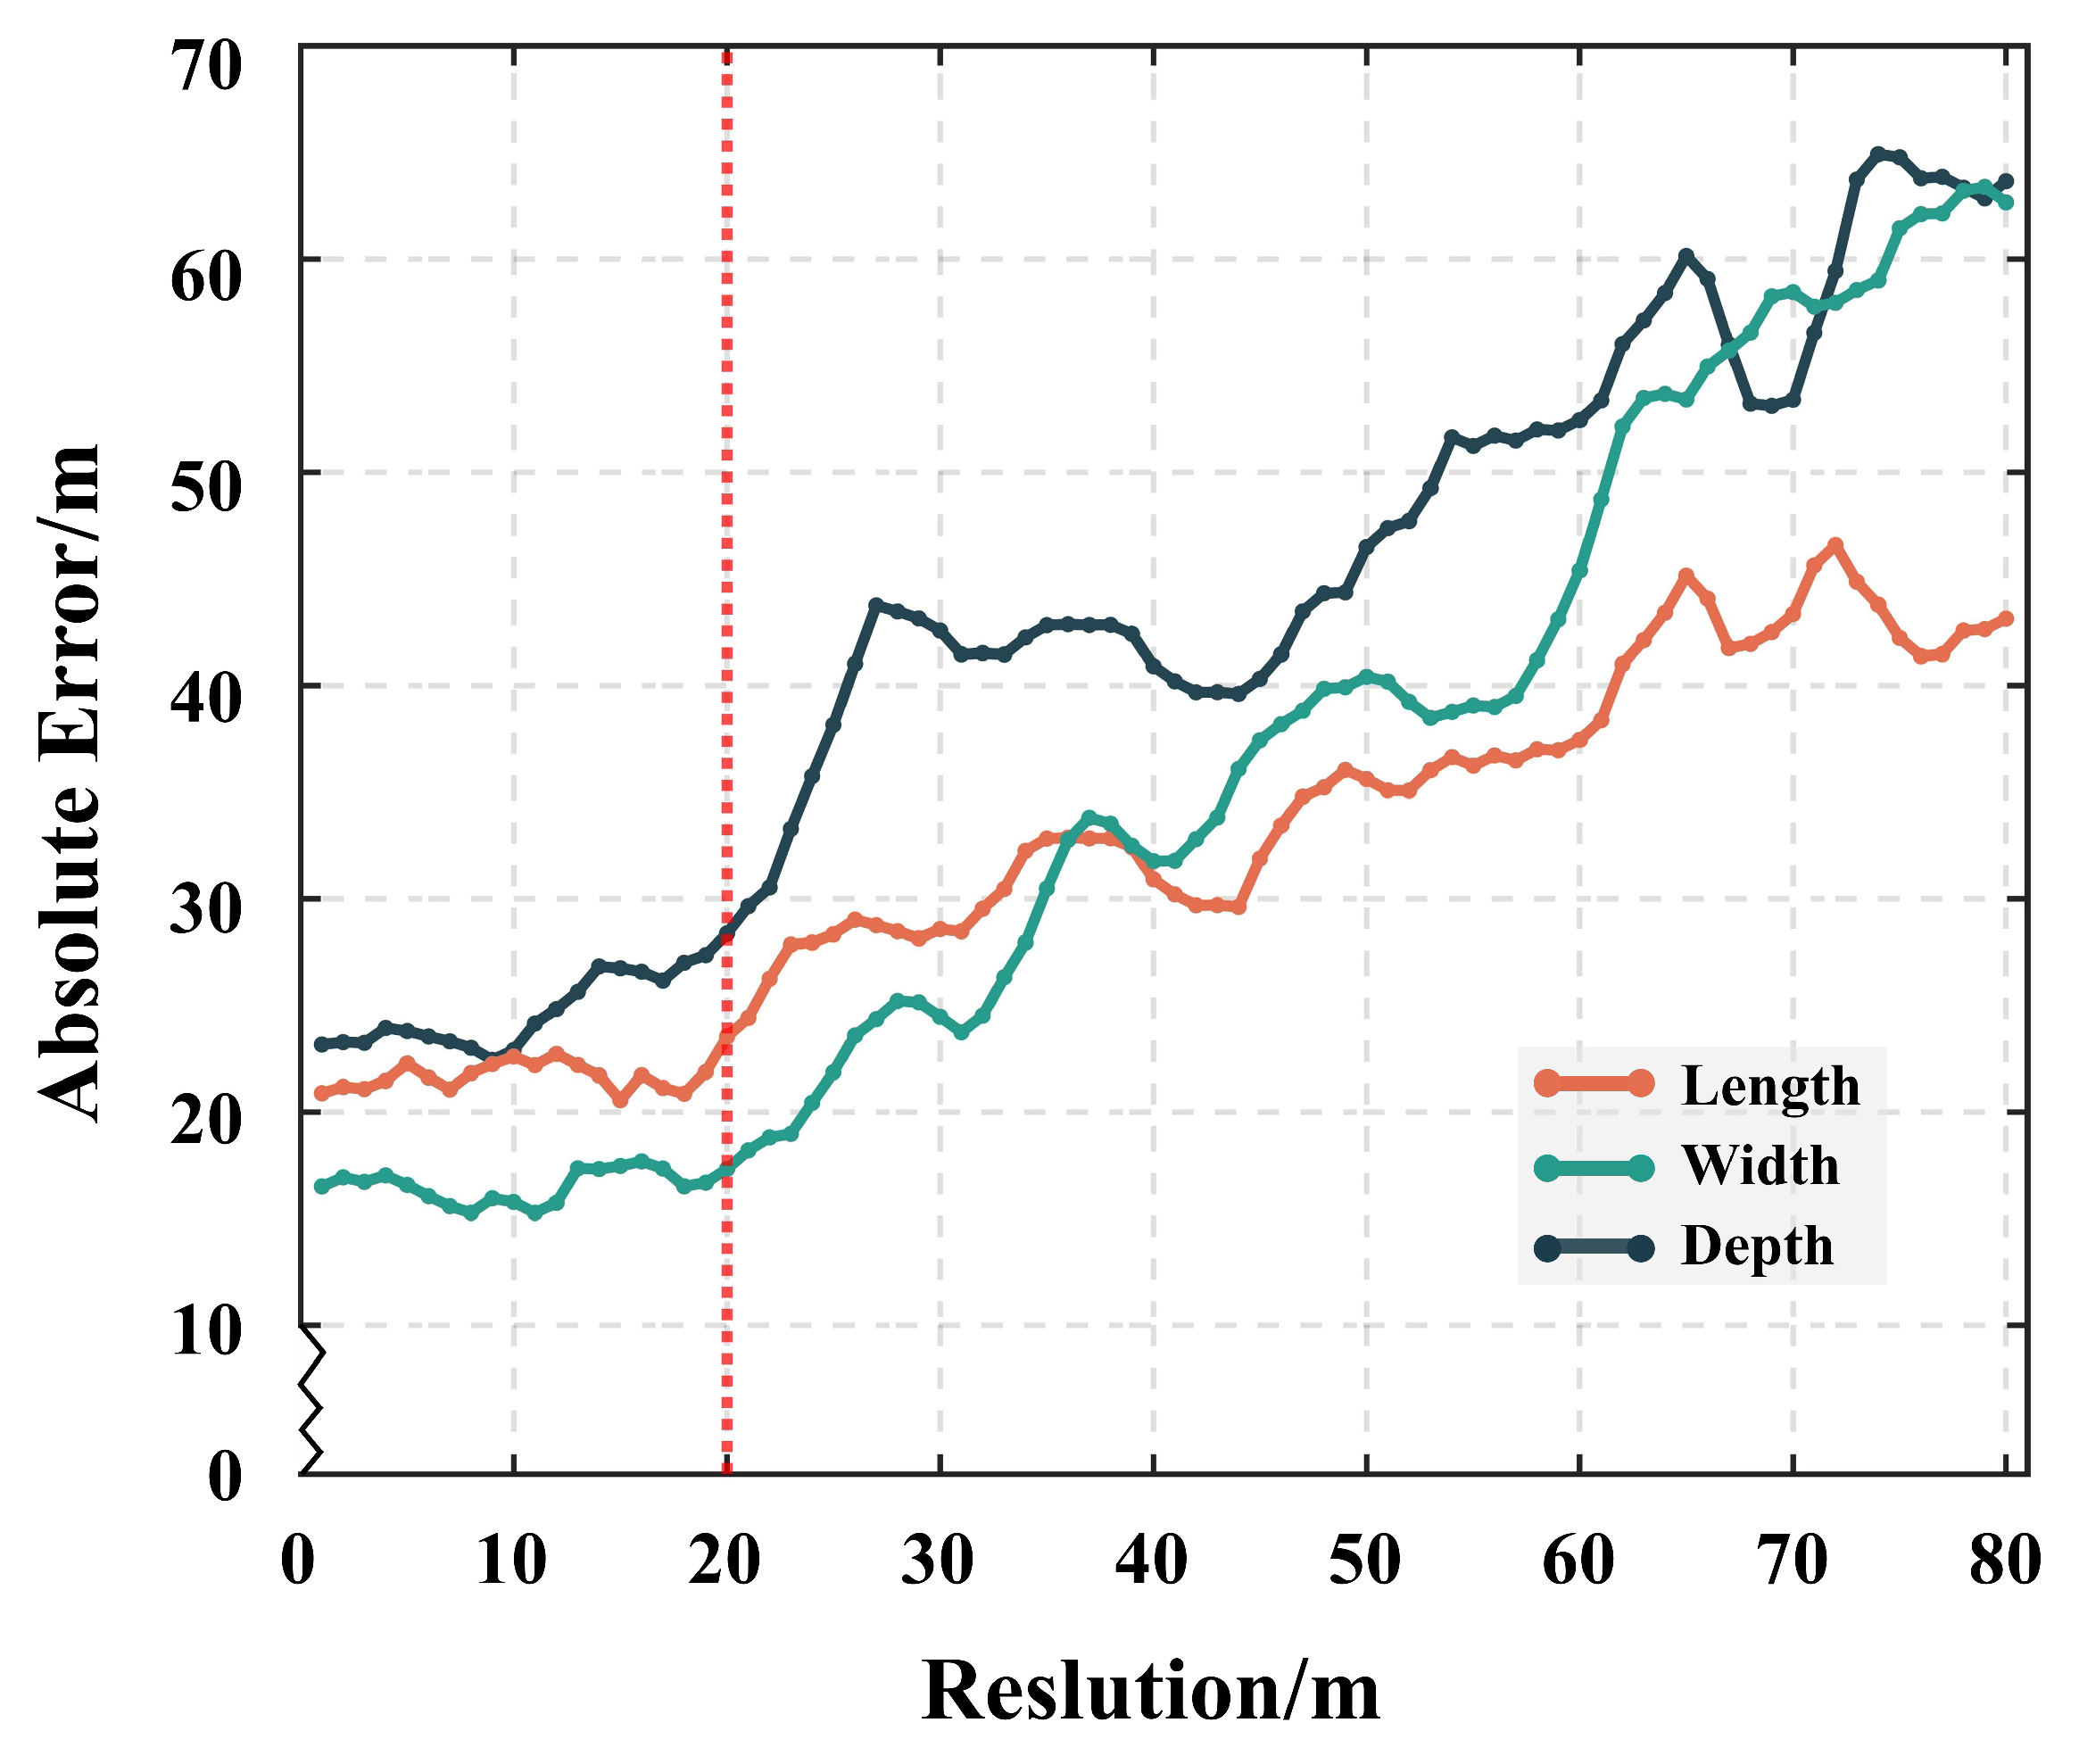
The application of underground goaf detection in illegal mining monitoring is a routine, long-term, and large-scale operation, which underscores the critical importance of considering the economic cost of SAR data. While commercial RADARSAT-2 SAR data provide enhanced spatial resolution compared with open-access SAR data (e.g., Sentinel-1A) observations, their operational costs pose challenges for illegal mining monitoring operations. Consequently, to evaluate the cost–precision trade-off, this study conducts systematic simulations assessing resolution-dependent locating errors. To evaluate the cost–precision trade-off, this study conducts systematic simulations assessing resolution-dependent localization errors. Synthetic goaf geometries (the strike length L = 500 m, the dip length W = 100 m, the depth H = 500 m, the dip angle φ = 20°, the azimuth angle α = 60°, the goaf height h = 3 m, and the central coordinates were (0 m, 0 m)) were forward-modeled under satellite geometry (incident angle = 35.5° and heading angles = 349.6°), with progressive spatial degradation (1–80 m) applied to simulate multi-resolution ground deformation. Then the inversion framework proposed in Section 3.4.3 was applied for parameter estimation. The inversion results are shown in Figure 18.
Figure 18 illustrates that sub-20 m resolutions maintain sub-meter stability in strike length ( δ = 0.74 m) and dip width ( δ = 0.77 m) estimation, with depth errors constrained to δ = 1.83 m. Beyond the 20 m resolution, error variances surge by 266% (L), 589% (W), and 170% (H). This nonlinear error escalation reveals the spatial resolution thresholds affecting inversion robustness. A conclusion can therefore be drawn that the underground goaf locating accuracy using the proposed framework has certain robustness when the spatial resolution is better than 20 m, and once the resolution is more than 20 m, the accuracy will decrease significantly.

5.2. Influence of Determining Azimuth in Advance

The surrounding old goaves introduce complex deformation interference patterns, compromising conventional azimuth estimation approaches that rely on non-temporal deformation signatures. To quantify this effect, comparative inversion experiments were conducted in Area I: (1) RM-DBC-guided azimuth estimation (Section 3.4.2) versus (2) full-parameter joint inversion treating azimuth as a free variable.
As quantified in Table 7, RM-DBC pre-determination achieved sub-2° azimuth precision, while unconstrained inversion reached an error of 18° (RM-DBC 167° and unconstrained inversion 151°). In addition, determining the azimuth in advance using RM-DBC reduces dimensional estimation errors by 5.8% in dimensional estimation accuracy and 11.86 m in center positioning accuracy compared with unconstrained inversion. This suggests that determining the azimuth in advance can significantly improve the accuracy of underground goaf locating.

5.3. Comparisons of Non-Hybrid and Hybrid Optimization Algorithms

Underground goaf locating constitutes a high-dimensional nonlinear inverse problem requiring global optimization techniques to search a complex solution space. While single-strategy optimizers (e.g., Particle Swarm Optimization, PSO) demonstrate rapid initial convergence, they exhibit premature convergence in complex nonlinear solution spaces due to gradient estimation limitations [25].
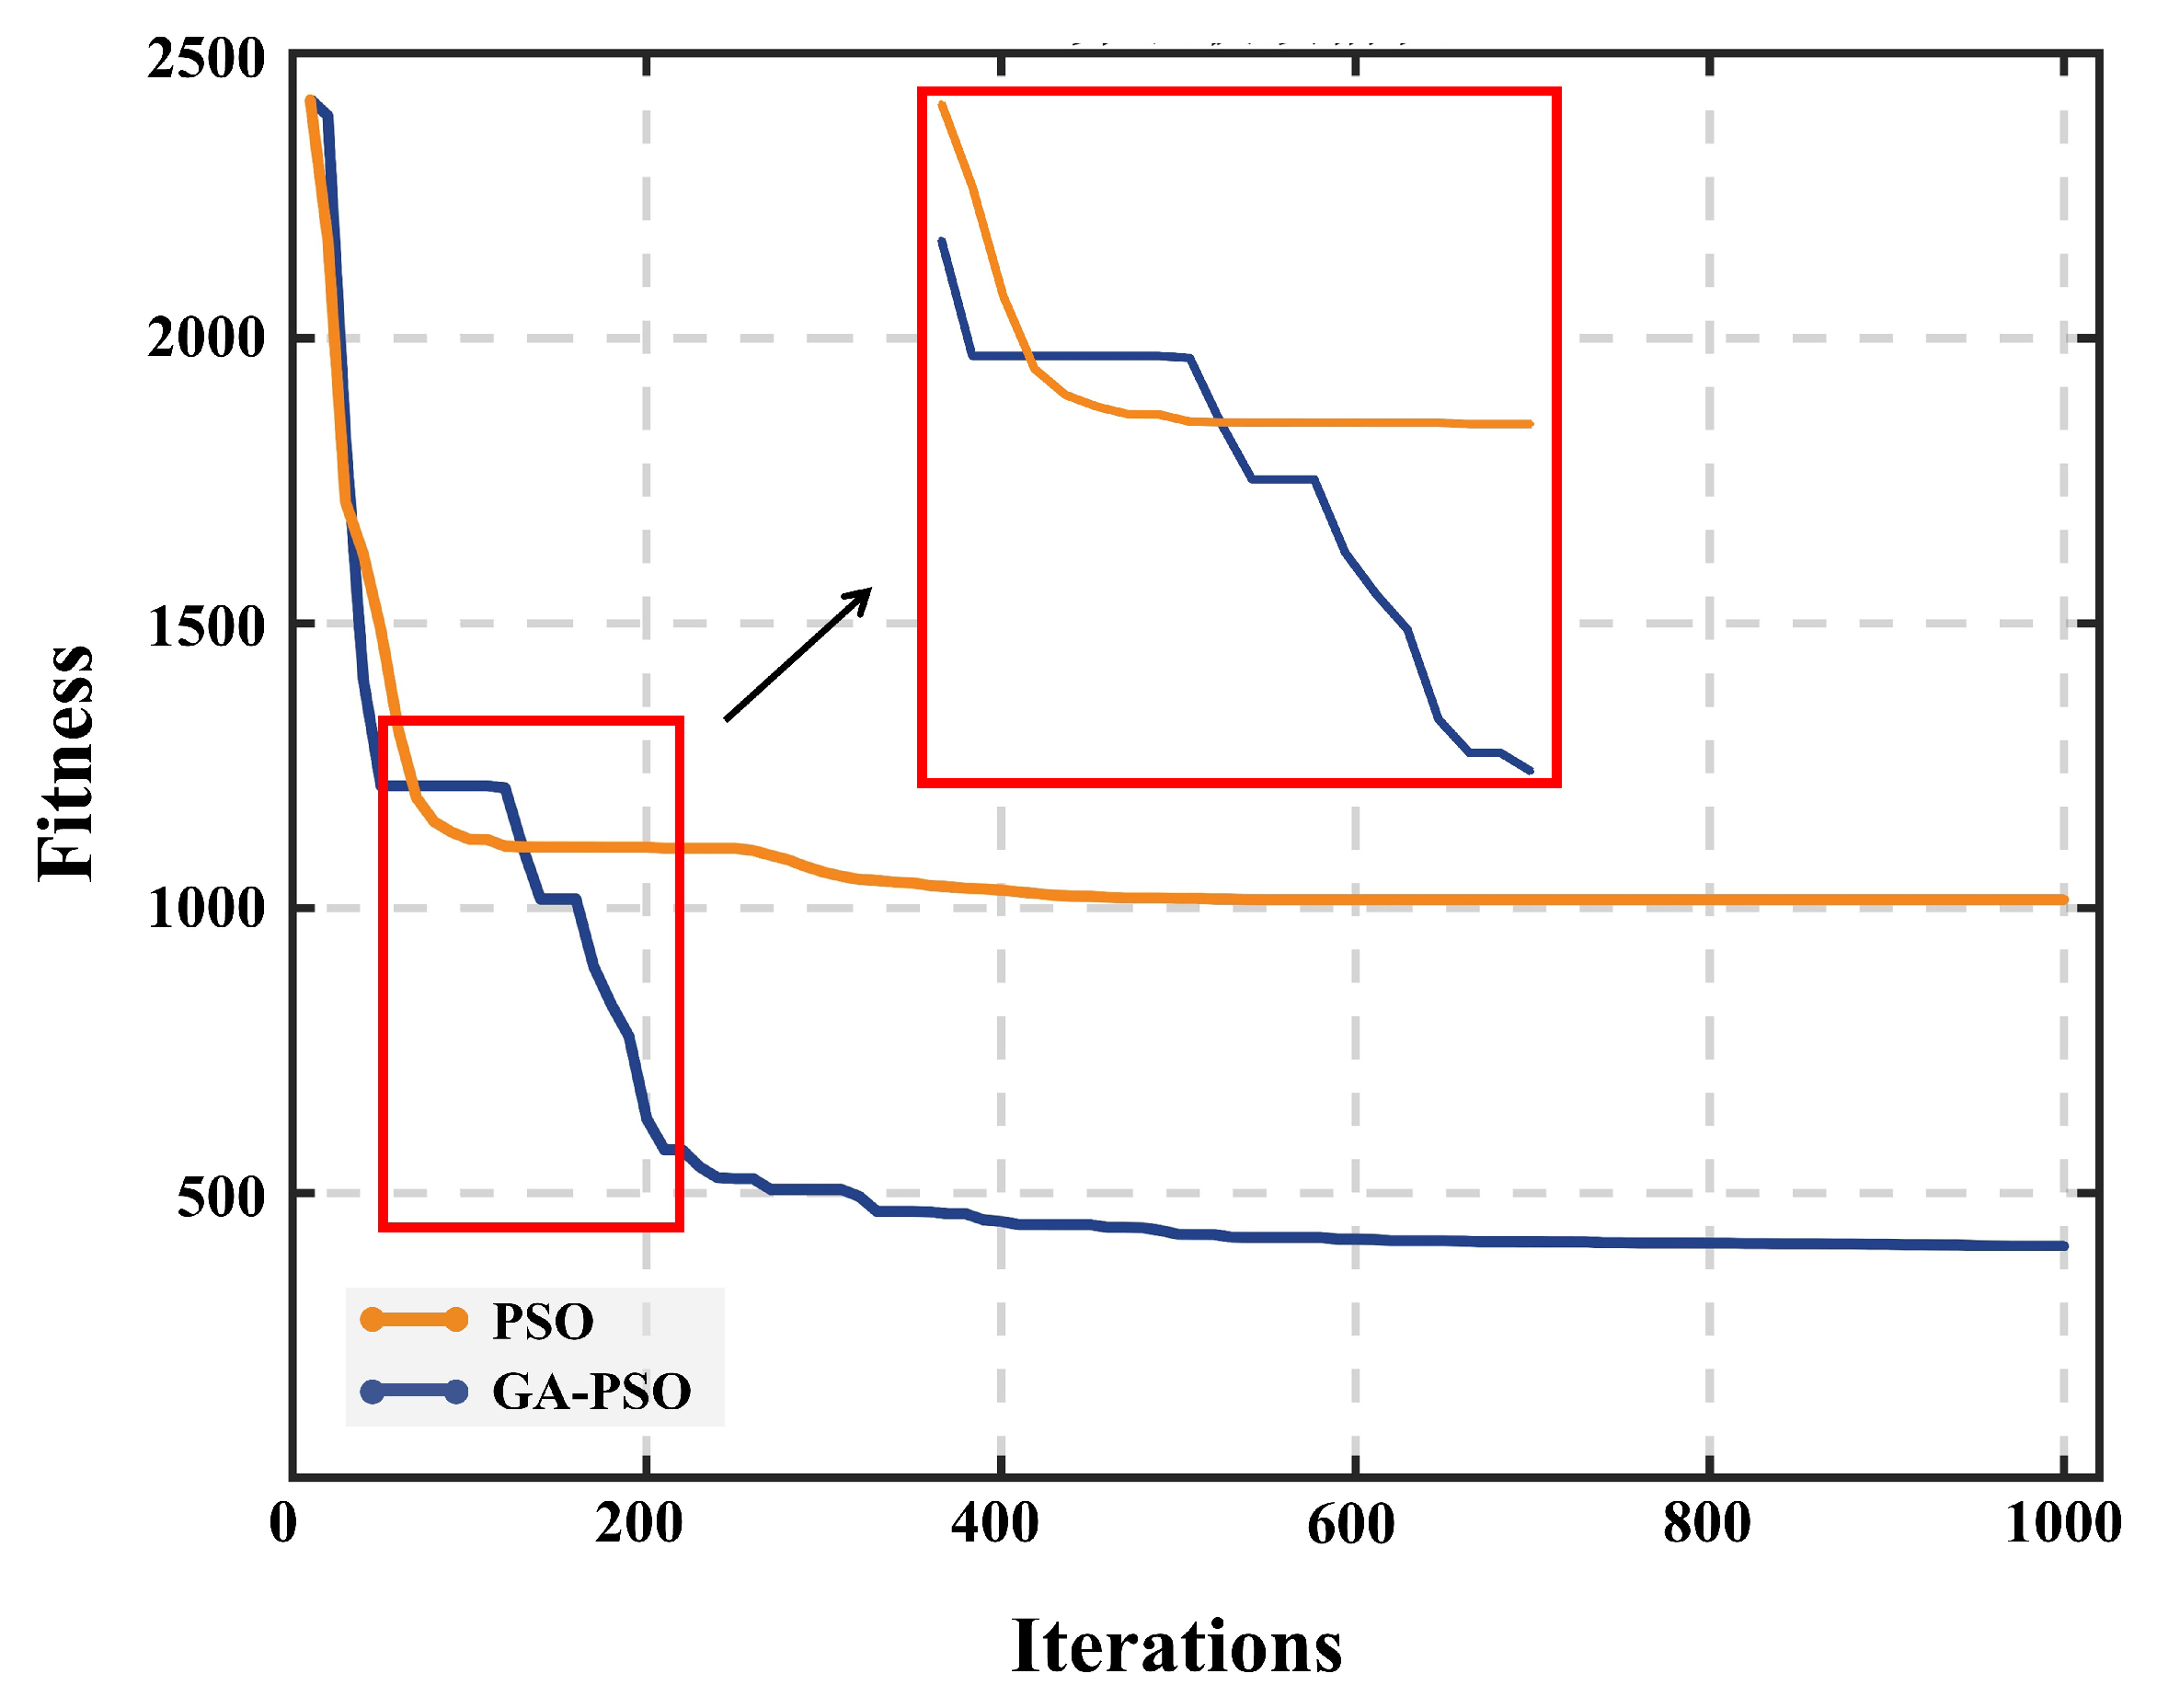
To address this challenge, a hybrid GA-PSO optimization algorithm, synergizing genetic algorithm (GA) exploration with PSO exploitation mechanisms, is applied to search for the global optimum. To compare the impacts of non-hybrid and hybrid optimization algorithms, convergence tests were conducted using the case of this study (refer to Section 4.3 for model parameter settings), comparing standalone PSO against GA-PSO using 1000 iterations and a population size of 200. The convergence results are depicted in Figure 19.
From Figure 19, it is demonstrated that when the hybrid algorithm falls into a local optimum, it continues to search for the global optimum as the iterations proceed. While the non-hybrid algorithm will directly output the local optimal solution. This performance enhancement relies on GA’s niche preservation maintaining solution space diversity. Therefore, in the underground goaf locating project, hybrid algorithms are more suitable to be selected for estimating parameters.

6. Conclusions

This study proposed an underground goaf locating framework based on D-InSAR with three different prior geological information conditions. Specifically, this framework classifies priori geological information into three categories to evaluate PIM and ODM across varying data availabilities, providing references into model selection criteria, which indicates that PIM performs better in the detailed information condition, while ODM performs better in the limited information condition, and the two models perform similarly in the moderate condition. On this basis, several conclusions have been drawn.
Model performance exhibits strong dependency on prior geological information. In a detailed prior information condition, PIM demonstrates better accuracy in dimensional parameter estimation than ODM, achieving a 6.9% reduction in maximum relative error, attributable to its capacity to integrate layer-specific lithological properties. Conversely, in a limited prior information condition, ODM achieves 3.4% precision enhancement in maximum relative error than PIM, relying on ODM’s elasticity physics principle, which can minimize reliance on complex geological constraints. Moderate prior information conditions reveal model equivalency, suggesting the equivalent predictive capability of PIM and ODM under regional-scale geological priors.
Notably, centroid positioning accuracy remains consistent across all prior information conditions distributed around 25 m (25.24 m, 27.47 m, 23.36 m) in Area I and around 32 m (32.45 m, 31.89 m, 33.39 m) in Area II, which demonstrates the weak correlation between the center point locating and different priori geological information conditions. Additionally, the RM-DBC methodology reduces azimuth errors and improves dimensional accuracy compared with unconstrained inversions. Algorithmically, hybrid GA-PSO optimization proves effective for searching solutions in high-dimensional nonlinear space.
Collectively, this framework establishes a reference for underground goaf locating problem. Future extensions could integrate multi-source remote sensing data to further explore complex ground deformation and lithologic characteristics in coal mining areas.

Author Contributions

Conceptualization, K.Z., Y.W. and F.Z.; methodology, K.Z. and Y.W.; software, K.Z. and Z.S.; validation, K.Z., F.Z., T.W. and Y.W.; formal analysis, K.Z. and N.Z.; investigation, D.Z., X.D., Z.M. and G.Z.; writing—original draft preparation, K.Z.; writing—review and editing, K.Z., F.Z., Y.W. and W.H.; visualization, K.Z.; supervision, K.Z.; project administration, K.Z. All authors have read and agreed to the published version of the manuscript.

Funding

This work has been supported in part by the National Key R&D Program of China (Grant No. 2022YFE0102600), in part by the National Natural Science Foundation of China (Grant No. 52474184, No. 42474018, No. U22A20598, No. 52104174), in part by the Young Elite Scientists Sponsorship Program by CAST (Grant No. 2023QNRC001-YESS20230599) and in part by the China Postdoctoral Science Foundation (Grant No. 2023T160685, No. 2020M671646).

Data Availability Statement

The original contributions presented in the study are included in the article, further inquiries can be directed to the corresponding author.

Acknowledgments

Some figures were prepared using the public domain GMT software [Wessel and Smith, 1998]. Optical images were provided by Google Earth.

Conflicts of Interest

The authors declare no conflicts of interest.

References

  1. The Energy Institute. Statistical Review of World Energy; The Energy Institute: London, UK, 2024. [Google Scholar]
  2. Xia, Y. Research on the Key Technologies of InSAR/GIS Monitoring for Illegal Underground Mining in Coal Mining Area. Ph.D Thesis, China University of Mining and Technology, Xuzhou, China, 2020. [Google Scholar]
  3. Fan, H.D.; Cheng, D.; Deng, K.Z.; Chen, B.Q.; Zhu, C.G. Subsidence monitoring using D-InSAR and probability integral prediction modelling in deep mining areas. Emp. Surv. Rev. 2015, 47, 438–445. [Google Scholar] [CrossRef]
  4. Yang, Z.; Li, Z.; Zhu, J.; Wang, Y.; Wu, L. Use of SAR/InSAR in mining deformation monitoring, parameter inversion, and forward predictions: A review. IEEE Geosci. Remote Sens. Mag. 2020, 8, 71–90. [Google Scholar] [CrossRef]
  5. Li, T.; Zhang, H.; Fan, H.; Zheng, C.; Liu, J. Position inversion of goafs in deep coal seams based on DS-InSAR data and the probability integral methods. Remote Sens. 2021, 13, 2898. [Google Scholar] [CrossRef]
  6. Maus, V.; Werner, T.T. Impacts for half of the world’s mining areas are undocumented. Nature 2024, 625, 26–29. [Google Scholar] [CrossRef] [PubMed]
  7. Zahorec, P.; Pašteka, R.; Papčo, J.; Putiška, R.; Mojzeš, A.; Kušnirák, D.; Plakinger, M. Mapping hazardous cavities over collapsed coal mines: Case study experiences using the microgravity method. Near Surf. Geophys. 2021, 19, 353–364. [Google Scholar] [CrossRef]
  8. Chang, J.; Su, B.; Malekian, R.; Xing, X. Detection of water-filled mining goaf using mining transient electromagnetic method. IEEE Trans. Ind. Inform. 2019, 16, 2977–2984. [Google Scholar] [CrossRef]
  9. Zhu, J.; Li, Z.; Hu, J. Research Progress and Methods of InSAR for Deformation Monitoring. Acta Geod. Cartogr. Sin. 2017, 46, 1717–1733. [Google Scholar] [CrossRef]
  10. Gao, H.; Liao, M.; Liu, X.; Xu, W.; Fang, N. Source geometry and causes of the 2019 Ms6. 0 Changning earthquake in Sichuan, China based on InSAR. Remote Sens. 2022, 14, 2082. [Google Scholar] [CrossRef]
  11. Anantrasirichai, N.; Biggs, J.; Albino, F.; Bull, D. A deep learning approach to detecting volcano deformation from satellite imagery using synthetic datasets. Remote Sens. Environ. 2019, 230, 111179. [Google Scholar] [CrossRef]
  12. Cai, J.; Liu, G.; Jia, H.; Zhang, B.; Wu, R.; Fu, Y.; Xiang, W.; Mao, W.; Wang, X.; Zhang, R. A new algorithm for landslide dynamic monitoring with high temporal resolution by Kalman filter integration of multiplatform time-series InSAR processing. Int. J. Appl. Earth Obs. Geoinf. 2022, 110, 102812. [Google Scholar] [CrossRef]
  13. Zhang, N.; Wang, Y.; Zhao, F.; Wang, T.; Zhang, K.; Fan, H.; Zhou, D.; Zhang, L.; Yan, S.; Diao, X.; et al. Monitoring and Analysis of the Collapse at Xinjing Open-Pit Mine, Inner Mongolia, China, Using Multi-Source Remote Sensing. Remote Sens. 2024, 16, 993. [Google Scholar] [CrossRef]
  14. Liu, X.; Wang, Y.; Yan, S.; Shao, Y.; Zhou, H.; Li, Y. Ground subsidence characteristics associated with urbanization in East China analyzed with a Sentinel-1A-based InSAR time series approach. Bull. Eng. Geol. Environ. 2019, 78, 4003–4015. [Google Scholar] [CrossRef]
  15. Zhang, Y.; Wang, Y.; Huo, W.; Zhao, F.; Hu, Z.; Wang, T.; Song, R.; Liu, J.; Zhang, L.; Fernández, J.; et al. Ground Deformation Monitoring over Xinjiang Coal Fire Area by an Adaptive ERA5-Corrected Stacking-InSAR Method. Remote Sens. 2023, 15, 1444. [Google Scholar] [CrossRef]
  16. Wang, Y.; Yuan, G.; Wang, T.; Liu, J.; Zhao, F.; Feng, H.; Dang, L.; Peng, K.; Zhang, L. Research on Multi-source Remote Sensing Detection of Concealed Fire Sources in Coalfields. Geomat. Inf. Sci. Wuhan Univ. 2022, 47, 1651–1661. [Google Scholar] [CrossRef]
  17. Hu, Z.; Ge, L.; Li, X.; Zhang, K.; Zhang, L. An underground-mining detection system based on DInSAR. IEEE Trans. Geosci. Remote Sens. 2012, 51, 615–625. [Google Scholar] [CrossRef]
  18. Du, S.; Wang, Y.; Zheng, M.; Zhou, D.; Xia, Y. Goaf locating based on InSAR and probability integration method. Remote Sens. 2019, 11, 812. [Google Scholar] [CrossRef]
  19. Yang, Z.; Li, Z.; Zhu, J.; Yi, H.; Feng, G.; Hu, J.; Wu, L.; Preusse, A.; Wang, Y.; Papst, M. Locating and defining underground goaf caused by coal mining from space-borne SAR interferometry. ISPRS J. Photogramm. Remote Sens. 2018, 135, 112–126. [Google Scholar] [CrossRef]
  20. Wang, T.; Zhao, F.; Wang, Y.; Zhang, N.; Zhou, D.; Diao, X.; Zhao, X. An Algorithm for Locating Subcritical Underground Goaf Based on InSAR Technique and Improved Probability Integral Model. IEEE Trans. Geosci. Remote Sens. 2023, 61, 5214914. [Google Scholar] [CrossRef]
  21. Zhang, K.; Wang, Y.; Du, S.; Zhao, F.; Wang, T.; Zhang, N.; Zhou, D.; Diao, X. A Goaf-Locating Method Based on the D-InSAR Technique and Stratified Okada Dislocation Model. Remote Sens. 2024, 16, 2741. [Google Scholar] [CrossRef]
  22. He, L.; Wang, X.; Liu, C.; Tang, Y.; Zhang, X.; Kang, J.; Guo, C.; He, R. Time series interferometric synthetic aperture radar-based modeling and analysis of complex land subsidence caused by multi-seam coal mining on the Liaohe Plain, China. J. Appl. Remote Sens. 2022, 16, 024512. [Google Scholar] [CrossRef]
  23. Wang, R.; Wu, K.; He, Q.; He, Y.; Gu, Y.; Wu, S. A novel method of monitoring surface subsidence law based on probability integral model combined with active and passive remote sensing data. Remote Sens. 2022, 14, 299. [Google Scholar] [CrossRef]
  24. Kinoshita, Y.; Furuta, R. Slow slip event displacement on 2018 offshore Boso Peninsula detected by Sentinel-1 InSAR time-series analysis with numerical weather model assistance. Geophys. J. Int. 2024, 237, 75–89. [Google Scholar] [CrossRef]
  25. Sheikhalishahi, M.; Ebrahimipour, V.; Shiri, H.; Zaman, H.; Jeihoonian, M. A hybrid GA–PSO approach for reliability optimization in redundancy allocation problem. Int. J. Adv. Manuf. Technol. 2013, 68, 317–338. [Google Scholar] [CrossRef]
  26. Crosetto, M.; Monserrat, O.; Cuevas-González, M.; Devanthéry, N.; Crippa, B. Persistent scatterer interferometry: A review. ISPRS J. Photogramm. Remote Sens. 2016, 115, 78–89. [Google Scholar] [CrossRef]
  27. Zheng, M.; Deng, K.; Fan, H.; Du, S. Monitoring and analysis of surface deformation in mining area based on InSAR and GRACE. Remote Sens. 2018, 10, 1392. [Google Scholar] [CrossRef]
  28. Aspri, A.; Beretta, E.; Mazzucato, A.L.; De Hoop, M.V. Analysis of a model of elastic dislocations in geophysics. Arch. Ration. Mech. Anal. 2020, 236, 71–111. [Google Scholar] [CrossRef]
  29. Okada, Y. Surface deformation due to shear and tensile faults in a half-space. Bull. Seismol. Soc. Am. 1985, 75, 1135–1154. [Google Scholar] [CrossRef]
Figure 1. Geospatial context of the study area showing (a) regional location within Hebei Province, (b) local Digital Elevation Model (DEM), (c) Area II mining layout schematic, and (d) Area I mining layout schematic.
Remotesensing 17 02714 g001
Figure 2. Workflow of the theoretical-model-driven underground goaf locating framework.
Remotesensing 17 02714 g002
Figure 3. Spatial relationships of coordinate systems: (a) three-dimensional configuration of reference frames and (b) planar projection of surface coordinate systems. (The schematic was prepared with the reference of another published paper [21] by the authors).
Remotesensing 17 02714 g003
Figure 4. Architecture of RM-DBC: (a) synthetic subsidence profile with stable reference area; (b) binarization results, the star represents the calculation origin which is usually the point of maximum subsidence. (The figure was prepared with the reference of another published paper [21] by the authors).
Remotesensing 17 02714 g004
Figure 5. The optimization process of GA-PSO. P 0 n   ( n     1 ,   2 ,   ,   s i z e ) constructs an eight-dimensional initial parametric population space. Q i n (i represent the iterations number, n     0 ,   1 ,   ) corresponds to the sorted result by P 0 n . (The flowchart was referenced from another published paper [21] by the authors).
Remotesensing 17 02714 g005
Figure 6. Time-series cumulative subsidence result of Area I. A total of 91 leveling points were set, and the maximum cumulative deformation is −442 mm in this area.
Remotesensing 17 02714 g006
Figure 7. Time-series cumulative subsidence result of Area II. A total of 77 leveling points were set, and the maximum cumulative deformation is −267 mm in this area.
Remotesensing 17 02714 g007
Figure 8. Cross-validation of D-InSAR measurements against leveling in Area I (InSAR process from 13 October 2015 to 5 December 2015 and leveling measurement from 10 October 2015 to 19 December 2015) (a) is dip direction and (b) strike direction. The RMSEs between InSAR observations and leveling measurements in the dip direction and strike direction are 20.265 mm and 28.575 mm.
Remotesensing 17 02714 g008
Figure 9. Cross-validation of D-InSAR measurements against leveling in Area II (InSAR process from 13 October 2015 to 5 December 2015 and leveling measurement from 10 October 2015 to 19 December 2015) (a) is dip direction and (b) strike direction. The RMSEs between InSAR observations and leveling measurements in the dip direction and strike direction are 12.386 mm and 14.167 mm.
Remotesensing 17 02714 g009
Figure 10. (ad) are the Area I deformation binary conversion results at four time points. (e) Ray method (RM-DBC) azimuth estimation result; the maximum number of pixels reached 201 at an azimuth of 167°.
Remotesensing 17 02714 g010
Figure 11. (ad) are the Area II deformation binary conversion results at four time points. (e) Ray method (RM-DBC) azimuth estimation result; the maximum number of pixels reached 422 at an azimuth of 234°.
Remotesensing 17 02714 g011
Figure 12. Underground goaf locating results of Area I using PIM and ODM. (ac) represent the parameter estimation results using both PIM and ODM under the detailed, moderate, and limited conditions, respectively. The top and bottom of the figure are 3D/2D presentations of the InSAR-derived deformation of study area.
Remotesensing 17 02714 g012
Figure 13. Underground goaf locating results of Area II using PIM and ODM. (ac) represent the parameter estimation results using both PIM and ODM under the detailed, moderate, and limited conditions, respectively. The top and bottom of the figure are 3D/2D presentations of the InSAR-derived deformation of the study area.
Remotesensing 17 02714 g013
Figure 14. Comparison results of the simulation results with the InSAR−derived deformation in a detailed information condition. Specifically, with the application of PIM, the RMSE values for strike and dip directions in Area I are 3.64 cm and 6.29 cm, while those for Area II are 1.87 cm and 1.69 cm. For ODM, the RMSE values in Area I are 6.95 cm and 7.47 cm, and in Area II are 3.25 cm and 4.29 cm.
Remotesensing 17 02714 g014
Figure 15. Comparison results of the simulation results with the InSAR−derived deformation in a moderate information condition. Specifically, for PIM, the RMSE values for strike and dip directions in Area I are 7.01 cm and 9.04 cm, and in Area II are 5.49 cm and 5.77 cm. For ODM, the RMSE values for strike and dip directions in Area I are 7.76 cm and 8.20 cm, and in Area II are 5.69 cm and 5.60 cm.
Remotesensing 17 02714 g015
Figure 16. Comparison results of the simulation results with the InSAR−derived deformation in a limited information condition. Specifically, for PIM, the RMSE values for strike and dip directions in Area I are 9.02 cm and 11.13 cm, and in Area II are 6.11 cm and 8.33 cm. For ODM, the RMSE values for strike and dip directions in Area I are 8.23 cm and 9.09 cm, and in Area II are 3.57 cm and 5.22 cm.
Remotesensing 17 02714 g016
Figure 17. Residuals between model-forward simulation results of two models and InSAR-derived observations for Area I. (a) is the InSAR-derived observations. (b,c) represent the forward simulation results of PIM and ODM, respectively. (d,e) represent their residuals.
Remotesensing 17 02714 g017
Figure 18. The parameters’ ( L ,   W ,   D ) estimated results of progressively coarsened resolutions (1 m–80 m) using simulation data and GA-PSO algorithms.
Remotesensing 17 02714 g018
Figure 19. Convergence results of PSO and GA-PSO. The red box is an zoom-in view of the key parts.
Remotesensing 17 02714 g019
Table 1. Interferometric baseline parameters.
Interferogram PairsSpatial BaselineTime Baseline
20151013–2015110647.1835 m24 d
20151106–201511303.8988 m24 d
20151130–2015122413.3323 m24 d
20151224–20160117−43.7693 m24 d
20160117–20160305−37.7825 m48 d
Table 2. Rock property parameters correspondence.
Rock PropertiesRock CategoryQPoisson’s Ratio
softtopsoil/loam10.35–0.5
medium softsandy mudstone/mudstone0.60.25–0.35
medium hardmedium sandstone/siltstone0.40.15–0.25
hardgranite/fine-grained sandstone0.20.1–0.15
Table 3. Correspondence between rock property parameters and rock-weighted composite evaluation factor.
softP0.000.030.070.110.150.190.230.270.3
D r o c k 0.760.820.880.951.011.081.141.201.25
medium hardP0.30.350.400.450.500.550.600.650.70
D r o c k 1.261.351.451.541.641.731.821.912.00
hardP0.700.750.800.850.9100.951.001.051.10
D r o c k 2.002.102.202.302.402.502.602.702.80
Table 4. Stratification parameters for the study area.
Rock PropertiesThicknesspqPoisson’s Ratio
soft20 m0.030.4650.4
medium hard400 m0.220.560.18
hard344/320 m0.120.510.12
Table 5. Area I: underground goaf locating results, absolute error, and relative error.
-TrueDetailed Moderate Limited
PIMODMError (abs)Error (rel) PIMODMError (abs)Error (rel) PIMODMError (abs)Error (rel)
L29131432123/307.9/10.3% 32833037/3912.7/13.1% 34325252/3917.8/13.4%
W1651741819/165.3/9.5% 18318018/1510.9/9.1% 14014825/2215.1/13.3%
D77477477400 75280122/272.9/3.5% 72819546/215.9/2.7%
X56356857018.03 m
/25.24 m
55657019.43 m
/27.47 m
55355923.36 m
/14.42 m
Y480475473 484472 482476
δ 31°28°33°3/2° 37°32°6/4° 35°42°4/11°
φ 169°167°167° 167°167° 167°167°
Table 6. Area II: underground goaf locating results, absolute error, and relative error.
-TrueDetailed Moderate Limited
PIMODMError (abs)Error (rel) PIMODMError (abs)Error (rel) PIMODMError (abs)Error (rel)
L49346954124/484.9/9.7% 55354460/5112.2/10.3% 58257089/7718.1/15.6%
W14215216310/217.0/14.8% 12516117/1910.6/13.4% 16916127/1919.0/13.4%
D74074074000 77271532/254.3/3.4% 76872046/213.8/2.8%
X38038537118.03 m
/32.45 m
37039131.89 m
/31.74 m
38837133.39 m
/32.45 m
Y250245259 242243 240259
δ 13°15°12°2/1° 12°15°1/2° 17°5/4°
φ 236°234°234° 236°236° 236°236°
Table 7. Influence of determining azimuth in advance.
MethodAzimuthLengthWidthDepthCenter CoordinateInclined Angle
True Value169°291 m165 m774 m(563, 480)31°
RM-DBC167°314 m174 m774 m(568, 475)28°
Direct Inversion151°332 m183 m774 m(575, 471)33°
Disclaimer/Publisher’s Note: The statements, opinions and data contained in all publications are solely those of the individual author(s) and contributor(s) and not of MDPI and/or the editor(s). MDPI and/or the editor(s) disclaim responsibility for any injury to people or property resulting from any ideas, methods, instructions or products referred to in the content.