Abstract
Morphology is an important characteristic of the hydraulic and gravitational processes driving gully erosion. In this study, field scouring experiments were conducted on five experimental plots using terrestrial laser scanning to study gully erosion processes. The erosion and deposition on a gully slope were quantified using the M3C2 algorithm. The results show that the proportion of sediment yield of the gully slope in the whole slope–gully system ranged from 81.5% to 99.7% for different flow discharges (25, 40, 55, 70, and 85 L/min). Compared with low flow discharges (25 and 40 L/min), the gully slope presented more intense gully head retreat and higher erosion intensity under relatively high discharges (55, 70, and 85 L/min). Alcove expansion processes were characterized by horizontal and vertical cycles. Vertical dynamic changes were dominated by the co-evolution of collapses of the gully head and the deepening of the alcove. Horizontal development mainly manifested as a widening of the alcove caused by the hydraulic erosion of the gully wall. The roughness of the gully slope increased gradually with the increase in scour times and then tended towards stability. These results provide a reference for understanding the processes and mechanisms of gully erosion.
1. Introduction
Soil erosion is a major ecological security problem around the world and is expected to worsen with climate change [1,2,3,4,5,6,7]. Gully slopes, extremely severe erosion areas and the main sand-producing areas contribute more than 30% on average, and sometimes up to 94%, of catchment sediment yield [8]. Meanwhile, gully erosion is accompanied by gravity erosion such as landslides and collapse, as well as water erosion, resulting in extremely intense erosion processes and a particularly complex erosion morphology [9,10,11,12]. Therefore, investigating the fine terrain development dynamics of gully erosion and its responses to different rainfall characteristics will facilitate an understanding of the erosion processes of whole slope–gully systems, further benefiting erosion control and ecological restoration.
Rainfall runoff is the main driving force of morphology evolution processes on gully slopes [13,14]. The morphological development of a gully slope, in turn, will also have an important impact on the spatio-temporal characteristics of erosion processes, as well as the erosion type (i.e., hydraulic erosion and gravitational erosion) by changing the flow direction, discharge distribution, and hydraulic characteristics of surface runoff [15]. Thus, investigating morphological development is critical in order to understand the erosion processes and mechanisms of a gully slope. Related studies have been conducted on the erosion morphology of gully slopes [16,17]. The morphological development processes of gully erosion have typically been classified into three stages, as follows [18]: (i) a natural falling sill forms via flow downcutting or runoff gathering, which lays the foundation and provides the conditions necessary to trigger headward erosion; (ii) the runoff erosivity increases rapidly under the influence of gravity from the gully wall, promoting the formation of an alcove and an overhanging soil block above the alcove; (iii) the alcove is eroded continuously and expands in all directions, resulting in an increase in the overhanging soil block’s size, and finally, the gully shoulder line returns to a relatively stable state with the collapse of the overhanging soil block and retreat of the gully head. Obviously, the erosion morphology of a gully slope is extremely complex and three-dimensional and represents the most intuitive manifestation of the erosion process [19]. However, various studies have mainly focused on the rill morphology of a hillslope or investigated the local erosion morphology of a gully slope based on the two-dimensional morphological features, such as width and depth [20,21]. Few studies have quantitatively described the dynamic processes of the three-dimensional fine morphological characteristics of the whole gully slope, such as gully head retreat, alcove expansion, and surface relief conditions during gully slope erosion processes.
The erosion processes of a gully slope include the dynamic recycling of hydraulic erosion, terrain development, mass movement, deposition, and sediment yield, in the context of which the morphological characteristics act as a key driving factor [22]. Collison [23] concluded that the retreat of the gully head requires the formation of a hollow undercut. Previous studies have also confirmed that the collapse of overhanging layers is caused by the development of scour holes [24,25]. Gully evolution, such as the formation of overhanging layers and scour holes, as well as gully head retreat, is the interactive effect of hydraulic erosion and gravity erosion. Similarly, a change in gully morphology will also inevitably impact all erosion and deposition processes [25]. Related studies have also demonstrated that the development of scour holes enhances the frequency and magnitude of mass movement and collapse-induced deposition [26,27]. Evidently, the topographic characteristics of a gully slope are closely related to soil erosion and deposition. However, most recent studies on the erosion morphology and erosion/deposition of gully slopes have mainly focused on laboratory experiments with backfill soil, or concentrate on rill erosion on gentle slopes [14,28]. These are often controversial issues as the erosion processes occurring on backfill soil and gentle slopes cannot represent the real conditions of a steep gully slope. Therefore, there is an urgent need to figure out the interactive relationship between erosion morphological characteristics and natural gully erosion/deposition in the field. As an area where energy flow increases dramatically, gully slopes exhibit typical characteristics of severe erosion and three-dimensional morphological complexity. Previous studies on the morphological development characteristics of gully slopes have predominantly been conducted using relatively rough measurement or observation techniques [16,17]. Limited by these traditional monitoring methods and techniques (e.g., erosion pins [29,30] and tape measurement [31]), relevant studies on the morphological development of gully slopes are mainly qualitative, lacking quantitative findings. In recent years, the development of light detection and ranging (LiDAR) has greatly facilitated the acquisition of high-resolution terrain data. LiDAR harnesses an active remote sensing system (laser scanner), which uses returned pulses to obtain high-resolution information on the distance, slope details, roughness, and reflectivity of the detected target [32]. To date, this technique has been widely used in the soil erosion field, such as for erosion quantification [19,33] and the shape monitoring of rill erosion [20,21,34] due to the millimeter-level terrain monitoring accuracy of the approach. However, recent erosion morphology studies based on LiDAR technology have focused on the morphological development of rill or an ephemeral gully under laboratory conditions. As a result, it is difficult to accurately classify the fine development processes of gully erosion (especially in field conditions) due to the extremely complex nature of the erosive terrain.
The slope–gully system is the basic geomorphic unit and sediment source in the hilly and gully Loess Plateau. In the past few decades, a series of vegetation rehabilitation strategies have been implemented in this area, and these have decreased the soil erosion rates greatly. However, the gully slope area of the hilly–gully Loess Plateau is still characterized by severe soil erosion due to the poor vegetation condition and frequent mass movements, making it an important but challenging research field for erosion control in the context of large-scale vegetation restoration. Few studies have quantitatively investigated the spatio-temporal characteristics of soil erosion and the fine morphological development processes at play in natural slope–gully systems, strongly limiting our understanding of the mechanisms underlying gully erosion and the development of erosion models for the region. Consequently, a combination of LiDAR and runoff scouring experiments is used to study the gully erosion characteristics and their morphological development processes in the natural slope–gully systems of Xindiangou catchment (a typical region of the hilly–gully Loess Plateau). Based on this experiment, this study aimed to (i) determine the dynamic changes and spatio-temporal pattern of gully erosion; (ii) quantify dynamic processes of terrain development based on various topographic and morphological parameters of gully erosion; and (iii) assess the relationships between erosion, deposition and sediment yield in a gully slope and the morphological characteristics of gully erosion.
2. Materials and Methods
2.1. Study Area
The hilly–gully Loess Plateau, located in the south of the Chinese Loess Plateau, is characterized by severe soil erosion due to the relatively harsh terrain, vegetation and precipitation conditions [35,36]. Slope–gully systems are the basic geomorphic unit, as well as the major sediment source in this area. Xindiangou catchment, a small catchment typical of the hilly–gully Loess Plateau, covers an area of approximately 1.44 km2 (Figure 1). It has a typical temperate continental semi-arid monsoon climate with an average annual rainfall of 475.9 mm and mean temperature of 10.2 °C. Rainfall here has the characteristics of short duration and high intensity, and is mainly concentrated between June and September. The surface materials of the basin are predominantly loess soil, characterized by a loose texture and strong water absorption capacity, but weak a water retention capacity, making it highly susceptible to erosion. The loess layer has a thickness of approximately 60 m, with Malan loess in the upper section and Lishi loess partially exposed in the partial gully bottom. The soil is relatively rich in potassium and calcium, but very low in organic matter and nitrogen; the organic matter content is around 0.3% [37]. The catchment is topographically complex and fragmented, with a gully density of 7.26 km/km2, which covers 46.8% of the area of the entire basin. The dominant vegetation type is herbosa, including Ziziphus sativa, Atemisia gmelini, Stipa bungeana.
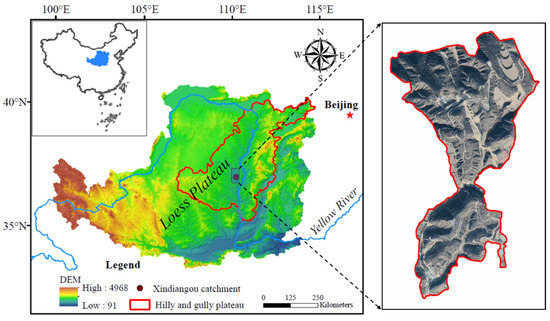
Figure 1.
Location of the study area.
2.2. Design of Experiment
The soil erosion processes of the natural slope–gully system in the hilly–gully loess region were simulated using runoff plots under four flow discharges, with runoff scouring and the terrestrial laser scanning (Leica ScanStation C10, Leica Geosystems, Heerbrugg, Switzerland). Then, the spatiotemporal characteristics of erosion, deposition, sediment yield and morphology on the gully slope were investigated based on field observations and TLS-scanned surficial point clouds.
2.2.1. Establishment of Runoff Plots
Field surveys were conducted to select representative natural slope–gully systems (consisting of hillslopes and gully slopes) and construct five runoff plots (Figure 2a). The underlying surfaces of the different runoff plots were required to be consistent in topography and vegetation characteristics, with a flat terrain, uniform vegetation distribution, and similar vegetation coverage and slope. According to the actual proportions (ranging from 2:1 to 12:1) of the geomorphic units of hillslopes and gully slopes, as well as the real gradients (between 45° and 78°) of gully slope in the hilly–gully Loess Plateau [19], the length ratio of hillslope and gully slope was set at about 5:1, and the gradients of gully slopes were artificially set at 70°. Finally, the whole length of the runoff plot was set as 6 m (the hillslope and gully slope were 5 m and 1 m long, respectively) and the width was set to 1.5 m. The hillslope topography was kept unchanged, with a relatively steep slope of 16.1–23.2° in the middle and upper parts and a relatively gentle slope (2.4–7.6°) in the lower part. In order to minimize the impact of hillslope vegetation on the TLS-scanned surficial point cloud, before the experiment started properly, the aboveground vegetation on the hillslopes was cut to a 5 cm height to facilitate the accurate collection of terrain point cloud and retain the vegetation’s function of retarding surface runoff.
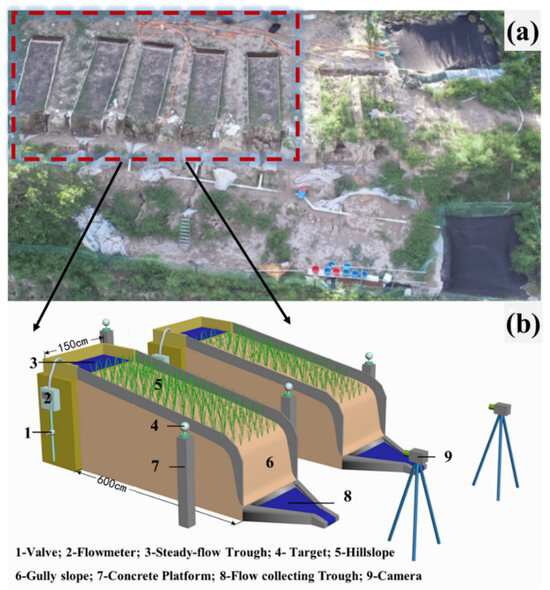
Figure 2.
The overall layout of the experimental area (a) and a 3D model of the runoff plots (b).
Steady-flow troughs were set at the tops of the hillslopes so as to simulate the runoff generated from the drainage area and ensure the water flowed into the plots evenly and smoothly (Figure 2b). Electromagnetic flowmeters were installed in the inlet pipe before the steady-flow troughs to control and regulate the flow discharge. The two sides of the runoff plots were enclosed by 30 cm-tall polyvinyl chloride (PVC) boards, 20 cm of which were buried in the ground and 10 cm of which were left above the surface to ensure the complete collection of slope runoff and the consistency of the boundary conditions. A triangular flow-collecting trough was placed at the end of each runoff plot to collect the sand-containing water sample, which was then used to assess the runoff and sediment yield of the whole slope throughout the experiment. Ultimately, a total of five adjacent slope–gully system runoff plots were established on the same slope orientations to perform experiments with various flow discharge rates.
2.2.2. Experiment Process
Five scouring experiments were conducted on each runoff plot. A single experiment lasted 30 min, which was consistent with the conventional rainfall duration seen in the study area. Before the first trial began, the terrestrial laser scanning (TLS) was employed to determine the initial topography of the gully slope. Timing began when the flow reached the flow-collecting trough, and the sand-containing flow was sampled every two minutes after collection in buckets (10 L, precision 50 mL). The cameras were set directly opposite the gully slope to record the overall erosion and dynamic topographic processes of the gully slope during the experiment. Once the preset experiment duration had been reached, the water valve was turned off immediately, and the experiment in question ended. Subsequently, eroded terrain point clouds of the gully slope were obtained once again using the TLS again. The runoff plots were not repaired and backfilled between two experiments (that is, the resulting terrain produced by the previous trial was the initial terrain of the subsequent trial) in order to observe the continuous changes in the morphological development processes of the gully slope. The runoff plots were fully covered with plastic cloth to avoid external interference between trials. Finally, twenty-five sets of sediment yield data and the corresponding topographic data from five experimental plots were used for the study of erosion processes and the correlation analysis.
Equation (1) was used to confirm the experimental flow discharge gradient, so as to ensure that the designated flow discharges conformed to the real rainfall conditions of Xindiangou Basin.
where F is flow discharge (L/min), W is the width of the runoff plot (m), D is the natural hillslope width of the basin (m), I represents the rainfall intensity (mm/min), A is the drainage area (m2), θ is the slope gradient (°), and ∂ represents the runoff coefficient. In the current study, W and D were set to 1.5 m and 5 m, referring to the terrain of the runoff plots and study area, while A was 300–400 m2, θ was 16.53°, ∂ was set as 0.32–0.57 and I was set as 0.3–0.6 mm/min, according to the data measured at the small meteorological station [38] as well as the historical data for the Xindiangou catchment [39]. The estimated flow discharge varied from 8.39 L/min to 78.62 L/min. Finally, the five flow discharge rates used in this study were set as 25 L/min, 40 L/min, 55 L/min, 70 L/min and 85 min, respectively.
Three soil samples were gathered from the top, middle and bottom parts of the topsoil (0–10 cm) on the gully slopes of each runoff plot using the 100 cm3 ring cutting equipment after the experiment had run its course. The collected samples were then weighed using an electronic balance with an accuracy of 0.1 g. Then, the soil samples were dried at 105 °C for 24 h, and the dried samples were weighed again. The soil bulk density can be determined based on the ratio of the quality of dried soil sample to the volume of the ring cutting product [40]. The corresponding mean soil bulk densities of the runoff plots of 25, 40, 55, 70, and 85 L/min flow discharges were 1.30, 1.28, 1.23, 1.30, and 1.24 g/cm3, respectively.
2.3. Acquisition and Preprocessing of Experiment Data
2.3.1. Point Cloud Acquisition from TLS and Pre-Processing
The point cloud data of the runoff plots were acquired by use of the Leica ScanStation C10. This device can collect high-density point cloud (maximum scan rate up to 50,000 points per second) data quickly, accurately and continuously without touching the object, with a range of 300 m, a vertical scanning range of 270° and a horizontal scanning range of 360°. The measuring accuracy is of the millimeter level, as a result of which it can realize perform the fine observation of surface micro-topography changes. During scanning, sphere targets were placed on pre-laid concrete platforms, and the TLS was employed to conduct multi-angle and multi-sorties terrain point cloud collections. Each runoff plot was scanned separately, and the scan was conducted 6~8 times for each experiment to obtain terrain information of the eroded gully slope that was as complete as possible. The height of the scanner was adjusted between 1.3 m and 2.0 m above the ground to ensure the scanning area covered the entire gully slope completely and to minimize voids when acquiring point cloud data. All the positions of sphere targets were kept consistent for the same runoff plot throughout the study period to reduce systematic errors.
The original point cloud data sets obtained by the TLS needed to be pre-processed by stitching, registration and filtering to obtain the ground points of the gully slope. Firstly, the point cloud processing software Leica Cyclone 6.0 (https://leica-geosystems.com/products/laser-scanners/software/leica-cyclone) was used to concatenate and register the complete point cloud in the same coordinate system. The registration processes (scan-to-scan registration) were undertaken based on the center coordinates of the three sphere targets. Secondly, the point cloud registration was performed by use of Terrasolid version 08.11.09.292 (https://terrasolid.com/products/) to identify and eliminate noisy and vegetation-related points. In order to improve the filtering accuracy, an automatic filtering algorithm combined with manual filtering was used to separate ground points and non-ground points. The final ground point densities of the five runoff plots (25, 40, 55, 70, and 85 L/min flow discharges) were 8.57 × 10⁵ point/m2, 9.24 × 10⁵ point/m2, 8.33 × 10⁵ point/m2, 7.59 × 10⁵ point/m2 and 7.47 × 10⁵ point/m2, respectively. Finally, the generated ground points could be used to directly quantify the volume of gully erosion, or to generate high-precision DEM for the three-dimensional morphology change analysis of the gully slope.
2.3.2. Derivation of Morphological Parameters
- (1)
- Gully head retreat characteristic
The point clouds of the gully shoulder line were plotted in an O-XY coordinate system after each experiment so as to quantify the retreat and change processes of gullies’ heads (Figure 3). The Y axis followed the gully head retreat direction, while the X axis was parallel to the gully shoulder line. The maximum gully head retreat lengths (MHRLs) of various experiments were measured using the gully point cloud data by means of the Terrasolid version 08.11.09.292. Then, the rate of gully head retreat (V) could be derived by the ratio of the difference in maximum gully head retreat lengths (DMHRL) between the former and latter trials and the duration of a single experiment, and this was employed to describe the changing velocity of the gully shoulder line with erosion processes. The area of gully head retreat (S) was determined from the area of the region enclosed by the receding shoulder line and the original shoulder line.
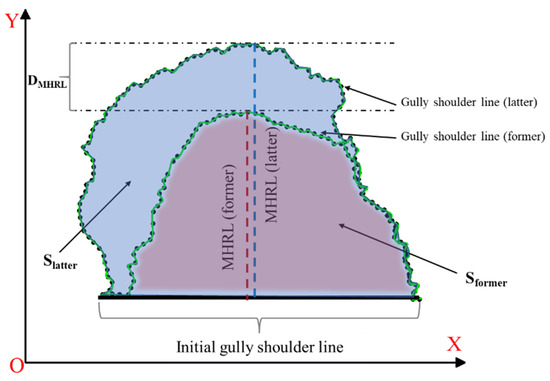
Figure 3.
Illustration of the retreat characteristics of the gully shoulder line.
The shape of the shoulder line developed from a nearly straight line to a curve with the procedure of the scouring experiment, as described by the fractal dimension of the gully head. Based on fractal theory, the fractal dimension could be calculated here. The basic calculation principle involves using a collection of line segments of length r (the line lengths of 200 mm, 180 mm, 150 mm, 120 mm, 100 mm, 80 mm, 50 mm, 20 mm and 10 mm were selected according to the length and complexity of the actual gully head used in the current study) to approximatively measure the complex of gully shoulder lines. Then, a series of approximate gully shoulder line lengths relating to r could be acquired. Assuming that the length of a given line is r, the total length of the line segment could be calculated as
where N(r) represents the total number of line segments. Obviously, for a gully shoulder line of a fixed length, the total number of segments N(r) changed with the change in length r. According to fractal theory [41], the formula for the calculation of the fractal dimension (Fd) was as follows:
- (2)
- Concavity index
Alcoves formed and developed on the gully slopes during the experiments. In the current study, taking the maximum depth point (the point d in Figure 4) of the alcove during a single experiment as the reference point, the longitudinal and cross profiles perpendicular to the z and x axes were set up, respectively. These profiles were employed to analyze the horizontal and vertical developmental characteristics of the alcove on the gully slope. The concavity index was usually to describe the degree of depression of the cross-sections of permanent gullies at the catchment scale [42], which is similar to the continuous widening and concaving of the gully slope in the runoff plot. Thus the horizontal concavity index (CIc) and vertical concavity index (CIv) were adopted in an attempt to quantify the morphological characteristics of concave expansion on the gully slope. The distance between the point with the minimum y-value at the intersection of the profile and the gully slope (i.e., the point h in Figure 4) and the point of maximum depth is represented by the two sides of the rectangle, while the concavity index represents the ratio of the area of the concave profile (S1) to the area below the concave profile (S2) in the rectangle.
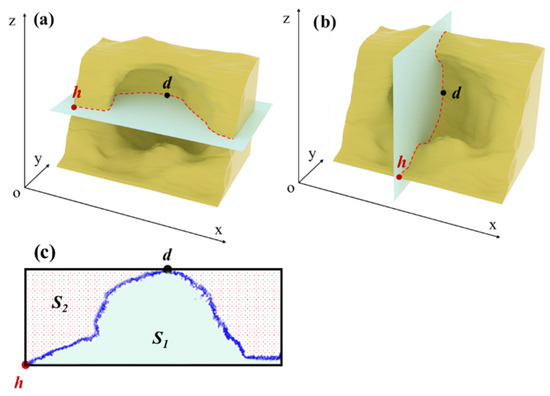
Figure 4.
Illustration of the horizontal profile (a) and the vertical profile (b) of the concave area on the gully slope, along with the schematic diagram used for the calculation of the concavity index (c).
- (3)
- Roughness characteristic of gully slope
The processes of erosion of the gully slope were extremely intense and had extremely complex three-dimensional morphological characteristics. Thus, the roughness parameter was selected to characterize the three-dimensional surface relief condition during the erosion process [43,44]. The CloudCompare version 2.1 was employed to calculate surface roughness based on the point cloud data. The basic principle of the algorithm was that a series of planes could be fitted for each point cloud by giving a suitable radius, r. The roughness of each point could then be derived by calculating the distance between each point in the radius r range and the plane. According the dimensions of the runoff plot and the topographic complexity yielded by the experiments in this study, a radius r of 1 m was confirmed to calculate the surface roughness.
2.3.3. Calculation of Soil Erosion, Deposition and Sediment Yield on Gully Slope
Based on the point cloud data, the volumetric change between two sequential trials could be derived based on the volumetric quantification method proposed by Gao et al. [19]. The method is based on the spatial–differential principle and the distance calculation enabled by the M3C2 (Multiscale Model to Model Cloud Comparison) algorithm. The algorithm incorporates two key parameters: D (normal scale) and d (projection scale). The algorithm first fits a plane to the neighborhood of each point i in the reference point cloud, defined by a radius of D/2. The normal vector of this plane is then calculated. Subsequently, a cylinder with a radius of d/2 is created, oriented along the direction of this normal vector and passing through point i. This defined cylinder intersects with both point clouds, generating two subsets of points, n1 and n2. Each subset is then projected onto the cylinder’s axis, resulting in two distance distributions. The mean value of each distribution is calculated to determine the average positions of the point clouds along the normal vector, denoted as i1 and i2. The distance between i1 and i2 along this axis is then considered the topographic change at that point (Figure 5). The volumetric change is obtained by accumulating the product of the topographic variation and the base area of the differential cylinder at each point i. The quantity of erosion or deposition for each experiment was then calculated by multiplying the volumetric change via the soil bulk density of the corresponding runoff plot. The sediment yield of the gully slope could then be acquired by calculating the difference between the amounts of erosion and deposition.
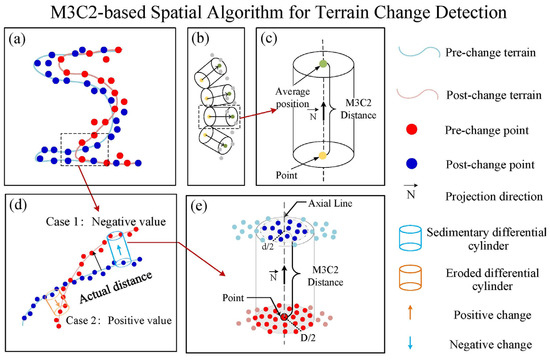
Figure 5.
Illustration of the M3C2 algorithm. (a) Reference point cloud (the red dots) and comparison point cloud (the blue dots); (b) Cylinder creating; (c) Distance calculation; (d) positive and negative terrain changes determining; (e) M3C2 distance.
3. Results
3.1. Spatiotemporal Patterns of Soil Erosion Processes on the Gully Slope
3.1.1. Temporal Change Characteristics of Erosion and Sediment Yield
The amount of soil erosion on the gully slope generally showed a decreasing trend under different flow discharge rates. Specifically, the amount of erosion decreased slowly with the rate of 25 L/min throughout the whole experiment, while an abrupt increase was detected during the second experiment using 55 and 70 L/min, as well as the third experiment using 40 L/min. In contrast, the amount of erosion dropped dramatically from the first trial (260.2 kg) to the second trial (74.6 kg) under the greatest flow condition (85 L/min), and then remained basically stable. The overall change trends of sediment yield were downward under different flow discharge rates, basically coinciding with the erosion amount. In contrast, the deposition amount displayed by the gully slope was relatively small for different flow discharge rates. For the 25 L/min flow discharge rate, the deposition amount showed large fluctuation characteristics during the five experiments. The deposition reached its peak immediately in the second experiment when moderate flow discharge was applied (40 and 55 L/min), then gradually decreased to a lower magnitude. Similarly, the amount of deposition under the large flow condition (70 and 85 L/min) increased and then decreased with the number of experiments, while transition occurred in the third experiment.
The proportion of sediment yielded by the gully slope in the whole slope gully system was between 81.5% and 99.7% during the five experiments under different flow discharge rates (Figure 6d). The changes in sediment yield proportion were relatively small for the experiment applying 25 and 40 L/min, during which the values remained consistently above 96%, whereas the proportions fluctuated greatly under conditions of large flow discharge. For example, the sediment yield of the gully slope accounted for 97.3% of the whole slope during the first experiment, with a 85 L/min flow discharge rate, while the value produced during the fourth experiment was only about 80%.
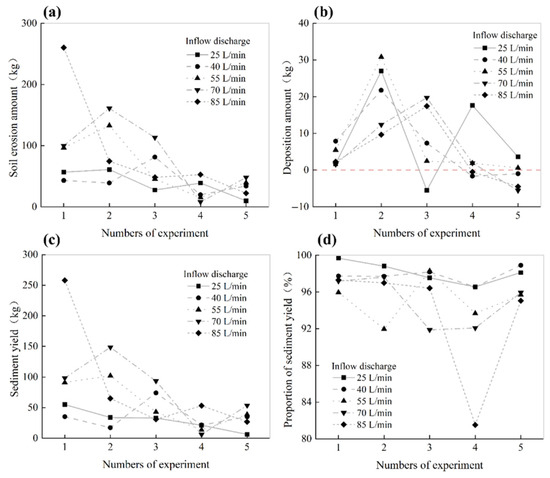
Figure 6.
Variation characteristics of erosion (a), deposition (b) and sediment yield (c), and the proportion of sediment yield (d) on the gully slope.
3.1.2. Spatial Variations of Soil Erosion and Sediment Deposition
Obvious differences could be detected in the distribution of erosion and deposition as well as in the regression characteristics of the gully head under different flow discharge rates (Figure 7). The areas adjacent to the shoulder lines all presented erosion characteristics. Generally, more intense erosion could be detected around areas where the gully head receded severely. In contrast, the deposition was mostly distributed in stable areas near the shoulder lines or in areas far away from the shoulder lines. For example, the area to the right of the shoulder line receded before the third experiment with 25 L/min, which was followed by the retreat of the left side due to the change in the retreat range. In this case, the erosion area and deposition area also changed accordingly. Likewise, the erosion amount and erosion range along the shoulder line with an 85 L/min flow discharge rate were obviously greater than those seen with other discharge rates due to the intense retreat of the entire shoulder line. The characteristics of the gully head under different flow discharge rates suggested a sharp retreat after just one experiment at an 85 L/min flow discharge rate, during which the original straight line of the shoulder was completely destroyed. The gully head moved back significantly after the second experiment with 70 L/min and 55 L/min flow discharge rates. The lower flow discharge rate (25 and 40 L/min), by contrast, led to a relatively small retreat range and retreat intensity. Specially, the middle part of the gully head showed almost no recession after all five experiments at the 25 L/min flow discharge rate. The whole gully head under the 40 L/min flow discharge rate showed clear expansion and regression, but the degree was relatively weak.
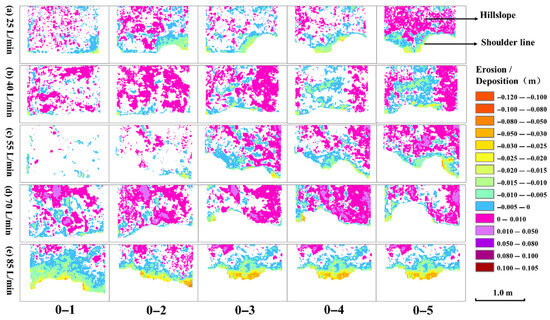
Figure 7.
The dynamic changes of the gully head as well as the erosion and position in areas around the shoulder line during the experiments.
The soil and deposition maps of the gully slope show that erosion was mainly distributed in the upper part of the gully slope, and the deposition was mostly concentrated at the bottom (Figure 8). The bottom deposition situations for the 70 L/min and 85 L/min flow discharge rates were relatively serious compared with other rates. The erosion range and erosion degree expanded throughout the entire experimental process under all flow discharge rates, whereas the spatial distribution showed certain differences. For the 85 L/min flow discharge rate, almost the entire original gully slope showed erosion characteristics, with the erosion depth greater than 0.1 m just one experiment later. Subsequently, the erosion intensity continued to increase, and a contiguous area with an erosion depth exceeding 0.8 m could be found on the right side of the gully slope after the fifth experiment. Similar erosion development processes on the gully slope were observed at 55 L/min and 70 L/min flow discharge rates. The difference was that the erosion intensity and erosion range were relatively low after the first experiment, and the high-value area was mainly concentrated on the left side. In contrast, no areas of change and few areas of deposition could be identified in the upper parts of the gully slope at low flow discharge rates (25 and 40 L/min), even after five scouring experiments, and the erosion depth in areas with intense erosion ranged from 0.3 m to 0.5 m. In particular, the area of severe erosion shifted from right part to left part after the third experiment at 25 L/min discharge due to the gully head’s retreat.
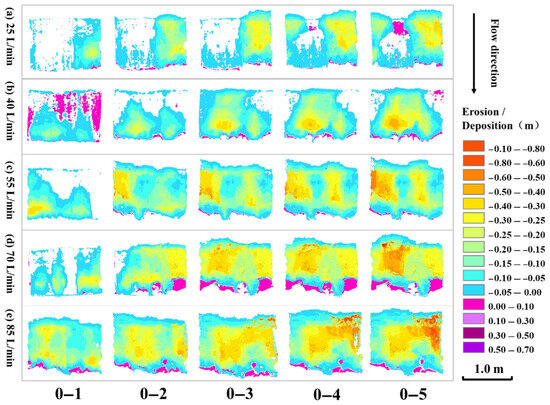
Figure 8.
Spatial distribution characteristics of erosion and deposition on gully slope.
3.2. Characteristics of Morphological Development on Gully Slope
3.2.1. Morphological Development of Gully Headcut Erosion
The rate of gully head retreat was extremely high in the first and second trials (0.90 and 0.85 cm/min, respectively) at 85 L/min flow discharge, and it reached its maximum in the first trial (Figure 9a). Then, the overall retreat rate of the gully head decreased in the following experimental sessions. With the other four discharge rates, the retreat in the first experiment was considerably slower than that seen with 85 L/min discharge. This indicates that the gully head cloud collapsed and receded rapidly, and then tended to become stable under extreme rainstorm conditions, meaning the retreat processes would be relatively slow at low flow discharge rates. The peak retreat rates were seen in the second and third experiments, and then decreased. Specifically, the peak value of retreat rate (1.30 cm/min), which was the maximum value seen in all trials, was noted in the second trial with a 55 L/min discharge rate. Meanwhile, the peak values of the retreat rate at high flow discharge rates (55, 70 and 85 L/min) were greater than those of low flow discharge rates (25 and 40 L/min). Further, the fluctuation in and value of retreat rate were generally low across all experiments with the 40 L/min flow discharge rate.
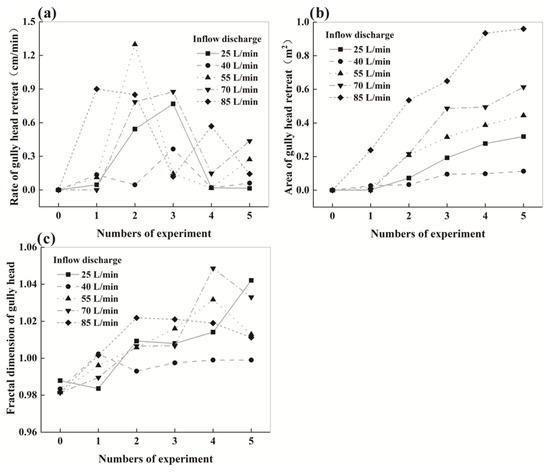
Figure 9.
Morphological changes of the gully head under different flow discharges. (a) Rate of gully head retreat; (b) Area of gully head retreat; (c) Fractal dimension of gully head.
With the increase in the number of scouring trials, the areas of gully head retreat under different flow discharge rates all showed increasing trends to different degrees. Further, the overall growth rate increased with the increase in flow discharge (Figure 9b). Consistently with the retreat rate of the gully head, the increases in retreat area for the other flow discharges were not obvious in the first trial except for with 85 L/min discharge. Moreover, the retreat area throughout the whole trial process increased rapidly under 85 L/min discharge, with the final retreat area being close to 1 m2. For the 70 L/min discharge, a sharp increase was detected in the second and third experiments, and the retreat area of the third trial reached 0.49 m2. Then, the growth rate slowed down, and the final area was 0.61 m2. The retreat areas in the remaining three trials increased to a certain extent after the first experiment, but the increase was relatively slow, and the final retreat areas were 0.32 m2 (25 L/min), 0.11 m2 (40 L/min) and 0.44 m2 (55 L/min), respectively, which values are far lower than that seen for the 85 L/min discharge. In addition, the retreat area of the 40 L/min discharge was smaller than that of the 25 L/min discharge. This was because the flow of under L/min discharge was concentrated on one side, while it was more dispersed under the 25 L/min discharge condition, resulting in the different rates and degrees of erosion on the gully head.
The fractal dimension of the gully head varied between 0.98 and 1.05 during the different trials under various flow discharge rates. The fractal dimension presented a rapid upward trend under the 25 L/min discharge condition, which suggests that the morphological characteristics of the gully head were relatively complicated throughout the experiment. This might be related to the sequential development of both sides of the gully head caused by the path change of concentrated flow. The fractal dimension showed less variation during the whole trial with 40 L/min discharge, indicating the uniform development and simple shape of the gully head. The fractal dimension gradually increased in the first four trials and decreased in the fifth experiment with 55 L/min and 70 L/min discharge rates. For the 85 L/min discharge rate, the fractal dimension increased sharply in the first and second trials and then remained stable, with a slightly decreasing trend.
3.2.2. Alcove Expansion of Gully Slope
The alcove expansion of gullies was characterized by horizontal and vertical cycles of erosion processes (Figure 10). In the cross-section, there were certain differences in the concave growth rate in different spatial locations of the gully slope across all trials. The retreat areas were mainly concentrated on both sides of the gully slope under 25 L/min and 55 L/min discharge rates, whereas the middle part of the gully head retreated slowly. Notably, with the 25 L/min discharge rate, the alcove could hardly be identified in a small part of the cross-section, and the left side of the gully slope receded sharply only after the fourth trial with the 25 L/min flow discharge rate. The overall concave expansion of the gully slope was relatively uniform with the 40 L/min discharge. In contrast, the alcove of the gully slope underwent obvious unilateral expansion under higher flow discharge rates (70 and 85 L/min), and the development of the left side was far greater than that on the right side. Furthermore, the depths of concave expansion after the experiments with large flow discharge rates were generally greater than those seen with low flow discharge rates. On the vertical view, alcoves and cantilevers (i.e., the overhanging soil block above an alcove) were seen to form and develop during gully erosion. With a flow discharge rate of 85 L/min, no concave feature was formed after the first trial due to the intensity of the water erosion and gully head collapse processes (Figure 10e). This, in turn, caused the retreat of the whole gully slope. As the experiment progressed, an alcove formed after the fourth trial. The terrain of the other flow gradients, by contrast, was characterized by obvious concavity in the lower part of the gully slope after the first trial. Then, the increase in concave depth led to the hanging and then collapse of gully heads in subsequent experiments. Further, the co-evolution of collapses and alcoves finally caused vertical dynamic changes in the gully terrain. In addition, a certain amount of deposition in the bottom of the gully slope was seen after the first experiment under four relatively low flow discharge rates, especially after the collapse of the gully head. However, a small amount of deposition or even an erosion pit could be detected in the bottom of the gully slope under the maximum flow discharge rate.
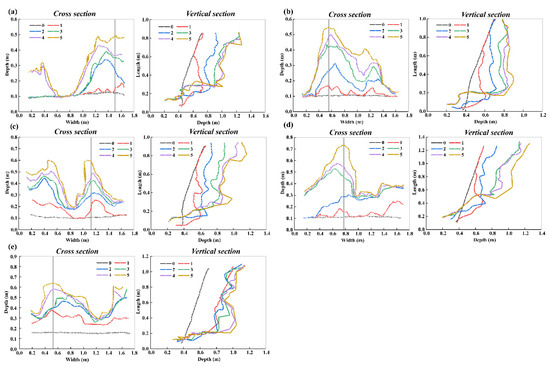
Figure 10.
The changes in cross-section lines (images on the left) and vertical section lines (images on the right) at maximum concave depth during the experiments ((a) 25 L/min, (b) 40 L/min, (c) 55 L/min, (d) 70 L/min, (e) 85 L/min). The position of the vertical profile is marked by gray lines.
The concavity index of horizontal expansion presented relatively large changes under the two maximum flow discharges. Most notably for the 85 L/min discharge, the concavity index increased continuously in the first four trials, before reaching its peak and then declining in the fifth experiment. In contrast, the variations in the horizontal concavity index were moderate under low flow discharge rates, suggesting a slow increase or steady state. The concavity index of vertical expansion showed a general similar pattern under different discharge rates (Figure 11), whereby the index increased rapidly in the former experiments, and then descended. Specifically, a considerably greater increase and then sharp drop could be detected under the 85 L/min flow discharge, whereas the index under lower discharges tended to decline slightly after the first or second episode of fast growth. The change characteristics of the horizontal and vertical concavity indexes show that the gully slope may be prone to local rapid downcutting with changes in terrain under high discharge rates, while the expansion would basically continue in the initial formation before being uniformly cut down under low discharge rates after the initial gully shape had formed.
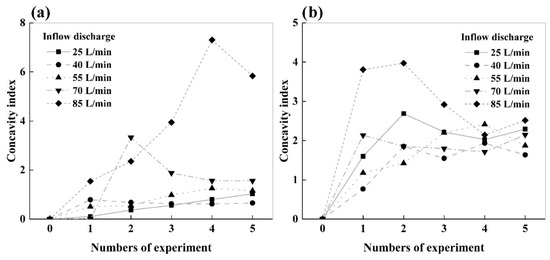
Figure 11.
Concavity index of gully slope. (a) Cross section; (b) Vertical section.
3.2.3. Roughness Characteristic of Gully Slope
The variations in the average and maximum roughness value of the gully slope exhibited generally similar characteristics as the trials proceeded (Figure 12). Further, the overall degree of topographic roughness increased gradually with the increase in scour time, before tending to stability. After the whole experiment, the average and maximum roughness under each flow discharge rate increased sharply compared with the original ground surface, ranging from 482.88 to 1955.35% and 199.16 to 467.35%, respectively. The greatest increases in average and maximum roughness of the gully slope occurred under the flow discharge conditions of 70 L/min and 85 L/min, respectively. In addition, the scouring time required for the roughness of the gully slope to stabilize decreased gradually with the increase in the flow discharges. For example, the average roughness tended to become stable after the fourth trial under the 25 L/min discharge rate, while the increase amplitude slowed down after the third trial for the 40 L/min and 55 L/min discharge rates. Furthermore, the increase in mean roughness slowed and stabilized after the first experiment at the flow discharge rates of 70 L/min and 85 L/min.
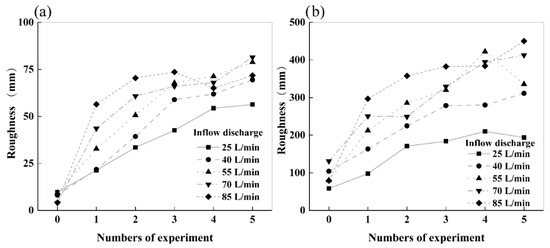
Figure 12.
The temporal variations in the roughness of the gully slope under different flow discharge rates. (a) Mean roughness; (b) Maximum roughness.
The spatial characteristics of roughness can reflect the response of the surface microtopography of a gully slope to flow discharge and erosion processes. The roughness value displayed visible spatial heterogeneity for different gully slope areas (Figure 13). Compared with the low flow discharge condition, the first trial performed with the two large flow discharge rates (70 and 85 L/min) already yielded a range of high roughness values (above 0.2 m), whereas the roughness value of the gully slope under the lowest flow discharge rate (25 L/min) was lower than 0.20 min throughout the whole scouring experiment. Furthermore, the areas with high roughness values were mainly located in the upper and middle parts of the gully slope under low flow discharge conditions (25 and 40 L/min). The high values were mainly concentrated in this region throughout the whole experiment, with only a certain increase in magnitude and scope. In contrast, the areas of high roughness were mostly distributed in the lower part of the gully slope under the conditions of 55 L/min and 70 L/min flow discharge during the first two trials, after which the distribution was relatively dispersed throughout almost the whole gully slope. The high roughness values were seen to be spread over most areas of the gully slope after the first scouring trial at the flow discharge rate of 85 L/min. Additionally, the local area of high roughness in the fourth trial was reduced compared with the third field with 85 L/min discharge, whereas the scope and magnitude of the high-roughness area under the rest of the flow discharge conditions increased with the progress of the scouring experiment.
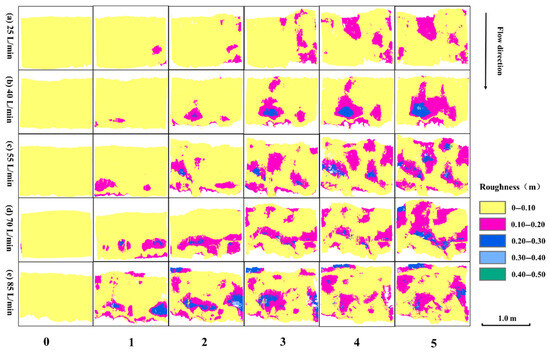
Figure 13.
The variations in roughness of the gully slope under different flow discharges.
3.3. The Relationship Between Soil Erosion and Morphological Characteristics on Gully Slope
The erosion of the gully slope (especially under the large flow discharge condition) was particularly intense with minimal deposition, resulting in an extremely significant correlation between erosion and sediment yield (SY). The soil erosion and sediment yield of the gully slope were seen to be strongly correlated (p < 0.01) with the fractal dimension of the gully head (Fd), the area of gully head retreat (S), the roughness, and the concavity index of the cross-section (CIc). In particular, the strongest linear correlation was detected between soil erosion and the area of gully head retreat (S), as well as roughness, with correlation coefficients of 0.93 and 0.87, respectively (Figure 14). Thus, the two topographic indicators could be taken as the primary variables characterizing the erosion and sediment yield in the gully slope. On the other hand, the deposition was statistically significantly (p < 0.05) correlated with the fractal dimension (Fd), the area of gully head retreat (S) and roughness, indicating that changes in the erosion terrain of the gully slope might lead to corresponding sediment deposition. Nevertheless, no remarkable or weak correlations were observed between the erosion/deposition/sediment yield and the rate of gully head retreat (V) or concavity index of the vertical section (CIv).
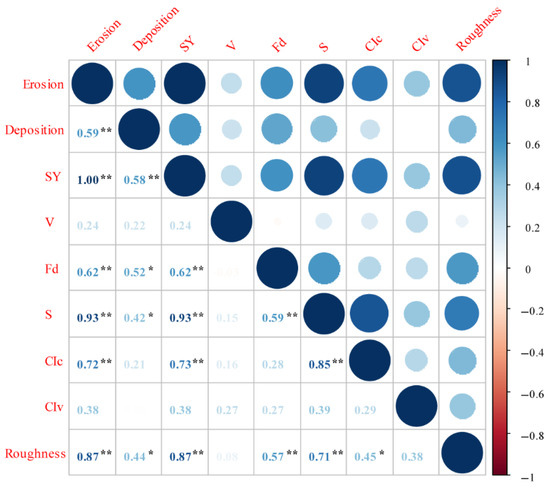
Figure 14.
Analysis of correlation between erosion, deposition, sediment yield of gully slope and morphological variables (** significance at the 0.01 level; * significance at the 0.05 level).
The analysis of correlation between erosion, deposition, sediment yield and morphological variables under a single flow discharge rate was also conducted (Table 1). For almost all flow discharge rates, the soil erosion and sediment yield were significantly correlated with the area of gully head retreat (S) and roughness, but they showed no notable correlation with the rate of gully head retreat (V). The remaining topographic parameters showed a good agreement with erosion and sediment yield only at the maximum or minimum flow discharge rates. For example, the horizontal concavity index (CIc) and vertical concavity index (CIv) all presented a good relationship with erosion and sediment yield at 85 L/min flow discharge, whereas the erosion and sediment yield of the 25 L/min flow discharge were strongly correlated with the fractal dimension (Fd) and horizontal concavity index. In contrast, the relationships between deposition and the corresponding topographic parameters were relatively poor for different flow discharges. Therefore, the morphological index of the plane and the three dimensions could be used to better characterize the erosion and sediment yield of the gully slope, while the linear index was relatively poor.

Table 1.
Relationship between erosion, deposition, sediment yield and morphological variables under different flow discharge rates.
4. Discussion
4.1. Monitoring and Quantification of Gully Erosion Processes
This quantitative study of the erosion and sediment yield on a gully slope is relatively weak due to the complexity of the erosion of landforms, as well as the limitations of the monitoring techniques and algorithms used [8,17,45,46]. In this study, the TLS and M3C2 algorithms were employed to obtain the erosion volume in the current study, as they have been proven to be applicable for gully slopes and hillslopes. For example, Li et al. [47] demonstrated that the TLS produced relatively sound soil erosion estimates, with relative errors of −27.80% to +15.70% for consecutive sediment yields. Gao et al. [19] found that the TLS combined with M3C2 algorithm can achieve erosion quantification for a gully slope, with a mean relative error lower than 11.38%. In contrast, the quantification accuracy of TLS is relatively poor for hillslopes, while its accuracy has been greatly improved compared with traditional approaches. In addition, we found that the sediment yield of the gully slope accounted for more than 80% of the sediment yield of the whole slope under all flow discharge rates during five experiments, and its proportion to the total sediment yield was more than 96% for the 25 and 40 L/min rates. Obviously, the ratio of sediment yield on the gully slope was much higher than that on the hillslope, which could be attributed to the intense erosion of the gully slope due to the combined effects of hydraulic erosion and frequent mass movements [19,21]. The proportion of mass movements even reached up to 90% of the sediment yield for the gully slope [48]. This is consistent with the findings of previous studies, such as that by Li et al. [49], which demonstrated that the largest proportion of total erosion accounted for by ephemeral gullies in the Loess Plateau of China was as high as 70%. However, the contribution of gully erosion to sediment yield may vary considerably with the spatial–temporal scale and environmental factors such as climate change and land use dynamics. For example, Poesen et al. [8] concluded that the contribution rate of gully erosion to overall sediment production may be as low as 10% in different regions around the world. Moreover, previous studies have found that the length proportion of hillslopes and gully slopes was between 2:1 and 12:1, based on field surveys in the Xindiangou catchment and its vicinity [19]. However, our research adopted a fixed hillslope and gully slope ratio, which inevitably led to differences in the proportions of sediment yield contributions. Further experiments must be conducted under different hillslope and gully slope ratios in the future so as to enhance our understanding of the sediment yield contribution rate of slopes and gully slopes.
In addition, our study showed that the erosion and sediment yield changed little during the experiment with the 25 L/min flow discharge rate, whereas the highest value was produced under other discharge rates, and the occurrence of extreme values was gradually delayed (Figure 6). For instance, the maximum value appeared in the first trial using 85 L/min flow discharge, while it appeared in the second trial with the discharge rates of 55 and 70 L/min. This could be attributed to the cycle processes of gully head collapse and alcove formation. During the erosion processes of a gully slope, the overhanging soil block forms gradually in the gully head area as a result of the alcove growth driven by water erosion, which may lower the stability of gully heads and lead to the occurrence of collapses [25,50,51]. Then, the terrain gradually stabilizes, and the ensuing cycle of collapses and alcoves continues under the processes of hydraulic erosion. Our study found that the retreat rate of the gully head exhibited a sharp increase followed by a decrease (Figure 9a), which is also related to its collapse. Meanwhile, the time required for a full cycle may decrease with the increase in the flow rate (Figure 10). For example, for large flow discharge rates, such as 85 L/min, this cycle will be completed quickly (even after just one trial), which inevitably brings about massive collapses and subsequent sudden increases in erosion and sediment yield. The cyclic processes of gully erosion have also been detected in relevant studies of different regions such as the Chinese Yuanmou valley [25], the Loess Plateau [52], Nigeria [18] and the US state of Iowa [53]. Moreover, this process can also be verified in the vertical section of Figure 10e herein, where the alcove began to gradually form again after it had completely collapsed in the first trial. Eventually, this cyclic process causes the retreat of the gully head, followed by its expansion (Figure 7). Notably, for the 85 L/min flow discharge rate, the whole gully head receded after just one experiment, while the gully head under the 25 L/min discharge rate, by contrast, still preserved part of its original shoulder line after five experiments. Previous studies have also concluded that gully head retreat becomes serious due to alcove erosion and development, and subsequent cantilever collapse, during high-intensity storm runoff processes [24,54].
4.2. Spatial–Temporal Characteristics of Gully Erosion Morphology
As described above, the dynamic development of a gully head and alcove is an important manifestation of the gully erosion process. Our study clearly reveals the developmental processes of gully heads and alcoves by addressing numerous morphological parameters and terrain roughness, using the ultra-high-resolution terrain information produced by the TLS. The results demonstrate that the alcove expansion processes present characteristics of horizontal and vertical development during gully erosion (Figure 10). Horizontal development is mainly characterized by lateral widening on both sides of the initially formed alcove or gully head area under the effects of hydraulic erosion and gully wall collapse. The vertical development is manifested as the deepening of the alcove under hydraulic erosion and its gravitational collapse after the formation of the cantilever, resulting in intense erosion and sediment yield in a short time span. This is consistent with the findings of previous studies [19,25,50,51]. Meanwhile, the concavity curve further indicates that the horizontal change in concavity was relatively gentle, while the vertical concavity index presented a dramatic change due to the occurrence of collapses (Figure 11).
The cross-section in Figure 10a shows that the lateral expansion was slow after the initial formation of the alcove, while the development in terms of depth was relatively rapid in comparison. This can be attributed to the fact that the dispersed runoff gradually converges to the middle of the alcove due to the gully head’s downcutting, resulting in an increase in the flow of the central area and a decrease in the flow on both sides of the gully walls (Figure 15). Furthermore, the depth of the alcoves increased sharply after the collapse of the gully head under different flow discharges. For example, the collapse occurred in the gully head area during the period between the first trial and the second under 25 L/min flow discharge (the red and blue lines in the vertical section of Figure 10a), while a sharp deepening could be detected in the corresponding alcove area (the cross-section in Figure 10a). During gully erosion, the flow gradually separated and generated on-wall flows and jet flows due to the formation of a cantilever and alcove [54]. As the scouring experiment proceeded, the collapse of the cantilever made it difficult for the runoff to maintain the “jet flow” condition, which in turn led to a decrease in jet flow and a rapid increase in on-wall flow [26,54,55]. Among the relevant literature, Chen et al. [25] found that the effect of on-wall flow on the development of alcoves is greater than that of jet flow. Thus, the proportion of on-wall flow increased sharply after the collapse of the cantilever, enabling the depth-wise development of alcoves to accelerate. This is consistent with the finding of previous studies [52,56,57].

Figure 15.
The runoff distribution during gully head downcutting (a), and the transformation of jet flow and on-wall flow before (b) and after (c) the collapse of the gully head.
Deposition was detected in the bottom of the alcove with the erosion of the alcove area and the collapse of the cantilever under the scouring of flow (Figure 10). However, the transport processes of deposition varied with flow discharge. In cases of large flow discharge, the collapsed soils were rapidly detached and transported away by the runoff as the time proceeded. For example, a significant collapse and retreat occurred in the gully head area in the first trial with the 85 L/min flow discharge rate, while no obvious siltation was found at the bottom of the alcove (the vertical section in Figure 10e). Even plunge pool formations appeared in subsequent experiments, as was also found in the study of Guo et al. [58]. In contrast, a considerable amount of sedimentation was seen at the bottoms of alcoves after collapses under low discharge rates, and the sedimentation still persisted after multiple trials. Hence, the transport of sediment on the gully slope is closely related to the hydraulic characteristics of runoff. Dong et al. [59] also concluded that the hydraulics were the key dynamic leading to soil loss from the gully heads, which is consistent with our findings.
The gully terrain constantly undergoes dynamic changes, which, in turn, affect the erosion processes and subsequently the soil erosion and sediment yield by altering the hydraulic and gravitational characteristics. Our study showed extremely significant relationships between erosion/sediment yield and the area of gully head retreat (S), as well as roughness, at the inter-experiment scale for almost all flow discharge rates. However, relatively poor relationships were detected between erosion/sediment yield and the rate of gully head retreat and the concavity index of vertical section. Gully slopes are areas that endure extremely intense erosion, including the hydraulic erosion of the whole gully slope, as well as mass movements (i.e., collapse and slump) at the gully head and alcove. This leads to drastic terrain changes and extremely strong three-dimensional morphological characteristics [19]. Therefore, the linear indicators of terrain, such as retreat rate and concavity index, cannot be easily used to characterize the erosion condition. However, the two-dimensional (i.e., area of gully head retreat) and three-dimensional surface indicators (i.e., roughness) can better reflect the erosion and sediment yield characteristics of gully slopes.
Our results demonstrate that the erosion processes and morphological development of gully slopes became more intense with the increase in rainfall intensity. Similarly, the morphological development of gullies is also closely related to climate variation and rainfall processes at large scales. Numerous studies have reported that increases in rainfall intensity exacerbate sediment transport and topsoil loss, resulting in increases in gully width, dimensions and density on the Loess Plateau [60,61,62,63]. Even in areas where the Grain for Green project and gully control measures have been implemented, heavy rainfall events still compromise the effectiveness of engineering measures taken against gully expansion control [64]. Furthermore, post-drought desiccation cracks may accelerate erosion by forming preferential flow paths that enhance permeability and reduce shear strength, thereby intensifying the development of rills and gullies [65]. This study can provide references for the prevention and control of gully erosion against the background of climate change.
5. Conclusions
In this study, runoff scouring experiments were conducted in field slope–gully systems under five flow discharge rates in order to study the morphological development processes of gully erosion. High-precision three-dimensional terrain data derived from TLS were used to quantitatively analyze erosion and deposition characteristics, as well as the morphological development of the gully head and alcove, during gully erosion.
Gully slopes were the major sources of sediment in slope–gully systems, accounting for more than 80% during the scouring experiments performed at different flow discharge rates. The degree of erosion of a gully slope fluctuates sharply under large flow discharge rates due to frequent collapses in the gully head and wall. Meanwhile, the amount of erosion of the gully slope was found to be much higher than the amount of deposition.
Sharp retreat was seen in the gully head area under high flow discharge rates (55, 70 and 85 L/min), resulting in a rapid increase in the area of gully head retreat. The lower flow discharge rate (25 and 40 L/min), by contrast, yielded a relatively small retreat range and retreat intensity. The alcove presented the characteristics of horizontal and vertical development during gully erosion processes. The vertical deepening was more intense than the lateral widening due to the collapse of the gully head, and the influence of this event on hydraulic erosion.
The morphological index of the plane and three dimensions (i.e., area of gully retreat and roughness) can be used to better characterize the erosion and sediment yield of a gully slope, while linear indexes, such as the retreat rate of the gully head, are less useful.
Overall, the current study contributes to an improved understanding of the development processes and underlying mechanisms of gully erosion, ultimately contributing to the development of soil erosion models for slope–gully systems.
Author Contributions
Conceptualization, J.H. and P.L.; methodology, J.H.; validation, J.H. and P.L.; formal analysis, Y.H.; investigation, J.H., Y.H. and K.H.; resources, L.Y. and B.T.; data curation, J.H. and P.L.; writing—original draft preparation, J.H., Y.H. and K.H.; writing—review and editing, J.H. and P.L.; visualization, J.H.; supervision, P.L. and S.L.; project administration, P.L.; funding acquisition, J.H. and P.L. All authors have read and agreed to the published version of the manuscript.
Funding
This research was funded by the National Natural Science Foundation of China (42207407, U2243211), ‘Scientists + engineers’ team development project of YuLin High Tech Industrial Development Zone (YGXKG-2023-105).
Data Availability Statement
Please contact Pengfei Li (pengfeili@xust.edu.cn) for access to the data.
Conflicts of Interest
The authors declare no conflicts of interest.
References
- Chen, G.; Bian, S.; Ma, J.; Meng, X.; Shi, W.; Wu, J.; Zhang, Y.; Li, Y. Field experiment on the spatiotemporal evolution of soil moisture in a rainfall-induced loess landslide: Implications for early warning. J. Hydrol. 2024, 630, 130777. [Google Scholar] [CrossRef]
- Eekhout, J.; Vente, J. Global impact of climate change on soil erosion and potential for adaptation through soil conservation. Earth-Sci. Rev. 2022, 226, 103921. [Google Scholar] [CrossRef]
- Li, D.; Lu, X.; Overeem, I.; Walling, D.; Syvitski, J.; Kettner, A.; Bookhagen, B.; Zhou, Y.; Zhang, T. Exceptional increases in fluvial sediment fluxes in a warmer and wetter high mountain Asia. Science 2021, 374, 599–603. [Google Scholar] [CrossRef] [PubMed]
- Borrelli, P.; Robinson, D.; Panagos, P.; Lugato, E.; Yang, J.; Alewell, C.; Wuepper, D.; Montanarella, L.; Ballabio, C. Land use and climate change impacts on global soil erosion by water (2015–2070). Proc. Natl. Acad. Sci. USA 2020, 117, 21994–22001. [Google Scholar] [CrossRef]
- Zhang, M.; Zhang, K.; Cen, Y.; Wang, P.; Xia, J. Effects of Grass Cover on the Overland Soil Erosion Mechanism Under Simulated Rainfall. Water Resour. Res. 2025, 61, e2023WR036888. [Google Scholar] [CrossRef]
- Li, J.; Li, H.; Guo, M.; Ding, W.; Zhang, C.; Liu, J.; Xu, W.; Tong, X.; Sun, B. Influences of vegetation types and near-surface characteristics on hydrodynamics and soil erosion of steep spoil heaps under rainfall and overland flow conditions. Soil Tillage Res. 2025, 247, 106378. [Google Scholar] [CrossRef]
- Yang, B.; Ma, X.; Jiao, J.; Zhao, W.; Lin, Q.; Li, J.; Zhang, X. Magnitude and hotspots of soil erosion types during heavy rainstorm events on the Loess Plateau: Implications for watershed management. Catena 2024, 246, 108365. [Google Scholar] [CrossRef]
- Poesen, J.; Nachtergaele, J.; Verstraeten, G.; Valentin, C. Gully erosion and environmental change: Importance and research needs. Catena 2003, 50, 91–133. [Google Scholar] [CrossRef]
- Lou, Y.; Zhu, Y.; Wei, J.; Wang, W.; Guo, M.; Kang, H.; Feng, L.; Yang, H. Effects of vegetation on runoff hydrodynamics and erosion morphologies in headcut erosion processes in the loess tableland region. Water Resour. Res. 2025, 61, 38274. [Google Scholar] [CrossRef]
- Zhu, B.; Zhou, Z.; Li, Z. Soil erosion and controls in the slope-gully system of the loess plateau of China: A review. Front. Environ. Sci. 2021, 9, 657030. [Google Scholar] [CrossRef]
- Shi, Q.; Wang, W.; Guo, M.; Chen, Z.; Feng, L.; Zhao, M.; Xiao, H. The impact of flow discharge on the hydraulic characteristics of headcut erosion processes in the gully region of the Loess Plateau. Hydrol. Process. 2020, 34, 718–729. [Google Scholar] [CrossRef]
- Bennett, S.; Casalí, J. Effect of initial step height on headcut development in upland concentrated flows. Water Resour. Res. 2001, 37, 1475–1484. [Google Scholar] [CrossRef]
- Sadeghian, N.; Vaezi, A.; Majnooniheris, A.; Cerdà, A. Soil physical degradation and rill detachment by raindrop impact in semi-arid region. Catena 2021, 207, 105603. [Google Scholar] [CrossRef]
- Babazadeh, H.; Ashourian, M.; Shafai-Bajestan, M. Experimental study of headcut erosion in cohesive soils under different consolidation types and hydraulic parameters. Environ. Earth Sci. 2017, 76, 438. [Google Scholar] [CrossRef]
- Cai, Q. Relationship of sediment production between hillslope and gully slope in a small basin in the hilly loess region, north China. Int. J. Sediment. Res. 1997, 12, 353–359. [Google Scholar]
- Castillo, C.; Gómez, J. A century of gully erosion research: Urgency, complexity and study approaches. Earth-Sci. Rev. 2016, 160, 300–319. [Google Scholar] [CrossRef]
- Poesen, J. Soil erosion in the Anthropocene: Research needs. Earth Surf. Process. Landf. 2018, 43, 64–84. [Google Scholar] [CrossRef]
- Vanmaercke, M.; Poesen, J.; Van, M.; Demuzere, M.; Bruynseels, A.; Golosov, V.; Rodrigues, B.; Bolysov, S.; Dvinskih, A.; Frankl, A.; et al. How fast do gully headcuts retreat? Earth Sci. Rev. 2016, 154, 336–355. [Google Scholar] [CrossRef]
- Gao, C.; Li, P.; Hu, J.; Yan, L.; Latifi, H.; Yao, W.; Hao, M.; Gao, J.; Dang, T.; Zhang, S. Development of gully erosion processes: A 3D investigation based on field scouring experiments and laser scanning. Remote Sens. Environ. 2021, 265, 112683. [Google Scholar] [CrossRef]
- Li, P.; Hao, M.; Hu, J.; Gao, C.; Zhao, G.; Chan, F.; Gao, J.; Dang, T.; Mu, X. Spatiotemporal patterns of hillslope erosion investigated based on field scouring experiments and terrestrial laser scanning. Remote Sens. 2021, 13, 1674. [Google Scholar] [CrossRef]
- Eltner, A.; Maas, H.G.; Faust, D. Soil micro-topography change detection at hillslopes in fragile Mediterranean landscapes. Geoderma 2018, 313, 217–232. [Google Scholar] [CrossRef]
- Dong, Y.; Xiong, D.; Su, Z.; Duan, X.; Lu, X.; Zhang, S.; Yuan, Y. The influences of mass failure on the erosion and hydraulic processes of gully headcuts based on an in situ scouring experiment in a dry-hot valley of China. Catena 2019, 176, 14–25. [Google Scholar] [CrossRef]
- Collison, A.J.C. The cycle of instability: Stress release and fissure flow as controls on gully head retreat. Hydrol. Process. 2001, 15, 3–12. [Google Scholar] [CrossRef]
- Kang, H.; Wang, W.; Guo, M.; Li, J.; Chen, Z.; Lou, Y.; Guo, W.; Xiao, H. Headwall scour hole erosion and overhanging mass collapse play critical roles in gully head retreat on grassland under surface flow. Geomorphology 2022, 411, 108301. [Google Scholar] [CrossRef]
- Chen, A.; Zhang, D.; Peng, H.; Fan, J.; Xiong, D.; Liu, G. Experimental study on the development of collapse of overhanging layers of gully in Yuanmou Valley, China. Catena 2013, 109, 177–185. [Google Scholar] [CrossRef]
- Gao, C.; Li, P.; Yang, X.; Hu, J.; Bai, X.; Yao, W.; Li, D.; Latifi, H.; Gao, J.; Dang, T.; et al. 3D investigation of gully headcut processes: A slicing segmentation based on filed scouring experiments and laser scanning. J. Hydrol. 2024, 638, 131497. [Google Scholar] [CrossRef]
- Stein, O.; LaTray, D. Experiments and modeling of head cut migration instratified soils. Water Resour. Res. 2002, 38, 20–21. [Google Scholar] [CrossRef]
- Guo, W.; Xu, X.; Wang, W.; Liu, Y.; Guo, M.; Cui, Z. Rainfall-triggered mass movements on steep loess slopes and their entrainment and distribution. Catena 2019, 183, 104238. [Google Scholar] [CrossRef]
- Barnes, N.; Luffman, I.; Nandi, A. Gully erosion and freeze-thaw processes in clayrich soils, northeast Tennessee, USA. GeoResJ 2016, 9, 67–76. [Google Scholar] [CrossRef]
- Vandekerckhove, L.; Poesen, J.; Wijdenes, D.; Gyssels, G. Short-term bank gully retreat rates in Mediterranean environments. Catena 2001, 44, 133–161. [Google Scholar] [CrossRef]
- Zhu, T. Gully and tunnel erosion in the hilly loess plateau region, China. Geomorphology 2012, 153, 144–155. [Google Scholar] [CrossRef]
- Wehr, A.; Lohr, U. Airborne laser scanning—An introduction and overview. ISPRS J. Photogramm. Remote Sens. 1999, 54, 68–82. [Google Scholar] [CrossRef]
- Ulrich, V.; Williams, J.; Zahs, V.; Anders, K.; Hfle, B. Disaggregating surface change mechanisms of a rock glacier using terrestrial laser scanning point clouds acquired at different time scales. Earth Surf. Dynam. 2020, 9, 19–28. [Google Scholar] [CrossRef]
- Qin, C.; Zheng, F.; Zhang, X.; Xu, X.; Liu, G. A laboratory study of rill bed incision processes in upland concentrated flows. Catena 2018, 165, 310–319. [Google Scholar] [CrossRef]
- Wang, S.; Fu, B.; Piao, S.; Lv, Y.; Ciais, P.; Feng, X.; Wang, Y. Reduced sediment transport in the Yellow River due to anthropogenic changes. Nat. Geosci. 2016, 9, 38–41. [Google Scholar] [CrossRef]
- Liu, Y.; Jin, X.; Hu, Y. Study on the pattern of rural distinctive ecoeconomy based on land resources: A case study of Suide county in loess hilly areas. Nat. Resour. J. 2006, 21, 738–745. [Google Scholar]
- Yang, F.; Pan, C. Effects of Perennial Grassland on Soil and Water Conservation in Hilly Region of Loess Plateau. Bull. Soil Water Conserv. 2016, 36, 300–306. [Google Scholar]
- Yan, L.; Bai, X.; Li, P.; Li, C.; Hu, J.; Li, D.; Yang, X.; Liu, L.; Gao, J.; Dang, T. A multifactorial study of mass movement in the hilly and gully Loess Plateau based on intensive field surveys and remote sensing techniques. Sci. Total Environ. 2024, 924, 171628. [Google Scholar] [CrossRef]
- Wang, L. Runoff-Sediment Coupling Mechanism of Different Geomorphic Unit in the Loess Hilly-Gully Region; Northwest Agricultural and Forestry University: Yangling, China, 2017. [Google Scholar]
- Su, Z.; Xiong, D.; Dong, Y.; Li, J.; Yang, D.; Zhang, J.; He, G. Simulated headward erosion of bank gullies in the Dry-hot Valley Region of southwest China. Geomorphology 2014, 204, 532–541. [Google Scholar] [CrossRef]
- Li, J.; Guo, X.; Wu, X.; Chen, S.; Zhang, N. Fractal characteristics of overburden fissures in shallow thick coal seam mining in loess gully areas. PLoS ONE 2022, 17, e0274209. [Google Scholar] [CrossRef] [PubMed]
- Deng, Q.; Qin, F.; Zhang, B.; Wang, H.; Luo, M.; Shu, C.; Liu, H.; Liu, G. Characterizing the morphology of gully cross-sections based on PCA: A case of Yuanmou Dry-Hot Valley. Geomorphology 2015, 228, 703–713. [Google Scholar] [CrossRef]
- Tarolli, P.; Cavalli, M.; Masin, R. High-resolution morphologic characterization of conservation agriculture. Catena 2019, 172, 846–856. [Google Scholar] [CrossRef]
- Markus, H.; Christoph, A.; Bernhard, H.; Klaus, S.; Wolfgang, W. Roughness Mapping on Various Vertical Scales Based on Full-Waveform Airborne Laser Scanning Data. Remote Sens. 2011, 3, 503–523. [Google Scholar]
- Cox, S.; Doncaster, D.; Godfrey, P.; Londe, M. Aerial and terrestrial-based monitoring of channel erosion, headcutting, and sinuosity. Environ. Monit. Assess. 2018, 190, 717. [Google Scholar] [CrossRef]
- Vericat, D.; Smith, M.; Brasington, J. Patterns of topographic change in sub-humid badlands determined by high resolution multi-temporal topographic surveys. Catena 2014, 120, 164–176. [Google Scholar] [CrossRef]
- Li, P.; Ren, F.; Hu, J.; Yan, L.; Hao, M.; Liu, L.; Gao, J.; Dang, T. Monitoring soil erosion on field slopes by terrestrial laser scanning and structure-from-motion. Land Degrad. Dev. 2023, 34, 3663–3680. [Google Scholar] [CrossRef]
- Cândido, B.; James, M.; Quinton, J.; Lima, W.; Sliva, M. Sediment source and volume of soil erosion in a gully system using UAV photogrammetry. Rev. Bras. Ciênc. Solo 2020, 44, e0200076. [Google Scholar] [CrossRef]
- Li, Z.; Zhang, G.; Geng, R.; Wang, H. Spatial heterogeneity of soil detachment capacity by overland flow at a hillslope with ephemeral gullies on the Loess Plateau. Geomorphology 2015, 248, 264–272. [Google Scholar] [CrossRef]
- Zhang, B.; Xiong, D.; Zhang, G.; Zhang, S.; Han, W.; Yang, D.; Xiao, L.; Dong, Y.; Su, Z.; Lu, X. Impacts of headcut height on flow energy, sediment yield and surface landform during bank gully erosion processes in the Yuanmou Dry-Hot Valley region, Southwest China. Earth Surf. Process. Landf. 2018, 43, 2271–2282. [Google Scholar] [CrossRef]
- Burkard, M.; Kostaschuk, R. Initiation and evolution of gullies along the shoreline of Lake Huron. Geomorphology 1995, 14, 211–219. [Google Scholar] [CrossRef]
- Kang, H.; Wang, W.; Guo, M.; Li, J.; Shi, Q. How does land use/cover influence gully head retreat rates? An in-situ simulation experiment of rainfall and upstream inflow in the gullied loess region, China. Land Degrad. Dev. 2021, 32, 2789–2804. [Google Scholar] [CrossRef]
- Bradford, J.; Piest, R.; Spomer, R. Failure sequence of gully headwalls in Western Iowa. Soil Sci. Soc. Am. J. 1978, 42, 323–328. [Google Scholar] [CrossRef]
- Guo, M.; Lou, Y.; Chen, Z.; Wang, W.; Feng, L.; Zhang, X. The proportion of jet flow and on-wall flow and its effects on soil loss and plunge pool morphology during gully headcut erosion. J. Hydrol. 2021, 598, 126220. [Google Scholar] [CrossRef]
- Su, Z.; Xiong, D.; Dong, Y.; Zhang, B.; Zhang, S.; Zheng, X.; Yang, D.; Zhang, J.; Fan, J.; Fang, H. Hydraulic properties of concentrated flow of a bank gully in the dryhot valley region of southwest China. Earth Surf. Process. Landf. 2015, 40, 1351–1363. [Google Scholar] [CrossRef]
- Guo, M.; Wang, W.; Shi, Q.; Chen, T.; Li, J. An experimental study on the effects of grass root density on gully headcut erosion in the gully region of China’s Loess Plateau. Land Degrad. Dev. 2019, 30, 2107–2125. [Google Scholar] [CrossRef]
- de Oliveira, M. Towards the integration of subsurface flow and overland flow in gully head extension: Issues from a conceptual model for gully erosion evolution. S. Afr. Geogr. J. 1997, 79, 120–128. [Google Scholar] [CrossRef]
- Guo, M.; Chen, Z.; Wang, W.; Wang, T.; Shi, Q.; Kang, H.; Zhao, M.; Feng, L. Spatial-temporal changes in flow hydraulic characteristics and soil loss during gully headcut erosion under controlled conditions. Hydrol. Earth Syst. Sci. 2020, 25, 4473–4494. [Google Scholar] [CrossRef]
- Dong, Y.; Duan, X.; Huang, J.; Yang, J.; Xiong, D.; Yang, C.; Yi, G. The validation of a gully headcut retreat model in short-term scale based on an in-situ experiment in dry-hot valley. J. Soils Sediments 2021, 21, 2228–2239. [Google Scholar] [CrossRef]
- Yuan, S.; Fan, W.; Jiang, C.; Chang, Y.; Zheng, W. Active Gully Head Erosion Rates Characteristics on the Loess Plateau: InSAR- Based Calculation and Response to Extreme Rainfall. Land Degrad. Dev. 2024, 36, 249–264. [Google Scholar] [CrossRef]
- Yuan, M.; Zhang, Y.; Zhao, Y.; Deng, J. Effect of rainfall gradient and vegetation restoration on gully initiation under a large-scale extreme rainfall event on the hilly Loess Plateau: A case study from the Wuding River basin, China. Sci. Total Environ. 2020, 739, 140066. [Google Scholar] [CrossRef]
- López-Vicente, M.; Quijano, L.; Gaspar, L.; Palazón, L.; Navas, A. Severe soil erosion during a 3-day exceptional rainfall event: Combining modelling and field data for a fallow cereal field. Hydrol. Process. 2015, 29, 2358–2372. [Google Scholar] [CrossRef]
- Chen, Y.; Jiao, J.; Yan, X.; Li, J.; Vanmaercke, M.; Wang, N. Response of gully morphology and density to the spatial and rainy-season monthly variation of rainfall at the regional scale of the Chinese Loess Plateau. Catena 2024, 236, 107773. [Google Scholar] [CrossRef]
- Wang, J.; Zhang, Y.; Li, K.; Zhang, Z.; Chen, C. Gully internal erosion triggered by a prolonged heavy rainfall event in the tableland region of China’s Loess Plateau. Int. Soil Water Conserv. Res. 2023, 11, 610–621. [Google Scholar] [CrossRef]
- Zhang, J.M.; Luo, Y.; Zhou, Z.; Chong, L.; Victor, C.; Zhang, Y.F. Effects of preferential flow induced by desiccation cracks on slope stability. Eng. Geol. 2021, 288, 106164. [Google Scholar] [CrossRef]
Disclaimer/Publisher’s Note: The statements, opinions and data contained in all publications are solely those of the individual author(s) and contributor(s) and not of MDPI and/or the editor(s). MDPI and/or the editor(s) disclaim responsibility for any injury to people or property resulting from any ideas, methods, instructions or products referred to in the content. |
© 2025 by the authors. Licensee MDPI, Basel, Switzerland. This article is an open access article distributed under the terms and conditions of the Creative Commons Attribution (CC BY) license (https://creativecommons.org/licenses/by/4.0/).