Abstract
As a typical grain base with a dense population and high-level urbanization, the North China Plain (NCP) faces a serious threat to its sustainable development due to water shortage. Surface water area (SWA) is a key indicator for continuously measuring the trends of regional water resources and assessing their current status. Therefore, a deep understanding of its changing patterns and driving forces is essential for achieving the sustainable management of water resources. In this study, we examined the interannual variability and trends of SWA in the NCP from 1990 to 2023 using annual 30 m water body maps generated from all available Landsat imagery, a robust water mapping algorithm, and the cloud computing platform Google Earth Engine (GEE). The results showed that the SWA in the NCP has significantly increased over the past three decades. The continuous emergence of artificial reservoirs and urban lakes, along with the booming aquaculture industry, are the main factors driving the growth of SWA. Consequently, the expansion of artificial water bodies resulted in a significant increase in water evaporation (0.16 km3/yr). Moreover, the proportion of water evaporation to regional evapotranspiration (ET) gradually increased (0–0.7%/yr), indicating that the contribution of water evaporation from artificial water bodies to ET is becoming increasingly prominent. Therefore, it can be concluded that the ever-expanding artificial water bodies have become a new hidden danger affecting the water security of the NCP through evaporative loss and deserve close attention. This study not only provides us with a new perspective for deeply understanding the current status of water resources security in the NCP but also provides a typical case with great reference value for the analysis of water resources changes in other similar regions.
1. Introduction
In the North China Plain (NCP), the contradiction between a highly concentrated population and scarce water resources has become a key bottleneck restricting regional sustainable development [1,2,3]. As a considerable agricultural production base and densely populated area in China, the NCP accommodates about 1/5th of the country’s population, but water resources account for less than 5% of the country’s total. The per capita water resources are less than 1/6th of the national average [4,5], and the water resource carrying pressure has been high for ages. In recent years, the rapid urbanization process has profoundly disturbed the natural evolution of regional surface water and groundwater systems through large-scale changes in land use patterns, high-intensity groundwater exploitation, artificial water system transformation, and other human activities [6,7]. Relevant papers [8,9,10] showed that in the past 30 years, the cumulative groundwater overexploitation in some areas of the NCP has reached 180 billion cubic meters, causing the groundwater level to drop at an average annual rate of 1–3 m, triggering hydrogeological changes such as river drying and lake shrinkage. About 40% of the natural rivers in the region have stopped flowing, and the area of large lakes such as Baiyangdian has also been greatly reduced [11,12]. Therefore, systematic investigation into the temporal and spatial dynamics of surface water bodies is crucial for revealing the intertwined impacts of anthropogenic activities and climate change on regional water resources [13].
As a key part of the water cycle, evapotranspiration (ET) changes directly affect the availability of regional water resources and the stability of ecosystems [4,14]. With the increasing attention paid by the Chinese government to ecological restoration in recent years, the extension of artificial water bodies, including urban lakes, aquaculture ponds, and reservoirs, has significantly increased the surface water area (SWA) of regional water bodies, which in turn may lead to an increase in ET. Taking a large artificial reservoir in the NCP as an example, after its completion, the annual ET in the surrounding area increased by 15–20% compared with that before construction [15]. Despite increasing attention, comprehensive investigations into how the expansion of artificial water bodies affects ET across the NCP remain limited, particularly regarding the temporal and spatial dynamics of such influences. In addition, the ET behaviors of different types of artificial water bodies vary greatly (e.g., large water diversion reservoirs and small aquaculture ponds), and their overall contribution to regional water resource changes has not been fully elucidated. Therefore, the systematic analysis of the spatiotemporal evolution characteristics and long-term dynamics of surface water bodies is of great scientific value for assessing how climate change and human interventions jointly influence water resource systems. However, there are still gaps in the current research on NCP: on the one hand, the dynamic response mechanism between surface water changes and regional total water storage has not been systematically revealed; the impact path and intensity of artificial water body expansion on ET are especially unclear. On the other hand, the traditional monitoring model based on ground observation stations has a difficult time meeting the dynamic tracking needs of complex hydrological processes due to limited coverage and delayed data updates. Faced with the vast area of the NCP and the diverse types of artificial water bodies, traditional methods cannot fully and timely obtain information on artificial water body expansion and ET changes.
Fortunately, the booming development of remote sensing technology has provided an innovative path to solving the above problems [16]. With the technical advantages of high spatial resolution, long-term continuous observation, and large-scale synchronous data collection, satellite remote sensing has become the core means of the dynamic monitoring of water resources [17,18,19]. Many remote sensing data products have been introduced in global and regional scale studies [20,21,22,23,24]. These data products can capture the changes in surface information from a macro scale, providing a rich data basis for research. However, at present, there is no research that uses the Landsat surface reflectance (SR) dataset to produce annual variation maps of different surface water bodies across the NCP from the 1990s onward. The absence of continuous spatiotemporal data on different surface water bodies makes it challenging to investigate their dynamic transformations and assess their impacts on regional water resources. For example, in actual situations, it is hard to understand the amount of water lost due to the evaporation of water bodies and the impact of greenhouse gases emitted by small ponds and other water bodies on the environment. Fortunately, with the help of remote sensing cloud platforms represented by Google Earth Engine (GEE), we can use its powerful computing resources, rich remote sensing images (e.g., MODIS SR Landsat, and Sentinel data), geospatial datasets, and common classification tools to perform long-term land cover monitoring in an open environment. The platform supports the efficient processing of large-scale remote sensing data, thereby facilitating the spatiotemporal analysis of artificial water body expansion and ET changes in the NCP.
This study aims to focus on the spatio-temporal evolution of different kinds of surface water bodies in the NCP over the past three decades, identify their main driving mechanisms, and evaluate their impact on the regional water security pattern. To do this, we first systematically analyzed the historical evolution of various types of surface water bodies with the help of all of these Landsat archives and the remote sensing cloud computing service. Secondly, we investigated the variability of evaporative water loss and explored the relationship between the changes in evaporation and areas of surface water bodies. Finally, the impacts of evaporative water loss on water security were quantitatively evaluated by calculating the changes in how water evaporation contributes to regional ET. This study is expected to give us a new perspective on the current water security situation in the NCP and provide scientific support for protecting the limited water resources in such a strategically significant region and ensuring sustainable development.
2. Data and Methods
2.1. Study Area
The NCP, also referred to as the Huang-Huai-Hai Plain, is among the three major plains in China [25,26]. The scope of the NCP defined in this paper covers seven provinces and municipalities directly under the central government, including Beijing, Tianjin, Shandong, Henan, Hebei, Jiangsu, and Anhui, covering an area of approximately 800,000 km2 (Figure 1). Considering that the area of Beijing and Tianjin is smaller than that of other provinces, this study combines them into one area (Beijing and Tianjin, B&T). As one of the most densely populated plains and major grain-producing areas in China, NCP has formed a typical irrigation agricultural rotation system dominated by winter wheat and summer corn. However, the region faces severe water shortage problems: based on CHIRPS (Climate Hazards Group InfraRed Precipitation with Station Data) monitoring data from 1990 to 2023, the average annual precipitation in the NCP is 827.95 mm, showing significant temporal and spatial unevenness. The precipitation in summer (June–August) reaches 477.17 mm, accounting for 57.63% of the whole year; the precipitation in spring (March–May), autumn (September–November), and winter (December–February) is 157.61 mm (19.03%), 143.0 mm (17.29%), and 50.17 mm (6.05%), respectively. The lack of precipitation in the non-growing season has aggravated the pressure on agricultural irrigation [27,28]. Previous studies [29,30,31] have shown that high-intensity agricultural production has led to the over-exploitation of groundwater, rendering the region one of the three most over-exploited groundwater areas globally. Understanding water resource dynamics in the NCP is not only the core entry point for solving the regional water resources supply and demand imbalance dilemma but also a key scientific proposition for maintaining the safety of the basin’s hydrological cycle and promoting the sustainable development of the country’s main grain-producing areas [28].
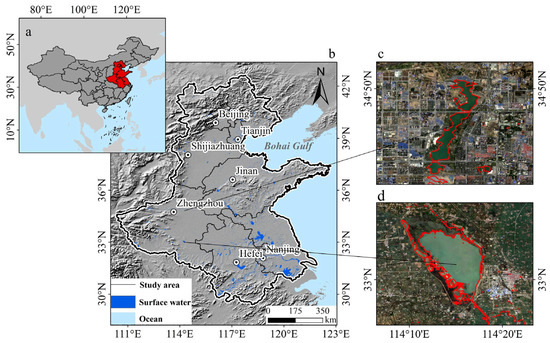
Figure 1.
Overview of the North China Plain (NCP). (a) Geographical location of the NCP; (b) Distribution of surface water in the NCP in 2023; (c–d) Enlarged view of Suya Lake and Kaifeng West Lake, with a false-color composite image generated using Sentinel-2 in the background.
2.2. Data
2.2.1. Landsat Data
This research focuses on the temporal and spatial evolution of surface water in the NCP and establishes a dynamic monitoring system based on multi-source remote sensing data. The Landsat 5/7/8/9 Collection 1 Tier 1 Surface Reflectance (SR) images, spanning from 1990 to 2023, are the core data source and form the long-term observational records of the entire NCP for 34 years. The above data are provided by the United States Geological Survey and can be obtained on GEE, supporting large-scale analysis through distributed computing. Data preprocessing uses CFmask QA tape to automatically mask clouds, cloud shadows, and snow [32,33]. We combine the solar azimuth and zenith angles in the metadata with the DEM derived from SRTM to simulate terrain shadows and correct terrain radiation distortion. In order to address the banding issue caused by Landsat 7 SLC failures since 2003, this study designed a quality-based filtering strategy to retain only high-quality observations in non-striped areas, ensuring temporal continuity. Quantitative evaluation confirms that the effective annual observation data since 1990 are dense enough to capture changes in surface water. Finally, about 59,000 Landsat images (~45 TB) were integrated, providing high spatiotemporal resolution support for dynamic SWA monitoring.
2.2.2. Auxiliary Data for Identifying Different Kinds of Artificial Surface Water
To identify artificial reservoirs and analyze their area changes, we used three main datasets: (1) China Reservoir Dataset (CRD) [34], which provides information on the location, area, and storage capacity of 97,435 reservoirs across the country. It was jointly developed by the Chinese Academy of Sciences, Kansas State University, and other research institutions. (2) China Surface Water, Dams, and Lakes Dataset (China-LDRL) [35], published by Fudan University, contains parameters such as latitude and longitude, area, and perimeter of 2418 dams, 3051 large lakes, and 2194 large reservoirs in China. (3) Global Reservoir and Dams Database (GRanD) [36] provides the location of typical reservoirs and dams around the world as of 2011. It was jointly constructed by the Global Water System Project (GWSP) and the Center for International Earth Science Information Network (CIESIN). In terms of aquaculture data, based on the GEE platform, Yin et al. [37] developed a spatial distribution dataset covering China’s terrestrial and offshore aquaculture areas with a spatial resolution of 30 m and a temporal resolution of 4 years. This study only used the terrestrial aquaculture pond distribution part (CAP_MA_China_1990_2022). Wang et al. [38] generated the first global spatial distribution data of landside clustered aquaculture ponds (LCAP), which used 4,015,054 10 m Sentinel-2 time series images collected in 2020. In addition, the study also used the Global Urban Boundaries (GUB) data from 1990 to 2018 [39], which are derived from the Global Artificial Impermeable Area (GAIA) dataset to extract surface water information in urban areas.
2.2.3. Data on Water Evaporation and Evapotranspiration
In order to accurately quantify the surface evaporation of NCP from 1990 to 2018, this study adopts a multi-source data fusion strategy. The core data source is the Global Lake Evaporation Dataset (GLEV) [40]. This covers the evaporation data of approximately 1.42 million lakes and reservoirs with an area of not less than 0.1 km2 from 1985 to 2018 worldwide. Its monthly evaporation estimates incorporate the water area data of HydroLAKES [41] and calculate the evaporation rate based on the optimized Penman equation [42] to improve the reliability and consistency of the data. In addition, the study introduced the Penman–Monteith–Leuning (PML) version 2 ground ET dataset as a supplement. The spatial resolution of this dataset is 500 m, the temporal resolution is 8 days, and the coverage period is from 2000 to 2018, which can reflect the surface water loss process in a relatively detailed manner [43]. In this study, we added the ground evaporation estimated by PML-V2 to the surface evaporation estimated by GLEV to obtain the total ET in the study area.
2.3. Methods
2.3.1. Identification of Different Kinds of Surface Water Bodies
This study used the modified normalized difference water index (mNDWI), enhanced vegetation index (EVI), and normalized difference vegetation index (NDVI) to accurately identify water pixels in satellite imagery. The fundamental idea is to distinguish water bodies from vegetation by leveraging the spectral difference in mNDWI, EVI, and NDVI values. Specifically, the identification rule is defined as [(mNDWI > EVI or mNDWI > NDVI) and EVI < 0.1]. Utilizing good-quality Landsat-5/7/8/9 observations after image quality control, we created the annual maps of surface water occurrence frequency in the NCP during 1990–2023. Furthermore, to extract the consistently present water bodies, we adopted a threshold of frequency > 0.75 and derived year-long surface water bodies, which are defined as areas persistently inundated throughout an entire year. This process resulted in annual maps at a 30 m resolution, representing the spatial distribution of perennial surface water. The detailed description of the procedures can be seen in the former research [13,44]. In order to realize the dynamic monitoring of different kinds of artificial water bodies (e.g., urban lakes, reservoirs, aquaculture ponds, etc.), we identified and extracted the large- and medium-sized artificial reservoirs and aquaculture ponds by integrating multi-source auxiliary data, such as GRanD [36] and CRD [34]. Secondly, the geographical locations of these targets are spatially intersected with the annual year-long surface water maps to determine the annual coverage areas. Thirdly, the urban lakes were extracted from the annual surface water maps based on the city boundaries defined by the GUB data [39]. Finally, the thematic maps of various kinds of water bodies were merged to achieve the comprehensive recording and monitoring of the dynamic changes in artificial water bodies (Figure 2).
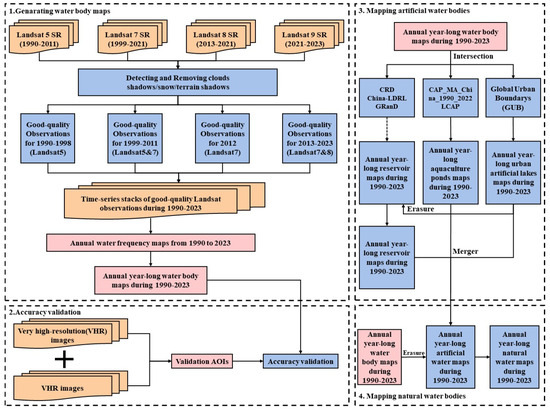
Figure 2.
Flowchart for mapping surface water by type using 30 m Landsat SR data.
2.3.2. Accuracy Assessment
This study randomly selected 700 Areas of Interest (AOI), using the random point creation tool of ArcGIS 10.8 software to generate a sample point set containing approximately 29,300 Landsat pixels. In the Google Earth Pro 7.3 environment, visual interpretation of very high-resolution (VHR) remote sensing images from Digital Earth, the National Spatial Research Center, and the Asian region was conducted, and field validation of land cover types was completed using the diameter method. This study conducted an accurate assessment of the water body distribution maps in 1990, 2000, 2010, and 2020. The sample area space in 2020 is as follows (Figure 3). Taking the 2020 validation data as an example, this batch of AOI includes 116 aquatic areas and 584 non-aquatic body areas. To ensure the temporal consistency of the data sources, the study specifically selected ultra-high-resolution images within the AOI range of the same year as the analytical benchmark for generating surface water distribution maps corresponding to that period. The real object labels of the samples were obtained through high-resolution images and field verification, the Landsat water body classification results were matched with them, and the confusion matrix was constructed to count the number of real-classification intersections [44,45,46]. Then, the producer accuracy, user accuracy, overall accuracy, and Kappa coefficient were calculated to evaluate the classification performance and reliability of the Landsat water body maps. The assessment results indicated that the overall accuracy consistently exceeded 95.0% across all periods, validating the robustness and reliability of the generated data products for monitoring surface water dynamics (Table 1).
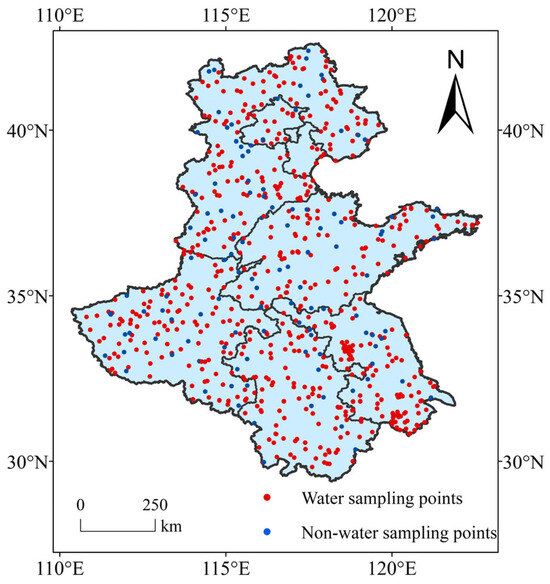
Figure 3.
Spatial distributions of 700 AOIs (116 water AOIs and 584 non-water AOIs) in the NCP, for validating the accuracy of the surface water maps in 2020.

Table 1.
Confusion matrices for assessing the accuracy of surface water maps.
2.3.3. Change Analyses of Different Types of Artificial Surface Water Bodies
After completing the extraction of the NCP surface water time series from 1990 to 2023 (Figure 4), this study constructed a multi-scale, multi-method quantitative analysis framework to systematically analyze its spatial distribution characteristics and evolution trends. Given the temporal evolution of the SWA of artificial water bodies, a linear fitting model was used to quantify the changing trends of the SWA of different types of artificial water bodies, revealing their dynamic evolution laws from the time dimension. At the spatial analysis level, since the interannual surface water images with a resolution of 30 m are relatively small, the spatial distribution pattern is not obvious, and spatial aggregation is performed and converted into 0.5° × 0.5° grid units to make the spatial distribution more obvious. The interannual SWA spatial distribution map is generated by calculating the proportion of water pixels in each grid. Building on this foundation, to investigate the spatial evolution of SWA, we applied the Theil–Sen median slope estimator in combination with the Mann–Kendall non-parametric test to assess the temporal trend of SWA at the each grid pixel from 1990 to 2023. The Theil–Sen method can accurately capture the changing trend of long-term remote sensing series by its strong robustness regarding extreme values and data errors; the Mann–Kendall test verifies the statistical significance of time series changes based on the characteristics of the non-distribution hypothesis, and its high tolerance to missing data and outliers further ensures the reliability of the analysis. The two are used in synergy to determine the direction and significance of the SWA change trend of each grid pixel in the study area. In addition, by calculating the slope of water evaporation change at the administrative unit and grid scale, the key areas with the most significant changes in evaporation are identified, providing precise target areas for subsequent water resource management and ecological research.
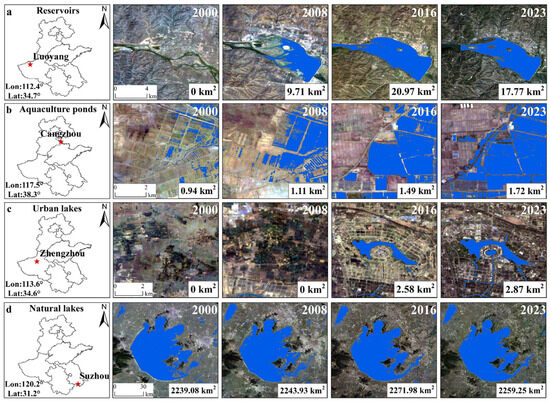
Figure 4.
Comparative analysis of urban artificial lakes, natural lakes, reservoirs, and aquaculture ponds during 2000–2023, with the help of false color composites from Landsat images. (a) Reservoirs; (b) Aquaculture ponds; (c) Urban lakes; (d) Natural lakes.
2.3.4. Calculation of Water Evaporation Volume
This study estimates water evaporation using the following method. The daily evaporation rate data from 1990 to 2018 provided by GLEV are used to calculate the annual average evaporation rate and are spatially matched with various SWA data obtained during the same period to achieve the calculation of evaporation.
Among them, E represents the evaporation of water in cubic kilometers (km3), Erate is the daily evaporation rate provided by GLEV, in mm/day, n is the total number of days when calculating the annual average, SWA is the surface area of each type of water body in square meters (km2), and 10−6 is the unit conversion factor from millimeter square kilometers (mm * km2) to cubic kilometers (km3).
2.3.5. Effects of SWA Changes on Water Security
In the natural hydrological cycle, SWA plays a vital role in determining the total volume of evaporation [46,47]. An expansion of SWA exposes a greater number of water molecules to atmospheric conditions, increasing the likelihood that these molecules gain sufficient energy to transition from liquid to vapor, thus intensifying evaporative water loss. In contrast, a reduction in SWA limits this exposure, thereby reducing the potential for evaporation. Water Evaporation is a key component of ET [48,49,50]. Changes in water evaporation due to the dynamics of SWA directly affect the regional ET. In this study, we analyzed the impact of SWA dynamics on water evaporation through the following process. First, we assessed the interannual variation and long-term trends of SWA at both provincial and prefectural levels. Second, we quantified the relationship between SWA and water evaporation volumes to elucidate the extent to which fluctuations in SWA influence evaporative water loss. Finally, we examined the proportion of water evaporation contributing to total ET across prefecture-level cities, underscoring the implications of these findings for regional water resource security.
3. Results
3.1. Changes in Different Types of Artificial Surface Water Bodies
In order to further understand the trend of SWA of different types of artificial water bodies in the NCP, we first used a linear regression model for analysis. The results clearly showed that during the period 1990–2023, the SWA of different types of artificial water bodies in the NCP demonstrated a significant growth trend (p < 0.05, R2 ≈ 1). This result is highly statistically significant, which means that the growth trend is not accidental, but has internal laws and influencing factors. From the perspective of interannual changes and overall trends, the growth of different types of artificial water bodies has its own characteristics. Among them, the growth rate of the SWA of aquaculture ponds (Figure 5a) is the most prominent. In 1990, its SWA was 3796.63 km2. By 2023, this value continued to climb to 6108.13 km2, an increase of 60.9%, with an annual growth rate of 57.73 km2/yr. At the same time, the SWA of reservoirs and urban artificial lakes is also expanding steadily. During the period 1990–2023, reservoirs (Figure 5b) grew at a rate of 26.08 km2/yr, while urban artificial lakes (Figure 5c) expanded at a rate of 18.05 km2/yr. The increase in the area of urban artificial lakes may be related to the emphasis on ecological landscape construction in urban planning, as well as the growing demand from urban residents for leisure and recreational spaces. The expansion of reservoir areas may be related to factors such as water resources regulation, the continuous advancement of water conservancy project construction, and the uneven temporal and spatial distribution of water resources caused by climate change. Compared with the relatively clear growth trend of artificial water bodies, the SWA changes of natural water bodies (Figure 5d) are more complicated. Because natural water bodies are affected by a variety of factors, such as precipitation, evaporation, and human activities, their SWA fluctuates in different periods. The interaction of these influencing factors makes it difficult to describe the SWA changes of natural water bodies with a single law.
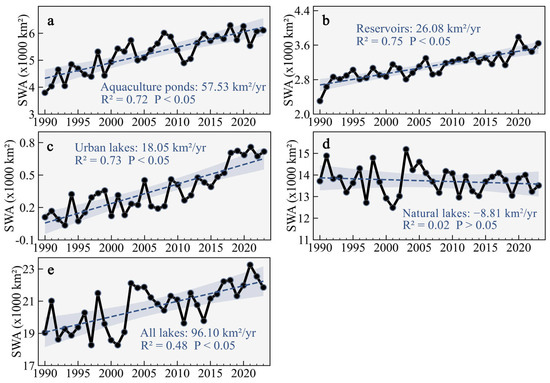
Figure 5.
Trends of SWA Changes in Different Types of Water Bodies in the NCP from 1990 to 2023; (a) Aquaculture ponds; (b) Reservoirs; (c) Urban artificial lakes; (d) Natural lakes; (e) All lakes.
The spatial pattern of SWA changes also indicates that the SWA has continued to expand since 1990. Specifically, among 436 grids with dimensions of 0.5° × 0.5°, 367 and 143 grid units of urban artificial lakes (Figure 6c) and reservoirs (Figure 6d), respectively, showed a significant (p < 0.05) upward trend in SWA. Since most of the aquaculture ponds (Figure 6e) are distributed in coastal areas, they showed a zero-growth trend in Henan, Hebei, and inland Shandong, but there were still 109 grid units in coastal areas, and Jiangsu, Anhui, and other places showed a significant (p < 0.05) upward trend in SWA. We also drew a trend map of the change in all water bodies (Figure 6a). As can be seen, except for Anhui and parts of Jiangsu, the SWA of the NCP as a whole showed an increasing trend. These findings offer a broad-scale perspective for comprehensively understanding the changes in SWA across the NCP, facilitating deeper analysis of regional water resource dynamics and providing a scientific foundation for informed water resource management and ecological environmental protection.
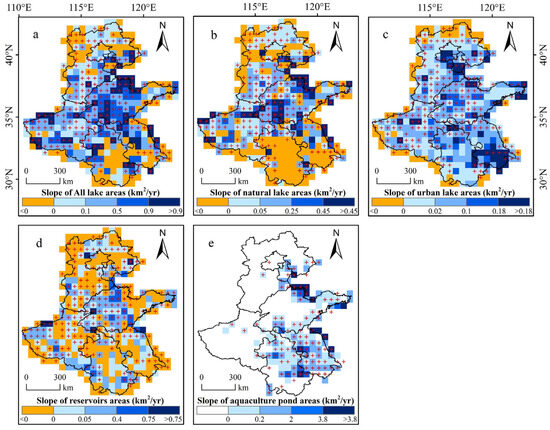
Figure 6.
Trend of Changes in Different Types of Water Bodies in the NCP from 1990 to 2023 at 0.5 Degree Resolution. (a) All lakes; (b) Natural lakes; (c) Urban artificial lakes; (d) Reservoirs; (e) Aquaculture ponds. The presence of a “+” marker on pixels signifies statistically significant linear trends (p-value < 0.05).
3.2. Changes in Water Evaporation Volumes
Previous studies [5,51,52,53] have confirmed that SWA expansion can increase evaporated moisture loss. Based on this, we first conduct in-depth research on the water evaporation dynamics and trends of different types of water bodies. The research results show that between 1990 and 2018, the overall evaporation of water in the NCP area showed an increase. Among them, although the evaporation of natural water bodies also has a growing trend (Figure 7d), its fluctuations are relatively violent (R2 = 0.17), which has a conflict with the steadily increasing evaporation of NCP water bodies (Figure 7e). Based on this, we believe that the rise in evaporation of artificial water bodies is the dominant factor driving the increase in the evaporation of NCP water bodies.
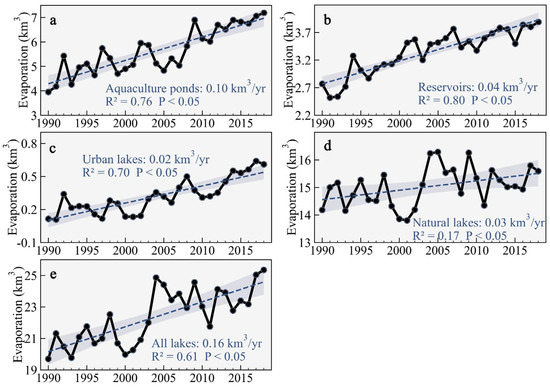
Figure 7.
Variation trend of evaporation of different types of water bodies from 1990 to 2018. (a) Aquaculture ponds; (b) Reservoirs; (c) Urban artificial lakes; (d) Natural lakes; (e) All lakes.
Through further research, we have shown that the evaporation of artificial water bodies has shown a significant growth trend (p < 0.05, R2 ≈ 1). Among all kinds of artificial water bodies, the evaporated water loss in aquaculture ponds has the fastest growth rate, reaching 0.10 km3/yr (Figure 7a), followed by reservoirs, with a growth rate of 0.04 km3/yr (Figure 7b); the growth rate of urban artificial lakes is relatively slow at 0.02 km3/yr (Figure 7c). To prove the above conclusion more intuitively and comprehensively, we have produced spatial distribution maps of different water body types. On a municipal scale, among the 82 prefecture-level cities in the NCP region, water evaporation in 66 prefecture-level cities (Figure 8e) showed an increasing trend. Specifically, for different types of artificial water bodies, among these 82 prefecture-level cities, the evaporation of water in urban artificial lakes (Figure 8c) all showed a growth trend; in terms of aquaculture ponds (Figure 8a), except for areas where there are no aquaculture ponds, the area of aquaculture ponds in all regions has shown an upward trend; in terms of reservoir evaporation (Figure 8b), except for Beijing, Tianjin, and Lianyungang, the evaporation of water in other cities has also continued to grow.
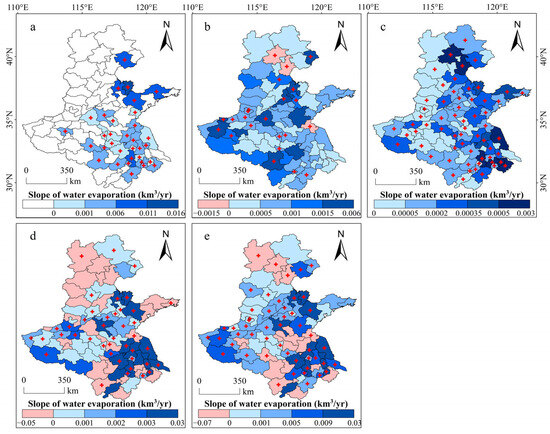
Figure 8.
Spatial chart of evaporation of different types of water bodies at the municipal scale from 1990 to 2018. (a) Aquaculture ponds; (b) Reservoirs; (c) Urban artificial lakes; (d) Natural lakes; (e) All lakes. The presence of a “+” marker on pixels signifies statistically significant linear trends (p-value < 0.05).
3.3. Effects of Water Evaporation Changes on ET
Past research [40,49,54] have shown that variations in water evaporation can significantly influence regional water security. In this study, we focused on the relationship between changes in water evaporation and SWA. Through linear regression analysis, there was a strong positive correlation between total water evaporation and SWA growth (R2 = 0.70, p < 0.05) (Figure 9a). These findings suggest a strong underlying association between SWA expansion and increased total water evaporation, indicating that the growth of SWA is likely a key contributing factor. To further explore how this relationship manifests spatially across the region, we further analyze it in the municipal scale spatial map. The study covered 82 prefecture-level cities of NCP (Figure 9b). The results showed that, except for cities such as Weifang, Zibo, and Binzhou, the other 62 prefecture-level cities showed significant correlations. This means that in most NCP-level cities, the positive correlation between moisture evaporation and SWA is more common and obvious. From this, we can reasonably infer that in the NCP region, the expansion of SWA significantly increases evaporation and water loss. This phenomenon may contain complex ecological and hydrological processes. For example, the expansion of SWA may increase the contact area between the water and the atmosphere, resulting in more water evaporation.
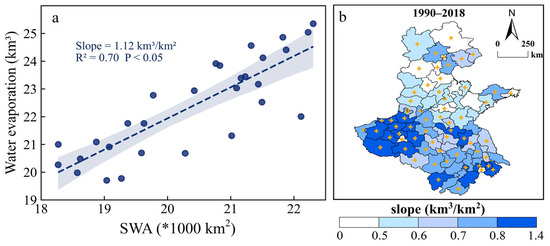
Figure 9.
The impact of surface water change on evaporation. (a,b) Correlation analyses between water evaporation and SWA for the entire NCP and each prefecture-level city from 1990 to 2018. The presence of a “+” marker on pixels signifies statistically significant linear trends (p-value < 0.05).
Furthermore, we also found that in the process of ET growth, moisture evaporation plays an increasingly important role. After analyzing the ratio of the multi-year average evaporation to ET in 82 prefecture-level cities (Figure 10a), it was found that only 10 prefecture-level cities had a ratio less than 1%. Especially in Jiangsu and Anhui regions, such as Xuanzhou, Liuan, Anqing, and other places, the average annual ratio has reached 22.85%, 20.37%, and 23.17% respectively, all above 19%. This fully demonstrates that in these areas, moisture evaporation accounts for a considerable proportion of ET. To more comprehensively understand the dynamic changes between water evaporation and ET, we conducted in-depth research on the ratio of water evaporation to ET over the years (Figure 10b). The results demonstrate that the portion of water evaporation relative to ET in the NCP has generally been increasing over the years (0–0.7%/yr). Only seven prefecture-level cities showed a slightly decreasing trend. This trend further highlights the increasing role of evaporation changes in ET, which cannot be ignored in water resource management and protection. Based on the above research results, the expansion of SWA promotes the growth of evaporated water, which in turn has a significant impact on regional ET.
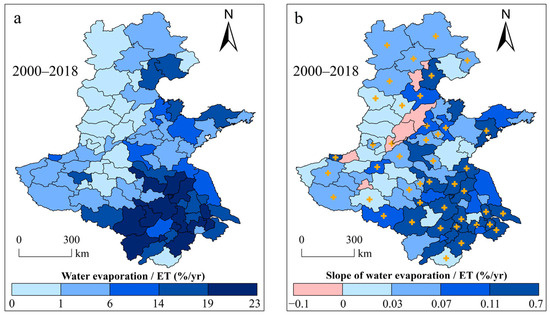
Figure 10.
Effects of water evaporation on ET. (a) The ratio of annual average water evaporation to ET in various prefecture-level cities from 2000 to 2018; (b) Trends of annual water evaporation/ET ratio in various prefecture-level cities from 2000 to 2018. The presence of a “+” marker on pixels signifies statistically significant linear trends (p-value < 0.05).
4. Discussion
4.1. Emerging Artificial Surface Water Bodies and Their Risks to Water Security
Indeed, if the expansion of surface water bodies is due to increased precipitation, this is undoubtedly a positive signal for NCP with severe water shortages and will increase regional freshwater supply and alleviate groundwater overexploitation. However, satellite-based observations of surface water dynamics in the NCP over recent decades indicate that the rapid expansion of surface water is primarily attributed to the continuous development of different artificial water bodies (i.e., urban lakes, reservoirs, and aquaculture ponds), rather than an increase in natural water inflow or recharge. The water sources of these projects generally come from groundwater extraction or water diversion projects (e.g., Yellow River Diversion Project), resulting in a large number of water bodies exposed to the Earth’s surface [55,56,57,58]. The total volume of evaporation from water bodies will be affected by a range of meteorological factors, including surface water area, temperature, solar radiation, wind speed, and atmospheric pressure. Among them, the water surface area is recognized as one of the most critical factors affecting water evaporation changes. Previous studies [7,42] have pointed out that the contribution rate of the expansion of water area to the change in total evaporation can exceed 60%. Changes in ET are one of the most important factors affecting regional water reserves. Their changes not only reflect the dynamic adjustment of the hydrological cycle but also profoundly affect the surplus and deficit status of regional water reserves. Considering that ET is composed of multiple processes, such as water surface evaporation, vegetation transpiration, soil evaporation, and vegetation interception loss, changes in surface water evaporation will inevitably affect the overall ET level. This study revealed that the increase in artificial water bodies has led to the expansion of SWA, which in turn has enhanced water surface evaporation, leading to an increase in regional ET and accelerating the loss of surface freshwater. Therefore, this process ultimately poses a new challenge to the already tense water resources situation in the NCP.
4.2. Comparison with Previous Studies
The NCP has limited water resources, and previous research [59,60,61] has primarily concentrated on the temporal dynamics of groundwater and overall water storage in the region. Utilizing data from the Gravity Recovery and Climate Experiment (GRACE), numerous researchers have identified the NCP as one of the three global hotspots experiencing the most severe groundwater storage depletion [62,63,64]. These studies attribute the long-term depletion mainly to intensive agricultural irrigation practices over the past several decades. Surface water has an important impact on the regional ecological environment. Although some previous studies [65,66,67] have examined the temporal dynamics of surface water bodies, there has been limited attention paid to long-term trends and their potential driving factors. In particular, studies about exploring the implications of surface water changes for regional water security remain limited.
In this study, we fully depicted the complete changes of surface water in the NCP from 1990 to the present. We utilized all the remote sensing records from Landsat and various kinds of auxiliary datasets to conduct the classification and continuous monitoring of various types of water bodies over the past three decades. Moreover, we revealed the driving factors of SWA changes in this water-limited region. We found the continuous expansion of surface water due to artificially constructed urban lakes, reservoirs, and aquaculture ponds. In addition, we quantitatively assessed the influence of surface water body dynamics on regional ET. The findings indicate that the expansion of artificial surface water bodies has contributed to increased water loss in the NCP, primarily through enhanced evaporation (0.16 km3/yr) and the associated rise in ET. Moreover, the datasets and methodologies employed in this study for monitoring surface water evolution and evaluating the impacts of SWA changes on water resources are applicable to similar research efforts in comparable regions worldwide.
4.3. Uncertainty Analyses and Prospects
Compared with existing studies [58,68,69], although this study is innovative in revealing the complete process of surface water changes and analyzing their potential effects on water security in the NCP, which is China’s most water scarcity region, with irreplaceable national strategy significance, there are still uncertainties and limitations related to the data and methodology used. First, the water body extraction method based on Landsat satellites is limited by the spatial resolution of 30 m × 30 m, resulting in the risk of missing small water bodies. Second, this study utilized the GLEV dataset to quantify the changes in the annual volumes of surface water evaporation. Considering that GLEV included those water bodies with a size over 0.1 km2 [40], there is inevitably a deviation in estimating the total water evaporation because of the omission of the evaporation from smaller water bodies. However, it is important to recognize that large bodies of water are often major contributors to evaporation [46,47]. In the future, it is of great significance to estimate the water evaporation from all the surface water bodies by using the combination of time series surface water body maps and the calculation of the evaporation rate based on various models (e.g., Penman Equation). Finally, to obtain the annual areas of different kinds of artificial water bodies, we applied the geographical information of these artificial water bodies from multi-source auxiliary data to our generated year-long surface water maps, which could also bring uncertainties to the results. In future work, we should pay more attention to developing automatic algorithms for mapping different types of surface water bodies by fully taking advantage of powerful artificial intelligence and cloud computing platforms.
5. Conclusions
As China’s urbanization process continues to advance, the government’s attention to environmental protection continues to increase, and the quantity and scale of artificial water bodies in the NCP have shown a significant growth trend.
The NCP is the region with the most severe water scarcity, along with the largest population, in China. A latest understanding about the evolution of water resources is crucial for sustainable water resources management and protection. In this study, we used the complete historical Landsat archives, an index- and threshold-based water extraction algorithm, and the GEE cloud computing service to analyze the interannual variation of SWA in the region from 1990 to 2023. We found that the areas of surface water bodies continuously increased from 19,038.22 km2 to 21,852.17 km2 at a rate of 96.1 km2/yr. Driver analyses showed that the significant expansion of SWA was the result of the large-scale construction of different types of artificial water bodies (urban lakes: 18.05 km2/yr; reservoirs: 26.08 km2/yr; aquaculture ponds: 57.53 km2/yr). Furthermore, we revealed that the growth of artificial water bodies has enlarged the interface between water surfaces and the atmosphere, thereby leading to an increase in evaporative water loss (0.16 km3/yr) from surface water. Specifically, the increasing rate of evaporation from aquaculture ponds reached 0.1 km3/yr, which presents the largest increase compared to other types of artificial water bodies (reservoirs: 0.04 km3/yr; urban lakes: 0.02 km3/yr). Additionally, our findings indicate that the proportion of water evaporation to total ET exhibited a yearly increasing trend (0–0.7%/yr) over the past two decades, suggesting a growing significance of water evaporation in the overall ET process. It inspired to urgently formulate reasonable and effective water resources management policies by fully considering the impact of evaporative water loss on the regional water budget. Such action is critical for promoting sustainable water use and safeguarding ecological security alongside balanced social and economic development in the NCP.
Author Contributions
Conceptualization, Y.Z., S.T. and W.Z.; methodology and formal analysis, Z.W., Y.Z., H.T., X.L. and B.H.; writing—original draft preparation, Z.W., Y.Z., W.Z. and S.T.; writing—review and editing, Y.C. and W.Z. All authors have read and agreed to the published version of the manuscript.
Funding
This study is supported by the National Natural Science Foundation of China (42430702, 42301125), the Opening Foundation of Henan Key Laboratory of Ecological Environment Protection and Restoration of Yellow River Basin (LYBEPR202303), the Postdoctoral Fellowship Program of CPSF under Grant Number GZB20240197, the China Postdoctoral Science Foundation (2024M760767), the Henan Provincial Key Science Fund (232300421138), and the Natural Science Foundation of Henan (252300420295).
Data Availability Statement
The original contributions presented in the study are included in the article; further inquiries can be directed to the corresponding author.
Conflicts of Interest
The authors declare that they have no known competing financial interests or personal relationships that could have appeared to influence the work reported in this paper.
References
- Fang, Q.X.; Ma, L.; Green, T.R.; Yu, Q.; Wang, T.D.; Ahuja, L.R. Water Resources and Water Use Efficiency in the North China Plain: Current Status and Agronomic Management Options. Agric. Water Manag. 2010, 97, 1102–1116. [Google Scholar] [CrossRef]
- Mo, X.-G.; Hu, S.; Lin, Z.-H.; Liu, S.-X.; Xia, J. Impacts of Climate Change on Agricultural Water Resources and Adaptation on the North China Plain. Adv. Clim. Change Res. 2017, 8, 93–98. [Google Scholar] [CrossRef]
- Khan, S.; Hanjra, M.A.; Mu, J. Water Management and Crop Production for Food Security in China: A review. Agric. Water Manag. 2009, 96, 349–360. [Google Scholar] [CrossRef]
- Koch, J.; Zhang, W.; Martinsen, G.; He, X.; Stisen, S. Estimating Net Irrigation across the North China Plain through Dual Modeling of Evapotranspiration. Water Resour. Res. 2020, 56, e2020WR027413. [Google Scholar] [CrossRef]
- Zhou, Y.; Dong, J.; Cui, Y.; Zhou, S.; Li, Z.; Wang, X.; Deng, X.; Zou, Z.; Xiao, X. Rapid Surface Water Expansion Due to Increasing Artificial Reservoirs and Aquaculture Ponds in North China Plain. J. Hydrol. 2022, 608, 127637. [Google Scholar] [CrossRef]
- Liu, J.; Yang, W. Water Sustainability for China and Beyond. Science 2012, 337, 649–650. [Google Scholar] [CrossRef]
- Tian, W.; Liu, X.; Wang, K.; Bai, P.; Liu, C. Estimation of Reservoir Evaporation Losses for China. J. Hydrol. 2021, 596, 126142. [Google Scholar] [CrossRef]
- Zhang, C.; Duan, Q.; Yeh, P.J.-F.; Pan, Y.; Gong, H.; Moradkhani, H.; Gong, W.; Lei, X.; Liao, W.; Xu, L. Sub-Regional Groundwater Storage Recovery in North China Plain after the South-to-North Water Diversion Project. J. Hydrol. 2021, 597, 126156. [Google Scholar] [CrossRef]
- Yang, W.; Long, D.; Scanlon, B.R.; Burek, P.; Zhang, C.; Han, Z.; Butler, J.J., Jr.; Pan, Y.; Lei, X.; Wada, Y. Human Intervention Will Stabilize Groundwater Storage across the North China Plain. Water Resour. Res. 2022, 58, e2021WR030884. [Google Scholar] [CrossRef]
- Su, G.; Wu, Y.; Zhan, W.; Zheng, Z.; Chang, L.; Wang, J. Spatiotemporal Evolution Characteristics of Land Subsidence Caused by Groundwater Depletion in the North China Plain During the Past Six Decades. J. Hydrol. 2021, 600, 126678. [Google Scholar] [CrossRef]
- Helfer, F.; Lemckert, C.; Zhang, H. Impacts of Climate Change on Temperature and Evaporation from a Large Reservoir in Australia. J. Hydrol. 2012, 475, 365–378. [Google Scholar] [CrossRef]
- Schneider, T.; O’Gorman, P.A.; Levine, X.J. Water Vapor and the Dynamics of Climate Changes. Rev. Geophys. 2010, 48, RG3001. [Google Scholar] [CrossRef]
- Wang, X.; Xiao, X.; Zou, Z.; Dong, J.; Qin, Y.; Doughty, R.B.; Menarguez, M.A.; Chen, B.; Wang, J.; Ye, H. Gainers and Losers of Surface and Terrestrial Water Resources in China During 1989–2016. Nat. Commun. 2020, 11, 3471. [Google Scholar] [CrossRef] [PubMed]
- Zhang, Y.; Shen, Y.; Wang, J.; Qi, Y. Estimation of Evaporation of Different Cover Types Using a Stable Isotope Method: Pan, Bare Soil, and Crop Fields in the North China Plain. J. Hydrol. 2022, 613, 128414. [Google Scholar] [CrossRef]
- Gao, Z.; Du, X.; Yu, H.; Liu, C.; Jian, H.; Xu, X.; Li, X.; Bian, D.; Cui, Y. Sub-Surface Plastic Mulching Reduced Evaporation During the Fallow Season and Increased Spring Maize Yield in the North China Plain. Eur. J. Agron. 2023, 143, 126708. [Google Scholar] [CrossRef]
- Zhang, Y.; Zhang, Y.; Shi, K.; Zhou, Y.; Li, N. Remote Sensing Estimation of Water Clarity for Various Lakes in China. Water Res. 2021, 192, 116844. [Google Scholar] [CrossRef]
- Huang, C.; Chen, Y.; Zhang, S.; Wu, J. Detecting, Extracting, and Monitoring Surface Water from Space Using Optical Sensors: A Review. Rev. Geophys. 2018, 56, 333–360. [Google Scholar] [CrossRef]
- Werther, M.; Burggraaff, O.; Gurlin, D.; Saranathan, A.M.; Balasubramanian, S.V.; Giardino, C.; Braga, F.; Bresciani, M.; Pellegrino, A.; Pinardi, M.; et al. On the Generalization Ability of Probabilistic Neural Networks for Hyperspectral Remote Sensing of Absorption Properties across Optically Complex Waters. Remote Sens. Environ. 2025, 328, 114820. [Google Scholar] [CrossRef]
- Xiong, S.; Zhang, X.; Lei, Y.; Tan, G.; Wang, H.; Du, S. Time-Series China Urban Land Use Mapping (2016–2022): An Approach for Achieving Spatial-Consistency and Semantic-Transition Rationality in Temporal Domain. Remote Sens. Environ. 2024, 312, 1. [Google Scholar] [CrossRef]
- Sui, Y.; Feng, M.; Wang, C.; Li, X. A high-Resolution Inland Surface Water Body Dataset for the Tundra and Boreal Forests of North America. Earth Syst. Sci. Data 2022, 14, 3349–3363. [Google Scholar] [CrossRef]
- Tellman, B.; Sullivan, J.A.; Kuhn, C.; Kettner, A.J.; Doyle, C.S.; Brakenridge, G.R.; Erickson, T.A.; Slayback, D.A. Satellite Imaging Reveals Increased Proportion of Population Exposed to Floods. Nature 2021, 596, 80–86. [Google Scholar] [CrossRef]
- Pekel, J.-F.; Cottam, A.; Gorelick, N.; Belward, A.S. High-Resolution Mapping of Global Surface Water and Its Long-Term Changes. Nature 2016, 540, 418–422. [Google Scholar] [CrossRef] [PubMed]
- Li, L.; Long, D.; Wang, Y.; Woolway, R.I. Global Dominance of Seasonality in Shaping Lake-Surface-Extent Dynamics. Nature 2025, 642, 361–368. [Google Scholar] [CrossRef] [PubMed]
- Jasechko, S.; Seybold, H.; Perrone, D.; Fan, Y.; Shamsudduha, M.; Taylor, R.G.; Fallatah, O.; Kirchner, J.W. Rapid Groundwater Decline and Some Cases of Recovery in Aquifers Globally. Nature 2024, 625, 715–721. [Google Scholar] [CrossRef]
- Zhang, C.; Duan, Q.; Yeh, P.J.F.; Pan, Y.; Gong, H.; Gong, W.; Di, Z.; Lei, X.; Liao, W.; Huang, Z. The Effectiveness of the South-to-North Water Diversion Middle Route Project on Water Delivery and Groundwater Recovery in North China Plain. Water Resour. Res. 2020, 56, e2019WR026759. [Google Scholar] [CrossRef]
- Woolway, R.I.; Kraemer, B.M.; Lenters, J.D.; Merchant, C.J.; O’Reilly, C.M.; Sharma, S. Global Lake Responses to Climate Change. Nat. Rev. Earth Environ. 2020, 1, 388–403. [Google Scholar] [CrossRef]
- Yang, G.; Li, S.; Wang, H.; Wang, L. Study on Agricultural Cultivation Development Layout Based on the Matching Characteristic of Water and Land Resources in North China Plain. Agric. Water Manag. 2022, 259, 107272. [Google Scholar] [CrossRef]
- Qin, H.; Cao, G.; Kristensen, M.; Refsgaard, J.; Rasmussen, M.; He, X.; Liu, J.; Shu, Y.; Zheng, C. Integrated Hydrological Modeling of the North China Plain and Implications for Sustainable Water Management. Hydrol. Earth Syst. Sci. 2013, 17, 3759–3778. [Google Scholar] [CrossRef]
- Wang, H.; Zhang, L.; Dawes, W.R.; Liu, C. Improving Water Use Efficiency of Irrigated Crops in the North China Plain—Measurements and Modelling. Agric. Water Manag. 2001, 48, 151–167. [Google Scholar] [CrossRef]
- Wang, E.; Yu, Q.; Wu, D.; Xia, J. Climate, Agricultural Production and Hydrological Balance in the North China Plain. Int. J. Climatol. 2008, 28, 1959–1970. [Google Scholar] [CrossRef]
- Dong, J.; Metternicht, G.; Hostert, P.; Fensholt, R.; Chowdhury, R.R. Remote Sensing and Geospatial Technologies in Support of a Normative Land System Science: Status and Prospects. Curr. Opin. Environ. Sustain. 2019, 38, 44–52. [Google Scholar] [CrossRef]
- Wulder, M.A.; White, J.C.; Loveland, T.R.; Woodcock, C.E.; Belward, A.S.; Cohen, W.B.; Fosnight, E.A.; Shaw, J.; Masek, J.G.; Roy, D.P. The Global Landsat Archive: Status, Consolidation, and Direction. Remote Sens. Environ. 2016, 185, 271–283. [Google Scholar] [CrossRef]
- Wulder, M.A.; Roy, D.P.; Radeloff, V.C.; Loveland, T.R.; Anderson, M.C.; Johnson, D.M.; Healey, S.; Zhu, Z.; Scambos, T.A.; Pahlevan, N.; et al. Fifty Years of Landsat Science and Impacts. Remote Sens. Environ. 2022, 280, 113195. [Google Scholar] [CrossRef]
- Song, C.; Fan, C.; Zhu, J.; Wang, J.; Sheng, Y.; Liu, K.; Chen, T.; Zhan, P.; Luo, S.; Yuan, C.; et al. A Comprehensive Geospatial Database of Nearly 100000 Reservoirs in China. Earth Syst. Sci. Data 2022, 14, 4017–4034. [Google Scholar] [CrossRef]
- Wang, X.; Xiao, X.; Qin, Y.; Dong, J.; Wu, J.; Li, B. Improved Maps of Surface Water Bodies, Large Dams, Reservoirs, and Lakes in China. Earth Syst. Sci. Data 2022, 14, 3757–3771. [Google Scholar] [CrossRef]
- Lehner, B.; Liermann, C.R.; Revenga, C.; Vörösmarty, C.; Fekete, B.; Crouzet, P.; Döll, P.; Endejan, M.; Frenken, K.; Magome, J. High-Resolution Mapping of the World’s Reservoirs and Dams for Sustainable River-Flow Management. Front. Ecol. Environ. 2011, 9, 494–502. [Google Scholar] [CrossRef]
- Yin, Y.; Zhang, Y.; Hu, Z.; Xu, Y.; Wang, J.; Wang, C.; Shi, T.; Wu, G. Quadrennial Series Dataset of Coastal Aquaculture Distribution of China Based on Landsat Images (1990–2022). J. Glob. Chang. Data Discov. 2023, 7, 215–224. [Google Scholar]
- Wang, Z.; Zhang, J.; Yang, X.; Huang, C.; Su, F.; Liu, X.; Liu, Y.; Zhang, Y. Global Mapping of the Landside Clustering of Aquaculture Ponds from Dense Time-Series 10 m Sentinel-2 Images on Google Earth Engine. Int. J. Appl. Earth Obs. Geoinf. 2022, 115, 103100. [Google Scholar] [CrossRef]
- Li, X.; Gong, P.; Zhou, Y.; Wang, J.; Bai, Y.; Chen, B.; Hu, T.; Xiao, Y.; Xu, B.; Yang, J.; et al. Mapping Global Urban Boundaries from the Global Artificial Impervious Area (GAIA) Data. Environ. Res. Lett. 2020, 15, 094044. [Google Scholar] [CrossRef]
- Zhao, G.; Li, Y.; Zhou, L.; Gao, H. Evaporative Water Loss of 1.42 Million Global Lakes. Nat. Commun. 2022, 13, 3686. [Google Scholar] [CrossRef]
- Messager, M.L.; Lehner, B.; Grill, G.; Nedeva, I.; Schmitt, O. Estimating the Volume and Age of Water Stored in Global Lakes Using a Geo-Statistical Approach. Nat. Commun. 2016, 7, 13603. [Google Scholar] [CrossRef]
- Zhao, G.; Gao, H. Estimating Reservoir Evaporation Losses for the United States: Fusing Remote Sensing and Modeling Approaches. Remote Sens. Environ. 2019, 226, 109–124. [Google Scholar] [CrossRef]
- Gan, R.; Zhang, Y.; Shi, H.; Yang, Y.; Eamus, D.; Cheng, L.; Chiew, F.H.; Yu, Q. Use of Satellite Leaf Area Index Estimating Evapotranspiration and Gross Assimilation for Australian Ecosystems. Ecohydrology 2018, 11, e1974. [Google Scholar] [CrossRef]
- Zhou, Y.; Liu, B.; Cui, Y.; Wang, X.; Cao, M.; Zhang, S.; Xiao, X.; Dong, J. Annual Improved Maps to Understand the Complete Evolution of 9 Thousand Lakes on the Tibetan Plateau in 1991–2023. ISPRS J. Photogramm. Remote Sens. 2024, 217, 134–148. [Google Scholar] [CrossRef]
- Zou, Z.; Xiao, X.; Dong, J.; Qin, Y.; Doughty, R.B.; Menarguez, M.A.; Zhang, G.; Wang, J. Divergent Trends of Open-Surface Water Body Area in the Contiguous United States from 1984 to 2016. Proc. Natl. Acad. Sci.USA 2018, 115, 3810–3815. [Google Scholar] [CrossRef]
- Liu, B.; Zhou, Y.; Cui, Y.; Dong, J.; Wang, X.; Zhang, Q.; Zou, Z.; Xiao, X. Exacerbating Water Shortage Induced by Continuous Expansion of Surface Artificial Water Bodies in the Yellow River Basin. J. Hydrol. 2024, 633, 130979. [Google Scholar] [CrossRef]
- Liang, H.; Zhou, Y.; Cui, Y.; Dong, J.; Gao, Z.; Liu, B.; Xiao, X. Is Satellite-Observed Surface Water Expansion a Good Signal to China’s Largest Granary? Agric. Water Manag. 2024, 303, 109039. [Google Scholar] [CrossRef]
- Jones, F.E. Evaporation of Water with Emphasis on Applications and Measurements; CRC Press: Boca Raton, FL, USA, 2018. [Google Scholar]
- Zhan, S.; Song, C.; Wang, J.; Sheng, Y.; Quan, J. A global Assessment of Terrestrial Evapotranspiration Increase Due to Surface Water Area Change. Earth’s Future 2019, 7, 266–282. [Google Scholar] [CrossRef]
- Monteith, J.L. Evaporation and Environment. Symp. Soc. Exp. Biol. 1965, 19, 205–234. [Google Scholar]
- Skrzypek, G.; Mydłowski, A.; Dogramaci, S.; Hedley, P.; Gibson, J.J.; Grierson, P.F. Estimation of Evaporative Loss Based on the Stable Isotope Composition of Water Using Hydrocalculator. J. Hydrol. 2015, 523, 781–789. [Google Scholar] [CrossRef]
- Song, C.; Ke, L.; Pan, H.; Zhan, S.; Liu, K.; Ma, R. Long-Term Surface Water Changes and Driving Cause in Xiong’an, China: From Dense Landsat Time Series Images and Synthetic Analysis. Sci. Bull. 2018, 63, 708–716. [Google Scholar] [CrossRef]
- Gao, Z.; Zhou, Y.; Cui, Y.; Dong, J.; Wang, X.; Zhao, G.; Zou, Z.; Xiao, X. Rebound of Surface and Terrestrial Water Resources in Mongolian Plateau Following Sustained Depletion. Ecol. Indic. 2023, 156, 111193. [Google Scholar] [CrossRef]
- Nevermann, H.; Aminzadeh, M.; Madani, K.; Shokri, N. Quantifying Water Evaporation from Large Reservoirs: Implications for Water Management in Water-Stressed Regions. Environ. Res. 2024, 262, 119860. [Google Scholar] [CrossRef]
- Gao, H.; Ryan, M.C.; Li, C.; Sun, B. Understanding the Role of Groundwater in a Remote Transboundary Lake (Hulun Lake, China). Water 2017, 9, 363. [Google Scholar] [CrossRef]
- Ren, C.; Wang, Z.; Zhang, Y.; Zhang, B.; Chen, L.; Xi, Y.; Xiao, X.; Doughty, R.B.; Liu, M.; Jia, M. Rapid Expansion of Coastal Aquaculture Ponds in China from Landsat Observations During 1984–2016. Int. J. Appl. Earth Obs. Geoinf. 2019, 82, 101902. [Google Scholar] [CrossRef]
- Boyd, C.E. Aquaculture pond fertilization. CABI Rev. 2018, 13, 1–12. [Google Scholar] [CrossRef]
- Yang, H.; Hu, Y.; Li, J.; Wang, H.; Liu, Z.; Li, G. Investigation of Push-Flow Aeration on Improving Water Quality in Urban Lakes. Environ. Technol. Innov. 2023, 32, 103247. [Google Scholar] [CrossRef]
- Scanlon, B.R.; Fakhreddine, S.; Rateb, A.; de Graaf, I.; Famiglietti, J.; Gleeson, T.; Grafton, R.Q.; Jobbagy, E.; Kebede, S.; Kolusu, S.R. Global Water Resources and the Role of Groundwater in a Resilient Water Future. Nat. Rev. Earth Environ. 2023, 4, 87–101. [Google Scholar] [CrossRef]
- Yang, D.; Yang, Y.; Xia, J. Hydrological Cycle and Water Resources in a Changing World: A Review. Geogr. Sustain. 2021, 2, 115–122. [Google Scholar] [CrossRef]
- Aeschbach-Hertig, W.; Gleeson, T. Regional Strategies for the Accelerating Global Problem of Groundwater Depletion. Nat. Geosci. 2012, 5, 853–861. [Google Scholar] [CrossRef]
- Wang, L.; Chen, C.; Du, J.; Wang, T. Detecting Seasonal and Long-Term Vertical Displacement in the North China Plain Using GRACE and GPS. Hydrol. Earth Syst. Sci. 2017, 21, 2905–2922. [Google Scholar] [CrossRef]
- Xu, Y.; Gong, H.; Chen, B.; Zhang, Q.; Li, Z. Long-Term and Seasonal Variation in Groundwater Storage in the North China Plain Based on GRACE. Int. J. Appl. Earth Obs. Geoinf. 2021, 104, 102560. [Google Scholar] [CrossRef]
- Wang, F.; Wang, Z.; Yang, H.; Di, D.; Zhao, Y.; Liang, Q. Utilizing Grace-Based Groundwater Drought Index for Drought Characterization and Teleconnection Factors Analysis in the North China Plain. J. Hydrol. 2020, 585, 124849. [Google Scholar] [CrossRef]
- Zhang, G.; Yao, T.; Chen, W.; Zheng, G.; Shum, C.; Yang, K.; Piao, S.; Sheng, Y.; Yi, S.; Li, J. Regional Differences of Lake Evolution across China During 1960s–2015 and Its Natural and Anthropogenic Causes. Remote Sens. Environ. 2019, 221, 386–404. [Google Scholar] [CrossRef]
- You, N.; Dong, J. Examining Earliest Identifiable Timing of Crops Using All Available Sentinel 1/2 Imagery and Google Earth Engine. ISPRS J. Photogramm. Remote Sens. 2020, 161, 109–123. [Google Scholar] [CrossRef]
- Mao, D.; Wang, Z.; Du, B.; Li, L.; Tian, Y.; Jia, M.; Zeng, Y.; Song, K.; Jiang, M.; Wang, Y. National Wetland Mapping in China: A New Product Resulting from Object-Based and Hierarchical Classification of Landsat 8 Oli images. ISPRS J. Photogramm. Remote Sens. 2020, 164, 11–25. [Google Scholar] [CrossRef]
- Wang, M.; Mao, D.; Xiao, X.; Song, K.; Jia, M.; Ren, C.; Wang, Z. Interannual Changes of Coastal Aquaculture Ponds in China at 10-M Spatial Resolution During 2016–2021. Remote Sens. Environ. 2023, 284, 113347. [Google Scholar] [CrossRef]
- Liu, J.; Jiang, L.; Zhang, X.; Druce, D.; Kittel, C.M.M.; Tøttrup, C.; Bauer-Gottwein, P. Impacts of Water Resources Management on Land Water Storage in the North China Plain: Insights from Multi-Mission Earth Observations. J. Hydrol. 2021, 603, 126933. [Google Scholar] [CrossRef]
Disclaimer/Publisher’s Note: The statements, opinions and data contained in all publications are solely those of the individual author(s) and contributor(s) and not of MDPI and/or the editor(s). MDPI and/or the editor(s) disclaim responsibility for any injury to people or property resulting from any ideas, methods, instructions or products referred to in the content. |
© 2025 by the authors. Licensee MDPI, Basel, Switzerland. This article is an open access article distributed under the terms and conditions of the Creative Commons Attribution (CC BY) license (https://creativecommons.org/licenses/by/4.0/).