Article

Panoptic Plant Recognition in 3D Point Clouds: A Dual-Representation Learning Approach with the PP3D Dataset

1
Key Laboratory of Degraded and Unused Land Consolidation Engineering, Ministry of Natural Resources, Xi’an 710075, China
2
Jiangsu Center for Collaborative Innovation in Geographical Information Resource Development and Application, Nanjing 210023, China
3
State Key Laboratory of Climate System Prediction and Risk Management, Nanjing Normal University, Nanjing 210023, China
4
Technology Innovation Center for Integrated Applications in Remote Sensing and Navigation, Ministry of Natural Resources, Nanjing 210044, China
*
Author to whom correspondence should be addressed.
Remote Sens. 2025, 17(15), 2673; https://doi.org/10.3390/rs17152673 (registering DOI)
Submission received: 3 June 2025 / Revised: 24 July 2025 / Accepted: 31 July 2025 / Published: 2 August 2025

Abstract

The advancement of Artificial Intelligence (AI) has significantly accelerated progress across various research domains, with growing interest in plant science due to its substantial economic potential. However, the integration of AI with digital vegetation analysis remains underexplored, largely due to the absence of large-scale, real-world plant datasets, which are crucial for advancing this field. To address this gap, we introduce the PP3D dataset—a meticulously labeled collection of about 500 potted plants represented as 3D point clouds, featuring fine-grained annotations for approximately 20 species. The PP3D dataset provides 3D phenotypic data for about 20 plant species spanning model organisms (e.g., Arabidopsis thaliana), potted plants (e.g., Foliage plants, Flowering plants), and horticultural plants (e.g., Solanum lycopersicum), covering most of the common important plant species. Leveraging this dataset, we propose the panoptic plant recognition task, which combines semantic segmentation (stems and leaves) with leaf instance segmentation. To tackle this challenge, we present SCNet, a novel dual-representation learning network designed specifically for plant point cloud segmentation. SCNet integrates two key branches: a cylindrical feature extraction branch for robust spatial encoding and a sequential slice feature extraction branch for detailed structural analysis. By efficiently propagating features between these representations, SCNet achieves superior flexibility and computational efficiency, establishing a new baseline for panoptic plant recognition and paving the way for future AI-driven research in plant science.

1. Introduction

Three-dimensional (3D) plant phenotyping, a cornerstone of precision agriculture and smart farming [1], faces a critical challenge: the scarcity of high-quality, specialized datasets. Current phenotypic traits encode substantial geometric and semantic information, enabling high-fidelity plant reconstruction. However, conventional analysis methods remain confined to small-scale, destructive manual measurements [2]. Given the rapidly growing demand for high-throughput phenotyping [3], the development of standardized datasets and associated algorithms has emerged as an urgent priority for the field.
Despite recent advances in plant-phenotyping point cloud datasets (e.g., Soybean-MVS, PlanesT-3D, and Pheno4D), three fundamental challenges remain unresolved: (1) the intricate morphological architecture of plant organs [4], (2) the technical hurdles of data collection in dynamic growth conditions, and (3) the inadequate compatibility of conventional 3D processing approaches with plant biological properties [5,6,7]. These limitations severely constrain both the scope and precision of current datasets for deep learning applications in phenotyping [8]. In response, we introduce PP3D, a groundbreaking 3D point cloud benchmark specifically developed for plant phenotyping research, featuring three key advancements—(1) hybrid data acquisition: combining adaptive multi-view imaging with advanced stereo reconstruction techniques to produce high-resolution point clouds with preserved morphological fidelity; (2) comprehensive organ annotation: implementing rigorous annotation protocols to deliver precise semantic and instance segmentation at the stem and leaf level; (3) ecological diversity: encompassing approximately 20 agriculturally significant species with nearly 500 temporally tracked specimens.
To fully leverage the dataset’s potential, we developed the SCNet benchmark framework with two novel architectural innovations: (1) a cylindrical feature extraction module that effectively encodes global plant architecture; (2) a sequential slice analysis module that maintains fine-scale morphological details. Our experimental results show that SCNet outperforms existing state-of-the-art methods by more than 10% in accuracy metrics. The key contributions of this work are threefold: First, we introduce the PP3D dataset, a novel resource that significantly advances plant phenotypic parameter extraction and supports the development of smart agriculture technologies. Second, we formulate the panoptic plant recognition task, unifying both semantic (stem/leaf classification) and instance-level (individual leaf identification) segmentation into a comprehensive framework. Third, we propose an innovative baseline method employing a flexible dual-representation approach that establishes new state-of-the-art performance on the PP3D dataset.
The remainder of this paper is organized as follows: Following this introduction, Section 2 provides a comprehensive review of related work in plant dataset and 3D point cloud analysis. Section 3 provides a comprehensive description of the dataset construction (see Figure 1) and its accompanying benchmark algorithms. Section 4 presents extensive experimental results, including benchmark comparisons, ablation studies, and real-world application scenarios. Finally, Section 5 concludes the paper with a summary of key contributions and discussions of future research directions.

2. Related Work

Recent advances in high-resolution plant point cloud datasets have greatly advanced the development of plant phenotyping algorithms. However, panoramic recognition—a crucial component of phenotyping analysis—still faces notable limitations. This section provides a focused review of existing plant point cloud datasets and state-of-the-art panoramic recognition techniques.

2.1. Three-Dimensional Plant Datasets

Current 3D segmentation datasets predominantly concentrate on common objects and scenes across various domains. In autonomous driving scenarios, benchmark datasets like SemanticKITTI [9], Panoptic nuScenes [10], and SemanticSTF [11] provide comprehensive annotations for typical transportation environment elements, including road surfaces, sidewalks, vehicles, and terrain features. The SensatUrban [12] dataset significantly advances urban scene understanding by offering detailed semantic labels for complex street environments. For indoor scene analysis, datasets such as S3DIS [13], ScanNet [14], and PartNet [15] facilitate fine-grained object recognition through their meticulous annotations of household items like tables, chairs, and cups. These diverse datasets have catalyzed significant progress in panorama segmentation, particularly in fine-grained scene understanding, establishing it as an increasingly prominent research direction.
The automatic acquisition of plant phenotypic information through high-precision 3D plant modeling has emerged as a significant research focus in recent years [16]. The accuracy of plant organ segmentation plays a pivotal role in determining both the quantification of plant structural characteristics and the reliability of phenotypic analysis. Deep learning-based approaches for plant point cloud segmentation have become the predominant methodology in this field [17,18]. However, the lack of comprehensive and high-quality datasets currently hinders further advancements in this research direction. To systematically evaluate the available resources, we conducted a comparative analysis of five existing plant point cloud datasets, as summarized in Table 1.
Soybean-MVS [19] is a comprehensive 3D point cloud dataset capturing soybean plants throughout their complete growth cycle for organ-level segmentation tasks. The dataset was constructed using multi-view stereo (MVS) reconstruction techniques, providing high-fidelity point clouds of 102 soybean samples spanning five distinct varieties across 13 developmental stages. Each sample is meticulously annotated with three key organ categories: leaf, main stem, and branch stem, enabling fine-grained structural analysis and phenotypic studies.
PlanesT-3D [20] is a high-quality 3D plant point cloud dataset comprising 34 samples across three species: 10 pepper plants, 10 rose-bush plants, and 14 ribes plants. Each sample consists of a complete, colorized 3D point cloud reconstructed using MVS techniques. The dataset provides detailed semantic annotations for two key organ categories: stem and leaf, with the latter further segmented at the instance level to enable fine-grained plant structure analysis.
Pheno4D [21] is a high-resolution, multi-temporal plant point cloud dataset acquired through high-precision 3D laser scanning, achieving sub-millimeter accuracy. The dataset features maize and tomato plants captured throughout their growth cycles. Each point cloud is manually annotated with three semantic categories: soil, stem, and leaf, where leaves are further segmented at the instance level (i.e., each individual leaf is delineated as a distinct object). This fine-grained annotation enables detailed morphological and phenotypic analysis of plant development over time.
ROSE-X [22] is a high-resolution 3D point cloud dataset comprising 11 rosebush specimens acquired through X-ray computed tomography (CT) scanning, enabling non-destructive structural analysis. The dataset achieves exceptional spatial resolution, with 0.5 mm inter-leaf spacing and 1 mm pixel spacing, capturing intricate plant architectures with high fidelity. Each sample is annotated with four semantic classes: leaf, stem, flower, and pot, providing comprehensive ground truth for plant organ segmentation tasks. The X-ray acquisition methodology particularly facilitates the study of internal plant structures while preserving specimen integrity.
Plant3D [23] represents a comprehensive 3D plant architecture dataset encompassing 505 high-resolution scans acquired through precision 3D laser scanning. The dataset systematically captures three agriculturally significant species—tomato, tobacco, and sorghum—under 35 controlled environmental conditions (including light variations, thermal stress, and drought) across 20 developmental time points. This multidimensional design enables the robust investigation of genotype-by-environment interactions and temporal growth patterns. Each scan provides detailed structural information, making the dataset particularly valuable for studies in plant phenomics, stress response analysis, and developmental biology.
While existing plant point cloud datasets (e.g., Pheno4D, Plant3D) capture multi-temporal growth phases, they remain limited in scale, diversity, and practical applicability due to constrained environmental conditions and temporal coverage. To address these limitations, this paper introduces PP3D, a novel large-scale dataset featuring the following: (1) high-precision 3D reconstructions of diverse crop species; (2) comprehensive growth-stage coverage under real agricultural conditions; (3) annotated structural phenotypes tailored for precision farming applications. This work aims to provide robust data infrastructure for advancing smart agriculture technologies, including automated growth monitoring, yield prediction, and resource optimization systems.

2.2. Three-Dimensional Panoptic Segmentation

Panoptic segmentation has emerged as a unified approach to scene understanding that combines semantic segmentation (class-level classification) and instance segmentation (object distinction) into a single framework. For LiDAR point cloud analysis, this task involves simultaneously classifying each point into semantic categories while assigning unique instance identifiers, thereby providing comprehensive 3D scene interpretation. The development of benchmark datasets such as Panoptic nuScenes [10] and the extended SemanticKITTI [24] has significantly advanced research in this domain, leading to two predominant methodological paradigms: detection-based approaches that first identify object instances before classification, and grouping-based methods that cluster points before assigning semantic and instance labels.
Detection-based panoptic segmentation methods typically follow a two-stage approach: first generating foreground object proposals, then refining and merging them with background semantic segmentation results. For instance, EfficientLPS [25] employs point similarity metrics to model geometric transformations between points and images, while augmenting Mask R-CNN with a semantic head to produce panoptic segmentation outputs. Building on this framework, Panoptic-TrackNet [26] extends EfficientPS [27] by incorporating a tracking head, thereby unifying panoptic segmentation with object tracking in a multi-task learning paradigm. While these approaches demonstrate promising results, their overall effectiveness remains fundamentally constrained by the performance of the underlying object detection component.
Grouping-based panoptic segmentation methods typically follow a two-stage approach, first predicting point-wise semantic labels, then applying clustering algorithms to generate instance predictions [28,29,30]. For instance, Panoptic-PolarNet [31] transforms the problem by projecting point cloud features into a polar Bird’s Eye View (BEV) representation, where instance segmentation is achieved through centroid regression. Building on this BEV paradigm, Panoptic-PHNet [32] further improves clustering efficiency by introducing pseudo-heatmaps and a dedicated centroid grouping module. Another notable approach, DSNet [33], enhances the clustering process through its innovative Dynamic Shifting module, which adaptively adjusts point features for more accurate instance segmentation. These methods demonstrate how geometric transformations and adaptive feature learning can effectively address the instance grouping challenge in 3D point clouds.
Recent advances in agricultural point cloud analysis have developed innovative approaches for extracting phenotypic information from plant structures. Several notable methods have emerged to address the challenges of plant organ segmentation: PlantNet [18] introduced a dual-function network architecture capable of simultaneous semantic and instance segmentation for both dicotyledonous and monocotyledonous plants in the Plant3D dataset. PST [7] leveraged transformer architectures to achieve high-resolution semantic segmentation of rapeseed plants from handheld laser scanning (HLS) data. PSeg-Net [34] advanced the field through its novel double-neighborhood feature extraction and double-granularity feature fusion mechanisms, enabling joint semantic and leaf instance segmentation for multiple plant species.
Alternative approaches have focused on reducing annotation requirements while maintaining accuracy. Eff-3DPSeg [35] demonstrated that weakly supervised learning can achieve comparable performance to fully supervised methods for plant shoot segmentation across both soybean and Pheno4D datasets. Complementing these data-driven methods [36], proposed a graph-based framework that incorporates botanical structural constraints to enable rapid and accurate organ-level segmentation while preserving plant architecture integrity. These diverse methodologies collectively address key challenges in plant phenotyping, ranging from handling complex plant architectures to reducing dependency on labeled data, while consistently validating their approaches on established benchmark datasets.
While numerous methods have been developed for plant phenotyping using point cloud data, current approaches face two fundamental limitations that constrain their practical application: (1) the restricted scale and diversity of existing plant datasets, and (2) the inability of current models to achieve sufficiently fine-grained phenotypic analysis. These constraints highlight the critical need for developing more robust plant phenotyping frameworks specifically designed to meet the requirements of precision agriculture and smart farming systems. Future research should prioritize creating comprehensive datasets and advanced analytical models capable of supporting detailed, large-scale phenotypic characterization that can directly inform agricultural decision-making and automated management practices.

3. Materials and Methods

To address the growing demand for 3D plant segmentation amid limited available datasets, we introduce PP3D—a densely annotated point cloud dataset—along with an efficient segmentation method.

3.1. The PP3D Dataset

PP3D is a large-scale, publicly available dataset designed for panoramic plant identification using 3D point clouds. The dataset comprises photogrammetric point clouds reconstructed from approximately 2 million high-resolution images spanning 20 plant species and about 500 individual potted plants. Using advanced 3D reconstruction techniques, we generated dense, structurally accurate point clouds from these images, enabling detailed plant organ analysis. All point clouds in PP3D are annotated with dual-level labels: semantic segmentation (distinguishing stems and leaves) and instance segmentation (identifying individual organs). The data were collected throughout 2023 across multiple locations in Eastern China, capturing seasonal growth variations and environmental diversity. With its unprecedented scale, multimodal 3D representations, and fine-grained annotations, PP3D serves as a foundational resource for applications in plant phenotyping, agricultural robotics, and 3D computer vision. The PP3D dataset comprises thousands of high-precision 3D models of potted plants across multiple species. This section provides a comprehensive overview of the dataset construction pipeline, detailing each critical stage from initial data acquisition to final dataset preparation.

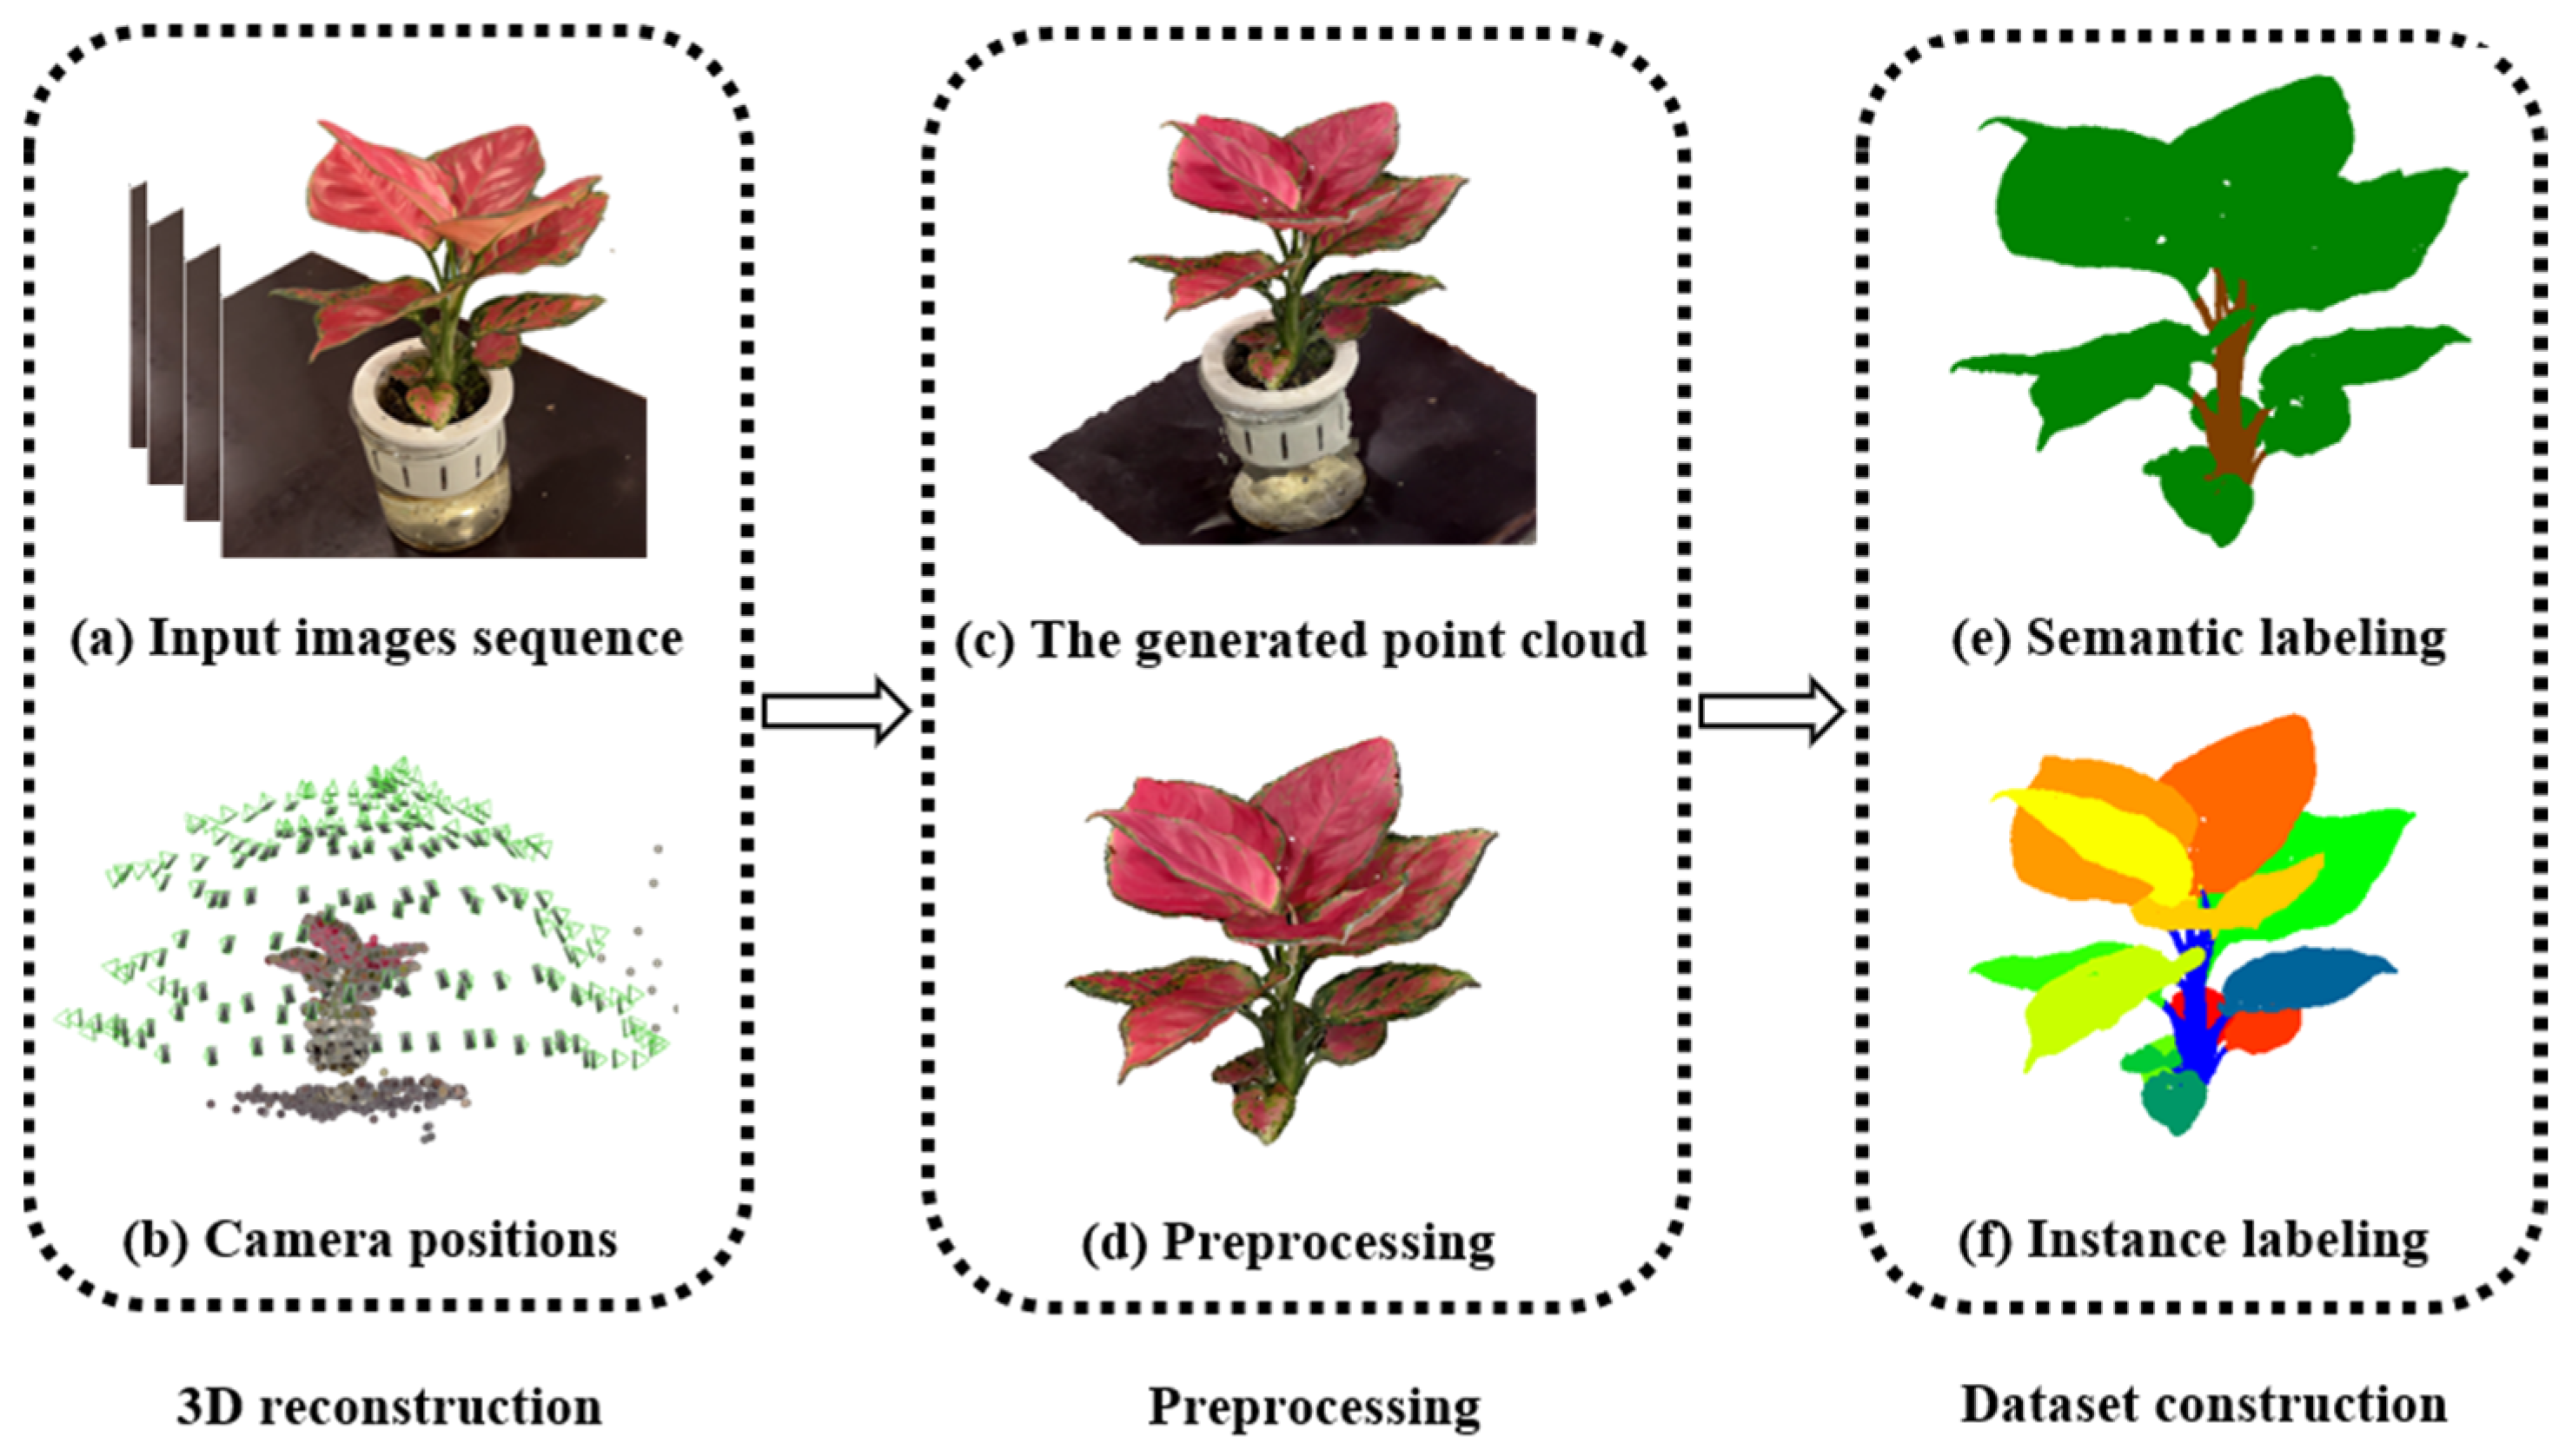
3.1.1. Images Acquisition

The development of the PP3D dataset commenced with RGB image acquisition of representative potted plant species from Eastern China, including but not limited to jade plants (Crassula ovata), money trees (Pachira aquatica), mint (Mentha spp.), and kalanchoe. During preliminary data collection, we faced several technical challenges. Initial image sets showed inadequate overlap because of inconsistent camera paths and poorly planned shooting angles. Compounding these issues, variable lighting conditions produced problematic glare and shadow artifacts that degraded image quality and consequently affected 3D reconstruction accuracy. To overcome these limitations, we implemented a standardized imaging protocol and refined our environmental controls.
We captured all images using smartphone cameras with high-resolution sensors. Our standardized imaging protocol used 4K UHD resolution (3840 × 2160 pixels) at 30 frames per second to precisely document plant morphological features. All images were saved in standard RGB format (red, green, blue channels) to ensure reliable color-based analysis. To improve dataset generalization, we systematically varied both environmental conditions and lighting parameters during image collection. For optimal 3D point cloud reconstruction quality, we created a specialized multi-ring scanning protocol. Each potted plant was systematically imaged using our tiered capture system, which employs carefully calibrated camera paths and viewing angles to fully document all plant structures—from stems and leaves to the entire canopy. Specifically, our imaging protocol followed three concentric circular paths: lower foliage, mid-canopy, and upper crown regions. Between consecutive shots in each zone, we consistently maintained 70–80% image overlap—ensuring robust feature matching for downstream 3D reconstruction. Our multi-level imaging protocol typically captures about 250 photos per plant, with extra coverage dedicated to the upper canopy. The three-ring scanning pattern minimizes leaf overlap issues, producing comprehensive 3D models of every leaf surface in the crown area.

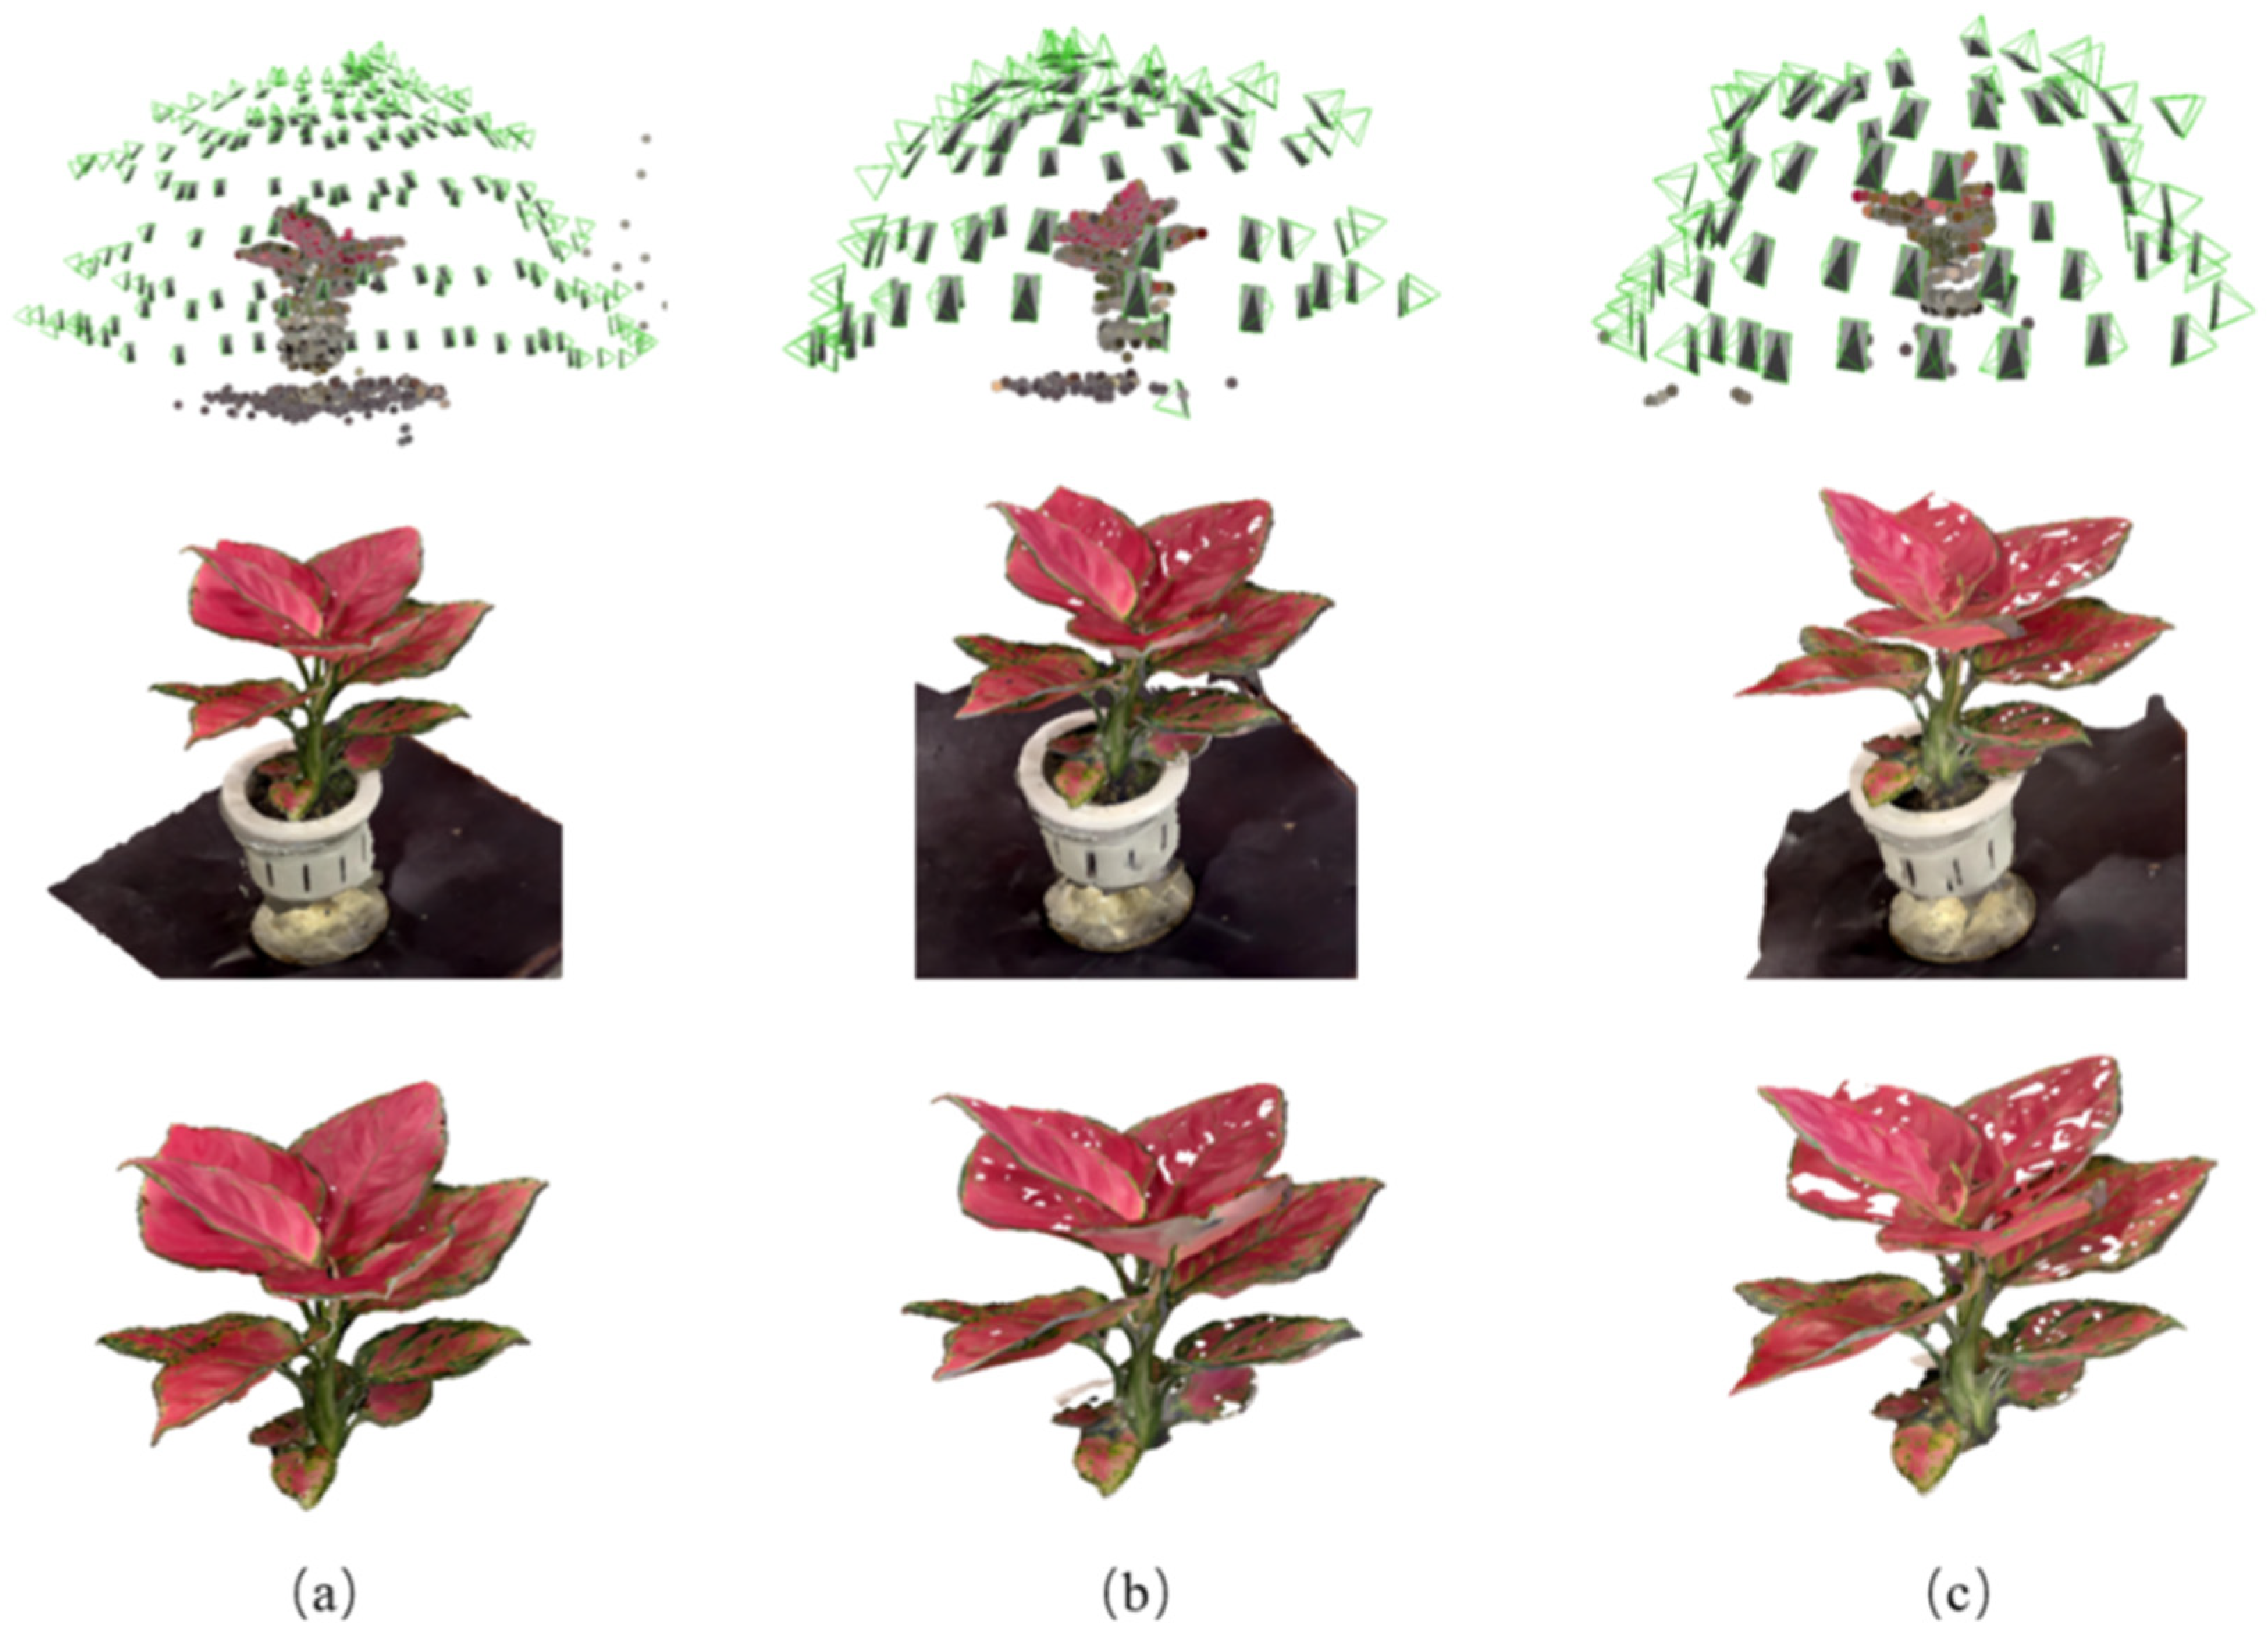
3.1.2. Three-Dimensional Point Cloud Reconstruction

To ensure high-quality 3D point cloud reconstruction, we implemented a comprehensive preprocessing pipeline for the original plant images. The preprocessing consisted of four key steps: First, we conducted rigorous quality control by eliminating images affected by human-induced blurring, insufficient overlap, or other quality issues. This initial screening ensured only optimal images were retained for subsequent processing. Second, we applied fundamental image enhancement techniques, including noise reduction and lens distortion correction, to improve the overall image quality. Since most plant images were captured in indoor environments without GPS metadata, we established a unified coordinate system to reconstruct the relative positional relationships between camera stations. This approach enabled the accurate restoration of shooting positions and the effective integration of images from multiple viewing angles. Finally, to minimize interference during point cloud reconstruction, we performed precise foreground segmentation. This process selectively preserved the relevant elements (the plant, pot, and placement surface) while removing extraneous background clutter, thereby focusing the reconstruction on the essential botanical features. These preprocessing steps collectively enhanced the accuracy and reliability of our subsequent 3D reconstruction workflow.
Leveraging high-resolution, multi-angle plant images, we performed 3D point cloud reconstruction through feature matching and multi-view geometry analysis. Our methodology employed two complementary approaches: a direct sparse reconstruction method that rapidly generated raw point clouds but with limited detail in foliar structures, and a more computationally intensive high-fidelity pipeline that first created detailed 3D mesh models before converting them to dense, accurate point clouds. While the former provided efficient preliminary reconstructions, the latter delivered superior results with complete botanical features. This dual-method approach enabled us to successfully generate approximately 500 plant point clouds with varying levels of detail suitable for different analytical purposes.
Our study on 3D plant point cloud reconstruction revealed a significant dependence of reconstruction quality on the number of input photographs. To systematically investigate this relationship, we conducted a controlled experiment using a reference dataset of 250 uniformly captured plant images under consistent lighting conditions. Through randomized sampling from this dataset, we evaluated three representative sample sizes: 200 (Figure 2a), 100 (Figure 2b), and 75 (Figure 2c) images. The results demonstrate a clear quality trend: with 200 images, we achieved optimal reconstruction with complete plant morphology; reducing samples to 100 introduced visible artifacts including leaf surface holes; further reduction to 75 images exacerbated these issues, causing both significant scene distortion (particularly in the supporting table structure) and substantial increase in surface discontinuities. These observations suggest that reconstruction quality follows a logarithmic decay curve with respect to sample size reduction, providing important practical guidance for balancing data acquisition effort with reconstruction fidelity in plant phenotyping applications.
For standard plant specimens similar to the reference sample shown, we collected 300 photographs per subject—exceeding the empirically determined optimal count of 250 images—to ensure robust reconstruction quality. This 20% buffer accounts for potential image quality variations during processing. To maintain dataset complexity, we additionally included a subset of structurally complex specimens requiring customized sampling strategies. For these challenging cases, we implemented adaptive image acquisition protocols where the sample size was dynamically adjusted based on the real-time assessment of morphological complexity, typically ranging between 300 and 400 photographs depending on foliage density and structural intricacy.

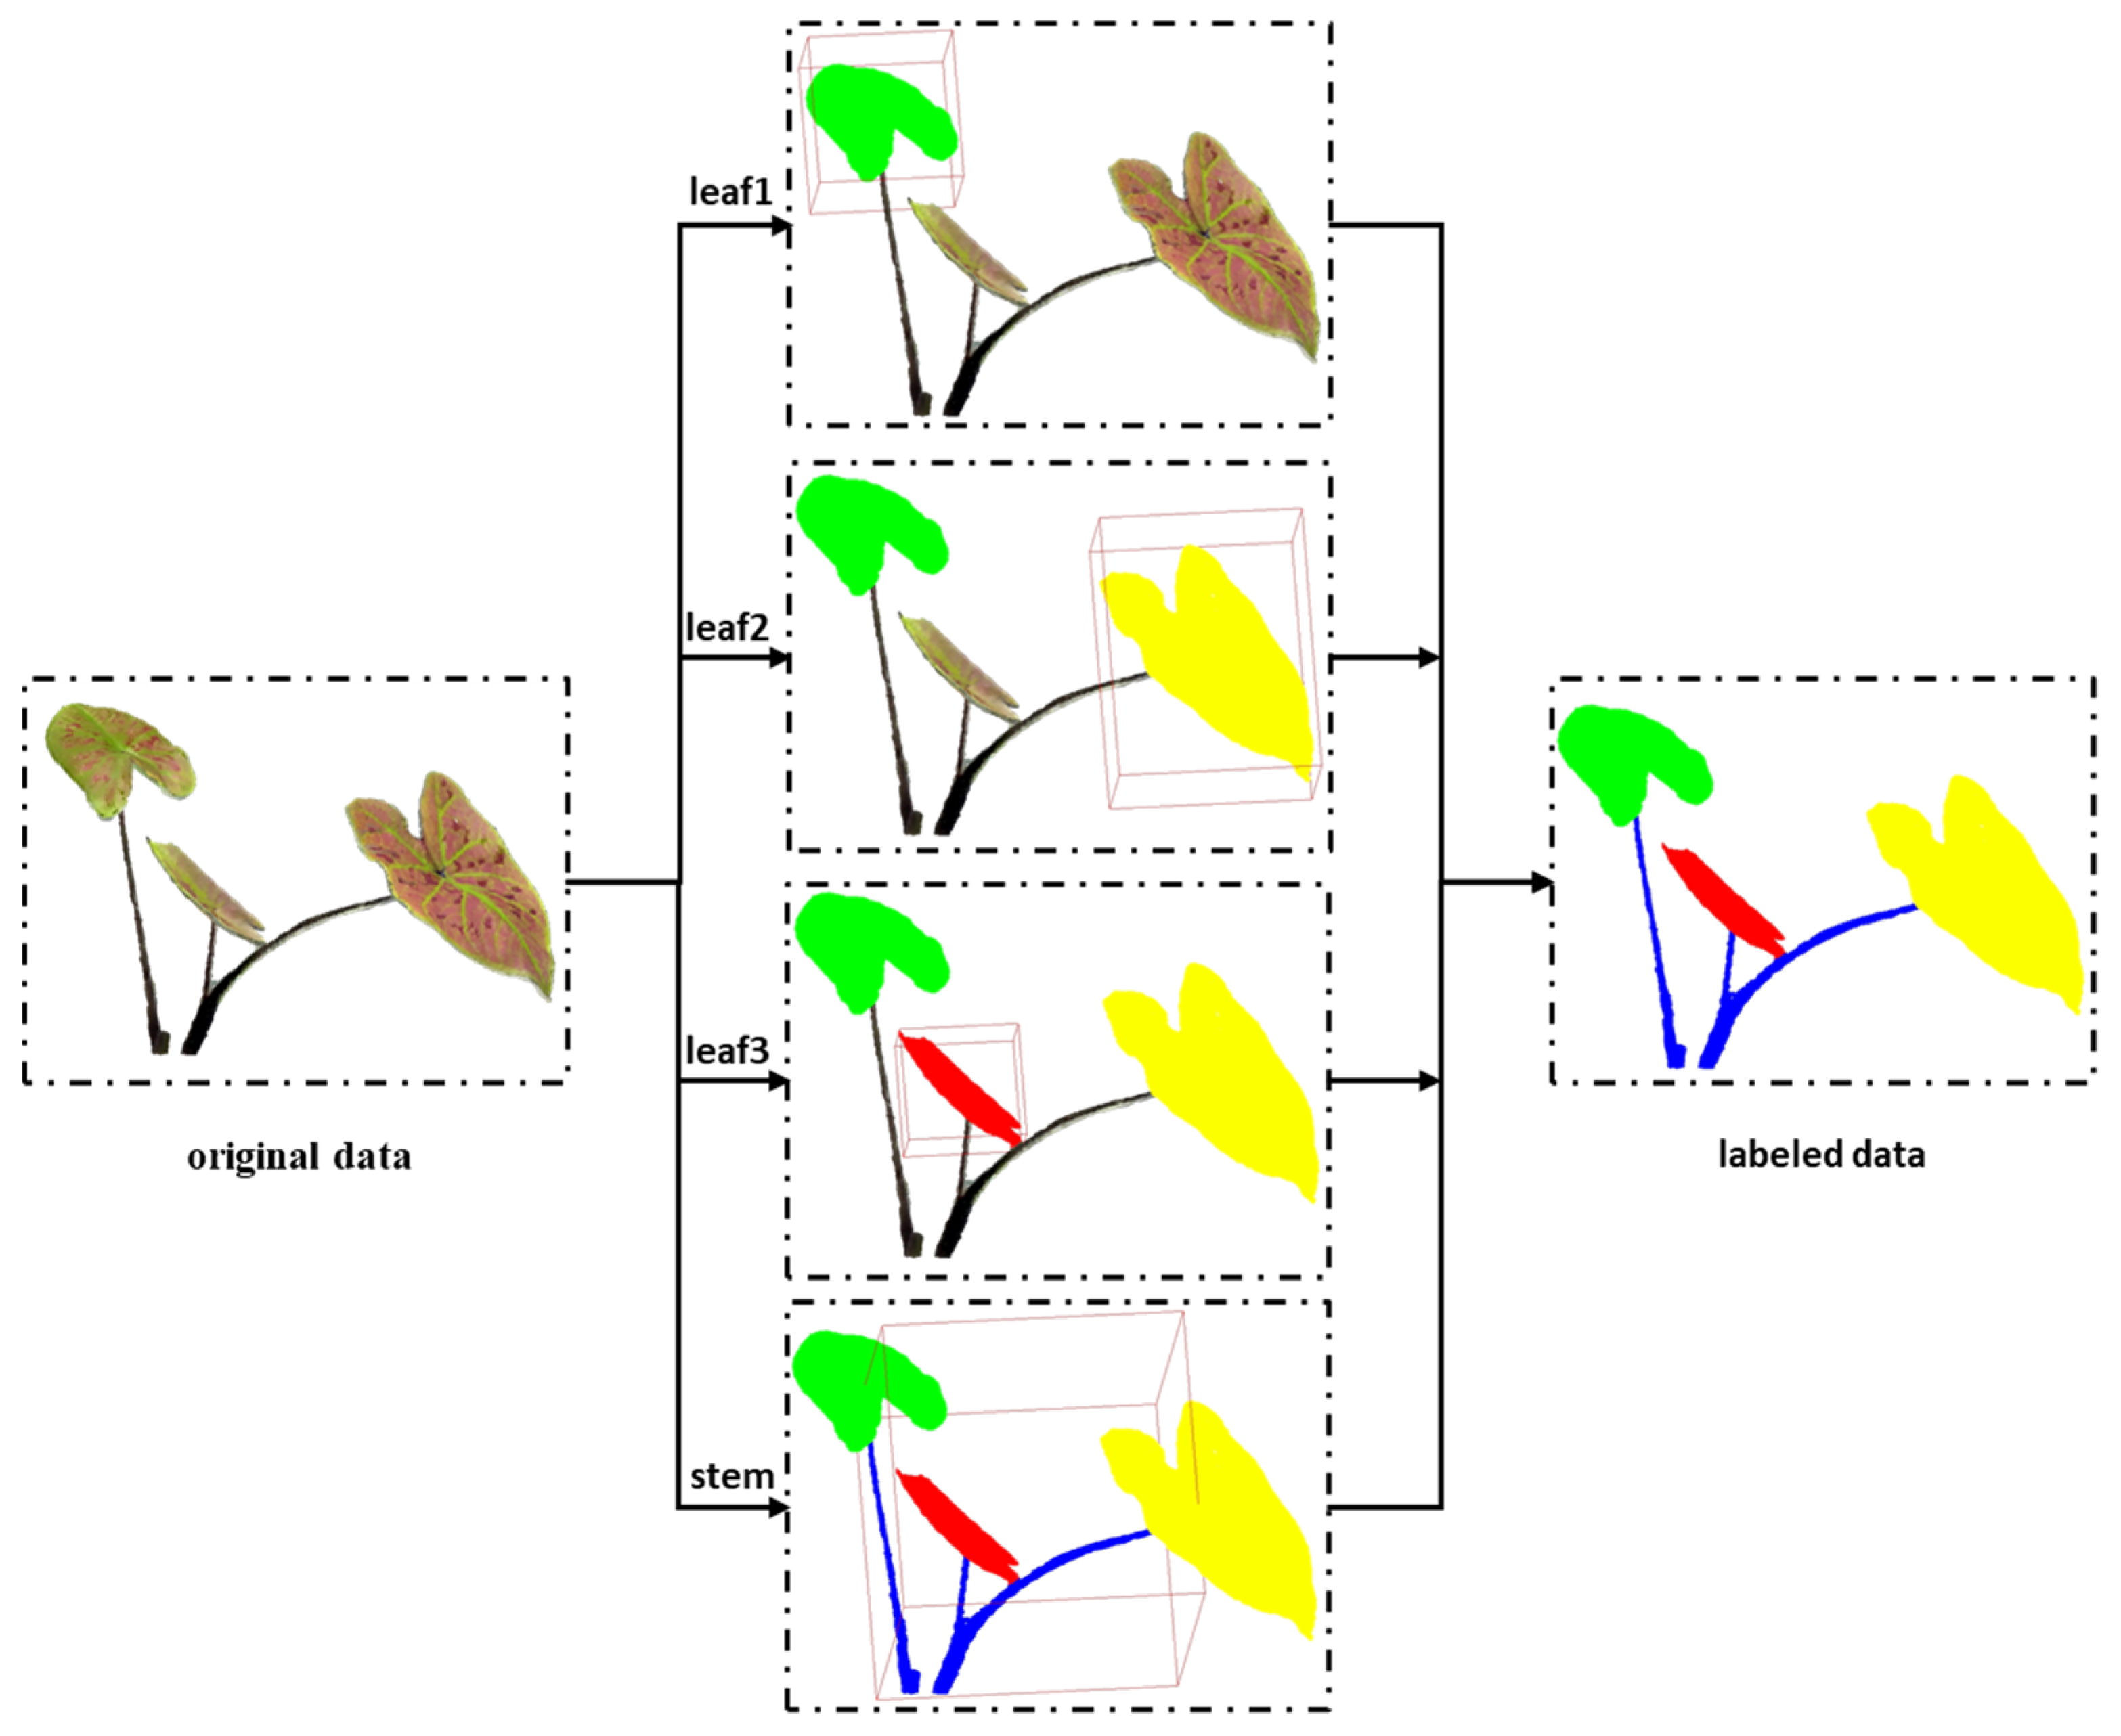
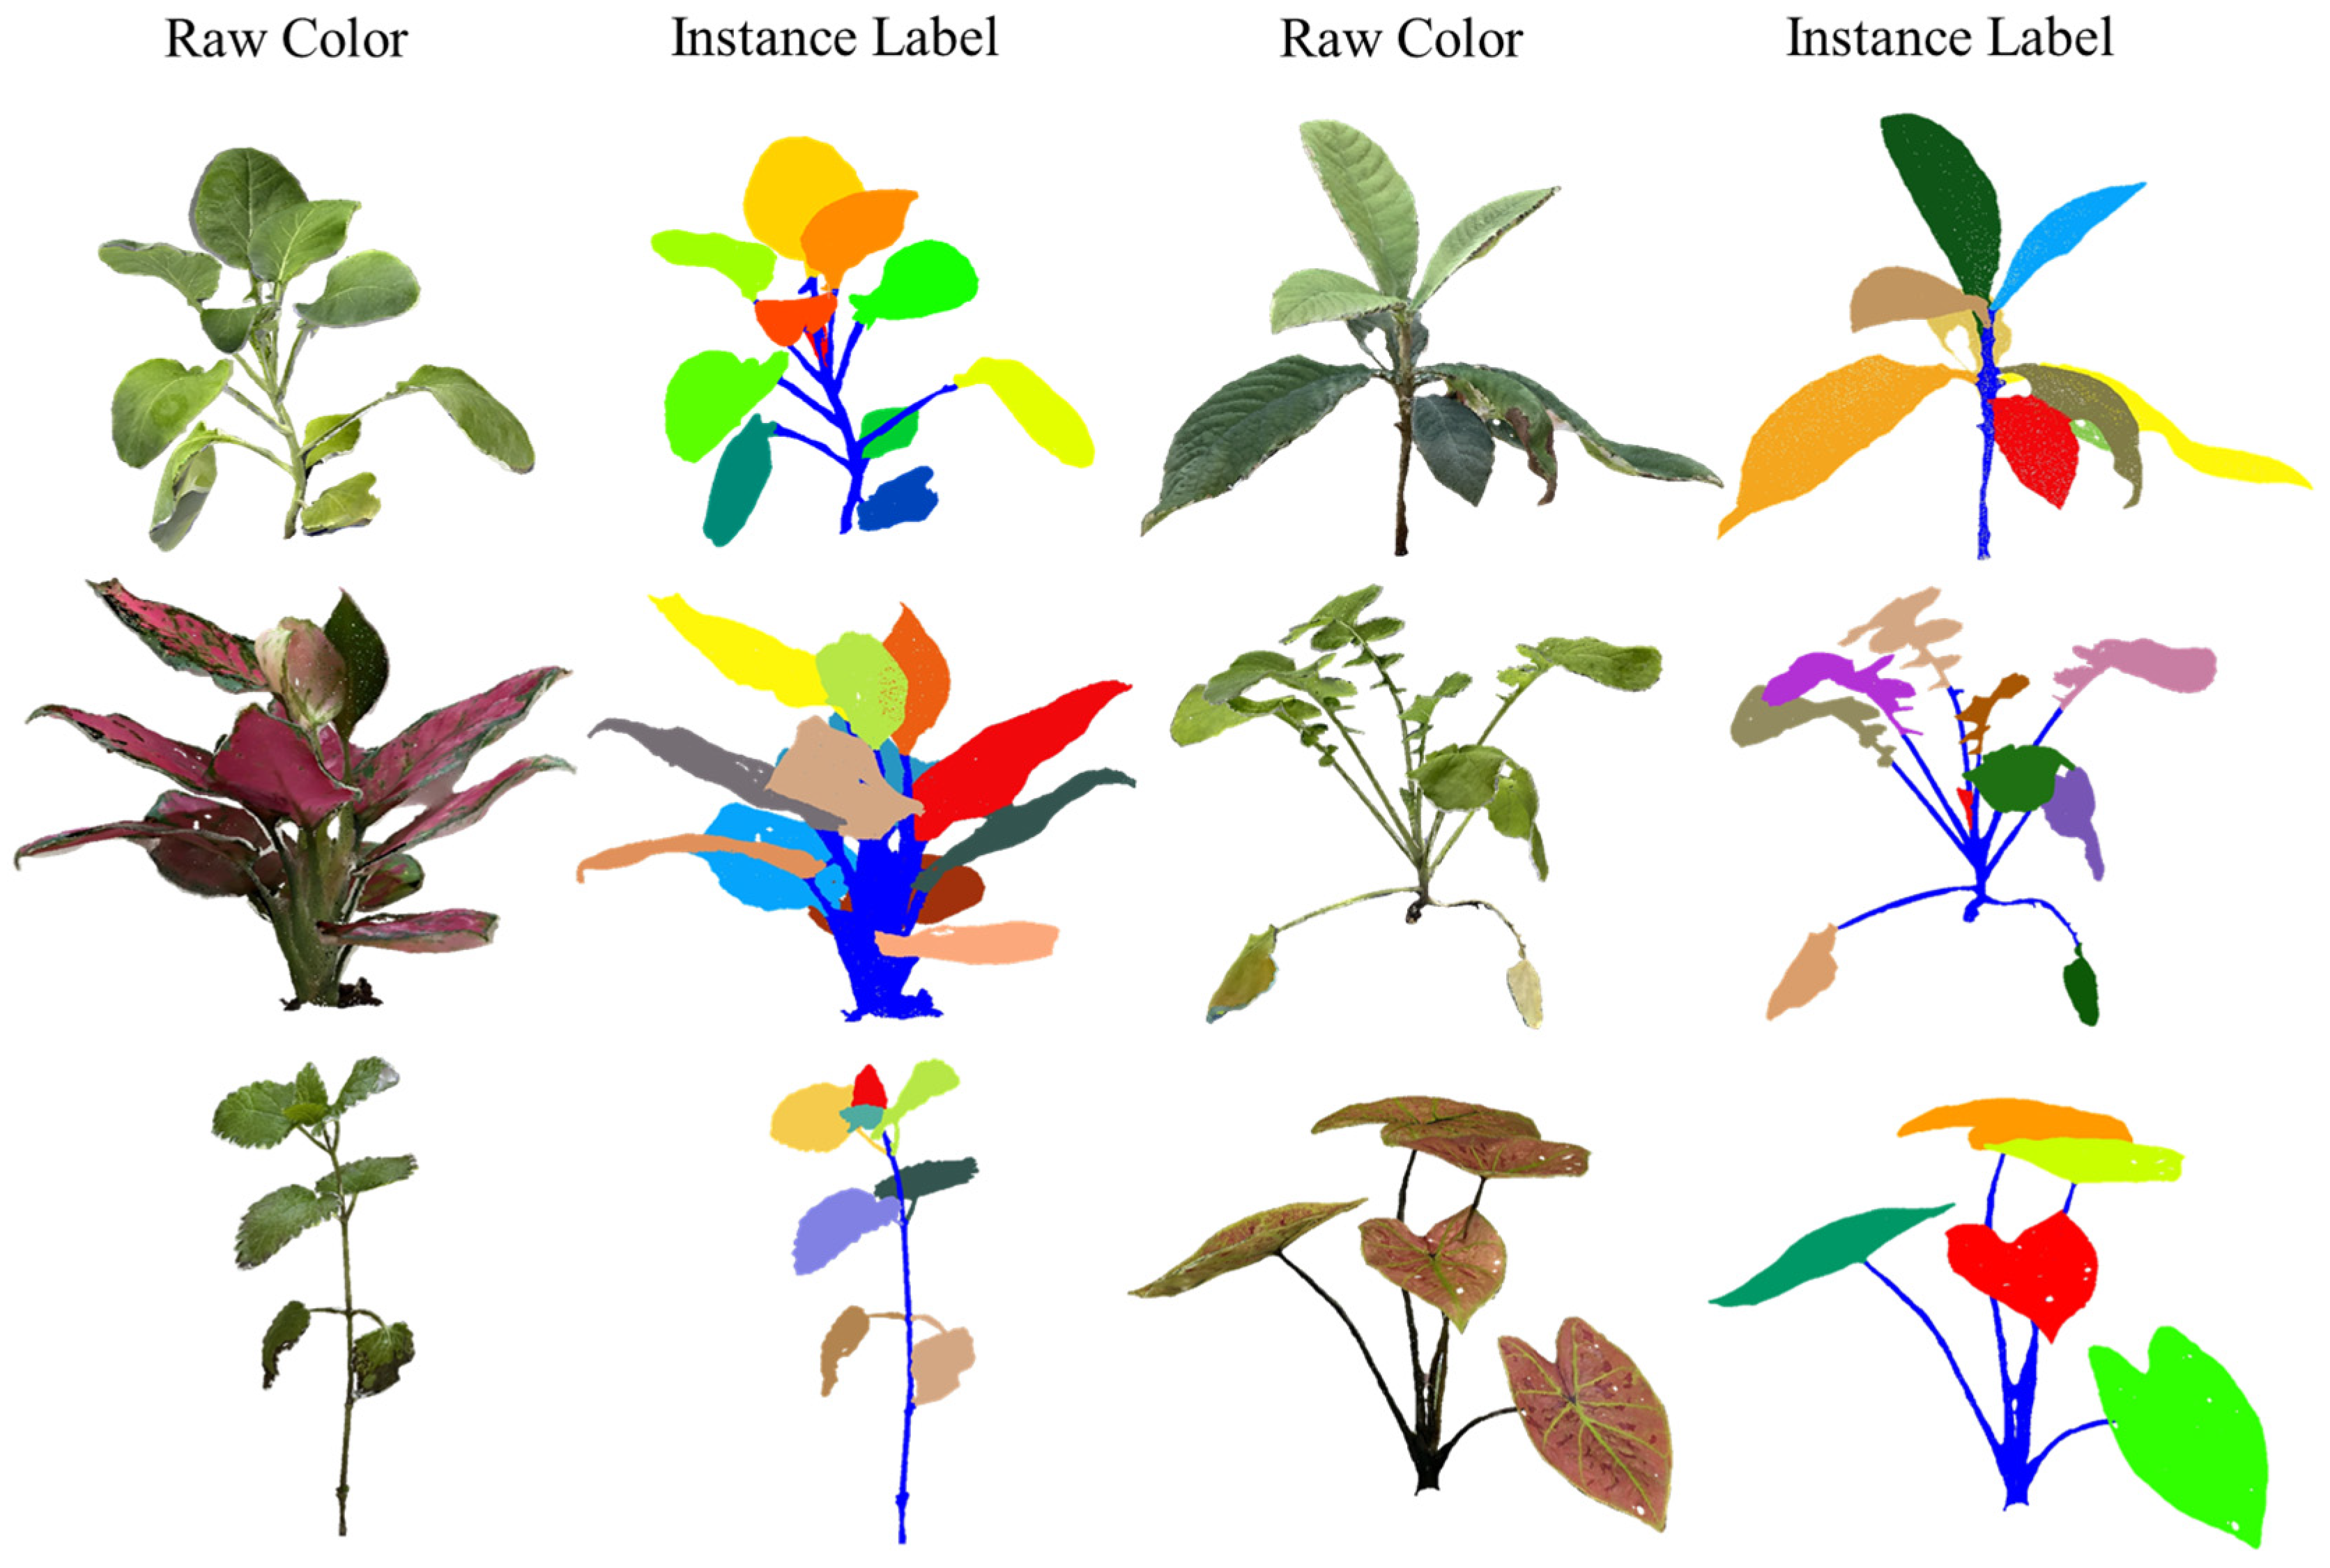
3.1.3. Point Cloud Annotation

To enable advanced organ-level analysis within our dataset, we implemented a comprehensive point-wise annotation system with hierarchical labeling. Each data point was meticulously annotated with: (1) a primary classification as either “stem” or “leaf”, and (2) a unique organ-specific identifier distinguishing individual leaves within the same plant. As illustrated in Figure 3, our annotation pipeline leveraged the open-source software CloudCompare version 2.12.4 for precise manual segmentation of plant morphological structures. The annotated point clouds incorporate seven key data dimensions stored in TXT format: XYZ coordinates (spatial positioning), RGB values (true color information), C (binary stem/leaf classification), and I (unique leaf identification code). This multi-layered labeling scheme provides researchers with unprecedented granularity for structural and functional analyses of plant architecture.
Prior to annotation, all point cloud data underwent a standardized preprocessing pipeline to ensure data quality and consistency. For each potted plant reconstruction, we first performed semi-automatic background and noise removal to isolate the complete botanical structure, preserving only the pot, branches, and leaves. Additionally, to address scale variations inherent in multi-view stereo reconstruction, we implemented a normalization procedure involving coordinate translation to the origin and proportional scaling based on pot dimensions. This spatial standardization enabled meaningful comparisons across specimens while maintaining biological accuracy in the reconstructed plant architectures.
The annotation process involved ten trained annotators holding degrees in geomatics with a minimum of 3 years of labeling experience. To ensure consistency, each sample was independently labeled by two annotators, with discrepancies resolved through the following: (1) third-annotator arbitration (for technical conflicts); (2) professional software verification (for spatial data). The PP3D dataset annotation was performed using CloudCompare, an open-source point cloud processing software. Following the import of preprocessed data, we conducted comprehensive manual annotation across hundreds of plant specimens, including: (1) the semantic segmentation of stems and leaves, (2) instance-level leaf labeling for panoramic segmentation tasks (Figure 4), and (3) the random downsampling of each labeled organ to optimize data size while preserving structural fidelity. Each potted plant sample was independently annotated by two labelers at the instance level. Annotations with IoU < 0.85 were adjudicated by a third expert annotator. These annotations provide multi-granularity phenotypic information, from organ classification to individual leaf identification. Future work will expand the annotation schema to include finer morphological features (e.g., petioles, nodes) to support advanced plant architecture analysis [4]. The current annotation pipeline achieves an optimal balance between data richness and computational efficiency through strategic downsampling that maintains critical topological features.
The current PP3D dataset partitions all data into training, validation, and test sets following a 7:1:2 ratio. The dataset is organized in a hierarchical structure where each plant specimen occupies a dedicated directory containing the following: (1) the complete plant point cloud file, and (2) an annotation subdirectory with separated stem and leaf point clouds. Each point is characterized by six attributes (XYZ coordinates and RGB color values) stored in a standardized tabular format. To facilitate initial evaluation, we have released representative samples from the dataset. Upon completion, we will publicly share the full-scale dataset to support advanced research in panoramic plant phenotyping and 3D morphological analysis.

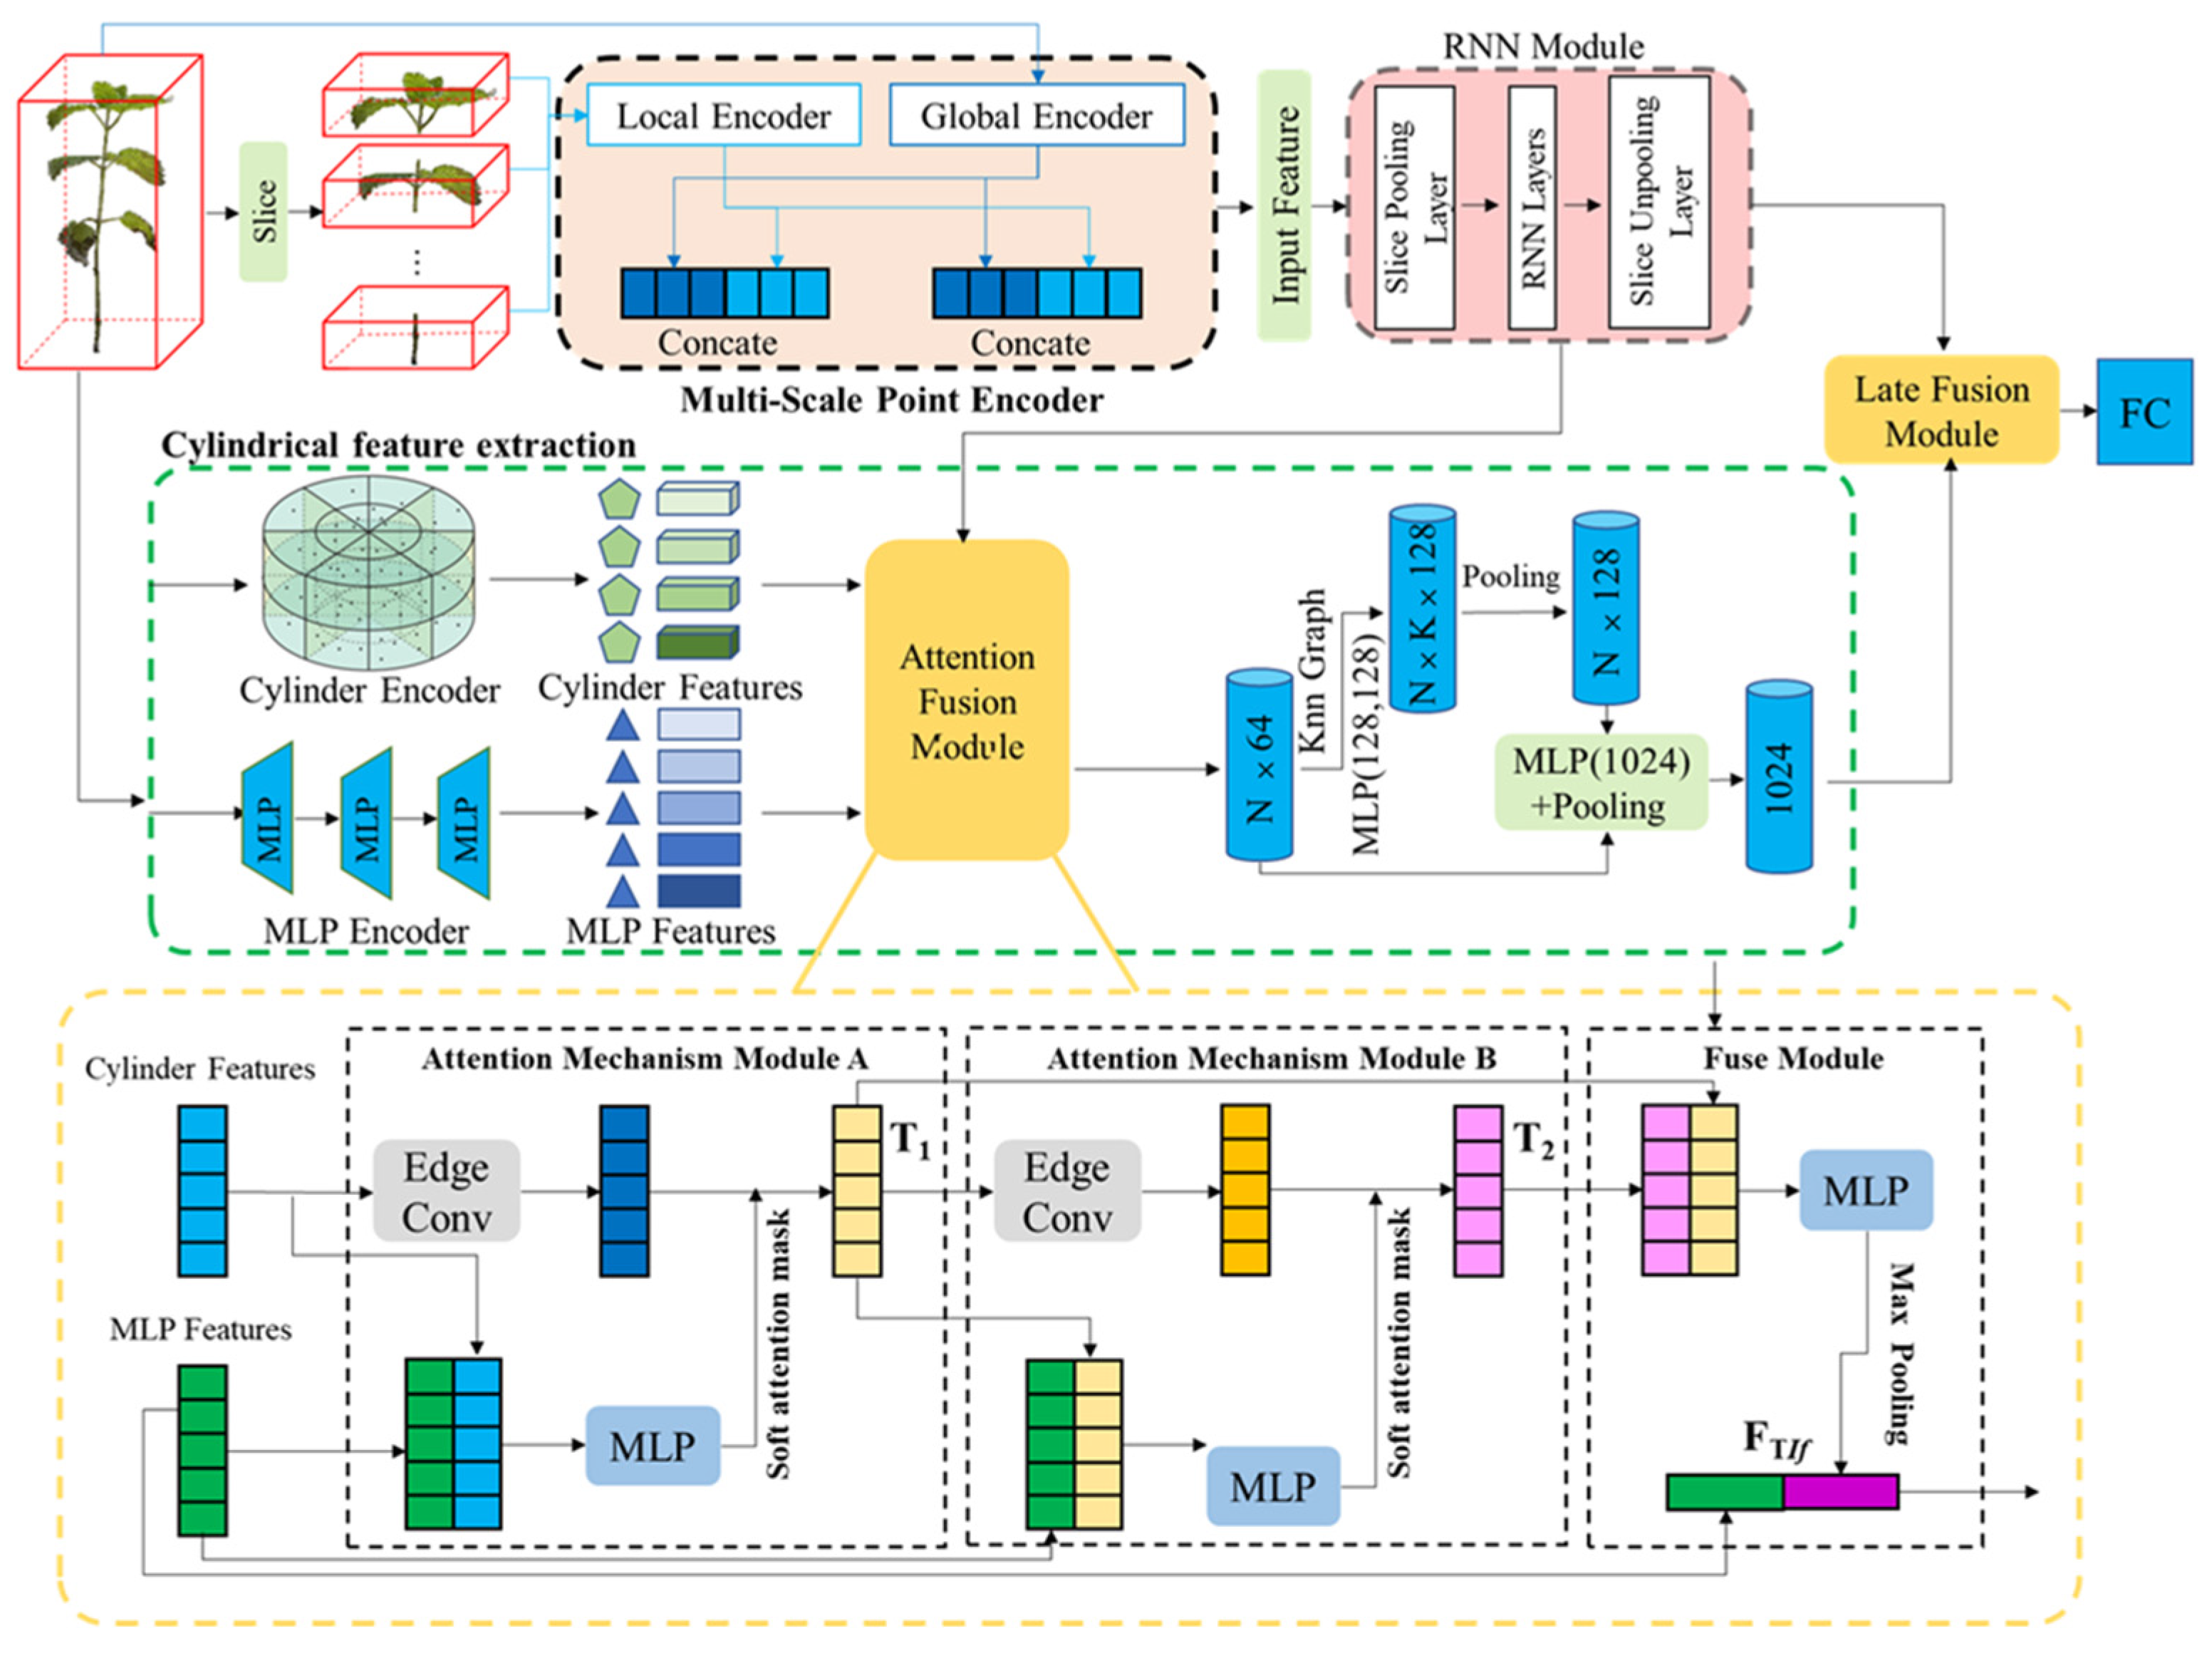
3.2. The Proposed SCNet

In this section, we present the theoretical foundations and architectural principles underlying the proposed SCNet framework. The system primarily comprises three core components: (1) sequential slice feature extraction, (2) cylindrical feature extraction, and (3) a feature fusion module. Each component is carefully designed to address specific challenges in the feature representation pipeline.

3.2.1. Sequential Slice Feature Extraction

As depicted in Figure 5, the sequential slice feature extraction branch comprises three main modules: a sequential slice module for input processing, a multi-scale point encoder for hierarchical feature learning, and a recurrent neural network (RNN) with GRU to capture temporal dependencies.
Sequential Slicer. Prior to inputting the potted plant point cloud into the network, we transform the raw point cloud into a sequential-slice representation. This operation is motivated by the natural growth pattern of potted plants, which typically exhibit rotational symmetry around the vertical axis. Given an input point cloud P = (x, y, z), we first normalize the geometric coordinates to the range [0, 1] to ensure scale invariance. Subsequently, we partition P into M slices along the z-axis, where M is a user-defined hyperparameter (typically, M = 1, 2, …, m). Formally, for a point cloud P containing N points, the slice operation is defined as follows:
S   =   S M | S M   =   p i | p i P ,   z i   ×   m   =   M
where S M denotes the M-th slice, where z i represents the z-coordinate of point p i . The slice assignment is determined through a ceiling operation (⌈⋅⌉), which clusters all points into their respective slices along the z-axis. This process generates an ordered slice set S   =   { S 1 ,   S 2 ,   ,   S M } , where each S M contains points falling within a specified height interval. The primary objective of this operation is dimensionality reduction: by decomposing the 3D point cloud into a sequence of 2D slices, we enable more efficient feature extraction while preserving the structural hierarchy of the plant.
Point Encoder. To extract multi-scale features from each slice S i , we first project it into 2D space along the z-axis and rasterize it into a grid-mapped image I i with resolution r. The feature extraction process begins with PointNet [37] capturing global slice features, followed by PointConv [38] efficiently extracting local geometric patterns. We then employ MLPs to integrate these features across multiple scales, combining point-wise attributes with neighborhood context to enhance the representation. Finally, the concatenated global and multi-scale local features are prepared for subsequent processing.
RNN Layer. To model the sequential dependencies between slices, we employ an RNN architecture where each slice is treated as a timestamp, enabling information flow across the sequence. This transforms the unordered point cloud features into structured temporal representations. For enhanced feature discrimination, we introduce a sequence voting layer that performs weighted averaging to aggregate high-level features across all timestamps.

3.2.2. Cylindrical Feature Extraction

To enhance the network’s descriptive capability, we designed a cylindrical feature extraction module that captures comprehensive contextual information from plant point clouds. Addressing the challenges of uneven point distribution and variable point density, our approach first employs a key point extraction layer to generate a fixed number of representative points while preserving critical structural information. These sampled points are then processed through a Multi-Layer Perceptron (MLP) comprising four fully connected layers, each equipped with ReLU activation and Batch Normalization.
The extracted features are subsequently mapped to cylindrical voxels based on the spatial occupancy of the original points. For feature refinement, we apply a spatial sparse 3D convolution layer [39] to aggregate local geometric patterns efficiently. In the final fusion stage, cylindrical voxel features are spatially aligned with slice point features and concatenated to form enriched fused point representations, effectively combining both local geometric details and global contextual information.

3.2.3. Feature Fusion Module

Attention-Guided Feature Fusion. SCNet employs an attention mechanism to dynamically integrate multi-modal features for enhanced plant representation. The network first embeds the MLP-derived features M f and uses them to adaptively guide the learning of cylindrical features C f through attention coefficients, effectively capturing the relative importance of different local structures in potted plants. Our framework incorporates two complementary attention modules: the Explicit Geometric Attention (Module A) focusing on the salient structural features of plant morphology, and the Implicit Geometric Attention (Module B) targeting latent spatial relationships and subtle geometric patterns. As illustrated in Figure 5, this dual-attention architecture enables the comprehensive fusion of 2D semantic information from images with 3D spatial features from point clouds, providing a more complete representation of plant characteristics.
Attention Mechanism Module A. To effectively fuse the cylindrical features C f and MLP features M f across different dimensional spaces, we first project M f into an N-dimensional space matching C f ’s dimensionality. The aligned features are then concatenated to form a relational feature representation F 1 ( C f ,   M f ) . This combined feature undergoes adaptive transformation through an MLP, followed by normalization to the [0, 1] range using a sigmoid function, ultimately generating a soft attention mask M that quantifies the relative importance of cylindrical features with respect to MLP features.
Attention Mechanism Module B. While explicit geometric features provide fundamental structural information, they alone cannot fully capture the rich semantic and geometric complexity of potted plants. To address this limitation, we conduct an in-depth exploration of latent implicit features through Module B. This enhanced attention mechanism processes refined point features in conjunction with both cylindrical features ( C f ) and MLP-derived features ( M f ), enabling the comprehensive learning of subtle spatial relationships and contextual patterns that are critical for accurate plant characterization.

4. Results and Discussion

4.1. Representative Baselines and Implementation Details

This section elaborates on the experimental setup, including four representative baseline methods and implementation details. For comprehensive evaluation on the PP3D dataset, we conducted panoptic segmentation experiments using the following: (1) ASIS [40], a pioneering point cloud segmentation approach; (2) HAIS [41], which incorporates hierarchical aggregation; (3) ISBNet [42], known for its instance-aware segmentation; and (4) JSNet [43], featuring joint segmentation capabilities. These baselines were compared against our proposed SCNet architecture to validate its effectiveness. Detailed configurations include the following: hardware specifications (e.g., GPU models), software environment (e.g., PyTorch version 1.12.1), and hyperparameter settings (learning rate, batch size, etc.), ensuring reproducible experimental conditions.
ASIS [40] serves as a foundational framework for concurrent instance and semantic segmentation in 3D point clouds. This approach introduces a synergistic dual-task learning mechanism that creates mutual enhancement between both segmentation tasks through: (1) semantically informed instance embedding learning, where instance segmentation benefits from the semantic context by incorporating category-aware features into point-level embeddings, and (2) instance-aware semantic refinement, where semantic predictions are improved by aggregating features from points belonging to identical instances. This bidirectional information flow establishes a mutually reinforcing improvement cycle, significantly boosting performance on both tasks compared to processing them independently.
HAIS [41] proposes an efficient hierarchical clustering framework that leverages both point-level and cluster-level spatial relationships for instance segmentation. The method employs a two-stage aggregation process: (1) Point Aggregation: geometrically proximate points are clustered into primitive segments using learned feature affinities, forming initial instance proposals; (2) Set Aggregation: these primitive segments are progressively merged into complete instances through hierarchical feature propagation and spatial reasoning. This bottom-up approach eliminates the need for computationally expensive non-maximum suppression (NMS) post-processing while maintaining competitive performance, achieving an optimal balance between accuracy and computational efficiency in large-scale 3D scenes.
ISBNet [42] introduces an innovative cluster-free paradigm for instance segmentation that conceptualizes instances as learnable kernel representations. The framework comprises three key components: (1) Instance-aware Farthest Point Sampling strategically selects candidate seed points to ensure comprehensive spatial coverage; (2) a modified PointNet++ architecture employs local feature aggregation to encode robust candidate representations; and (3) dynamic convolution kernels generate instance masks by adaptively weighting point features. This approach eliminates traditional clustering bottlenecks while achieving superior recall rates through its discriminative kernel learning mechanism, particularly effective in handling densely distributed instances with complex geometries.
JSNet [43] proposes an integrated framework for joint instance and semantic segmentation through bidirectional feature interaction. The core innovation is the Joint Instance Semantic Segmentation (JISS) module that establishes the following: (1) a semantic-to-instance pathway that transforms categorical features into discriminative instance embeddings through learned projection, and (2) an instance-to-semantic pathway that enriches semantic features with structural information from instance groupings. This dual cross-pollination of features creates a synergistic effect where instance boundaries benefit from semantic consistency while semantic predictions gain structural precision from instance awareness. The framework demonstrates particular effectiveness in complex botanical scenes where morphological continuity and categorical distinction are equally critical.
All computational experiments were performed on a high-performance workstation featuring an NVIDIA GeForce RTX 3090 graphics (NVIDIA Corporation, Santa Clara, CA, USA) processor with 24GB GDDR6X memory. To ensure optimal compatibility with existing point cloud processing architectures, we preprocessed the PP3D dataset into dual standardized formats: (1) the STPL3D [44] vegetation-specific format and (2) the general-purpose S3DIS [13] point cloud format, both of which will be made publicly available to maximize research utility. For implementations involving HAIS and ISBNet frameworks, we adopted specific parameter configurations: each potted plant specimen was processed as an independent 3D scene with a scaling factor of 3 to preserve fine-scale morphological features, while the ‘max_npoint’ parameter was optimized to its maximum viable value (typically ranging between 50,000 and 100,000 points per specimen) to comprehensively capture intricate plant structures. Feature dimensions were uniformly maintained at [128, 512] throughout upscaling operations, with all remaining hyperparameters preserved at their default values to ensure the authentic representation of each network’s baseline performance capabilities. This rigorous experimental protocol was designed to facilitate direct cross-method comparisons while addressing the unique challenges of 3D plant phenotyping analysis.

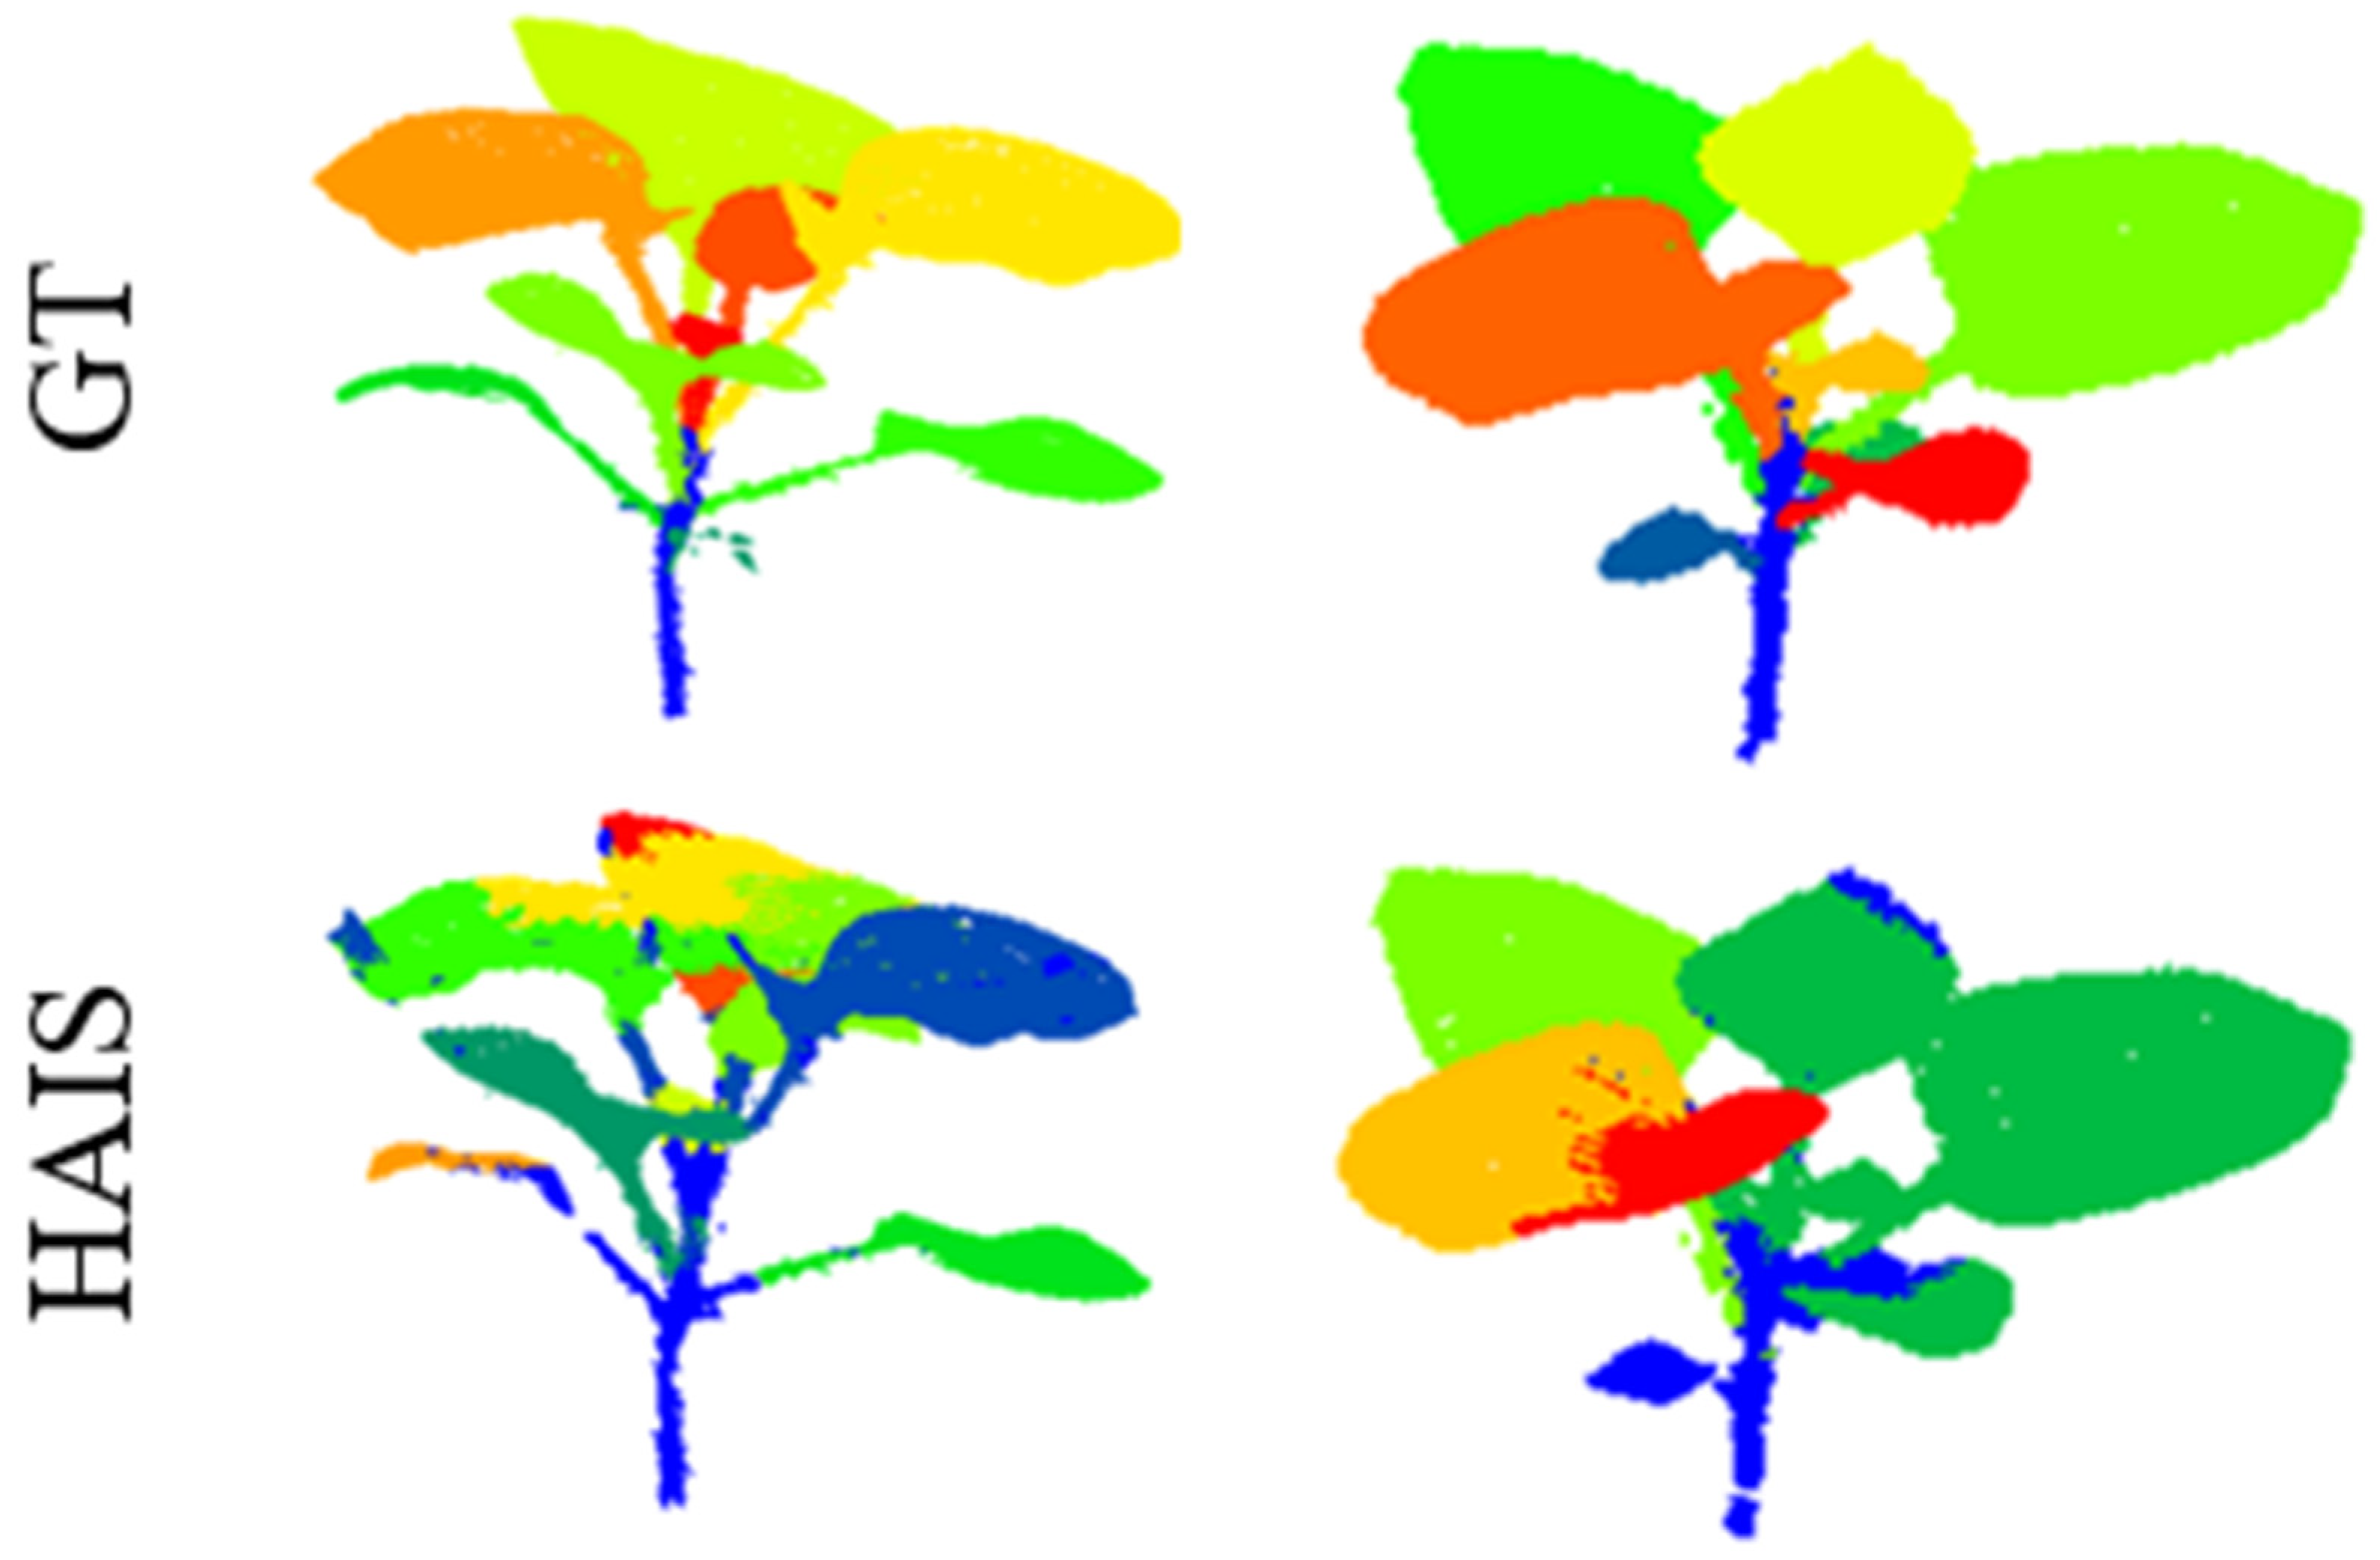
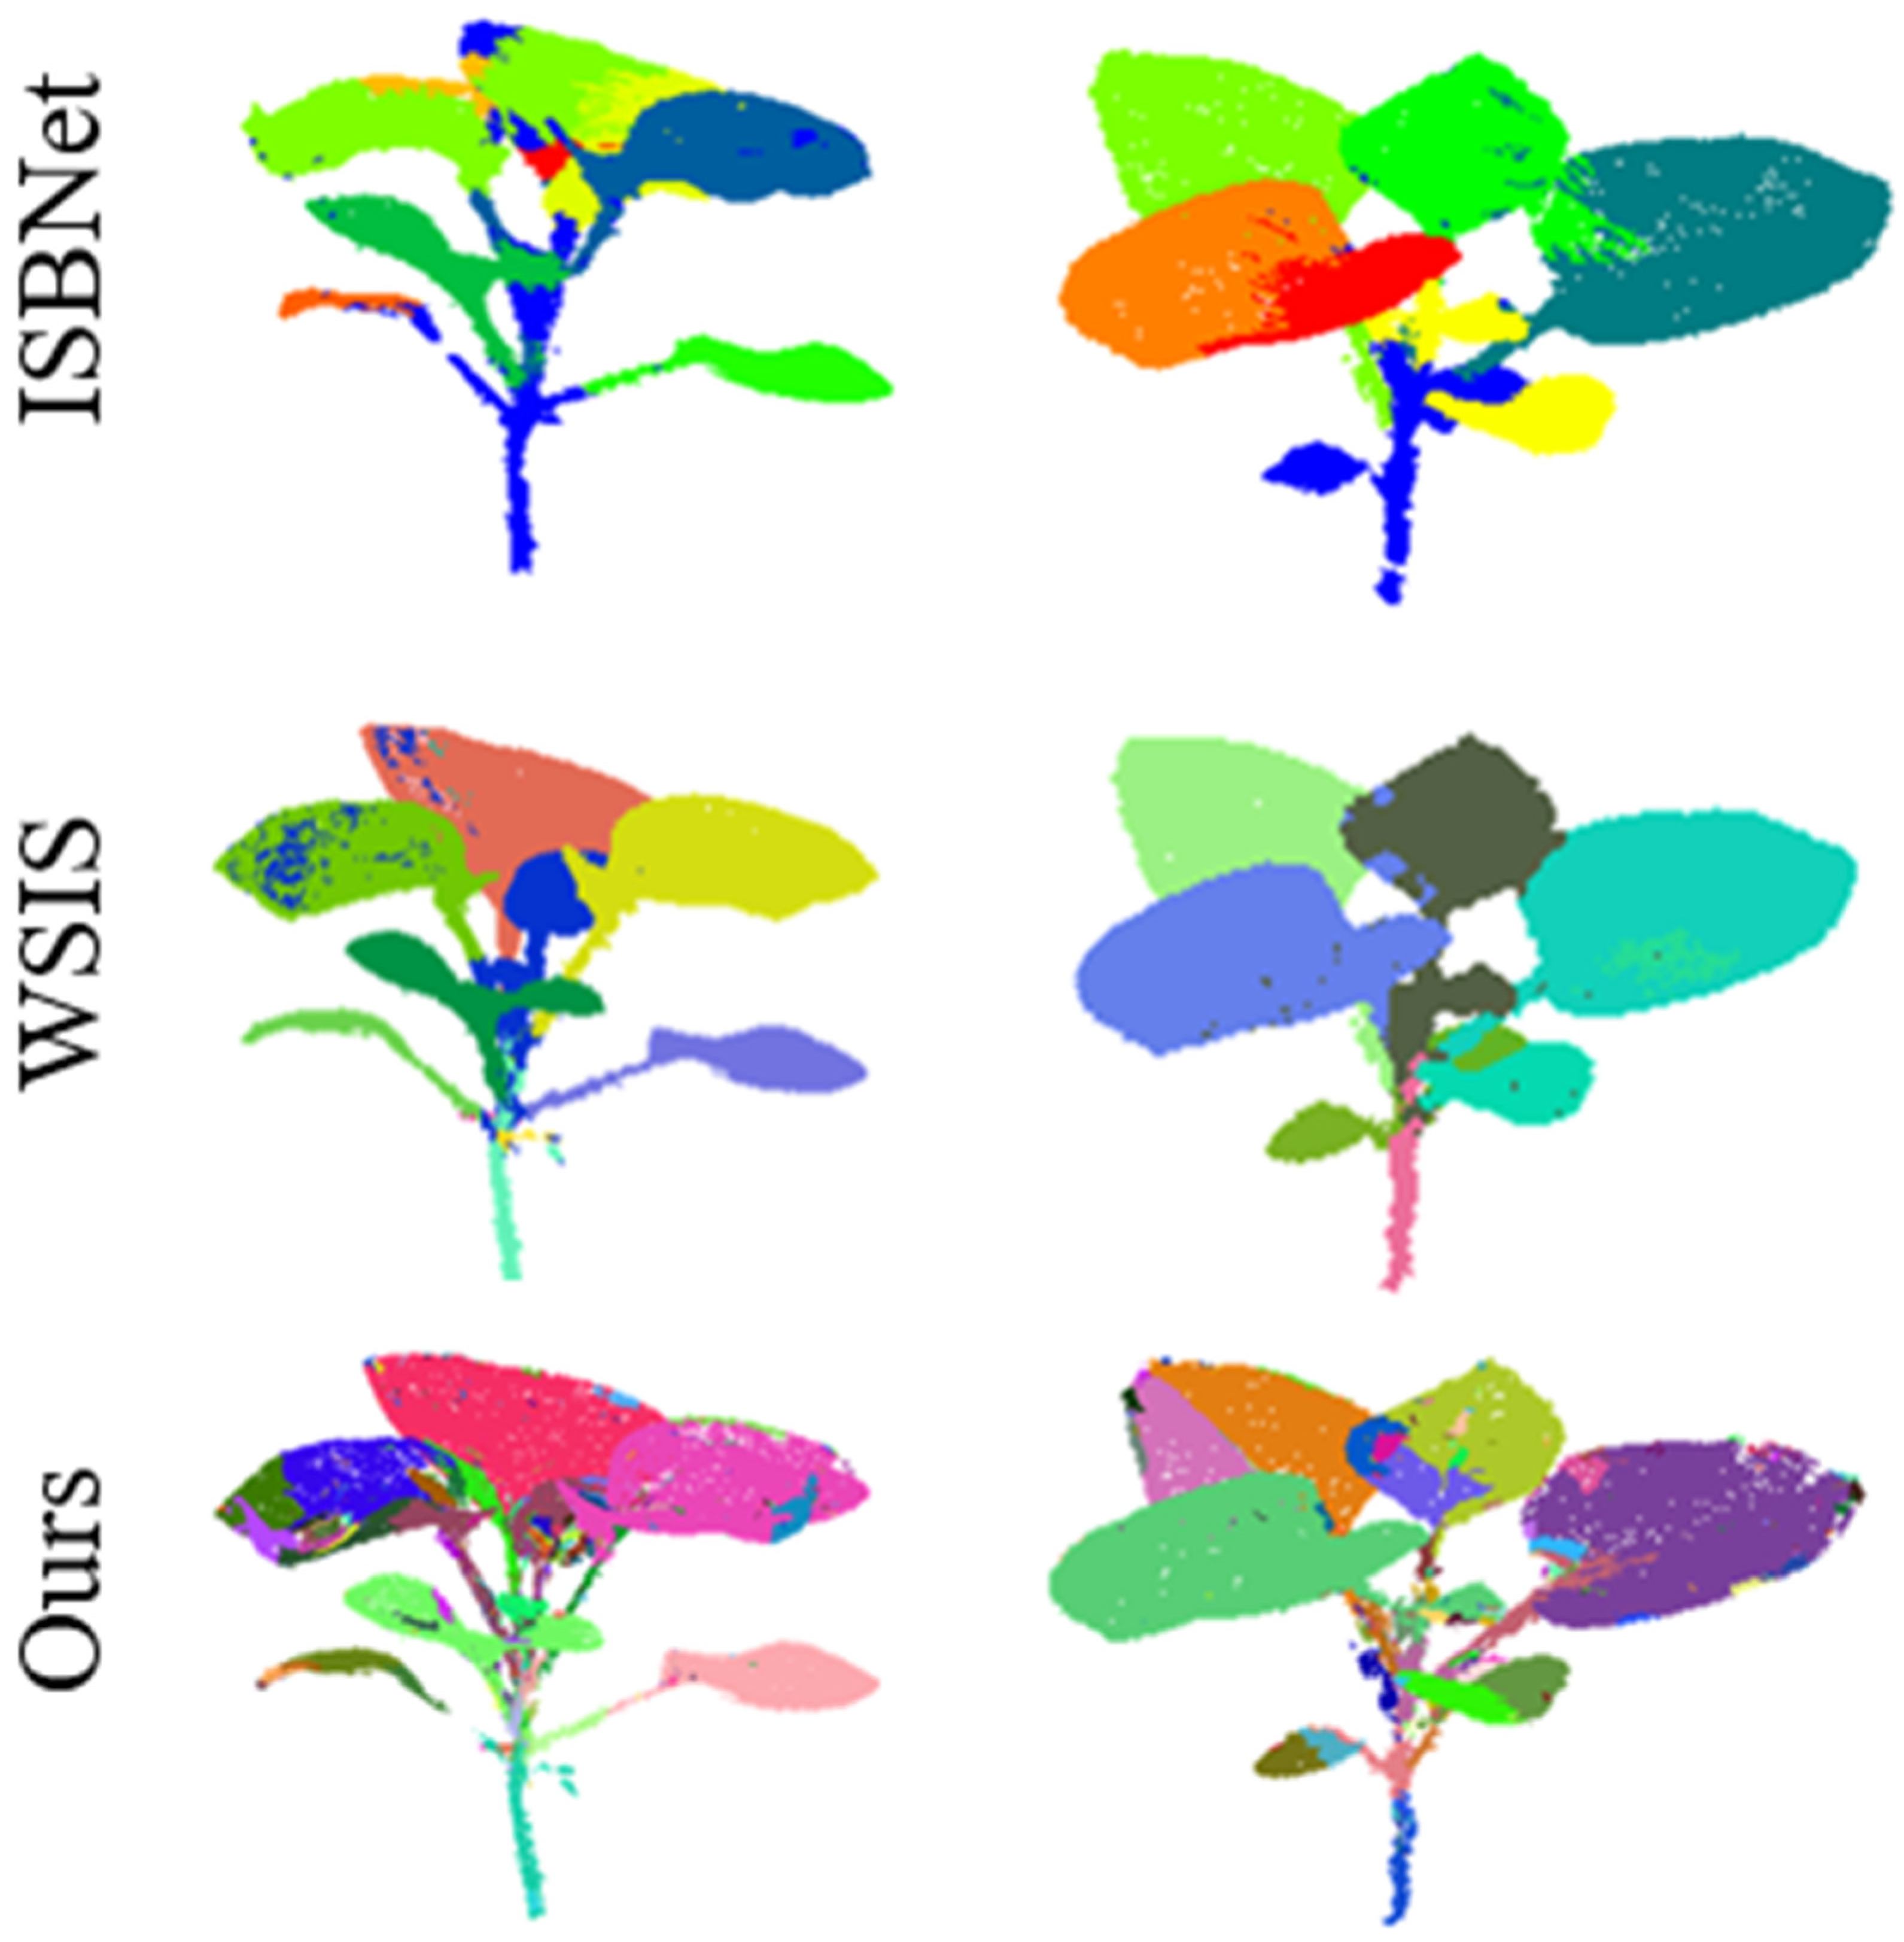
4.2. Qualitative and Quantitative Results

Figure 6 presents a comparative visualization of instance segmentation performance on the PP3D dataset, evaluating five state-of-the-art methods: ASIS [40], HAIS [41], ISBNet [42], JSNet [43], and our proposed SCNet. Experimental results demonstrate SCNet’s superior robustness in leaf-level instance segmentation across diverse plant morphologies compared to the four baseline methods. Notably, while photogrammetric point clouds inherently suffer from precision limitations due to reconstruction artifacts, our SCNet maintains remarkable segmentation consistency. The method particularly excels in handling complex canopy structures, successfully distinguishing individual leaves even in challenging scenarios involving dense foliar overlap near stem junctions.
For comprehensive performance evaluation, Table 2 provides quantitative metrics comparing all five methods on the PP3D dataset. The results clearly indicate SCNet’s dominance across all evaluation criteria, with HAIS [41] ranking second and ISBNet [42] showing the weakest performance. This exceptional performance originates from our novel dual-branch architecture design: (1) the sequential slice module employs adaptive slicing planes to achieve precise leaf boundary detection, while (2) the cylindrical feature extractor specializes in accurate leaf-stem junction identification, effectively eliminating non-foliar point clusters. The synergistic operation of these complementary feature extractors ensures reliable individual leaf identification regardless of point cloud quality variations.
Nevertheless, as shown in Figure 7, the proposed SCNet still presents three characteristic limitations in segmentation performance: (1) Morphological ambiguity between woody branches and slender petioles frequently causes erroneous region splitting due to their nearly identical local geometric features. (2) Partial occlusion artifacts and inconsistent neighborhood contexts often induce irreducible classification errors, particularly in dense foliar regions. (3) Morphologically anomalous leaves (e.g., highly lobed or curled specimens) are occasionally mislabeled as distinct botanical components. These findings underscore the persistent challenges inherent in our PP3D dataset, highlighting critical areas that demand immediate research attention and methodological refinement.

4.3. Experimental Analysis and Discussion

The Role of True RGB Color. Our photogrammetric point clouds typically contain richer information, offering additional features that can enhance network training. To evaluate the impact of color information on model performance, we conducted comparative experiments using four existing networks (ASIS [40], HAIS [41], ISBNet [42] and JSNet [43]) along with our proposed network. Following the approach of SensatUrban [12], we trained these networks using either point coordinates alone or both point coordinates and color information. The qualitative segmentation results without real RGB information are presented in Figure 8. As shown in Table 3, most existing networks demonstrate improved segmentation performance when trained with both geometric and color information. However, since our proposed network primarily relies on geometric partitioning, incorporating color information does not yield significant performance gains.
Study on the Weak Supervision. Weak supervision has emerged as a crucial research direction in point cloud segmentation, seeking to maintain satisfactory performance while significantly reducing annotation costs. Following the approach of SegGroup [45], we adopt an extremely sparse annotation scheme where only a single randomly selected point per instance serves as the ground truth label. Using WSIS [46] as our baseline, we evaluate its segmentation performance under an exceptionally low annotation rate of 0.1% on the PP3D dataset. As shown in Table 4, while the mIoU achieved by WSIS is slightly lower than fully supervised models, the results demonstrate that competitive segmentation accuracy can still be attained with minimal supervisory signals. As for the weak supervision segmentation, the qualitative results of the PP3D dataset are presented in Figure 9. This finding substantiates the practical viability of weak supervision approaches for point cloud segmentation tasks.

5. Conclusions

While deep learning has achieved remarkable progress in visual recognition tasks in recent years, the 3D organ-level segmentation of plants remains significantly underdeveloped. To bridge this critical gap, we present PP3D—a comprehensive point cloud dataset featuring panoptic segmentation of real-world potted plants with over 500 meticulously annotated plant organs. To the best of our knowledge, PP3D represents the largest and most diverse dataset of its kind, surpassing existing plant point cloud datasets in both scale (by 3×) and species coverage (by 5×). The dataset introduces novel challenges for plant panoptic segmentation from 3D point clouds, including complex occlusions and fine structural details. To establish a robust benchmark, we conduct an extensive evaluation of state-of-the-art panoptic segmentation algorithms alongside our proposed method. In future developments, we will first expand the PP3D dataset by incorporating additional point cloud samples to increase its scale. Next, we will enhance its diversity by including more plant species while implementing temporal modeling for perennial plants to improve both species coverage and temporal representation. Finally, we will refine and strengthen the annotation protocols to establish PP3D as a standard reference dataset in plant phenotyping research. We firmly believe this initiative will drive advancements in two critical domains: high-throughput plant phenotyping pipelines and smart agricultural systems, ultimately contributing to more sustainable and efficient agricultural practices.

Author Contributions

Conceptualization, S.L. and T.J.; Data curation, L.Z., S.W., S.L. and T.J.; Formal analysis, S.W., S.L. and T.J.; Funding acquisition, T.J.; Investigation, J.F., S.L. and T.J.; Methodology, L.Z., S.F. and T.J.; Project administration, T.J.; Resources, S.L. and T.J.; Software, L.Z., S.W., J.F., S.F. and T.J.; Supervision, T.J.; Validation, S.W., J.F., S.F. and S.L.; Visualization, S.L. and T.J.; Writing—original draft, L.Z., S.W., S.L. and T.J.; Writing—review and editing, S.L. and T.J. All authors have read and agreed to the published version of the manuscript.

Funding

This research was supported by the Open Fund of the Key Laboratory of Degraded and Unused Land Consolidation Engineering, Ministry of Natural Resources of China (grant number SXDJ2024-22), the Open Fund of Key Laboratory of Land Satellite Remote Sensing Application, Ministry of Natural Resources of China (grant number KLSMNR-K202305), the Science and Technology Research and Development Program of China State Railway Group Co., Ltd. (grant number Q2024G032), the National Natural Science Foundation of China (grant number 42401552), the Natural Science Foundation of Jiangsu Province, China (grant number BK20240598), the Natural Science Foundation of the Higher Education Institutions of Jiangsu Province, China (grant number 24KJB420005), and the Open Fund of Technology Innovation Center for Integrated Applications in Remote Sensing and Navigation, Ministry of Natural Resources of China (grant number TICIARSN-2023-06).

Data Availability Statement

Data underlying the results presented in this paper are not publicly available at this time but may be obtained from the authors upon reasonable request.

Acknowledgments

The authors acknowledge all the reviewers for their valuable comments.

Conflicts of Interest

The authors declare no conflicts of interest.

References

  1. Song, H.; Wen, W.; Wu, S.; Guo, X. Comprehensive Review on 3D Point Cloud Segmentation in Plants. Artif. Intell. Agric. 2025, 15, 296–315. [Google Scholar] [CrossRef]
  2. Wang, Z.; Chen, M.; Liu, Q. A review on multimodal communications for human-robot collaboration in 5G: From visual to tactile. Intell. Robot. 2025, 5, 579–606. [Google Scholar] [CrossRef]
  3. Jin, S.C.; Su, Y.J.; Wu, F.F.; Pang, S.X.; Gao, S.; Hu, T.Y.; Guo, Q.H. Stem–leaf segmentation and phenotypic trait extraction of individual maize using terrestrial LiDAR data. IEEE Trans. Geosci. Remote Sens. 2018, 57, 1336–1346. [Google Scholar] [CrossRef]
  4. Hu, H.; Wang, J.; Nie, S.; Zhao, J.; Batley, J.; Edwards, D. Plant pangenomics, current practice and future direction. Agric. Commun. 2024, 2, 100039. [Google Scholar] [CrossRef]
  5. Li, D.; Shi, G.L.; Kong, W.J.; Wang, S.F.; Chen, Y. A leaf segmentation and phenotypic feature extraction framework for multiview stereo plant point clouds. IEEE J. Sel. Top. Appl. Earth Obs. Remote Sens. 2020, 13, 2321–2336. [Google Scholar] [CrossRef]
  6. Jiang, T.; Liu, S.; Zhang, Q.; Xu, X.; Sun, J.; Wang, Y. Segmentation of individual trees in urban MLS point clouds using a deep learning framework based on cylindrical convolution network. Int. J. Appl. Earth Obs. Geoinf. 2023, 123, 103473. [Google Scholar] [CrossRef]
  7. Du, R.; Ma, Z.; Xie, P.; He, Y.; Cen, H. PST: Plant segmentation transformer for 3D point clouds of rapeseed plants at the podding stage. ISPRS J. Photogramm. Remote Sens. 2023, 195, 380–392. [Google Scholar] [CrossRef]
  8. Salve, D.A.; Ferreyra, M.J.; Defacio, R.A.; Maydup, M.L.; Lauff, D.B.; Tambussi, E.A.; Antonietta, M. Andean maize in Argentina: Physiological effects related with altitude, genetic variation, management practices and possible avenues to improve yield. Technol. Agron. 2023, 3, 14. [Google Scholar] [CrossRef]
  9. Behley, J.; Garbade, M.; Milioto, A.; Quenzel, J.; Behnke, S.; Stachniss, C.; Gall, J. Semantickitti: A dataset for semantic scene understanding of lidar sequences. In Proceedings of the IEEE/CVF Conference on Computer Vision and Pattern Recognition (CVPR), Long Beach, CA, USA, 16–20 June 2019; pp. 9297–9307. [Google Scholar]
  10. Fong, W.K.; Mohan, R.; Hurtado, J.V.; Zhou, L.; Caesar, H.; Beijbom, O.; Valada, A. Panoptic nuscenes: A large-scale benchmark for lidar panoptic segmentation and tracking. IEEE Robot. Autom. Lett. 2022, 7, 3795–3802. [Google Scholar] [CrossRef]
  11. Xiao, A.; Huang, J.; Xuan, W.; Ren, R.; Liu, K.; Guan, D.; Saddik, A.E.; Lu, S.; Xing, E.P. 3d semantic segmentation in the wild: Learning generalized models for adverse-condition point clouds. In Proceedings of the IEEE/CVF Conference on Computer Vision and Pattern Recognition (CVPR), Vancouver, BC, Canada, 17–24 June 2023; pp. 9382–9392. [Google Scholar]
  12. Hu, Q.Y.; Yang, B.; Khalid, S.; Xiao, W.; Trigoni, N.; Markham, A. Towards semantic segmentation of urban-scale 3D point clouds: A dataset, benchmarks and challenges. In Proceedings of the IEEE/CVF Conference on Computer Vision and Pattern Recognition (CVPR), Nashville, TN, USA, 20–25 June 2021; pp. 4977–4987. [Google Scholar]
  13. Armeni, I.; Sax, S.; Zamir, A.R.; Savarese, S. Joint 2d-3d-semantic data for indoor scene understanding. arXiv 2017, arXiv:1702.01105. [Google Scholar]
  14. Dai, A.; Chang, A.X.; Savva, M.; Halber, M.; Funkhouser, T.; Nießner, M. Scannet: Richly-annotated 3d reconstructions of indoor scenes. In Proceedings of the IEEE/CVF Conference on Computer Vision and Pattern Recognition (CVPR), Honolulu, HI, USA, 21–26 July 2017; pp. 5828–5839. [Google Scholar]
  15. Mo, K.; Zhu, S.; Chang, A.X.; Yi, L.; Tripathi, S.; Guibas, L.J.; Su, H. Partnet: A large-scale benchmark for fine-grained and hierarchical part-level 3d object understanding. In Proceedings of the IEEE/CVF Conference on Computer Vision and Pattern Recognition (CVPR), Long Beach, CA, USA, 2–8 July 2019; pp. 909–918. [Google Scholar]
  16. Zhu, R.; Sun, K.; Yan, Z.; Yan, X.; Yu, J.; Shi, J.; Hu, Z.; Jiang, H.; Xin, D.; Zhang, Z.; et al. Analysing the phenotype development of soybean plants using low-cost 3D reconstruction. Sci. Rep. 2020, 10, 7055. [Google Scholar] [CrossRef] [PubMed]
  17. Jiang, T.; Wang, Y.; Liu, S.; Zhang, Q.; Zhao, L.; Sun, J. Instance recognition of street trees from urban point clouds using a three-stage neural network. ISPRS J. Photogramm. Remote Sens. 2023, 199, 305–334. [Google Scholar] [CrossRef]
  18. Li, D.; Shi, G.L.; Li, J.S.; Chen, Y.L.; Zhang, S.Y.; Xiang, S.Y.; Jin, S.C. PlantNet: A dual-function point cloud segmentation network for multiple plant species. ISPRS J. Photogramm. Remote Sens. 2022, 184, 243–263. [Google Scholar] [CrossRef]
  19. Sun, Y.; Zhang, Z.; Sun, K.; Li, S.; Yu, J.; Miao, L.; Zhang, Z.; Li, Y.; Zhao, H.; Hu, Z.; et al. Soybean-MVS: Annotated three-dimensional model dataset of whole growth period soybeans for 3D plant organ segmentation. Agriculture 2023, 13, 1321. [Google Scholar] [CrossRef]
  20. Mertoğlu, K.; Şalk, Y.; Sarıkaya, S.K.; Turgut, K.; Evrenosoğlu, Y.; Çevikalp, H.; Gerek, Ö.N.; Dutagaci, H.; Rousseau, D. PLANesT-3D: A New Annotated Data Set of 3D Color Point Clouds of Plants. In Proceedings of the Signal Processing and Communications Applications Conference (SIU), Istanbul, Turkey, 2–8 July 2023; pp. 1–4. [Google Scholar]
  21. Schunck, D.; Magistri, F.; Rosu, R.A.; Cornelißen, A.; Chebrolu, N.; Paulus, S.; Léon, J.; Klingbeil, L. Pheno4D: A spatio-temporal dataset of maize and tomato plant point clouds for phenotyping and advanced plant analysis. PLoS ONE 2021, 16, e0256340. [Google Scholar] [CrossRef]
  22. Dutagaci, H.; Rasti, P.; Galopin, G.; Rousseau, D. ROSE-X: An annotated data set for evaluation of 3D plant organ segmentation methods. Plant Methods 2020, 16, 28. [Google Scholar] [CrossRef]
  23. Conn, A.; Pedmale, U.V.; Chory, J.; Navlakha, S. High-resolution laser scanning reveals plant architectures that reflect universal network design principles. Cell Syst. 2017, 5, 53–62. [Google Scholar] [CrossRef]
  24. Behley, J.; Milioto, A.; Stachniss, C. A benchmark for LiDAR-based panoptic segmentation based on KITTI. In Proceedings of the 2021 IEEE International Conference on Robotics and Automation (ICRA), Xi’an, China, 30 May–5 June 2021; pp. 13596–13603. [Google Scholar]
  25. Sirohi, K.; Mohan, R.; Büscher, D.; Burgard, W.; Valada, A. Efficientlps: Efficient lidar panoptic segmentation. IEEE Trans. Robot. 2021, 38, 1894–1914. [Google Scholar] [CrossRef]
  26. Hurtado, J.V.; Mohan, R.; Burgard, W.; Valada, A. Mopt: Multi-object panoptic tracking. arXiv 2020, arXiv:2004.08189. [Google Scholar]
  27. Mohan, R.; Valada, A. Efficientps: Efficient panoptic segmentation. Int. J. Comput. Vis. 2021, 129, 1551–1579. [Google Scholar] [CrossRef]
  28. Gasperini, S.; Mahani, M.A.N.; Marcos-Ramiro, A.; Navab, N.; Tombari, F. Panoster: End-to-end panoptic segmentation of lidar point clouds. IEEE Robot. Autom. Lett. 2021, 6, 3216–3223. [Google Scholar] [CrossRef]
  29. Milioto, A.; Behley, J.; McCool, C.; Stachniss, C. Lidar panoptic segmentation for autonomous driving. In Proceedings of the IEEE/RSJ International Conference on Intelligent Robots and Systems (IROS), Las Vegas, NV, USA, 25–29 October 2020; pp. 8505–8512. [Google Scholar]
  30. Razani, R.; Cheng, R.; Li, E.; Taghavi, E.; Ren, Y.; Bingbing, L. Gp-s3net: Graph-based panoptic sparse semantic segmentation network. In Proceedings of the IEEE/CVF International Conference on Computer Vision (ICCV), Montreal, QC, Canada, 10–17 October 2021; pp. 16076–16085. [Google Scholar]
  31. Zhou, Z.; Zhang, Y.; Foroosh, H. Panoptic-polarnet: Proposal-free lidar point cloud panoptic segmentation. In Proceedings of the IEEE/CVF Conference on Computer Vision and Pattern Recognition (CVPR), Nashville, TN, USA, 20–25 June 2021; pp. 13194–13203. [Google Scholar]
  32. Li, J.K.; He, X.; Wen, Y.; Gao, Y.; Cheng, X.Q.; Zhang, D. Panoptic-phnet: Towards real-time and high-precision lidar panoptic segmentation via clustering pseudo heatmap. In Proceedings of the IEEE/CVF Conference on Computer Vision and Pattern Recognition (CVPR), New Orleans, LA, USA, 18–24 June 2022; pp. 11799–11808. [Google Scholar]
  33. Hong, F.Z.; Zhou, H.; Zhu, X.; Li, H.S.; Liu, Z.W. Lidar-based panoptic segmentation via dynamic shifting network. In Proceedings of the IEEE/CVF Conference on Computer Vision and Pattern Recognition (CVPR), Nashville, TN, USA, 20–25 June 2021; pp. 13090–13099. [Google Scholar]
  34. Li, D.; Li, J.S.; Xiang, S.Y.; Pan, A.Q. PSegNet: Simultaneous semantic and instance segmentation for point clouds of plants. Plant Phenomics 2022, 2022, 9787643. [Google Scholar] [CrossRef] [PubMed]
  35. Luo, L.Y.; Jiang, X.T.; Yang, Y.; Samy, E.R.A.; Lefsrud, M.G.; Hoyos-villegas, V.; Sun, S.P. Eff-3dpseg: 3d organ-level plant shoot segmentation using annotation-efficient deep learning. Plant Phenomics 2023, 5, 0080. [Google Scholar] [CrossRef] [PubMed]
  36. Mirande, K.; Godin, C.; Tisserand, M.; Charlaix, J.; Besnard, F.; Hétroy-Wheeler, F. A graph-based approach for simultaneous semantic and instance segmentation of plant 3D point clouds. Front. Plant Sci. 2022, 13, 1012669. [Google Scholar] [CrossRef]
  37. Qi, C.R.; Su, H.; Mo, K.; Guibas, L.J. PointNet: Deep Learning on Point Sets for 3D Classification and Segmentation. In Proceedings of the IEEE/CVF Conference on Computer Vision and Pattern Recognition (CVPR), Honolulu, HI, USA, 21–26 July 2017; pp. 652–660. [Google Scholar]
  38. Wu, W.; Qi, Z.; Li, F. PointConv: Deep convolutional networks on 3d point clouds. In Proceedings of the IEEE/CVF conference on computer vision and pattern recognition (CVPR), Long Beach, CA, USA, 15–20 June 2019; pp. 9621–9630. [Google Scholar]
  39. Ibrahim, M.; Akhtar, N.; Anwar, S.; Mian, A. SAT3D: Slot attention transformer for 3D point cloud semantic segmentation. IEEE Trans. Intell. Transp. Syst. 2023, 24, 5456–5466. [Google Scholar] [CrossRef]
  40. Wang, X.; Liu, S.; Shen, X.; Shen, C.; Jia, J. Associatively segmenting instances and semantics in point clouds. In Proceedings of the IEEE/CVF Conference on Computer Vision and Pattern Recognition (CVPR), Long Beach, CA, USA, 15–20 June 2019; pp. 4096–4105. [Google Scholar]
  41. Chen, S.; Fang, J.; Zhang, Q.; Liu, W.; Wang, X.G. Hierarchical aggregation for 3d instance segmentation. In Proceedings of the IEEE/CVF International Conference on Computer Vision (ICCV), Seoul, Republic of Korea, 27 October–2 November 2019; pp. 15467–15476. [Google Scholar]
  42. Ngo, T.D.; Hua, B.S.; Nguyen, K. ISBNet: A 3D point cloud instance segmentation network with instance-aware sampling and box-aware dynamic convolution. In Proceedings of the IEEE/CVF Conference on Computer Vision and Pattern Recognition (CVPR), Vancouver, BC, Canada, 18–19 June 2023; pp. 13550–13559. [Google Scholar]
  43. Zhao, L.; Tao, W. JSNet: Joint instance and semantic segmentation of 3d point clouds. In Proceedings of the AAAI Conference on Artificial Intelligence (AAAI), New York, NY, USA, 7–12 February 2020; pp. 12951–12958. [Google Scholar]
  44. Chen, M.; Hu, Q.; Yu, Z.; Thomas, H.; Feng, A.; Hou, Y.; McCullough, K.; Ren, F.; Soibelman, L. STPLS3D: A large-scale synthetic and real aerial photogrammetry 3D point cloud dataset. arXiv 2022, arXiv:2203.09065. [Google Scholar]
  45. Tao, A.; Duan, Y.; Wei, Y.; Lu, J.; Zhou, J. Seg-group: Seg-level supervision for 3d instance and semantic segmentation. IEEE Trans. Image Process 2020, 31, 4952–4965. [Google Scholar] [CrossRef]
  46. Tang, L.; Hui, L.; Xie, J. Learning inter-superpoint affinity for weakly supervised 3d instance segmentation. In Proceedings of the Asian Conference on Computer Vision (ACCV), Macao, China, 4–8 December 2022; pp. 1282–1297. [Google Scholar]
Figure 1. The PP3D dataset was developed through a systematic three-stage pipeline: (1) 3D reconstruction, (2) preprocessing, and (3) dataset compilation. For each plant specimen, this workflow was implemented through six sequential processing steps: initial image capture, feature point extraction, sparse reconstruction, dense reconstruction, point cloud refinement, and final data packaging. This structured approach ensured both the consistency and quality of all specimens within the PP3D collection.
Remotesensing 17 02673 g001
Figure 2. Comparative modeling results showing the impact of photographic sample size on reconstruction quality: (a) 200 images, (b) 100 images, and (c) 75 images. Note the progressive degradation in model completeness and surface quality with the decreasing image count.
Remotesensing 17 02673 g002
Figure 3. Data annotation pipeline for plant organ segmentation. Different colors represent different instances.
Remotesensing 17 02673 g003
Figure 4. Overview of the proposed PP3D dataset. The first and third columns are the original point clouds, colored by texture; the second and fourth columns are the ground truth; different colors represent different instances.
Remotesensing 17 02673 g004
Figure 5. The pipeline of the proposed SCNet.
Remotesensing 17 02673 g005
Figure 6. Panoramic segmentation results of the photogrammetric plant point cloud. Different colors represent different instances.
Remotesensing 17 02673 g006aRemotesensing 17 02673 g006b
Figure 7. Illustration of several examples of typical mis-segmentation. First line: ground truths. Second line: predictions. Different colors represent different instances.
Remotesensing 17 02673 g007
Figure 8. Plant point cloud segmentation results without real RGB information. Different colors represent different instances.
Remotesensing 17 02673 g008
Figure 9. The plant point cloud segmentation results of a weakly supervised study. Different colors represent different instances.
Remotesensing 17 02673 g009aRemotesensing 17 02673 g009b
Table 1. Comparative analysis of existing plant point cloud datasets.
DatasetSoybean-MVSPLANesT-3DPheno-4DROSE-XPlant3DPP3D (Ours)
Year202320232021202020172025
Plant Speciessoybeanpepper, rosebush, and ribesmaize and tomatorosebushtomato, tobacco and sorghum20 species
Acquisition Methodreconstructed using MVS technologyreconstructed from 2D color images of real plants
through MVS
measured with a highly accurate 3D laser scanning system with a spatial precision of less than a tenth of a millimeteracquired through X-ray scanningmapped using high-precision 3D laser scanningpartly collected by MVS and partly by photogrammetry
SensorSLR digital cameraMVS systemLaser scanningX-ray tomographyLaser scanningMVS and photogrammetry system
ColorYesYesNoNoNoYes
Number of Point Clouds1023412611505~500
Labeled Classesleaf, main stem and stemleaf and stemsoil, stem and leafleaf, stem, flower and pot-leaf and stem
Organ-level LabelNoYesYesNo-Yes
Table 2. Segmentation performance evaluation on PP3D.
MethodsAP(%)AP50(%)AP25(%)
StemLeafStemLeafStemLeaf
ASIS [40]16.714.134.828.242.539.9
HAIS [41]54.453.070.262.674.071.5
ISBNet [42]0.47.11.29.52.21.3
JSNet [43]16.313.233.727.240.935.7
SCNet (ours)60.056.171.364.575.472.2
Table 3. Instance segmentation performance of the proposed PP3D dataset. # represents without real RGB information. ∆ shows the change in performance without real RGB information.
MethodsAP(%)AP50(%)AP25(%)
StemLeafStemLeafStemLeaf
ASIS [40]16.714.134.828.242.539.9
ASIS #16.813.833.927.440.136.5
ASIS   0.1−0.3−0.9−0.8−2.4−3.4
HAIS [41]54.453.070.262.674.071.5
HAIS #50.249.663.855.269.163.2
HAIS   −4.2−3.4−6.4−7.4−4.9−8.3
ISBNet [42]0.47.11.29.52.21.3
ISBNet #0.47.01.18.82.01.3
ISBNet   0.0−0.1−0.1−0.7−0.20.0
JSNet [43]16.313.233.727.240.935.7
JSNet #18.914.233.827.039.235.6
JSNet   2.61.00.1−0.2−1.7−0.1
SCNet (ours)60.056.171.364.575.472.2
SCNet #56.356.069.563.474.269.9
SCNet   −3.7−0.1−1.8−1.1−1.2−2.3
Table 4. A weakly supervised study on PP3D. We chose WSIS for the weakly supervised study and compared it with the fully supervised methods.
MethodsAnnotationAP(%)AP50(%)AP25(%)
StemLeafStemLeafStemLeaf
HAIS [41]100%54.453.070.262.674.071.5
HAIS [41]0.10%22.021.533.831.245.644.7
ISBNet [42]100%0.47.11.29.52.21.3
ISBNet [42]0.10%1.36.80.97.62.51.0
SCNet (ours)100%60.056.171.364.575.472.2
SCNet (ours)0.10%20.511.938.331.846.246.8
WSIS [46]0.10%30.526.546.741.250.145.8
Disclaimer/Publisher’s Note: The statements, opinions and data contained in all publications are solely those of the individual author(s) and contributor(s) and not of MDPI and/or the editor(s). MDPI and/or the editor(s) disclaim responsibility for any injury to people or property resulting from any ideas, methods, instructions or products referred to in the content.

