Article

Self-Supervised Learning of End-to-End 3D LiDAR Odometry for Urban Scene Modeling

1
Chengyi College, Jimei University, Xiamen 361021, China
2
Fujian Key Laboratory of Sensing and Computing for Smart Cities, School of Informatics, Xiamen University, Xiamen 361005, China
3
College of Computer Engineering, Jimei University, Xiamen 361021, China
*
Author to whom correspondence should be addressed.
Remote Sens. 2025, 17(15), 2661; https://doi.org/10.3390/rs17152661
Submission received: 16 June 2025 / Revised: 28 July 2025 / Accepted: 30 July 2025 / Published: 1 August 2025

Abstract

Accurate and robust spatial perception is fundamental for dynamic 3D city modeling and urban environmental sensing. High-resolution remote sensing data, particularly LiDAR point clouds, are pivotal for these tasks due to their lighting invariance and precise geometric information. However, processing and aligning sequential LiDAR point clouds in complex urban environments presents significant challenges: traditional point-based or feature-matching methods are often sensitive to urban dynamics (e.g., moving vehicles and pedestrians) and struggle to establish reliable correspondences. While deep learning offers solutions, current approaches for point cloud alignment exhibit key limitations: self-supervised losses often neglect inherent alignment uncertainties, and supervised methods require costly pixel-level correspondence annotations. To address these challenges, we propose UnMinkLO-Net, an end-to-end self-supervised LiDAR odometry framework. Our method is as follows: (1) we efficiently encode 3D point cloud structures using voxel-based sparse convolution, and (2) we model inherent alignment uncertainty via covariance matrices, enabling novel self-supervised loss based on uncertainty modeling. Extensive evaluations on the KITTI urban dataset demonstrate UnMinkLO-Net’s effectiveness in achieving highly accurate point cloud registration. Our self-supervised approach, eliminating the need for manual annotations, provides a powerful foundation for processing and analyzing LiDAR data within multi-sensor urban sensing frameworks.

1. Introduction

Accurate and robust 3D point cloud alignment is fundamental to LiDAR-based urban scene modeling, enabling high-precision reconstructions essential for digital twins, infrastructure monitoring, and urban dynamics analysis. While large-scale modeling typically achieves centimeter-level accuracy in open environments using GNSS-RTK positioning, this approach suffers significant degradation in complex urban settings. Tall urban canyons, densely wooded areas, and obstructed spaces induce non-line-of-sight (NLOS) and multipath effects that substantially increase positioning errors [1]. Although mitigation techniques exist [2,3,4,5,6,7], they often fail to meet high-precision modeling requirements. Consequently, LiDAR sensor data have emerged as the primary solution for precise point cloud alignment when external positioning is unreliable.
LiDAR technology has become the cornerstone sensor for urban 3D modeling due to its lighting invariance, long-range capability, and measurement accuracy. Modern mobile mapping platforms deploy multi-line LiDAR sensors that capture detailed spatial representations through direct time-of-flight measurement. Unlike passive cameras, these active sensors maintain operational stability under challenging illumination and weather conditions. This robustness has established point cloud registration algorithms as essential techniques for continuous reconstruction in complex environments like urban canyons and vegetated areas [8,9].
Traditional reconstruction methods employ either direct point registration or geometric feature matching. While effective in static scenes, they exhibit critical limitations in urban environments: sensitivity to dynamic objects (e.g., vehicles and pedestrians) causing alignment errors, performance degradation from point cloud sparsity and measurement noise, and a requirement for manual parameter tuning across diverse urban contexts.
Deep learning approaches have demonstrated potential in addressing these challenges through end-to-end feature extraction [10,11,12,13,14,15,16,17,18,19,20]. However, prevailing methodologies exhibit fundamental limitations.
Projection-based methods [10,11,14] process range images derived from cylindrical or spherical projections using 2D convolutional neural networks (CNNs). This representation inherently discards the essential three-dimensional structural relationships.
Self-supervised approaches [12,13] mitigate dependency on labeled data by utilizing pose-predicted point cloud alignment as supervisory signals. Nevertheless, these methods manifest critical deficiencies: (1) dependence on 2D CNN architectures (e.g., DeepLO [12] and DeLORA [13]) that fail to capture complete 3D geometric information; (2) optimization objectives based exclusively on geometric consistency metrics (e.g., Chamfer distance and photometric error), while neglecting the detrimental effects of point cloud sparsity and sensor noise on alignment precision.
Beyond methodological limitations, learning-based LiDAR odometry must contend with four fundamental challenges: (1) data characteristics, including unordered, sparse point distributions with measurement uncertainties; (2) environmental complexity from reflective surfaces and complex structures generating outliers; (3) scene dynamics where moving objects introduce occlusion noise; (4) platform motion characteristics like vibration that degrade data quality.
To overcome these limitations, we propose UnMinkLO-Net, a self-supervised LiDAR odometry framework featuring 3D sparse convolution to preserve geometric structure (replacing cylindrical projection) and a novel uncertainty-aware loss modeling alignment errors through covariance estimation. Our end-to-end approach estimates 6-DoF poses without ground-truth supervision. Innovations of this work include the following:
  • We propose an end-to-end LiDAR odometry network, UnMinkLO-Net, which uses 3D sparse convolution to preserve the 3D geometric structure and employs a covariance matrix to model alignment uncertainty between point clouds.
  • We design a self-supervised loss function based on uncertainty modeling, enabling training without pose ground truth, making it suitable for scenarios where pose labels are hard to obtain.
  • Experiments on the KITTI dataset show that UnMinkLO-Net can effectively estimate pose transformations between consecutive LiDAR frames and outperforms existing self-supervised 2D-convolution-based methods in accuracy.

2. Related Works

2.1. LiDAR Odometry Based on Point Cloud Registration

Point-based LiDAR odometry methods estimate ego-motion by iteratively optimizing the correspondence between pairs of sequential LiDAR point clouds to obtain the optimal pose transformation. Among these, the iterative closest point (ICP) algorithm [21] is the most widely recognized. ICP is a modular framework that aligns two point clouds by establishing point correspondences through a nearest neighbor search (NNS). However, one of the major limitations of ICP is its high computational cost when processing dense point clouds due to the complexity of nearest neighbor search. Additionally, the non-convex nature of the optimization makes the algorithm highly sensitive to the accuracy of the initial transformation. Moreover, outliers caused by dynamic objects can introduce further non-convexity into the optimization process.
To enhance the performance of ICP in terms of both efficiency and accuracy, various improved variants have been proposed, such as normal-ICP [22] and generalized ICP (G-ICP) [23,24,25]. Among these, G-ICP is particularly favored for its high accuracy. It formulates the registration problem as the optimization of a distribution-to-distribution cost function, considering the local geometry of point distributions rather than relying solely on point locations. This modeling makes G-ICP more robust to poor initializations. Nevertheless, like traditional ICP, G-ICP still depends on computationally expensive nearest neighbor searches, which significantly impact its runtime performance [22].
Beyond ICP and its derivatives, other point-based registration approaches exist. For instance, the normal distribution transform (NDT) [26] estimates transformations by leveraging voxel-level associations instead of traditional point-wise nearest neighbor matching, leading to improved efficiency. Specifically, NDT divides the input point cloud into multiple voxels and models each voxel using a Gaussian distribution. A second point cloud is then matched against this voxelized representation by optimizing a suitable cost function. While NDT offers faster computation compared to ICP, its accuracy is highly sensitive to the voxel resolution, which must be carefully tuned based on the sensor and environment. Furthermore, NDT requires a relatively accurate initial pose for successful convergence.
Recent years have seen significant advances in sensor fusion frameworks. FAST-LIO [27] and its successors (e.g., FAST-LIO2 [28]) demonstrate exceptional real-time performance through tightly coupled IMU-LiDAR fusion using iterated Kalman filtering on manifolds (IKFoM). These methods achieve remarkable efficiency on resource-constrained platforms but fundamentally address a different problem domain (multi-sensor state estimation) than our focus on pure LiDAR odometry.
A notable feature-based LiDAR odometry approach is LOAM [29,30], which was designed to reduce the computational load associated with ICP. LOAM extracts edge and planar features based on local smoothness in the point cloud. Unlike general feature descriptors such as FPFH [31,32,33,34] or SHOT [35,36], which extract multiple types of local descriptors, LOAM focuses only on two types of features, combining the strengths of both point-based and feature-based methods. On the one hand, it avoids using the full raw point cloud, enabling efficient registration. On the other hand, it aligns extracted features with a dense edge/plane map, performing scan-to-map rather than scan-to-scan matching. The use of Euclidean distance for feature matching helps reduce false correspondences and improves robustness. LOAM has demonstrated outstanding performance across various autonomous driving datasets. However, its accuracy is not always guaranteed across diverse scenarios. LeGO-LOAM, an extension of LOAM, refines the matching and optimization steps by using ground points to optimize the vertical component of the pose, thereby reducing vertical drift [37]. For real-time applications, both LOAM and LeGO-LOAM divide the odometry process into high-frequency scan-to-scan tracking and low-frequency scan-to-map updates. Nonetheless, LOAM’s reliance on simple edge and planar feature extraction may lead to performance degradation in scenes with complex geometric structures. Additionally, dynamic objects in the environment may disrupt feature associations, potentially resulting in inaccurate pose estimates.

2.2. LiDAR Odometry Based on Deep Learning

End-to-end LiDAR odometry aims to estimate ego-motion by leveraging deep neural networks to learn a direct mapping from raw point cloud data to relative pose transformations. Due to the unordered and irregular structure of point clouds, traditional convolutional neural networks (CNNs) are not directly applicable. To address this challenge, several methods [10,11,12,13] project 3D point clouds onto 2D representations to enable the use of conventional CNNs. For instance, Velas et al. [11] employed cylindrical projection to convert 3D LiDAR scans into three-channel 2D matrices, which are then processed by CNNs to estimate the pose of sequential scans. However, this approach formulates the odometry problem as a classification task rather than a regression problem and only estimates translational motion, failing to capture the full six degrees of freedom (6-DoF) motion accurately.
LO-Net [10] proposed a novel deep learning architecture for LiDAR-based ego-motion estimation. It extracts motion-relevant features from pairs of consecutive scans, predicts uncertainty masks to identify valid static regions, and enforces spatiotemporal geometric consistency using normal vector-based alignment. LO-Net was the first deep-learning-based LiDAR odometry framework to achieve accuracy comparable to traditional geometric methods.
Although projecting 3D data into 2D helps address point cloud disorder, it inevitably distorts the original 3D geometric structure. Performing convolutions on the resulting 2D images often leads to incorrect data associations, as convolutional kernels may blend foreground and background points, undermining the extraction of meaningful depth features. To overcome these limitations, more recent end-to-end odometry frameworks have adopted point cloud-specific feature extractors that operate directly on 3D data. Inspired by scene flow estimation, Wang et al. introduced PWCLO-Net [15], an end-to-end odometry network based on PointNet++ [38]. PWCLO-Net utilizes a coarse-to-fine hierarchical embedding strategy to progressively refine pose estimates. It builds an attention-based cost volume to associate two point clouds and extract embedded motion patterns. Moreover, a learnable embedding mask is introduced to weight local motion patterns of individual points, thereby improving global pose regression and filtering outliers.
Most existing approaches, including recent supervised methods like DSLO [19] and TransLO [16], achieve high accuracy but require ground-truth trajectories as supervision during training. These are typically acquired using high-precision inertial navigation systems that are not viable in occluded or indoor environments, limiting their applicability. In contrast, our work focuses on label-free self-supervision. To address this limitation, DeepLO [12] introduced a self-supervised loss function based on the iterative closest point (ICP) algorithm [21], enabling network training without access to ground-truth trajectories. DeepLO enforces geometric consistency between adjacent scans by aligning them using predicted poses and minimizing the residual differences between aligned point clouds. It encodes projected point clouds using a feature extractor and employs VertexNet to estimate per-point uncertainty, while PoseNet regresses the relative transformation. The self-supervised loss is computed using vertex maps and estimated normal vectors, with uncertainty-based weighting to mitigate the influence of dynamic objects.
DeLORA [13] further advances this line of work by proposing a lightweight and general self-supervised end-to-end LiDAR odometry framework. While it retains the geometric consistency-based loss from DeepLO, it omits the confidence estimation module to improve runtime efficiency. Additionally, DeLORA moves normal vector estimation to the preprocessing stage, allowing reuse across multiple training iterations and significantly reducing training time.
In summary, existing self-supervised end-to-end LiDAR odometry approaches face two major limitations: most methods, such as DeepLO and DeLORA [12,13], rely on 2D projections for convolution, which inevitably compromise the 3D topological structure of the original point cloud. Current self-supervised loss functions are primarily based on geometric consistency between adjacent frames [12,13]. However, due to the sparse nature and measurement noise of LiDAR data, even ground-truth-aligned scans cannot guarantee perfect geometric consistency. These loss functions do not explicitly model the inherent alignment errors between point clouds. To further enhance the accuracy and generalizability of end-to-end LiDAR odometry, it is imperative to develop improved self-supervised loss functions that explicitly model the intrinsic misalignment between adjacent scans.

3. Method

3.1. Problem Description

There are two point clouds captured by the LiDAR sensor at time steps k and k 1 , denoted as S k R n k × 4 and S k 1 R n k 1 × 4 , where n k and n k 1 represent the number of points collected at each respective time. Each point s i S is a four-dimensional vector [ x i , y i , z i , I i ] , where p i = { x i , y i , z i } denotes the 3D coordinates of the point s i , and I i is its intensity value. The objective of LiDAR odometry is to estimate the relative pose transformation at time t, denoted as T k 1 , k = { q k 1 , k R 4 , t k 1 , k R 3 } , which represents the transformation from the source point cloud S k to the target point cloud S k 1 . Here, t k 1 , k is the translational component and q k 1 , k is the rotational component of the pose transformation. Due to the influence of platform motion, LiDAR measurement noise, and dynamic objects in the environment, the relationship between the relative pose transformation T k 1 , k and the point clouds S k 1 , S k can be modeled by the following conditional probability density function:
p ( T k 1 , k | S k 1 , S k ) .
Assuming there exists unique and deterministic mapping from a pair of point clouds to the corresponding relative pose transformation, S k 1 , S k T k 1 , k . This chapter models such mapping using a neural network. The network approximates this deterministic function as follows: T ^ k 1 , k ( θ , S k 1 , S k ) , where θ R P represents the learnable parameters of the network, and P denotes the total number of parameters. During training, the network is optimized by minimizing a loss function L , which guides the learning process. The optimization objective can be formulated as follows:
θ * = arg min θ L T ^ k 1 , k ( θ , S k 1 , S k ) .

3.2. Algorithm Description

This chapter presents UnMinkLO-Net, a self-supervised end-to-end LiDAR odometry framework. The overall architecture and workflow of UnMinkLO-Net are illustrated in Figure 1. A pair of consecutive point clouds is first passed through a Siamese network-based feature extraction module to obtain high-dimensional point-wise features. These features are then fed into a BEV (bird’s-eye view) projection-based feature fusion module, which fuses the spatial and semantic information of both frames. The fused features are subsequently processed by a relative pose regression module, which estimates the relative transformation between the two frames. The output of the regression module is the predicted relative pose transformation: T ^ k 1 , k = { q ^ k 1 , k R 4 , t ^ k 1 , k R 3 } , where t ^ denotes the translational component represented as a 3D vector, and q ^ is the rotational component represented as a quaternion. The red dashed arrows in Figure 1 represent the gradient flow during training, which passes through the proposed self-supervised loss function based on point cloud uncertainty modeling.

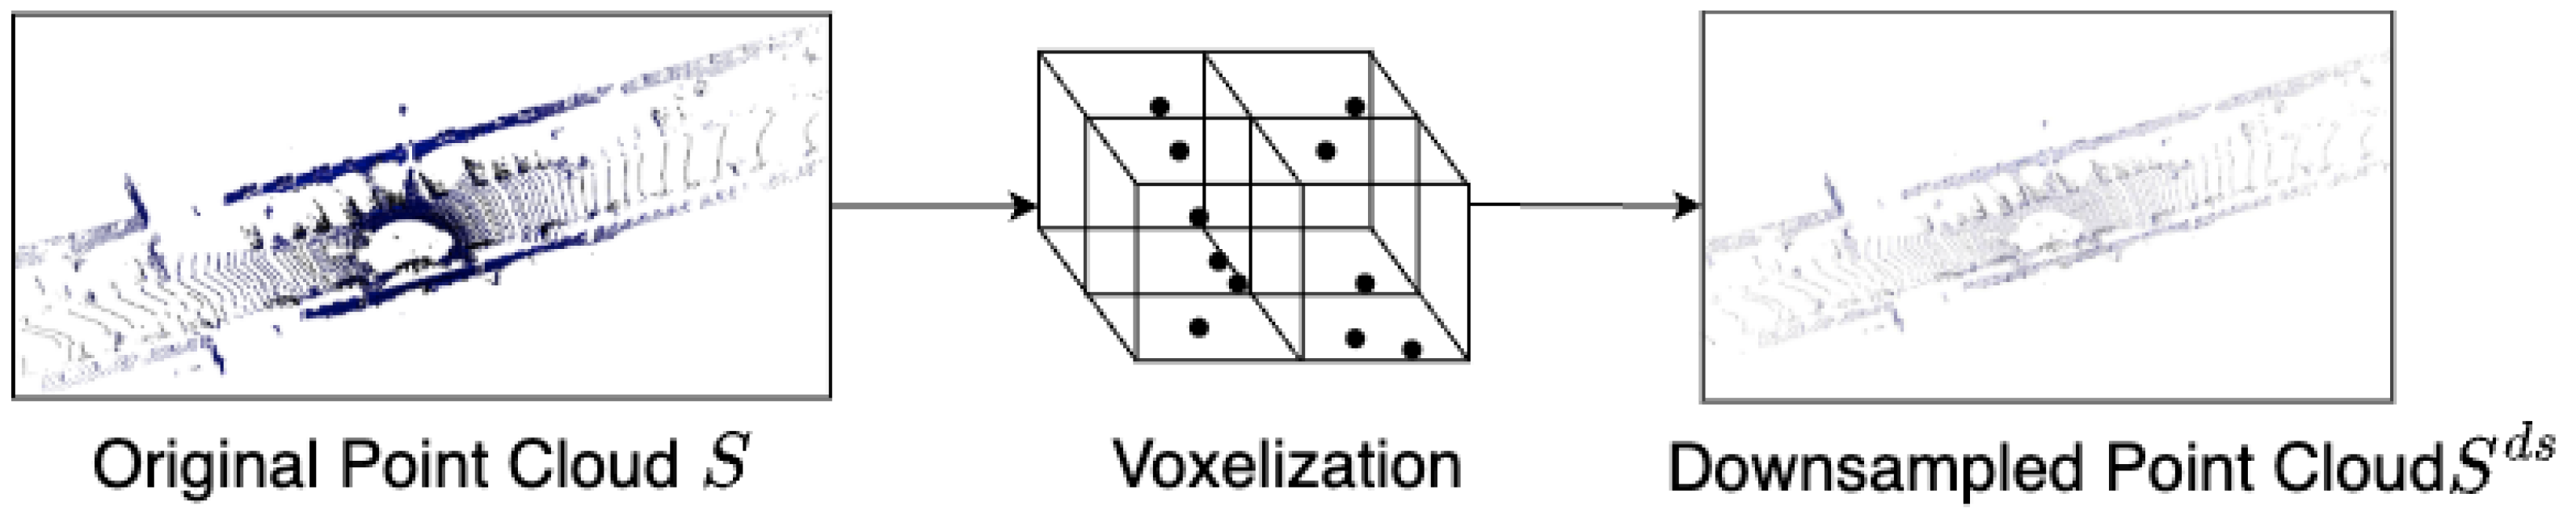
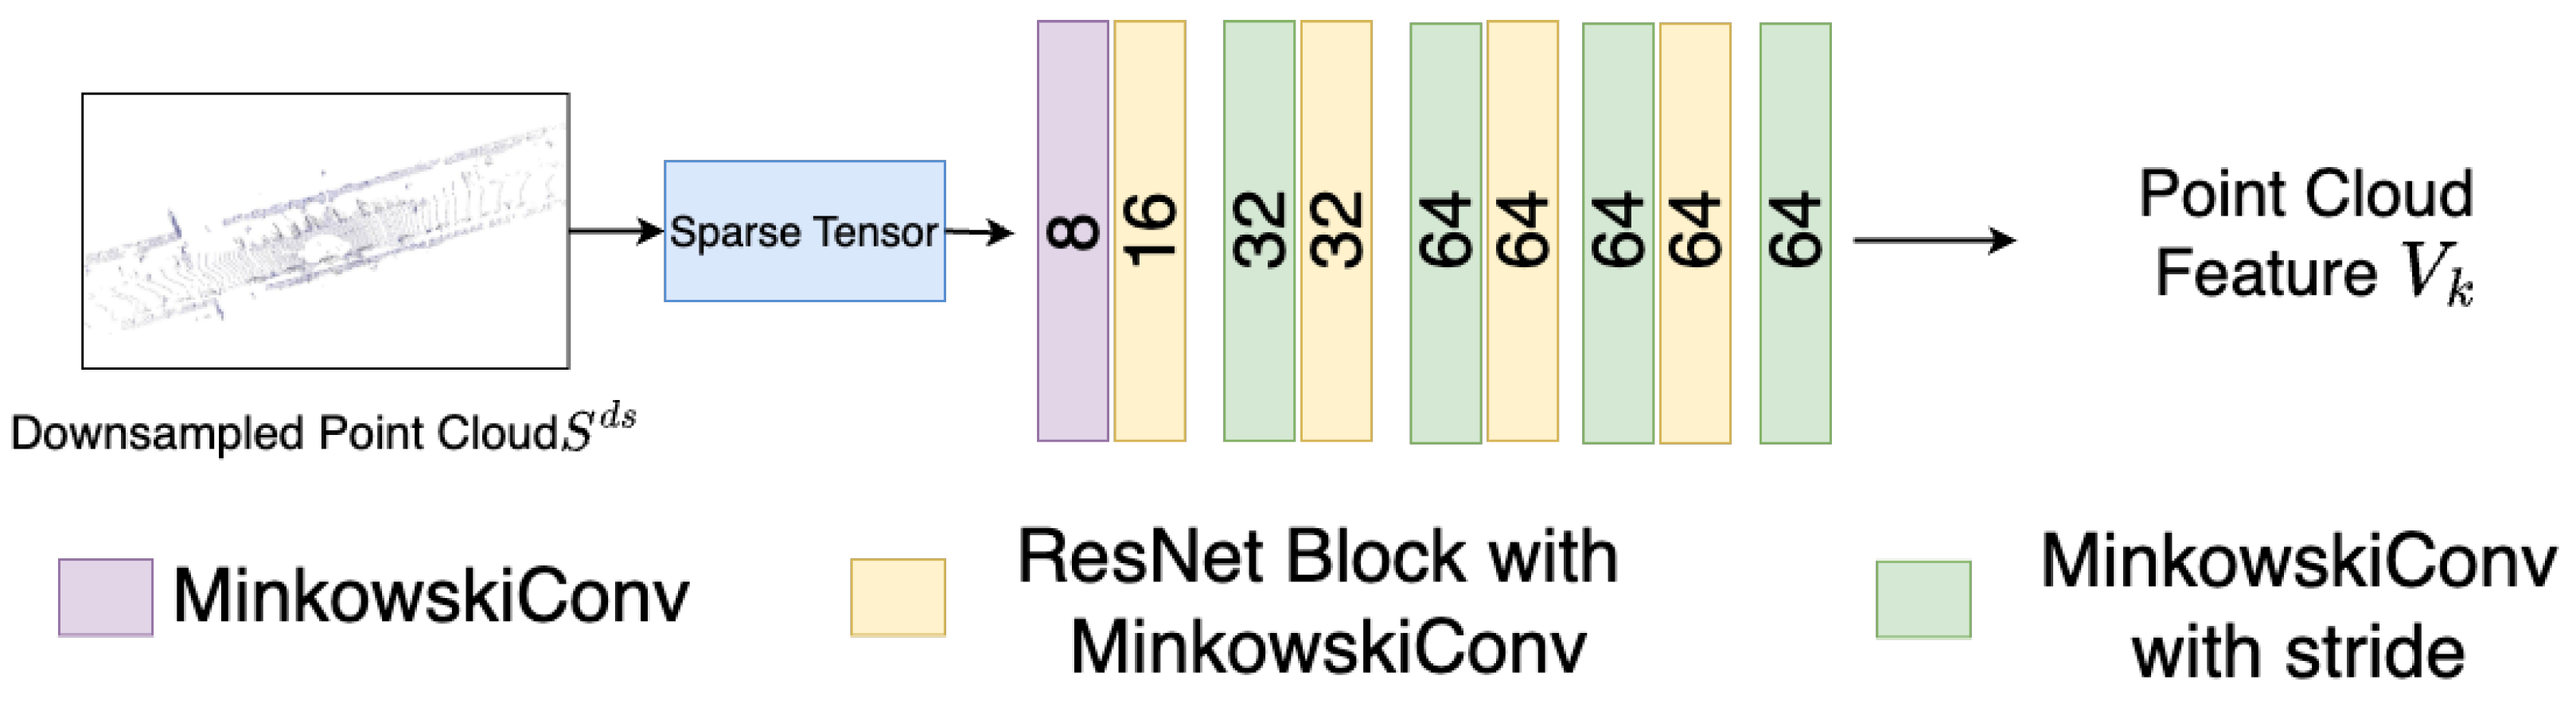
3.2.1. Point Cloud Feature Extraction

Existing LiDAR odometry methods based on cylindrical projection and 2D convolution often distort the inherent 3D topological relationships between points when projecting them onto a 2D plane, hindering the network’s ability to effectively learn 3D structural information. To overcome this limitation, we adopt 3D convolutional networks that can directly extract meaningful features from point clouds in 3D space. To fully leverage the sparsity and non-uniform distribution of LiDAR sensor data, we represent 3D point clouds using sparse tensors. Additionally, to ensure efficient feature extraction, we design a point cloud feature extraction module based on the MinkowskiEngine [39] sparse convolutional network. This module comprises two main components: point cloud voxelization and feature extraction.
(1)
Point Cloud Voxelization
Let the 3D space E have dimensions ( D , W , H ) along the x-, y-, and z-axes, respectively. We divide this space into a regular grid, where each grid cell e i is referred to as a voxel. All voxels have identical sizes, with dimensions ( v x , v y , v z ) in length, width, and height, respectively. After voxelization, the resulting grid has dimensions ( D / v x , W / v y , H / v z ) . Each point s i in the input point cloud S is then assigned to the voxel e i that contains it. Due to the inherent sparsity of LiDAR point clouds, many voxels may contain no points, while others may contain only a few. For example, when the voxel size is set to ( 10 cm , 10 cm , 20 cm ) , some voxels may contain as few as 2 to 3 points. The voxelization process produces a structured grid in which each voxel e i has a coordinate index ( e i x , e i y , e i z ) . If a voxel contains no points, it is marked as empty. If a voxel contains multiple points, we compute the arithmetic mean s ¯ i of all the points within the voxel to represent it, thereby improving computational efficiency. This process is illustrated in Figure 2. As a result, each voxel contains one representative point at most, yielding a downsampled point cloud denoted as S d s .
(2)
Feature Extraction
The feature extraction module is implemented as a weight-sharing Siamese network, where each of the two branches independently extracts features from a pair of adjacent point cloud frames. As illustrated in Figure 3, the downsampled point cloud S d s is first converted into a sparse tensor representation V . Specifically, the voxel coordinates e i of non-empty cells and the corresponding representative point s ¯ i within each voxel are extracted, where e i denotes the voxel index and s ¯ i serves as the voxel feature. This results in a sparse tensor representation of the form V = { coords Z n v × 3 , feat R n v × 4 } . A stacked sparse convolutional network is then employed to extract high-dimensional features from the sparse point cloud data. Sparse convolutions effectively capture local 3D geometric features while ignoring empty voxels, thereby improving computational efficiency. Furthermore, during the downsampling process, sparse convolutions preserve the underlying geometric structures and spatial topology, enabling multi-scale feature extraction. As a result, the network outputs the extracted features V k and V k 1 corresponding to the source point cloud S k and the target point cloud S k 1 , respectively.

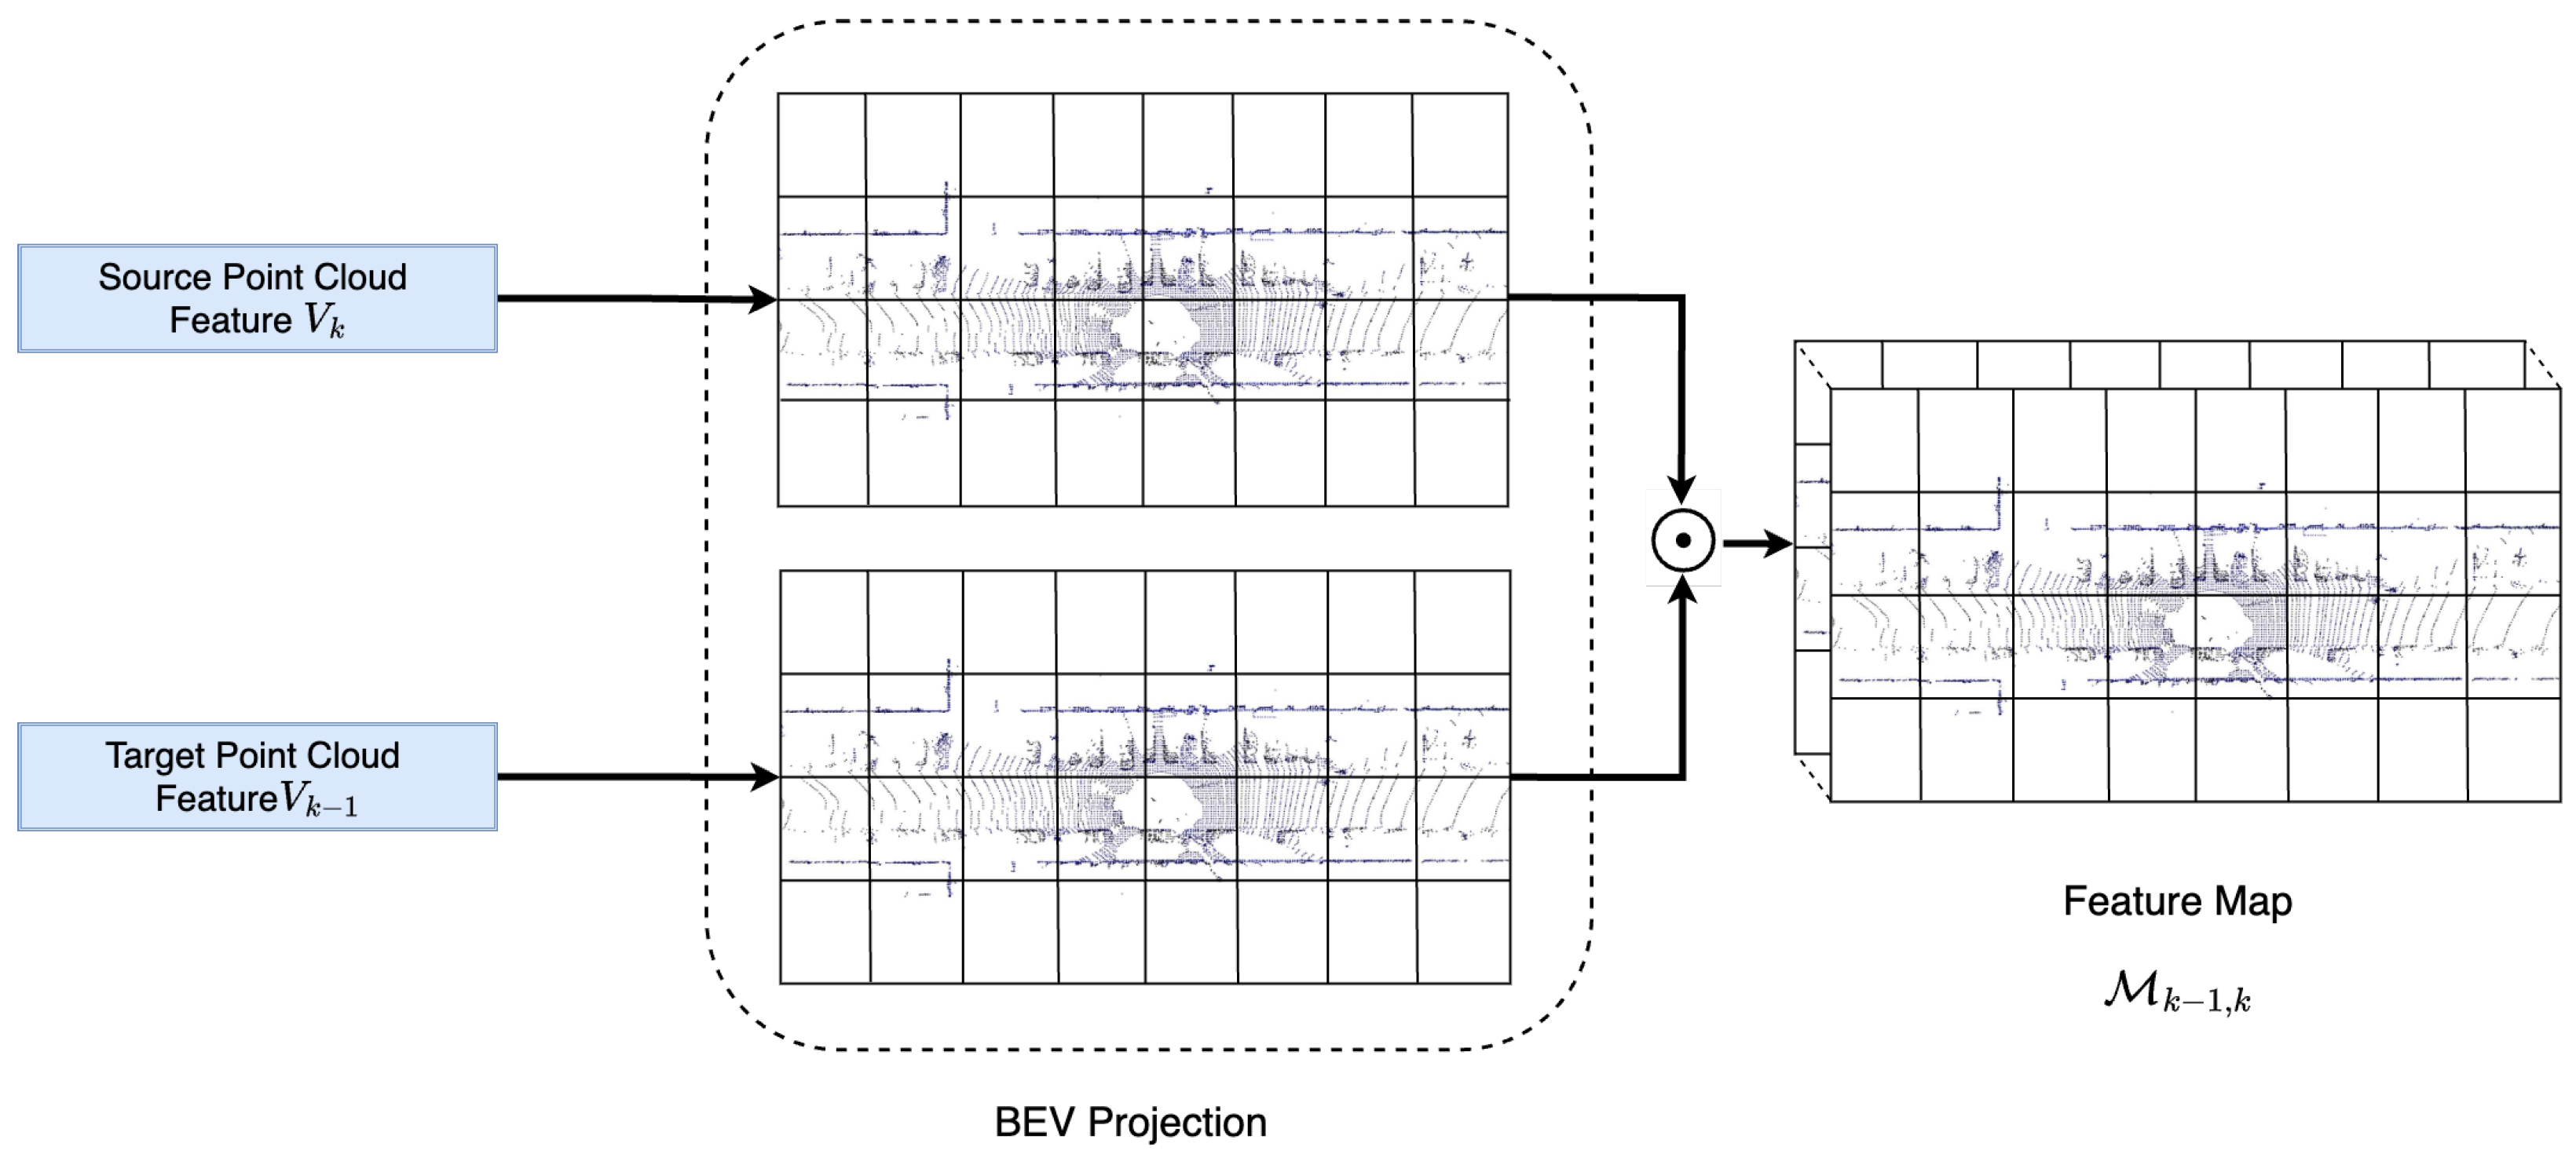
3.2.2. Point Cloud Feature Fusion

After extracting the features of the source and target point clouds, denoted as V k and V k 1 , respectively, we introduce a feature fusion module to facilitate the subsequent prediction of the relative transformation T ^ k 1 , k between adjacent frames by the pose regression network. As visualized in Figure 4, this module operates as follows: to reduce memory consumption and improve computational efficiency, the sparse voxel features V k and V k 1 are first converted into dense voxel grids, resulting in 3D feature volumes G k and G k 1 . Following the approach in [40], these 3D grids are then projected into 2D feature maps M k and M k 1 using a bird’s-eye view (BEV) projection.
Notably, this hybrid approach balances efficiency and 3D structure preservation, leveraging BEV’s strengths for feature fusion only after robust volumetric encoding, aligning with principles in VoxelNet [40] and PointPillars [41].
Finally, the projected feature maps M k and M k 1 are concatenated along the channel dimension to form the fused feature map M k 1 , k . This fused representation is a 3D tensor comprising feature channels, width, and length. Here, the spatial dimensions (width and length) correspond to the BEV-projected plane, while the channel dimension encodes both ground-level and vertical features. The first half of the channels corresponds to the source point cloud S k , and the second half to the target point cloud S k 1 .

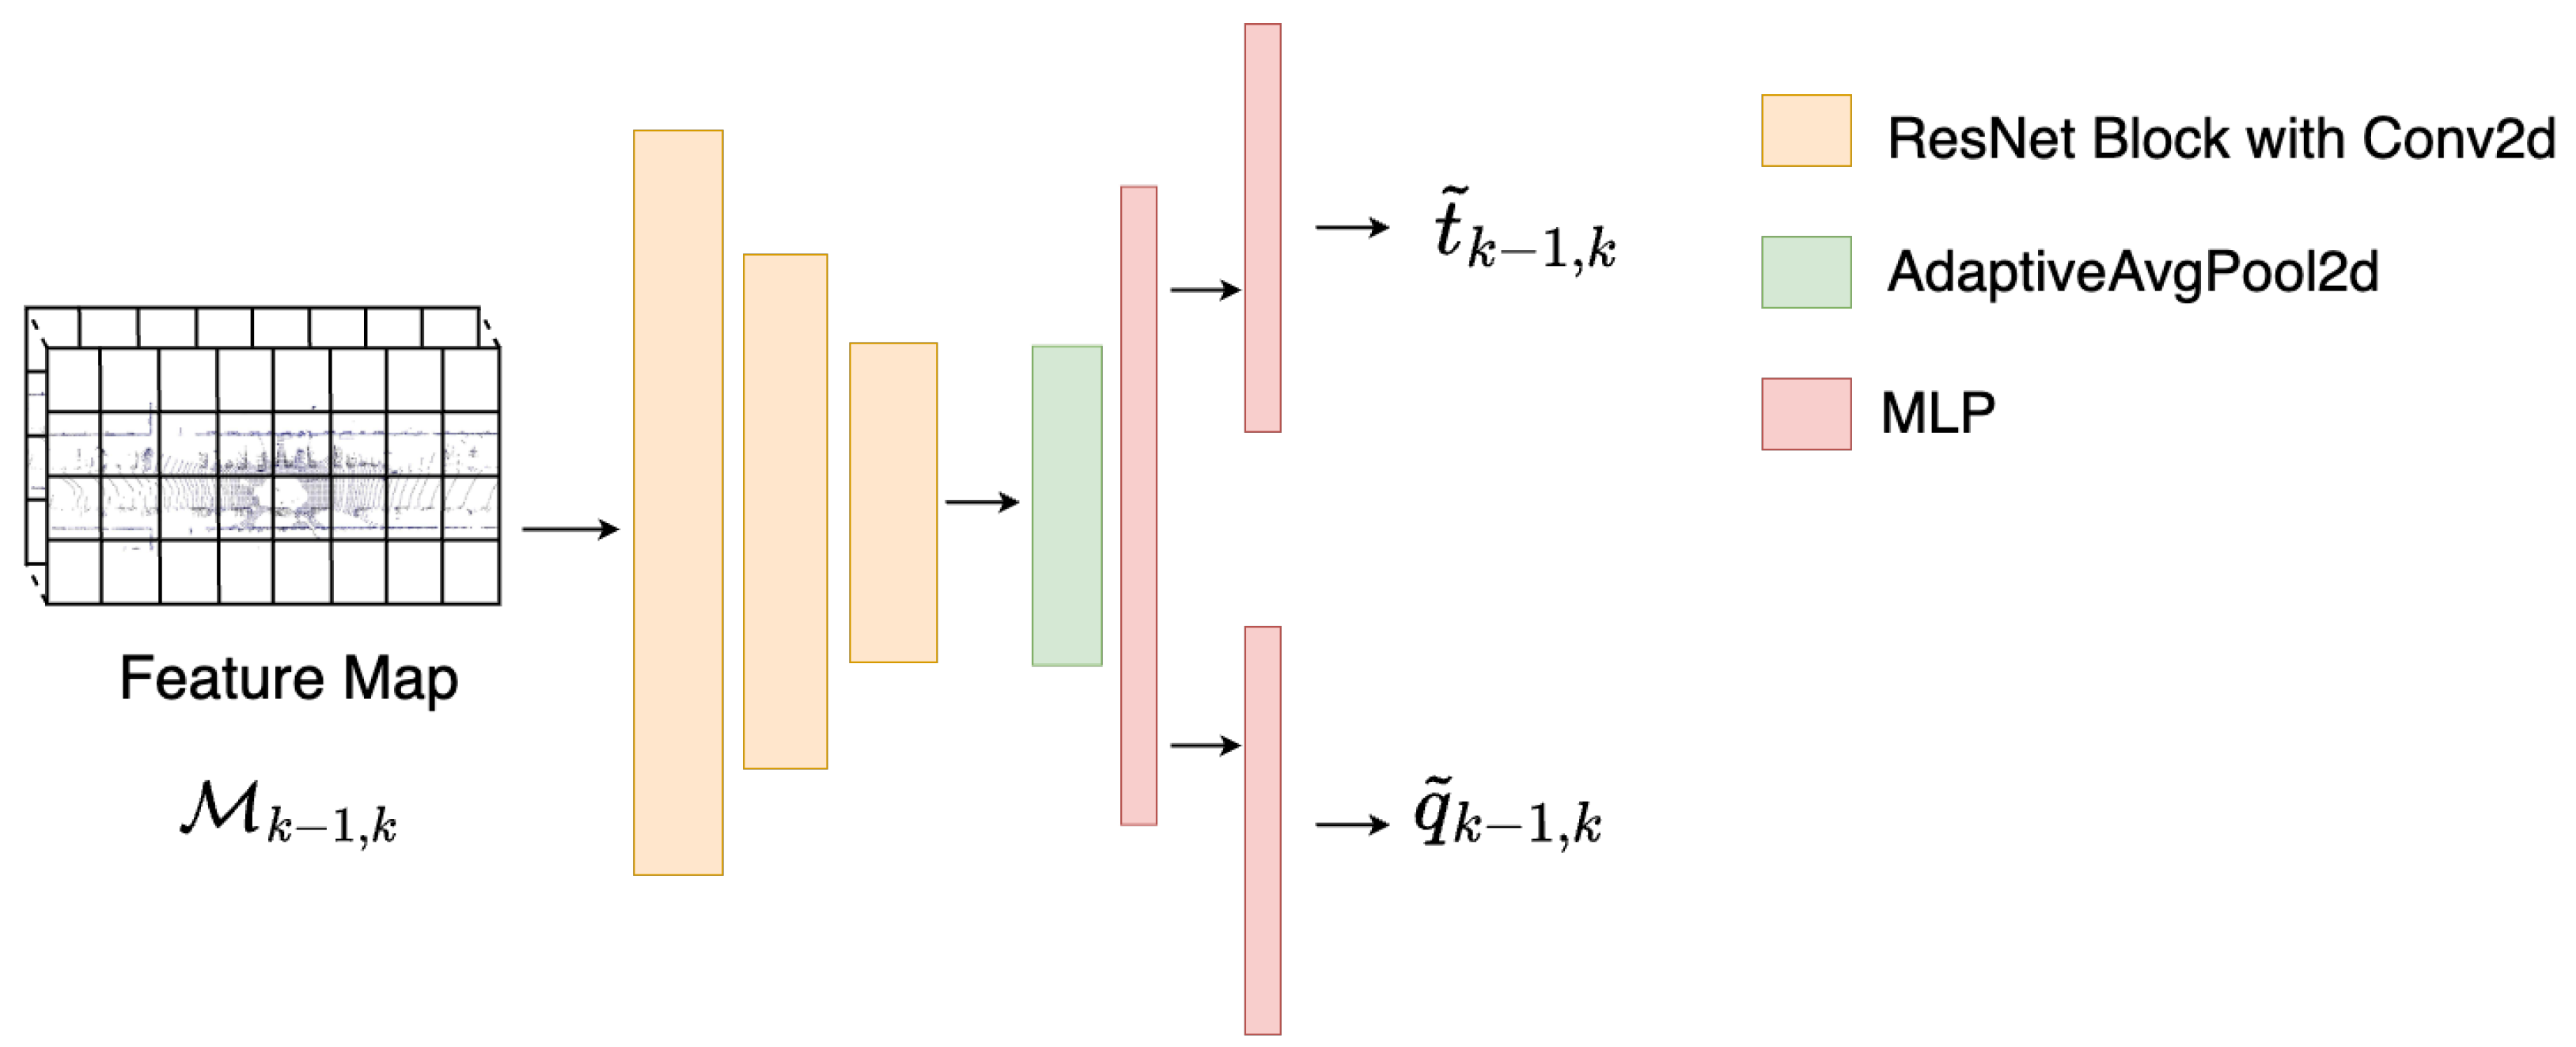
3.2.3. Relative Pose Regression

In this work, we aim to regress the relative pose transformation from the source point cloud S k to the target point cloud S k 1 based on the fused 2D feature map M k 1 , k . The feature map, which has undergone channel-wise fusion after projection, requires additional processing to extract the motion information between the two frames. To achieve this, we propose a relative pose regression module that utilizes a combination of ResNet [42] and fully connected layers. The module processes the 2D feature map F B E V and outputs the estimated pose transformation T ^ k 1 , k from S k to S k 1 . The detailed architecture of the regression module is illustrated in Figure 5. It primarily consists of several residual blocks followed by fully connected layers. First, a series of 2D convolutions is applied to the input feature map F B E V . The resulting fused features are then passed through three fully connected layers to regress the translation t ^ k 1 , k and rotation q ^ k 1 , k from the source point cloud S k to the target point cloud S k 1 . For the rotation representation, we adopt quaternions, as they provide a more compact and efficient representation compared to rotation matrices, while being mathematically equivalent. This choice has been shown to be more effective in prior work, making quaternions the ideal regression target [10] for the relative pose module.

3.2.4. Loss Function

Existing end-to-end LiDAR odometry methods based on self-supervised learning [12,13] typically use geometric consistency between adjacent frames of point clouds for self-supervised training. These methods usually transform the source point cloud using the network-predicted relative pose to align it with the target point cloud, and then compute the difference between the transformed source point cloud and the target point cloud as the loss to supervise network training. However, the sparsity of the LiDAR point clouds and measurement errors lead to incomplete geometric consistency between adjacent point clouds, and thus, this method cannot handle the inherent alignment errors of point clouds. As shown in Figure 6, the inherent alignment errors are inconsistent in direction and magnitude across different object types. Modeling the uncertainty of point clouds is key to addressing these inherent alignment errors.
To address the impact of inherent alignment errors on network performance, this chapter proposes to model the uncertainty of point clouds using a covariance matrix. Similar to DeepLO [12], we extract geometric priors without manual labels, but our approach extends this concept through PCA-based covariance estimation to explicitly model point cloud uncertainty. This enhancement significantly improves loss robustness against alignment errors. Based on this uncertainty modeling, we design a self-supervised loss function L g t consisting of a point-to-plane loss L p 2 n and a distribution-to-distribution loss L d 2 d . These two loss functions are similar to the cost functions used in model-based point cloud registration methods [23,43]. The point-to-plane and distribution-to-distribution loss functions require the normal vectors and covariance matrices of the point clouds for computation. To accelerate the training process, the normal vectors and covariance matrices are estimated only during data preprocessing and reused during the training phase.
In calculating the loss function, the network-predicted pose transformation T ^ k 1 , k is first used to transform the source point cloud S k and covariance matrix C k into the target point cloud coordinate system, resulting in the point cloud S ˜ k 1 and covariance C ˜ k 1 :
S ˜ k 1 = rot ( q ^ k 1 , k ) S k + t ^ k 1 , k ,
C ˜ k 1 = rot ( q ^ k 1 , k ) C k rot ( q ^ k 1 , k ) T .
Here, ⊙ denotes element-wise matrix multiplication. During the transformation process, only the spatial coordinates x , y , z of the point cloud are considered, while the intensity values remain unchanged. The function rot ( · ) : R 4 S O ( 3 ) represents the conversion from a quaternion to a rotation matrix. It is important to note that the transformation of the covariance matrix is influenced solely by the rotation component and is independent of translation.
To establish point correspondences between S ˜ k 1 and S k 1 , we perform a nearest neighbor search. Specifically, for each point in the transformed source point cloud S ˜ k 1 , its nearest neighbor in the target point cloud S k 1 is identified. This process is analogous to that used in the iterative closest point (ICP) algorithm. To improve computational efficiency, we employ a KD-Tree [44] to accelerate the nearest neighbor search. Furthermore, the KD-Tree is constructed during dataset preprocessing, which eliminates the need for reconstruction during each training iteration and thus significantly speeds up training. Based on the resulting point correspondences, the point-to-plane loss L p 2 n and the distribution-to-distribution loss L d 2 d are subsequently computed.
(1)
Point-to-plane loss function L p 2 n
For each point s ˜ b in the transformed source point cloud S ˜ k 1 , its nearest neighbor s b in the target point cloud S k 1 is identified using a KD-Tree. The corresponding normal vector n b , together with the point s b , defines a local plane in 3D space, with n b as the surface normal at location s b . By projecting s ˜ b onto this plane, the point-to-plane loss can be formulated as follows:
L p 2 n = 1 n k b = 1 n k ( s ˜ b s b ) · n b 2 2 .
If the normal vector n b is unavailable, the point-to-plane loss for that correspondence is omitted from the computation.
(2)
Distribution-to-Distribution Loss Function L d 2 d
For each point s ˜ b in the transformed source point cloud S ˜ k 1 , its nearest neighbor s b in the target point cloud S k 1 is identified using a KD-Tree. Let C k 1 b denote the covariance matrix corresponding to s b , and C ˜ k 1 b denote the covariance matrix associated with s ˜ b . These covariance matrices characterize the local spatial uncertainty around each point. By incorporating this uncertainty into the distance metric between corresponding points, the impact of inherent alignment errors can be effectively reduced. The distribution-to-distribution loss function L d 2 d is then formulated as follows:
L d 2 d = 1 n k b = 1 n k ( s b s ˜ b ) T C k 1 b + C ˜ k 1 b ( s b s ˜ b ) .
Ultimately, the self-supervised loss function L g t is formulated as a weighted sum of the point-to-plane loss L p 2 n and the distribution-to-distribution loss L d 2 d :
L g t = λ · L p 2 n + L d 2 d .
Since both loss terms converge independently during training, the weight λ has minimal impact on performance during testing. In practice, the weight λ is set to 2. The self-supervised loss encourages the neural network to predict a relative pose transformation T ^ k 1 , k that brings the transformed source point cloud S ˜ k 1 closer to the target point cloud S k 1 .

4. Experiments

4.1. Dataset and Preprocessing

This paper conducts experiments on the publicly available KITTI Odometry dataset [45], which provides point cloud data captured by a Velodyne HDL-64E LiDAR sensor. To facilitate training and evaluation, the dataset is preprocessed using the following steps.
(1)
Ground Truth Trajectory Transformation
The ground truth trajectories provided by the KITTI Odometry dataset are defined in the camera coordinate system, which differs from the coordinate system of the LiDAR point clouds. Therefore, the provided ground truth trajectories cannot be directly used to evaluate the performance of LiDAR-based algorithms. To address this, the ground truth trajectories must be transformed. In this work, we utilize the extrinsic calibration parameters provided by the KITTI Odometry dataset to convert the trajectories from the camera coordinate system to the LiDAR coordinate system.
T ^ k 1 , k = T C L 1 T C k 1 1 T C k T C L .
In Equation (8), T ^ k 1 , k denotes the ground truth relative pose transformation between two consecutive frames, T C L is the extrinsic calibration matrix from the LiDAR coordinate system to the camera coordinate system, and T C k 1 1 T C k represents the ground truth poses of two successive camera frames.
(2)
Normal Vector and Covariance Calculation
To facilitate the computation of the self-supervised loss during training, covariance matrices and normal vectors for each point cloud frame are precomputed during the data preprocessing stage. The covariance matrix for a given point s is calculated based on its neighboring points. Specifically, the five nearest neighbors of s within the point cloud are identified to compute the covariance matrix. A KD-Tree structure is employed to efficiently accelerate the nearest neighbor search process. The covariance matrix is computed as follows:  
s ¯ = 1 N i = 1 N s i ,
C = 1 N i = 1 N ( s i s ¯ ) · ( s i s ¯ ) T .
Here, N = 5 . Once the covariance matrix is computed, eigenvalue decomposition is applied, and the eigenvector associated with the smallest eigenvalue is selected as the normal vector n for the point s.
(3)
Data Augmentation
To prevent the network from overfitting, random rotations are applied to augment the point cloud data. Specifically, random values following a Gaussian distribution with a mean of 0 are generated for the yaw angle. These values are then converted into a rotation matrix R a u g representing a random rotation around the Z-axis. The random rotation R a u g is subsequently applied to the source point cloud S k and the associated covariance matrices C k .  
S k aug = R aug S k ,
C k aug = R aug C k R aug T .

4.2. Implementation Details

The proposed odometry network is trained in a self-supervised, end-to-end fashion, as illustrated in Figure 1. The weights of the point cloud feature extraction network are shared across inputs. The entire network is implemented in PyTorch 1.8 within a Linux environment, with training and inference performed on an NVIDIA GeForce RTX 3090 GPU. Each point cloud frame from the KITTI dataset is first cropped to include only points within a spatial range of 140.8 m in length, 76.8 m in width, and 8 m in height. The resulting 3D region is voxelized using voxel sizes of (0.1 m, 0.1 m, and 0.2 m). Prior to training, covariance matrices and normal vectors for the input point clouds are computed using the method outlined in Section 4.1. During training, only the transformation of these precomputed normals and covariances is performed, allowing the reuse of a single computation multiple times and thereby significantly improving training efficiency. To speed up nearest neighbor searches in the self-supervised loss computation, KD-Trees are constructed for all point clouds in the dataset before training begins. The network employs the leaky_relu activation function and is optimized using the Adam optimizer, with an initial learning rate of 0.001 that decays exponentially. The training batch size is set to 16, and the model is trained for 100 epochs. The hyperparameter λ in the self-supervised loss function L g t of UnMinkLO-Net is set to 2.0. Additionally, the data augmentation technique described in Section 4.1 is applied throughout training.

4.3. Evaluation Metrics and Comparison Methods

As illustrated in Figure 1, during the testing phase, UnMinkLO-Net does not compute the self-supervised loss. Instead, it directly outputs the relative pose transformations predicted by the network as the odometry result. This chapter employs evaluation metrics consistent with those used in the KITTI Odometry benchmark [46] as the primary criteria. These metrics measure the translational and rotational errors between the estimated odometry trajectory and the ground truth. For all evaluation data, subsequences are segmented at intervals of 100 m (i.e., 100, 200,..., 800 m). The root mean square errors (RMSEs) of translation and rotation are then calculated for each subsequence. Finally, the average errors across all subsequences are computed to obtain the average translational error t r e l and average rotational error r r e l . The average translational error is expressed as a percentage (%), where a 1% error indicates that when the robot travels 100 m, the estimated trajectory deviates by 1 m in translation from the ground truth. The average rotational error is expressed in degrees per 100 m (°/100 m), where an error of 1 / 100 m means the estimated rotation deviates by 1 degree from the ground truth rotation over a 100 m distance.
This study conducts experiments on sequences 00–10 of the KITTI Odometry dataset, which contain ground truth poses. For fair comparison, the sequence splitting strategy used in references [12,13] is adopted, where sequences 00–08 serve as training data and sequences 09–10 are used for testing to evaluate odometry performance. The proposed method is primarily compared against existing odometry approaches based on point cloud registration and deep learning. For point cloud registration methods, this chapter compares ICP point-to-point (ICP-po2po) [47], ICP point-to-plane (ICP-po2pl) [43], and NDT point-to-distribution (NDT-P2D) [26]. For deep learning-based methods, the comparisons include DeLORA [13] and DeepLO [12], along with image-based deep learning methods such as SfMLearner [48], UnDeepVO [49], and Zhu [50]. Among these, the self-supervised end-to-end methods DeLORA and DeepLO are used as baseline methods in the comparative experiments. ICP-po2po, ICP-po2pl, and NDT-P2D are implemented using the Point Cloud Library (PCL) [51]. For DeepLO, Zhu, UnDeepVO, and SfMLearner, due to the absence of open-source code, their experimental results reported in the respective papers are directly used. Experimental results for DeLORA are obtained using the author-provided code and pretrained network weights. Since the aim of this work is to compare the accuracy of directly estimating relative pose transformations between point clouds across different odometry algorithms, none of the methods in the experiments employ loop closure detection or pose graph optimization.

4.4. Experimental Results

Table 1 summarizes the experimental results of various methods on the KITTI dataset. Figure 7 depicts the trajectories of ICP-po2pl, DeLORA, UnMinkLO-Net, and the ground truth on the test sequences. Figure 8 presents the trajectory projections from three different viewing angles. Figure 9 illustrates the average translational and rotational errors of ICP-po2pl, DeLORA, and UnMinkLO-Net across different driving speeds and trajectory intervals. As shown in Table 1, the self-supervised odometry method UnMinkLO-Net proposed in this chapter substantially outperforms all compared methods in trajectory estimation accuracy.
Specifically, compared to the benchmark method DeLORA, which leverages 2D convolutions and a geometric consistency loss, the proposed method reduces translational and rotational errors by 25% and 50%, respectively, on the test sequences. Relative to the benchmark DeepLO, the proposed method achieves reductions of approximately 5% and 30% in translational and rotational errors, respectively. Moreover, when compared to self-supervised visual odometry methods (SfMLearner and UnDeepVO) and classical point cloud registration techniques (ICP-po2po, ICP-po2pl, and NDT-P2D), the proposed approach consistently demonstrates significantly lower translational and rotational errors.
As shown in Figure 7 and Figure 8, compared with the learning-based DeLORA method and the registration-based ICP-po2pl method, the proposed UnMinkLO-Net achieves smaller vertical and rotational deviations in trajectory estimation. As illustrated in Figure 9, under varying driving speeds and trajectory distances, UnMinkLO-Net consistently exhibits the lowest translational and rotational errors among all compared methods. These quantitative comparisons and visualizations effectively demonstrate the superiority of the proposed method. Furthermore, the results confirm that the uncertainty-based self-supervised loss function and the 3D sparse convolution-based feature extraction module introduced in this chapter can significantly reduce trajectory estimation errors in self-supervised end-to-end odometry.

5. Discussion

5.1. Ablation Study

To investigate the contributions of the uncertainty-based loss function L g t introduced in Section 3.2.4 and the 3D sparse convolution-based point cloud feature extraction module described in Section 3.2.1, this experiment combines different loss functions and point cloud processing strategies to train and evaluate UnMinkLO-Net on the KITTI dataset. First, we replace the uncertainty-based loss function in UnMinkLO-Net with the geometric consistency-based loss function L c d , as proposed in DeLORA [13] and DeepLO [12], and conduct experiments. Next, we substitute the 3D sparse convolution-based feature extraction module with the projection-based 2D convolutional feature extractor used in DeLORA and DeepLO.The experimental results are summarized in Table 2. As shown, only when both the uncertainty-based loss function L g t and the 3D sparse convolution-based point cloud feature extraction module are used does UnMinkLO-Net achieve optimal performance. This demonstrates the importance and effectiveness of these two components in improving the odometry accuracy of the proposed method.

5.2. Runtime Analysis

Since navigation tasks in mobile robotics and autonomous driving typically impose high demands on the real-time performance of odometry, this chapter analyzes the runtime of the proposed UnMinkLO-Net. Commonly used multi-line LiDAR sensors acquire point cloud data at a rate of 10 frames per second, meaning that an odometry method with an average runtime of less than 0.1 s per frame can meet real-time requirements. During the inference phase, loss functions are not computed, and the nearest neighbor search used during training introduces no additional computational overhead. The detailed runtime statistics of different comparison methods are presented in Table 3.
All methods are evaluated on the same computing platform to ensure fairness. As shown in the table, the average runtime of UnMinkLO-Net on the KITTI dataset is 49 ms per frame. Compared with classical point cloud registration methods such as ICP-po2po, ICP-po2pl, and NDT-P2D, the proposed method achieves a significant reduction in computational time while maintaining higher pose estimation accuracy. In addition, compared with the deep learning-based self-supervised LiDAR odometry.

6. Conclusions

This study proposes an end-to-end odometry network named UnMinkLO-Net, based on self-supervised learning. The network is capable of directly estimating the robot’s pose from LiDAR data without requiring any ground truth or annotations. The proposed odometry network mainly consists of three modules: point cloud feature extraction, bird’s-eye view (BEV)-based feature fusion, and relative pose regression.UnMinkLO-Net addresses the inherent alignment errors between consecutive point clouds by modeling uncertainty through covariance matrices. Compared with feature extraction modules based on point cloud projection and 2D convolution, the 3D sparse convolution-based module can more effectively encode the 3D geometric structure of the point cloud.
Experimental evaluations demonstrate that UnMinkLO-Net significantly improves odometry accuracy over relevant baselines, effectively overcoming limitations of existing approaches. The framework concurrently achieves high pose estimation accuracy while maintaining computational efficiency, highlighting its practical viability. While this study validates UnMinkLO-Net’s core design under standard evaluation settings, several avenues for future work remain: (1) performance validation with low-cost LiDAR sensors (e.g., 16-beam configurations); (2) robustness testing under adverse weather conditions, such as precipitation and fog; (3) assessment of generalization capabilities in diverse environments, including non-urban settings and indoor navigation scenarios. Investigating these aspects will further enhance the applicability and resilience of the proposed approach.

Author Contributions

Conceptualization, S.C., Z.W., and W.L.; methodology, S.C., Z.W., C.H., and W.L.; software, S.C., Z.W., C.H., and Y.S.; validation, C.H., Y.S., and H.J.; formal analysis, S.C., Z.W., Y.S., and H.J.; investigation, S.C., C.H., and Y.S.; resources, S.C. and W.L.; data curation, S.C., Z.W., and C.H.; writing—original draft preparation, S.C., Z.W., C.H., and Y.S.; writing—review and editing, S.C., Z.W., H.J., and W.L.; visualization, S.C., C.H., and Y.S.; supervision, Z.W. and W.L.; project administration, S.C. and W.L.; funding acquisition, S.C. and W.L. All authors have read and agreed to the published version of the manuscript.

Funding

This research was funded by the Natural Science Foundation of Xiamen of China under grant numbers 3502Z202474005 and 3502Z202472018; the National Natural Science Foundation of China under grant number 62401225; the Fujian Provincial Natural Science Foundation of China under grant number 2024J01115; the Jimei University Scientific Research Start-up Funding Project under grant number ZQ2024034.

Data Availability Statement

The original contributions presented in this study are included in the article. Further inquiries can be directed to the corresponding author.

Conflicts of Interest

The authors declare no conflicts of interest.

References

  1. Hsu, L.T. Analysis and modeling GPS NLOS effect in highly urbanized area. GPS Solut. 2018, 22, 7. [Google Scholar] [CrossRef]
  2. Wen, W.W.; Zhang, G.; Hsu, L.T. GNSS NLOS exclusion based on dynamic object detection using LiDAR point cloud. IEEE Trans. Intell. Transp. Syst. 2019, 22, 853–862. [Google Scholar] [CrossRef]
  3. Hsu, L.T.; Gu, Y.; Kamijo, S. NLOS correction/exclusion for GNSS measurement using RAIM and city building models. Sensors 2015, 15, 17329–17349. [Google Scholar] [CrossRef]
  4. Wen, W.; Zhang, G.; Hsu, L.T. Correcting NLOS by 3D LiDAR and building height to improve GNSS single point positioning. Navigation 2019, 66, 705–718. [Google Scholar] [CrossRef]
  5. Luo, H.; Mi, X.; Yang, Y.; Chen, W.; Weng, D. Multiepoch Grid-Based 3DMA Positioning in Dense Urban Canyons by Optimizing Reflection Modeling. IEEE Trans. Instrum. Meas. 2025, 74, 8503213. [Google Scholar] [CrossRef]
  6. Liu, J.; Deng, Z.; Hu, E. An NLOS Ranging Error Mitigation Method for 5G Positioning in Indoor Environments. Appl. Sci. 2024, 14, 3830. [Google Scholar] [CrossRef]
  7. Zhang, X.; Wang, X.; Liu, W.; Tao, X.; Gu, Y.; Jia, H.; Zhang, C. A reliable NLOS error identification method based on LightGBM driven by multiple features of GNSS signals. Satell. Navig. 2024, 5, 31. [Google Scholar] [CrossRef]
  8. Jia, S.; Xu, X.; Chen, Z.; Jiao, Y.; Huang, H.; Wang, Y.; Xiong, R. A Visual-Inertial Perception System for Autonomous Mars Rover Missions. J. Space Control Technol. Appl. 2022, 47, 41–51. [Google Scholar]
  9. Gong, Z. Research on Semantic Segmentation and Object Detection Methods for Indoor Scenes Based on LiDAR Backpack Point Clouds. Ph.D. Thesis, Xiamen University, Xiamen, China, 2019. [Google Scholar]
  10. Li, Q.; Chen, S.; Wang, C.; Li, X.; Wen, C.; Cheng, M.; Li, J. Lo-net: Deep real-time lidar odometry. In Proceedings of the IEEE/CVF Conference on Computer Vision and Pattern Recognition, Long Beach, CA, USA, 15–20 June 2019; pp. 8473–8482. [Google Scholar]
  11. Velas, M.; Spanel, M.; Hradis, M.; Herout, A. CNN for IMU assisted odometry estimation using velodyne LiDAR. In Proceedings of the 2018 IEEE International Conference on Autonomous Robot Systems and Competitions (ICARSC), Torres Vedras, Portugal, 25–27 April 2018; pp. 71–77. [Google Scholar]
  12. Cho, Y.; Kim, G.; Kim, A. Unsupervised geometry-aware deep lidar odometry. In Proceedings of the 2020 IEEE International Conference on Robotics and Automation (ICRA), Paris, France, 31 May–31 August 2020; pp. 2145–2152. [Google Scholar]
  13. Nubert, J.; Khattak, S.; Hutter, M. Self-supervised learning of lidar odometry for robotic applications. In Proceedings of the 2021 IEEE International Conference on Robotics and Automation (ICRA), Xi’an, China, 30 May–5 June 2021; pp. 9601–9607. [Google Scholar]
  14. Li, Z.; Wang, N. Dmlo: Deep matching lidar odometry. In Proceedings of the 2020 IEEE/RSJ International Conference on Intelligent Robots and Systems (Iros), Las Vegas, NV, USA, 24 October 2020–24 January 2021; pp. 6010–6017. [Google Scholar]
  15. Wang, G.; Wu, X.; Liu, Z.; Wang, H. Pwclo-net: Deep lidar odometry in 3d point clouds using hierarchical embedding mask optimization. In Proceedings of the IEEE/CVF Conference on Computer Vision and Pattern Recognition, Nashville, TN, USA, 20–25 June 2021; pp. 15910–15919. [Google Scholar]
  16. Liu, J.; Wang, G.; Jiang, C.; Liu, Z.; Wang, H. TransLO: A Window-Based Masked Point Transformer Framework for Large-Scale LiDAR Odometry. In Proceedings of the 37th AAAI Conference on Artificial Intelligence, Washington DC, USA, 7–14 February 2023. [Google Scholar]
  17. Alam, P.; Pachamuthu, R. LiDAR-OdomNet: LiDAR Odometry Network Using Feature Fusion Based on Attention. In Proceedings of the 2024 IEEE 100th Vehicular Technology Conference (VTC2024-Fall), Washington, DC, USA, 7–10 October 2024; pp. 1–5. [Google Scholar]
  18. Pan, Y.; Zhong, X.; Wiesmann, L.; Posewsky, T.; Behley, J.; Stachniss, C. PIN-SLAM: LiDAR SLAM Using a Point-Based Implicit Neural Representation for Achieving Global Map Consistency. IEEE Trans. Robot. 2024, 40, 4045–4064. [Google Scholar] [CrossRef]
  19. Zhang, H.; Wang, G.; Wu, X.; Xu, C.; Ding, M.; Tomizuka, M.; Zhan, W.; Wang, H. DSLO: Deep Sequence LiDAR Odometry Based on Inconsistent Spatio-temporal Propagation. In Proceedings of the 2024 IEEE/RSJ International Conference on Intelligent Robots and Systems (IROS), Abu Dhabi, United Arab Emirates, 14–18 October 2024; pp. 10672–10677. [Google Scholar]
  20. Zheng, Y.; Wang, G.; Liu, J.; Pollefeys, M.; Wang, H. Spherical Frustum Sparse Convolution Network for LiDAR Point Cloud Semantic Segmentation. arXiv 2023, arXiv:2311.17491. [Google Scholar] [CrossRef]
  21. Besl, P.J.; McKay, N.D. Method for registration of 3-D shapes. In Proceedings of the Sensor fusion IV: Control paradigms and data structures, Boston, MA, USA, 12–15 November 1991; SPIE: Bellingham, WA, USA, 1992; Volume 1611, pp. 586–606. [Google Scholar]
  22. Pomerleau, F.; Colas, F.; Siegwart, R.; Magnenat, S. Comparing ICP variants on real-world data sets: Open-source library and experimental protocol. Auton. Robot. 2013, 34, 133–148. [Google Scholar] [CrossRef]
  23. Segal, A.; Haehnel, D.; Thrun, S. Generalized-icp. In Proceedings of the Robotics: Science and Systems, Seattle, WA, USA, 28 June–1 July 2009; Volume 2, p. 435. [Google Scholar]
  24. Moon, Y.; Hong, J.; Park, C.; Han, S. Faster GICP with Voxel-Based Computation: Dynamic voxel size refinement for Enhanced Accuracy. In Proceedings of the 2024 24th International Conference on Control, Automation and Systems (ICCAS), Jeju, Republic of Korea, 29 October–1 November 2024; pp. 493–498. [Google Scholar]
  25. Yu, Z.; Yuan, W.; Zhao, H.; Zhuang, H.; Yang, M. GOGICP: A Real-time Gaussian Octree-based GICP Method for Faster Point Cloud Registration. In Proceedings of the 2024 IEEE International Conference on Real-time Computing and Robotics (RCAR), Alesund, Norway, 24–28 June 2024; pp. 112–117. [Google Scholar]
  26. Stoyanov, T.; Magnusson, M.; Andreasson, H.; Lilienthal, A.J. Fast and accurate scan registration through minimization of the distance between compact 3D NDT representations. Int. J. Robot. Res. 2012, 31, 1377–1393. [Google Scholar] [CrossRef]
  27. Xu, W.; Zhang, F. FAST-LIO: A Fast, Robust LiDAR-Inertial Odometry Package by Tightly-Coupled Iterated Kalman Filter. IEEE Robot. Autom. Lett. 2020, 6, 3317–3324. [Google Scholar] [CrossRef]
  28. Xu, W.; Cai, Y.; He, D.; Lin, J.; Zhang, F. Fast-lio2: Fast direct lidar-inertial odometry. IEEE Trans. Robot. 2022, 38, 2053–2073. [Google Scholar] [CrossRef]
  29. Zhang, J.; Singh, S. LOAM: Lidar odometry and mapping in real-time. In Proceedings of the Robotics: Science and Systems, Berkeley, CA, USA, 15–19 July 2014; Volume 2, pp. 1–9. [Google Scholar]
  30. Wang, H.; Wang, C.; Chen, C.L.; Xie, L. F-LOAM: Fast LiDAR Odometry and Mapping. In Proceedings of the 2021 IEEE/RSJ International Conference on Intelligent Robots and Systems (IROS), Prague, Czech Republic, 27 September–1 October 2021; pp. 4390–4396. [Google Scholar]
  31. Rusu, R.B.; Blodow, N.; Beetz, M. Fast point feature histograms (FPFH) for 3D registration. In Proceedings of the 2009 IEEE International Conference on Robotics and Automation, Kobe, Japan, 12–17 May 2009; pp. 3212–3217. [Google Scholar]
  32. Szalai-Gindl, J.M.; Varga, D. FPFH Revisited: Histogram Resolutions, Improved Features, and Novel Representation. IEEE Access 2024, 12, 67325–67354. [Google Scholar] [CrossRef]
  33. Lian, Z.; Wang, X.; Lin, J.; Zhang, L.; Tang, M. Second-order Spatial Measures Low Overlap Rate Point Cloud Registration Algorithm Based On FPFH Features. AI Commun. 2024, 37, 599–617. [Google Scholar] [CrossRef]
  34. Pan, J.; Zhang, X. Research on 3D point cloud registration algorithm based on FPFH and ColorICP. In Proceedings of the International Conference on Optical and Photonic Engineering, Foshan, China, 15–18 November 2024. [Google Scholar]
  35. Salti, S.; Tombari, F.; Di Stefano, L. SHOT: Unique signatures of histograms for surface and texture description. Comput. Vis. Image Underst. 2014, 125, 251–264. [Google Scholar] [CrossRef]
  36. Liu, S.; Wang, H.; Yan, D.M.; Li, Q.; Luo, F.; Teng, Z.; Liu, X. Spectral Descriptors for 3D Deformable Shape Matching: A Comparative Survey. IEEE Trans. Vis. Comput. Graph. 2024, 31, 1677–1697. [Google Scholar] [CrossRef]
  37. Rusu, R.B.; Blodow, N.; Marton, Z.C.; Beetz, M. Aligning point cloud views using persistent feature histograms. In Proceedings of the 2008 IEEE/RSJ International Conference on Intelligent Robots and Systems, Nice, France, 22–26 September 2008; pp. 3384–3391. [Google Scholar]
  38. Qi, C.R.; Yi, L.; Su, H.; Guibas, L.J. Pointnet++: Deep hierarchical feature learning on point sets in a metric space. In Proceedings of the 31st Conferenc on Neural Information Processing Systems (NIPS 2017), Long Beach, CA, USA, 4–9 December 2017; Volume 30. [Google Scholar]
  39. Choy, C.; Gwak, J.; Savarese, S. 4d spatio-temporal convnets: Minkowski convolutional neural networks. In Proceedings of the IEEE/CVF Conference on Computer Vision and Pattern Recognition, Long Beach, CA, USA, 15–20 June 2019; pp. 3075–3084. [Google Scholar]
  40. Zhou, Y.; Tuzel, O. Voxelnet: End-to-end learning for point cloud based 3d object detection. In Proceedings of the IEEE Conference on Computer Vision and Pattern Recognition, Salt Lake City, UT, USA, 18–23 June 2018; pp. 4490–4499. [Google Scholar]
  41. Lang, A.H.; Vora, S.; Caesar, H.; Zhou, L.; Yang, J.; Beijbom, O. PointPillars: Fast Encoders for Object Detection From Point Clouds. In Proceedings of the IEEE/CVF Conference on Computer Vision and Pattern Recognition (CVPR), Long Beach, CA, USA, 15–20 June 2019. [Google Scholar]
  42. He, K.; Zhang, X.; Ren, S.; Sun, J. Deep residual learning for image recognition. In Proceedings of the IEEE Conference on Computer Vision and Pattern Recognition, Las Vegas, NV, USA, 27–30 June 2016; pp. 770–778. [Google Scholar]
  43. Chen, Y.; Medioni, G. Object modelling by registration of multiple range images. Image Vis. Comput. 1992, 10, 145–155. [Google Scholar] [CrossRef]
  44. Bentley, J.L. Multidimensional binary search trees used for associative searching. Commun. ACM 1975, 18, 509–517. [Google Scholar] [CrossRef]
  45. Geiger, A.; Lenz, P.; Stiller, C.; Urtasun, R. Vision meets robotics: The kitti dataset. Int. J. Robot. Res. 2013, 32, 1231–1237. [Google Scholar] [CrossRef]
  46. Geiger, A.; Lenz, P.; Urtasun, R. Are we ready for autonomous driving? The kitti vision benchmark suite. In Proceedings of the 2012 IEEE Conference on Computer Vision and Pattern Recognition, Providence, RI, USA, 16–21 June 2012; pp. 3354–3361. [Google Scholar]
  47. Arun, K.S.; Huang, T.S.; Blostein, S.D. Least-squares fitting of two 3-D point sets. IEEE Trans. Pattern Anal. Mach. Intell. 1987, PAMI-9, 698–700. [Google Scholar] [CrossRef] [PubMed]
  48. Zhou, T.; Brown, M.; Snavely, N.; Lowe, D.G. Unsupervised learning of depth and ego-motion from video. In Proceedings of the IEEE Conference on Computer Vision and Pattern Recognition, Honolulu, HI, USA, 21–26 July 2017; pp. 1851–1858. [Google Scholar]
  49. Li, R.; Wang, S.; Long, Z.; Gu, D. Undeepvo: Monocular visual odometry through unsupervised deep learning. In Proceedings of the 2018 IEEE International Conference on Robotics and Automation (ICRA), Brisbane, Australia, 21–25 May 2018; pp. 7286–7291. [Google Scholar]
  50. Zhu, A.Z.; Liu, W.; Wang, Z.; Kumar, V.; Daniilidis, K. Robustness meets deep learning: An end-to-end hybrid pipeline for unsupervised learning of egomotion. arXiv 2018, arXiv:1812.08351. [Google Scholar]
  51. Rusu, R.B.; Cousins, S. 3d is here: Point cloud library (pcl). In Proceedings of the 2011 IEEE International Conference on Robotics and Automation, Shanghai, China, 9–13 May 2011; pp. 1–4. [Google Scholar]
Figure 1. The proposed UnMinkLO-Net network architecture.
Remotesensing 17 02661 g001
Figure 2. Voxelization of LiDAR point clouds.
Remotesensing 17 02661 g002
Figure 3. Feature extraction network.
Remotesensing 17 02661 g003
Figure 4. Feature fusion module for point clouds.
Remotesensing 17 02661 g004
Figure 5. Relative pose regression module.
Remotesensing 17 02661 g005
Figure 6. Aligning two frames of point clouds using the pose ground truth. The yellow bounding boxes indicate that the inherent alignment errors are inconsistent in direction and magnitude across different object types.
Remotesensing 17 02661 g006
Figure 7. Comparison of trajectory curves predicted by different methods against ground-truth trajectories on the KITTI dataset.
Remotesensing 17 02661 g007
Figure 8. Projections of the predicted trajectory curves and ground-truth trajectories from different methods on the KITTI dataset.
Remotesensing 17 02661 g008
Figure 9. Average translational and rotational errors of different methods at varying driving speeds (left) and trajectory intervals (right).
Remotesensing 17 02661 g009aRemotesensing 17 02661 g009b
Table 1. Motion estimation results of different methods on the KITTI dataset ( r r e l [°/100 m], t r e l [%]). The bolded numbers represent the optimal performance for the corresponding indicators.
MethodTraining Sequences (00–08)Sequence 09Sequence 10
r rel t rel r rel t rel r rel t rel
ICP-po2po [21]3.376.702.836.864.468.94
ICP-po2pl [43]2.134.082.465.903.966.15
NDT-P2D [26]2.744.913.126.214.067.51
Zhu [50]2.355.722.928.843.896.65
UnDeepVO [49]2.554.543.617.014.6510.63
SfMLearner [48]4.6728.523.2118.773.3014.33
DeLORA [13]1.383.002.156.053.006.44
DeepLO [12]0.873.681.954.871.835.02
UnMinkLO-Net (Ours)0.912.511.873.032.013.79
Table 2. Experimental results of different loss functions and point cloud processing methods on KITTI dataset sequences 09–10 ( r r e l [°/100 m], t r e l [%]). The bolded numbers represent the optimal performance for the corresponding indicators.
3D Convolution, L cd 3D Convolution, L gt 2D Convolution, L gt
r rel t rel r rel t rel r rel t rel
Average2.415.421.943.412.524.26
Table 3. Runtime evaluation of different methods on KITTI dataset sequence 09.
MethodTime (ms)
ICP-po2po [21]261
ICP-po2pl [43]1250
NDT-P2D [26]1723
DeLORA [13]10
UnMinkLO-Net (Ours)49
Disclaimer/Publisher’s Note: The statements, opinions and data contained in all publications are solely those of the individual author(s) and contributor(s) and not of MDPI and/or the editor(s). MDPI and/or the editor(s) disclaim responsibility for any injury to people or property resulting from any ideas, methods, instructions or products referred to in the content.

