Article

Mechanisms of Ocean Acidification in Massachusetts Bay: Insights from Modeling and Observations

1
School for Marine Science and Technology, University of Massachusetts-Dartmouth, New Bedford, MA 02744, USA
2
Ocean Processes Analysis Laboratory, University of New Hampshire, Durham, NH 03824, USA
3
Department of Physical Oceanography, Woods Hole Oceanographic Institution, Woods Hole, MA 02543, USA
4
Northeastern Regional Association of Coastal Ocean Observing Systems (NERACOOS), Portsmouth, NH 03801, USA
*
Author to whom correspondence should be addressed.
Remote Sens. 2025, 17(15), 2651; https://doi.org/10.3390/rs17152651 (registering DOI)
Submission received: 2 June 2025 / Revised: 20 July 2025 / Accepted: 28 July 2025 / Published: 31 July 2025

Abstract

Massachusetts Bay in the northeastern United States is highly vulnerable to ocean acidification (OA) due to reduced buffering capacity from significant freshwater inputs. We hypothesize that acidification varies across temporal and spatial scales, with short-term variability driven by seasonal biological respiration, precipitation–evaporation balance, and river discharge, and long-term changes linked to global warming and river flux shifts. These patterns arise from complex nonlinear interactions between physical and biogeochemical processes. To investigate OA variability, we applied the Northeast Biogeochemistry and Ecosystem Model (NeBEM), a fully coupled three-dimensional physical–biogeochemical system, to Massachusetts Bay and Boston Harbor. Numerical simulation was performed for 2016. Assimilating satellite-derived sea surface temperature and sea surface height improved NeBEM’s ability to reproduce observed seasonal and spatial variability in stratification, mixing, and circulation. The model accurately simulated seasonal changes in nutrients, chlorophyll-a, dissolved oxygen, and pH. The model results suggest that nearshore areas were consistently more susceptible to OA, especially during winter and spring. Mechanistic analysis revealed contrasting processes between shallow inner and deeper outer bay waters. In the inner bay, partial pressure of pCO2 (pCO2) and aragonite saturation (Ωa) were influenced by sea temperature, dissolved inorganic carbon (DIC), and total alkalinity (TA). TA variability was driven by nitrification and denitrification, while DIC was shaped by advection and net community production (NCP). In the outer bay, pCO2 was controlled by temperature and DIC, and Ωa was primarily determined by DIC variability. TA changes were linked to NCP and nitrification–denitrification, with DIC also influenced by air–sea gas exchange.

1. Introduction

The coastal ocean in the northeastern United States is highly susceptible to ocean acidification (OA), where variability arises from complex, fully nonlinear interactions among physical, biological, and chemical processes. These processes are influenced by increased atmospheric carbon dioxide (CO2) loading, freshwater discharges from rivers [1,2,3], and eutrophication [4]. The Northeast Coastal Acidification Network (NECAN), established by the Northeastern Regional Association of Coastal and Ocean Observing Systems (NERACOOS), provides a collaborative platform for regional research and monitoring of acidification-induced environmental changes [5]. Gledhill et al. [5] emphasized that a considerable air–sea partial pressure gradient of CO2 (pCO2) in the region drives a net CO2 flux into the ocean, which intensifies as the atmospheric CO2 levels rise. Short-term and seasonal fluctuations in CO2 level are further modulated by biological respiration associated with spring and fall phytoplankton blooms, including frequent harmful algal bloom events.
The aragonite saturation state (Ωa), a key indicator of ocean acidification, decreases as pCO2 rises [1,2,6]. Values of Ωa below 1 indicate conditions unfavorable for calcifying organisms. Freshwater discharges from local rivers, combined with low-salinity inflows from the upstream St. Lawrence River and the Labrador Sea via the Scotian Shelf, contribute to lower Ωa in the Gulf of Maine and adjacent inner bays, especially along the western Gulf of Maine coast and in Massachusetts Bay and Boston Harbor. The Gulf of Maine’s low buffering capacity, due to its cool water temperature, freshwater dilution, and dissolved inorganic carbon (DIC) consumption, makes it particularly vulnerable to acidification. Short-term variability in acidification in this region is primarily driven by lower trophic level respiration, precipitation minus evaporation, and river discharge, while long-term variability reflects climate-driven changes in atmospheric CO2 and the inflow of colder, less saline water from upstream sources.
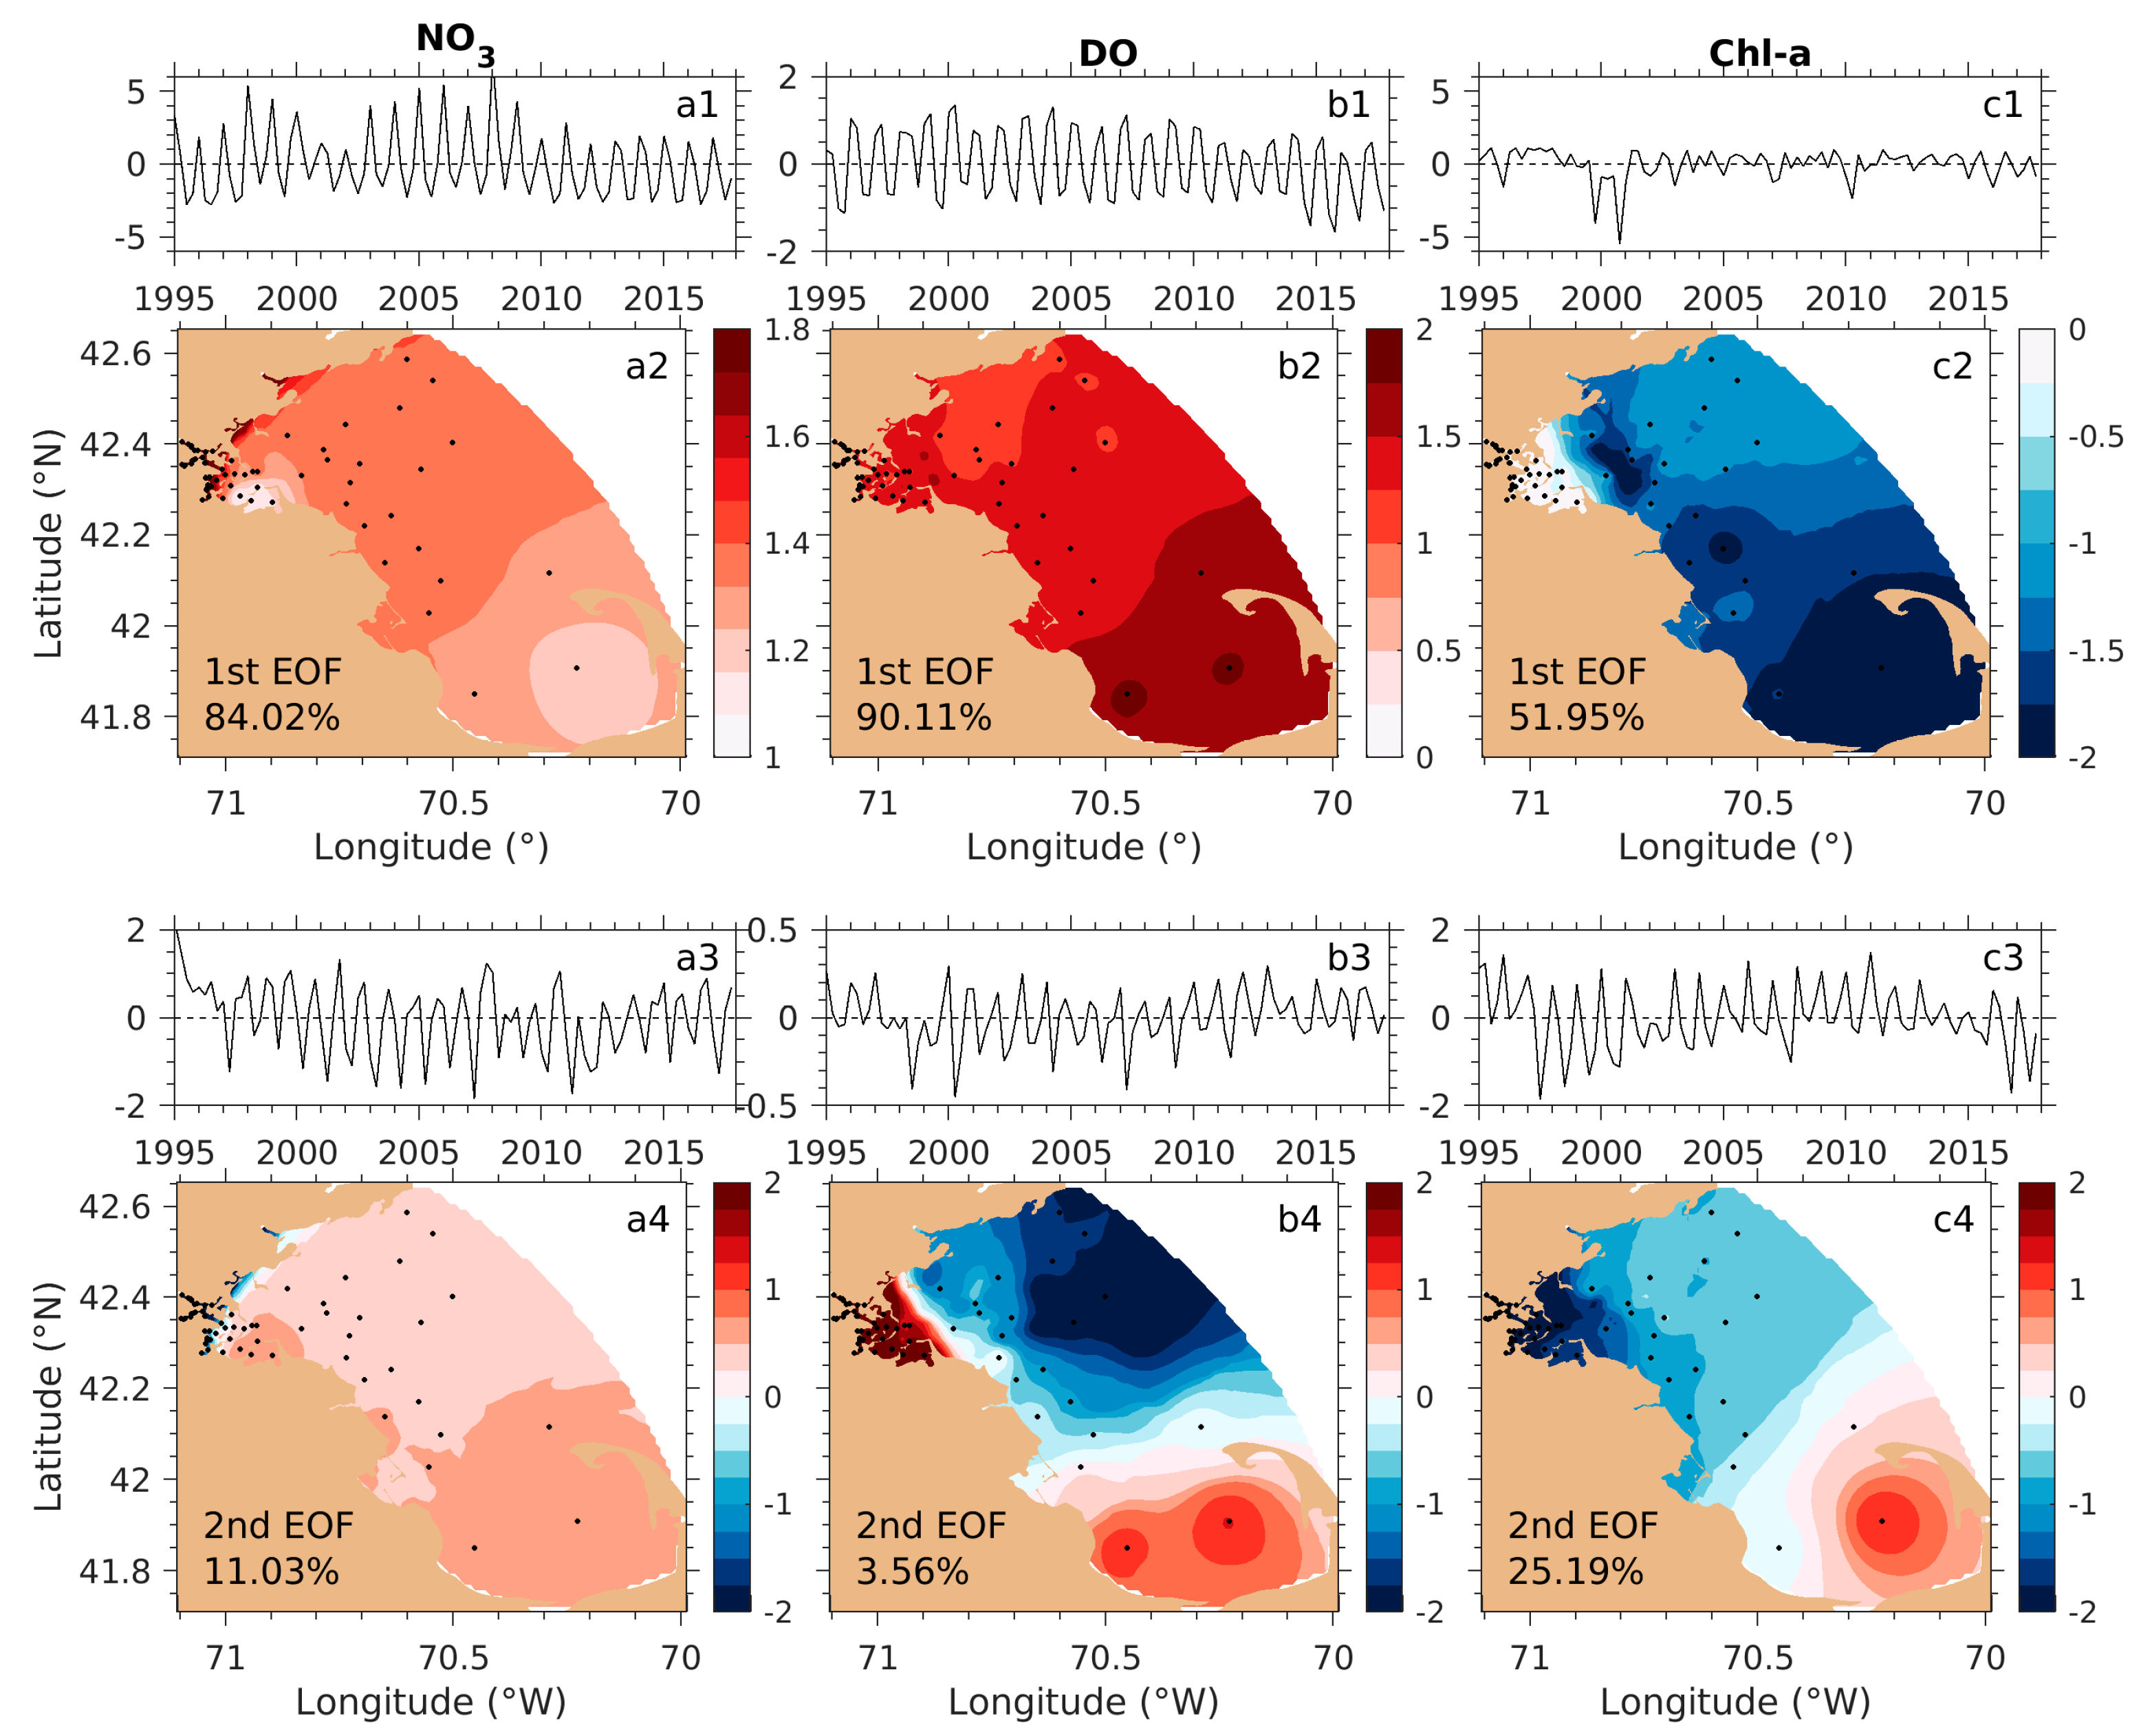
In Massachusetts Bay, the temporospatial variability of biogeochemical and ecosystem processes is strongly modulated significantly by complex hydrodynamic conditions [7]. Since 1992, extensive biweekly and monthly surveys have been conducted to monitor water quality in the bay (Figure 1). This effort has resulted in a long-term biogeochemical dataset including key variables such as nitrate (NO3), Chlorophyll a (Chl-a), dissolved oxygen (DO), pH, etc. To support three-dimensional ocean acidification modeling, we performed an empirical orthogonal function (EOF) analysis [8,9] using these data. The results reveal that the temporospatial variabilities of NO3, Chl-a, DO, and p H are characterized by the first and second dominant EOF modes, which represent the seasonal variations linked to bottom-up lower trophic food web processes influenced by wind mixing and stratification (Figure 2). These modes exhibit distinct spatial patterns, with higher amplitudes in northern Massachusetts Bay than in Cape Cod Bay in the first mode, and opposite distributions in the second mode.
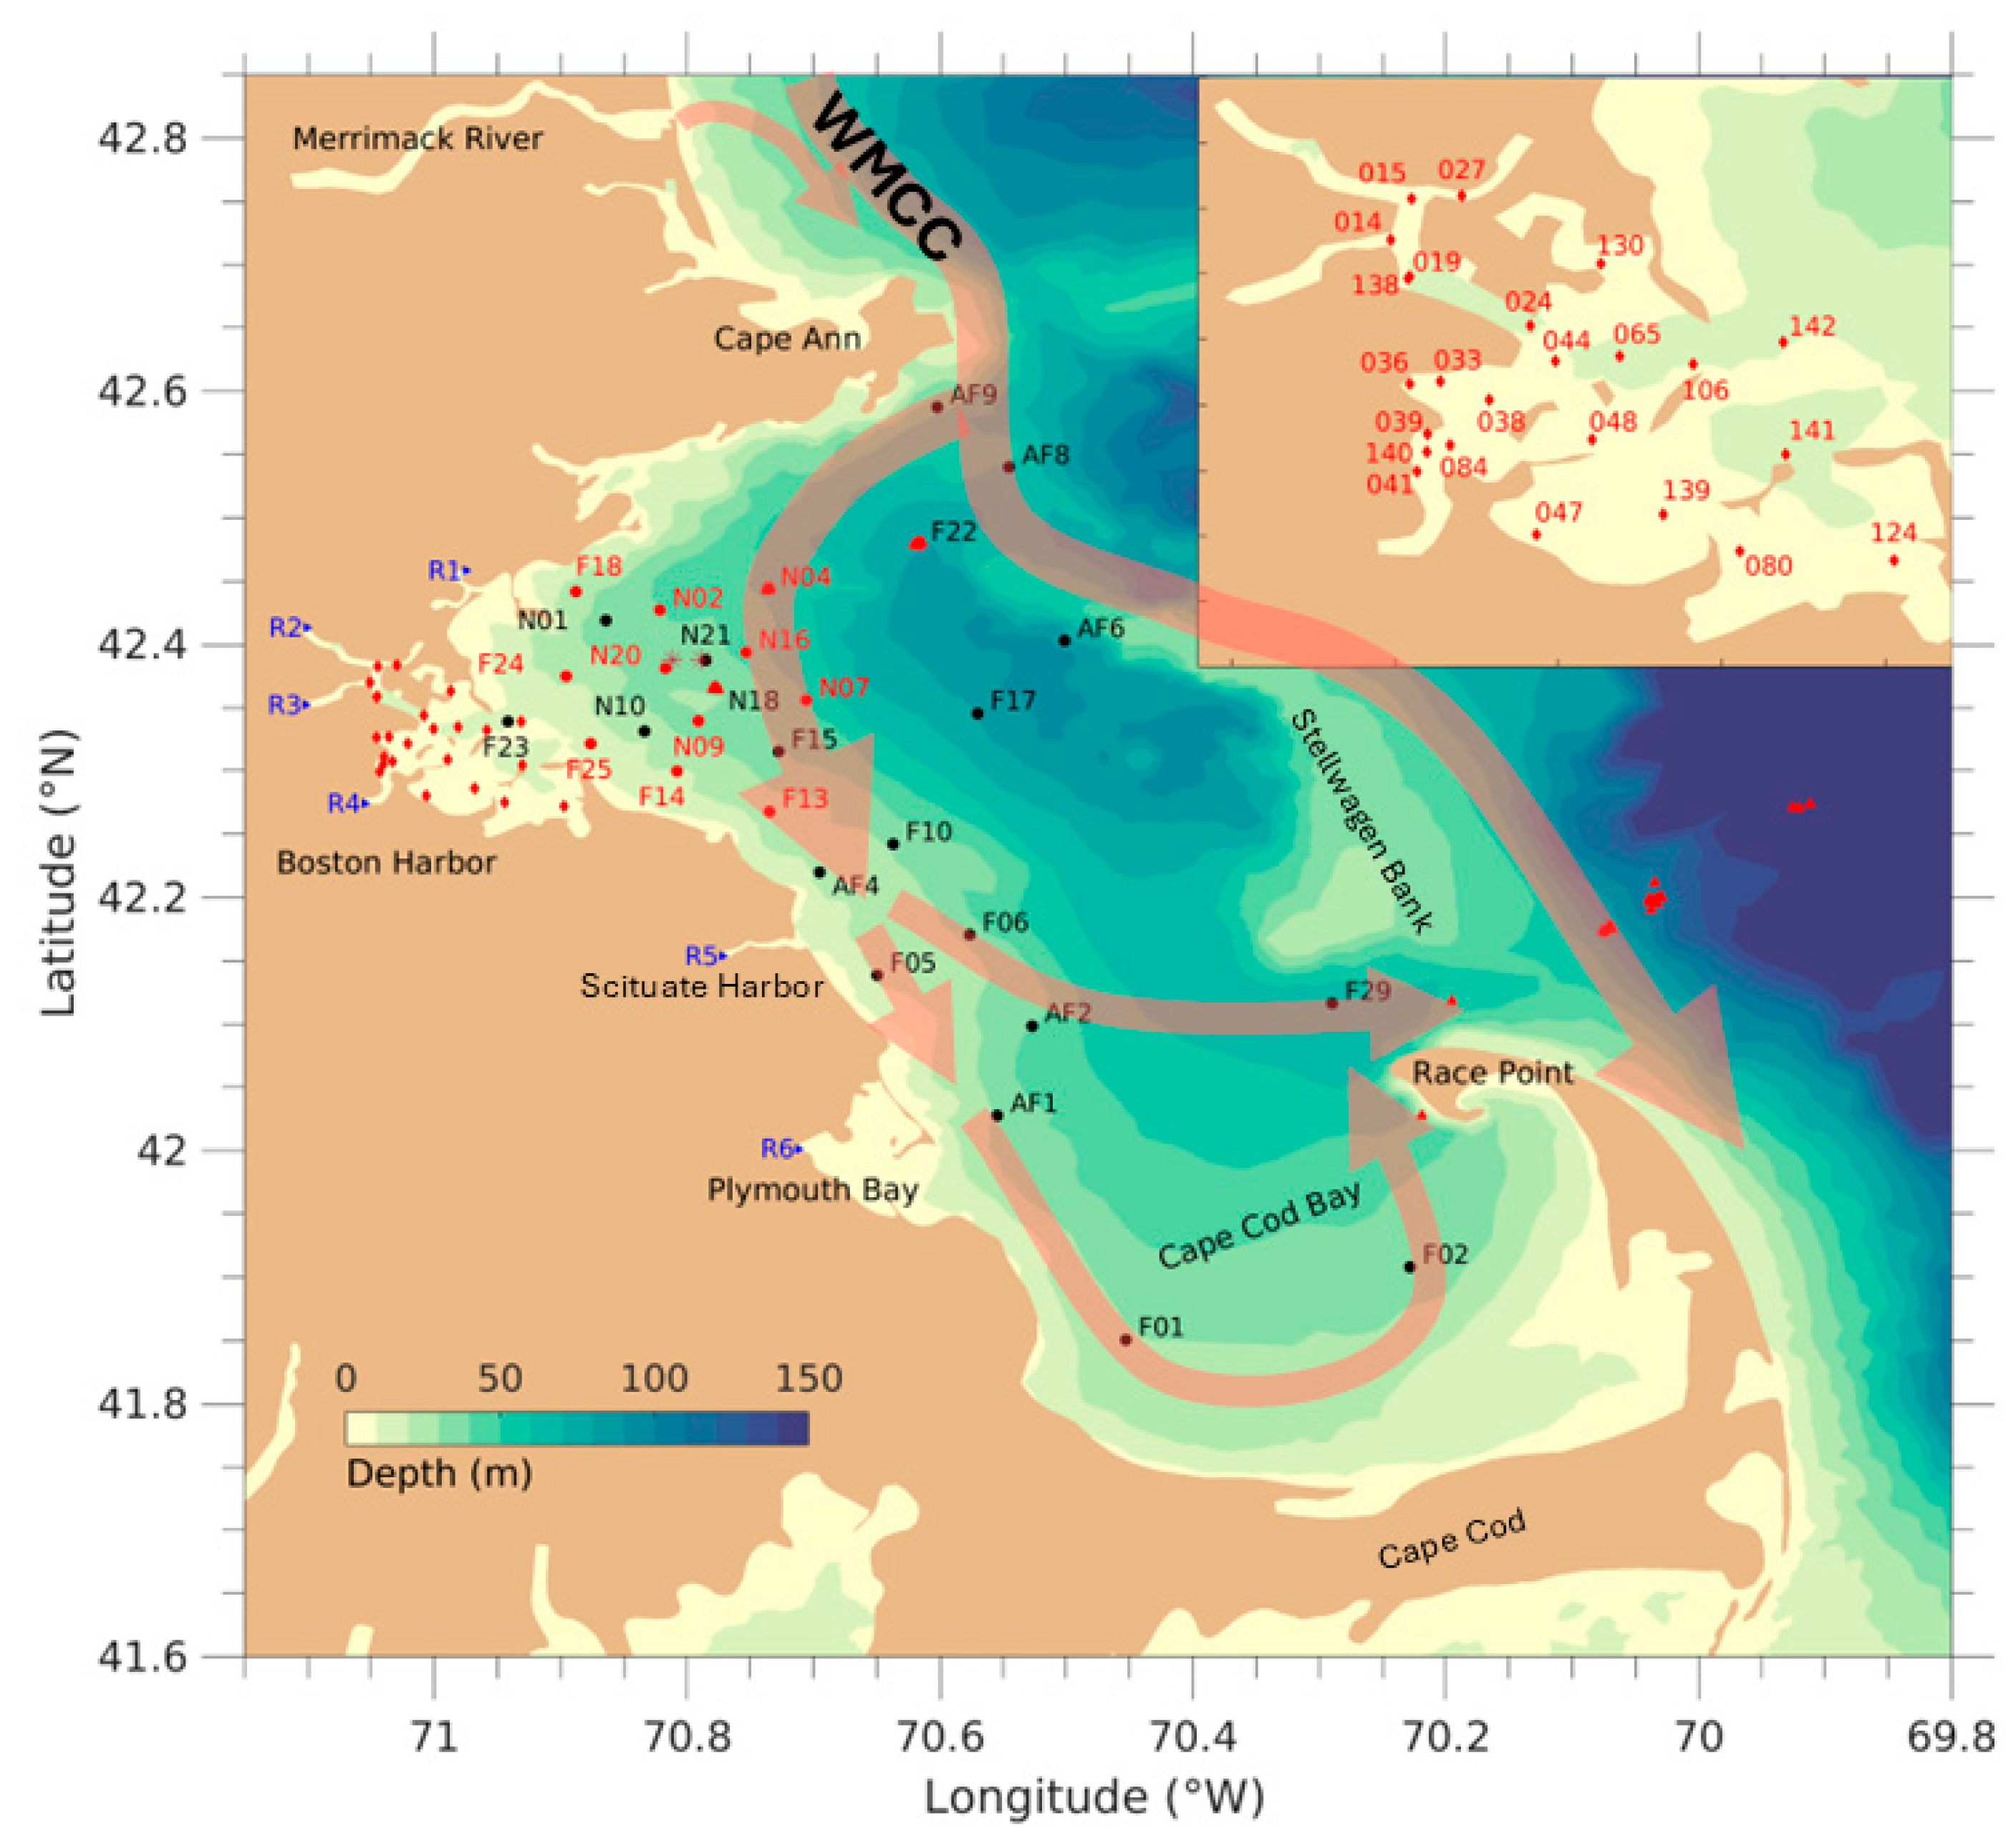
Figure 1. Locations of the MWRA survey sites, sewage outfall, and six rivers in Massachusetts Bay including Boston Harbor, overlaid with the long-term mean circulation. Black dots: far-field stations. Red dots: near-field stations. Red diamonds: harbor stations. Asterisk symbols: sewage outfall. R1–R6: Six rivers from north to south: the Saugus, Mystic, Charles, Neponset, North, and Jones Rivers. Measurements at far-field and near-field stations included temperature, salinity, chlorophyll-a, nitrate, ammonium, phosphate, silicate, and p H . Red triangles: additional observation sites from ECOA1, ECOA2, GOME, and MIT Sea Grant within or near Massachusetts Bay. WMCC: Western Maine Coast Current. Station numbers in Boston Harbor are shown in the zoomed-in panel in the upper-right corner.
Remotesensing 17 02651 g001
Figure 2. Spatial distributions of first and second dominant EOF modes and the corresponding time series of their temporal amplitudes for nitrate (NO3) (a1a4), dissolved oxygen (DO) (b1b4), and chlorophyll-a (Chl-a) (c1c4). The percentages shown in the lower-left corner of each panel indicate the proportion of total variance explained by that mode. Percentages of variance are estimated at the 95% confidence level.
Remotesensing 17 02651 g002
p H levels, as a key indicator of acidification, lacked insufficient bay-wide observations to construct temporospatial patterns. However, long-term p H monitoring in Boston Harbor was adequate to generate EOF maps for that area. The first dominant mode reveals a seasonal pattern, with the lowest p H level during winter and the highest during spring (Figure 3). Interannual variability includes notably low p H in 2008. The second mode, which accounts for 13.6% of the total variance, shows an offshore increase trend, with an opposite phase between Boston Harbor and the inner Massachusetts Bay shelf.
These temporospatial variations in biogeochemical processes across Massachusetts Bay are further shaped by cyclonic residual circulation, with inflow through the North Passage near Cape Ann and outflow via the South Passage at the tip of Cape Cod (Figure 1). The inflow consists of a branch of the West Maine Coastal Current (WMCC) and low-salinity estuarine discharges from the Merrimack River–Plum Island Sound complex [7,10,11,12,13]. Tides, winds, and river runoff are the primary drivers of temporal and spatial variability in currents and stratification. Seasonal stratification develops in spring, intensifies in summer, weakens in autumn, and mixes throughout the water column in winter [7,14,15,16]. In the shallow inner bay area (<20 m depth), flows and mixing are also further influenced by complex bathymetry, including numerous islands, inlets, estuaries, and harbors.
The absence of bay-wide p H and pCO2 measurements limit our understanding of the seasonal variability and spatial patterns of acidification in Massachusetts Bay. To date, no three-dimensional biogeochemistry model has been developed or applied to this region to fully capture the intricate physical, biological, and geochemical interaction processes contributing to acidification. While simpler lower trophic food web models, such as nutrients–phytoplankton–zooplankton (NPZ) or –detritus (NPZD) models [17,18,19,20], have robustly simulated spring and fall phytoplankton blooms, they lack chemical formulations necessary to compute critical acidification variables such as pCO2, pH, Ωa, DIC, and total alkalinity (TA). The unstructured-grid Row-Column Advanced water quality model (UG-RCA) has been used to assess eutrophication [7], but it does not resolve geochemistry processes related to acidification.
To address this gap, we developed the Northeast Biogeochemical Ecosystem Model (NeBEM), a modified version of the European Regional Seas Ecosystem Model (ERSEM) [21]. NeBEM incorporates a volume conservation adjustment module, an outfall module specific to Massachusetts Bay, and spatially dependent parameterizations. An initial one-dimensional (1-D) version of NeBEM was applied at two outer and inner bay sites from 1995 to 2016 to examine seasonal and interannual acidification variability under near-actual physical forcing [22]. The 1-D model robustly captured seasonal and interannual variability of nutrients, DO, Chl-a, pCO2, and pH at the outer bay site, where the ecosystem was predominantly driven by meteorological forcing. However, it failed at the inner bay site, primarily due to the absence of river discharge-induced advection. Diagnostic analysis confirmed that in nearshore regions, temporal variability is strongly influenced by advection resulting from the interaction of bay-wide circulation and buoyancy-driven low-salinity inflows from rivers. This finding underscores the need for a fully three-dimensional approach to resolve acidification dynamics.
In this study, we apply the three-dimensional NeBEM to Massachusetts Bay and Boston Harbor to investigate physical–biogeochemical interactions controlling temporospatial variability of acidification across the bay-wide scale, including Boston Harbor. This 3-D model is designed to evaluate how hydrodynamic processes contribute to the spatial variability of key ecosystems and biogeochemical variables. Since 1994, UG-RCA has been the primary model for assessing water quality in Massachusetts Bay. Its 23-year simulation (1994 to 2016) revealed that nutrients, phytoplankton, and DO generally exhibit consistent spatial patterns across years, with most variability driven by seasonal and interannual hydrodynamic fluctuations [7,23,24]. These findings suggest that focusing on a single representative year for 3-D NeBEM experiments is sufficient to capture the key physical and biogeochemical processes shaping ocean acidification across the bay. Accordingly, we selected 2016 for our simulations, enabling a direct comparison with results from the 1-D NeBEM and UG-RCA. This assumption is further supported by our more recent NeBEM simulations for 2017 and 2018, which employed a computational domain covering the entire northeastern U.S. coastal region, including Massachusetts Bay and Boston Harbor, and demonstrated robust model performance [21].
This paper presents major findings from the 2016 NeBEM simulations. We first validate and evaluate the model results against the monthly field survey data for nutrients, DO, Chl-a, and pH across all monitoring sites in Massachusetts Bay and Boston Harbor. Additionally, we investigate the biogeochemical processes affecting variability in TA and DIC using the normalized TA to DIC ratio. Finally, we assess the model’s performance through inter-model comparisons with UG-RCA under scenarios that account for or omit geochemical processes.

2. The Model, Numerical Designs, and Data

2.1. NeBEM

NeBEM is a regional biogeochemistry and ecosystem model for the northeastern United States coastal waters [21]. It is based on ERSEM, originally developed by the Plymouth Marine Laboratory in the United Kingdom [25]. ERSEM is designed to represent lower trophic level food web dynamics, encompassing autotrophic and heterotrophic processes. These include microbial and benthic food webs, the biogeochemical carbonate system, and calcification processes.
In the pelagic system, inorganic state variables comprise key chemical components such as carbon and nutrients. Carbon-related variables include DIC, pCO2, p H , Ωa, and TA. Nutrient variables include nitrate (NO3), ammonium (NH4), silicate (SiO4), phosphate (PO4) and iron. Organic state variables include four phytoplankton functional types, bacteria, three zooplankton groups, and both dissolved and particulate organic matter.
ERSEM features two configurations for benthic processes: a full benthic module and a simplified benthic closure. The full module includes benthic state variables that are consistent with the pelagic system, representing both inorganic and organic matter as well as benthic fauna. However, in this study, the simplified benthic closure was applied because of limited observational data available to calibrate the full benthic module. The simplified approach implicitly returns benthic materials to the pelagic system without resolving detailed benthic processes.
A comprehensive description of NeBEM, including model structures, algorithms for calculating pH and pCO2, and parameterizations, is provided by Wang et al. [22]. NeBEM can operate in two modes: (1) fully coupled online with the unstructured-grid Finite-Volume Community Ocean Model (FVCOM) and (2) offline using hourly physical field inputs from FVCOM. These inputs include three-dimensional currents, temperature, salinity, vertical and horizontal diffusion coefficients, shortwave solar radiation, river discharges, and other physical parameters. In this study, NeBEM was implemented in offline mode, allowing us to investigate biogeochemical processes under well-resolved hydrodynamic conditions.
Running NeBEM offline required a volume and mass conservation adjustment to correct errors introduced by temporal interpolation of the hourly physical fields. The correction ensured compliance due to the time interpolation of the hourly physical field. This correction entailed complications with the continuity equation:
ζ t + u ¯ D x + v ¯ D y d x d y = 0
Here, ζ is the water elevation, u ¯ and v ¯ are the x and y components of the depth-averaged velocity, and D denotes water depth. FVCOM frames a Generalized Biological Module that enables users to build ecosystem models from a library of pre-coded biological variables and parameterization functions [26]. For this study, a subroutine based on Equation (1) was incorporated into the offline GBM mode to recalculate sea surface elevation using the supplied velocity fields.
Massachusetts Water Resource Authority (MWRA) wastewater treatment plant (WWTP) outfall is a major point source of nutrient loading to Massachusetts Bay [27]. In previous modeling studies, the influence of this outfall was incorporated into UG-RCA by simulating the WWTP discharge as a groundwater input [19,28]. Two methods for representing groundwater discharges are implemented in FVCOM [26]: (1) adjusting tracer concentration (e.g., nutrients) without adding volume flux and (2) including the discharge as a bottom boundary volume flux. Consistent with previous applications of UG-RCA, NeBEM adopted the second method. The location of the WWTP outfall is near station N21, as indicated in Figure 1.
The biogeochemistry parameters used in the three-dimensional NeBEM experiments were consistent with those applied in the one-dimensional simulations, as detailed in Wang et al. [22]. For the three-dimensional case, sinking velocity and remineralization rate were adjusted to account for advection, tidal mixing, and river discharge effects (see Table 1). In addition, the semi-diagnostic algorithm recommended by the one-dimensional model for calculating total alkalinity was applied in the three-dimensional NeBEM experiments.

2.2. Numerical Experiment Designs

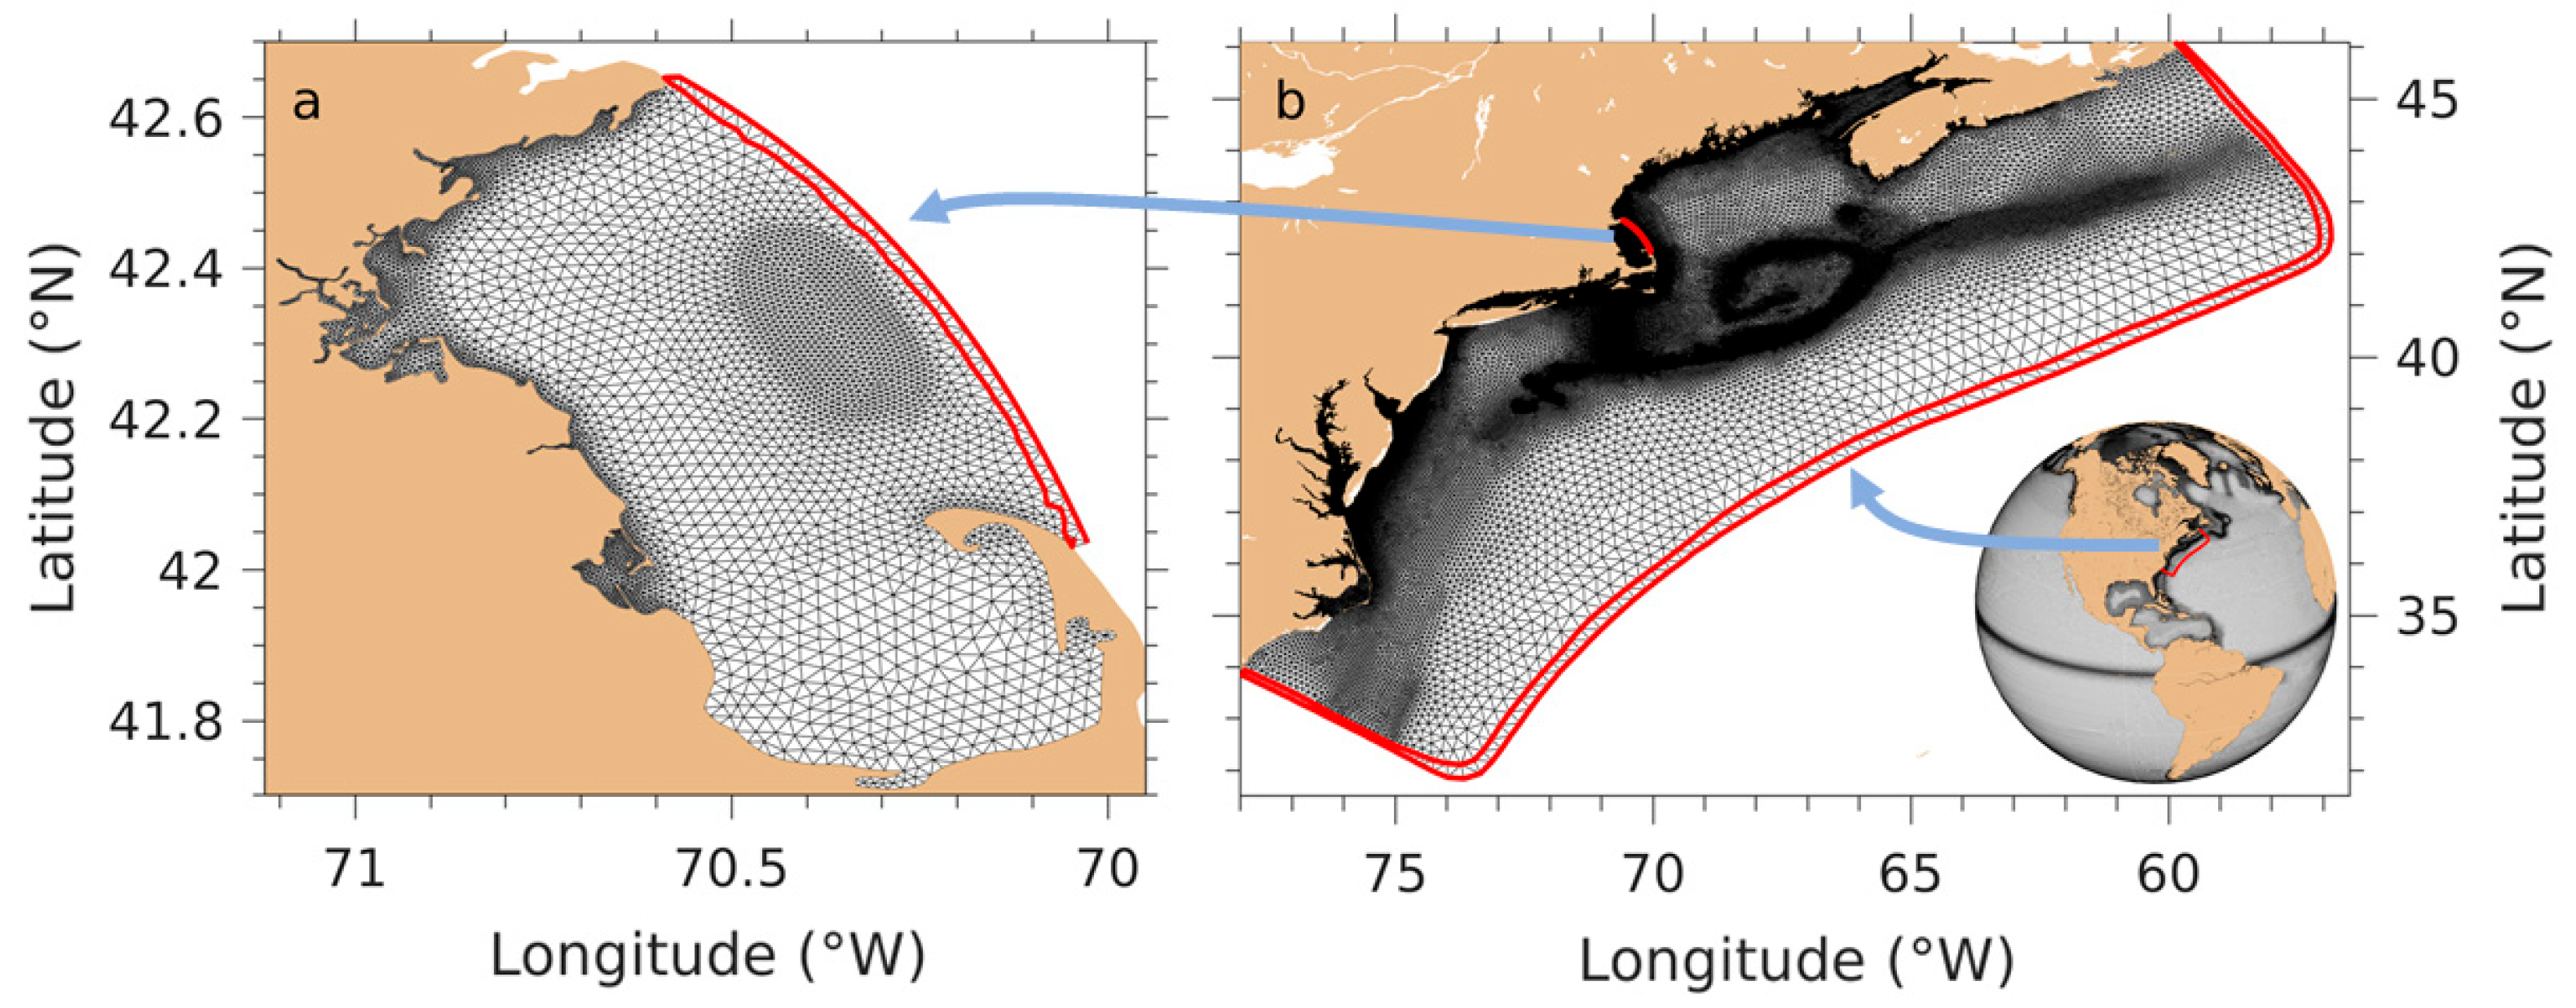
Numerical experiments were conducted using NeBEM configured over Massachusetts Bay, as shown in Figure 4a. The computational domain encompassed the entire bay, with an open boundary extending from the eastern coast of Cape Cod in the south to the coast of Rockport in the north. The model grid employed unstructured triangular meshes with horizontal resolutions varying from approximately 0.3 km within Boston Harbor and over Stellwagen Bank to about 9 km in the outer bay. Vertically, a sigma-coordinate system with 45 layers was used, providing a resolution of approximately 3.0 m near the open boundary and 0.1 m or less near the coast and within Boston Harbor.
NeBEM was driven by physical forcing from the Massachusetts Bay implementation of FVCOM, hereafter referred to as the Massachusetts Bay FVCOM (MB-FVCOM) [7]. MB-FVCOM itself was forced by surface atmospheric conditions simulated by the Weather Research and Forecast (WRF) model and freshwater inflows from rivers. At its open boundaries, MB-FVCOM received conditions via one-way nesting from the 3rd generation Gulf of Maine FVCOM (GOM3-FVCOM), a regional model embedded within the Northeast Coastal Ocean Forecast System (NECOFS) [16]. GOM3-FVCOM, in turn, was nested within a larger-scale global FVCOM (Global-FVCOM) [29,30,31] (see Figure 4b).
To improve the realism of physical fields, data assimilation was employed. Satellite-derived sea surface temperature (SST) and sea surface height (SSH) as well as in situ temperature and salinity profiles were assimilated into MB-FVCOM. SST/SSH data were assimilated daily, while in situ temperature and salinity data were assimilated within a 3 h window. This assimilation was crucial for correcting uncertainties arising from WRF atmospheric forcing, which included net heat flux, shortwave radiation, 10 m wind speed, and precipitation (P) minus evaporation (E). While WRF captured large-scale atmospheric variability, it tended to overestimate sensible and latent heat fluxes during storm events (Chen et al. [32]. This bias was corrected by recalculating these fluxes using the Coupled Ocean-Atmosphere Response Experiment algorithm [33]. However, uncertainties remained in WRF-predicted shortwave radiation, largely due to challenges in estimating cloud cover. These inaccuracies affected the surface heat budget, leading to biases in simulated SST and mixed layer depth. Furthermore, local hydrodynamic models cannot resolve regional mean sea surface height variability, which influences barotropic transport into and out of Massachusetts Bay. Assimilation of satellite SST and SSH significantly improves stratification, surface elevation, and overall model accuracy, which are parameters critical for simulating ocean acidification dynamics.
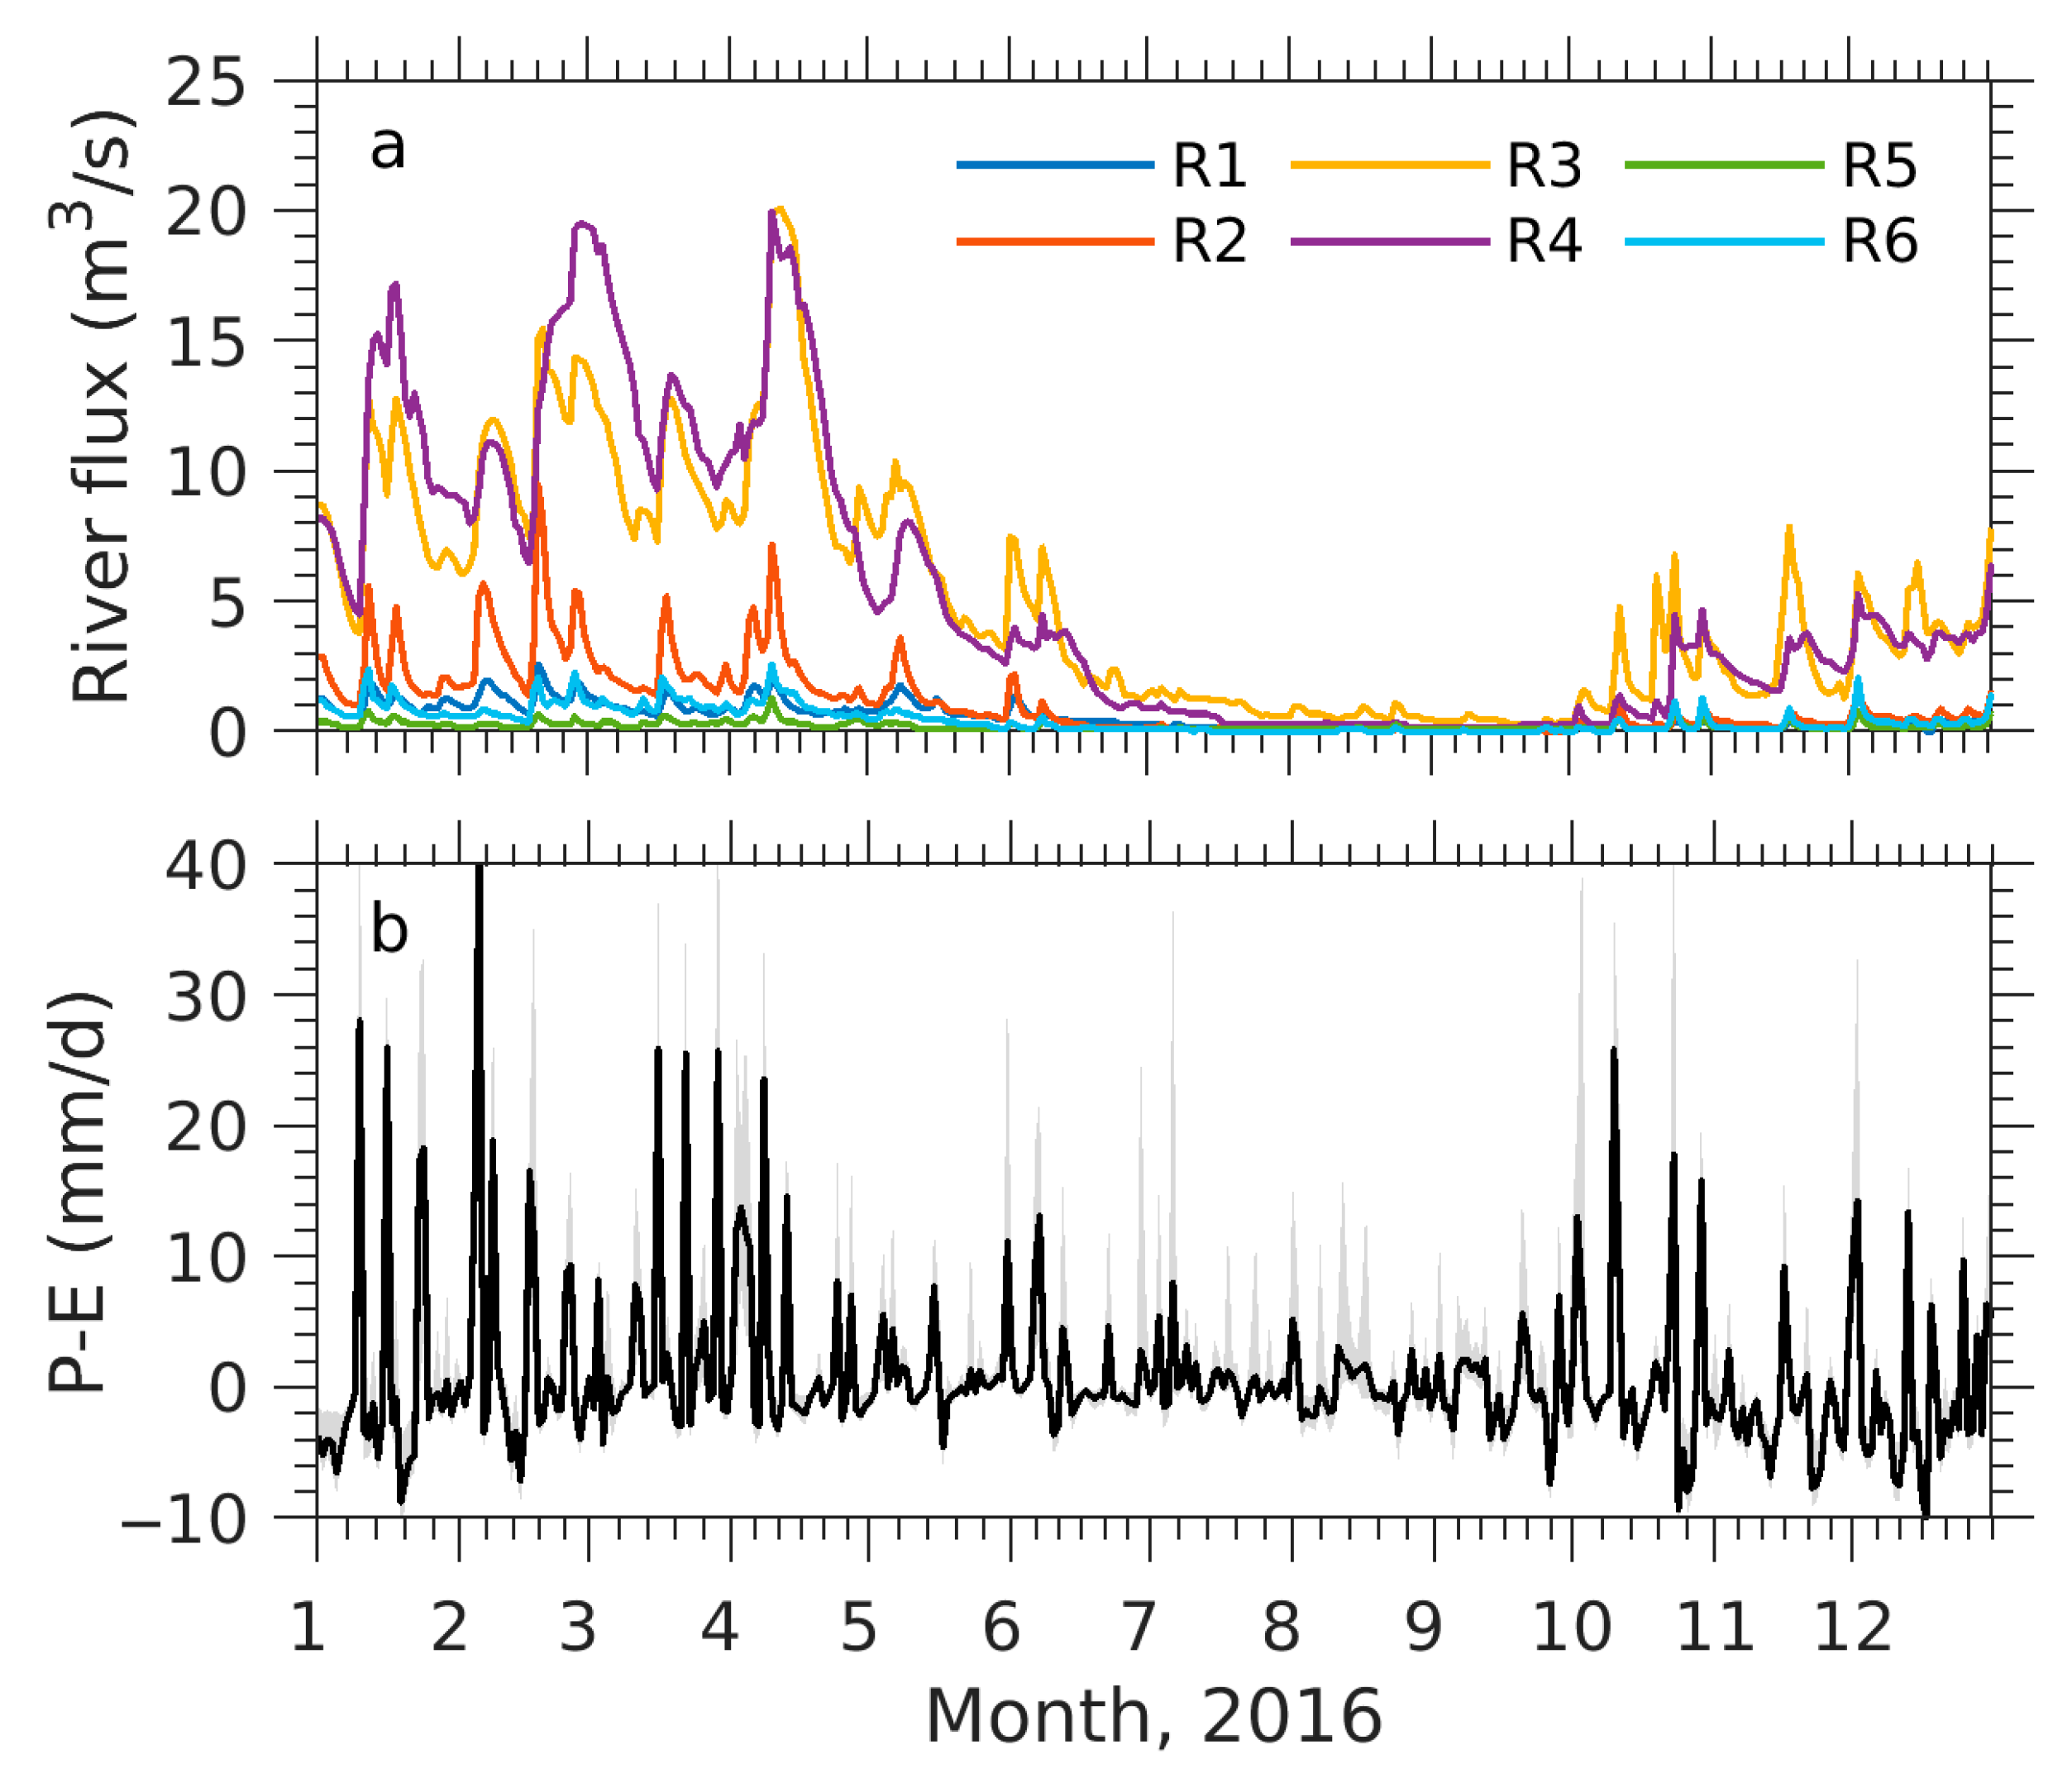
Freshwater inputs were specified for six local rivers, the Saugus, Mystic, Charles, Neponset, North, and Jones Rivers, with their locations shown in Figure 1. River discharge data were obtained from the United States Geological Survey (USGS) data (Figure 5a). These rivers exhibited similar seasonal variability, with peak discharges in spring and minimum in summer. Annual and seasonal discharge statistics are summarized in Table 2. While these six rivers contributed to local-scale freshening with Boston Harbor and adjacent nearshore areas, their combined influence was minor compared to the Merrimack River. For example, the Mystic and Charles Rivers had the longest records, but their maximum discharge rate (~19 m3/s) accounted for only about 2% of the Merrimack River’s freshwater input. The Merrimack River, located outside the computational domain, was included in boundary forcing to capture its dominant freshening effect on Massachusetts Bay.
Precipitation and evaporation data were derived from a 43-year (1978–2020) hindcast using the regional WRF within NECOFS. On average, precipitation exceeded evaporation over the bay throughout the year (Figure 5b), with an annual mean P-E of 0.8 ± 6.2 mm/day. Seasonal variability showed higher P-E values during winter and spring and lower values in summer and autumn. Freshwater inputs from rivers and precipitation are notable sources of acidity, low total alkalinity, and high nutrients, potentially affecting both biological productivity and carbonate chemistry in Boston Harbor and adjacent waters during spring [1,3].
The three-dimensional NeBEM experiments focused on the year 2016 for two main reasons. First, water quality assessment using UG-RCA has been completed for this year. UG-RCA, driven by MB-FVCOM nested within NECOFS, provided a valuable reference for inter-model comparisons [28]. Second, UG-RCA has been running continuously from 1995 to 2016, with validated results and monthly restart files. Using these initial and boundary conditions allowed NeBEM to avoid a lengthy spin-up from an observationally limited initial state.
Although NeBEM includes modules for total alkalinity and dissolved inorganic carbon, no direct measurements of these parameters were available for Massachusetts Bay and Boston Harbor in 2016. The initial conditions for total alkalinity were estimated from observed salinities using the empirical relationship developed by Millero [34]. D I C initial conditions were specified as a linear vertical profile, with 2050 μmol/kg at the surface and 2100 μmol/kg at the bottom, based on observations from other years collected during the Massachusetts Institute of Technology (MIT) Sea Grand, East Coast Ocean Acidification (ECOA), and Gulf of Maine East (GOME) cruises. Following similar approaches, riverine similar TA and DIC concentrations were set as constant, 1450 μmol/kg and 1400 μmol/m3, respectively. While this method required an adjustment period for NeBEM to achieve equilibrium in the carbonate system, its robustness was evaluated through comparison of simulated and observed pH.
The TA-salinity method introduced by Millero [34] remains widely used in ocean acidification studies, particularly in regions where direct TA measurements are unavailable. Lee et al. [35] applied this approach globally using satellite-derived sea surface salinity (SSS). Land et al. [36] demonstrated how SSS data from ESA’s SMOS and NASA’s Aquarius missions, combined with SST, can estimate key acidification parameters such as pH, carbonate ion concentration, and TA at global scales. Fassbender et al. [37] employed a similar method for coastal waters of Washington State, United States, while Courtney et al. [38] investigated uncertainties in normalized TA and DIC estimates derived from salinity. McCary et al. [39] also used this method to analyze processes influencing the carbonate system of the northeastern United States, relying on basic hydrographic data. More recently, Metzel et al. [40] compiled approximately 67,000 TA and DIC measurements collected between 1993 and 2023, further supporting the method’s validity for large-scale carbonate system reconstructions.

2.3. Data and Model Assessment Skills

The data sources used in this study were sourced from (1) MWRA; (2) MIT Sea Grant; (3) ECOA [41,42], and (4) GOME [43]. The MWRA monitoring program initiated in 1992 covers the entire Massachusetts Bay. It includes 12 “near-field” stations near the outfall, 14 “far-field” stations in the bay including Cape Cod Bay, and 23 “harbor” stations in Boston Harbor (Figure 1). The harbor measurements were made as part of the Harbor Monitoring Project. The collected data consists of temperature, salinity, dissolved oxygen (DO), chlorophyll-a (Chl-a), nitrate (NO3), ammonium (NH4), phosphate (PO4), silicate (SiO4) at all stations, and pH at near-field and harbor stations. Far-field stations were sampled approximately bi-monthly, near-field stations monthly, and harbor stations weekly.
Water samples were taken at five standard levels at near- and far-field stations, except at shallow far-field stations near the harbor (<15 m), where only three standard levels were sampled. At harbor stations, samples were collected from two layers (surface and bottom), but in very shallow areas (<5 m), only surface samples were taken. Nutrients and DO were analyzed following protocols developed by Libby et al. [44,45]. MWRA data were obtained directly or downloaded from https://www.mwra.com/harbor/download-environmental-data (accessed on 20 May 2020). Data from 1995 to 2017 were used for the EOF analysis in Section 1, while 2016 data were applied for model validation.
The datasets from MIT Sea Grant, ECOA, and GOME included water temperature, salinity, TA and DIC. MIT Sea Grant measurements were collected in 2017 at stations F22, F23, N04, and N18 (Figure 1). ECOA observations were gathered during June and July of 2015 and 2018 across the U.S. Northeast coastal region. The GOME dataset comprised repeat transect surveys in the southwestern Gulf of Maine between 2013 and 2015. Observations from these three datasets, located within or near Massachusetts Bay, were also incorporated into this study.
The performance of NeBEM was assessed using advanced model skill metrics, including the Cost Function (CF) [46], Percentage of Bias (PB) [47], and Adjusted Relative Mean Absolute Error (ARMAE) [48], defined as follows:
C F = M O n σ O  
P B = M O O × 100  
A R M A E = M O O E O
Here, O and M represent the observed and model-simulated variables, respectively; n is the number of observations, σ O is the observed standard deviation, and O E is the observational error reflecting measurement uncertainty. The O E values were set as 0.02 °C for temperature, 0.02 PSU for salinity, 2% for nutrients and DO [49,50], 0.1 mg/m3 for Chl-a [49], and 0.001 for pH. The angular brackets in the ARMAE formula denote averaging, and ARMAE is set to zero if the numerator becomes negative.

2.4. Salinity Normalization Approach

The normalization of TA and DIC relative to a constant salinity is a widely used method for assessing the relative contributions of biogeochemical processes to TA and DIC. In this study, normalization followed the approaches of Friis et al. [51] and Hunt et al. [52], defined as follows:
n T A = T A T A 0 S × S m + T A 0
n D I C = D I C D I C 0 S × S m + D I C 0
where TA and DIC represent the observed or model-simulated TA and DIC, respectively; S is the corresponding observed or modeled salinity; T A 0 , and D I C 0 are the intercept values determined by linear regression of TA and DIC against salinity; S m is the mean salinity in the regression.

3. Results

3.1. Physical Fields

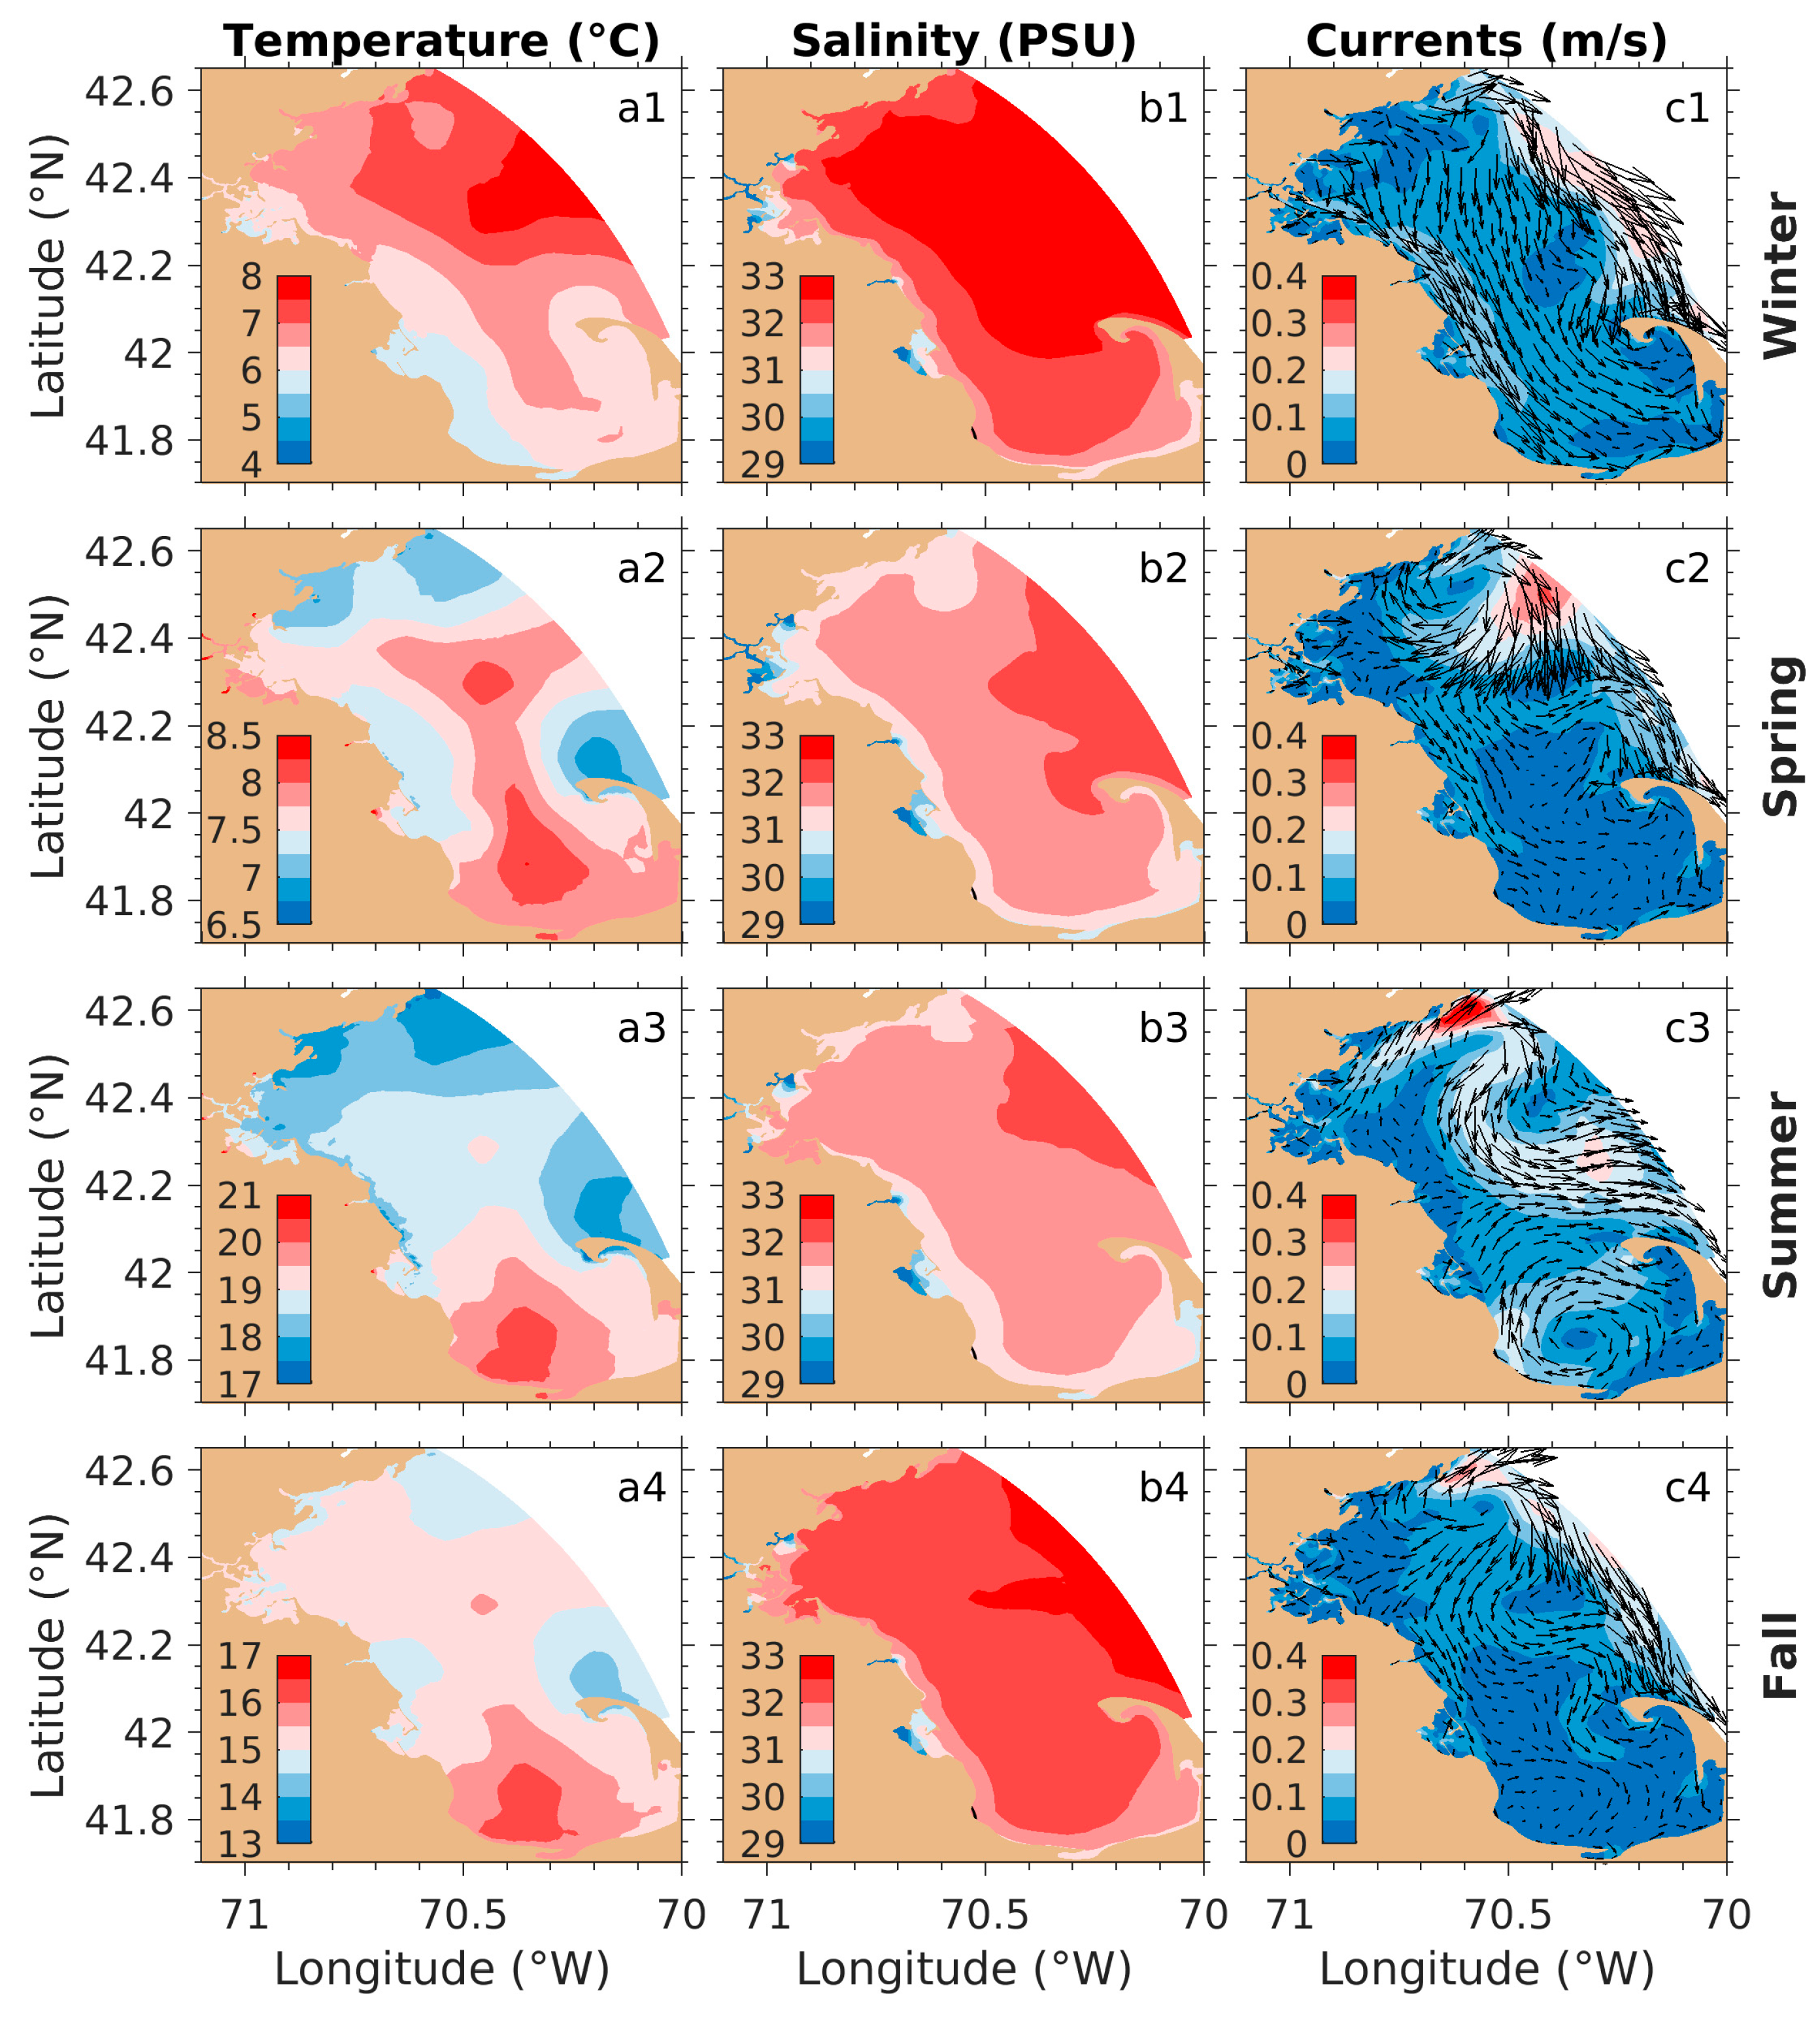
The model robustly reproduced the seasonal patterns of the bay-wide circulation and stratification in 2016 (Figure 6), consistent with findings summarized in Xue et al. [7]. One notable difference was observed in southern Massachusetts Bay during the spring-to-fall period, where the intrusion of the cold, low-salinity water from the WMCC in northern Massachusetts Bay contributed to distinct hydrographic features. A warm core feature exceeding 8 °C was detected in southern Massachusetts Bay during spring (Figure 6(a2)). This warm core intensified as it shifted toward the south coast, reaching central temperatures above 20 °C in summer (Figure 6(a3)). Although it persisted into fall, the central temperature declined to around 16 °C (Figure 6(a4)). Correspondingly, a warm core eddy developed in Cape Cod Bay during spring, strengthened in summer, and weakened in fall (Figure 6(c2–c4)).
River freshwater discharges from rivers in Boston Harbor and the inflow from the WMCC significantly influenced nearshore salinity, particularly in the northern Massachusetts Bay (Figure 6(b1–b4)). The lowest salinity values were observed near Boston Harbor. The presence of the warm-core eddy in the salinity field suggests it formed primarily in response to thermal changes within Cape Cod Bay.
Near-surface currents exhibited pronounced seasonal variability. In winter, the seasonal mean currents in Massachusetts Bay were predominately driven by northerly winds combined with WMCC intrusion, producing a southward flow at speeds of approximately 25 cm/s in the outer bay (>20 m depth) and 10 cm/s in the inner bay (<20 m depth) (Figure 6(c1)). During spring, enhanced runoff from the Merrimack River intensified the WMCC’s southward flow, resulting in the formation of a clockwise eddy in the northern Massachusetts Bay (Figure 6(c2)). Meanwhile, the flow in the southern bay remained weak, with speeds near 5 cm/s. In summer, prevailing southwesterly winds drove an outflow along the northern coast that combined with the WMCC to produce a southward flow in the outer bay (Figure 6(c3)). In fall, the currents exhibited similar spatial patterns, though flow speeds were notably weaker (Figure 6(c4)). The maximum southward flow during this season shifted offshore along the nested model boundary.
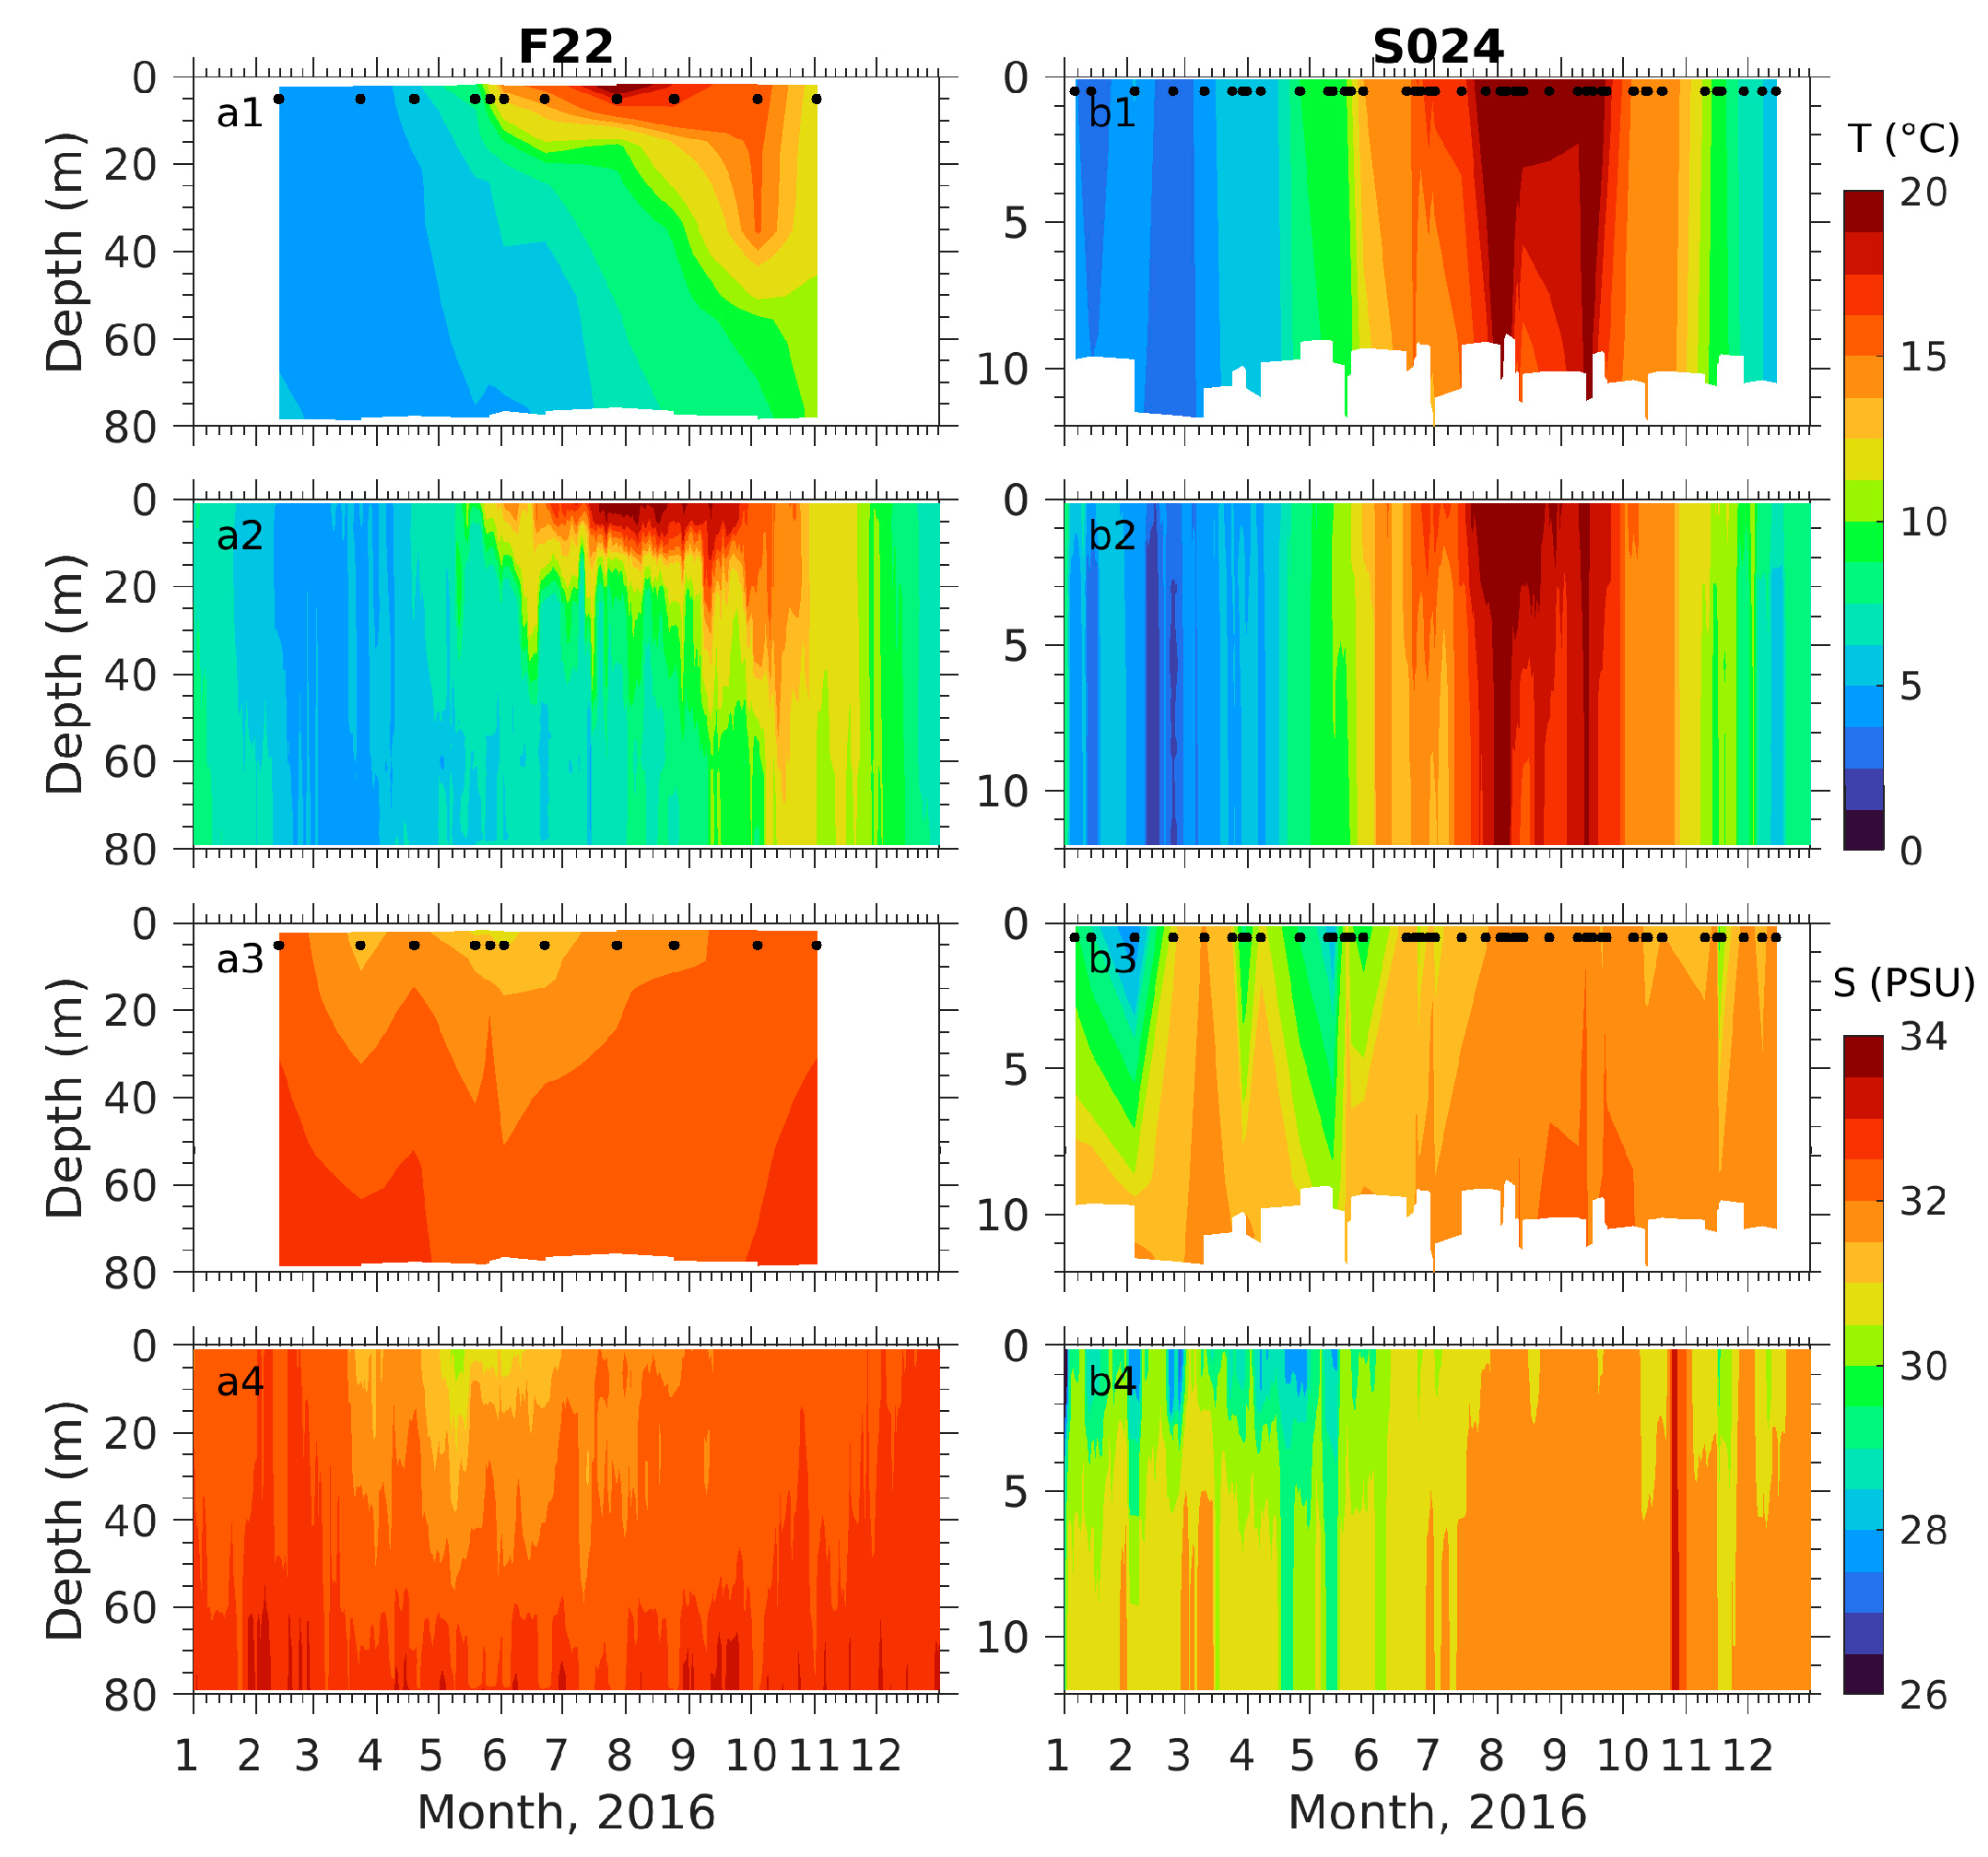
Seasonal stratification and mixing patterns varied significantly with depth, as demonstrated, for example, at F22 (a deep site in the outer bay) and S024 (a shallow site within Boston Harbor). At F22, observed sea temperatures remained vertically well-mixed during winter and early spring, became stratified from late spring through summer, and returned to a well-mixed state in late fall (Figure 7(a1)). Maximum thermal stratification occurred in summer, with the mixed layer thinning to approximately 10 m. In contrast, at S024, temperatures were generally vertically uniform year-round, though weak stratification developed during late summer and early fall (Figure 7(b1)).
At F22, salinity was significantly influenced by low salinity intrusions from the Merrimack River during spring and summer, with the strongest signal in May and June (Figure 7(a3)). At S024, fresher conditions persisted from winter through June due to runoff from the Saugus, Mystic, Charles, and Neponset Rivers, with the Mystic and Charles Rivers contributing most significantly (Figure 7(b3)). Salinity at S024 reached a minimum of 27.6 PSU during spring. Unlike F22, stratification at S024 was primarily driven by salinity, with a surface-bottom salinity difference of about 4.2 PSU in winter and spring.
Model-simulated temperature and salinity were compared with observations at all stations where hydrographic data were available. Even without data assimilation, MB-FVCOM adequately captured the seasonal variability in vertical temperature and salinity profiles. The inclusion of data assimilation further improved model performance by 10–15% for both temperature and salinity (Figure 7(a2,a4,b2,b4)).

3.2. Biogeochemical Fields

The NeBEM experiments aimed to evaluate the model’s ability to simulate key biogeochemistry variables relevant to ocean acidification in Massachusetts Bay and Boston Harbor, using the assimilated hydrodynamic fields from MB-FVCOM. We first compared the model results with observations at all measurement sites. The variables included in the comparison were four nutrients (nitrate, ammonium, phosphate, silicate), chlorophyll-a, dissolved oxygen, and pH. Seasonal variability of the biogeochemistry fields was then analyzed based on time series of validated simulated variables at measurement sites and their spatial distributions over seasonal means. Here, we focused particularly on nitrate and pH, while comparisons of other variables are displayed in Appendix A.
Model performance was assessed both qualitatively by direct comparison of simulated variables with observational data and quantitatively through statistical skill metrics. For spatial analysis, Massachusetts Bay and Boston Harbor were divided into the outer and inner bay zones using the 20 m isobath to account for variations driven by different physical mechanisms. The outer bay zone (hereafter referred to as “outer bay”) was strongly influenced by intrusion of the WMCC and freshwater discharge from the Merrimack River. In contrast, the inner bay zone (hereafter referred to as “inner bay”) includes BH, where multiple river inputs play a critical role in ocean acidification.

3.2.1. Comparison with Observations

Nutrients: NeBEM effectively reproduced the seasonal variability of nutrients observed at measurement sites in the outer bay. Both observed and simulated nitrate concentrations were vertically well mixed during winter, exhibited significant vertical stratification in spring and summer, and returned to a well-mixed state in fall (Figure 8(a1,a2)). Near the surface, nitrate concentrations decreased rapidly in spring due to phytoplankton uptake, remained relatively low throughout summer, and were replenished by enhanced vertical mixing in late fall. In contrast, bottom nitrate concentrations remained relatively high year-round.
The major discrepancies between simulated and observed nutrients were in seasonal mean values and the extent of spatial variability. Observations showed pronounced spatial variation, with surface nitrate concentration ranging from 0.1 to 2.7 μM and bottom nitrate concentrations from 1.5 to 4.3 μM. NeBEM tended to underestimate this variability, especially near the surface.
In the inner bay, strong vertical mixing led to synchronous changes in nitrate concentrations throughout the water column, following a consistent seasonal cycle (Figure 8(c1,c2)). Concentration declined steadily from January to June, remained low during July and August, and increased again from September to December. Observed spatial variability ranged from 0.1 to 3.0 μM, which NeBEM successfully captured. Weak vertical stratification persisted from winter through spring due to multiple riverine inputs, and surface-to-bottom nutrient differences were minimal during stratified periods.
pH: As noted, p H measurements were primarily available in the inner bay, particularly within Boston Harbor. Regionally averaged p H shown in Figure 8 was calculated based on 11 stations located just deeper than the 20 m isobath, which may not fully represent pH variations across the entire outer bay. At these stations, average surface p H was lowest in winter (7.66 in January), increased sharply to over 8.10 in April, remained at or above 8.00 during late spring and summer, and gradually declined below 8.00 during late summer and fall (Figure 8(b1)). Bottom pH exhibited little variation from April to July, dropped to 7.86 in August, and rose again to approximately 7.90 over September–October (Figure 8(b2)). No bottom pH data were available from January to March. Between April and October, surface pH was on average ~0.06 units higher than bottom pH.
In the inner bay, pH was measured at 23 stations distributed densely throughout Boston Harbor. At these stations, pH exhibited similar seasonal variations and changed synchronically throughout the water column (Figure 8(d1,d2)). Two peaks were observed, with maxima of around 8.10 in April and December, and two minima near 7.80 in March and September. NeBEM robustly reproduced the observed near-surface pH and its seasonal variability from spring through fall. However, in contrast to observations, simulated p H at outer bay stations was consistently above 8.00 and showed little change during winter and early spring.

3.2.2. Seasonal Distributions

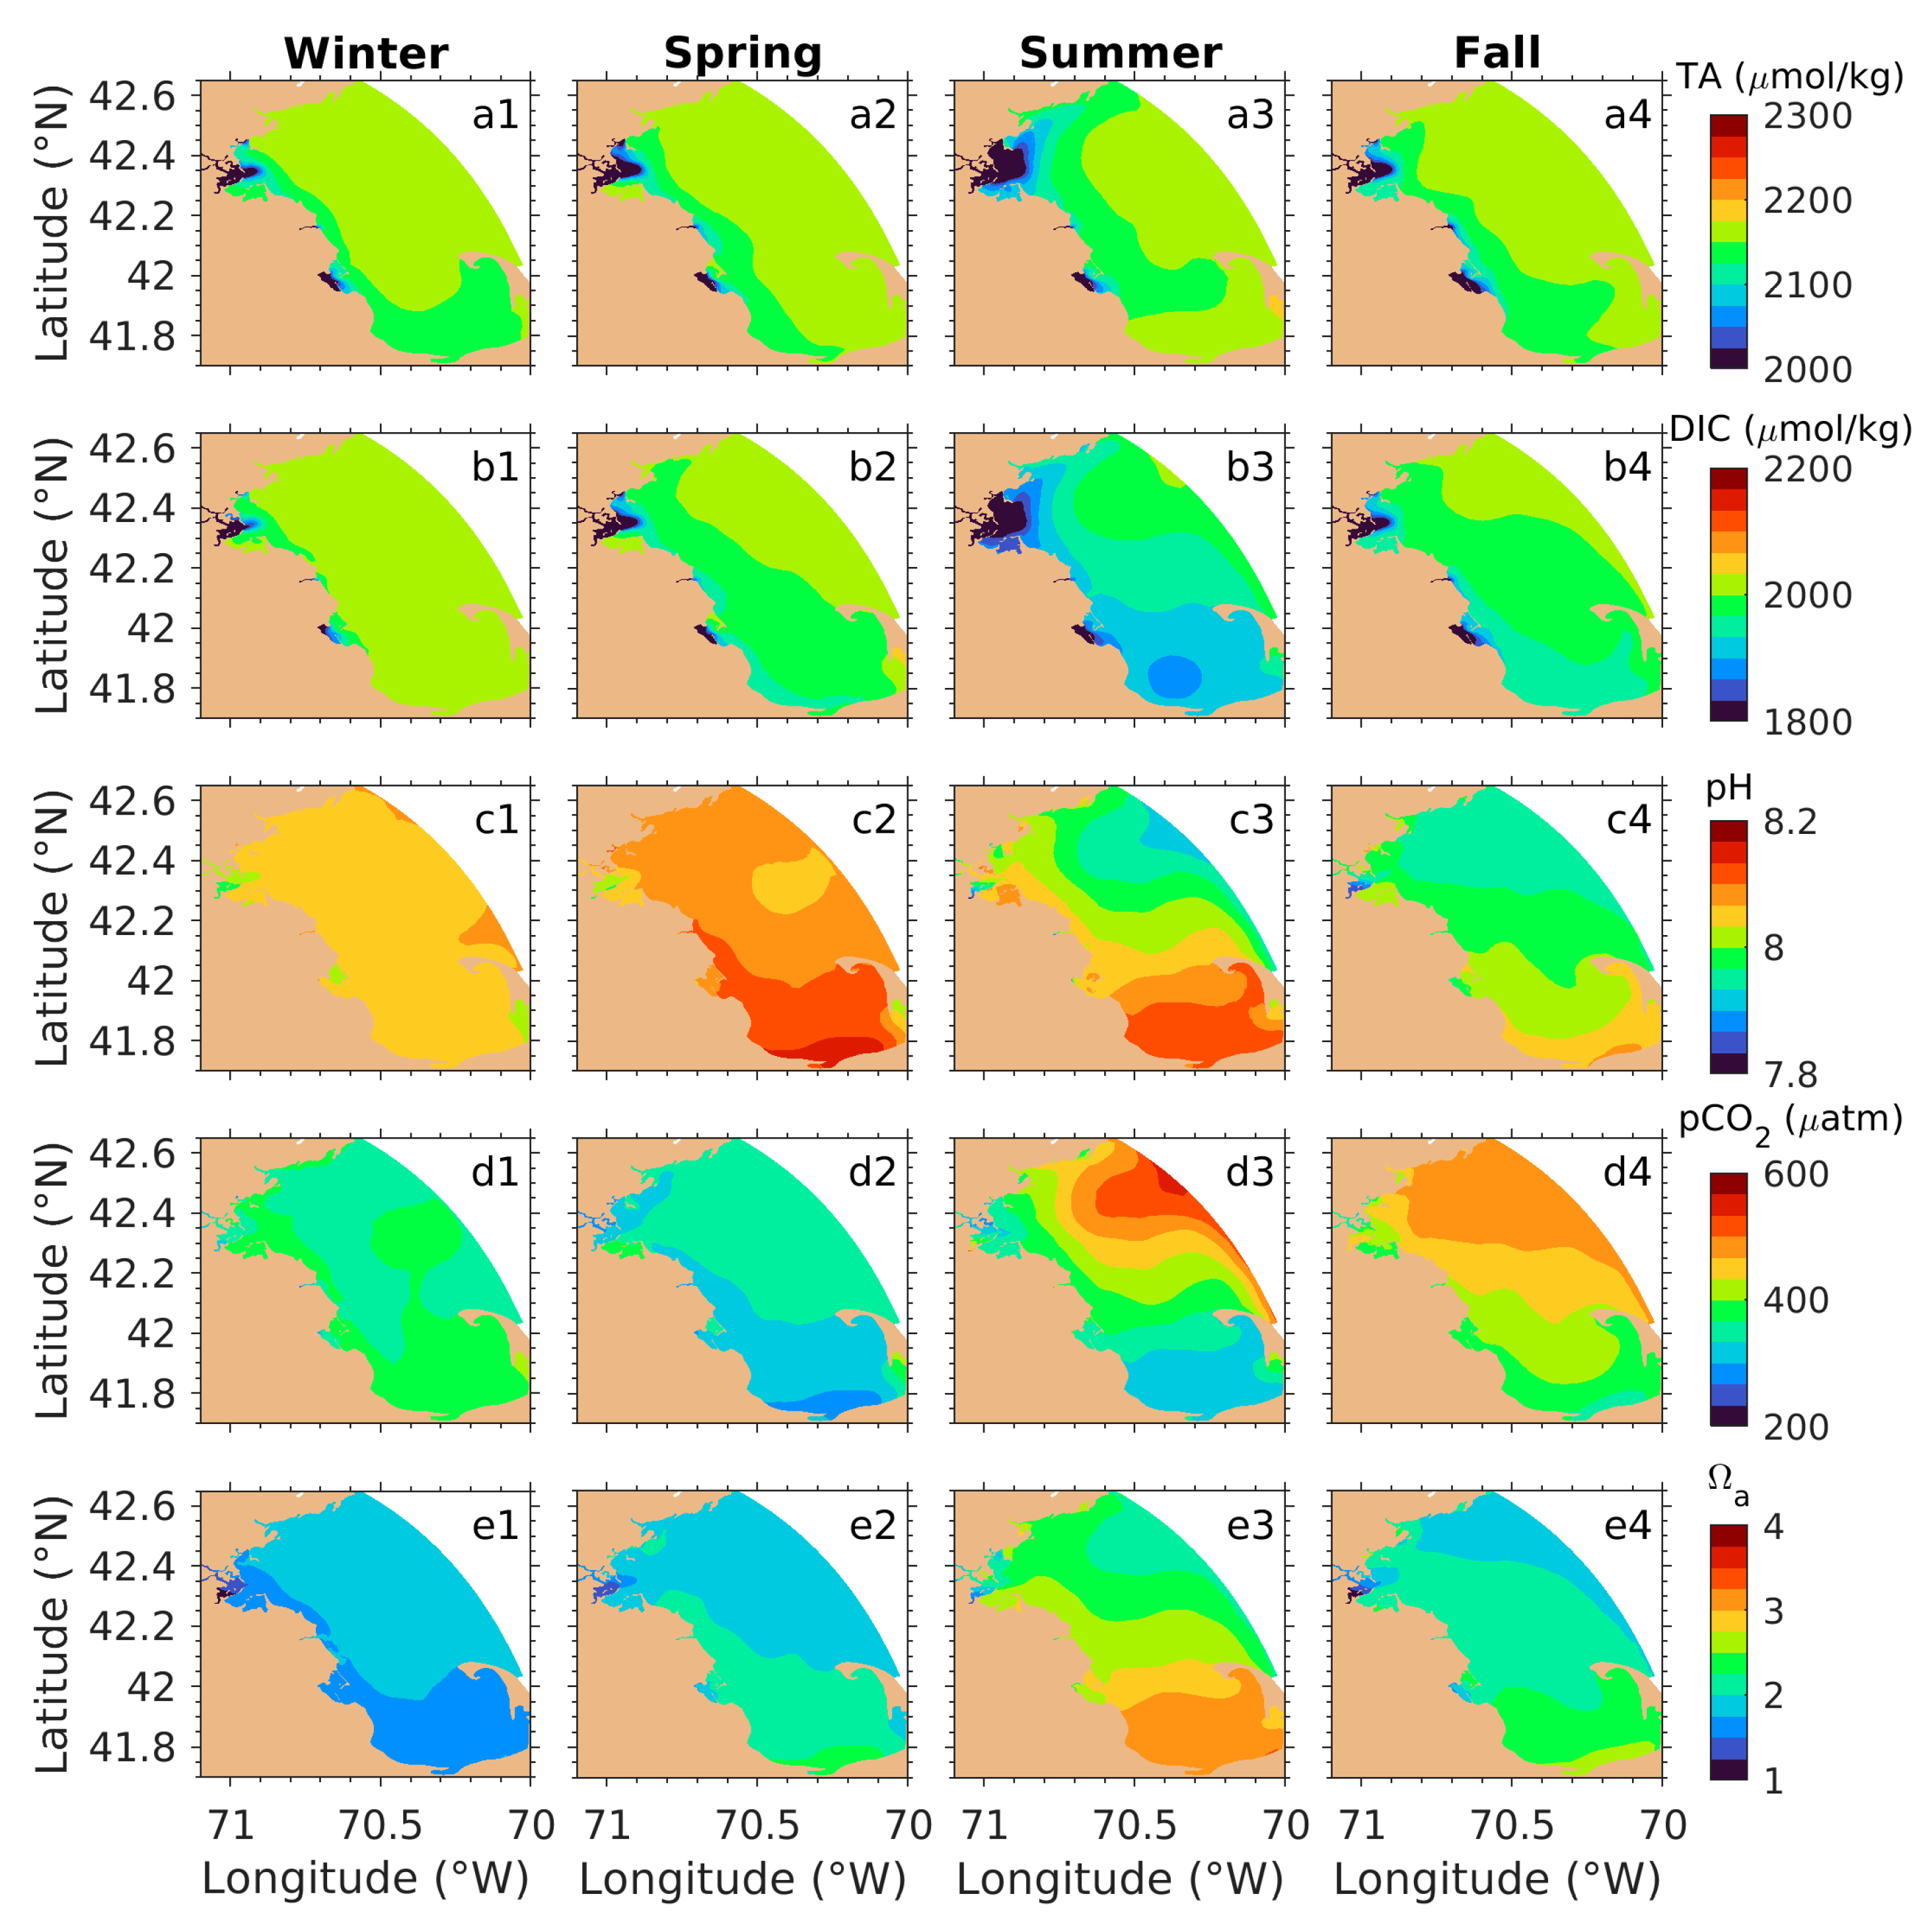
Here, the focus is primarily on key ocean acidification variables, while detailed seasonal distributions of other biogeochemical parameters are provided in the Appendix A. The seasonal and spatial distributions of TA and DIC displayed striking similarities, particularly in Boston Harbor (Figure 9(a1–b4)). Boston Harbor was strongly influenced by river runoff, which introduced water with lower DIC and TA concentrations. As a result, simulated DIC and TA levels within the harbor consistently remained below 1800 μmol/kg and 2000 μmol/kg, respectively. These low levels contributed to relatively low p H values (Figure 9(c1–c4)), despite the comparatively low pCO2 shown in Figure 9(d1–d4). The lowest pH values were observed during summer and fall, coinciding with the lowest Ωa in the harbor, which dropped to approximately 1.5 (Figure 9(e1–e4)).
Figure 9. Simulated seasonal mean surface distributions of total alkalinity (TA: (a1a4)), dissolved inorganic carbon (DIC: (b1b4)), pH (c1c4), partial pressure of carbon dioxide (pCO2: (d1d4)) and aragonite saturation state (Ωa: (e1e4)). Panels 1–4 represent winter, spring, summer, and fall, respectively.
Remotesensing 17 02651 g009
Other estuarine regions, such as Scituate Harbor and Plymouth Bay fed by the North and John Rivers, also exhibited reduced DIC and TA due to riverine inputs. However, these areas maintained slightly higher pH levels compared to Boston Harbor. These coastal estuaries were particularly susceptible to ocean acidification, especially during winter months.
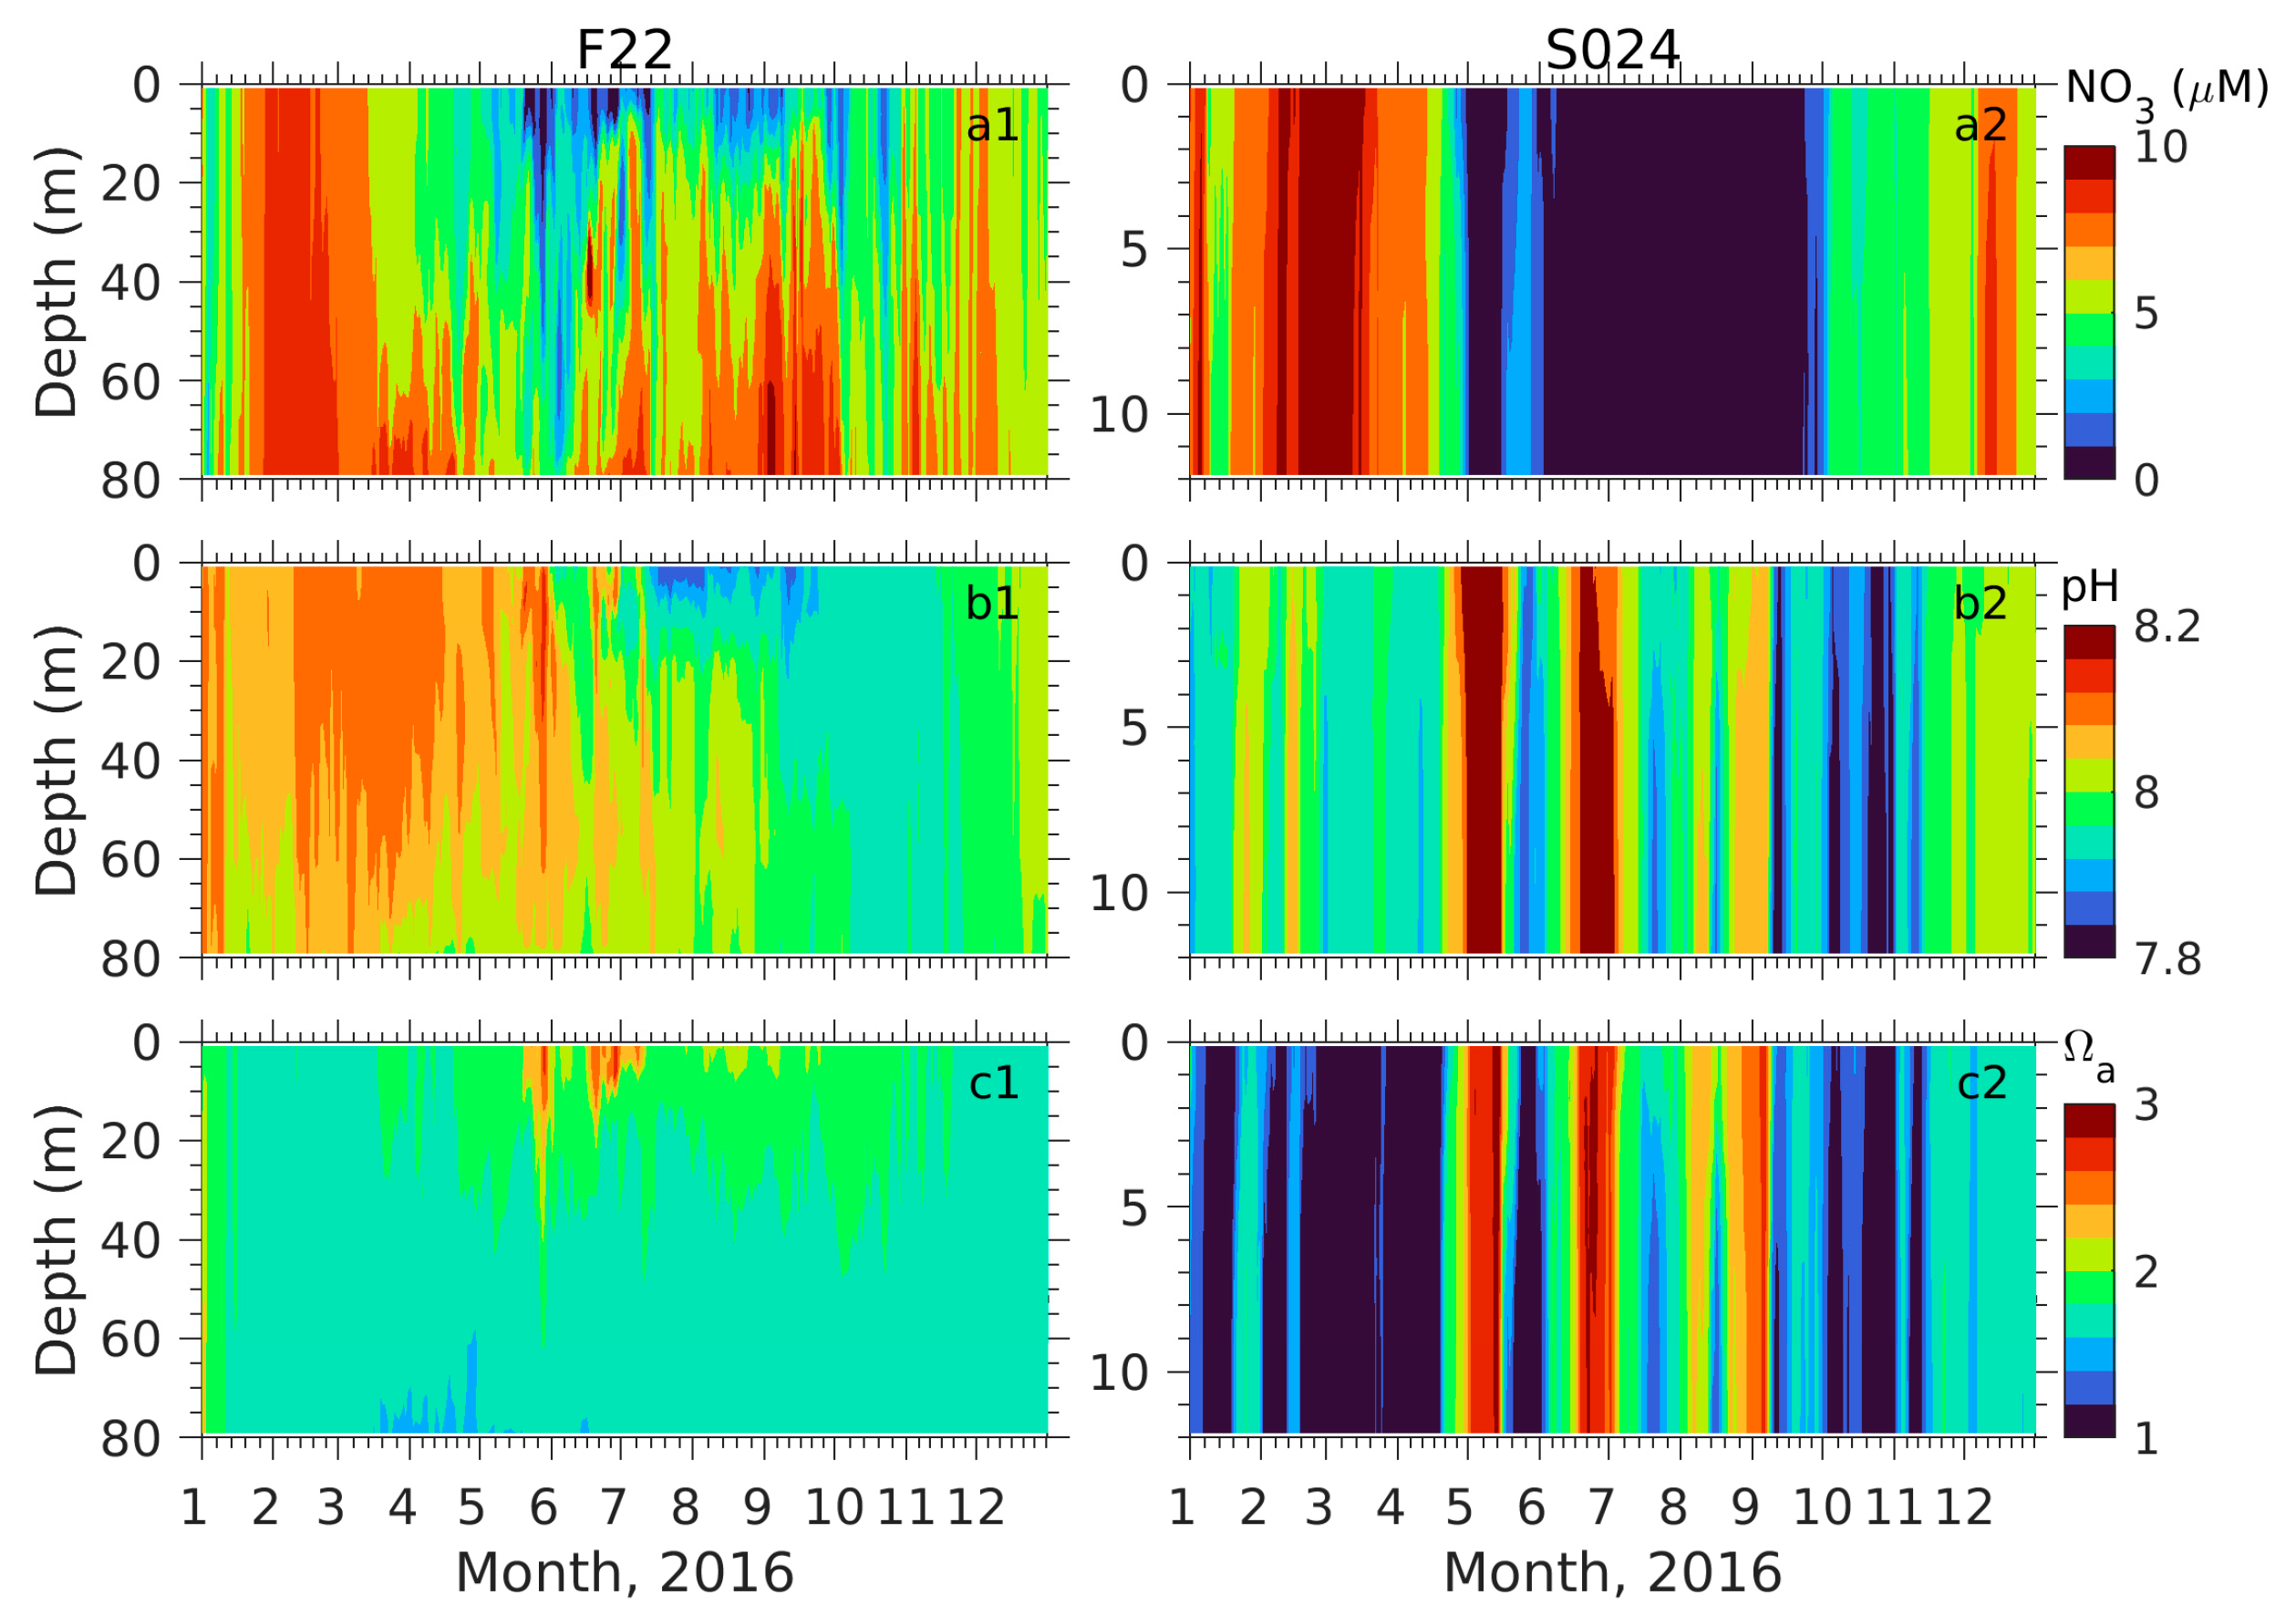
To illustrate the vertical profiles of nitrate, pH, and Ωa under stratified and mixed conditions in the outer and inner bays, two representative deep and shallow sites, F22 and S024, for example, were selected (Figure 10). At F22, seasonal fluctuations in nitrate concentrations were primarily confined to the upper water column and closely tied to stratification. Nitrate levels began declining in March due to phytoplankton uptake, remained low (<3.0 μM) under intensified stratification from spring to summer, and rebounded to high values (~8.0 μM) following wind-induced mixing in late fall. At this site, pH values below 8.0 were recorded from July to November, reaching a minimum of approximately 7.86 near the surface in July. Seasonal pH changes were closely linked to temperature variations, with the lowest p H coinciding with peak temperature (>10 °C, Figure 7(a1)). In contrast, Ωa showed no direct correlation with p H . The lowest Ωa values (<1.4) occurred near the bottom in April through May, corresponding to relatively low bottom pH levels. Although the lowest pH during the summertime did not align with the lowest Ωa value, a noticeable decrease in Ωa was still observed during periods of reduced pH.
At S024, weak stratification in winter and spring resulting from freshwater runoff from rivers did not significantly affect the vertical profiles of nitrate, pH, and Ωa. These variables exhibited synchronous changes throughout the water column, reflecting a vertically well-mixed environment. Nitrate concentrations followed a seasonal pattern similar to F22, with a rapid decline in spring, a minimum in summer, and escalating in fall. However, the restoration of nitrate levels at this site after summer was likely driven by horizontal advection rather than vertical mixing, given the well-mixed water column. Seasonal variations in p H at S024 mirrored those at F22, though in a vertically homogeneous context. Similar to F22, the lowest Ωa values at S024 occurred during spring, dropping to almost 1.0.

3.3. Quantitative Model Skill Assessment

The performance of NeBEM was evaluated using quantitative statistical analysis based on three key metrics: CF, PB, and ARMAE [46,47,48]. The evaluation criteria for these metrics are summarized in Table 3. Statistical assessments were performed for key parameters, including temperature, salinity, nitrate, ammonium, phosphate, silicate, dissolved oxygen, chlorophyll-a, and pH. The results are presented in Table 4 for the outer bay and Table 5 for the inner bay.
Temperature and salinity showed excellent performance in both the outer and inner bays, achieving ratings of “excellent and very good.” Under these consistent physical conditions, NeBEM also achieved “good” or higher scores for all biogeochemical variables, with slightly better performance in the outer bay. CF scores were rated as “excellent” or “very good” for all variables in the outer bay and ranged from “good” to “excellent” in the inner bay. As CF is calculated as the ratio of mean absolute error to observed standard deviation, these results indicate that model errors fell within the range of natural variability, supporting the model’s ability to capture seasonal and spatial patterns robustly.
The PB metric, which measures the average bias relative to observed means (positive for overestimation, negative for underestimation), provided additional insights. NeBEM achieved predominantly “excellent” or “very good” PB scores for most variables, except for nitrate and chlorophyll-a in the outer bay and phosphate and chlorophyll-a in the inner bay. These exceptions highlight cases where the model’s mean values deviated noticeably from observations.
The ARMAE metric further assessed model performance by incorporating measurement uncertainties. A negative ARMAE value indicates that model biases were smaller than observational uncertainties, qualifying the simulation as “excellent” or “very good.” Despite significant biases flagged by PB, ARMAE scores showed reasonable performance for nitrate and chlorophyll-a in the outer bay, and for phosphate and chlorophyll-a in the inner bay. However, notable discrepancies were observed in ammonium and silicate simulations, where performance varied between the outer and inner bays. Overall, ARMAE provided a more objective measure of model accuracy by focusing on absolute errors rather than average bias.
Collectively, these metrics demonstrated NeBEM’s strong performance in simulating dissolved oxygen and p H . This robust capability highlights NeBEM’s potential as a scientific tool for assessing the ocean acidification in Massachusetts Bay and Boston Harbor, reinforcing its value for environmental research and monitoring.
It is important to note that these statistical metrics evaluate model performance based solely on simulated results, without considering model uncertainty. Sources of uncertainty include errors in forcing data and parameterizations related to turbulence mixing in the hydrodynamic model, as well as biological and biogeochemical processes in the biogeochemical model. Unlike hydrodynamic models, which involve relatively few parameters, the biogeochemistry model includes over a hundred parameters. A sensitivity analysis by Wang et al. [22] identified the photosynthetically active fraction of shortwave radiation, the benthic calcite remineralization rate, and silt absorption as the most sensitive parameters contributing to model bias.

4. Discussion

4.1. Processes Contributing to TA and DIC Variations

In the three-dimensional NeBEM simulations, TA and DIC in the water column are influenced by biogeochemical processes and physical transport/mixing mechanisms. Variations in TA are driven by net community production, calcite dissolution and calcification, nitrification/denitrification, and benthic remineralization. Similarly, changes in DIC result from net community production, air–sea carbon dioxide exchange, benthic remineralization, and calcite dynamics. The inclusion of advection introduces additional complexity to daily changes in TA and DIC, contrasting with the simpler dynamics of a one-dimensional system. Without advection, TA and DIC would behave similarly to a one-dimensional process.
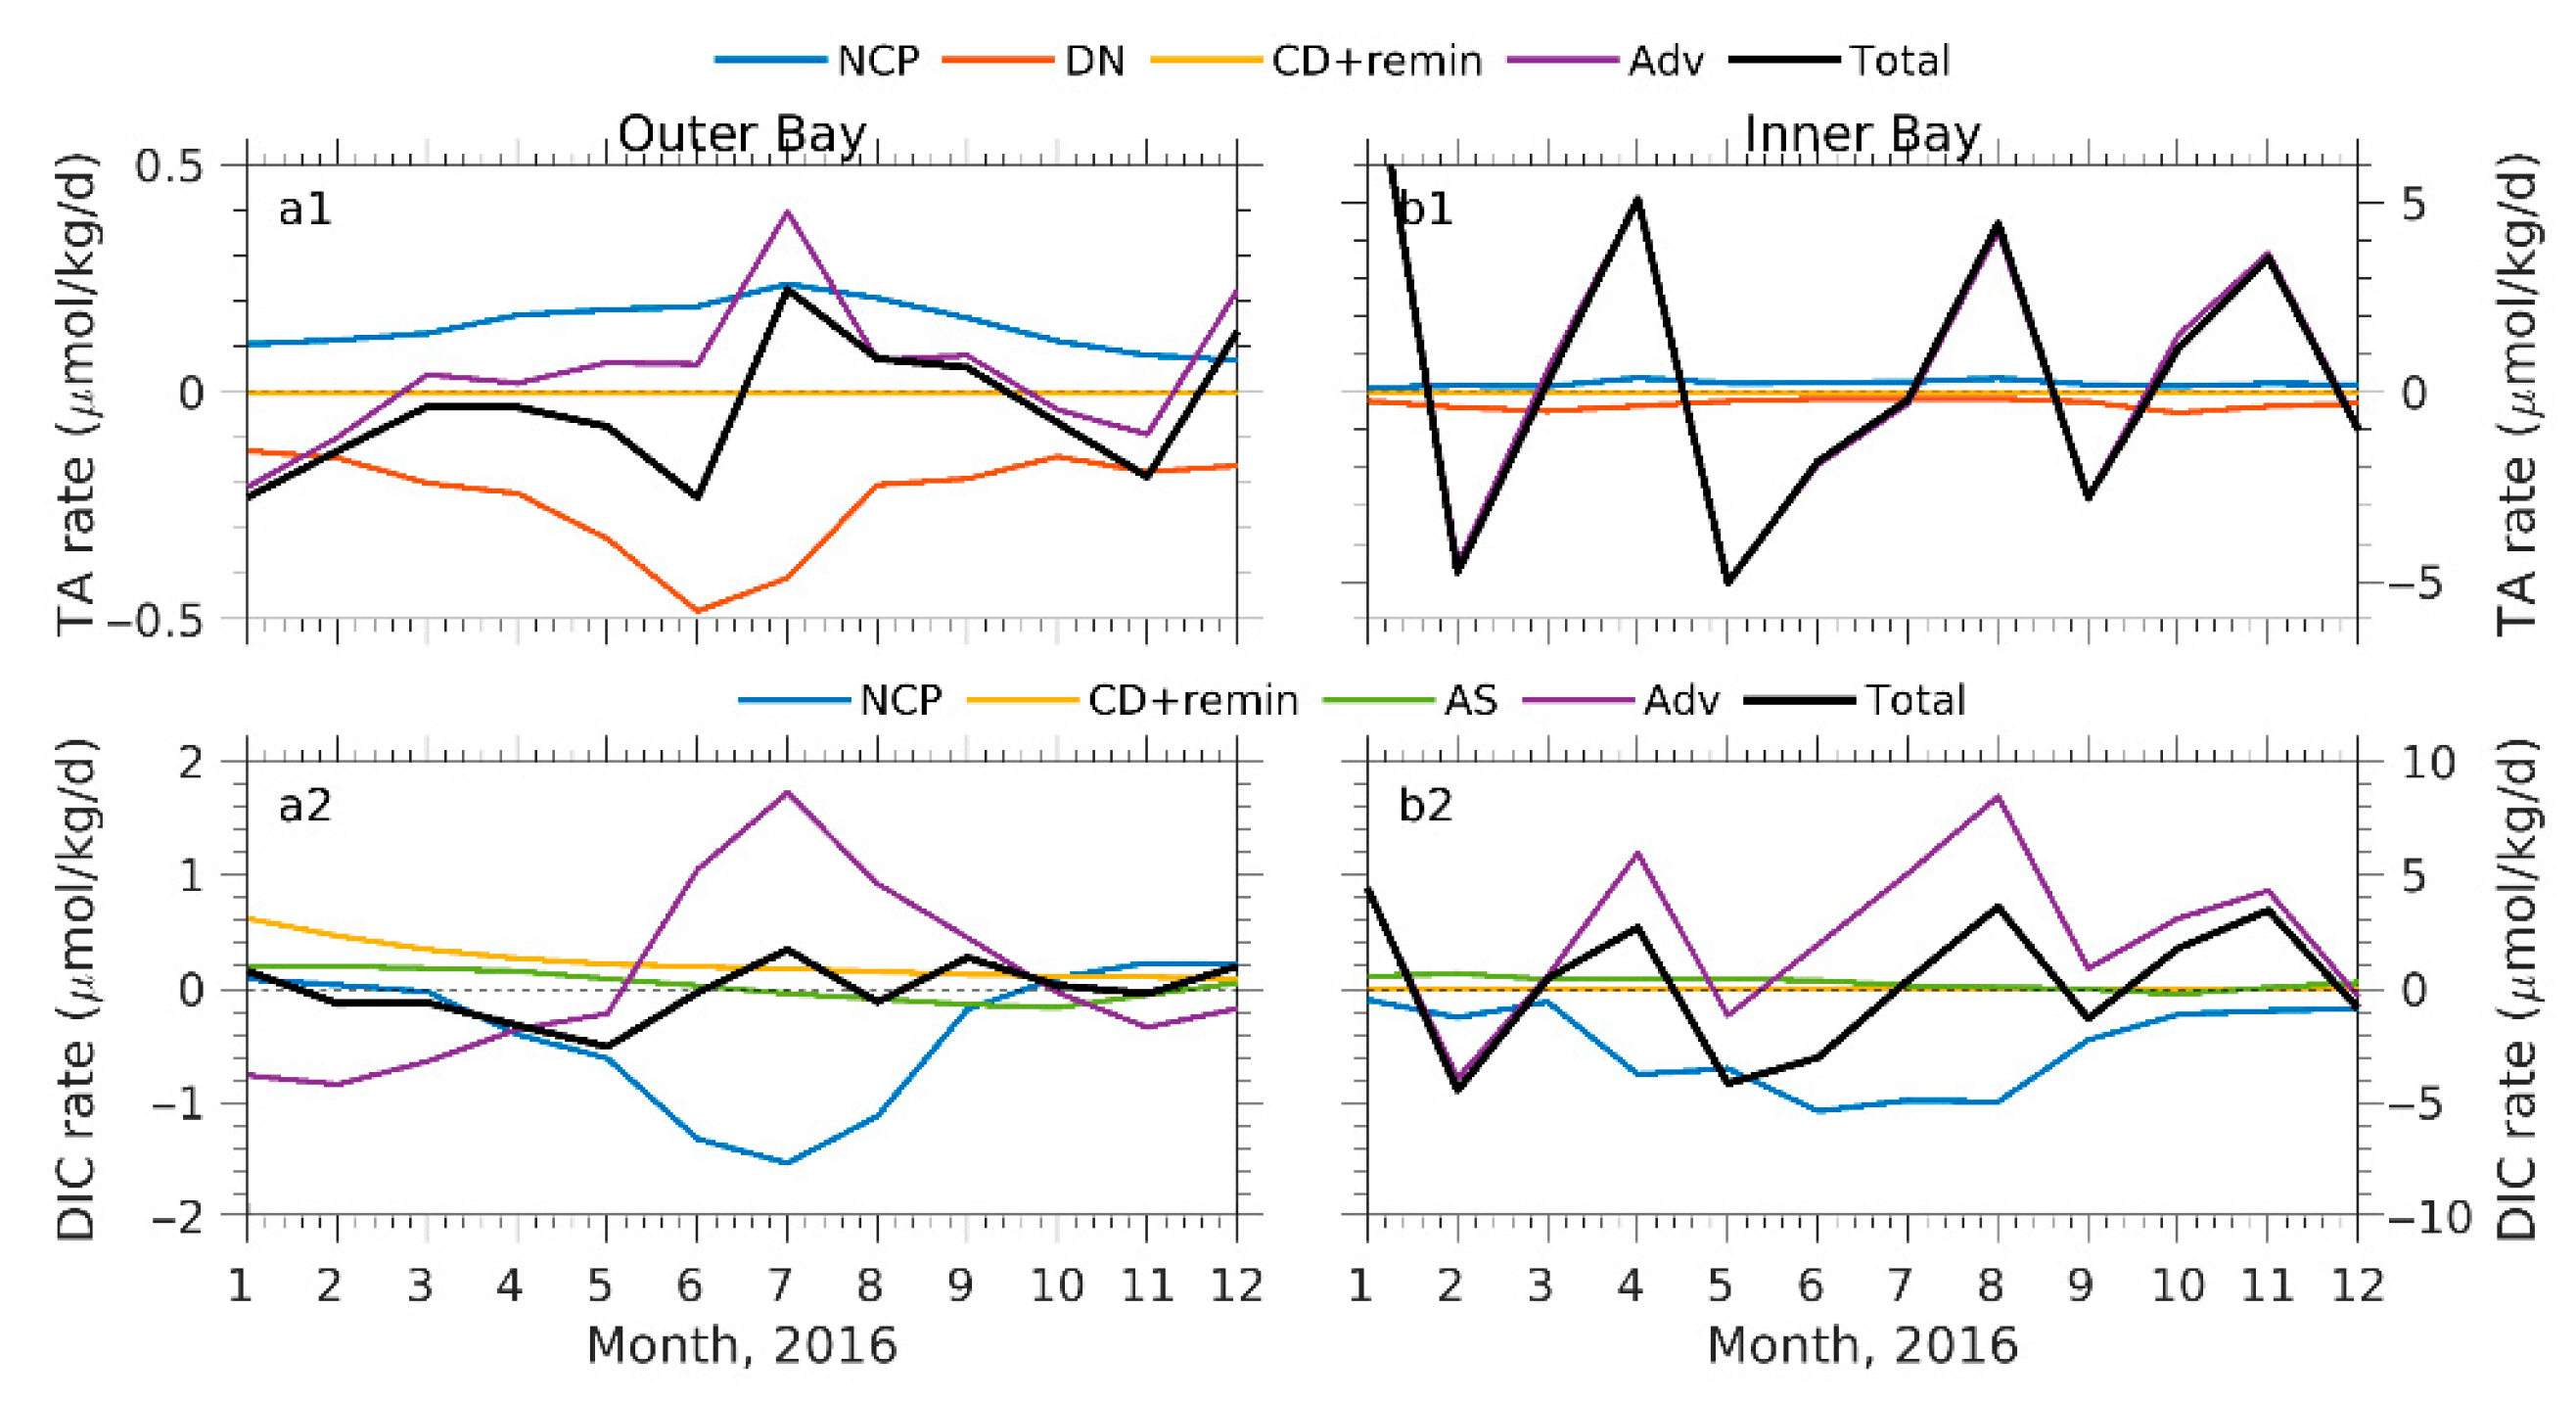
In the outer bay, seasonal variations of TA and DIC were relatively moderate, within approximately ± 15 and ± 12 μmol/kg, respectively. The saturation state of calcite remained stable, leading to nearly constant rates of calcification and dissolution. Daily TA fluctuations were primarily controlled by nitrification/denitrification, net community production, and advection, with benthic remineralization contributing minimally (Figure 11(a1)). DIC followed a similar seasonal pattern, dominated by net community production and advection, with lesser influence from benthic remineralization and air–sea carbon dioxide interactions (Figure 11(a2)). This dominance of biogeochemical processes suggests that atmospheric carbon dioxide loading from climate change may play a limited role in seasonal ocean acidification variability at the bay-wide scale.
In contrast, the inner bay, particularly in Boston Harbor, displayed much larger seasonal ranges of ± 130   μmol/kg for TA and ± 138   μmol/kg for DIC. Here, daily TA variability was predominantly driven by advection, while net community production and nitrification/denitrification effects tended to offset each other (Figure 11(b1)). For DIC, advection and net community production again emerged as the dominant drivers, while calcite dissolution/calcification, remineralization, and air–sea carbon dioxide exchanges contributed little. These results underscore the critical importance of accurately resolving complex geometries and riverine inputs for simulating acidification processes in the inner bay.
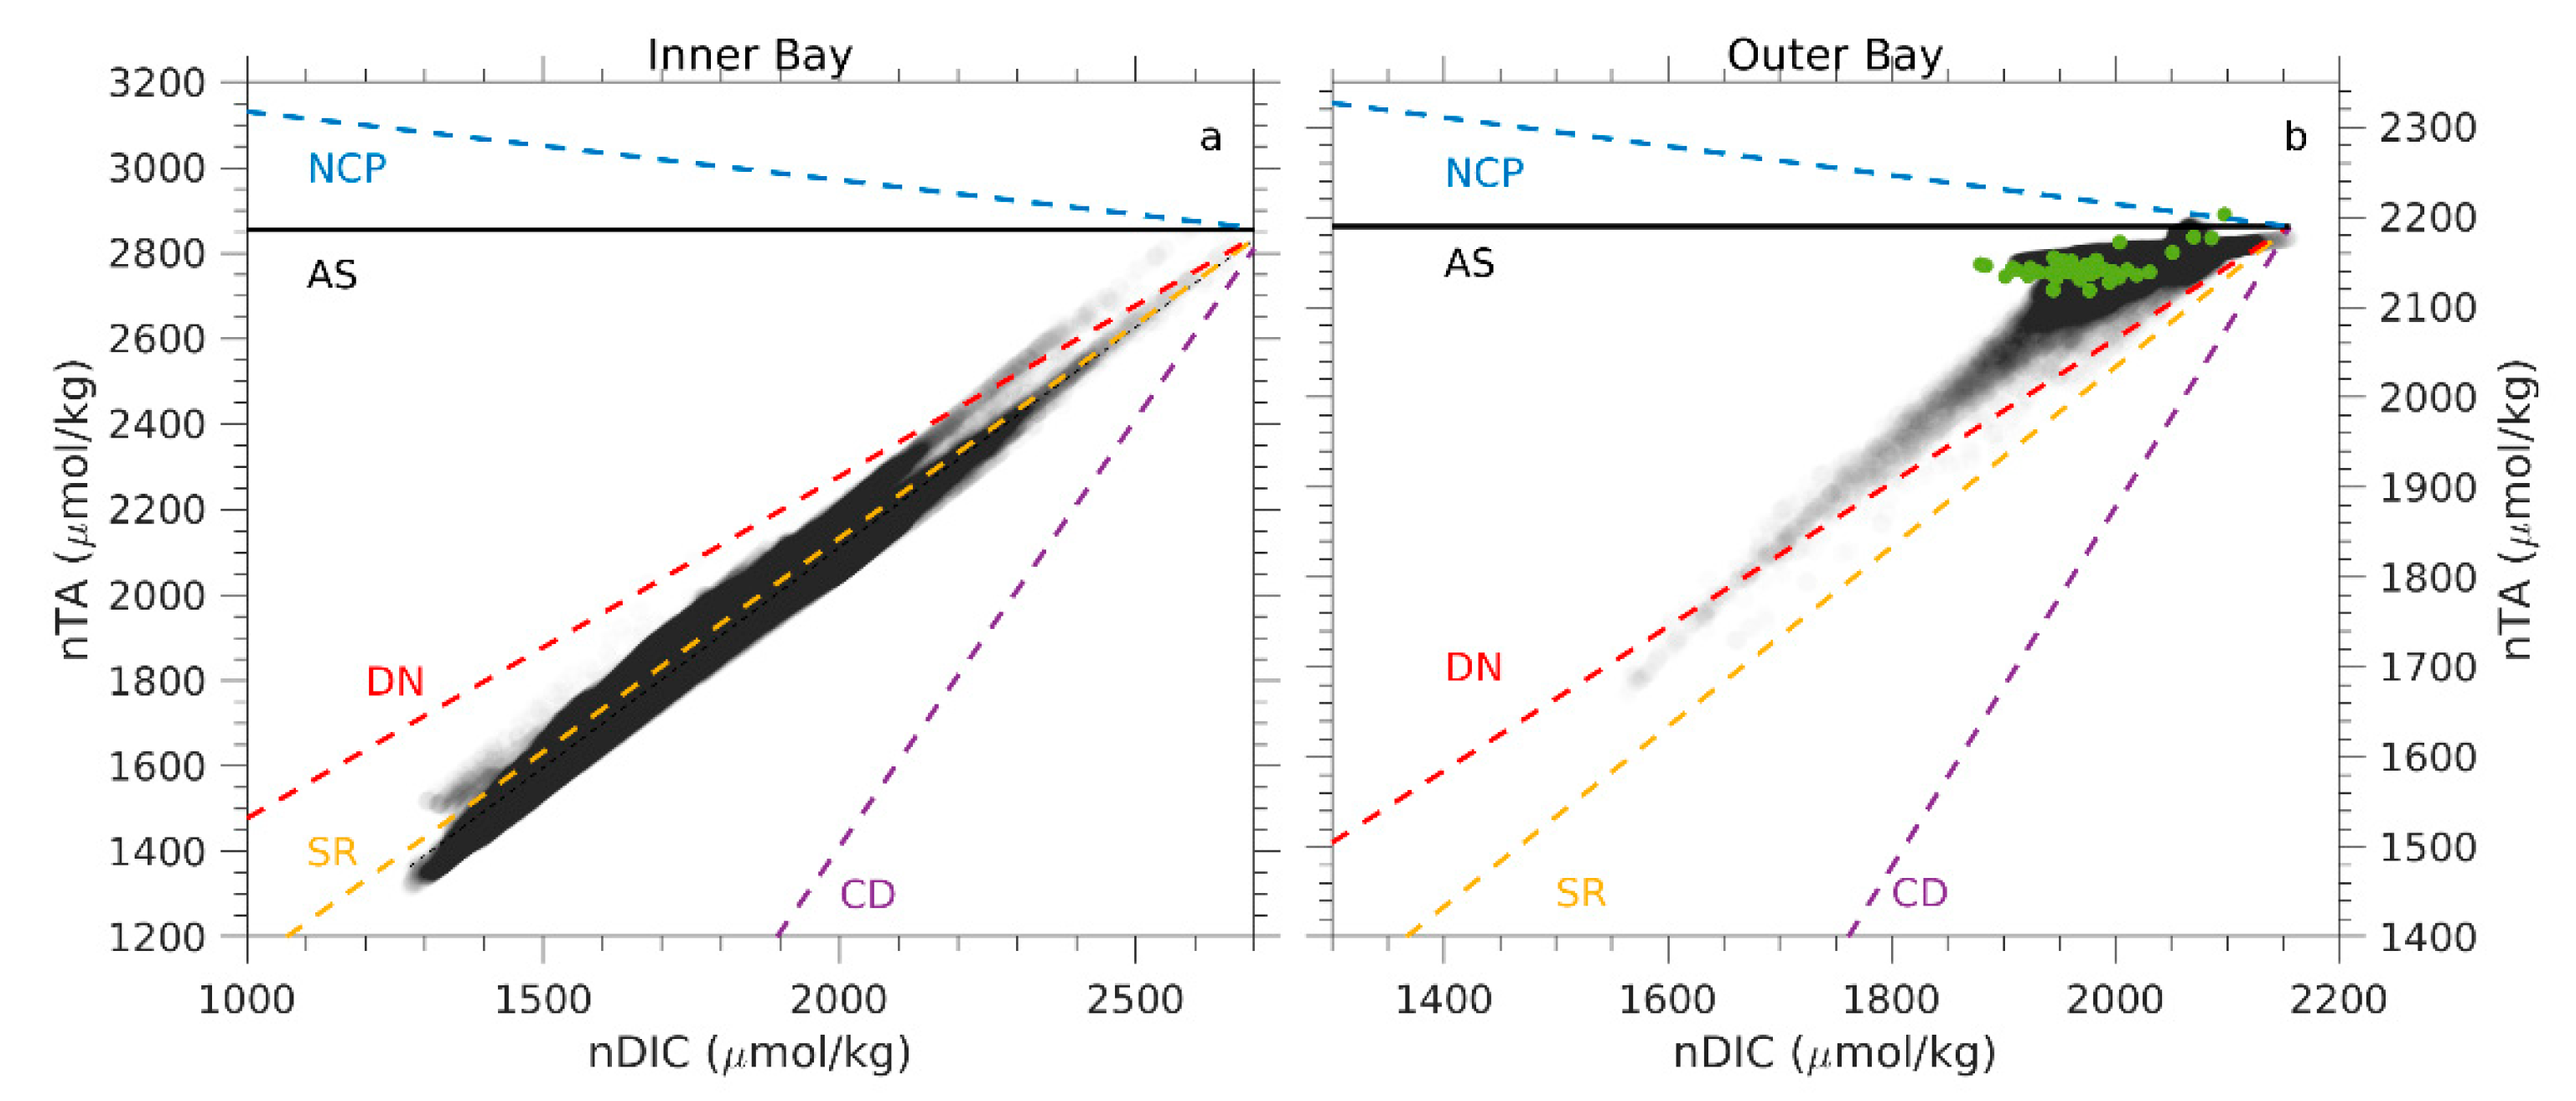
As highlighted by Burdige [53] and Krumins et al. [54], the ratio of changes in TA to change in DIC (ΔTA:ΔDIC), known as nTA:nDIC ratio, serves as a useful diagnostic of the relative contributions of different processes. Characteristic nTA:nDIC ratios have been reported for several processes: approximately −0.16 to −0.2 for net community production [55,56], around 1.0 for sulfate reduction (Sippo et al., 2016), approximately 2.0 for calcite dissolution/calcification [55,56], about 0.8 for nitrification/denitrification [55], and 0.0 for air–sea carbon dioxide exchange [52].
Analysis of model-simulated TA and DIC changes plotted on an nTA- nDIC diagram (Figure 12) revealed clear differences between the inner and outer bays. In the inner bay, the annual slope of the nTA:nDIC relationship was approximately 1.03, suggesting that the nitrification/denitrification dominated TA variability in the absence of sulfate reduction. In the outer bay, two distinct slopes emerged, reflecting the influences of net community production, air–sea carbon dioxide exchange (affecting DIC), and nitrification/denitrification on TA and DIC changes.
Historic observations of nTA:nDIC in the outer bay, included in Figure 12, fell within the model-simulated range. This agreement demonstrates that NeBEM successfully reproduced both the seasonal variability of pH and the biogeochemical processes driving the TA and DIC dynamics. These findings are consistent with process-oriented experiments, which also reveal distinct biogeochemical mechanisms in the inner and outer bays.
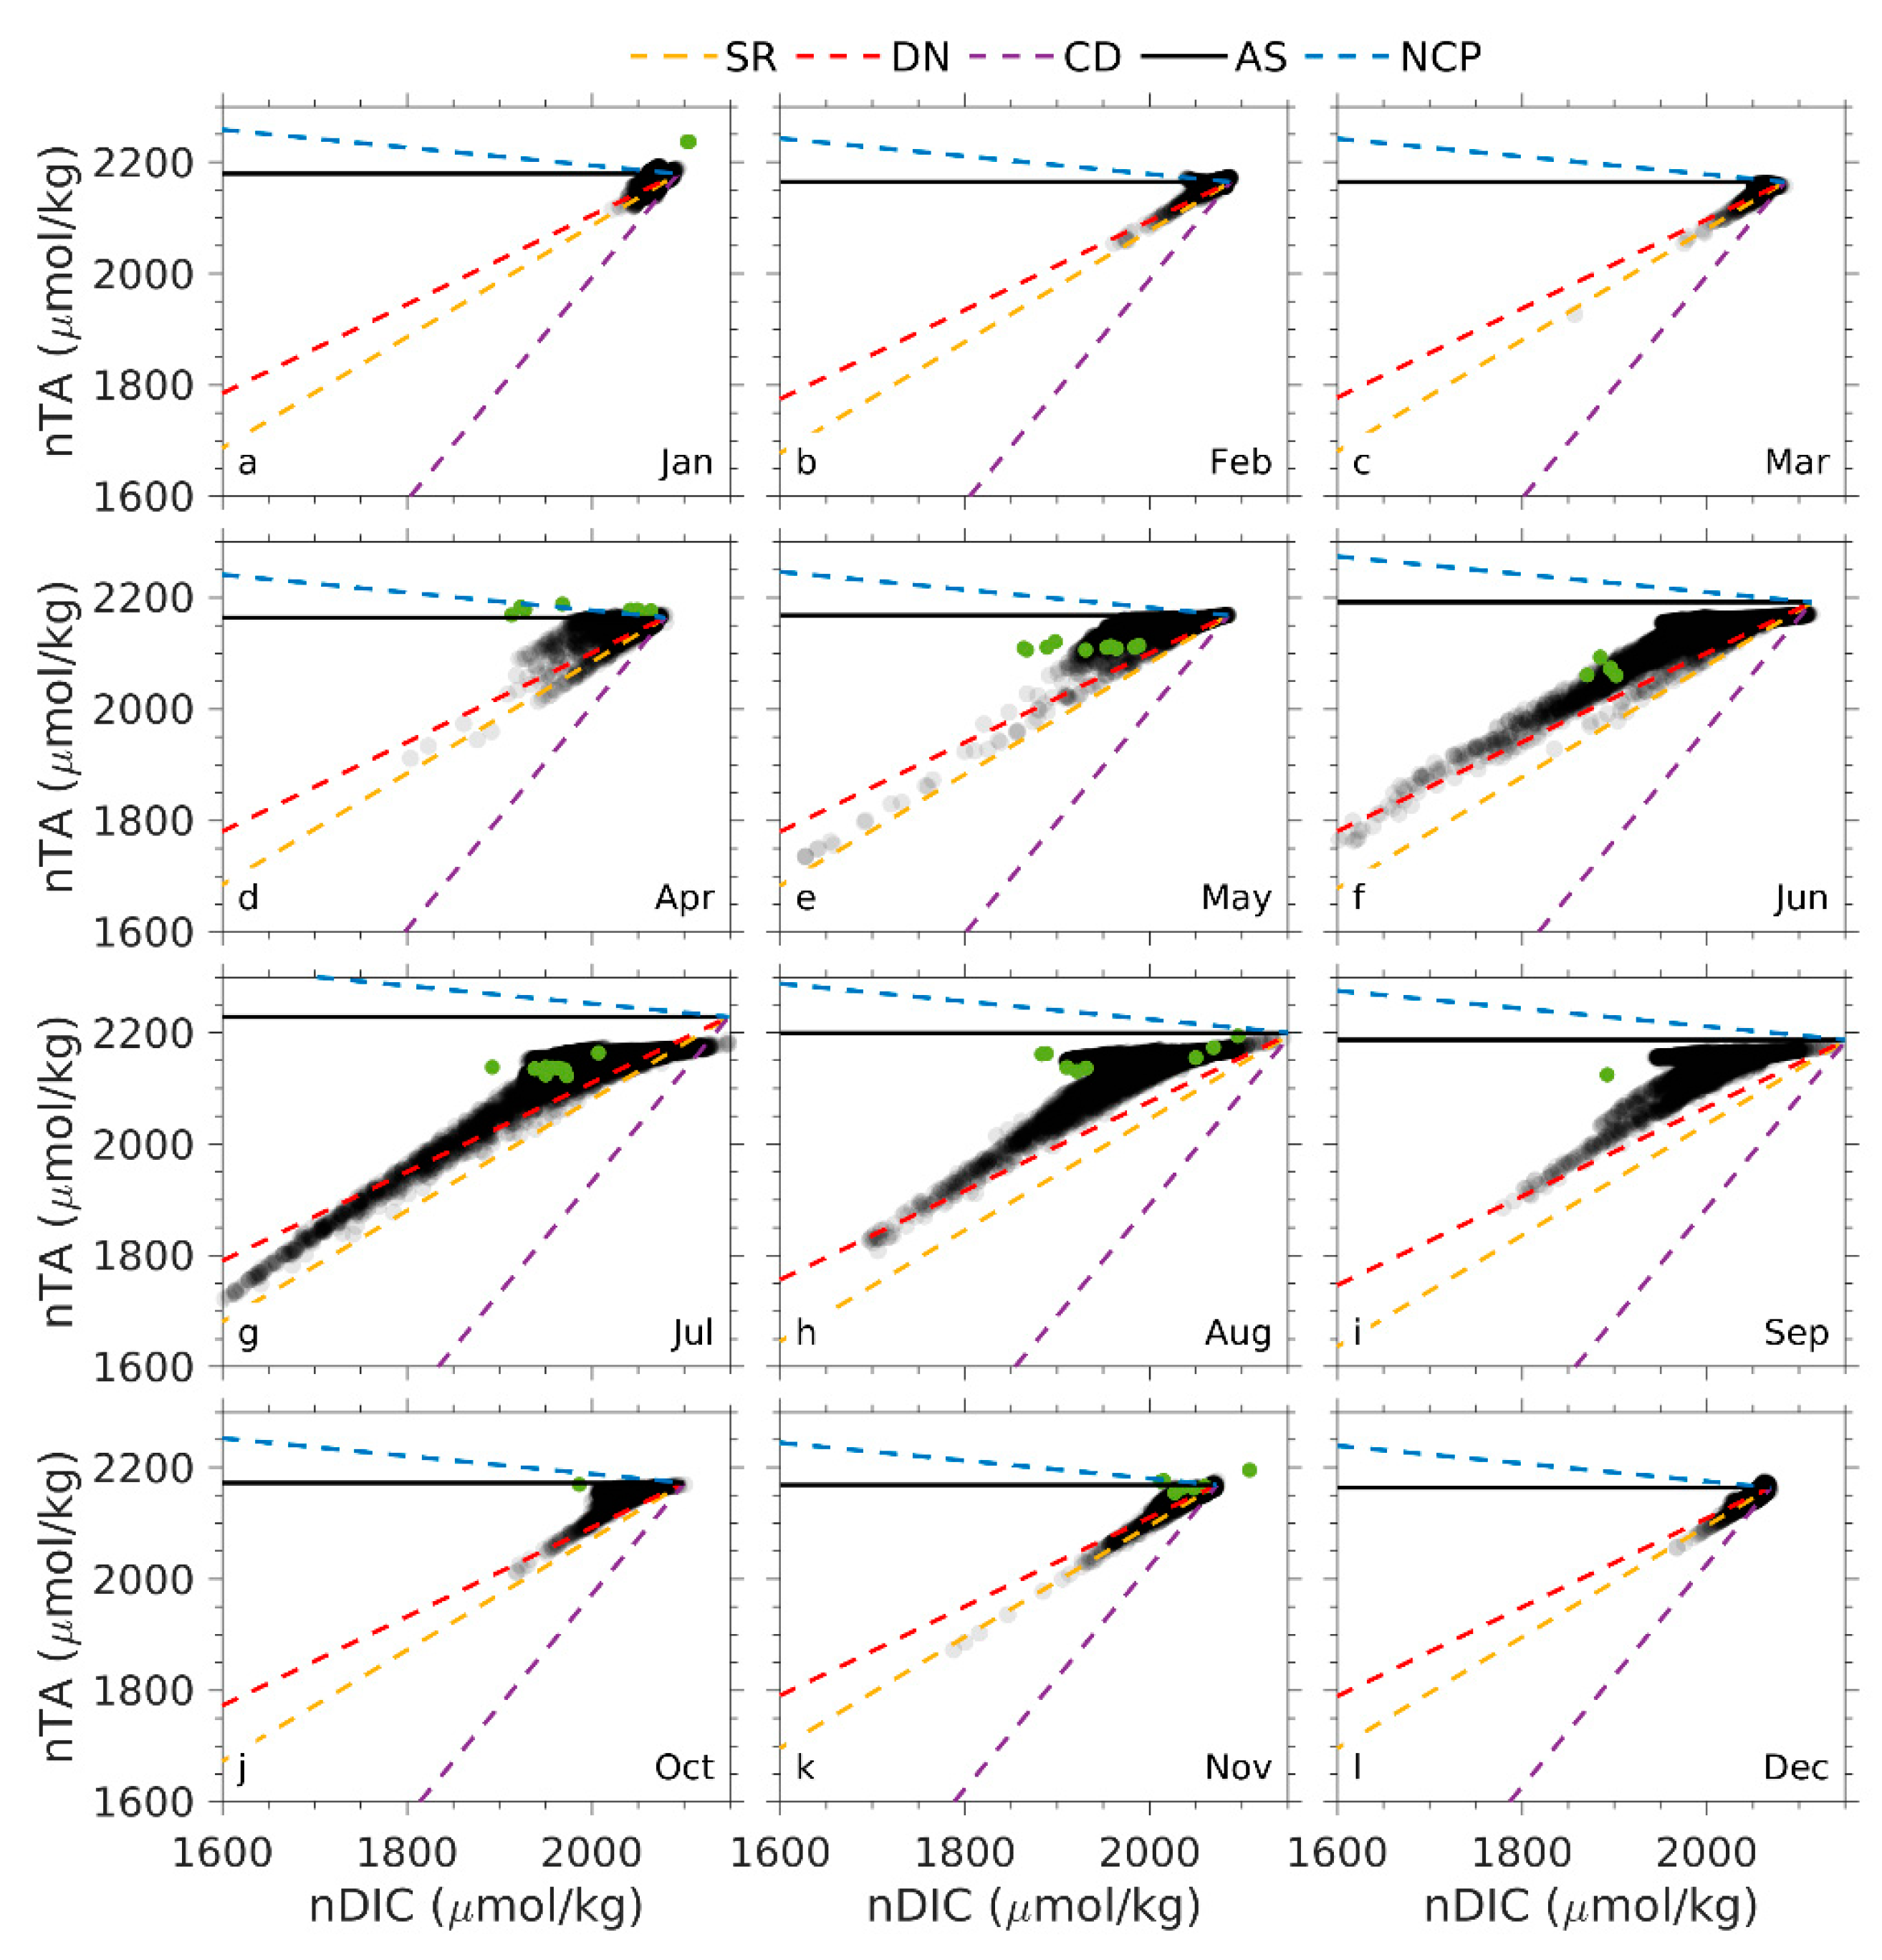
To further investigate, monthly mean nTA:nDIC values were analyzed (Figure 13). From November to March, nitrification/denitrification were the primary drivers, except in January when simulated values clustered near the intersection point of all processes. A closer look at the diagrams within TA and DIC ranges of 2000–2200 μmol/kg and 1900–2000 μmol/kg, respectively, confirmed the dominance of nitrification/denitrification during cooler months.
Between April and October, the scatterplots revealed two distinct clusters: one aligned with slopes of net community production and air–sea carbon dioxide exchange, and the other near the slope of nitrification/denitrification. This pattern suggests that during the warmer months, a combination of net community production, air–sea carbon dioxide exchange, and nitrification/denitrification controlled the variations in TA and DIC.
Interestingly, our finding that biogeochemical processes dominate DIC changes in the outer bay contrasts with global consensus on ocean acidification, which attributes pH and pCO2 changes primarily to atmospheric carbon dioxide increases. On a global scale, atmospheric carbon dioxide has been directly linked to rising pCO2 and decreasing pH in the ocean. In the northeastern United States shelf, the rate of ocean acidification matches the rate of atmospheric carbon dioxide increase [5]. Historic pCO2 and pH measurements in this region, dating back to 1932, show significant linear increase in pCO2 across all seasons (Figure 14(a1–a4)), with rates ranging from 0.64 μatm/year in winter to 2.31 μatm/year in fall.
However, this trend is less pronounced in coastal Massachusetts Bay. Seasonal increases in pCO2 were observed only in fall, while pCO2 generally decreased in winter through summer (Figure 14(a1–a4)). Our analysis aligns with Vandemark et al. [57], which found that net annual carbon dioxide flux into the northeastern U.S. shelf varies spatially and temporally. While the broader shelf acts as a sink for atmospheric carbon dioxide, this effect does not extend to nearshore regions like Massachusetts Bay.

4.2. Processes Attributing to Seasonal pCO2 and Ωa Cycles

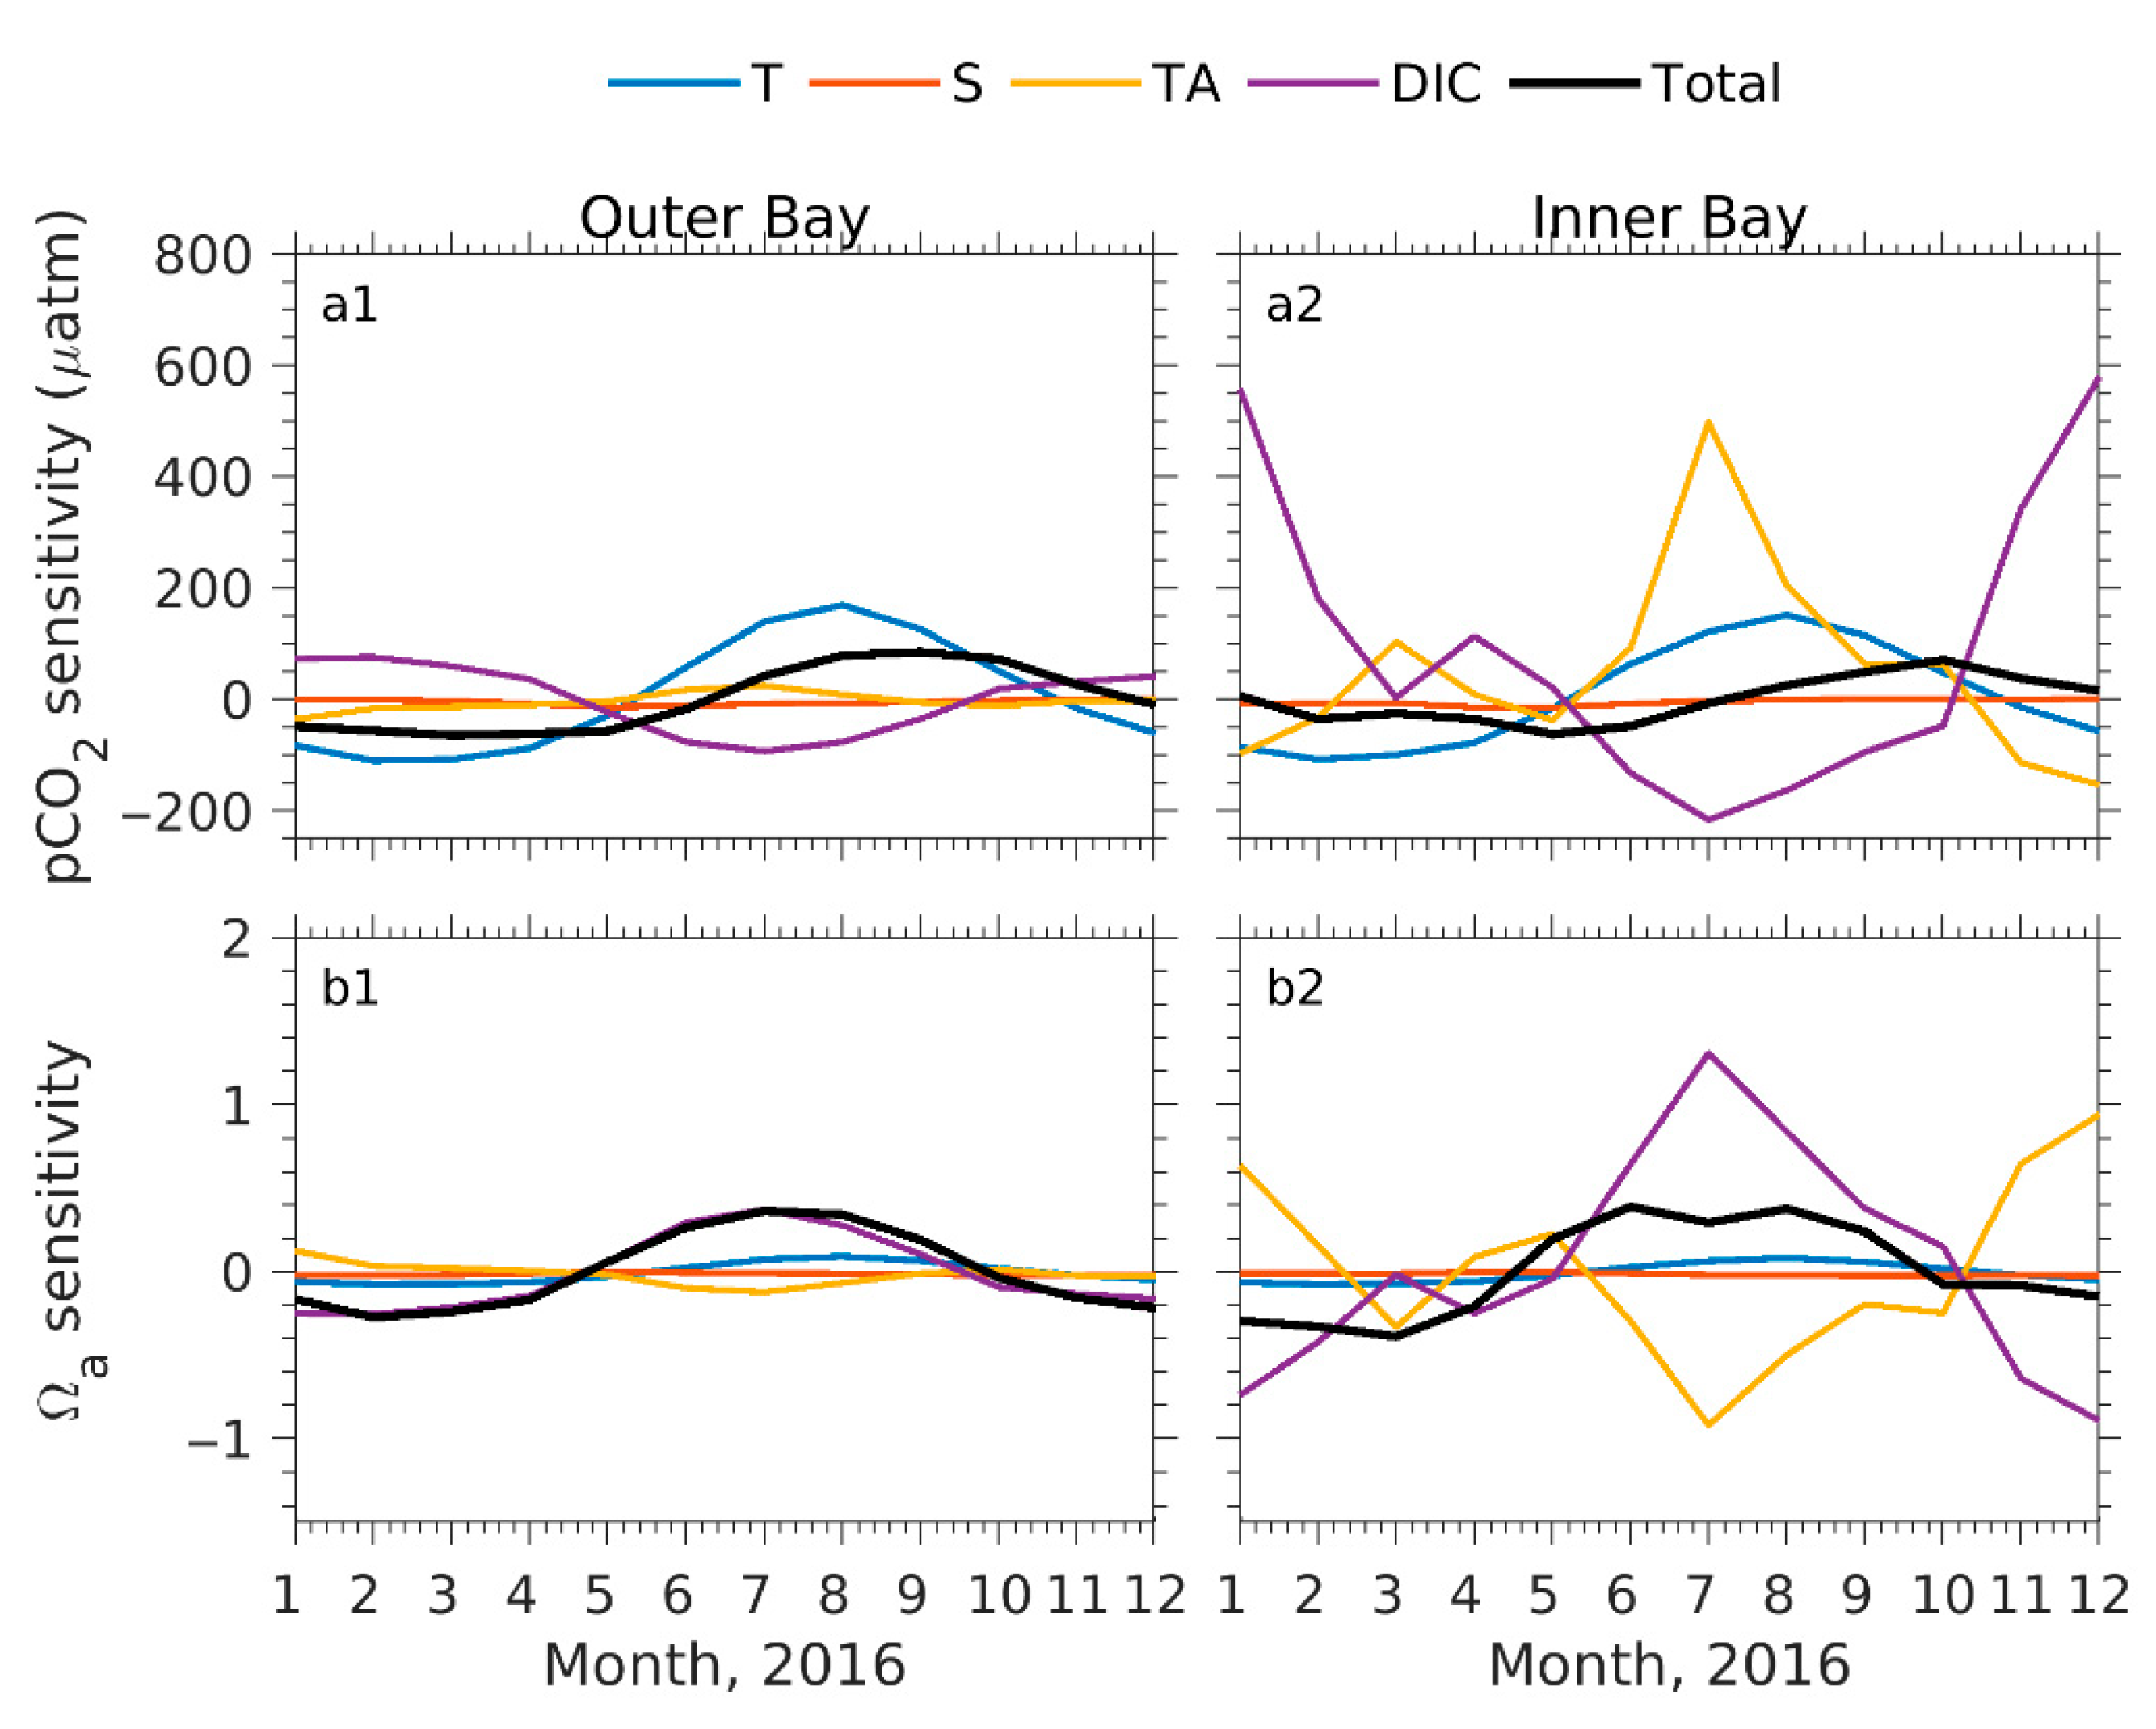
We applied the CO2SYS program [58] to assess the relative contributions of temperature, salinity, D I C , and T A to seasonal changes in pCO2 and Ωa in both outer stratified and inner mixed regions of the bay. Based on the results of one-dimensional model experiments [22], the effects of silicate and phosphate on carbonate system dynamics were determined to be negligible.
In the outer bay, the one-dimensional experiments revealed that temperature and DIC were the dominant factors controlling the seasonal variability of surface pCO2 [22]. When these investigations were extended to three-dimensional model simulations that incorporated horizontal advection, we found that advection led to a substantial alternation in TA by approximately ± 15 μmol/kg, which is about five times greater than those observed in the one-dimensional model experiments. As a result, seasonal variations in TA emerged as an essential driver of pCO2 variability (Figure 15(a1)). Meanwhile, the influence of salinity on pCO2 remained negligible in both one- and three-dimensional experiments, consistent with the observations reported by Signorini et al. [59].
The interplay between temperature and DIC also showed a clear inverse relationship across the seasons (Figure 15(a1)). Seasonal fluctuations in pCO2 closely tracked water temperature, with higher temperatures in summer corresponding to elevated pCO2 level. In contrast, DIC exhibited opposing seasonal trends: higher concentrations in winter and early spring coincided with lower pCO2 levels, and lower DIC in summer aligned with higher pCO2. TA, however, showed much smaller seasonal variations, generally an order of magnitude lower than temperature and DIC. As a result, TA did not significantly influence the overall pCO2 pattern.
For Ωa, seasonal variations in the outer bay were primarily driven by changes in DIC. Temperature and TA contributed jointly to about 25% of Ωa but their effects tended to offset each other throughout most of the year, except during August to December when they acted in phase (Figure 15(b1)). These findings are consistent with those from the one-dimensional experiments [22] and align with observations by Gledhill et al. [5]. Our NeBEM simulations suggest that accurate modeling of DIC is critical for forecasting ocean acidification trends reflected in Ωa.
In the inner bay, particularly in Boston Harbor, changes in TA became a key factor influencing both pCO2 and Ωa, alongside temperatures and DIC (Figure 15(a2,b2)). As noted earlier, horizontal advection played a dominant role in modifying TA and DIC concentrations in this highly dynamic region.
For pCO2, TA and DIC exhibited opposing seasonal trends, but their peaks did not align. TA had its strongest impact during summer, while DIC exerted the greatest influence in winter. This seasonal decoupling, combined with the effects of temperature, meant that pCO2 variability in Boston Harbor was primarily driven by TA in summer and by DIC in winter.
In contrast, Ωa variability in the inner bay was shaped by the combined effects of TA, DIC, and temperature. Although TA and DIC exhibited opposing seasonal phases, their effects on Ωa were largely synchronous, reinforcing each other throughout the year.

4.3. Inter-Model Comparisons

4.3.1. NeBEM vs. UG-RCA Performance Comparison

The water quality in Massachusetts Bay has been continuously monitored since 1992 as part of the MWRA permit for effluent discharge. These assessments have relied on eutrophication models, beginning with the coupled structured-grid semi-implicit Estuarine and Coastal Ocean Model (ECOM-is) and Row Column Advanced (RCA) water quality model [60,61,62,63]. Later, ECOM-si/RCA was replaced by the coupled unstructured-grid MB-FVCOM and UG-RCA [7,13,28]. The MB-FVCOM/UG-RCA system, with its improved representation of nearshore complex coastal geometries, significantly enhanced the simulation of observed magnitudes and seasonal cycles of key water quality variables, such as nitrogen, chlorophyll, and dissolved oxygen throughout Massachusetts Bay and Boston Harbor [64]. However, UG-RCA does not incorporate biogeochemical and ocean acidification dynamics, making it unable to directly simulate T A , DIC, pH, pCO2, and Ωa.
Comparing NeBEM and UG-RCA provides an opportunity to evaluate whether NeBEM matches or exceeds UG-RCA’s performance in simulating lower trophic level food web system. This inter-model assessment is particularly valuable for guiding stakeholders in decisions regarding further model upgrades of water quality management.
The comparison was carried out for nitrate, phosphate, ammonium, and silicate, chlorophyll-a, and dissolved oxygen at 49 near-field and far-field stations shown in Figure 1. Root Mean Square Errors (RMSEs) between model-simulated and observed data are summarized in Table 6.
Overall, NeBEM exhibited superior simulation accuracy across the bay, with notable RMSE reduction of 78% and 14% in ammonium, 71% and 97% in silicate, and 61% and 3% in dissolved oxygen in the outer and inner bays, respectively. However, spatial variability in performance was evident for other variables. For example, while NeBEM improved nitrate RMSE by 79% in the inner bay, it produced approximately three times higher errors in the outer bay compared to UG-RCA.
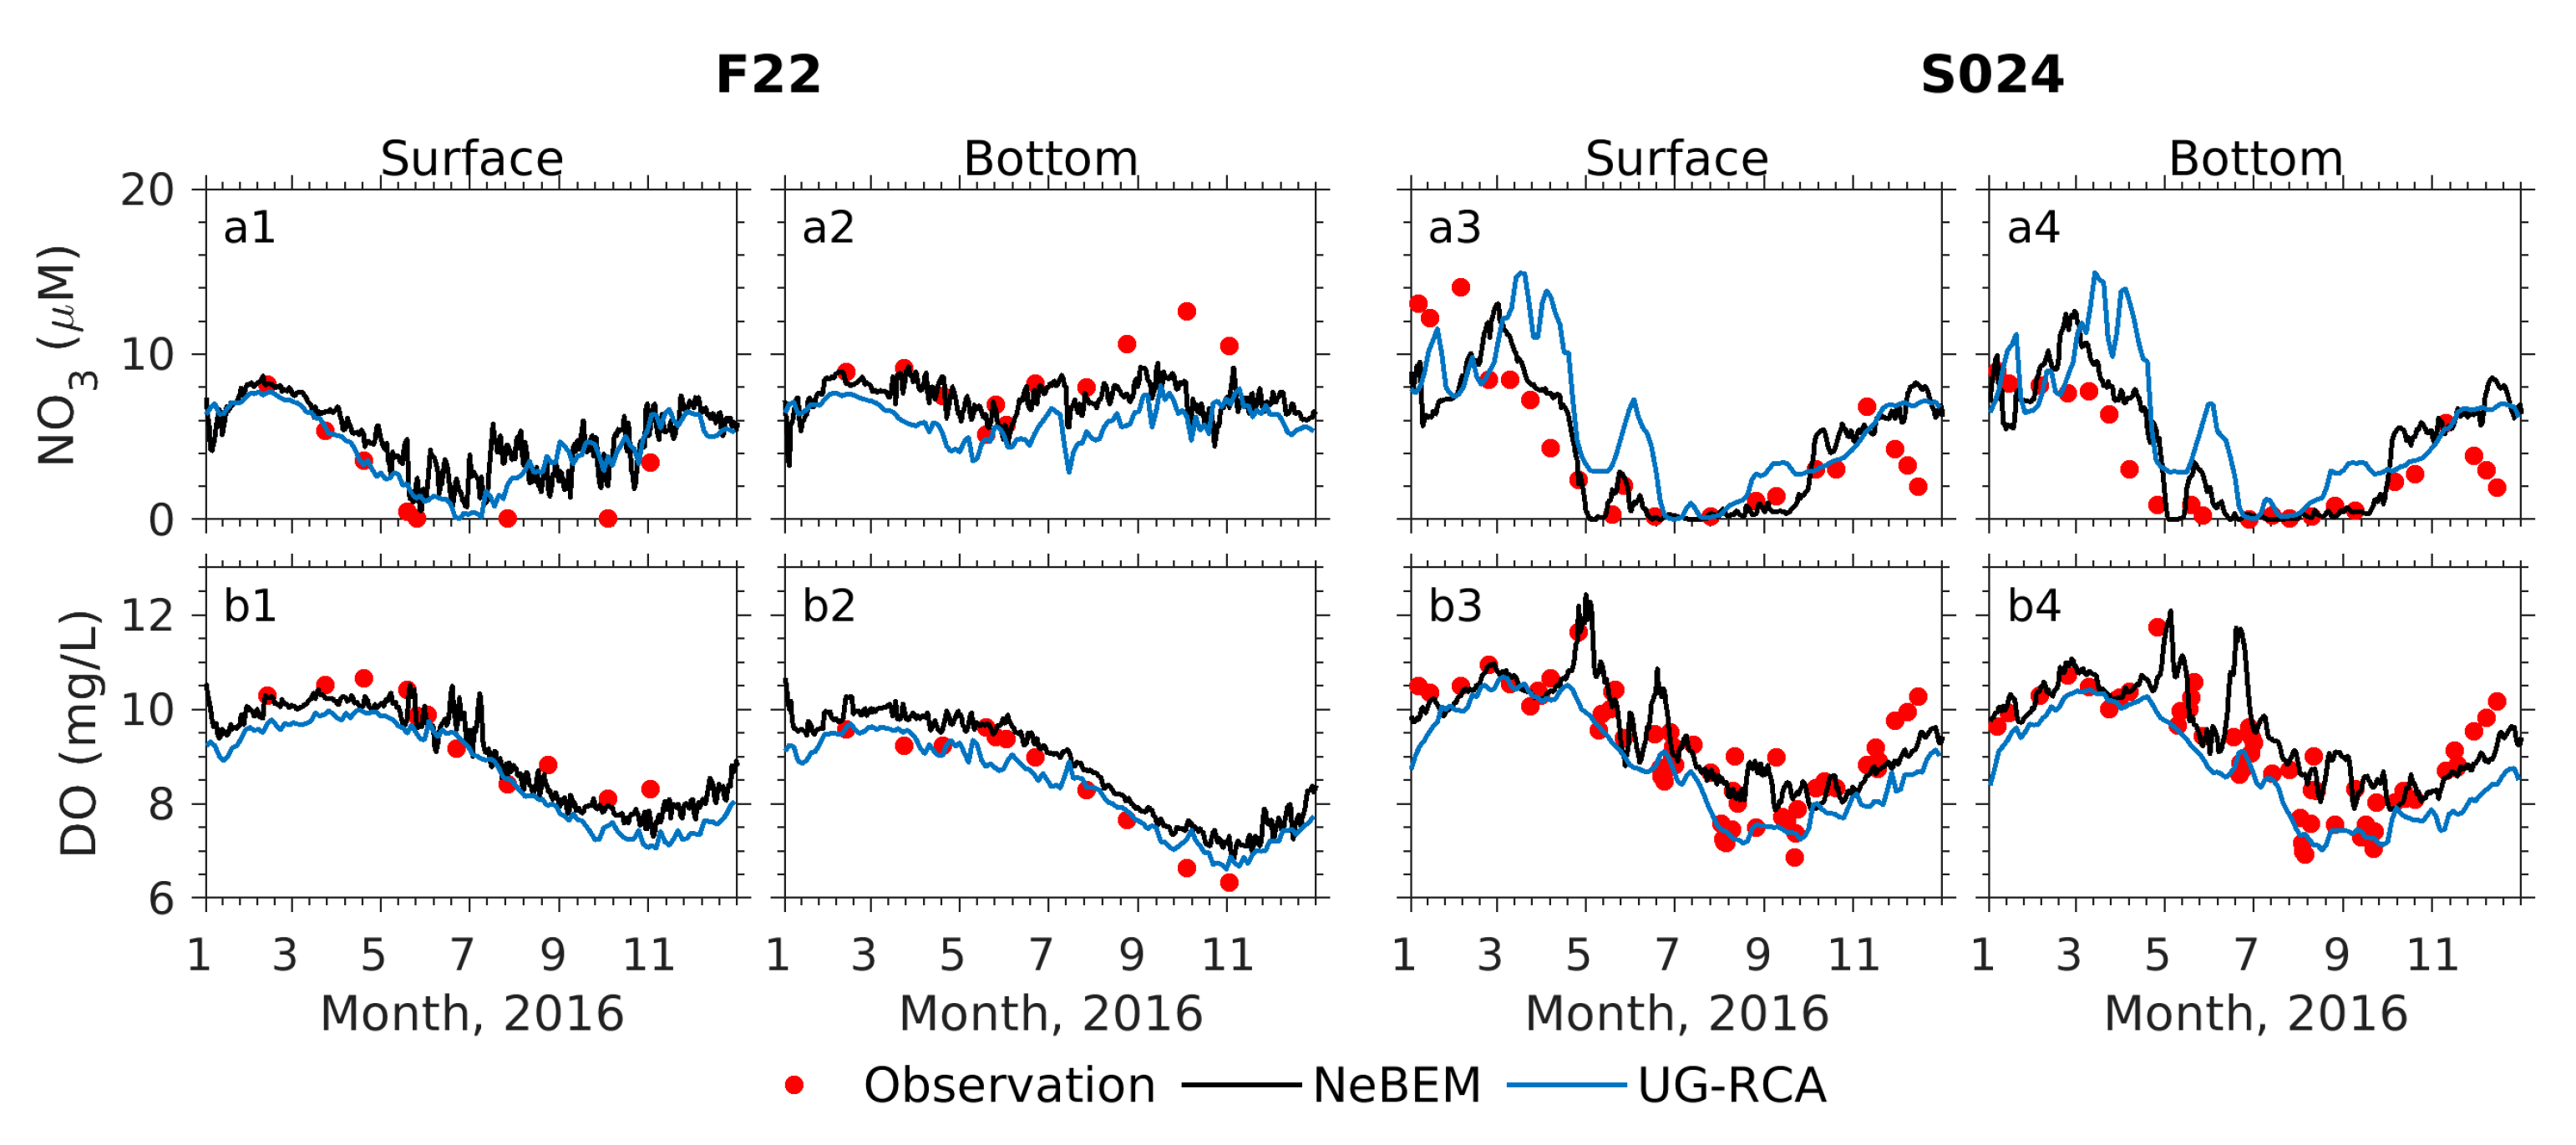
Performances at selected representative stations, F22 in the outer bay and S024 in Boston Harbor (Figure 15), provided further insight. Both models captured the seasonal cycles of nitrate and dissolved oxygen reasonably well at these locations (Figure 16(a1–a4,b1–b4)). At F22, NeBEM slightly outperformed UG-RCA with a smaller RMSE, indicating comparable skill. However, at S024, UG-RCA consistently overestimated nitrate concentrations from March to May at S024, a bias not observed in NeBEM. This discrepancy highlights how model outcomes can vary significantly within the inner bay despite sharing identical initial and boundary conditions.
Both models struggled to replicate nitrate and dissolved oxygen concentrations near the bottom at F22 during autumn. This discrepancy may be linked to uncertainties in open boundary conditions, as F22 is susceptible to influences from the MWCC [19].

4.3.2. Biological Processes Influencing Dissolved Oxygen

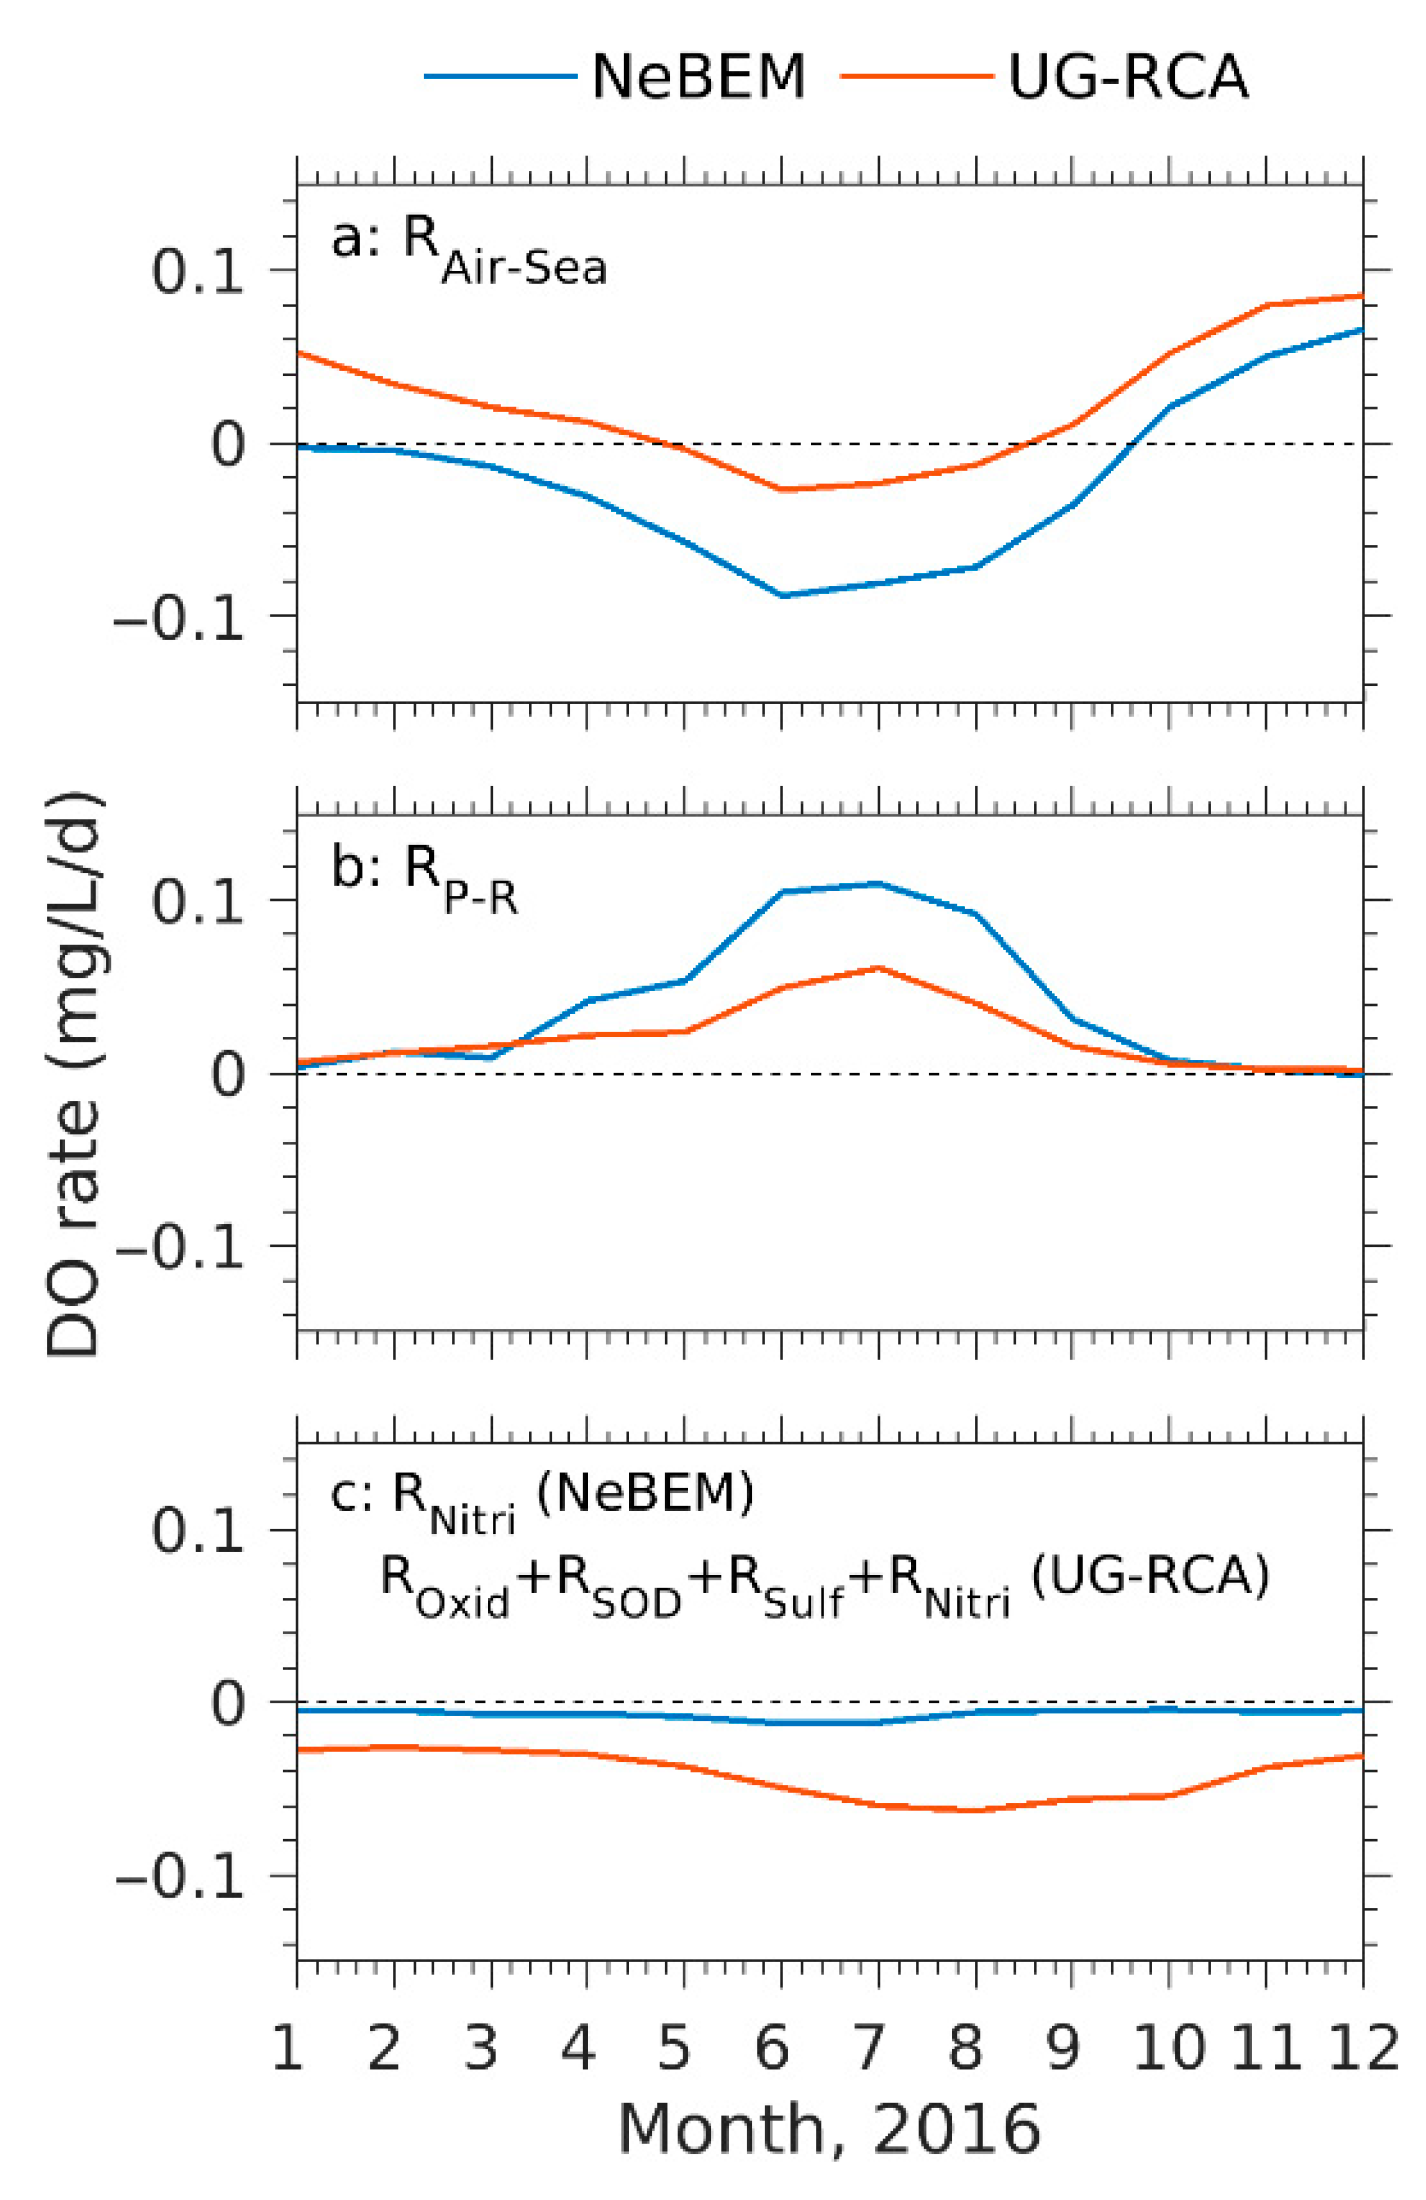
NeBEM and UG-RCA both performed well in simulating dissolved oxygen levels across Massachusetts Bay and Boston Harbor, despite significant differences in their formulations of biogeochemical processes. In UG-RCA, dissolved oxygen is affected by a combination of sources and sinks. The sources include oxygen supplied through air–sea gas exchange and net community production from photosynthesis minus respiration. The sinks consist of oxygen consumption during the oxidation of organic and nitrogenous materials, sediment oxygen demand, nitrification, and oxidation of sulfides. Additionally, horizontal and vertical transport processes (advection) also influence dissolved oxygen concentrations [19,26]. NeBEM, in contrast, accounts for air–sea oxygen exchange, photosynthesis, plankton respiration, and nitrification but does not include explicit terms for oxidation, sediment oxygen demand, or sulfide oxidation [25].
Both models calculate air–sea gas exchange as being proportional to the difference between the actual dissolved oxygen concentration in water and the saturation concentration that would exist under equilibrium conditions with the atmosphere. However, the two models use different formulations for the saturation concentration and the transfer coefficient that governs the rate of exchange.
In NeBEM, oxygen saturation depends on temperature and salinity in a relatively simple empirical formula, while the transfer coefficient is determined based on wind speed and water temperature using a wind-speed-dependent expression. When wind speeds exceed 11 m per second, the transfer rate increases significantly.
In UG-RCA, oxygen saturation is also a function of temperature and salinity but is expressed using a more complex exponential formula. The gas transfer coefficient is calculated differently, incorporating temperature correction factors, layer depth, and a wind-speed-dependent piston velocity function.
These distinct formulations result in differences in how each model estimates the rates of air–sea oxygen exchange and photosynthesis minus respiration. In NeBEM, air–sea interactions and net community production are the dominant contributors to dissolved oxygen variability, while nitrification and advection play much smaller roles. Conversely, UG-RCA also highlights air–sea exchange and net production but attributes greater importance to oxidation, sediment oxygen demand, and sulfide oxidation in maintaining oxygen levels (Figure 17).
Despite these differences, both models predicted similar seasonal variations in dissolved oxygen concentrations. This agreement, however, does not necessarily indicate that both models capture the underlying physical and biochemical mechanisms equally well. The contrasting process formulations emphasize the challenge of determining which model more accurately represents real-world oxygen dynamics. Without observational justification for key parameters and formulations, the similarity in model predictions suggests that achieving agreement with observations alone may not guarantee a complete understanding of the region’s biogeochemical processes.

5. Summary

The Northeast Biogeochemistry and Ecosystem Model (NeBEM) was applied to investigate ocean acidification in Massachusetts Bay and Boston Harbor. The model showed robust capabilities in reproducing the seasonal cycles of nutrients, dissolved oxygen, chlorophyll-a, and pH levels across the outer (stratified) and inner (relatively vertically mixed) bays. Model skill assessments demonstrated that NeBEM performed reasonably well or exceeded expectations in simulating nutrient concentrations, phytoplankton biomass and dissolved oxygen levels, with a particularly strong performance in capturing p H variability throughout Massachusetts Bay, including Boston Harbor.
Distinct physical and biogeochemistry processes were identified as major regulators of changes in total alkalinity and dissolved inorganic carbon in both the outer and inner bay regions. In the outer bay, changes in total alkalinity were primarily driven by nitrification and denitrification processes, net community production, and horizontal transport by water movement. Variation in dissolved inorganic carbon in this region were largely controlled by net community production and horizontal advection. In the inner bay, especially in Boston Harbor, changes in total alkalinity were mostly by horizontal advection, while variation in dissolved inorganic carbon was influenced by both horizontal advection and net community production. Contributions from air–sea gas exchanges and other biological processes were generally about an order of magnitude smaller than these dominant mechanisms.
The analysis of normalized ratio of total alkalinity to dissolved inorganic carbon revealed distinct biogeochemical patterns in the outer and inner bays. In the inner bay, nitrification and denitrification processes were the primary drivers of total alkalinity variability. In the outer bay, net community production, air–sea carbon dioxide exchanges (which influenced dissolved inorganic carbon), and nitrification and denitrification (which influenced total alkalinity) were the dominant processes contributing to changes in total alkalinity and dissolved inorganic carbon. Observed ratios of total alkalinity to dissolved inorganic carbon in the outer bay fell within the range simulated by NeBEM, suggesting that the model not only reproduced the seasonal variability of p H but also accurately captured the biogeochemical processes driving changes in total alkalinity and dissolved inorganic carbon. Seasonal changes in the dominant biogeochemical mechanisms were evident. From November through March, nitrification and denitrification were the primary drivers of total alkalinity in the outer bay. During April through October, total alkalinity and dissolved inorganic carbon were mainly controlled by multiple biogeochemical processes, including net community production, air–sea carbon dioxide exchange, nitrification and denitrification. These findings were consistent with the results of the process-oriented experiment described earlier.
The drivers of seasonal changes in pCO2 and Ωa also differed between the outer and inner bay regions. In the outer bay, seasonal variations of pCO2 were primarily influenced by temperature and dissolved inorganic carbon, with total alkalinity acting as a secondary contributor. Variations in Ωa were predominantly dictated by changes in dissolved inorganic carbon. In the inner bay, temperature, dissolved inorganic carbon and total alkalinity played essential roles in modulating both pCO2 and Ωa. For pCO2, total alkalinity has a stronger impact during summer, while dissolved inorganic carbon was the dominant driver in winter. For Ωa, changes in total alkalinity and dissolved inorganic carbon contributed simultaneously throughout the year but often in opposite phases. Together with temperature, these factors governed the seasonal variability of Ωa.
A comparison between NeBEM and UG-RCA showed that both models performed well in simulating dissolved oxygen concentration. However, they relied on different physical and biogeochemical mechanisms to explain dissolved oxygen variability. This underscores the importance of developing a robust biogeochemistry model that accurately represents observed ecosystem dynamics and reduces reliance on empirical parameterizations in water quality assessments.

Author Contributions

Methodology, C.C. and J.S.; Validation, L.W.; Formal analysis, L.W.; Resources, J.S.; Writing—original draft, L.W.; Writing—review & editing, C.C., J.S., S.L., R.C.B. and J.M.; Visualization, L.W.; Supervision, C.C. and R.C.B.; Project administration, C.C. All authors have read and agreed to the published version of the manuscript.

Funding

The development of NeBEM received initial support from the MIT Sea Grant under grant 2017-R/RCM-49C and the NSF LTER project under grant OCE-1655686. The numerical experiments and stakeholder engagement were funded by NOAA’s National Centers for Coastal Ocean Science Competitive Research Program and the NOAA Ocean Acidification Program under awards NA16NOS0120023, NA18NOS4780178, N21A013012, NA24NOSX012C0026-N24A025002, NA24NOSX012C0034-N24S022001 to the Northeastern Regional Association of Coastal Ocean Observing Systems (NERACOOS). This work is also in part supported by NASA 80LARC21DA002. The physical forcing data used in the paper were obtained from the U.S. Northeast Coastal Ocean Forecast System (NECOFS), supported by IOOS, NERACOOS under grants NA16NOS0120023, NA21NOS0120095, and NA18NOS0120156.

Data Availability Statement

The NeBEM hindcast simulation results presented in the study are available in http://www.smast.umassd.edu:8080/thredds/catalog/catalog.html.

Conflicts of Interest

The authors declare no conflict of interest.

Appendix A. Results and Discussions for Other Key Ecosystem Variables

Appendix A.1. Model–Data Comparisons
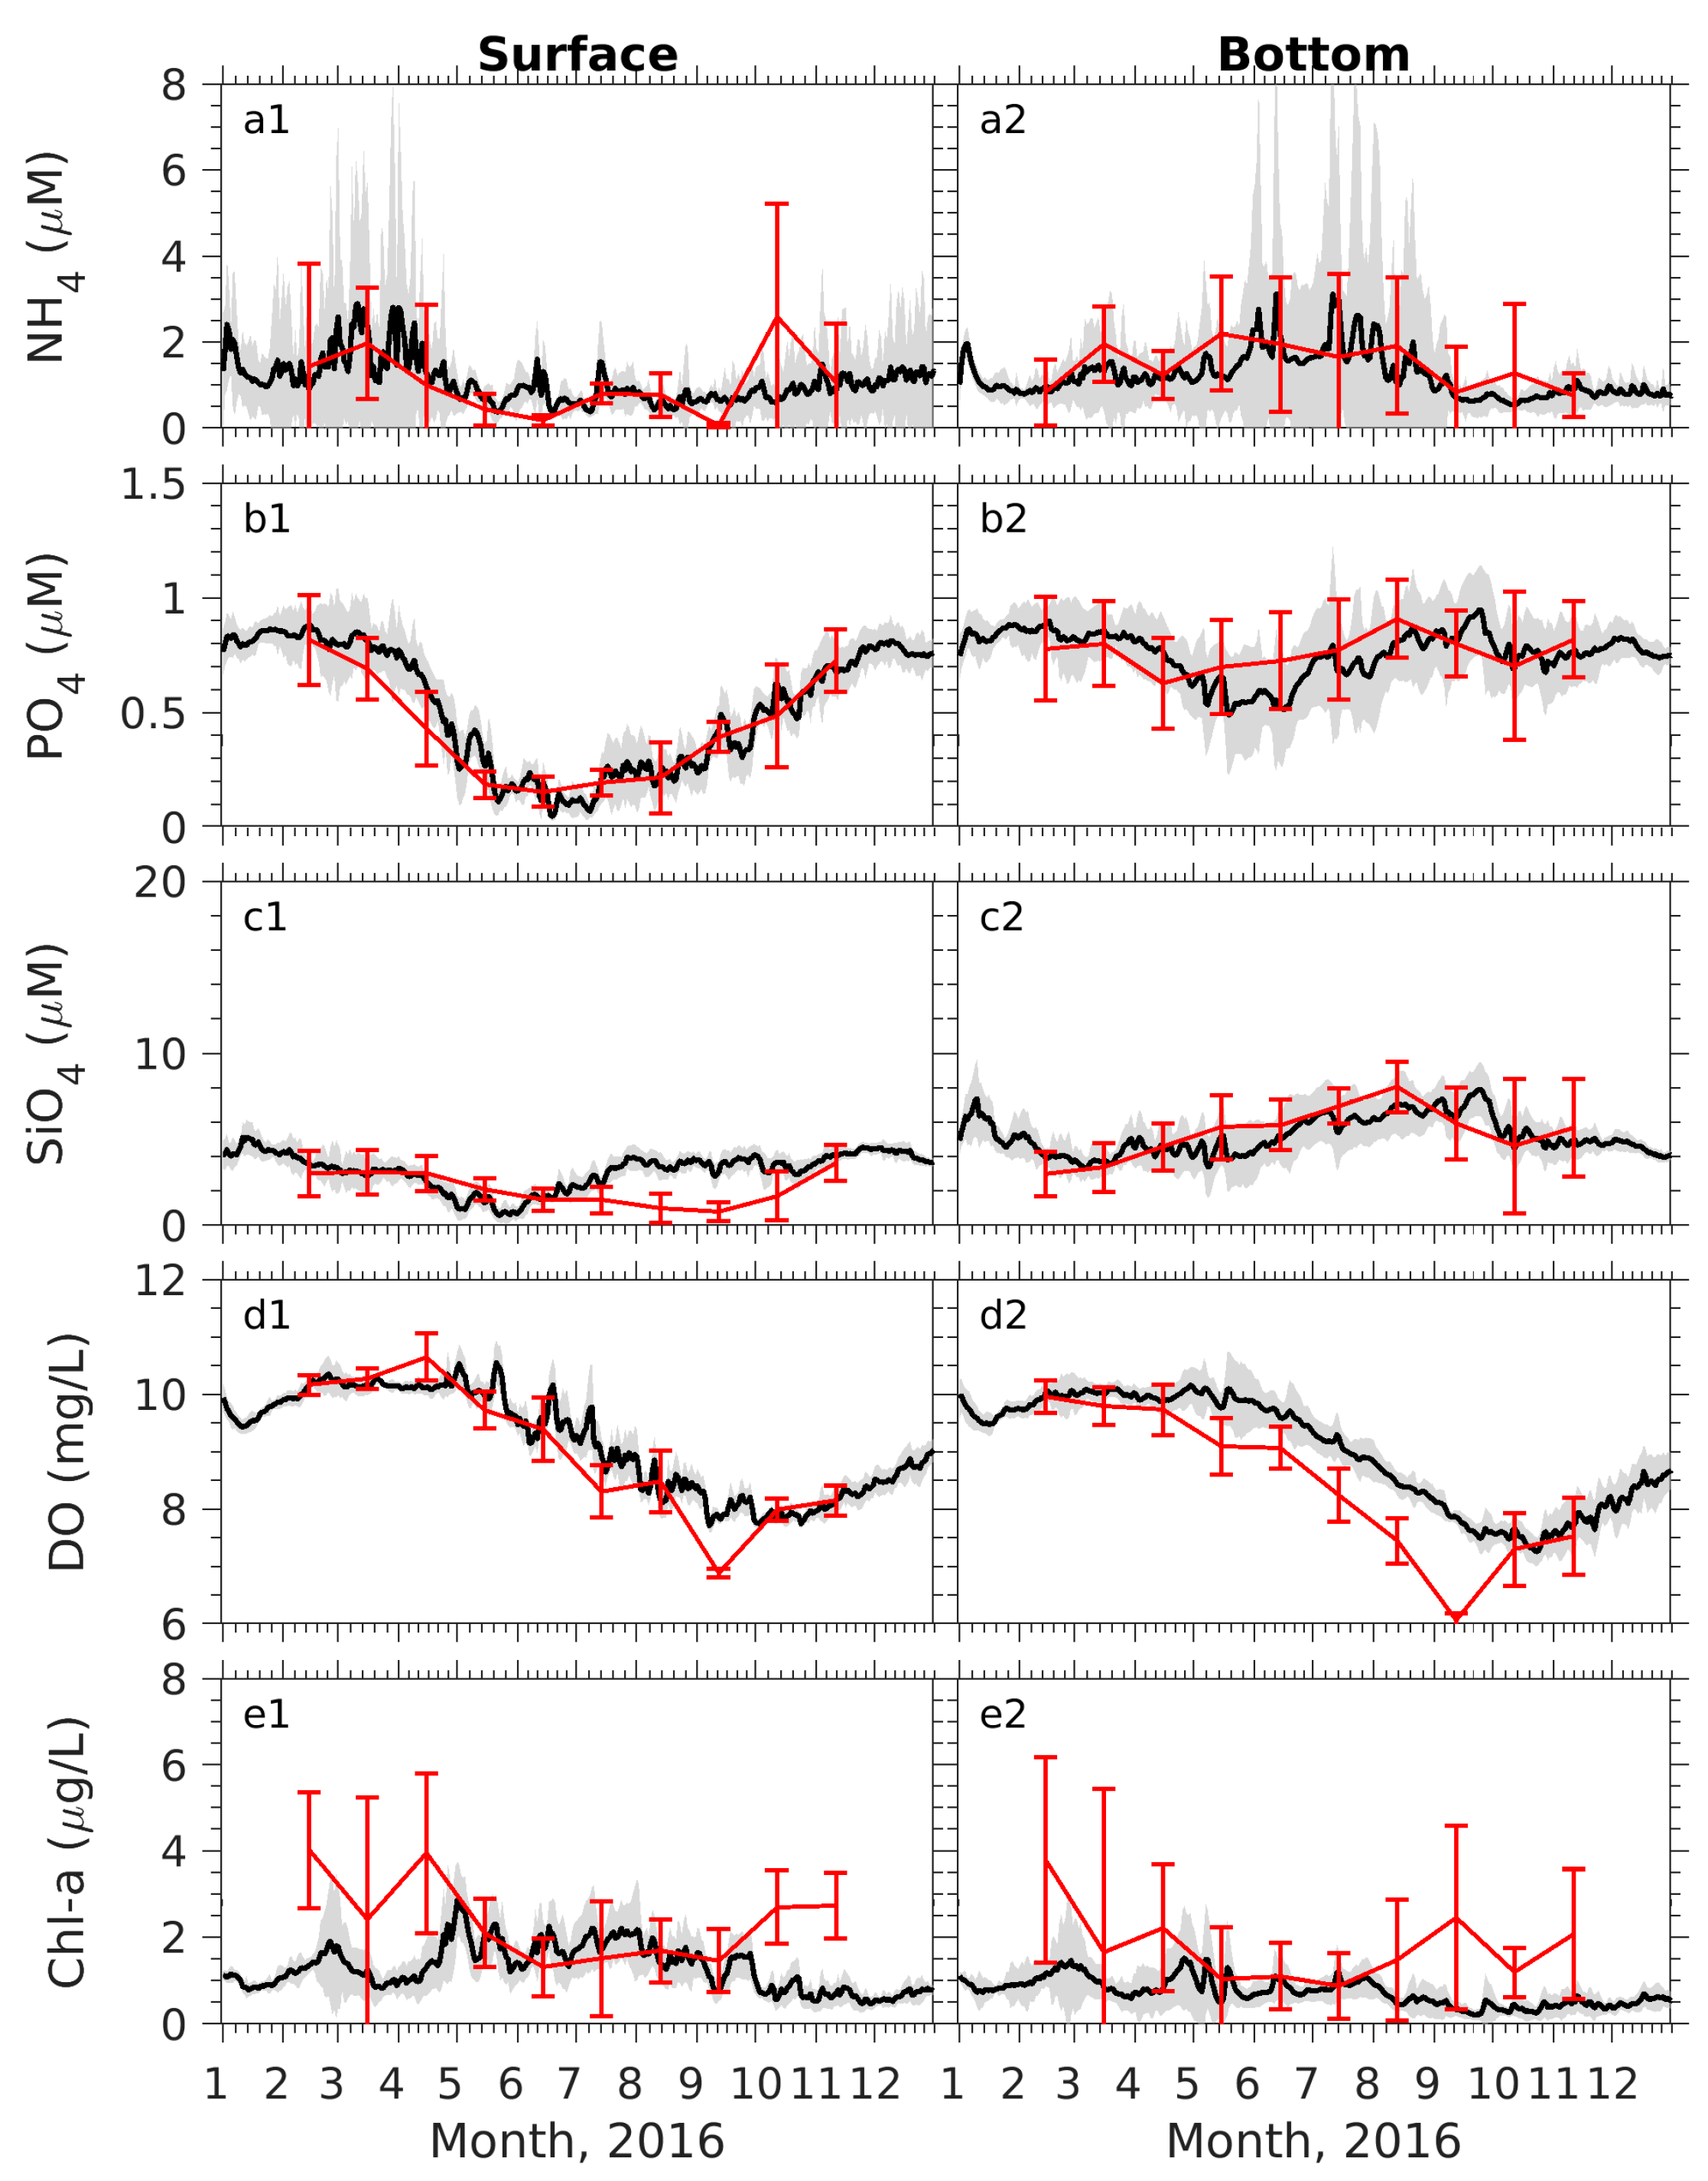
Phosphate, silicate, and ammonium Concentrations. In addition to nitrate, NeBEM successfully captured the seasonal variability of other key nutrients (phosphate, silicate, and ammonium) observed at measurement sites in Massachusetts Bay. In winter, phosphate and silicate concentrations were vertically well-mixed. From spring through summer, they exhibited a significant vertical gradient due to phytoplankton uptake and enhanced water column stratification. In fall, wind-induced mixing restored a vertically homogeneous distribution (Figure A1). The seasonal fluctuations of phosphate and silicate were mainly driven by heterotrophic processes, intrusion of water from the WMCC, and vertical turbulent mixing. Observed and simulated phosphate and silicate concentrations showed similar spatial variations near the surface and bottom. Near-surface concentrations ranged from 0.1 to 0.2 μM for phosphate and 0.5 to 1.6 μM for silicate, while near-bottom concentrations ranged from 0.1 to 0.4 μM for phosphate and from 0.3 to 3.9 μM for silicate. However, the timings of maximum observed and simulated spatial deviations differed. In the inner bay, NeBEM tended to overestimate surface phosphate concentrations during summer and fall (Figure A2).
Figure A1. Comparisons of simulated (black line) and observed (red line) surface (a1,b1,c1,d1,e1) and bottom (c2,b2,c2,d2,e2) concentrations of ammonium (NH4, (a1,a2)), phosphate (PO4, (b1,b2)), silicate (SiO4, (c1,c2)), DO (d1,d2), and chlorophyll a (Chl-a, (e1,e2)), averaged across all available harbor stations in Massachusetts Bay. Gray shading shows standard deviations relative to regional daily means. Vertical bars indicate observed standard deviations.
Remotesensing 17 02651 g0a1
Figure A2. Comparisons of simulated (black line) and observed (red line) surface (a1,b1,c1,d1,e1) and bottom (a2,b2,c2,d2,e2) concentrations of ammonium (NH4, (a1,a2)), phosphate (PO4, (b1,b2)), silicate (SiO4, (c1,c2)), DO (d1,d2), and chlorophyll a (Chl-a, (e1,e2)), averaged across all available harbor stations in Boston Harbor. Definitions of gray shading and vertical bars are as in Figure A1.
Remotesensing 17 02651 g0a2
Ammonium, as a regenerated nutrient through heterotrophic processes, displayed a distinct seasonal pattern compared to nitrate, phosphate, and silicate. Near the surface, observed regionally averaged ammonium concentrations were approximately 1.6–2.6 μM during spring and fall blooms but dropped below 0.5 μM in summer (Figure A1(a1)). At the bottom, concentrations were elevated during summer due to inputs from sewage outfalls, with mean values exceeding 1.8 μM (Figure A1(a2)). NeBEM robustly reproduced these patterns.
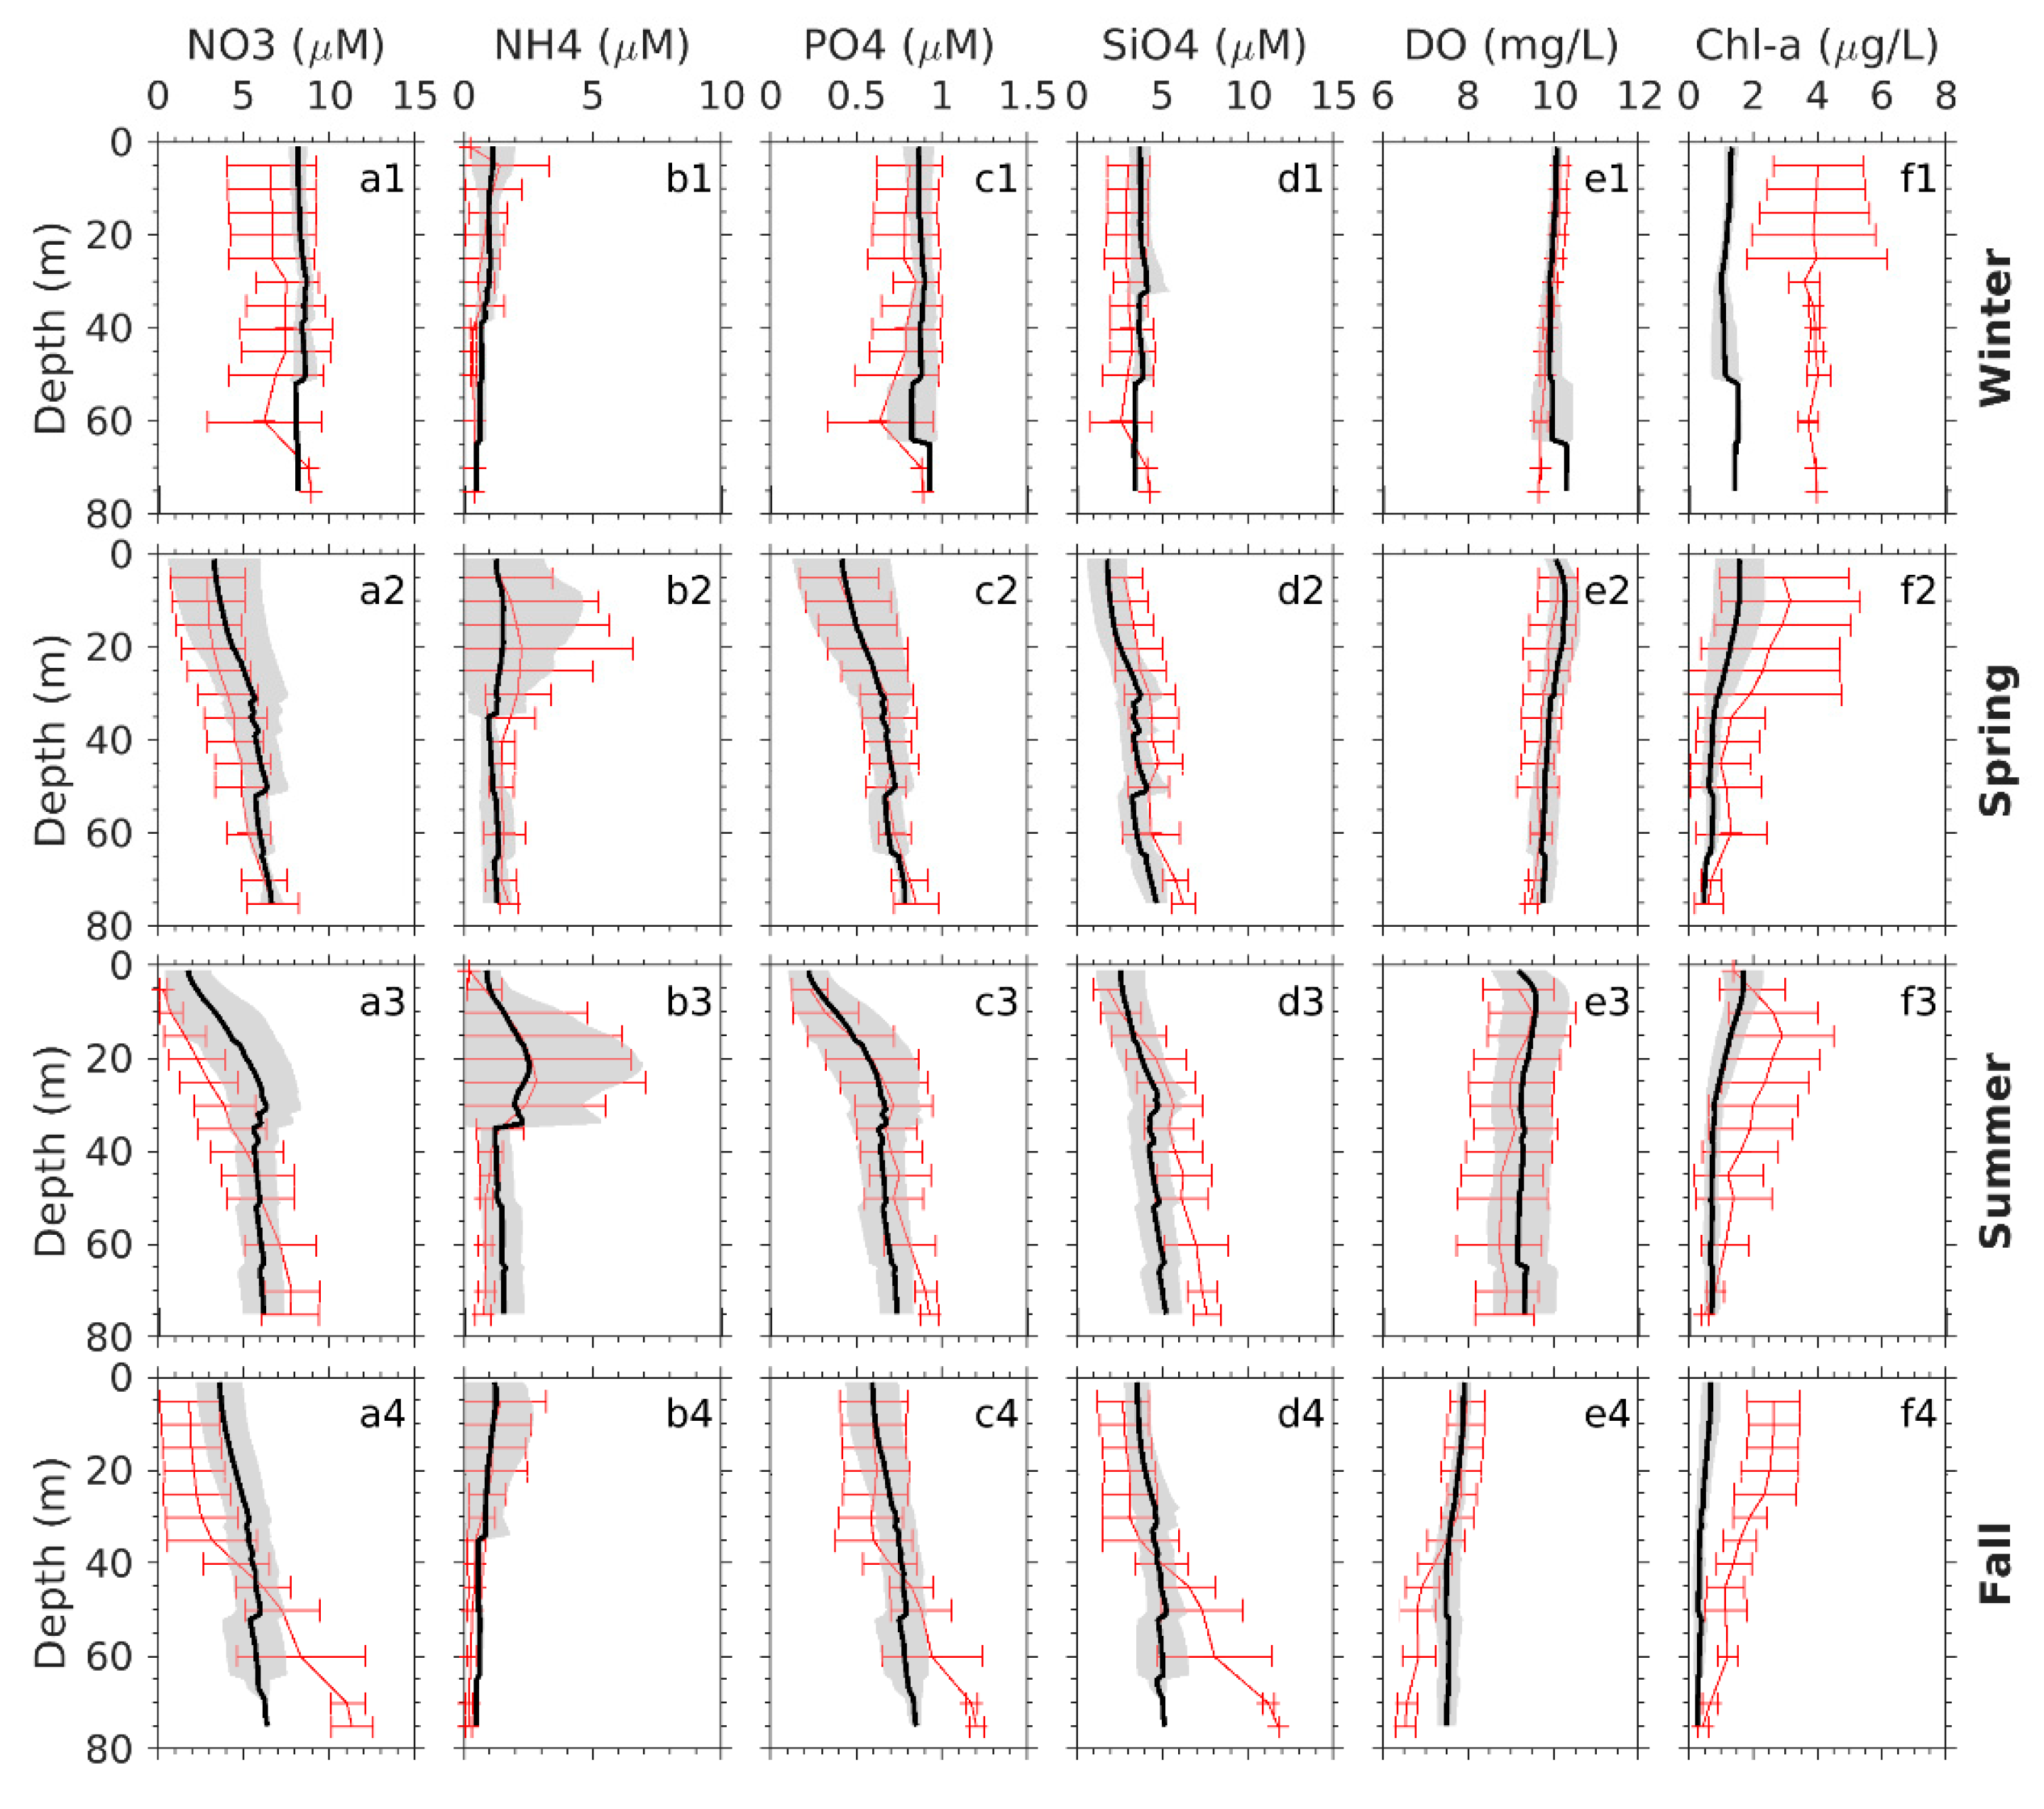
Dissolved oxygen. Dissolved oxygen exhibited similar seasonal variability in both the outer and inner bays, with concentrations peaking at ~10.6–12.1 mg/L in April and reaching a minimum of ~6.2–7.0 mg/L in September–October (Figure A1(d1,d2) and A2(d1,d2)). NeBEM reproduced this seasonal variation pattern. During the stratified period, bottom dissolved oxygen levels were lower than surface levels by approximately 0.6 mg/L in the outer bay and ~0.2 mg/L in the inner bay. Spatially, observed dissolved oxygen concentrations varied by about 0.35 mg/L across the outer bay. Vertical profiles showed consistent decreases in dissolved oxygen with depth in all seasons, reaching a minimum of ~6.5 mg/L near the bottom (Figure A3(e1–e4)). NeBEM effectively captured these vertical patterns and seasonal dynamics but underestimated the extent of low bottom oxygen concentrations during fall in the outer bay.
Figure A3. Comparisons of seasonal mean vertical profiles of simulated and observed concentrations of nitrate (NO3: (a1a4)), ammonium (NH4: (b1b4)), phosphate (PO4: (c1c4)), silicate (SiO4: (d1d4)), dissolved oxygen (DO: (e1e4)), and chlorophyll-a (Chl-a: (f1f4)), averaged over all far-field and near-field stations for winter, spring, summer, and fall. Gray shading shows standard deviations relative to regionally averaged seasonal means. Vertical bars indicate the observed standard deviations relative to regionally averaged seasonal means.
Remotesensing 17 02651 g0a3
Chlorophyll-a. Chlorophyll-a concentrations exceeding 2.0 μg/L are indicative of phytoplankton bloom in the Gulf of Maine [65]. In 2016, the outer bay experienced spring (February–April) and fall (October–November) phytoplankton blooms, with chlorophyll-a levels surpassing 2.5 μg/L (Figure A1(e1,e2)). During these blooms, chlorophyll-a exhibited a substantial spatial variability, with deviations comparable to the regional mean, reflecting the dynamic nature of regional phytoplankton growth.
Due to limited temporal and spatial coverage of in situ observations, evaluating NeBEM’s performance for chlorophyll-a was challenging. The model predicted a spring bloom in the outer bay in late April that was not resolved by the available data (Figure A1(e1)). Similarly, a chlorophyll-a peak in the inner bay between two observational periods (late April and early May) went undetected. Satellite-derived chlorophyll-a data was also limited by cloud cover during the bloom season.

Appendix A.2. Spatial Variability Patterns

NeBEM simulations revealed that, beyond seasonal variability, the nutrients, dissolved oxygen, and chlorophyll-a concentrations in Massachusetts Bay exhibited significant spatial variations that were identified through EOF analysis (Figure A4).
Figure A4. Simulated seasonal mean surface concentrations of nitrate (NO3: (a1a4)), ammonium (NH4: (b1b4)), dissolved oxygen (DO: (c1c4)), and chlorophyll-a (Chl-a: (d1d4)) for winter, spring, summer, and fall.
Remotesensing 17 02651 g0a4
Nutrients. Nitrate, phosphate, and silicate shared similar spatial distribution patterns. Near-surface nitrate concentrations showed higher levels in northern Massachusetts Bay than in southern Massachusetts Bay, peaking above 7 μM in winter and dropping below 2.0 μM in summer (Figure A4(a1–a4)). During summer and fall, clockwise circulation in the northern bay enhanced nutrient retention (Figure 6(c3,c4)), creating a nutrient-rich core with concentrations greater than 2.0 μM in summer and 5.0 μM in fall.
Ammonium concentration exhibited a markedly different spatial pattern. Surface concentrations were generally below 2.0 μM across the bay, except near the sewage outfall where significant ammonium inputs were detected (Figure A4(b1–b4)). Vertical mixing brought ammonium-rich water upward during winter, spring, and fall. Horizontal current advected that water into Boston Harbor.
Dissolved Oxygen. Near-surface dissolved oxygen levels aligned with dominant EOF modes, showing higher concentrations in the southern bay during winter and a reversal in summer (Figure A4(c1–c4)). Dissolved oxygen levels consistently decreased offshore and with depth in spring and fall, maintaining relatively high values of about 7.5 mg/L or more year-round.
Chlorophyll-a. Seasonal chlorophyll-a distributions were particularly prominent in spring and summer (Figure A4(d1–d4)). Boston Harbor and Cape Cod Bay supported robust spring blooms (up to ~2.6 μg/L, while the northern outer bay experienced an elevated summer chlorophyll-a level (~2.2 μg/L). These spatial patterns closely matched EOF analyses based on climatological data (Figure 2).

References

  1. Salisbury, J.; Green, M.; Hunt, C.; Campbell, J. Coastal acidification by rivers: A threat to shellfish? Eos Trans. Am. Geophys. Union 2008, 89, 513. [Google Scholar] [CrossRef]
  2. Salisbury, J.; Vandemark, D.; Hunt, C.W.; Campbell, J.W.; McGillis, W.R.; McDowell, W.H. Seasonal observations of surface waters in two Gulf of Maine estuary-plume systems: Relationships between watershed attributes, optical measurements and surface pCO2. Estuar. Coast. Shelf Sci. 2008, 77, 245–252. [Google Scholar] [CrossRef]
  3. Prasad, M.B.K.; Kaushal, S.S.; Murtugudde, R. Long-term pCO2 dynamics in rivers in the Chesapeake Bay watershed. Appl. Geochem. 2013, 31, 209–215. [Google Scholar] [CrossRef]
  4. Wallace, R.B.; Baumann, H.; Grear, J.S.; Aller, R.C.; Gobler, C.J. Coastal ocean acidification: The other eutrophication problem. Estuar. Coast. Shelf Sci. 2014, 148, 1–13. [Google Scholar] [CrossRef]
  5. Gledhill, D.K.; White, M.M.; Salisbury, J.; Thomas, H.; Mlsna, I.; Liebman, M.; Mook, B.; Grear, J.; Candelmo, A.C.; Chambers, R.C.; et al. Ocean and coastal acidification off New England and Nova Scotia. Oceanography 2015, 28, 182–197. [Google Scholar] [CrossRef]
  6. Salisbury, J.; Vandemark, D.; Hunt, C.; Campbell, J.; Jonsson, B.; Mahadevan, A.; McGillis, W.; Xue, H. Episodic riverine influence on surface DIC in the coastal Gulf of Maine. Estuar. Coast. Shelf Sci. 2009, 82, 108–118. [Google Scholar] [CrossRef]
  7. Xue, P.; Chen, C.; Qi, J.; Beardsley, R.C.; Tian, R.; Zhao, L.; Lin, H. Mechanism studies of seasonal variability of dissolved oxygen in Mass Bay: A multi-scale FVCOM/UG-RCA application. J. Mar. Syst. 2014, 131, 102–119. [Google Scholar] [CrossRef]
  8. Lagerloef, G.S.; Bernstein, R.L. Empirical orthogonal function analysis of advanced very high-resolution radiometer surface temperature patterns in Santa Barbara Channel. J. Geophys. Res. Ocean 1988, 93, 6863–6873. [Google Scholar] [CrossRef]
  9. Preisendorfer, R.W. Principal Component Analysis in Meteorology and Oceanography (Developments in Atmospheric Science); Mobley, C.D., Ed.; Elsevier Science: Oxford, UK, 1988; Volume 17. [Google Scholar]
  10. Bigelow, H.B. Physical Oceanography of the Gulf of Maine; U.S. Government Printing Office: Washington, DC, USA, 1927. [Google Scholar]
  11. Butman, B. Hydrography and low frequency currents associated with the spring runoff in Massachusetts Bay Memories. Soc. R. Des. Sci. Liege 1976, 6, 247–275. [Google Scholar]
  12. Xue, P.; Chen, C.; Beardsley, R.C. Observing system simulation experiments of dissolved oxygen monitoring in Massachusetts Bay. J. Geophys. Res. Ocean 2012, 117, C05014. [Google Scholar] [CrossRef]
  13. Zhao, L.Z.; Tian, R.C.; Xue, P.; Chen, C.; Leo, W.S.; Mickelson, M.J. Modeling 2010 in Massachusetts Bay Using the Unstructured-Grid Bays Eutrophication Model; Report 2011-09; Massachusetts Water Resources Authority: Boston, MA, USA, 2011; 118p. [Google Scholar]
  14. Geyer, W.R.; Gardner, G.B.; Brown, W.S.; Irish, J.D.; Butman, B.; Loder, T.C.; Signell, R.P. Physical Oceanographic Investigation of Massachusetts and Cape Cod Bays; The Massachusetts Environmental Trust: Boston, MA, USA, 1992. [Google Scholar]
  15. Butman, B.; Bothner, M.H.; Lightsom, F.L.; Gutierrez, B.T.; Alexander, P.S.; Martini, M.A.; Strahle, W.S. Long-Term Oceanographic Observations in Western Massachusetts Bay Offshore of Boston, Massachusetts: Data Report for 1989–2000; US Geological Survey: Reston, VA, USA, 2002. [Google Scholar]
  16. Chen, C.; Zhao, L.; Gallager, S.; Ji, R.; He, P.; Davis, C.; Beardsley, R.C.; Hart, D.; Gentleman, W.C.; Wang, L.; et al. Impact of larval behaviors on dispersal and connectivity of sea scallop larvae over the northeast US shelf. Prog. Oceanogr. 2021, 195, 102604. [Google Scholar] [CrossRef]
  17. Franks, P.J.; Chen, C. Plankton production in tidal fronts: A model of Georges Bank in summer. J. Mar. Res. 1996, 54, 631–651. [Google Scholar] [CrossRef]
  18. Franks, P.J.S.; Chen, C. A 3-D prognostic model study of the ecosystem over Georges Bank and adjacent coastal regions. Part II: Coupled biological and physical model. Deep Sea Res. 2001, 48, 457–482. [Google Scholar] [CrossRef]
  19. Tian, R.; Chen, C.; Qi, J.; Ji, R.; Beardsley, R.C.; Davis, C. Model study of nutrient and phytoplankton dynamics in the Gulf of Maine: Patterns and drivers for seasonal and interannual variability. ICES J. Mar. Sci. 2015, 72, 388–402. [Google Scholar] [CrossRef]
  20. Zang, Z.; Ji, R.; Feng, Z.; Chen, C.; Li, S.; Davis, C.S. Spatially varying phytoplankton seasonality on the Northwest Atlantic Shelf: A model-based assessment of patterns, drivers, and implications. ICES J. Mar. Sci. 2021, 78, 1920–1934. [Google Scholar] [CrossRef]
  21. Wang, L. Simulating Ocean Acidification in the Northeast, U.S. Region Using a Fully Coupled Three-Dimensional Biogeochemistry and Ecosystem Model. Ph.D Thesis, University of Massachusetts Dartmouth, North Dartmouth, MA, USA, 2023. [Google Scholar]
  22. Wang, L.; Chen, C.; Salisbury, J.; Beardsley, R.C.; Motyka, J. Modeling of Ocean Acidification in the Massachusetts Bay and Boston Harbor: 1-D Experiments; Ecological Modelling: San Diego, CA, USA, 2025; under review. [Google Scholar]
  23. Zhao, L.Z.; Tian, R.C.; Xue, P.; Chen, C.; Leo, W.S.; Mickelson, M.J. Modeling 2012 in Massachusetts Bay Using the Unstructured-Grid Bays Eutrophication Model; Report 2015-02; Massachusetts Water Resources Authority: Boston, MA, USA, 2013; 102p. [Google Scholar]
  24. Zhao, L.; Chen, C.; Beardsley, R.C.; Codiga, D.L.; Leo, W.S. Simulations of 2015 Hydrodynamics and Water Quality in the Massachusetts Bay System Using the Bays Eutrophication Model; Report 2016-16; Massachusetts Water Resources Authority: Boston, MA, USA, 2016; 112p. [Google Scholar]
  25. Butenschön, M.; Clark, J.; Aldridge, J.N.; Allen, J.I.; Artioli, Y.; Blackford, J.; Bruggeman, J.; Cazenave, P.; Ciavatta, S.; Kay, S.; et al. ERSEM 15.06: A generic model for marine biogeochemistry and the ecosystem dynamics of the lower trophic levels. Geosci. Model. Dev. 2016, 9, 1293–1339. [Google Scholar] [CrossRef]
  26. Chen, C.; Beardsley, R.C.; Cowles, G.; Qi, J.; Lai, Z.; Gao, G.; Stuebe, D.; Xu, Q.; Xue, P.; Ge, J.; et al. An Unstructured-Grid, Finite-Volume Community Ocean Model: FVCOM User Manual; Sea Grant College Program, Massachusetts Institute of Technology: Cambridge, MA, USA, 2012. [Google Scholar]
  27. Keller, A.A.; Taylor, C.; Oviatt, C.; Dorrington, T.; Holcombe, G.; Reed, L. Phytoplankton production patterns in Massachusetts Bay and the absence of the 1998 winter–spring bloom. Mar. Biol. 2001, 138, 1051–1062. [Google Scholar] [CrossRef]
  28. Zhao, L.; Beardsley, R.C.; Chen, C.; Codiga, D.L.; Wang, L. Simulations of 2016 Hydrodynamics and Water Quality in the Massachusetts Bay System Using the Bays Eutrophication Model; Report 2017-13; Massachusetts Water Resources Authority: Boston, MA, USA, 2017; 111p. [Google Scholar]
  29. Chen, C.; Gao, G.; Zhang, Y.; Beardsley, R.C.; Lai, Z.; Qi, J.; Lin, H. Circulation in the Arctic Ocean: Results from a high-resolution coupled ice-sea nested Global-FVCOM and Arctic-FVCOM system. Prog. Oceanogr. 2016, 141, 60–80. [Google Scholar] [CrossRef]
  30. Zhang, Y.; Chen, C.; Beardsley, R.C.; Gao, G.; Lai, Z.; Curry, B.; Lee, C.M.; Lin, H.; Qi, J.; Xu, Q. Studies of the Canadian Arctic Archipelago water transport and its relationship to basin-local forcings: Results from AO-FVCOM. J. Geophys. Res. Ocean 2016, 121, 4392–4415. [Google Scholar] [CrossRef]
  31. Zhang, Y.; Chen, C.; Beardsley, R.C.; Gao, G.; Qi, J.; Lin, H. Seasonal and interannual variability of the Arctic sea ice: A comparison between AO-FVCOM and observations. J. Geophys. Res. Ocean 2016, 121, 8320–8350. [Google Scholar] [CrossRef]
  32. Chen, C.; Beardsley, R.C.; Hu, S.; Xu, Q.; Lin, H. Using MM5 to hindcast the ocean surface forcing fields over the Gulf of Maine and Georges Bank region. J. Atmos. Ocean. Technol. 2005, 22, 131–145. [Google Scholar] [CrossRef]
  33. Fairall, C.W.; Bradley, E.F.; Godfrey, J.S.; Wick, G.A.; Edson, J.B.; Young, G.S. Cool-skin and warm-layer effects on sea surface temperature. J. Geophys. Res. Oceans 1996, 101, 1295–1308. [Google Scholar] [CrossRef]
  34. Millero, F.J.; Lee, K.; Roche, M. Distribution of alkalinity in the surface waters of the major oceans. Mar. Chem. 1998, 60, 111–130. [Google Scholar] [CrossRef]
  35. Lee, K.; Tong, L.T.; Millero, F.J.; Sabine, C.L.; Dickson, A.G.; Goyet, C.; Park, G.H.; Wanninkhof, R.; Feely, R.A.; Millero, F.J.; et al. Global relationships of total alkalinity with salinity and temperature in surface waters of the world’s oceans. Geophys. Res. Lett. 2006, 33, L19605. [Google Scholar] [CrossRef]
  36. Land, P.E.; Shutler, J.D.; Findlay, H.S.; Girard-Ardhuin, F.; Sabia, R.; Reul, N.; Piolle, J.-F.; Chapron, B.; Quilfen, Y.; Salisbury, J.; et al. Salinity from space unlocks satellite—based assessment of ocean acidification. Environ. Sci. Technol. 2015, 49, 1987–1994. [Google Scholar] [CrossRef]
  37. Fassbender, A.J.; Alin, S.R.; Feely, R.A.; Sutton, A.J.; Newton, J.A.; Byrne, R.H. Estimating total alkalinity in the Washington State coastal zone: Complexities and surprising utility for ocean acidification research. Estuaries Coasts 2017, 40, 404–418. [Google Scholar] [CrossRef]
  38. Courtney, T.A.; Cyronak, T.; Griffin, A.J.; Andersson, A.J. Implications of salinity normalization of seawater total alkalinity in coral–reef metabolism studies. PLoS ONE 2021, 16, e0261210. [Google Scholar] [CrossRef] [PubMed]
  39. McGarry, K.; Siedlecki, S.A.; Salisbury, J.; Alin, S.R. Multiple linear regression models for reconstructing and exploring processes controlling the carbonate system of the northeast US from basic hydrographic data. J. Geophys. Res. Ocean 2021, 126, e2020JC016480. [Google Scholar] [CrossRef]
  40. Metzl, N.; Fin, J.; Monaco, C.L.; Mignon, C.; Alliouane, S.; Bombled, B.; Boutin, J.; Bozec, Y.; Comeau, S.; Conan, P.; et al. An updated synthesis of ocean total alkalinity and dissolved inorganic carbon measurements from 1993 to 2023: The SNAPO-CO2-v2 dataset. Earth Syst. Sci. Data 2025, 17, 1075–1100. [Google Scholar] [CrossRef]
  41. Salisbury, J.E. Dissolved Inorganic Carbon, Total Alkalinity, pH, Nutrients and Other Variables Collected from Profile and Discrete Sample Observations Using CTD, Niskin Bottle, and Other Instruments from NOAA Ship Gordon Gunter off the US East Coast During the East Coast Ocean Acidification (GU-15-04 ECOA1) from 2015-06-20 to 2015-07-23 (NCEI Accession 0159428); Version 2.2; Dataset; NOAA National Centers for Environmental Information: Asheville, NC, USA, 2017. [Google Scholar]
  42. Salisbury, J.E.; Shawn, S.M. Dissolved Inorganic Carbon, Total Alkalinity, PH, Nutrients and Other Variables Collected from Discrete Profile Observations Using CTD, Niskin Bottle, and Other Instruments in the East Coast of the U.S. and Canada During the 2nd East Coast Ocean Acidification (ECOA2 or ECOA-2) Cruise from 2018-06-25 to 2018-07-29 (NCEI Accession 0196419); Dataset; NOAA National Centers for Environmental Information: Asheville, NC, USA, 2019. [Google Scholar]
  43. Wang, Z.A.; Gareth, L.; Cynthia, P.H.; Amy, M.E. Discrete Profile Measurements of Dissolved Inorganic Carbon, Total Alkalinity, Dissolved Oxygen, Temperature and Salinity During the R/V Tioga Ten Cruises in Wilkinson Basin of the Gulf of Maine from 2013-05-21 to 2015-02-15 (NCEI Accession 0172591); Dataset; NOAA National Centers for Environmental Information: Asheville, NC, USA, 2018. [Google Scholar]
  44. Libby, P.S.; Geyer, W.R.; Keller, A.A.; Turner, J.T.; Borkman, D.; Oviatt, C.A.; Hunt, C.D. 2002 Annual Water Column Monitoring Report; Report 2003-09; Massachusetts Water Resources Authority: Boston, MA, USA, 2003; 111p. [Google Scholar]
  45. Libby, P.S.; Geyer, W.R.; Keller, A.A.; Turner, J.T.; Borkman, D.; Oviatt, C.A. 2003 Annual Water Column Monitoring Report; Report 2004-07; Massachusetts Water Resources Authority: Boston, MA, USA, 2004; 154p. [Google Scholar]
  46. OSPAR; Villars, M.; de Vries, I.; Bokhorst, M.; Ferreira, J.; Gellers-Barkmann, S.; Kelly-Gerreyn, B.; Lancelot, C.; Mensguen, A.; Moll, A.; et al. Report of the ASMO Modelling Workshop on Eutrophication Issues, 5–8 November 1996, The Hague, The Netherlands; Report for Commission Report; Netherlands Institute for Coastal and Marine Management RIKZ: The Hague, The Netherlands, 1998. [Google Scholar]
  47. Allen, J.I.; Somerfield, P.J.; Gilbert, F.J. Quantifying uncertainty in high-resolution coupled hydrodynamic-ecosystem models. J. Mar. Syst. 2007, 64, 3–14. [Google Scholar] [CrossRef]
  48. Sutherland, J.; Walstra, D.J.R.; Chesher, T.J.; Van Rijn, L.C.; Southgate, H.N. Evaluation of coastal area modelling systems at an estuary mouth. Coast. Eng. 2004, 51, 119–142. [Google Scholar] [CrossRef]
  49. Olsen, A.; Key, R.M.; Van Heuven, S.; Lauvset, S.K.; Velo, A.; Lin, X.; Schirnick, C.; Kozyr, A.; Tanhua, T.; Hoppema, M.; et al. The Global Ocean Data Analysis Project version 2 (GLODAPv2)—An internally consistent data product for the world ocean. Earth Syst. Sci. Data 2016, 8, 297–323. [Google Scholar] [CrossRef]
  50. Melrose, D.C.; Rebuck, N.D.; Townsend, D.W.; Thomas, M.A.; Taylor, C.C. Ammonia, Silicate, Phosphate, Nitrite+Nitrate, Dissolved Oxygen, and Other Variables Collected from Profile and Discrete Sample Observations Using CTD, Nutrient Autoanalyzer, and Other Instruments from NOAA Ship Delaware II, NOAA Ship Gordon Gunter, NOAA Ship Henry, B. Bigelow, NOAA Ship Okeanos Explorer, and NOAA Ship Pisces in the Gulf of Maine, Georges Bank, and Mid-Atlantic Bight from 2009-11-03 to 2016-08-19 (NCEI Accession 0127524); Dataset; NOAA National Centers for Environmental Information: Asheville, NC, USA, 2015. [Google Scholar]
  51. Friis, K.; Körtzinger, A.; Wallace, D.W. The salinity normalization of marine inorganic carbon chemistry data. Geophys. Res. Lett. 2003, 30, 1085. [Google Scholar] [CrossRef]
  52. Burdige, D.J. 5.09-Estuarine and coastal Sediments—Coupled biogeochemical cycling. Treatise Estuar. Coast. Sci. 2011, 5, 279–316. [Google Scholar]
  53. Hunt, C.W.; Salisbury, J.E.; Vandemark, D. Controls on buffering and coastal acidification in a temperate estuary. Limnol. Oceanogr. 2022, 67, 1328–1342. [Google Scholar] [CrossRef]
  54. Krumins, V.; Gehlen, M.; Arndt, S.; Van Cappellen, P.; Regnier, P. Dissolved inorganic carbon and alkalinity fluxes from coastal marine sediments: Model estimates for different shelf environments and sensitivity to global change. Biogeosciences 2013, 10, 371–398. [Google Scholar] [CrossRef]
  55. Sippo, J.Z.; Maher, D.T.; Tait, D.R.; Holloway, C.; Santos, I.R. Are mangroves drivers or buffers of coastal acidification? Insights from alkalinity and dissolved inorganic carbon export estimates across a latitudinal transect. Glob. Biogeochem. Cycles 2016, 30, 753–766. [Google Scholar] [CrossRef]
  56. Cai, W.J.; Huang, W.J.; Luther, G.W., III.; Pierrot, D.; Li, M.; Testa, J.; Xue, M.; Joesoef, A.; Mann, R.; Brodeur, J.; et al. Redox reactions and weak buffering capacity lead to acidification in the Chesapeake Bay. Nat. Commun. 2017, 8, 369. [Google Scholar] [CrossRef]
  57. Vandemark, D.; Salisbury, J.E.; Hunt, C.W.; Shellito, S.M.; Irish, J.D.; McGillis, W.R.; Sabine, C.L.; Maenner, S.M. Temporal and spatial dynamics of CO2 air-sea flux in the Gulf of Maine. J. Geophys. Res. Oceans 2011, 116. [Google Scholar] [CrossRef]
  58. Van Heuven, S.M.A.C.; Pierrot, D.; Rae, J.W.B.; Lewis, E.; Wallace, D.W.R. MATLAB Program Developed for CO2 System Calculations; ORNL/CDIAC-105b; Carbon Dioxide Information Analysis Center, Oak Ridge National Laboratory, US Department of Energy: Oak Ridge, TN, USA, 2011; 530p. [Google Scholar]
  59. Signorini, S.R.; Mannino, A.; Najjar, R.G.; Friedrichs, M.A.; Cai, W.J.; Salisbury, J.; Wang, Z.A.; Thomas, H.; Shadwick, E. Surface ocean pCO2 seasonality and sea-air CO2 flux estimates for the North American east coast. J. Geophys. Res. Ocean 2013, 118, 5439–5460. [Google Scholar] [CrossRef]
  60. HydroQual Inc. Bays Eutrophication Model (BEM): Modeling Analysis for the Period 1992–1994; Report 2000-02; Massachusetts Water Resources Authority: Boston, MA, USA, 2000; 158p. [Google Scholar]
  61. HydroQual Inc; Signell, R.P. Calibration of the Massachusetts and Cape Cod Bays Hydrodynamic Model: 1998–1999; Report 2001-12; Massachusetts Water Resources Authority: Boston, MA, USA, 2001; 170p. [Google Scholar]
  62. Jiang, M.S.; Zhou, M. Bays Eutrophication Model (BEM) Model Verification for the Period: 2000–2001; Report 2004-09; Massachusetts Water Resources Authority: Boston, MA, USA, 2004; 90p. [Google Scholar]
  63. Tian, R.C.; Chen, C.S.; Xu, Q.C.; Xue, P.F.; Cowles, G.W.; Beardsley, R.; Rothschild, B. Massachusetts Bay Eutrophication Model: 2006–2007 Simulation; Report 2009-11; Massachusetts Water Resources Authority: Boston, MA, USA, 2009; 147p. [Google Scholar]
  64. Zhao, L.; Chen, C.; Vallino, J.; Hopkinson, C.; Beardsley, R.C.; Lin, H.; Lerczak, J. Wetland-estuarine-shelf interactions in the Plum Island Sound and Merrimack River in the Massachusetts coast. J. Geophys. Res. Ocean 2010, 115. [Google Scholar] [CrossRef]
  65. Durbin, E.G.; Durbin, A.G.; Beardsley, R.C. Springtime nutrient and chlorophyll—A concentrations in the southwestern Gulf of Maine. Cont. Shelf Res. 1995, 15, 433–450. [Google Scholar] [CrossRef]
Figure 3. Spatial distributions of first (a2) and second (b2) dominant EOF modes and the corresponding time series of their temporal amplitudes (a1,b1) for p H . Percentages in each panel are as defined in Figure 2.
Remotesensing 17 02651 g003
Figure 4. Unstructured grids of nested FVCOM systems: Mass Bay FVCOM (MB-FVCOM) (a), GOM-FVCOM (b), and Global-FVCOM (b). Red lines indicate the nesting boundary nodes.
Remotesensing 17 02651 g004
Figure 5. (a) Time series of freshwater discharges from six rivers (R1–R6: the Saugus, Mystic, Charles, Neponset, North, and Jones Rivers, from north to south). (b) Regionally averaged daily precipitation minus evaporation (P-E) over Massachusetts Bay. The black line in (b) represents the regional mean P-E, and the shaded area shows the standard deviation. River discharge data were from the USGS; P-E data are from WRF reanalysis results via NECOFS.
Remotesensing 17 02651 g005
Figure 6. Simulated surface seasonal mean distributions of temperature (a1a4), salinity (b1b4), and currents (c1c4). Panels 1–4 represent winter, spring, summer, and fall, respectively. Note: different color bar ranges were applied for temperature in each season to better highlight spatial variability.
Remotesensing 17 02651 g006
Figure 7. Observed (a1,a3,b1,b3) and simulated (a2,a4,b2,b4) daily averaged vertical profiles of temperature ( T ) and salinity ( S ) at F22 (a-panels) and S024 (b-panels) for 2016. Black dots indicate sampling times.
Remotesensing 17 02651 g007
Figure 8. Comparisons of simulated (black line) and observed (red line) surface and bottom nitrate (NO3), and pH values, averaged across all available far-field and near-field stations in Massachusetts Bay (a1,a2,b1,b2) and Boston Harbor (c1,c2,d1,d2). Black lines: simulated. Gray shadows: standard deviations relative to regional daily means. Vertical bars: observed standard deviations.
Remotesensing 17 02651 g008
Figure 10. Temporal variability of simulated daily averaged nitrate (NO3: (a1,a2)), pH (b1,b2), and Ωa (c1,c2) at F22 and S024, respectively.
Remotesensing 17 02651 g010
Figure 11. Monthly change rates of processes affecting total alkalinity (TA) and dissolved inorganic carbon (DIC) at the outer (a1,a2) and inner bay (b1,b2) sites. NCP: net community production; DN: nitrification/denitrification, AS: air–sea interactions, CD + remin: calcite dissolution/calcification plus remineralization, Adv: advection, and Total: sum of all the terms.
Remotesensing 17 02651 g011
Figure 12. Observed and simulated annual-mean normalized dissolved inorganic carbon (nDIC) and total alkalinity (nTA) in the inner (a) and outer (b) bays. Dashed lines indicate stoichiometric nTA:nDIC changes associated with NCP, AS, DN, CD, and sulfate reduction (SR). Black and green dots represent simulated and observed values, respectively, in the outer bay. See Figure 11 for definitions of NCP, AS, DN, and CD.
Remotesensing 17 02651 g012
Figure 13. Observed and simulated monthly mean normalized nDIC and nTA in the outer bay. (a) for January, (b) for February, (c) for March, (d) for April, (e) for May, (f) for June, (g) for July, (h) for August, (i) for September, (j) for October, (k) for November, and (l) for December. Definitions of NCP, AS, DN, CD and SR, as well as black and green dots, are the same as in Figure 12.
Remotesensing 17 02651 g013
Figure 14. Seasonal mean changes of partial pressure of carbon dioxide (pCO2: (a1a4)) and pH (b1b4) over the northeastern U.S. shelf (NES) and Massachusetts Bay (MB). Numeric values indicate annual linear regression change rates.
Remotesensing 17 02651 g014
Figure 15. Seasonal changes of partial pressure of carbon dioxide ( p C O 2 : (a1,a2)) and aragonite saturation state ( Ω a : (b1,b2)) relative to regionally averaged monthly mean temperature (T), salinity (S), dissolved inorganic carbon (DIC), and total alkalinity (TA) in the outer (left panels) and inner (right panels) bays.
Remotesensing 17 02651 g015
Figure 16. Comparisons of simulated and observed nitrate (NO3:(a1a4)) and dissolved oxygen (DO: (b1b4)) concentrations at the surface and bottom at F22 and S024, respectively. Black line: NeBEM (daily averaged). Blue line: UG-RCA (3-day averaged). Red dots: observed.
Remotesensing 17 02651 g016
Figure 17. Change rates of dissolved oxygen sources and sinks produced by NeBEM (blue line) and UG-RCA (red line), based on regionally and vertically averaged daily rates. R A i r S e a (a): oxygen production from air–sea gas exchanges; R P R (b): oxygen production from net community production; R N i t r i (NeBEM, (c)): oxygen consumed by nitrification in NeBEM; R N i t r i   (UG-RCA, (c)): oxygen consumed by nitrification in UG-RCA; R O x i d (c): oxygen consumed by oxidation of carbonaceous and nitrogenous materials in UG-RCA; R S O D (c): oxygen consumed by sediment oxygen demand in UG-RCA; R S u l f (c): oxygen consumed by oxidation of sulfide oxygen equivalents in UG-RCA. Dashed line indicates zero change.
Remotesensing 17 02651 g017
Table 1. Modified parameterization for 3-D experiments.
ParameterUnitValue
Sinking velocity for small-size POMm/day0.1 (1.0)
Sinking velocity for medium-size POMm/day0.5 (5.0)
Sinking velocity for large-size POMm/day1.0 (10.0)
Remineralization rate for benthic DOM1/day0.1 (0.001)
Remineralization rate for benthic POM1/day0.05 (0.0025)
Remineralization rate for benthic refractory matter1/day0.01 (0.001)
Note: Original values used by 1-D experiments are given in parentheses if different from this application.
Table 2. Seasonal and annual freshwater discharges.
RiverAnnualWinterSpringSummerFall
Saugus0.6 ± 0.50.9 ± 0.51.0 ± 0.30.3 ± 0.30.2 ± 0.1
Mystic1.2 ± 1.42.1 ± 1.82.0 ± 1.20.2 ± 0.40.3 ± 0.2
Charles5.2 ± 4.57.7 ± 3.69.4 ± 4.01.7 ± 1.71.9 ± 1.7
Neponset5.3 ± 5.48.6 ± 4.710.3 ± 4.91.1 ± 1.21.4 ± 1.3
North0.2 ± 0.20.3 ± 0.10.3 ± 0.20.1 ± 0.10.2 ± 0.1
Jones0.5 ± 0.50.8 ± 0.50.9 ± 0.50.1 ± 0.10.2 ± 0.2
Note. Unit is in m3/s. Winter is defined as December, January, and February. Spring is defined as March, April, and May. Summer is defined as June, July, and August. Fall is defined as September, October, and November.
Table 3. Scores of statistical measures.
Score ColorScoreCFPBARMAE
Excellent and very good<1<20<0.2
Good1–220–400.2–0.4
Reasonable2–3/0.4–0.7
Poor and bad>3>400.7–1.0
Note. CF: Cost Function; PB: Percentage of Bias; ARMAE: Adjusted Relative Mean Absolute Error. No reasonable score is defined for P B .
Table 4. Statistical measure scores of the model–observation comparison in the outer bay.
TSNO3NH4PO4SiO4DOChl-apH
CF0.050.100.720.420.530.730.480.840.76
PB0.490.0948.94−9.83−2.15−11.711.82−51.130.74
ARMAE0.020.010.580.660.250.400.020.540.01
Note. T: temperature, S: salinity, NO3: nitrate, NH4: ammonium, PO4: phosphate, SiO4: silicate, DO: dissolved oxygen, and Chl-a: chlorophyll a. Blue: excellent and very good. Green: good. Yellow: reasonable. Red: poor and bad.
Table 5. Statistical measure scores of the model–observation comparison in the inner bay.
TSNO3NH4PO4SiO4DOChl-a pH
CF0.110.200.490.791.210.670.491.070.97
PB0.59−0.23−9.00−11.64−45.74−0.523.25−65.411.43
ARMAE0.040.010.490.790.540.740.030.700.02
Note. T: temperature, S: salinity, NO3: nitrate, NH4: ammonium, PO4: phosphate, SiO4: silicate, DO: dissolved oxygen, and Chl-a: chlorophyll a. Blue: excellent and very good. Green: good. Yellow: reasonable. Red: poor and bad.
Table 6. Simulated regional annual mean and root-mean-square errors (RMSEs) of nitrate (NO3), ammonium (NH4), phosphate (PO4), silicate (SiO4), and dissolved oxygen (DO).
NO3 (μM)NH4 (μM)PO4 (μM)SiO4 (μM)DO (mg/L)
MBBHMBBHMBBHMBBHMBBH
NeBEM6.1 ± 1.73.7 ± 0.31.5 ± 0.21.6 ± 0.20.6 ± 0.00.3 ± 0.33.4 ± 0.33.3 ± 1.79.4 ± 0.29.2 ± 0.3
UG-RCA3.8 ± 0.55.4 ± 1.40.9 ± 0.82.1 ± 0.30.5 ± 0.10.7 ± 0.12.6 ± 1.06.1 ± 1.28.9 ± 0.48.6 ± 0.3
Disclaimer/Publisher’s Note: The statements, opinions and data contained in all publications are solely those of the individual author(s) and contributor(s) and not of MDPI and/or the editor(s). MDPI and/or the editor(s) disclaim responsibility for any injury to people or property resulting from any ideas, methods, instructions or products referred to in the content.