Article

Comprehensive Assessment of Ocean Surface Current Retrievals Using SAR Doppler Shift and Drifting Buoy Observations

1
Satellite Oceanography Laboratory, Russian State Hydrometeorological University, St. Petersburg 195196, Russia
2
State Key Laboratory of Climate System Prediction and Risk Management, Nanjing University of Information Science and Technology, Nanjing 210044, China
3
School of Marine Sciences, Nanjing University of Information Science and Technology, Nanjing 210044, China
4
SANYA Oceanographic Laboratory, Sanya 572024, China
5
Marine Hydrophysical Institute of RAS, Sebastopol 299011, Russia
*
Author to whom correspondence should be addressed.
Remote Sens. 2025, 17(12), 2007; https://doi.org/10.3390/rs17122007
Submission received: 19 May 2025 / Revised: 7 June 2025 / Accepted: 9 June 2025 / Published: 10 June 2025

Abstract

:
Ocean surface radial current velocities can be derived from synthetic aperture radar (SAR) Doppler shift observations using the Doppler centroid technique and a recently developed Doppler velocity model. However, comprehensive evaluations of the accuracy and reliability of these retrievals remain limited. To address this gap, we analyzed 6341 Sentinel-1 SAR scenes acquired over the South China Sea (SCS) between December 2017 and October 2023, in conjunction with drifting buoy observations, to systematically validate the retrieved radial current velocities. A linear fitting method and the dual co-polarization Doppler velocity (DPDop) model were applied to correct for the influence of non-geophysical factors and sea state effects. The validation against the drifter data yielded a bias of 0.01 m/s, a root mean square error (RMSE) of 0.18 m/s, and a mean absolute error (MAE) of 0.16 m/s. Further comparisons with the Surface and Merged Ocean Currents (SMOC) dataset revealed bias, RMSE, and MAE values of 0.07 m/s, 0.14 m/s, and 0.12 m/s in the Beibu Gulf, and −0.06 m/s, 0.23 m/s, and 0.19 m/s in the Kuroshio intrusion area. These results demonstrate that SAR Doppler measurements have a strong potential to complement existing ocean observations in the SCS by providing high-resolution (1 km) ocean surface current maps.

1. Introduction

Ocean surface currents (OSCs) play a crucial role in marine dynamics and consist of multiple components, including geostrophic currents, Ekman currents [1], Stokes drift [2], tidal currents, and near-inertial currents [3]. An accurate knowledge of OSCs is essential for a variety of maritime applications, such as navigation, fisheries, and marine search and rescue operations [4,5,6,7]. Direct in situ measurements of ocean current velocities can be obtained using instruments, such as the Acoustic Doppler Current Profiler (ADCP) [8], Acoustic Wave and Current Profiler (AWAC) [9], wave gliders [10], saildrones [11], and drifting buoys [12]. While these instruments provide high-quality current measurements, they are constrained by their limited spatial coverage, high operational costs, and relatively short deployment durations. To address these limitations, remote sensing technologies, such as airborne Doppler radar [13] and high-frequency (HF) radar [14], have been developed. HF radar offers high temporal and spatial resolution for surface current measurements, but is generally limited to within 300 km of the coastline. Airborne radar systems can provide broader coverage with finer spatial resolution; however, their performance is often highly sensitive to weather conditions. Recent advancements in satellite remote sensing have made it increasingly feasible to derive surface current fields from satellite observations. For instance, satellite altimetry enables the estimation of geostrophic surface currents through analyses of the sea surface height (SSH) variability [15]. However, geostrophic currents represent only one component of the total OSC velocity.
In recent years, spaceborne synthetic aperture radar (SAR) has emerged as a valuable tool for observing surface ocean currents, owing to its all-weather capability, continuous data availability, and high spatial resolution [16]. Rather than directly measuring the current velocity, SAR measures the Doppler frequency shifts induced by the motion of the sea surface. These observed Doppler shifts include both geophysical and non-geophysical components. The non-geophysical contributions arise from factors such as satellite attitude variations, scalloping effects, antenna electromagnetic mispointing, and residual errors. In contrast, geophysical Doppler shifts are associated with wave-induced motion and the actual dynamics of the ocean current. To isolate the Doppler shift attributable solely to ocean currents, both the non-geophysical and wave-induced Doppler contributions must be corrected [17,18]. The satellite attitude variations are typically corrected using pitch and yaw angles derived from onboard gyroscope telemetry [19]. The scalloping effects are commonly addressed through linear regression techniques [20] or Fourier transform methods [21]. The biases resulting from antenna mispointing and residual Doppler errors can be mitigated by referencing the “0 Hz” Doppler shift measured over the land areas in the SAR scenes [22,23]. Significant effort has also been devoted to estimating the geophysical Doppler contribution associated with the sea state. A widely used model, the CDOP, estimates this component based on the wind fields and radar configuration parameters [24]. However, the CDOP does not account for wave characteristics. To overcome this limitation, several empirical models, such as the CDOP3S, CDOP3SX, CDOP3SiX, and CDOP-Yn, have been developed to incorporate more comprehensive sea state information by including wave characteristic parameters alongside wind fields as the input variables [25,26,27].
Unlike purely data-driven empirical models, we developed a semi-empirical approach, known as the dual co-polarization Doppler velocity (DPDop) model, to estimate the wave-induced Doppler shifts [28,29]. This model accounts for the four primary contributors to the Doppler velocity: short Bragg waves, breaking waves, tilt, and hydrodynamic modulation associated with long waves. The DPDop model incorporates a range of input variables, including the wind fields (wind speed and wind direction), the wave parameters (such as significant wave height (SWH), wave direction, and wave number) or a full two-dimensional (2D) wave spectrum, and radar configuration settings (e.g., incidence angle, look direction, and polarization). It is capable of estimating the Doppler effects of wind-generated waves and swells, either separately or in combination. The validation of the DPDop model was conducted using HF radar measurements collected in the peripheral region of Hurricane Maria, under wind speeds below 28.7 m/s. The results showed a bias of 0.02 m/s and a root mean square error (RMSE) of 0.19 m/s [29]. However, we acknowledge that validation based on a single case study is insufficient to fully assess the model’s robustness and applicability across diverse and complex sea state conditions.
The objective of this study is to conduct a comprehensive evaluation of radial ocean surface current retrievals over the South China Sea (SCS) using the Doppler shift data derived from Sentinel-1 SAR, in combination with drifting buoy observations. Both case-based analyses and statistical assessments are employed to validate the accuracy of the retrieved radial current velocities. In addition, the Surface Merged Ocean Currents (SMOC) dataset is used as an independent reference to further evaluate the retrieval performance. The remainder of the paper is organized as follows: Section 2 describes the data and methodologies; Section 3 presents the experimental results; Section 4 provides an in-depth discussion; and Section 5 concludes the study.

2. Materials and Methods

This study evaluates the accuracy of the radial surface current retrievals by comparing them with observations from drifting buoys and the SMOC product, both spatially and temporally collocated with the Sentinel-1 SAR Doppler shift measurements. The DPDop model, used to estimate the wave-induced Doppler contributions, requires several input variables, including the wind speed and direction, SWH, wave direction, wave number, and radar configuration parameters. The wind speed was retrieved using geophysical model functions (GMFs), such as CMOD-IFR2 [30] or CMOD5.N [31], while the wind direction data were obtained from the European Centre for Medium-Range Weather Forecasts (ECMWF) reanalysis data. The Wind speed and direction were also available from the Sentinel-1 Level-2 Ocean (OCN) products. The wave characteristic parameters, including the SWH, wave number, and wave direction, were simulated using the WAVEWATCH III (WW3) model. The spatial resolutions of the ECMWF and WW3 datasets are 0.25° and 0.5°, respectively, with a temporal resolution of 1 h.

2.1. Sentinel-1 Level-2 OCN Data

The Sentinel-1 satellite constellation consists of three SAR satellites: Sentinel-1A, -1B, and -1C. Sentinel-1A and -1B were launched in April 2014 and April 2016, respectively, with Sentinel-1C joining the mission in December 2024. Currently, Sentinel-1A and -1C remain operational, while Sentinel-1B ceased functioning in January 2021 due to a power failure. The Sentinel-1 Level-2 Ocean (OCN) product provides Doppler shift measurements, wind speed estimates derived from VV-polarized radar backscatter, and wind direction obtained from the ECMWF reanalysis data. Operating in the interferometric wide (IW) mode, the OCN product offers a 250 km swath at a spatial resolution of 1 km. The incidence angle across the three IW sub-swaths ranges from 30° (near range) to 46° (far range), segmented into intervals of 30–36°, 36–42°, and 42–46°. These data are freely available through the Copernicus Open Access Hub. For this study, a total of 6431 Sentinel-1 SAR acquisitions in IW mode covering the SCS were collected between 5 November 2017 and 31 October 2023. Their geographical distribution is illustrated in Figure 1.

2.2. Drifter Ocean Surface Current Data

The Global Drifter Program (GDP) maintains a network of approximately 1300 surface drifters that provide ocean current data worldwide, with temporal resolutions of 1 h [32] and 6 h [33]. Between 5 November 2017 and 31 October 2023, a total of 487 drifting buoys collected surface current measurements in the SCS. The 1 h resolution data are available through 31 October 2022, while the 6 h resolution data extend to 31 October 2023. Accordingly, the Sentinel-1 SAR Doppler shift observations were matched with the 1 h drifter data up to 31 October 2022, and with the 6 h drifter data thereafter. Both datasets are publicly available from the National Oceanic and Atmospheric Administration (NOAA) GDP website. Figure 1 illustrates the trajectories and corresponding surface current velocities of the drifting buoys. A strong coastal current is evident along the southeast shelf of Vietnam, with velocities occasionally exceeding 2 m/s, primarily driven by summer upwelling in this region [34]. Additionally, the combined effects of the coastal topography and wave-induced motion generate pronounced longshore currents near the Pearl River estuary. The figure also reveals the distinct signatures of the Kuroshio current and a prominent mesoscale eddy southeast of Taiwan, both of which are further analyzed in the case studies presented later in this paper.

2.3. SMOC Ocean Surface Current Data

The SMOC product integrates the three primary components of ocean surface currents: large-scale ocean circulation, wave-induced Stokes drift, and tidal currents. These components are derived from three independent modeling systems: (1) the global high-resolution (1/12°) real-time forecasting system provided by the Copernicus Marine Environment Monitoring Service (CMEMS) [35,36]; (2) the CMEMS global wave forecasting system, with a 1/10° resolution, used for estimating the Stokes drift [37]; and (3) the FES2014 tidal model, also with a resolution of 1/12°, which provides estimates of the tidal currents [38]. The SMOC product provides hourly averaged ocean surface current data (filename: cmems_mod_glo_phy_anfc_merged-uv_PT1H-i) at a horizontal resolution of 1/12°, and is publicly available through the Copernicus Marine Service (CMS). A validation against the drifter observations has demonstrated strong agreement, with a reported standard deviation of approximately 0.09 m/s [39].

2.4. Methods

The Doppler shifts ( f d c ) measured by SAR consist of both non-geophysical and geophysical components. The non-geophysical contributions include variations in the satellite attitude and orbit ( f a t t ), scalloping effects ( f s c a ), antenna electronic mispointing ( f e l e c ), and residual errors ( f ). The geophysical contributions arise from the ocean surface currents ( f o s c ) and sea state effects ( f s s ). Accordingly, the total observed Doppler shift can be expressed as
f d c = f a t t + f s c a + f e l e c + f o s c + f s s + f
To accurately retrieve the radial OSC velocities, several correction procedures are applied to the observed Doppler shifts:
  • Correction of satellite attitude and orbit variations ( f a t t ): These contributions are corrected using information provided in the Sentinel-1 Level-2 OCN product.
  • Correction of scalloping effects ( f s c a ): A linear fitting method is employed to mitigate the Doppler distortions caused by scalloping. Notably, since 23 June 2020, the Sentinel-1 Instrument Processing Facility (IPF) has implemented internal corrections for Doppler scalloping [40].
  • Correction of antenna electronic mispointing ( f e l e c ) and residual biases ( f ): The doppler shift measurements over land are used as references to correct for the f e l e c and f over the ocean.
  • Removal of sea state effects ( f s s ): The geophysical Doppler contributions arising from wind waves and swell ( f s s ) are estimated and removed using the DPDop model. The DPDop model expresses the Doppler velocity ( V D ) as the sum of the OSC velocity, the contributions from Bragg waves and breaking wave motions, and the effects of tilt and hydrodynamic modulation.
V D = u s + 1 P N P c B + P N P c N P + c T + P N P c w b H
Here, u s denotes the radial OSC velocity, and P N P represents the ratio of the non-polarized backscatter ( σ n p ) to the total radar backscatter ( σ 0 p p ). The terms c B and c N P correspond to the velocities of the Bragg waves and breaking waves, respectively, while c T and c w b H account for the contributions of the tilt and hydrodynamic modulation to the V D . The formulas for each term are given as follows:
c B = c b r A b r φ A b r φ + π A b r φ + A b r φ + π
c n p = ε w b c ¯ w b A n p φ A n p φ + π A n p φ + A n p φ + π
c T = c o t θ M f t c o s φ R φ m C m k m 2 E
c w b H = [ c o s φ R φ m M 1 w b h φ m , k m + c o t θ M 2 w b h φ m , k m ] C m k m 2 E
In these equations, c b r denotes the phase speed of the Bragg waves, and A b r represents the directional distribution of the Bragg wave spectrum. The variable φ is the angular offset between the radar look direction ( φ R ) and the wind direction. The parameter ε w b is the wave-breaking tuning coefficient, while c ¯ w b represents the average speed of the breaking waves, and A n p characterizes the angular distribution of the breaking facets. The radar incidence angle is denoted by θ .   M f t and M w b h are transfer functions describing the effects of the tilt and hydrodynamic modulation, respectively. φ m is the mean wave direction, C m is the phase velocity corresponding to the mean wave number ( k m ), and E is the total wave energy. Detailed formulations for these parameters can be found in references [28,29]. The sum of the last four terms on the right-hand side of Equation (2) corresponds to the sea state-induced Doppler velocity, denoted as U s s . The resulting Doppler shift due to the sea state effect is given by f s s = k r s i n θ U s s / π , where k r = 113 m−1 is the electromagnetic wavenumber for C-band Sentinel-1 SAR.
For detailed descriptions of these correction procedures, refer to [20]. Once all the corrections are applied, the residual Doppler shift signal ( f o s c ) is assumed to arise solely from the surface currents. The radial current velocity ( U r v l ) is then calculated using the following equation:
U r v l = π f o s c k r s i n θ
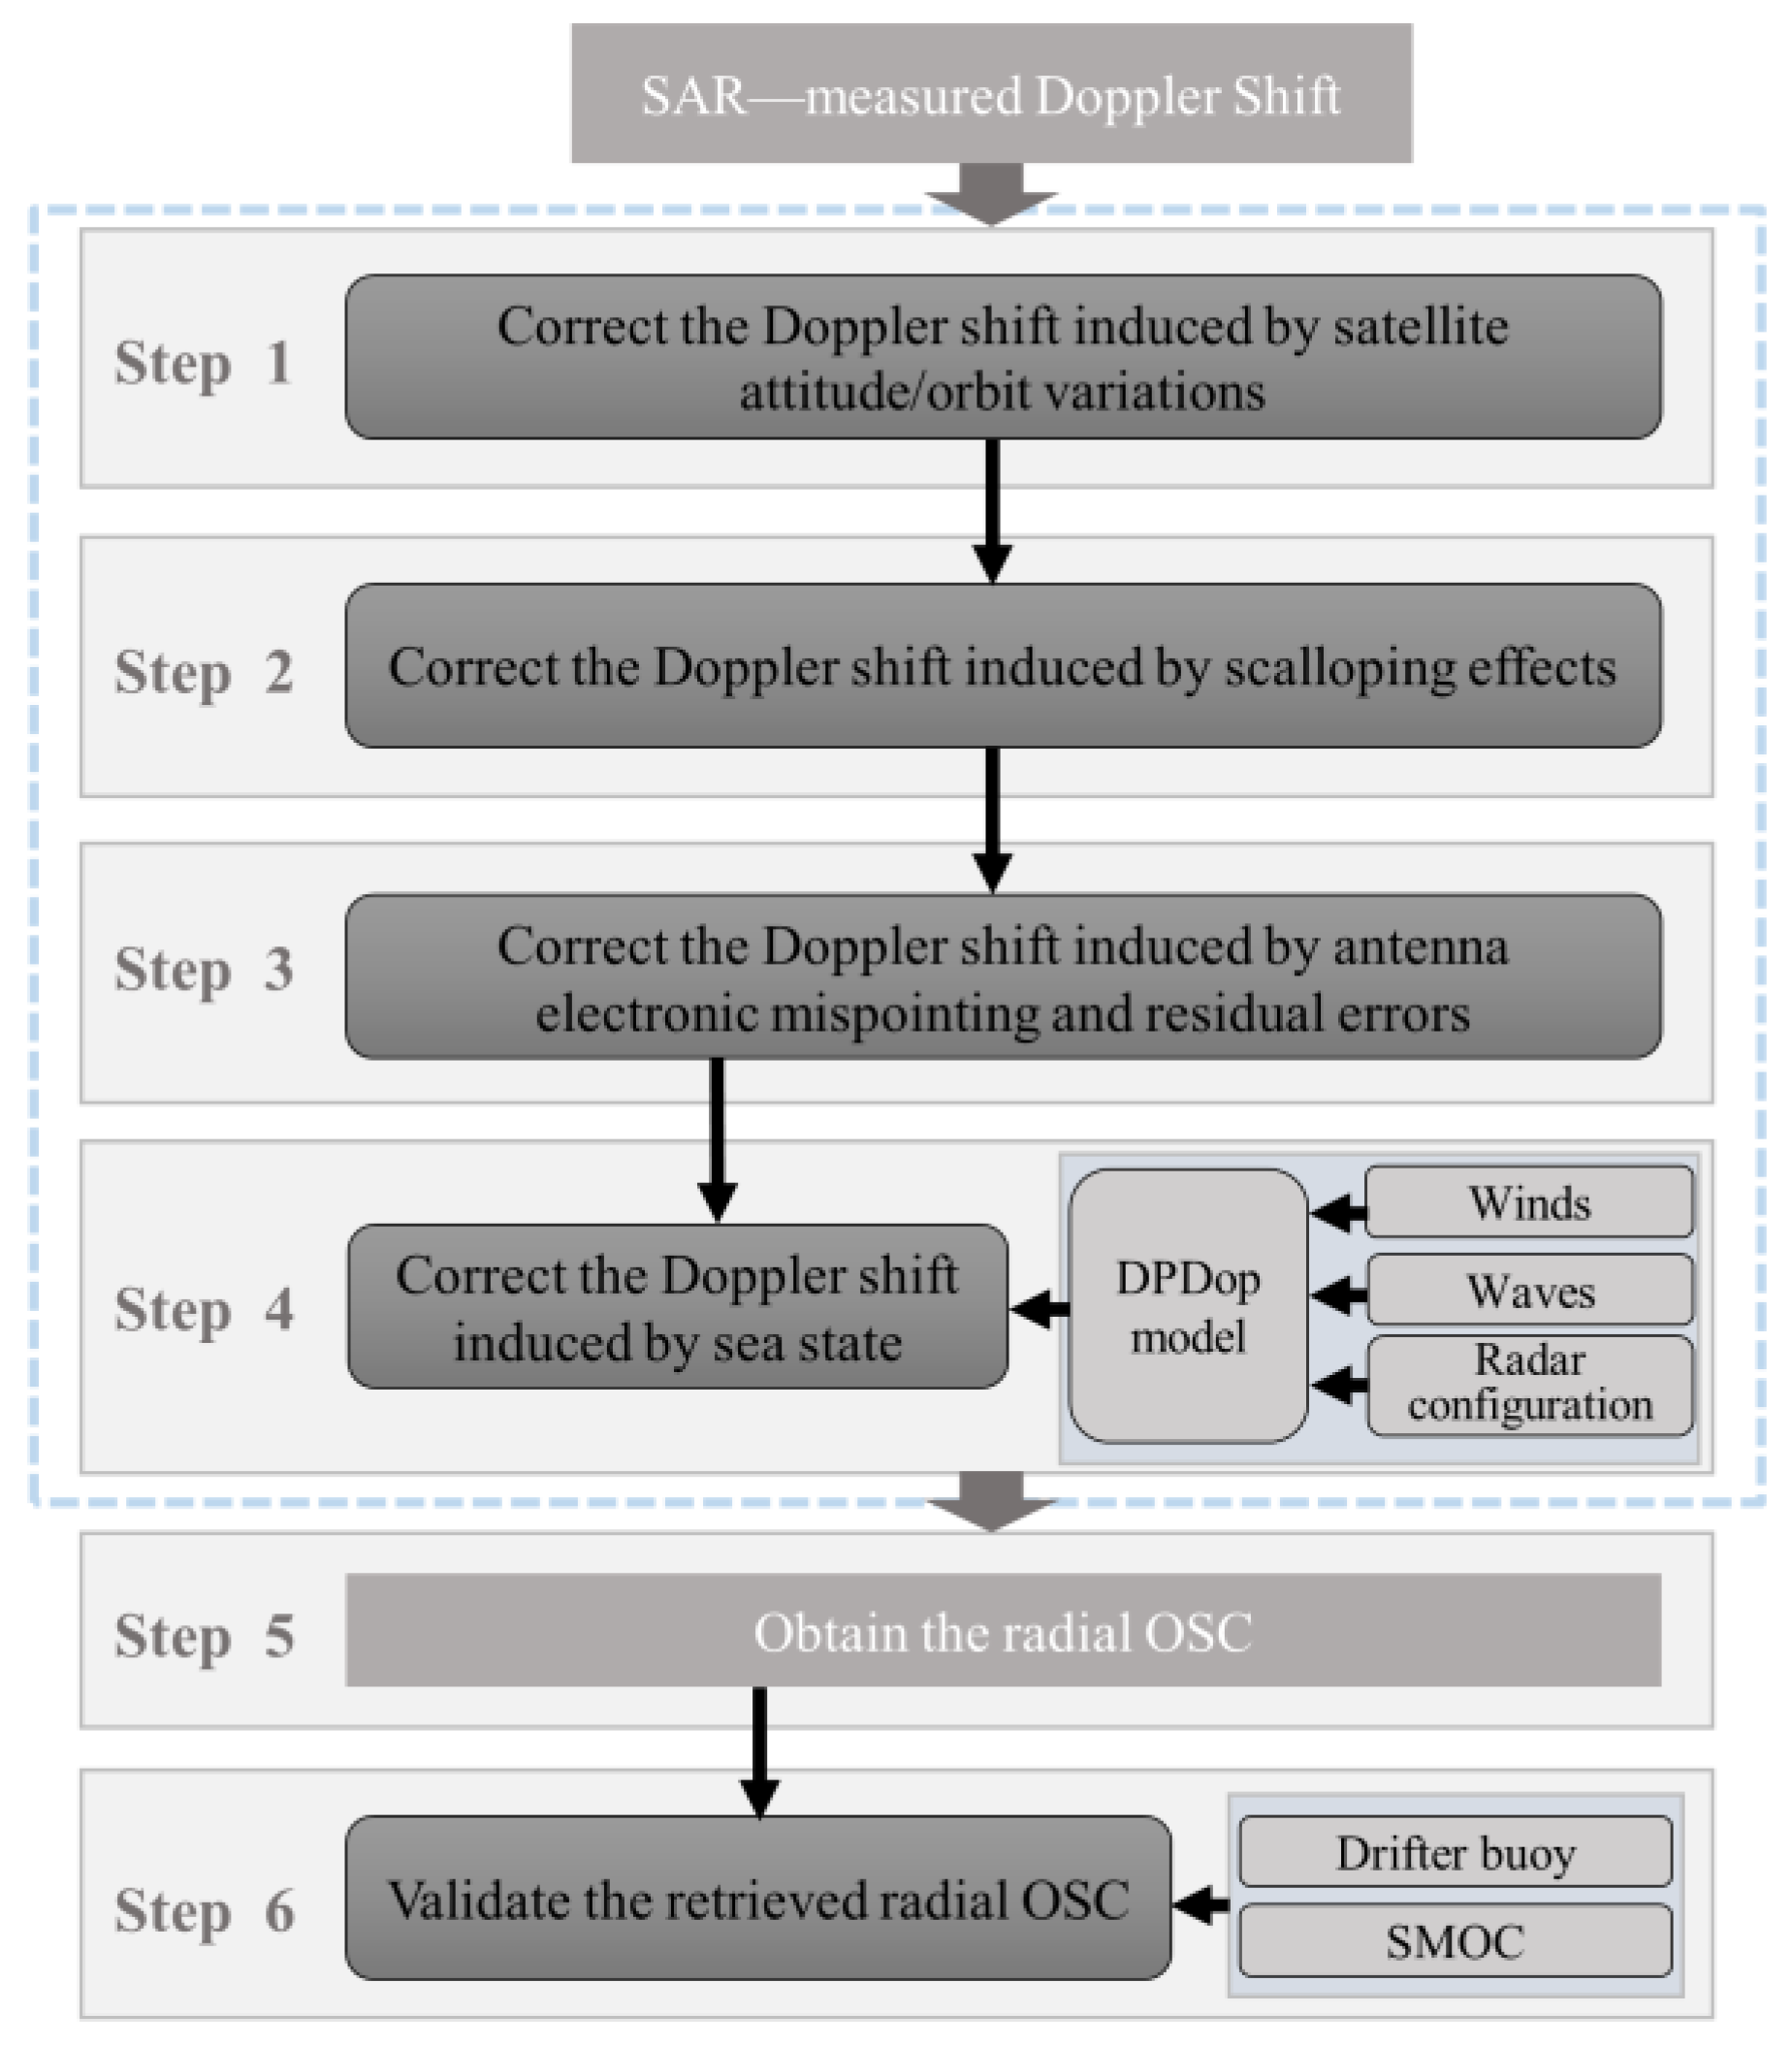
This equation converts the current-induced Doppler shift along the radar line-of-sight into the corresponding radial current velocity. Accordingly, U r v l represents only one component of the full OSC vector. It is important to note that U r v l is negative when the surface current flows toward the radar and positive when it flows away. The SAR-retrieved radial OSC velocities are subsequently validated using both the drifting buoy measurements and the SMOC product. The complete workflow for the Doppler correction and results validation is illustrated in Figure 2. To evaluate the performance of the surface current retrieval, two representative case studies are presented, followed by a comprehensive statistical analysis based on the full dataset collected over the SCS.

3. Results

3.1. Case Validation: Beibu Gulf

The first case study is of the Beibu Gulf of the SCS, as illustrated in Figure 3. Figure 3a shows the surface wind speeds estimated from the Sentinel-1A VV-polarized NRCS using the CMOD5.N. A strong wind zone is observed south of Hainan Island, with maximum wind speeds reaching 16.1 m/s. Figure 3b presents the corresponding SWH derived from the WW3 model simulations. The alignment between the wind and wave propagation directions indicates that the wind waves dominant the sea state in this case. In the high-wind region south of Hainan Island, the maximum SWH reaches 4.7 m, consistent with the strongest wind conditions.
By inputting the wind and wave fields from Figure 3a,b into the DPDop model, the Doppler shift induced by the wave motion is estimated. As shown in Figure 3c, following the correction procedure outlined in Figure 2, the radial OSC velocity at a spatial resolution of 1 km is presented. The strongest surface currents are observed in the high-wind region south of Hainan Island, with a maximum velocity of 0.95 m/s. The solid purple circle in Figure 3c marks the position of a collocated drifting buoy, which recorded a near-surface current speed of 0.59 m/s and a radial component of −0.03 m/s. This observation closely matches the SAR-retrieved radial current velocity of −0.07 m/s.
Figure 3d displays the corresponding radial OSC velocities derived from the SMOC product. To enable its direct comparison with the SAR retrievals, the original SMOC data (1/12° resolution) were interpolated onto a 1 km grid. In Figure 3c,d, the black arrows indicate the direction of the surface currents. Overall, the SAR-retrieved radial OSC velocities exhibit spatial patterns consistent with those from the SMOC product. At the drifting buoy location, the SMOC product reported a current speed of 0.6 m/s and a radial component of −0.12 m/s, both of which are in reasonable agreement with the SAR retrievals and drifter observations. However, in regions with strong surface currents, the SAR-retrieved radial velocities tend to be slightly higher than those reported by the SMOC.
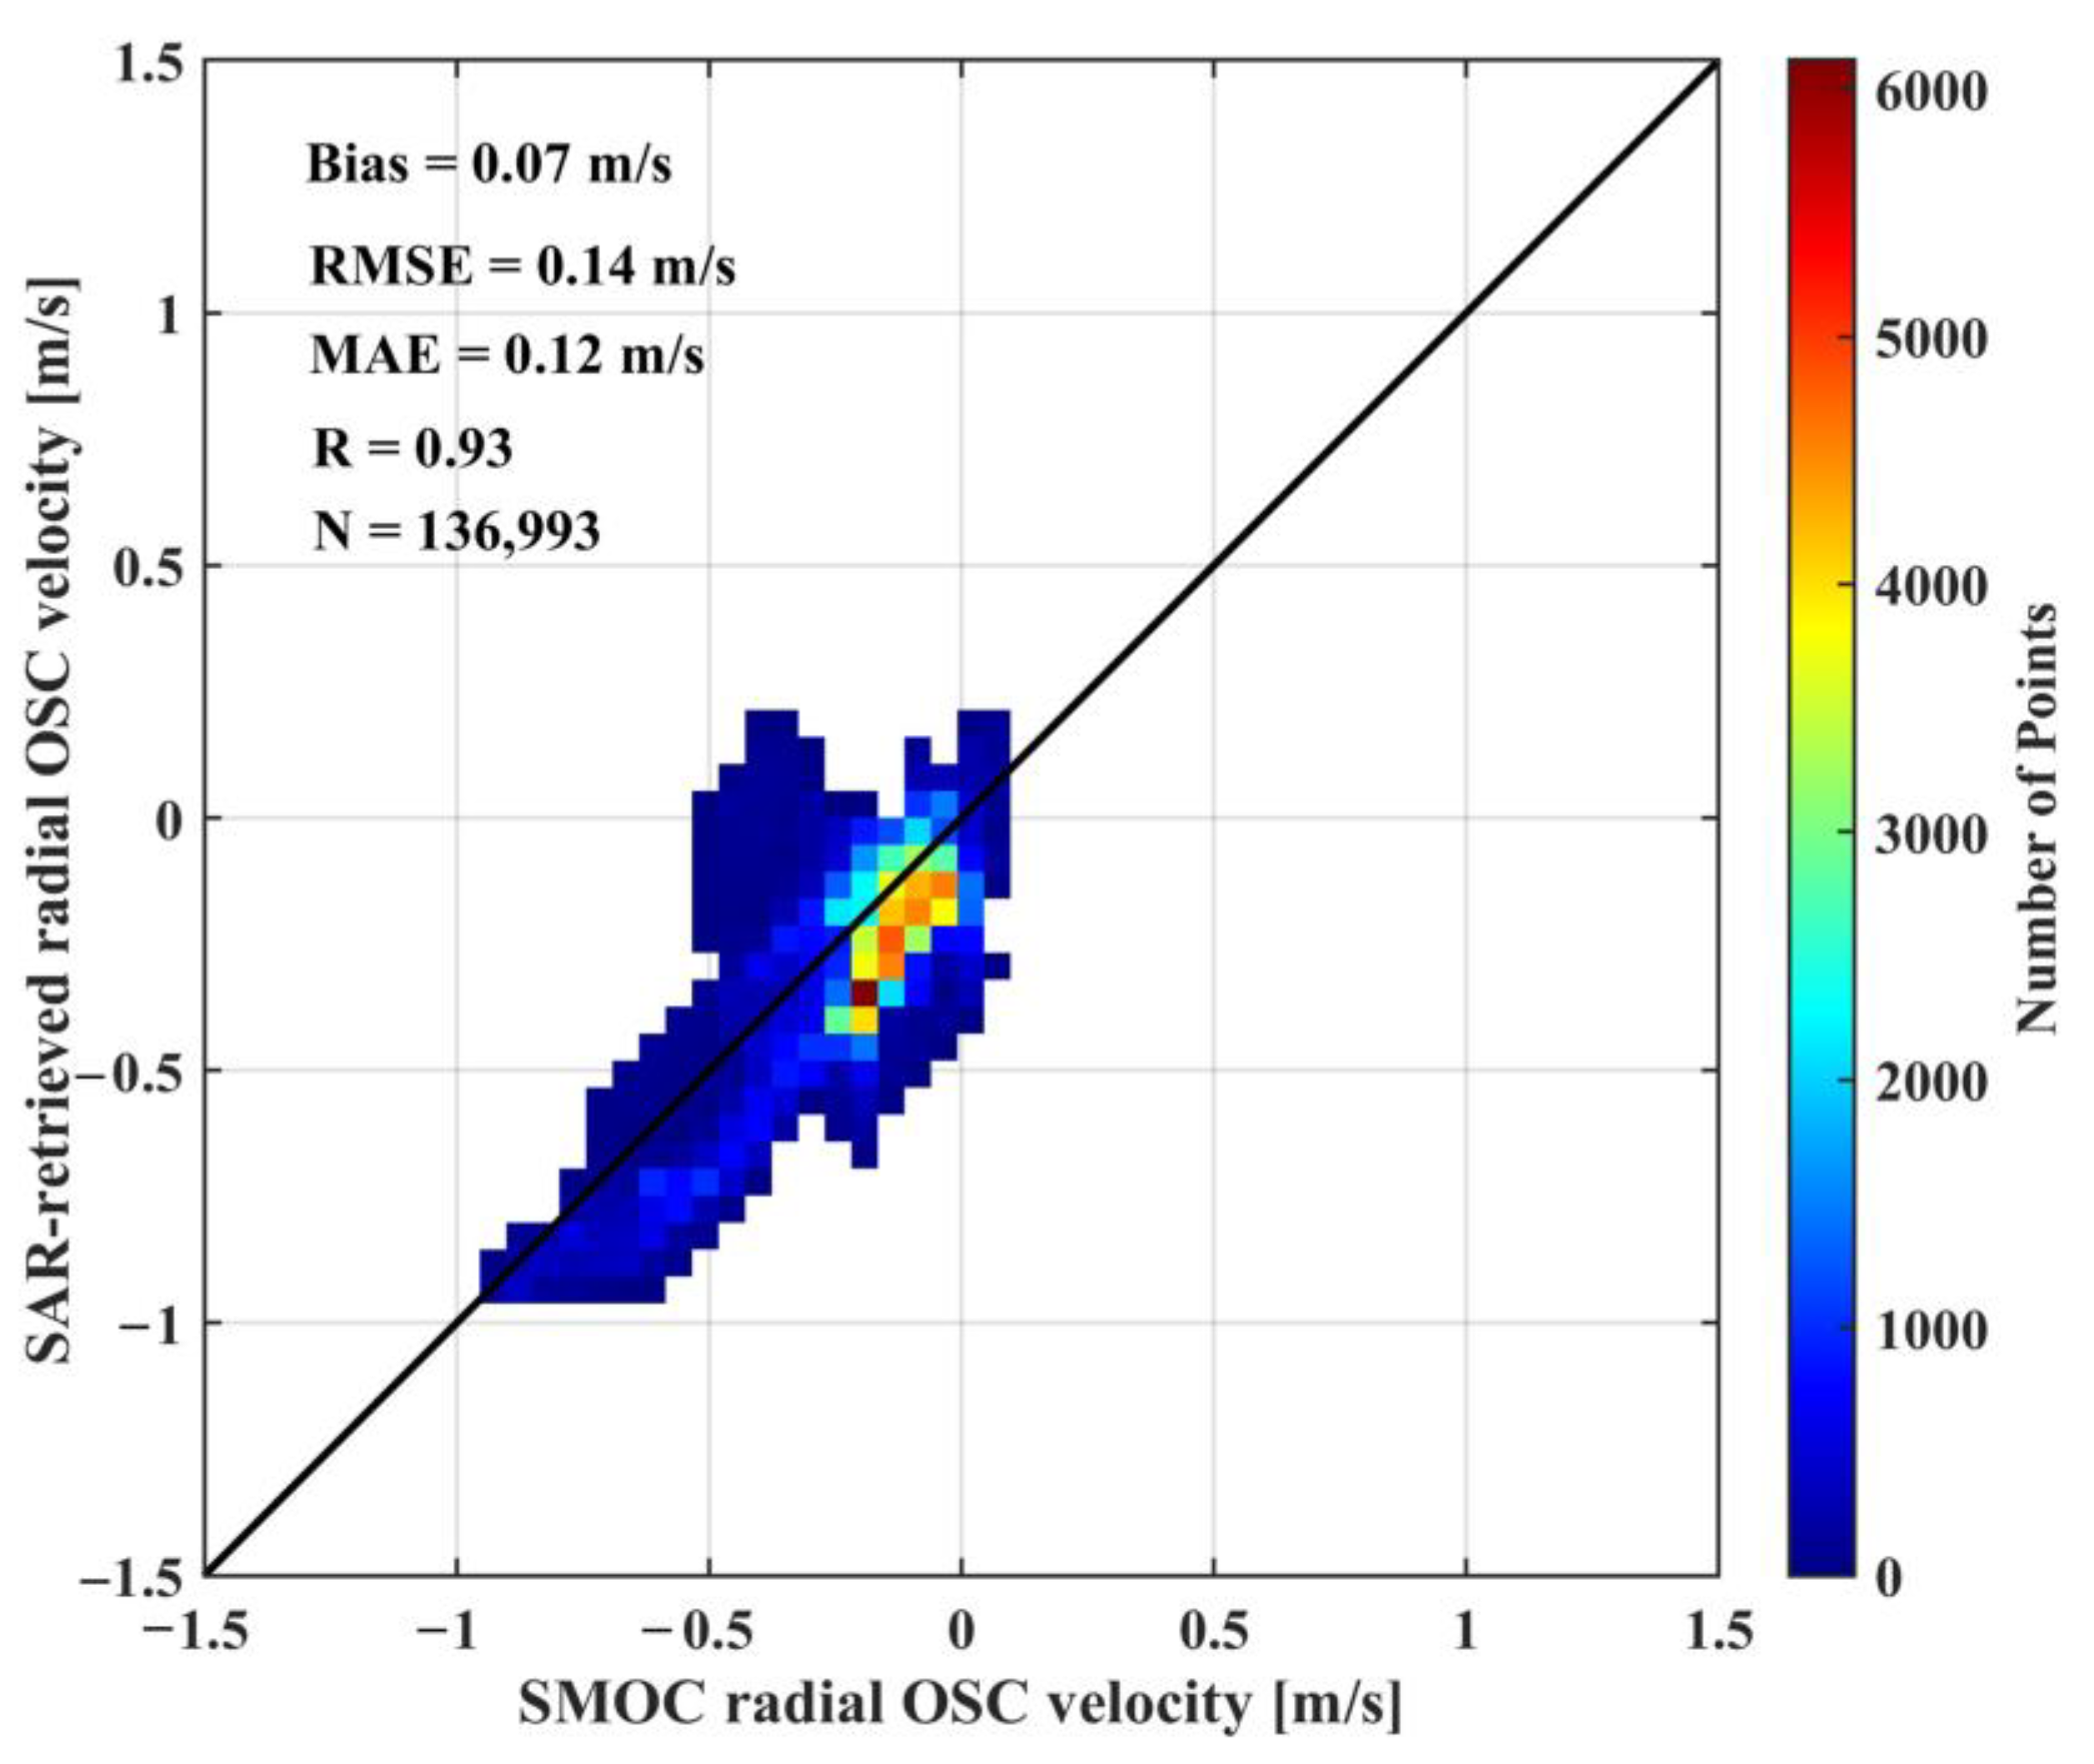
Figure 4 presents a scatter plot comparing the SAR-retrieved and SMOC-derived radial OSC velocities. The comparison yields a bias of 0.07 m/s, a RMSE of 0.14 m/s, a MAE of 0.12 m/s, and a correlation coefficient (R) of 0.93. Although some discrepancies occur in areas of strong currents, the small bias, RMSE, and MAE, along with the high correlation coefficient, indicate strong overall agreement between the SAR retrievals and SMOC data. These results demonstrate the reliability and robustness of the SAR-derived radial OSC velocities obtained from Doppler shift measurements.

3.2. Case Validation: Kuroshio Current

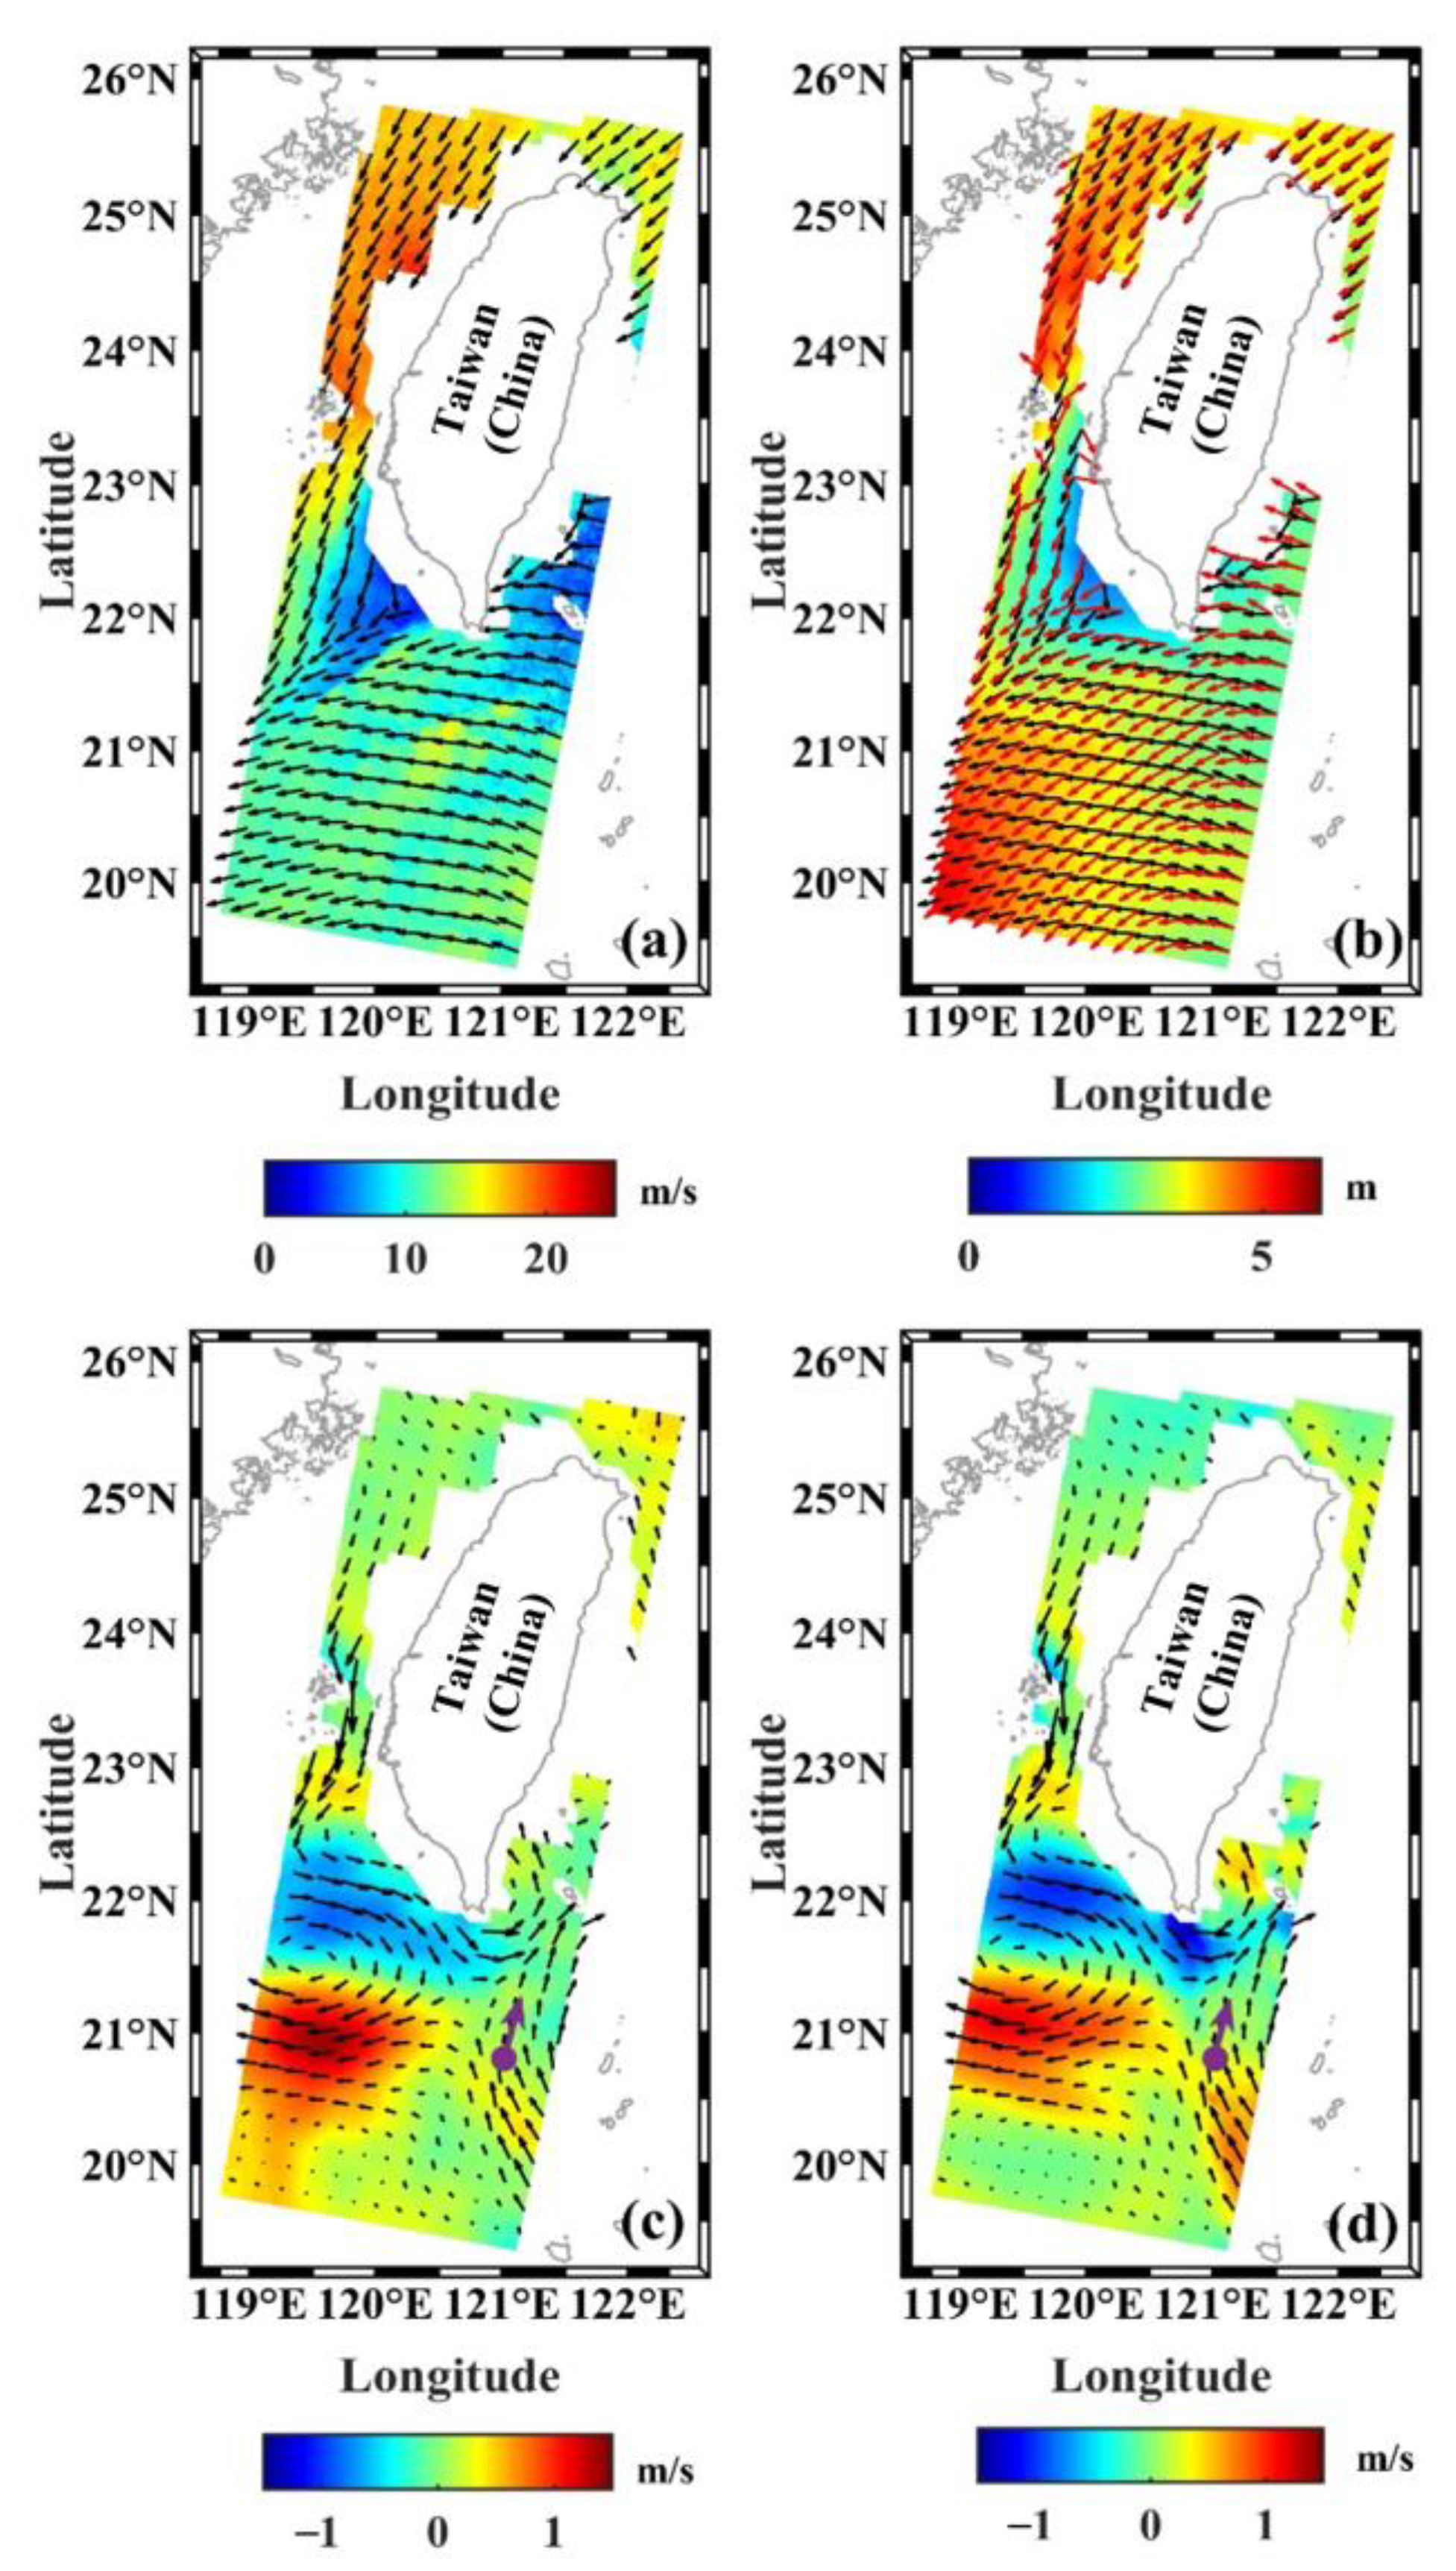
The second case study focuses on the region near the Kuroshio current, as shown in Figure 5. In Figure 5a, the wind fields derived from a Sentinel-1A SAR image over the Taiwan Strait reveal high wind activity, with peak speeds reaching 23.6 m/s. These intense winds generated significant wind waves, resulting in a maximum SWH of 4.9 m, as depicted in Figure 5b. Notably, in the southwestern offshore region of Taiwan, an area with comparatively lower wind speeds (13.3 m/s) exhibited even higher wave heights, reaching up to 5.3 m. This marked discrepancy between local wind and wave conditions suggests the presence of mixed wave fields or a dominant swell system. Such complex sea states, coupled with strong winds, pose substantial challenges for surface current retrieval, as accurately correcting for the Doppler shifts induced by high sea states is essential for isolating the contributions of ocean surface currents.
After correcting for the non-geophysical components, the radial OSC velocity is derived from the Doppler shifts induced by the surface currents. As shown in Figure 5c, the retrieved radial OSC velocity map reveals a well-defined anticyclonic eddy in the southwestern offshore region of Taiwan, consistent with the multi-temporal drifting buoy observations (see Figure 1). The maximum radial velocity within this eddy reaches 1.4 m/s. This anticyclonic eddy originates from the Kuroshio intrusion through the Luzon Strait and is primarily driven by barotropic and baroclinic instabilities associated with the Kuroshio intrusion [41].
At the location marked by the solid purple circle, a drifting buoy recorded a near-surface current speed of 0.56 m/s and a radial component of −0.05 m/s, which closely match the SAR-retrieved value of −0.04 m/s. Figure 5d presents the SMOC-derived radial velocities and corresponding current directions, also shown in Figure 5c. Overall, the SAR retrievals show good agreement with the SMOC data, with minor discrepancies, specifically, a slight overestimation in the southern portion of the anticyclonic eddy and an underestimation southeast of the drifting buoy location.
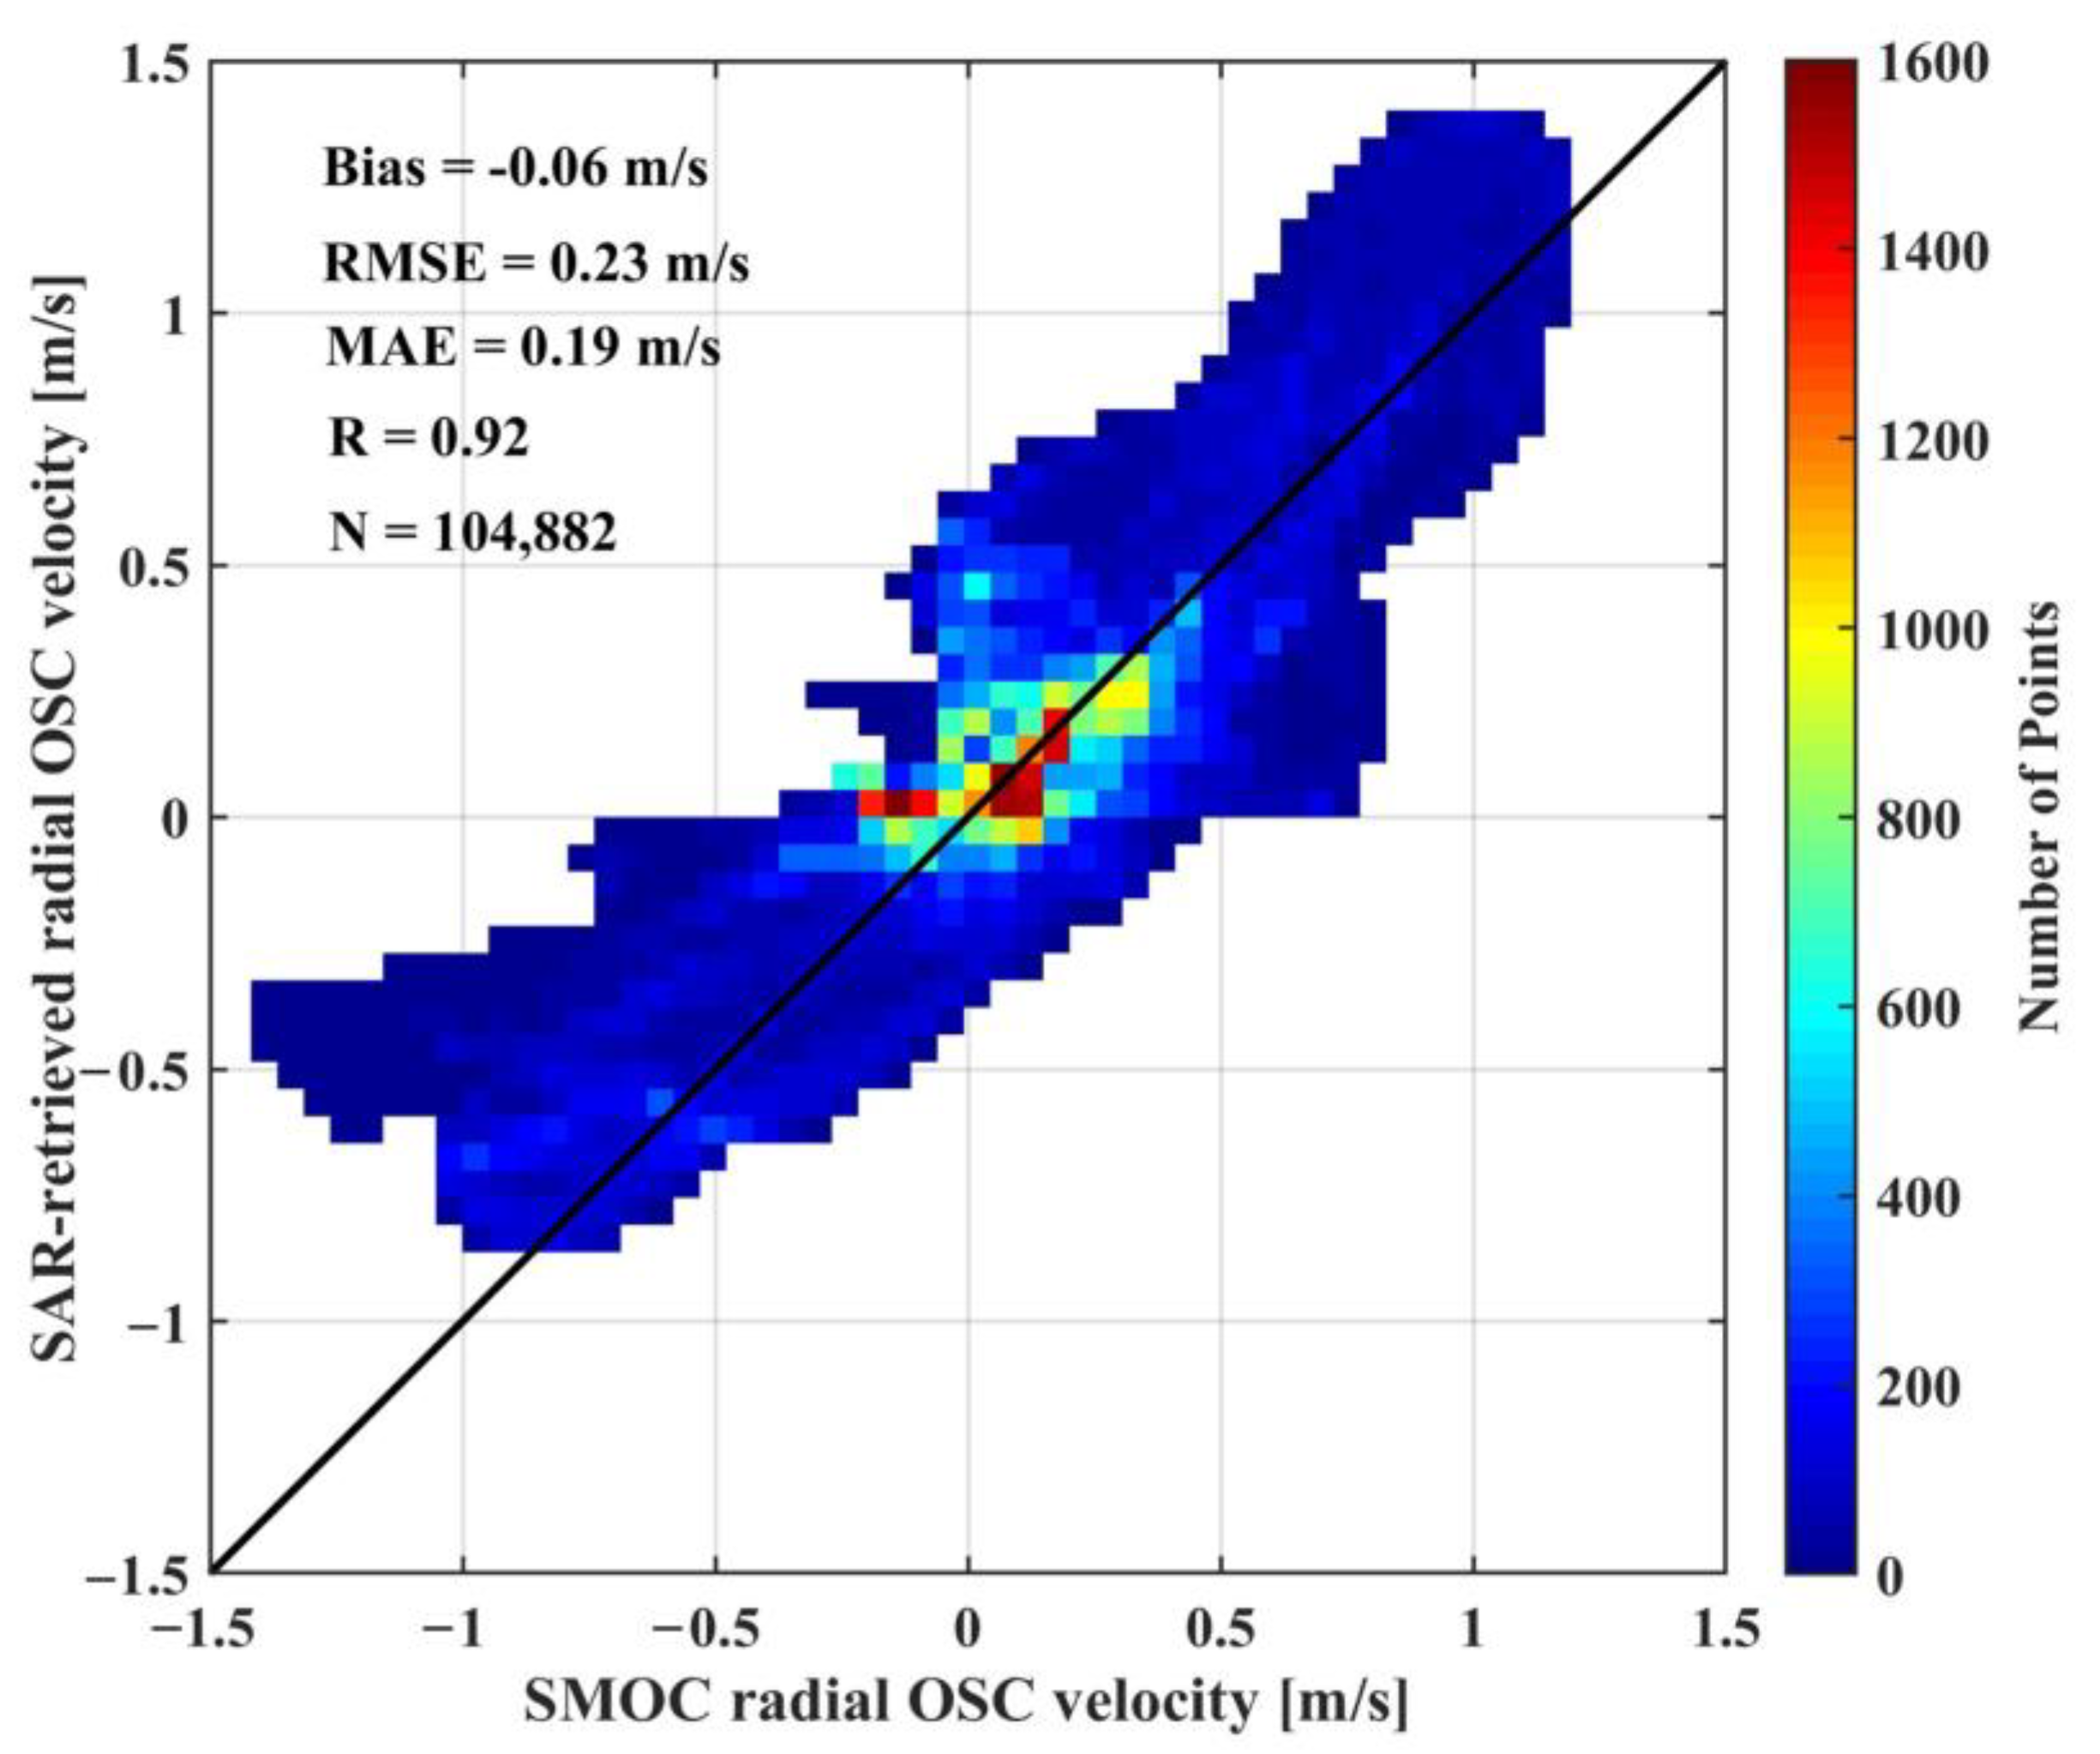
The scatter plot in Figure 6 further supports this comparison, yielding a bias of –0.06 m/s, a RMSE of 0.23 m/s, an MAE of 0.19 m/s, and a correlation coefficient of 0.92. Despite some deviations, these results demonstrate that the SAR-retrieved radial OSC velocities effectively capture the dynamic characteristics of the surface currents, even under complex oceanographic environments.

3.3. Statistical Validation

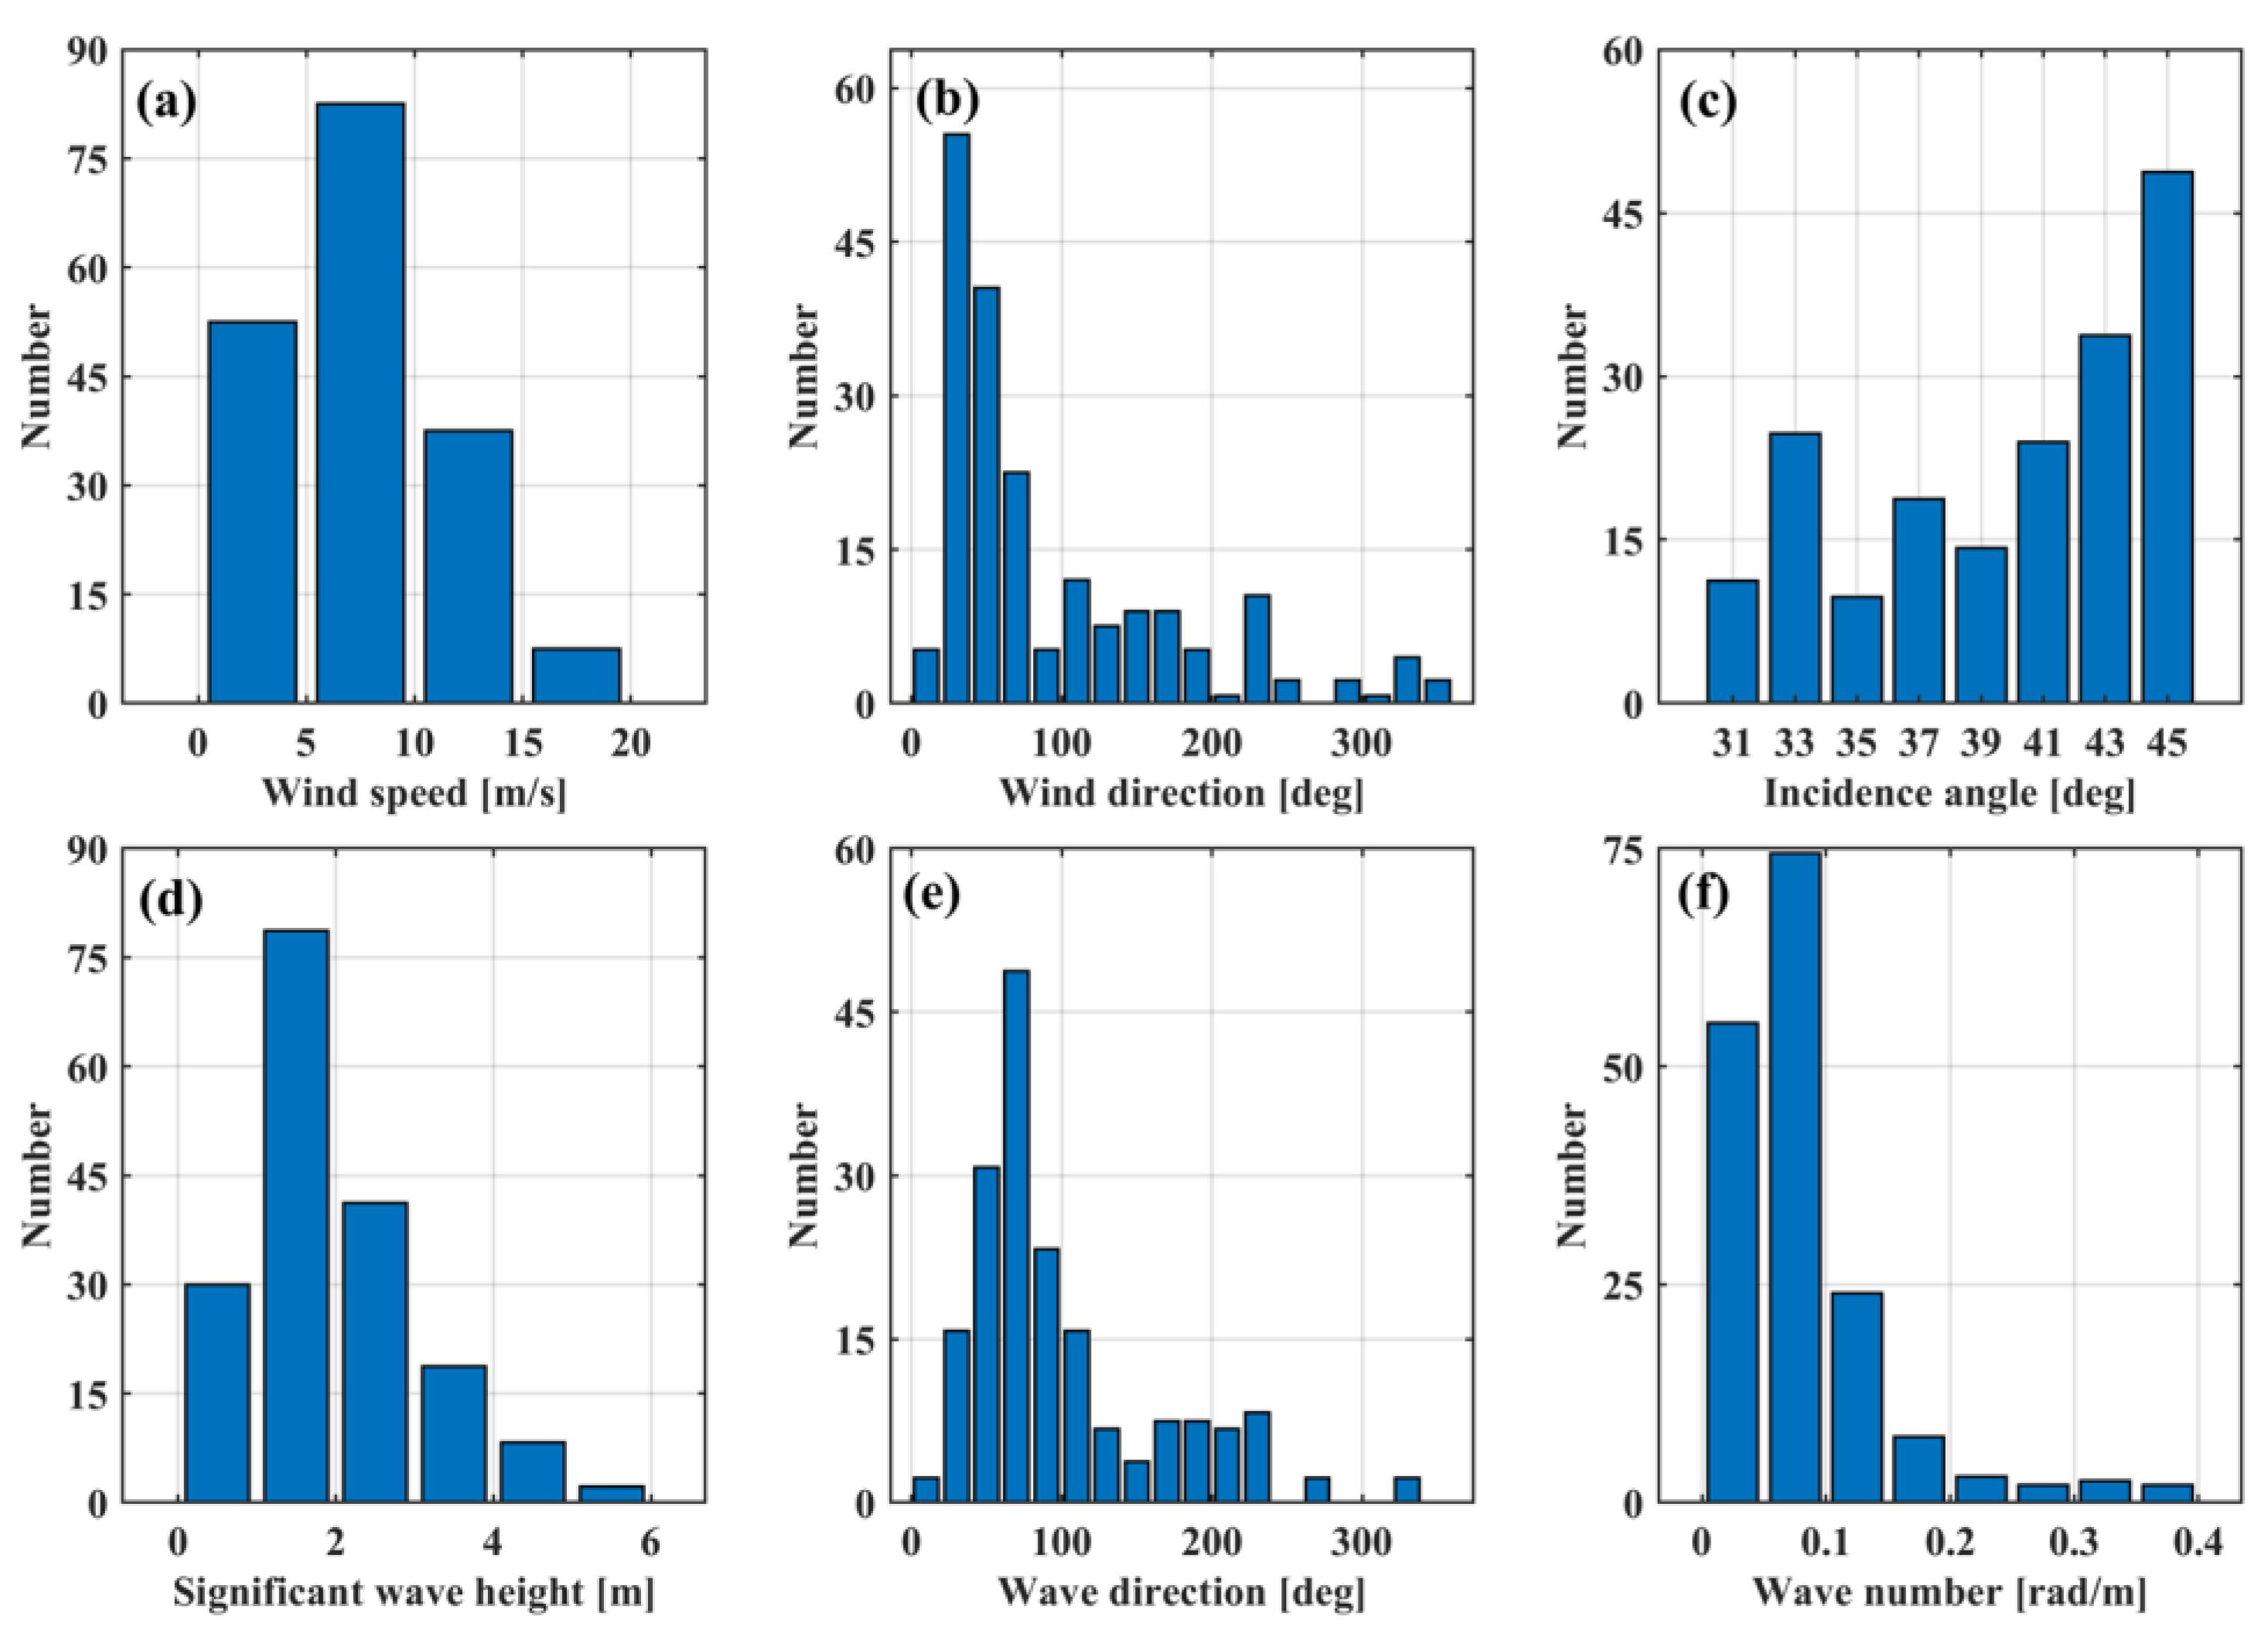
Based on the spatiotemporal matching of the SAR observations and drifting buoy measurements shown in Figure 1, a total of 107 SAR scenes were collocated with the drifting buoy data, resulting in 177 matched pairs. Figure 7 presents the histograms of the corresponding SAR-retrieved wind speed, ECMWF wind direction, radar incidence angles, and wave parameters, including the SWH, wave direction, and wave number derived from the WW3 model.
The wind speeds in the matched dataset range from 0.2 m/s to 16.7 m/s, with wind directions predominantly between 0° and 90°. A similar distribution is observed for the wave directions, which also cluster primarily within this angular sector. The SWH values vary from 0.3 m to 6.1 m, indicating that the dataset covers a board spectrum of sea states as classified by the Douglas Sea Scale. The wave numbers range from 0.02 to 0.39 rad/m, corresponding to wavelengths between 16 m and 314 m, thereby capturing a wide range of wave conditions. Additionally, the radar incidence angles are nearly uniformly distributed between 30° and 46°.
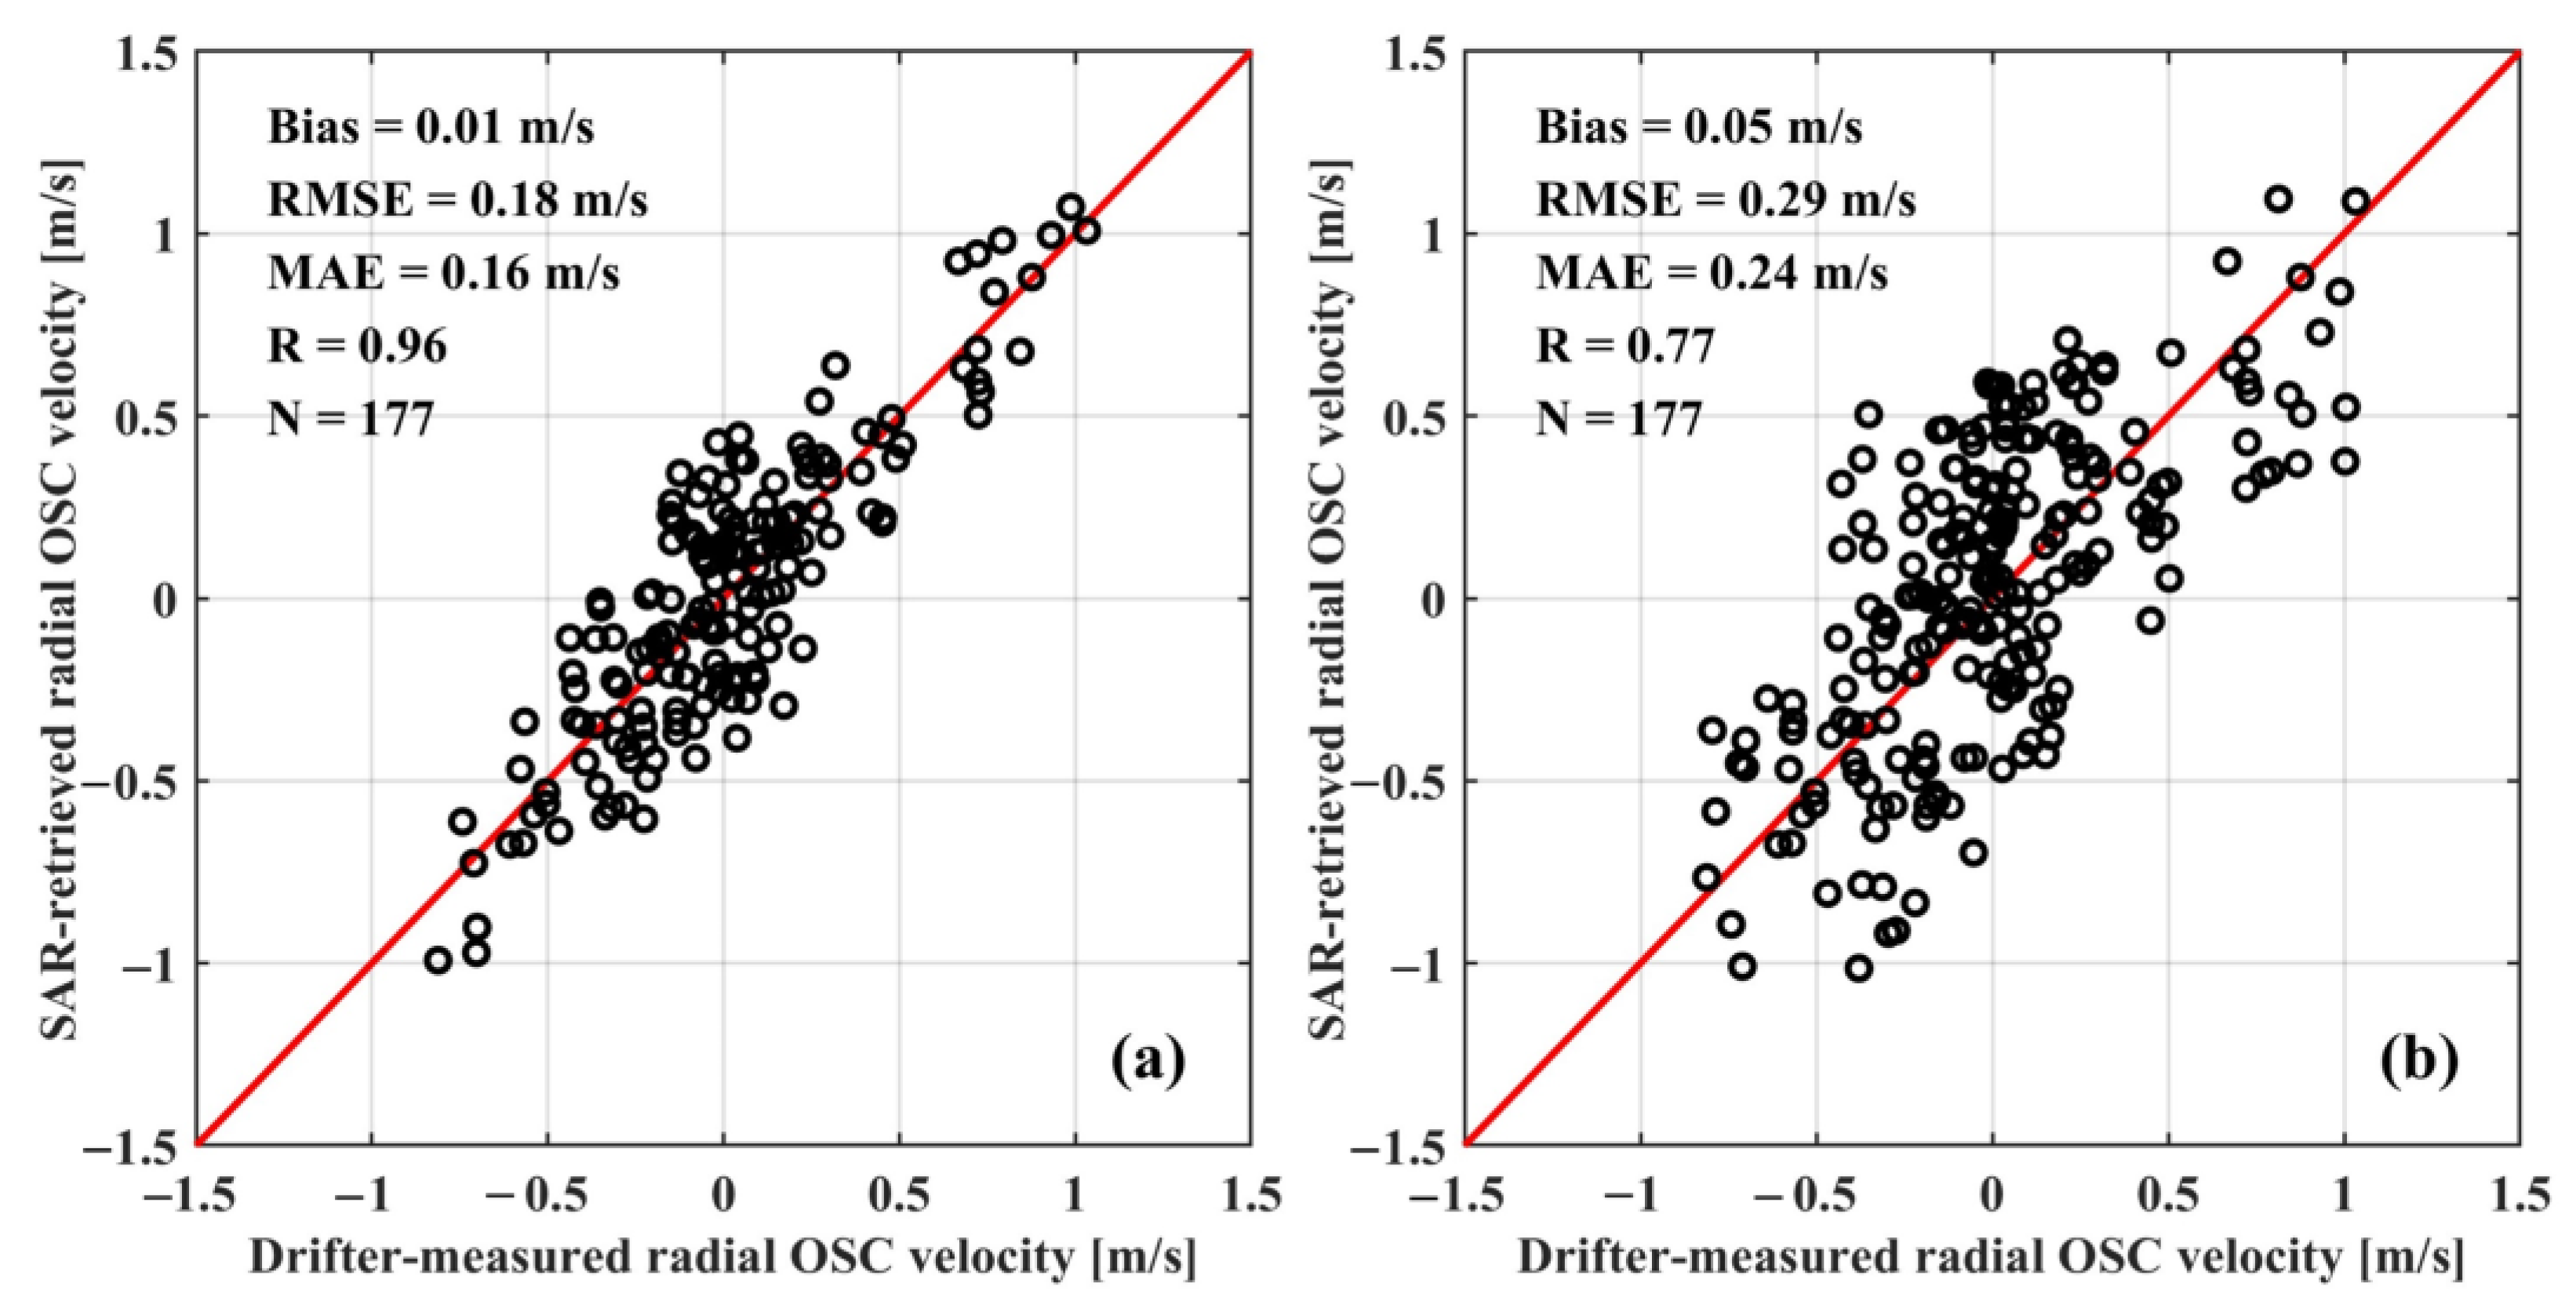
This matched dataset is further used to statistically validate the accuracy of the radial OSC velocity retrievals derived from the Doppler shift measurements. As shown in Figure 8a, the comparison between the SAR-retrieved radial current velocities using the DPDop model and the drifting buoy measurements yields a bias of 0.01 m/s, a RMSE of 0.18 m/s, a MAE of 0.16 m/s, and a correlation coefficient of 0.96. The low error metrics and strong correlation indicate that the DPDop-based SAR retrievals provide reliable estimates of the radial OSC velocities.
For comparison, the CDOP model was also applied to remove the wave-induced Doppler shifts, and the resulting radial OSC velocities were evaluated against the same set of drifting buoy observations, as shown in Figure 8b. In this case, the bias, RMSE, and MAE were 0.05 m/s, 0.29 m/s, and 0.24 m/s, respectively, with a correlation coefficient of 0.77. The reduced accuracy of the CDOP model is likely attributed to its dependence solely on the wind field inputs, without consideration of the wave parameters. This limitation hinders its ability to fully account for the wave-induced Doppler effects, resulting in larger retrieval errors compared to the DPDop model.

4. Discussion

Despite the encouraging results demonstrated in both case studies and the comprehensive statistical analyses, discrepancies persist between the SAR-retrieved radial OSC velocities and those obtained from the SMOC product and drifting buoy measurements. The primary source of these differences stems from the imperfect correction of the non-geophysical Doppler components, which include errors related to the satellite orbit and attitude variations, scalloping artifacts, residual biases, and antenna pointing inaccuracies. Furthermore, the accuracy of the DPDop model’s output is inherently dependent on the precision of its input parameters, including the wind speed, wind direction, and wave field parameters. Errors in the SAR-derived wind retrievals, misalignments in the ECMWF reanalysis wind data, or inaccuracies in the wave modeling from the WW3 could each have introduced uncertainty into the final velocity estimates. Additionally, the uncertainties inherent in the reference currents from the SMOC product and drifting buoy data could have also contributed to the observed discrepancies.
The applicability of the DPDop model is limited to wind speeds below 30 m/s, due to its dependence on an empirical formulation of wave breaking derived from dual-co-polarization SAR backscatter [28,42]. Extending this capability to more extreme wind conditions would require additional SAR observations under such environments. A notable example is the near-simultaneous acquisition of quad-polarization SAR imagery during Hurricane Epsilon in 2020 by both RADARSAT-2 and the RADARSAT Constellation Mission [43]. These observations demonstrated that the wave-breaking contributions to radar backscatter are substantially greater in extreme sea states than in low and moderate wind regimes [44]. Future work will prioritize acquiring and analyzing quad-polarization SAR datasets to develop an enhanced Doppler velocity model that can reliably retrieve radial OSC velocities under hurricane-force winds.

5. Conclusions

This study presents a comprehensive evaluation of radial OSC retrievals in the SCS using Sentinel-1 SAR Doppler shift data and drifting buoy observations. To achieve accurate radial current velocities, the DPDop model was applied to correct for the wave-induced Doppler contributions. Unlike traditional empirical methods, the DPDop model simultaneously accounts for the contributions from short Bragg waves, breaking waves, tilt, and hydrodynamic modulation associated with longer waves. This integrated correction approach significantly improves the retrieval accuracy across diverse sea state conditions.
In the Beibu Gulf, where the sea state is predominantly driven by wind waves, the SAR-derived radial currents exhibited close agreement with the SMOC dataset, with a bias of 0.07 m/s, a RMSE of 0.14 m/s, and a MAE of 0.12 m/s. In contrast, in mixed wave fields or the swell-dominated region south of Taiwan influenced by the Kuroshio current, the SAR-retrieved radial OSC velocities effectively captured a prominent anticyclonic eddy caused by Kuroshio intrusion. Both the location and intensity of the eddy closely aligned with the SMOC data. For this case, the bias, RMSE, and MAE were -0.06 m/s, 0.23 m/s, and 0.19 m/s, respectively. These results, derived from differing sea state conditions, demonstrate the strong performance and robustness of the radial current velocity retrievals, a conclusion further supported by the comprehensive statistical analysis.
To evaluate the model’s performance across diverse oceanic conditions, we analyzed 6431 SAR Doppler shift observations collected in the SCS from November 2017 to October 2023, matched with 177 drifting buoy measurements spanning low, moderate, and high sea states. The comparison revealed a bias of 0.01 m/s, an RMSE of 0.18 m/s, and a MAE of 0.16 m/s between the SAR-retrieved radial OSC velocities and the drifting buoy observations, demonstrating that SAR-measured Doppler shifts can reliably be used to derive surface current information under varying and complex sea states. Furthermore, the high correlation coefficients, ranging from 0.92 to 0.96 for the two case studies, supported by the overall statistical analysis, further confirm the robust performance of the DPDop model at effectively removing the Doppler contributions from the wind waves and swell.

Author Contributions

Conceptualization, methodology, S.F. and B.Z.; writing—original draft preparation, S.F.; writing—review and editing, S.F., B.Z., and V.K.; visualization, S.F.; supervision, B.Z. and V.K.; funding acquisition, B.Z. and V.K. All authors have read and agreed to the published version of the manuscript.

Funding

This research was funded by the National Key R&D Program of China under Grant 2024YFC2815703, the Hainan Province and Technology Special Fund under Grant SOLZSKY2025009, the Ministry of Science and Higher Education of Russia Assignment under Grant FSZU-2025-0005 from RSHU and under Grant FNNN-2024-0001 from MHI RAS.

Data Availability Statement

The Sentinel-1 Level-2 OCN data are available at https://search.asf.alaska.edu (accessed on 1 June 2024). The 1 h GDP drifter data are available at https://www.aoml.noaa.gov/phod/gdp/hourly_data.php (accessed on 1 June 2024). The 6 h GDP drifter are available at https://www.aoml.noaa.gov/phod/gdp/interpolated/data/all.php (accessed on 1 June 2024). The SMOC product is available at https://data.marine.copernicus.eu/product/GLOBAL_ANALYSISFORECAST_PHY_001_024/services (accessed on 1 June 2024).

Acknowledgments

The authors acknowledge the Alaska Satellite Facility and Copernicus Marine Service for providing the Sentinel-1 SAR data and SMOC product, respectively. Additionally, we appreciate NOAA AMOL’s Drifter Data Assembly Center for providing the drifter observations.

Conflicts of Interest

The authors declare no conflicts of interest.

References

  1. Ekman, V.W. On the influence of the Earth’s rotation on ocean-currents. Ark. För Mat. Astron. Och Fysik 1905, 2, 1–53. [Google Scholar]
  2. Stokes, G.G. On the theory of oscillatory waves. Trans. Camb. Philos. Soc. 1847, 8, 441–455. [Google Scholar]
  3. D’Asaro, E.A. The energy flux from the wind to near-inertial motions in the surface mixed layer. J. Phys. Oceanogr. 1985, 15, 1043–1059. [Google Scholar] [CrossRef]
  4. Singh, Y.; Sharma, S.; Sutton, R.; Hatton, D.; Khan, A. A constrained A* approach towards optimal path planning for an unmanned surface vehicle in a maritime environment containing dynamic obstacles and ocean current. Ocean Eng. 2018, 169, 187–201. [Google Scholar] [CrossRef]
  5. Nakada, S.; Hirose, N.; Senjyu, T.; Fukudome, K.; Tsuji, T.; Okei, N. Operational ocean prediction experiments for smart coastal fishing. Prog. Oceanogr. 2014, 121, 125–140. [Google Scholar] [CrossRef]
  6. Serra, M.; Sathe, P.; Rypina, I.; Kirincich, A.; Ross, S.D.; Lermusiaux, P.; Allen, A.; Peacock, T.; Haller, G. Search and rescue at sea aided by hidden flow structures. Nat. Commun. 2020, 11, 2525. [Google Scholar] [CrossRef] [PubMed]
  7. Ferreira, R.M.; Estefen, S.F.; Romeiser, R. Under what conditions SAR along-track interferometry is suitable for assessment of tidal energy resource. IEEE J. Select. Top. Appl. Earth. Observ. Remote Sens. 2016, 9, 5011–5022. [Google Scholar] [CrossRef]
  8. Herbers, T.H.S.; Lentz, S.J. Observing directional properties of ocean swell with an acoustic Doppler current profiler (ADCP). J. Atmos. Oceanic Technol. 2010, 27, 210–225. [Google Scholar] [CrossRef]
  9. Lim, H.S.; Kim, C.S.; Lee, H.J.; Shim, J.S.; Kim, S.J.; Park, K.S.; Chun, I. Variability of residual currents and waves in Haeundae using long-term observed AWAC data. J. Coast. Res. 2014, 72, 166–172. [Google Scholar] [CrossRef]
  10. Mitarai, S.; McWilliams, J.C. Wave glider observations of surface winds and currents in the core of Typhoon Danas. Geophys. Res. Lett. 2016, 43, 11312–11319. [Google Scholar] [CrossRef]
  11. Chi, N.H.; Zhang, D.; Zhang, C. Validation of OSCAR Surface Currents in the Western Arctic Marginal Seas Against Saildrone Observations. Earth Space Sci. 2023, 10, e2022EA002612. [Google Scholar] [CrossRef]
  12. Lumpkin, R.; Pazos, M. Measuring surface currents with Surface Velocity Program drifters: The instrument, its data and some recent results. Lagrangian Anal. Predict. Coast. Ocean. Dyn. 2007, 39, 67. [Google Scholar]
  13. Martin, A.; Gommenginger, C.; Marquez, J.; Doody, S.; Navarro, V.; Buck, C. Wind-wave-induced velocity in ATI SAR ocean surface currents: First experimental evidence from an airborne campaign. J. Geophys. Res. Oceans 2016, 121, 1640–1653. [Google Scholar] [CrossRef]
  14. Paduan, J.D.; Washburn, L. High-Frequency Radar Observations of Ocean Surface Currents. Annu. Rev. Mar Sci. 2013, 5, 115–136. [Google Scholar] [CrossRef] [PubMed]
  15. Pedlosky, J. Geophysical Fluid Dynamics; Springer-Verlag: New York, NY, USA, 1987. [Google Scholar]
  16. Chapron, B.; Collard, F.; Ardhuin, F. Direct measurements of ocean surface velocity from space: Interpretation and validation. J. Geophys. Res. Oceans 2005, 110, C07008. [Google Scholar] [CrossRef]
  17. Hansen, M.W.; Collard, F.; Dagestad, K.-F.; Johannessen, J.A.; Fabry, P.; Chapron, B. Retrieval of sea surface range velocities from Envisat ASAR Doppler centroid measurements. IEEE Trans. Geosci. Remote Sens. 2011, 49, 3582–3592. [Google Scholar] [CrossRef]
  18. Krug, M.; Mouche, A.; Collard, F.; Johannessen, J.A.; Chapron, B. Mapping the Agulhas Current from Space: An Assessment of ASAR Surface Current Velocities. J. Geophys. Res. Oceans 2010, 115, C10026. [Google Scholar] [CrossRef]
  19. Johnsen, H. Sentinel-1 Radial Velocity (RVL) Assessment. 1st ESA OSCC Metting. 2021. Available online: https://eo4society.esa.int/training_uploads/OceanScienceCluster2021/presentations/JOHNSEN-Harald_S1_RVL_OSCC_Dec01.pdf (accessed on 1 January 2025).
  20. Fan, S.; Zhang, B.; Kudryavtsev, V.; Perrie, W. Mapping Radial Ocean Surface Currents in the Outer Core of Hurricane Maria from Synthetic Aperture Radar Doppler Measurements. IEEE J. Select. Top. Appl. Earth. Observ. Remote Sens. 2024, 17, 2090–2097. [Google Scholar] [CrossRef]
  21. Elyouncha, A.; Eriksson, L.; Johnsen, H. Direct comparison of sea surface velocity estimated from Sentinel-1 and TanDEM-X SAR data. IEEE J. Select. Top. Appl. Earth. Observ. Remote Sens. 2022, 15, 2425–2436. [Google Scholar] [CrossRef]
  22. Martin, A.; Gommenginger, C.; Jacob, B.; Staneva, J. First multi-year assessment of sentinel-1 radial velocity products using HF radar currents in a coastal environment. Remote Sens. Environ. 2022, 268, 112758. [Google Scholar] [CrossRef]
  23. Tan, B.; Wang, L.; Ge, D.; Fang, Z.; Sun, W.; Feng, T. An investigation of inversion method to measure the radial velocity of Kuroshio from Sentinel-1 SAR data. Gisci. Remote Sens. 2024, 61, 2304965. [Google Scholar] [CrossRef]
  24. Mouche, A.A.; Collard, F.; Chapron, B.; Dagestad, K.F.; Guitton, G.; Johannessen, J.A.; Kerbaol, V.; Hansen, M.W. On the Use of Doppler Shift for Sea Surface Wind Retrieval from SAR. IEEE Trans. Geosci. Remote Sens. 2012, 50, 2901–2909. [Google Scholar] [CrossRef]
  25. Moiseev, A.; Johnsen, H.; Johannessen, J.A.; Collard, F.; Guitton, G. On removal of sea state contribution to Sentinel-1 Doppler shift for retrieving reliable ocean surface current. J. Geophys. Res. Oceans 2020, 125, e2020JC016288. [Google Scholar] [CrossRef]
  26. Moiseev, A.; Johannessen, J.A.; Johnsen, H. Towards retrieving reliable ocean surface currents in the coastal zone from the Sentinel-1 Doppler shift observations. J. Geophys. Res. Oceans 2022, 127, e2021JC018201. [Google Scholar] [CrossRef]
  27. Yang, Z.; Wang, J.; Liu, L.; Miao, H.; Miao, X.; Zhang, Q. Estimating effects of wind and waves on the Doppler centroid frequency shift for the SAR retrieval of ocean currents. Remote Sens. Environ. 2024, 311, 114312. [Google Scholar] [CrossRef]
  28. Kudryavtsev, V.; Fan, S.; Zhang, B.; Chapron, B.; Johannessen, J.A.; Moiseev, A. On the Use of Dual Co-Polarized Radar Data to Derive a Sea Surface Doppler Model—Part 1: Approach. IEEE Trans. Geosci. Remote Sens. 2023, 61, 4201013. [Google Scholar] [CrossRef]
  29. Fan, S.; Zhang, B.; Moiseev, A.; Kudryavtsev, V.; Johannessen, J.A.; Chapron, B. On the Use of Dual Co-Polarized Radar Data to Derive a Sea Surface Doppler Model—Part 2: Simulation and Validation. IEEE Trans. Geosci. Remote Sens. 2023, 61, 4202009. [Google Scholar] [CrossRef]
  30. Quilfen, Y.; Chapron, B.; Elfouhaily, T.; Katsaros, K.; Tournadre, J. Observation of tropical cyclones by high-resolution scatterometry. J. Geophys. Res. 1998, 103, 7767–7786. [Google Scholar] [CrossRef]
  31. Hersbach, H. Comparison of C-band scatterometer CMOD5.N equivalent neutral winds with ECMWF. J. Atmos. Oceanic Technol. 2010, 27, 721–736. [Google Scholar] [CrossRef]
  32. Elipot, S.; Lumpkin, R.; Perez, R.C.; Lilly, J.M.; Early, J.J.; Sykulski, A.M. A global surface drifter data set at hourly resolution. J. Geophys. Res. Oceans 2016, 121, 2937–2966. [Google Scholar] [CrossRef]
  33. Lumpkin, R.; Centurioni, L. Global Drifter Program Quality-Controlled 6-Hour Interpolated Data from Ocean Surface Drifting Buoys. NOAA National Centers for Environmental Information. Dataset. 2019. Available online: https://www.ncei.noaa.gov/access/metadata/landing-page/bin/iso?id=gov.noaa.nodc:AOML-GDP-6hr (accessed on 1 June 2024).
  34. Chen, C.; Lai, Z.; Beardsley, R.C.; Xu, Q.; Lin, H.; Viet, N.T. Current separation and upwelling over the southeast shelf of Vietnam in the South China Sea. J. Geophys. Res. Oceans 2012, 117, C03033. [Google Scholar] [CrossRef]
  35. Madec, G.; Bourdallé-Badie, R.; Bouttier, P.A.; Bricaud, C.; Bruciaferri, D.; Calvert, D. NEMO Ocean Engine (Version v3.6). Notes Du Pôle De Modélisation De L’institut Pierre-Simon Laplace (IPSL). 2017. Available online: https://epic.awi.de/id/eprint/39698/1/NEMO_book_v6039.pdf (accessed on 1 June 2024).
  36. Vancoppenolle, M.; Fichefet, T.; Goosse, H.; Bouillon, S.; Madec, G.; Maqueda, M.A. Simulating the mass balance and salinity of Arctic and Antartic sea ice: I. Model description and validation. Ocean Model. 2009, 27, 33–53. [Google Scholar] [CrossRef]
  37. Lefèvre, J.M.; Aouf, L.; Bataille, C.; Ardhuin, F.; Queffeulou, P. Apport d’un nouveau modèle de vagues de 3 génération à Météo Toulouse, France. Actes Des Ateliers De Modélisation de l’Atmosphère 2009, 27–29. [Google Scholar]
  38. Carrere, L.; Lyard, F.; Cancet, M.; Guillot, A. FES 2014, a new tidal model on the global ocean with enhanced accuracy in shallow seas and in the Arctic region. EGU Gen. Assem. Geophys. Res. Abstr. 2015, 17, EGU2015-5481-1. [Google Scholar]
  39. Drillet, Y.; Chune, S.L.; Levier, B.; Drevillon, M. SMOC: A new global surface current product containing the effect of the ocean general circulation, waves and tides. Geophys. Res. Abstr. 2019, 21, EGU2019-2376. [Google Scholar]
  40. Hajduch, G.; Vincent, P.; Cordier, K.; Grignoux, M.; Husson, R.; Peureux, C.; Piantanida, R.; Recchia, A.; Francheschi, N.; Schmidt, K. S-1A & S-1B Annual Performance Report 2020. ESA Technological Document MPC-0504. 2020. Available online: https://elib.dlr.de/145956/1/Sentinel-1-Annual-Performance-Report-2020.pdf (accessed on 1 June 2024).
  41. Zu, T.; Wang, D.; Yan, C.; Belkin, I.; Zhuang, W.; Chen, J. Evolution of an anticyclonic eddy southwest of Taiwan. Ocean Dyn. 2013, 63, 519–531. [Google Scholar] [CrossRef]
  42. Kudryavtsev, V.; Fan, S.; Zhang, B.; Mouche, A.A.; Chapron, B. On Quad-Polarized SAR Measurements of the Ocean Surface. IEEE Trans. Geosci. Remote Sens. 2019, 57, 8362–8370. [Google Scholar] [CrossRef]
  43. Zhang, B.; Mouche, A.A.; Perrie, W. First Quasi-Synchronous Hurricane Quad-Polarization Observations by C-Band Radar Constellation Mission and RADARSAT-2. IEEE Trans. Geosci. Remote Sens. 2022, 60, 4206510. [Google Scholar] [CrossRef]
  44. Fan, S.; Kudryavtsev, V.; Zhang, B.; Perrie, W. Radar Scattering Features Under High Wind Conditions From Spaceborne Quad-Polarization SAR Observations. IEEE Trans. Geosci. Remote Sens. 2024, 62, 4207309. [Google Scholar] [CrossRef]
Figure 1. Geographic distribution of the 6431 Sentinel-1 SAR scenes (red rectangles) and the trajectories of the drifting buoys (colored-dot lines) collected in the SCS between November 2017 and October 2023. The colorbar represents the drifters’ measured surface ocean current velocities, in units of m/s.
Remotesensing 17 02007 g001
Figure 2. Flowchart illustrating the procedure for retrieving and validating the radial OSC velocities using the SAR-measured Doppler shifts.
Remotesensing 17 02007 g002
Figure 3. (a) Sea surface wind field derived from a Sentinel-1A VV-polarization SAR scene acquired over the Beibu Gulf on 30 November 2020 at 10:56 UTC. The black arrows denote the wind directions from the ECMWF, and the colorbar represents the wind speed, in units of m/s. (b) The SWH simulated by the WW3 at 11:30 UTC on the same day. The black arrows denote the ECMWF wind directions, while the red arrows indicate the wave directions from the WW3. The colorbar shows the magnitude of the SWH, in units of m. (c) Radial OSC velocities (a negative value indicates that the surface current is directed toward the radar, while a positive value indicates flow away from the radar) retrieved from the SAR-measured Doppler shifts. (d) Radial OSC velocities from the SMOC product. Black arrows in (c,d) indicate SMOC current directions, and purple arrows represents the drifting buoy-measured current directions. The colorbars in (c,d) denote the radial OSC velocities, in units of m/s.
Remotesensing 17 02007 g003
Figure 4. Comparisons of SAR-retrieved radial OSC velocities with corresponding SMOC values. Colorbar represents number of data points.
Remotesensing 17 02007 g004
Figure 5. (a) Sea surface wind field derived from a Sentinel-1A VV-polarization SAR scene acquired over the Kuroshio intrusion on 30 October 2022 at 21:52 UTC. The black arrows denote the wind directions from the ECMWF, and the colorbar represents the wind speed, in units of m/s. (b) The SWH simulated by the WW3 at 22:00 UTC on the same day. The black arrows denote the ECMWF wind direction, while the red arrows indicate the wave directions from the WW3. The colorbar shows the magnitude of the SWH, in units of m. (c) The radial OSC velocities (negative when the surface current flows toward the radar and positive when it flows away) retrieved from the SAR-measured Doppler shifts. (d) The radial OSC velocities from the SMOC product. The black arrows in (c,d) indicate the SMOC current directions, and the purple arrows in (c,d) represent the drifting buoy-measured current directions. The colorbars in (c,d) denote the radial OSC velocities, in units of m/s.
Remotesensing 17 02007 g005
Figure 6. Comparison of SAR-retrieved radial OSC velocities with corresponding SMOC values. Colorbar represents number of data points.
Remotesensing 17 02007 g006
Figure 7. Histograms of collocated parameters: (a) SAR-derived wind speed, (b) ECMWF wind direction, (c) radar incidence angle, (d) WW3-simulated SWH, (e) wave direction, and (f) wave number.
Remotesensing 17 02007 g007
Figure 8. Comparisons of SAR-retrieved radial OSC velocities with collocated drifting buoy measurements: (a) after removing wave-induced Doppler shifts using the DPDop model, and (b) after removing wave-induced Doppler shifts using the CDOP model.
Remotesensing 17 02007 g008
Disclaimer/Publisher’s Note: The statements, opinions and data contained in all publications are solely those of the individual author(s) and contributor(s) and not of MDPI and/or the editor(s). MDPI and/or the editor(s) disclaim responsibility for any injury to people or property resulting from any ideas, methods, instructions or products referred to in the content.