Article

Stepwise Building Damage Estimation Through Time-Scaled Multi-Sensor Integration: A Case Study of the 2024 Noto Peninsula Earthquake

National Research Institute for Earth Science and Disaster Resilience, Ibaraki 305-0006, Japan
*
Author to whom correspondence should be addressed.
Remote Sens. 2025, 17(15), 2638; https://doi.org/10.3390/rs17152638
Submission received: 4 May 2025 / Revised: 28 June 2025 / Accepted: 30 June 2025 / Published: 30 July 2025

Abstract

Rapid and comprehensive assessment of building damage caused by earthquakes is essential for effective emergency response and rescue efforts in the immediate aftermath. Advanced technologies, including real-time simulations, remote sensing, and multi-sensor systems, can effectively enhance situational awareness and structural damage evaluations. However, most existing methods rely on isolated time snapshots, and few studies have systematically explored the continuous, time-scaled integration and update of building damage estimates from multiple data sources. This study proposes a stepwise framework that continuously updates time-scaled, single-damage estimation outputs using the best available multi-sensor data for estimating earthquake-induced building damage. We demonstrated the framework using the 2024 Noto Peninsula Earthquake as a case study and incorporated official damage reports from the Ishikawa Prefectural Government, real-time earthquake building damage estimation (REBDE) data, and satellite-based damage estimation data (ALOS-2-building damage estimation (BDE)). By integrating the REBDE and ALOS-2-BDE datasets, we created a composite damage estimation product (integrated-BDE). These datasets were statistically validated against official damage records. Our framework showed significant improvements in accuracy, as demonstrated by the mean absolute percentage error, when the datasets were integrated and updated over time: 177.2% for REBDE, 58.1% for ALOS-2-BDE, and 25.0% for integrated-BDE. Finally, for stepwise damage estimation, we proposed a methodological framework that incorporates social media content to further confirm the accuracy of damage assessments. Potential supplementary datasets, including data from Internet of Things-enabled home appliances, real-time traffic data, very-high-resolution optical imagery, and structural health monitoring systems, can also be integrated to improve accuracy. The proposed framework is expected to improve the timeliness and accuracy of building damage assessments, foster shared understanding of disaster impacts across stakeholders, and support more effective emergency response planning, resource allocation, and decision-making in the early stages of disaster management in the future, particularly when comprehensive official damage reports are unavailable.

1. Introduction

Building collapse remains a leading cause of fatalities during earthquakes in Japan, accounting for over 80% of deaths (83.3% in the Great Hanshin Earthquake [1] and 90.5% in the 2024 Noto Peninsula Earthquake [2]). Rapid and comprehensive assessment of earthquake-induced building damage is crucial for enabling effective emergency response planning and rescue operations in the immediate aftermath. Building damage data also inform operational priorities, assesses road accessibility in affected areas, and guides the optimal allocation of human and material resources. Advanced technologies—real-time simulations, remote sensing, and sensor networks—hold strong potential to improve situational awareness and structural damage evaluations. To accurately capture spatiotemporal variations in building damage, developing a dynamic building damage estimation (BDE) framework that systematically and continuously updates time-scaled damage information through multi-sensor integration is essential. This approach fosters a shared situational understanding of disaster impacts among stakeholders.
Real-time earthquake building damage estimation (REBDE) provides critical disaster information immediately after a seismic event. In Japan, the National Research Institute for Earth Science and Disaster Resilience (NIED) [3] generates REBDEs at a 250 m mesh resolution using the real-time damage estimate system (RDES), which integrates seismic data from strong-motion networks (Kyoshin Network [4] and Kiban Kyoshin Network [5]) with subsurface conditions, population data, and building characteristics such as structural type and construction year [6,7]. These estimates are typically released within 10–20 min after the mainshock [8].
During the early response phase, structural safety assessments are visually conducted by certified personnel to mitigate risks from aftershocks. In Japan, these assessments are classified into post-earthquake quick inspections and post-disaster damage certification surveys (i.e., building damage assessment surveys) [9]. The quick inspection aims to prevent secondary disasters caused by aftershock-related collapses or falling debris and classify buildings as unsafe, restricted use, or safe [9]. The damage certification surveys provide an official basis for disaster relief and insurance. Recent post-disaster evaluation volumes in Japan include 213,902 inspections in the 2016 Kumamoto Earthquake [10], 1164,746 in the 2011 Great East Japan Earthquake [11], and 115,357 in the 2024 Noto Peninsula Earthquake [12]. Although the importance of accelerating field inspections is widely recognized, it remains labor-intensive, subjective, time-consuming, logistically challenging, and risky [13,14].
Remote sensing has become a vital tool for assessing structural damage in hazardous or inaccessible areas, enabling efficient and broad-scale evaluations across spectral, spatial, and temporal dimensions [15]. Synthetic aperture radar (SAR) is particularly well-suited for disaster applications because it operates independently of weather and daylight conditions [16,17,18,19,20] and is sensitive to vertical surface changes [20,21]. These features allow for a comprehensive understanding of the location, distribution, and extent of building damage. Existing studies on regional-scale building damage detection have used wide-area SAR platforms—ALOS (L-band SAR, 10 m resolution [excluding wide mode], 46 d revisit) [16], ALOS-2 (L-band SAR, ~10 m, 14 d revisit) [22,23,24,25], JERS-1 (L-band SAR, 18 m, 44 d revisit) [26], TerraSAR-X (X-band SAR, ~16 m, 11 d revisit) [27,28], and Kompsat-5 (X-band SAR, ~3 m, 28 d revisit) [29]—covering a range of spatiotemporal resolutions. Damage detection techniques are broadly categorized into change detection (pre- and post-event comparison) and single-image assessment (post-event only) approaches [30,31]. Change detection methods typically use block-based techniques that analyze amplitude [32,33], coherence [25], polarimetry [23], or hybrid features [27,30]. Some studies have also explored detecting damaged buildings across different SAR imaging platforms [29]. Multi-sensor integration methods have been developed to enhance accuracy [34,35]. L-band SAR has been particularly effective for identifying regional building clusters of damaged buildings [16,22,23,24,25,26]. Machine learning technologies have been applied to L-band SAR for building damage detections [36,37]. Additionally, emergency response frameworks have been organized to support these efforts [38,39,40]. However, most applications for wide-area building damage detection remain limited to static, discrete-time snapshots; few studies have explored the continuous, time-scaled integration and updating of building damage estimations using multi-source sensing datasets.
In this study, we developed a stepwise estimation framework for earthquake-induced building damage that enables continuous estimation and systematic updating of time-scaled damage products using the best available multi-source sensing datasets. We used official damage reports from the Ishikawa Prefectural Government (reported between 1 January 2024 and 4 March 2025, hereafter referred to as official damage reports), REBDE data, and satellite-based damage estimation data from ALOS-2 (ALOS-2-BDE). Our specific objectives were to (1) summarize damage records and estimates from the three sources at the municipal level; (2) integrate REBDE and ALOS-2-BDE into a unified dataset (integrated-BDE); (3) validate all estimates against official damage records (reported on 4 March 2025); (4) present a spatiotemporal summary of the BDE products and their associated social media inputs; and (5) develop a stepwise estimation framework using REBDE and integrated-BDE, along with disaster-specific and non-disaster-specific data. This framework was developed based on the 2024 Noto Peninsula Earthquake.
The novelty of this study lies in the framework’s ability to systematically update time-scaled building damage estimates by integrating the most reliable multi-source sensing data. This approach also enhances a commonly shared situational understanding of disaster impacts across stakeholders.

2. Materials and Methods

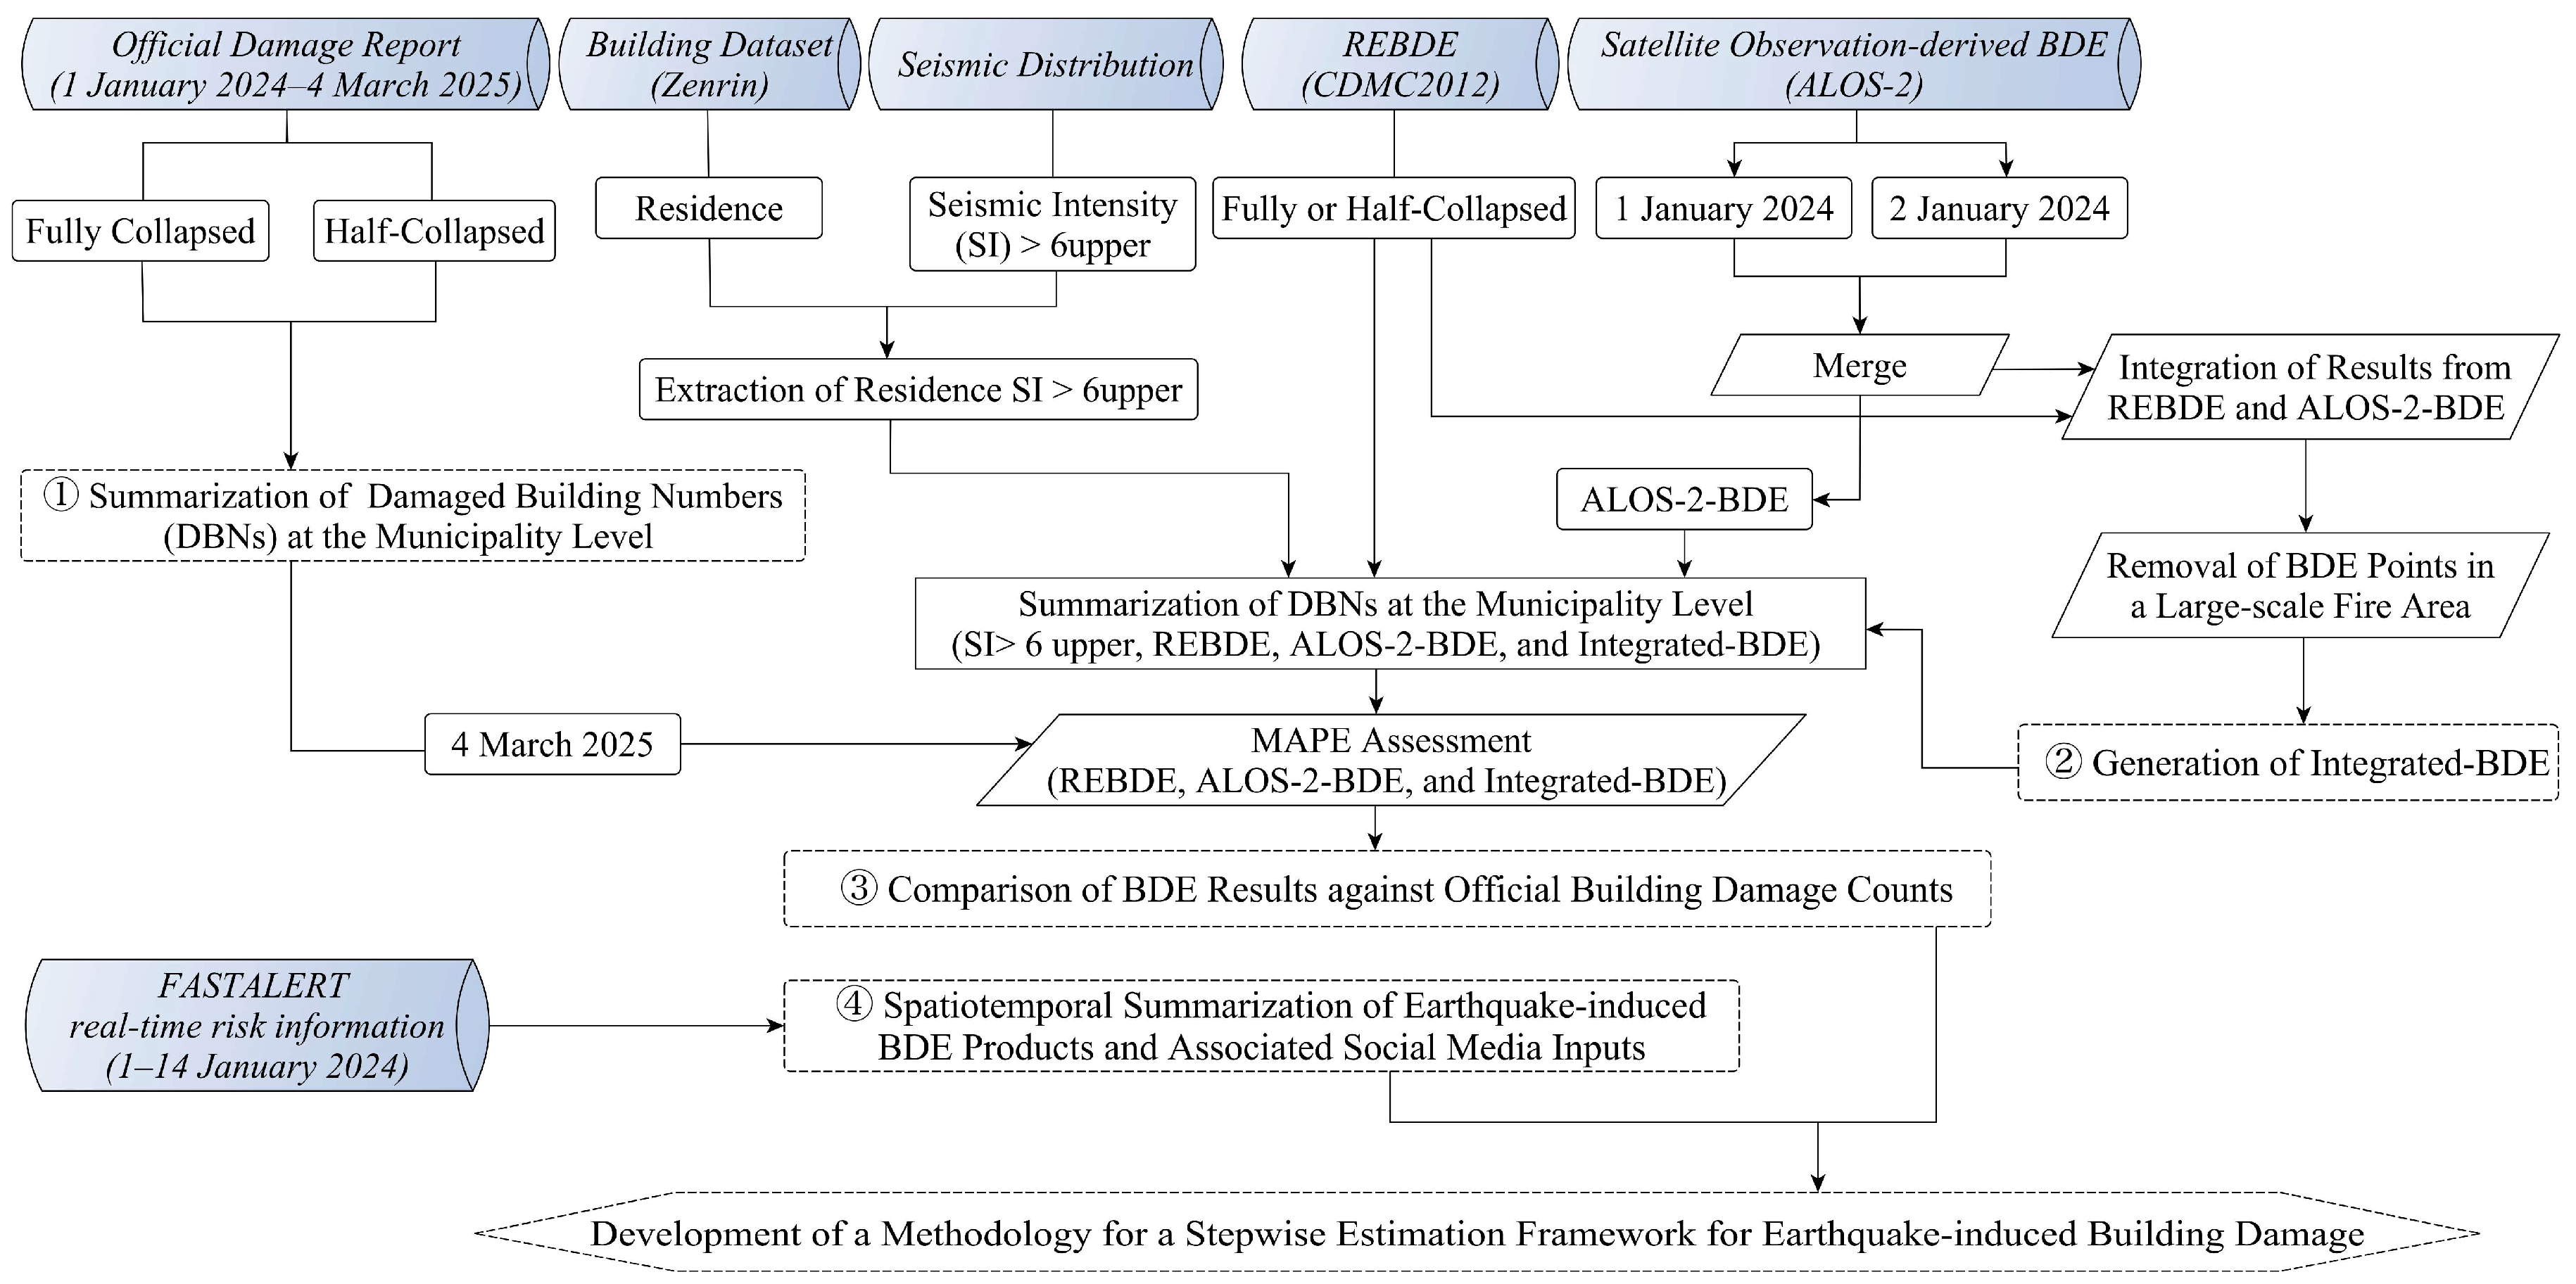
2.1. Overall Methodological Workflow

Figure 1 shows the overall methodological workflow used in this study. The workflow comprises four main steps designed to support the development of a stepwise estimation framework for earthquake-induced, time-scaled building damage information products. First, building damage counts from official damage reports, REBDE, and ALOS-2-BDE were summarized. Second, the REBDE and ALOS-2-BDE datasets were integrated. Third, the REBDE, ALOS-2-BDE, and integrated results were statistically evaluated against the official damage counts. Fourth, the time series of the BDE products and their associated social media inputs were summarized spatiotemporally, and the stepwise estimation framework was constructed. The subsequent sections detail the analytical findings from this process.

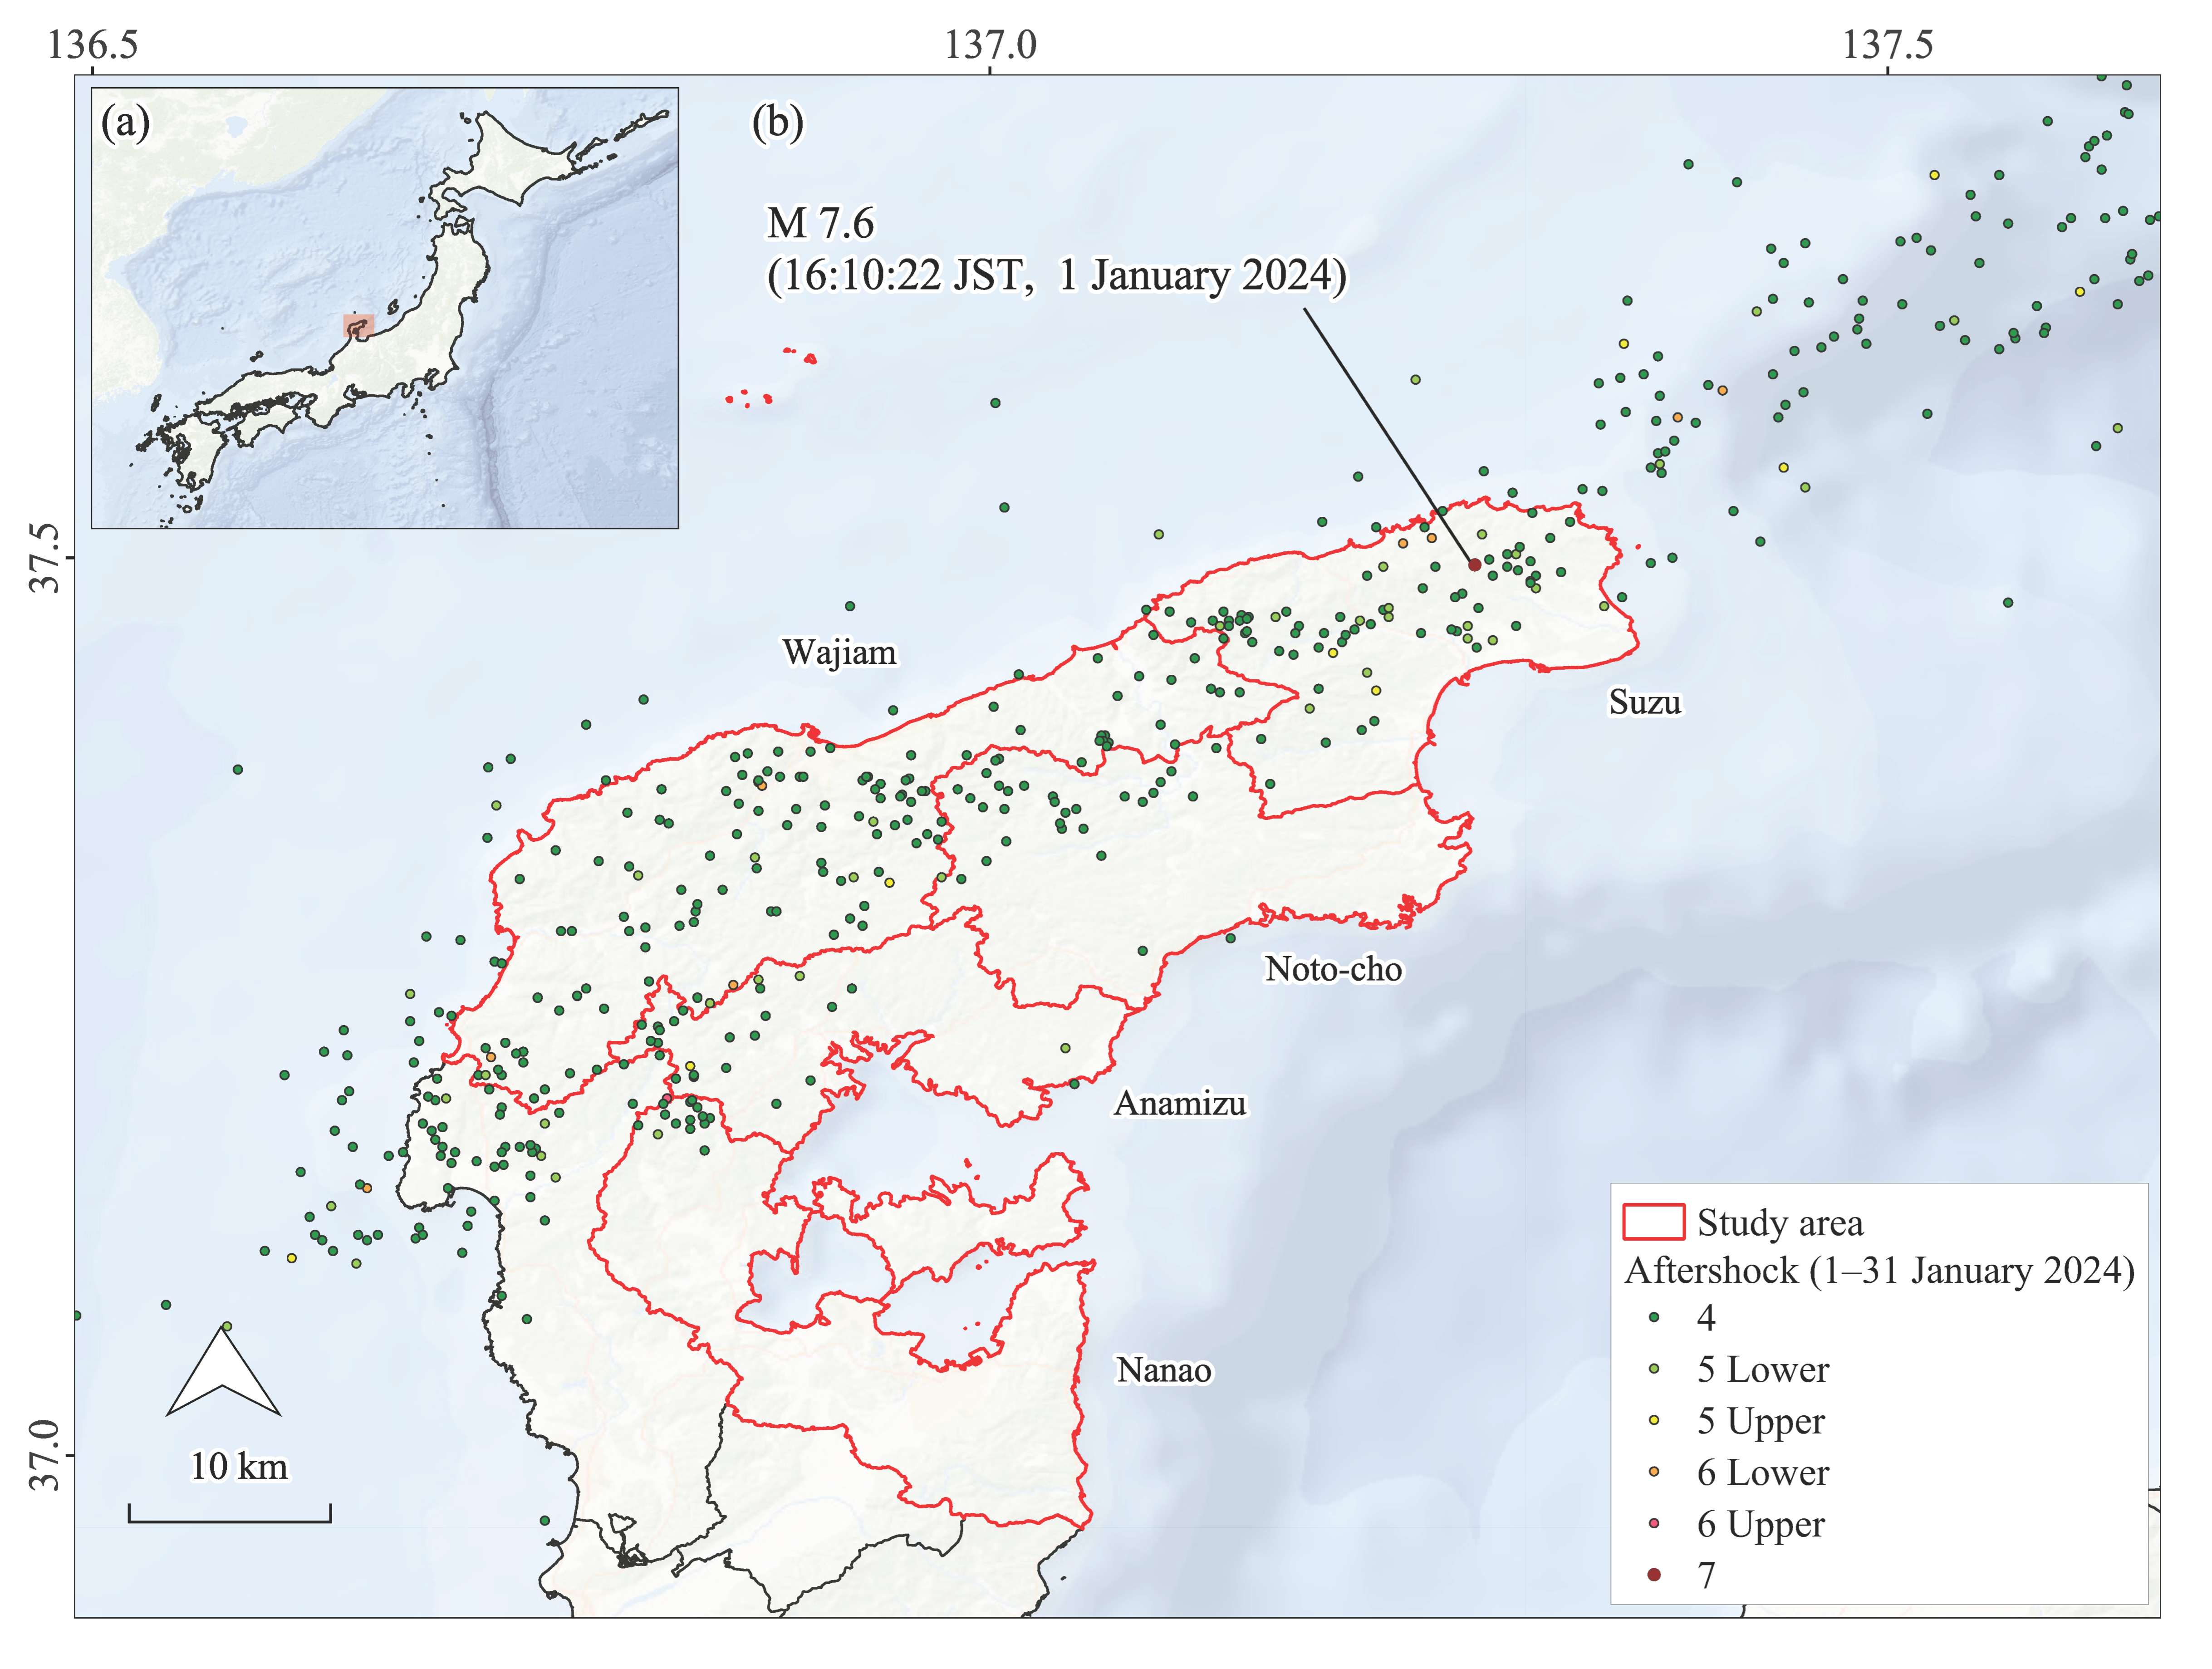
2.2. The 2024 Noto Peninsula Earthquake and Study Area

At 16:10 JST (07:10 UTC) on 1 January 2024, a magnitude 7.6 earthquake struck northeast of the Noto Peninsula, Japan, with the epicenter located at 37.50°N, 137.27°E. The region experienced an intense earthquake swarm, with more than 23,700 Mj1.0 events recorded between 1 December 2020 and 1 January 2024 [41]. The mainshock and subsequent aftershocks caused severe damage in Suzu, Noto-cho, Wajima, and Anamizu—municipalities located near the epicenter [42,43]. The earthquake also triggered secondary hazards, including tsunamis, landslides, ground deformation, and large-scale fires [44], resulting in extensive damage to infrastructure and buildings [45]. The disaster caused at least 527 fatalities, 299 disaster-related deaths, 390 serious injuries, and damage to 115,449 housing units in Ishikawa Prefecture [46,47]. This study focuses on the five most severely affected municipalities—Anamizu, Nanao, Noto-cho, Suzu, and Wajima—all located in the northern part of the Noto Peninsula (Figure 2).

2.3. Building Damage-Related Data

2.3.1. Real-Time Earthquake Building Damage Estimation Data

We used REBDE data generated by the RDES of NIED at a 250 m spatial resolution [8]. The RDES applies vulnerability functions [49,50,51,52,53,54,55,56] developed based on historical damage records of the Great Hanshin Earthquake in 1995 (Mw = 6.9) [55]. These functions consider building structure, damage level, construction year, or seismic design standard as input, using estimated strong ground motion data. The residential building dataset used in the RDES is the Zenrin Building Dataset 2015 [57]. The calculated damage rates are incorporated into building inventory data, and then, the number of damaged buildings per mesh is estimated in terms of structure type and construction category. The total damage count is obtained by summing these values. The building damage rate is estimated using the following Functions (1) or (2):
P P G V = Φ I n   P G V λ ζ
P G I S = Φ G I S λ ζ
where p is the damage rate, PGV is the peak ground velocity, GIS is the estimated seismic intensity, Φ is the standard cumulative distribution function, and λ and ζ are the parameters for total and partial destructions, respectively, as determined with vulnerability functions [8].
In this study, we used BDE data calibrated with the widely adopted Central Disaster Management Council 2012 (CDMC2012) vulnerability function (fully or half-collapsed version) [53] (hereafter referred to as REBDE, Figure 3), which models extreme scenarios for disaster preparedness [58]. The initial REBDE estimate was released at 16:29 JST (07:29 UTC) on 1 January 2024 [59], and an updated version was published at 18:40 JST (09:10 UTC) on 3 January 2024 [60]. The update was delayed because of the scale of the hypocentral region, frequent aftershocks, and power outages that affected data transmission. Significant damage was concentrated in the coastal city centers (Figure 3c–h).

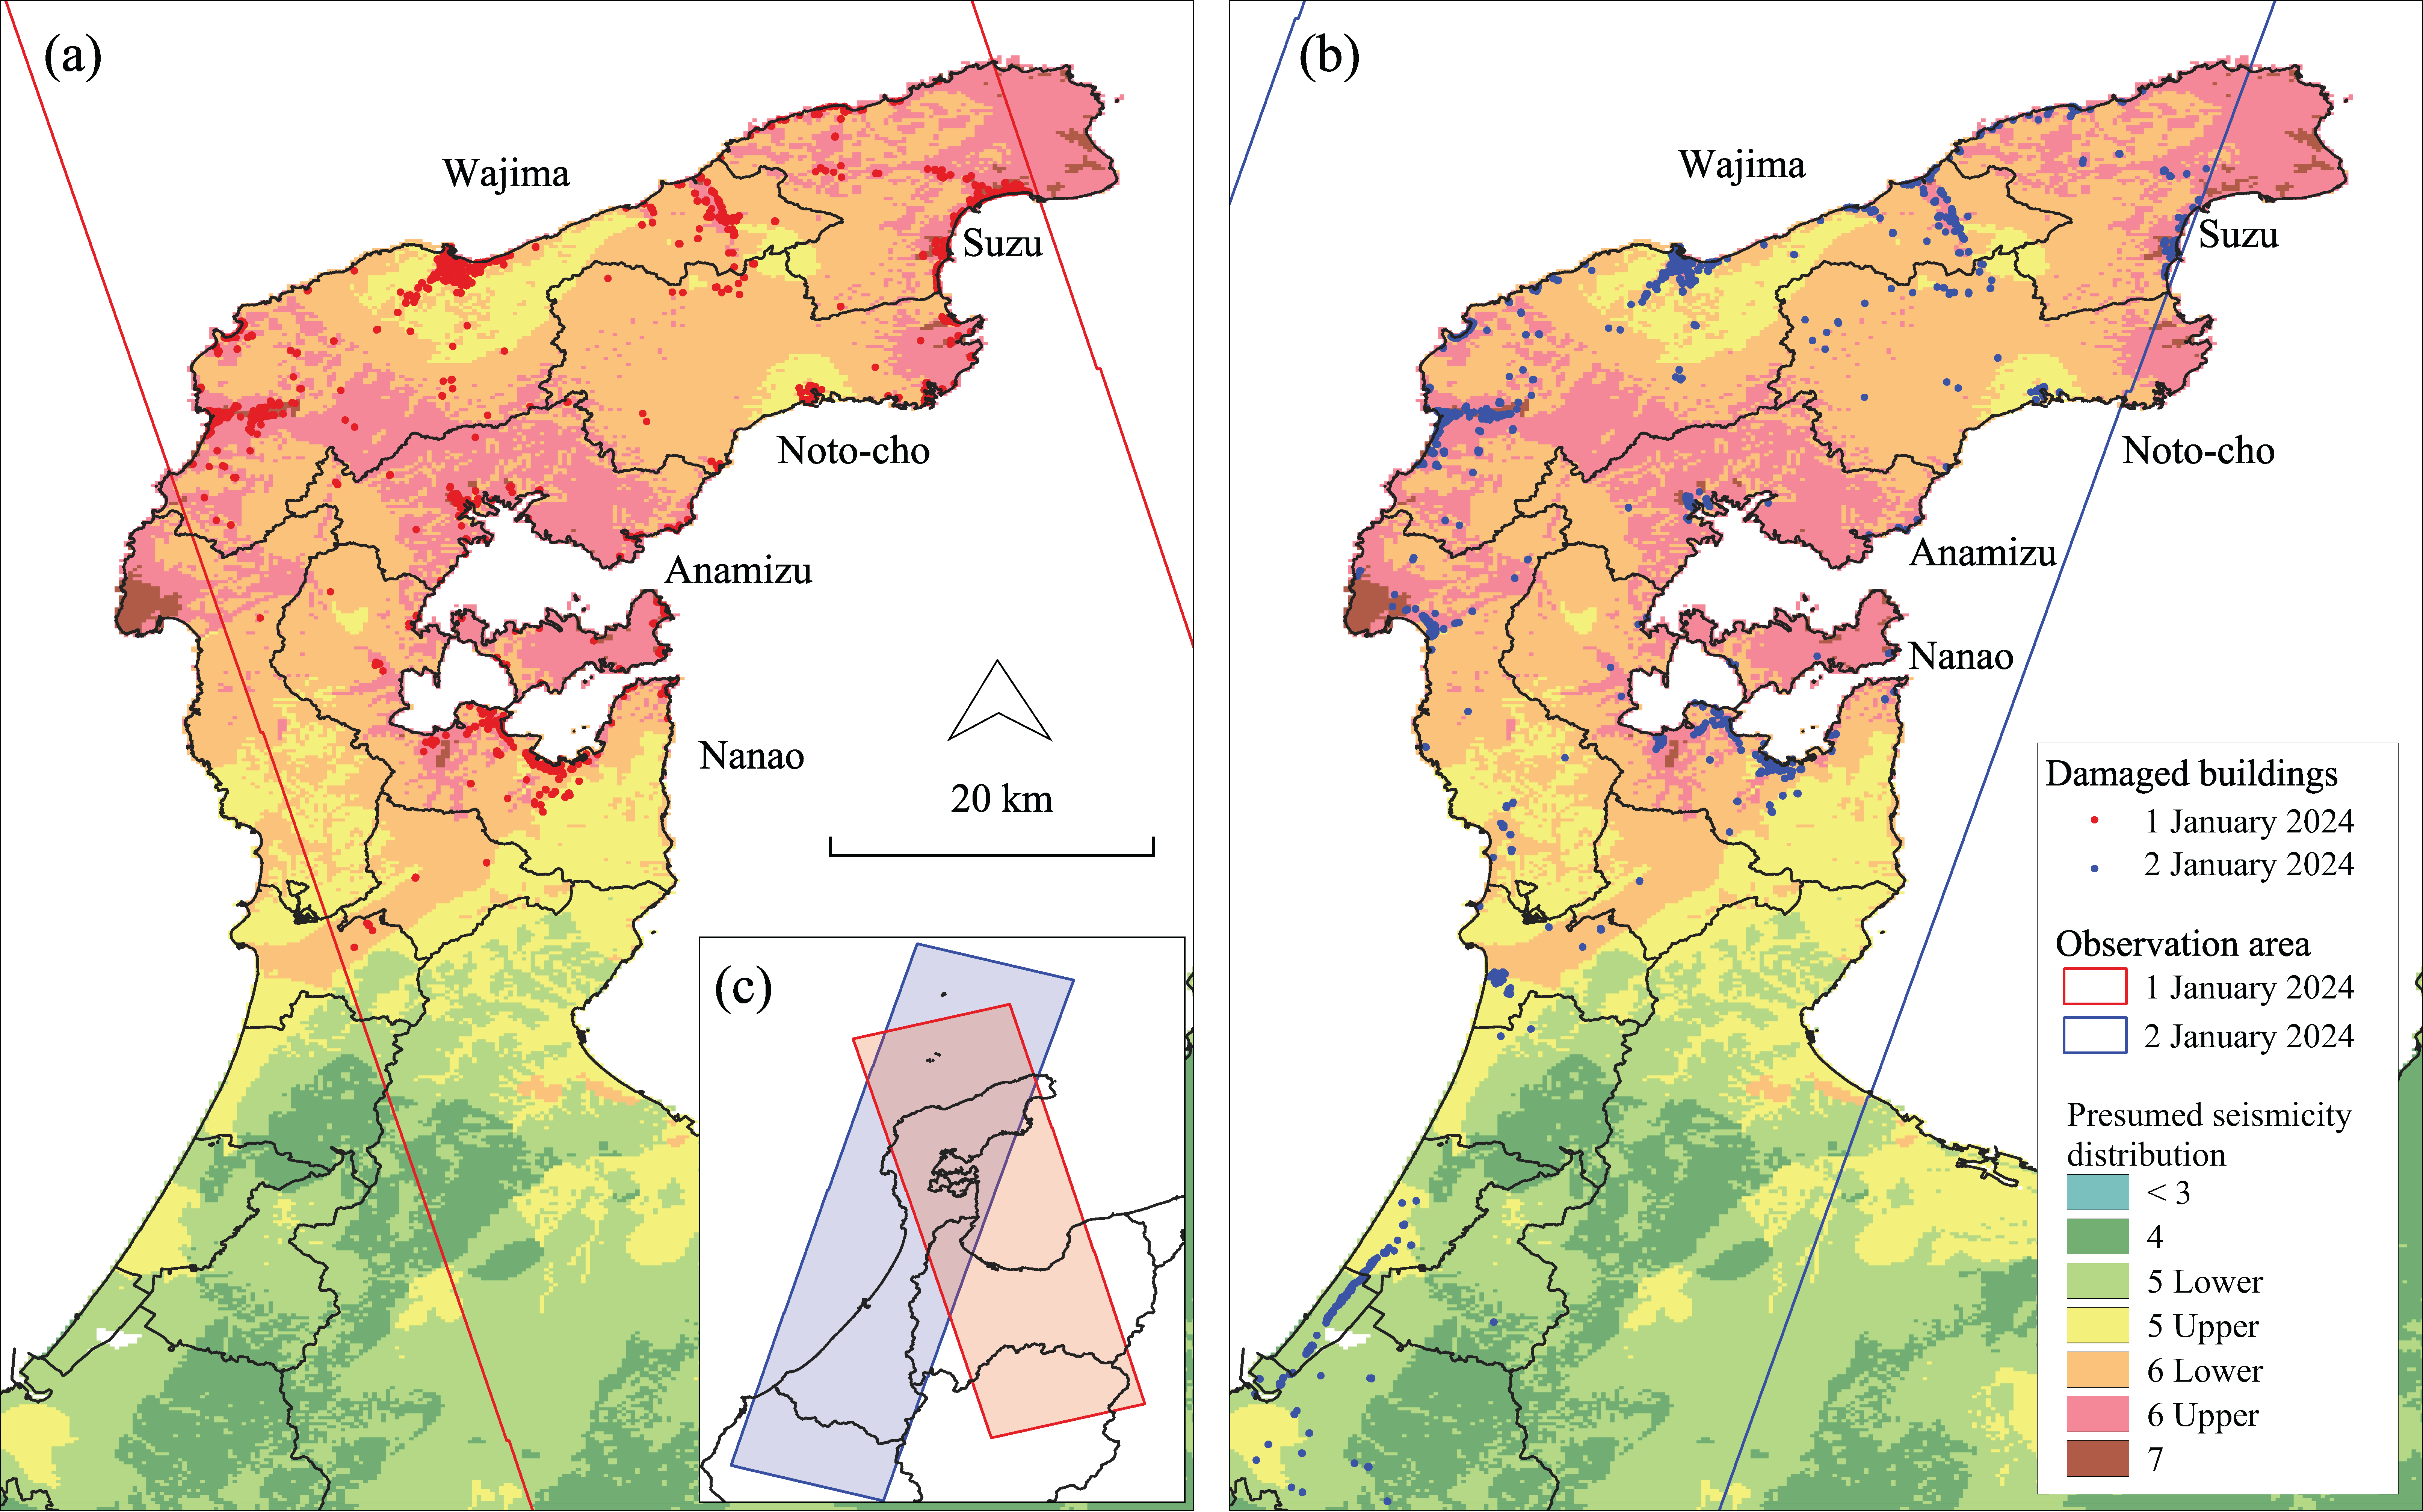
2.3.2. ALOS-2 Radar Satellite-Derived Building Damage Estimation Data

ALOS-2 is an L-band SAR system that offers a 50 km swath, ultrafine stripmap mode with 3 m spatial resolution, and dual polarization. ALOS-2-BDE data provided by the Japan Aerospace Exploration Agency (JAXA) [61] were utilized in this study (Figure 4). Images were acquired at 23:10 on 1 January 2024 (ascending track 121; Figure 4a) and at 12:37 on 2 January 2024 (descending track 26; Figure 4b) [62]. The eastern part of Suzu was not covered in either acquisition (Figure 4c). Damage detection was performed using the method developed by Natsuaki [63], based on the European Macroseismic Scale 1998 (EMS-98) classification criteria (Table 1) [64]. This method identifies building damage severity across levels 2 to 5 (DL2–DL5), where DL2 indicates moderate damage (slight structural and moderate non-structural damage) and DL5 indicates very heavy structural damage. Buildings categorized as DL > 2 were considered fully or half-collapsed [63]. The building inventory dataset used in this model was provided by the Geospatial Information Authority of Japan (GSI) [65].

2.3.3. Damage Report Issued by the Ishikawa Prefectural Government

Building damage information was obtained from the official damage reports [46]. These reports include data on human casualties (fatalities, missing persons, and injuries) and building damage levels (fully collapsed, half-collapsed, or partially collapsed), categorized by building type (residential or non-residential) at the municipal level (Table 2). The number of damaged buildings reported between 1 January 2024 and 4 March 2025 was summarized by the municipality to analyze the timeline of damage severity reporting. The official damage counts as of 4 March 2025 were used for validating BDE results from REBDE, ALOS-2-BDE, and integrated-BDE.

2.3.4. Social Networking Service Information

We used FASTALERT, an AI-powered real-time risk information service developed by JX-press Corporation in Japan [66]. This platform aggregates real-time disaster-related data from social media and other sources to detect various risk types (e.g., disasters and accidents) across Japan [67]. FASTALERT identifies posting locations and promptly disseminates information to users. Each entry includes a timestamp, geographic location, disaster category (hazards and disasters, structural and infrastructure damage, traffic and transport incidents, emergency response, and public safety-related), image, and user-generated text. The distributed information is refined as new data become available, and geographic errors are corrected through new inputs or user feedback. We extracted building damage-related entries (e.g., building collapse and building damage) distributed between 1 and 14 January 2024 and summarized and visualized them alongside the BDE results to support estimation validation.
Table 3 presents an overview of the main specifications of the estimation data, sensor characteristics, and social media inputs used in this study.

2.4. Data Processing and Validation

2.4.1. Estimation of Building Exposure

Building exposure was estimated using the presumed seismicity distribution and building datasets obtained from Zenrin [57]. Residential buildings located within 250 m mesh grids with a presumed seismic intensity exceeding “6 upper” were extracted. Then, the number of exposed buildings was aggregated at the municipal level.

2.4.2. REBDE-Based Building Damage Estimation

The REBDE dataset, calibrated with the CDMC2012 vulnerability function, was used to estimate initial building damage. The results were aggregated at the municipal level.

2.4.3. ALOS-2-Based Building Damage Estimation

The ALOS-2-BDE results were processed using a four-step procedure. First, a 3 m spatial buffer was applied to damage points identified from imagery acquired on 1 January 2024. Second, results from the 2 January 2024 acquisition that overlapped with the buffered area were excluded. Third, the 1 January ALOS-2-BDE data and filtered 2 January data were merged. Fourth, areas affected by large-scale fires were masked, and the total number of damaged buildings was aggregated at the municipal level.

2.4.4. Integrated Building Damage Estimation

Building damage estimates from REBDE (Section 2.4.2) and ALOS-2-BDE (Section 2.4.3) were integrated through the following steps. First, we extracted all 250 m grid cells in the REBDE layer that contained at least one ALOS-2-BDE point (Figure 5a ①–③, ⑤). Second, we identified grid cells containing only ALOS-2-BDE points (i.e., without REBDE data) (Figure 5a ⑥). Third, we merged these two sets to create a unified, integrated damage dataset (Figure 5b). Finally, the integrated results were aggregated at the municipal level.

2.4.5. Validation of Estimation and Observation Datasets

To assess the accuracy of the BDE results, we calculated the mean absolute percentage error (MAPE) between estimated values from REBDE (Section 2.4.2), ALOS-2-BDE (Section 2.4.3), and integrated-BDE (Section 2.4.4) and the official building damage counts. MAPE was computed using Equation (3):
MAPE = 100 1 n t = 1 n A t F t A t
where At is the actual value (from the official report as of 4 March 2025), and Ft is the forecast value (from REBDE, ALOS-2-BDE, or integrated-BDE). The difference between these values was divided by the actual value At. The absolute value of this ratio was summed for every forecasted point and then divided by the total number of points n.
All spatial data processing and visualizations were performed using Quantum GIS, an open-source geographic information system platform.

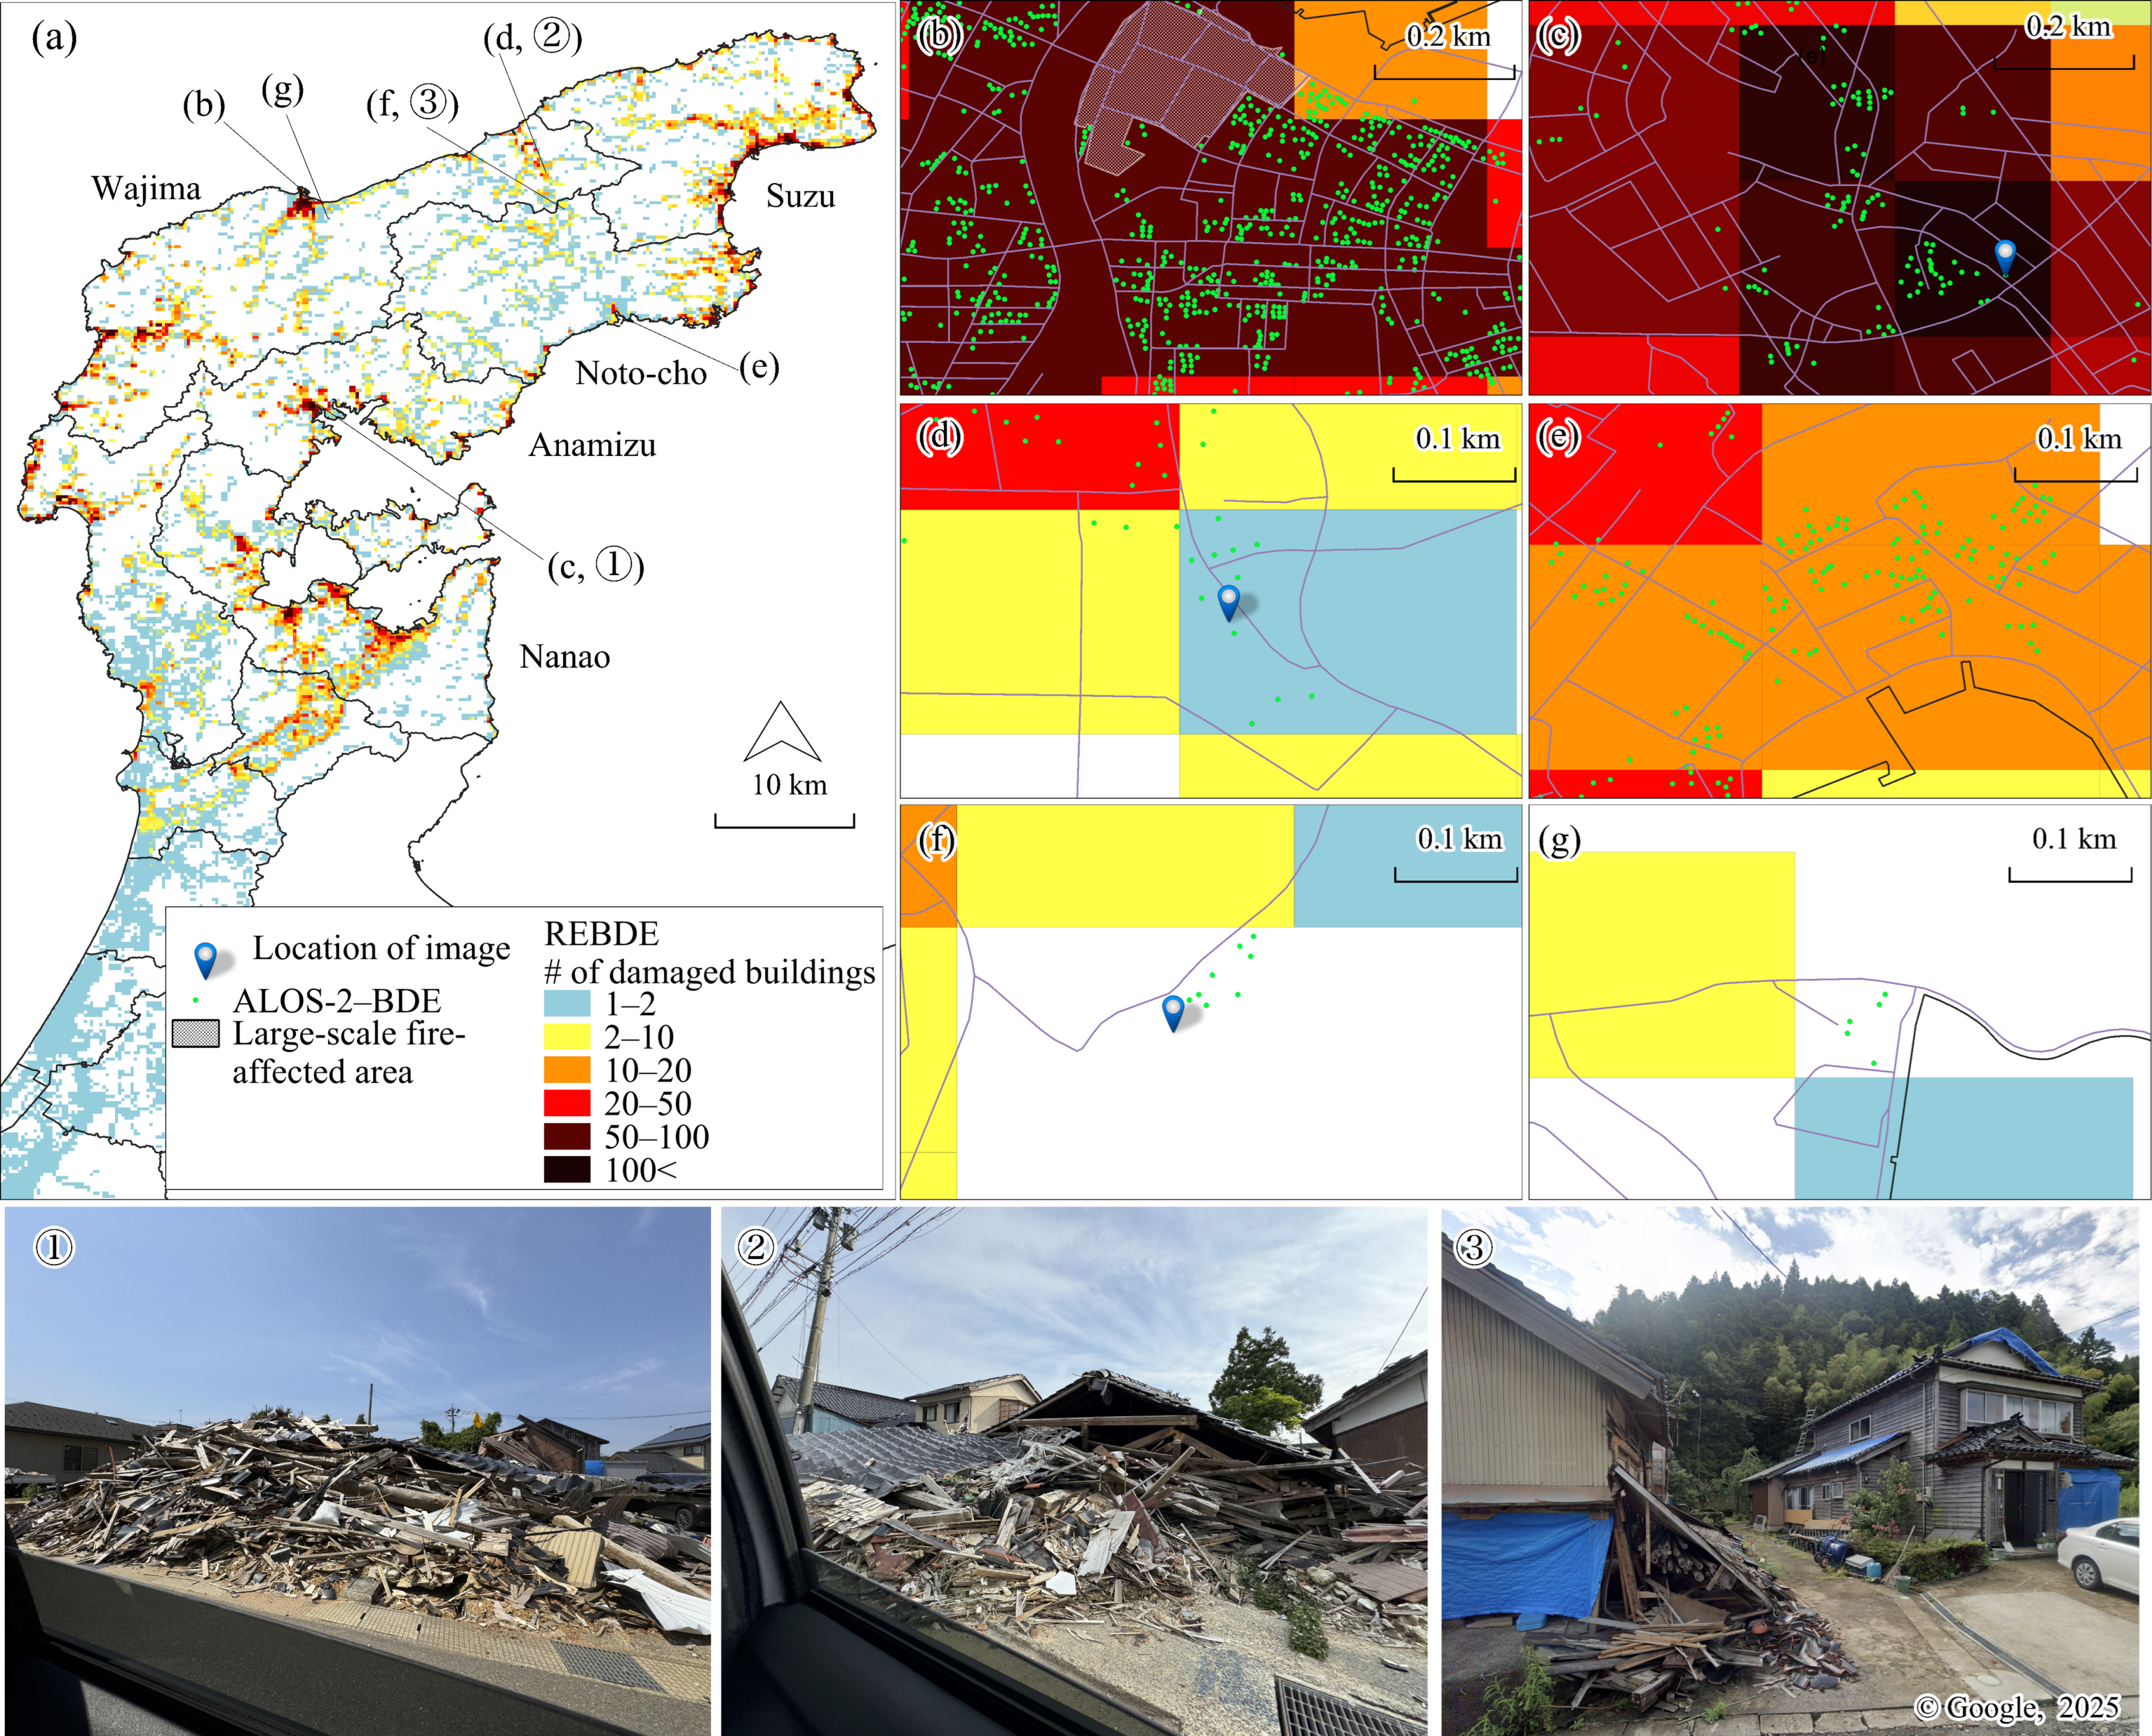
2.5. Field Investigation of Damaged Areas

A field survey was conducted from 6 to 9 June 2024 to validate building damage in the affected areas, with a focus on regions where damage estimates had been generated by REBDE and ALOS-2-BDE. In addition to on-site inspections, interviews were conducted with key informants working in the field to gather contextual and observational insights.

3. Results

3.1. Official Building Damage Count

Figure 6 shows the total number of damaged buildings reported between 1 January and 4 March 2025, based on the official damage report [45]. Although preliminary damage reports were issued shortly after the mainshock, detailed classifications of damage severity (full, half, or partial collapse) were released gradually over time. Major updates were provided on 30 January (Suzu), 6 February (Wajima), 16 February (Noto-cho), 19 February (Anamizu), and 15 March (Nanao), reflecting the ongoing progression of field surveys and ongoing data collection.

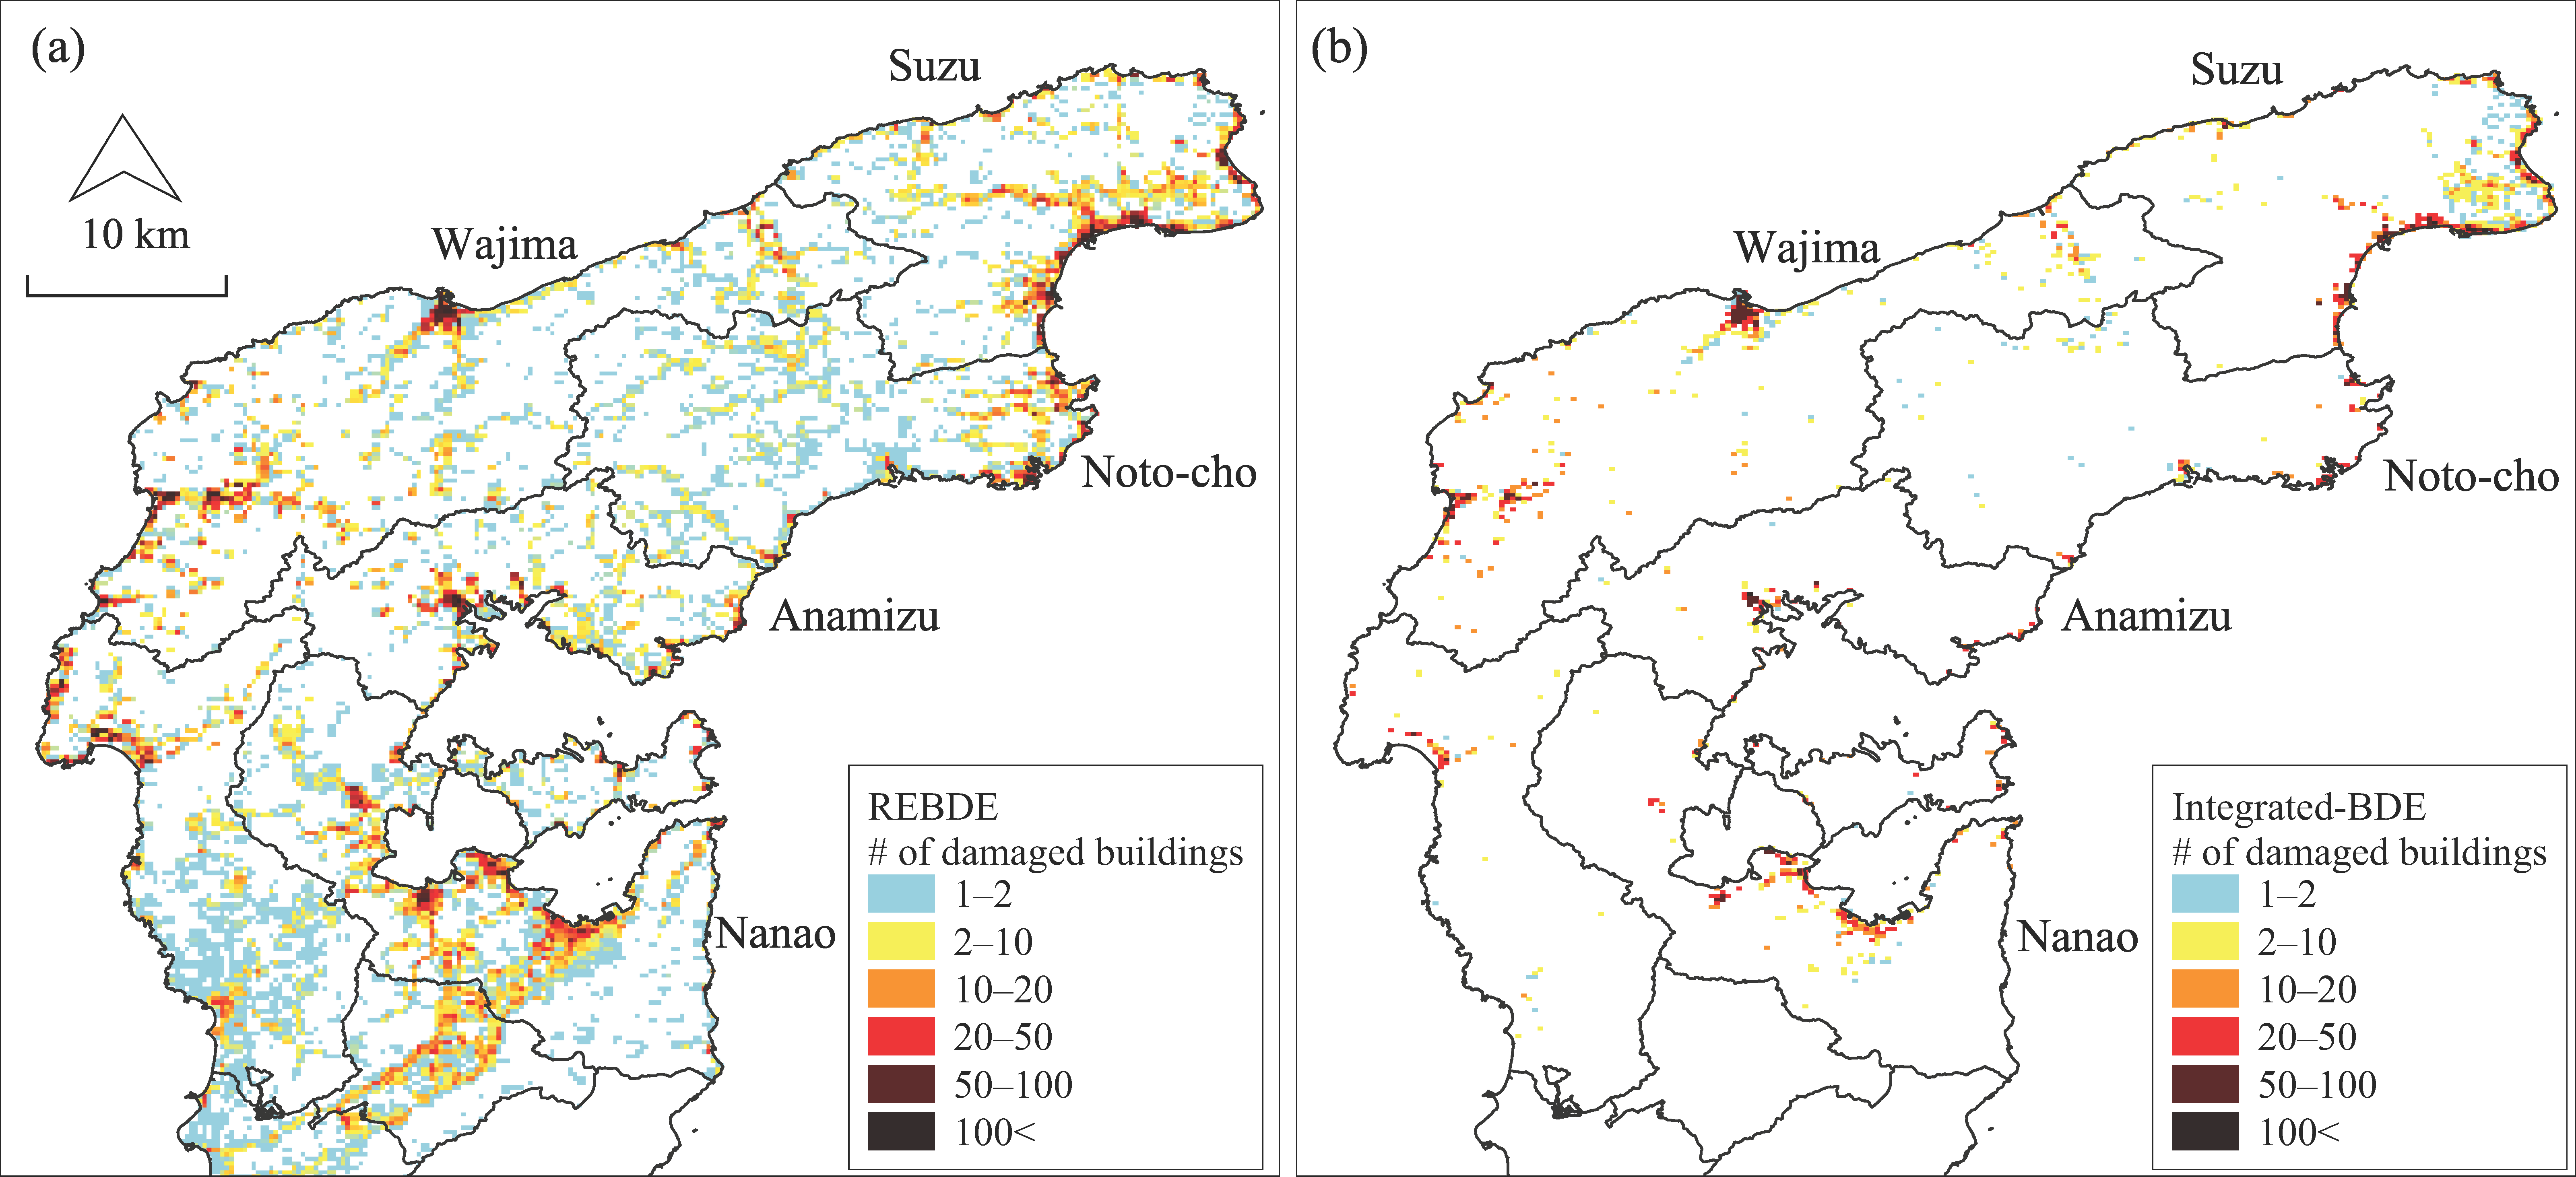
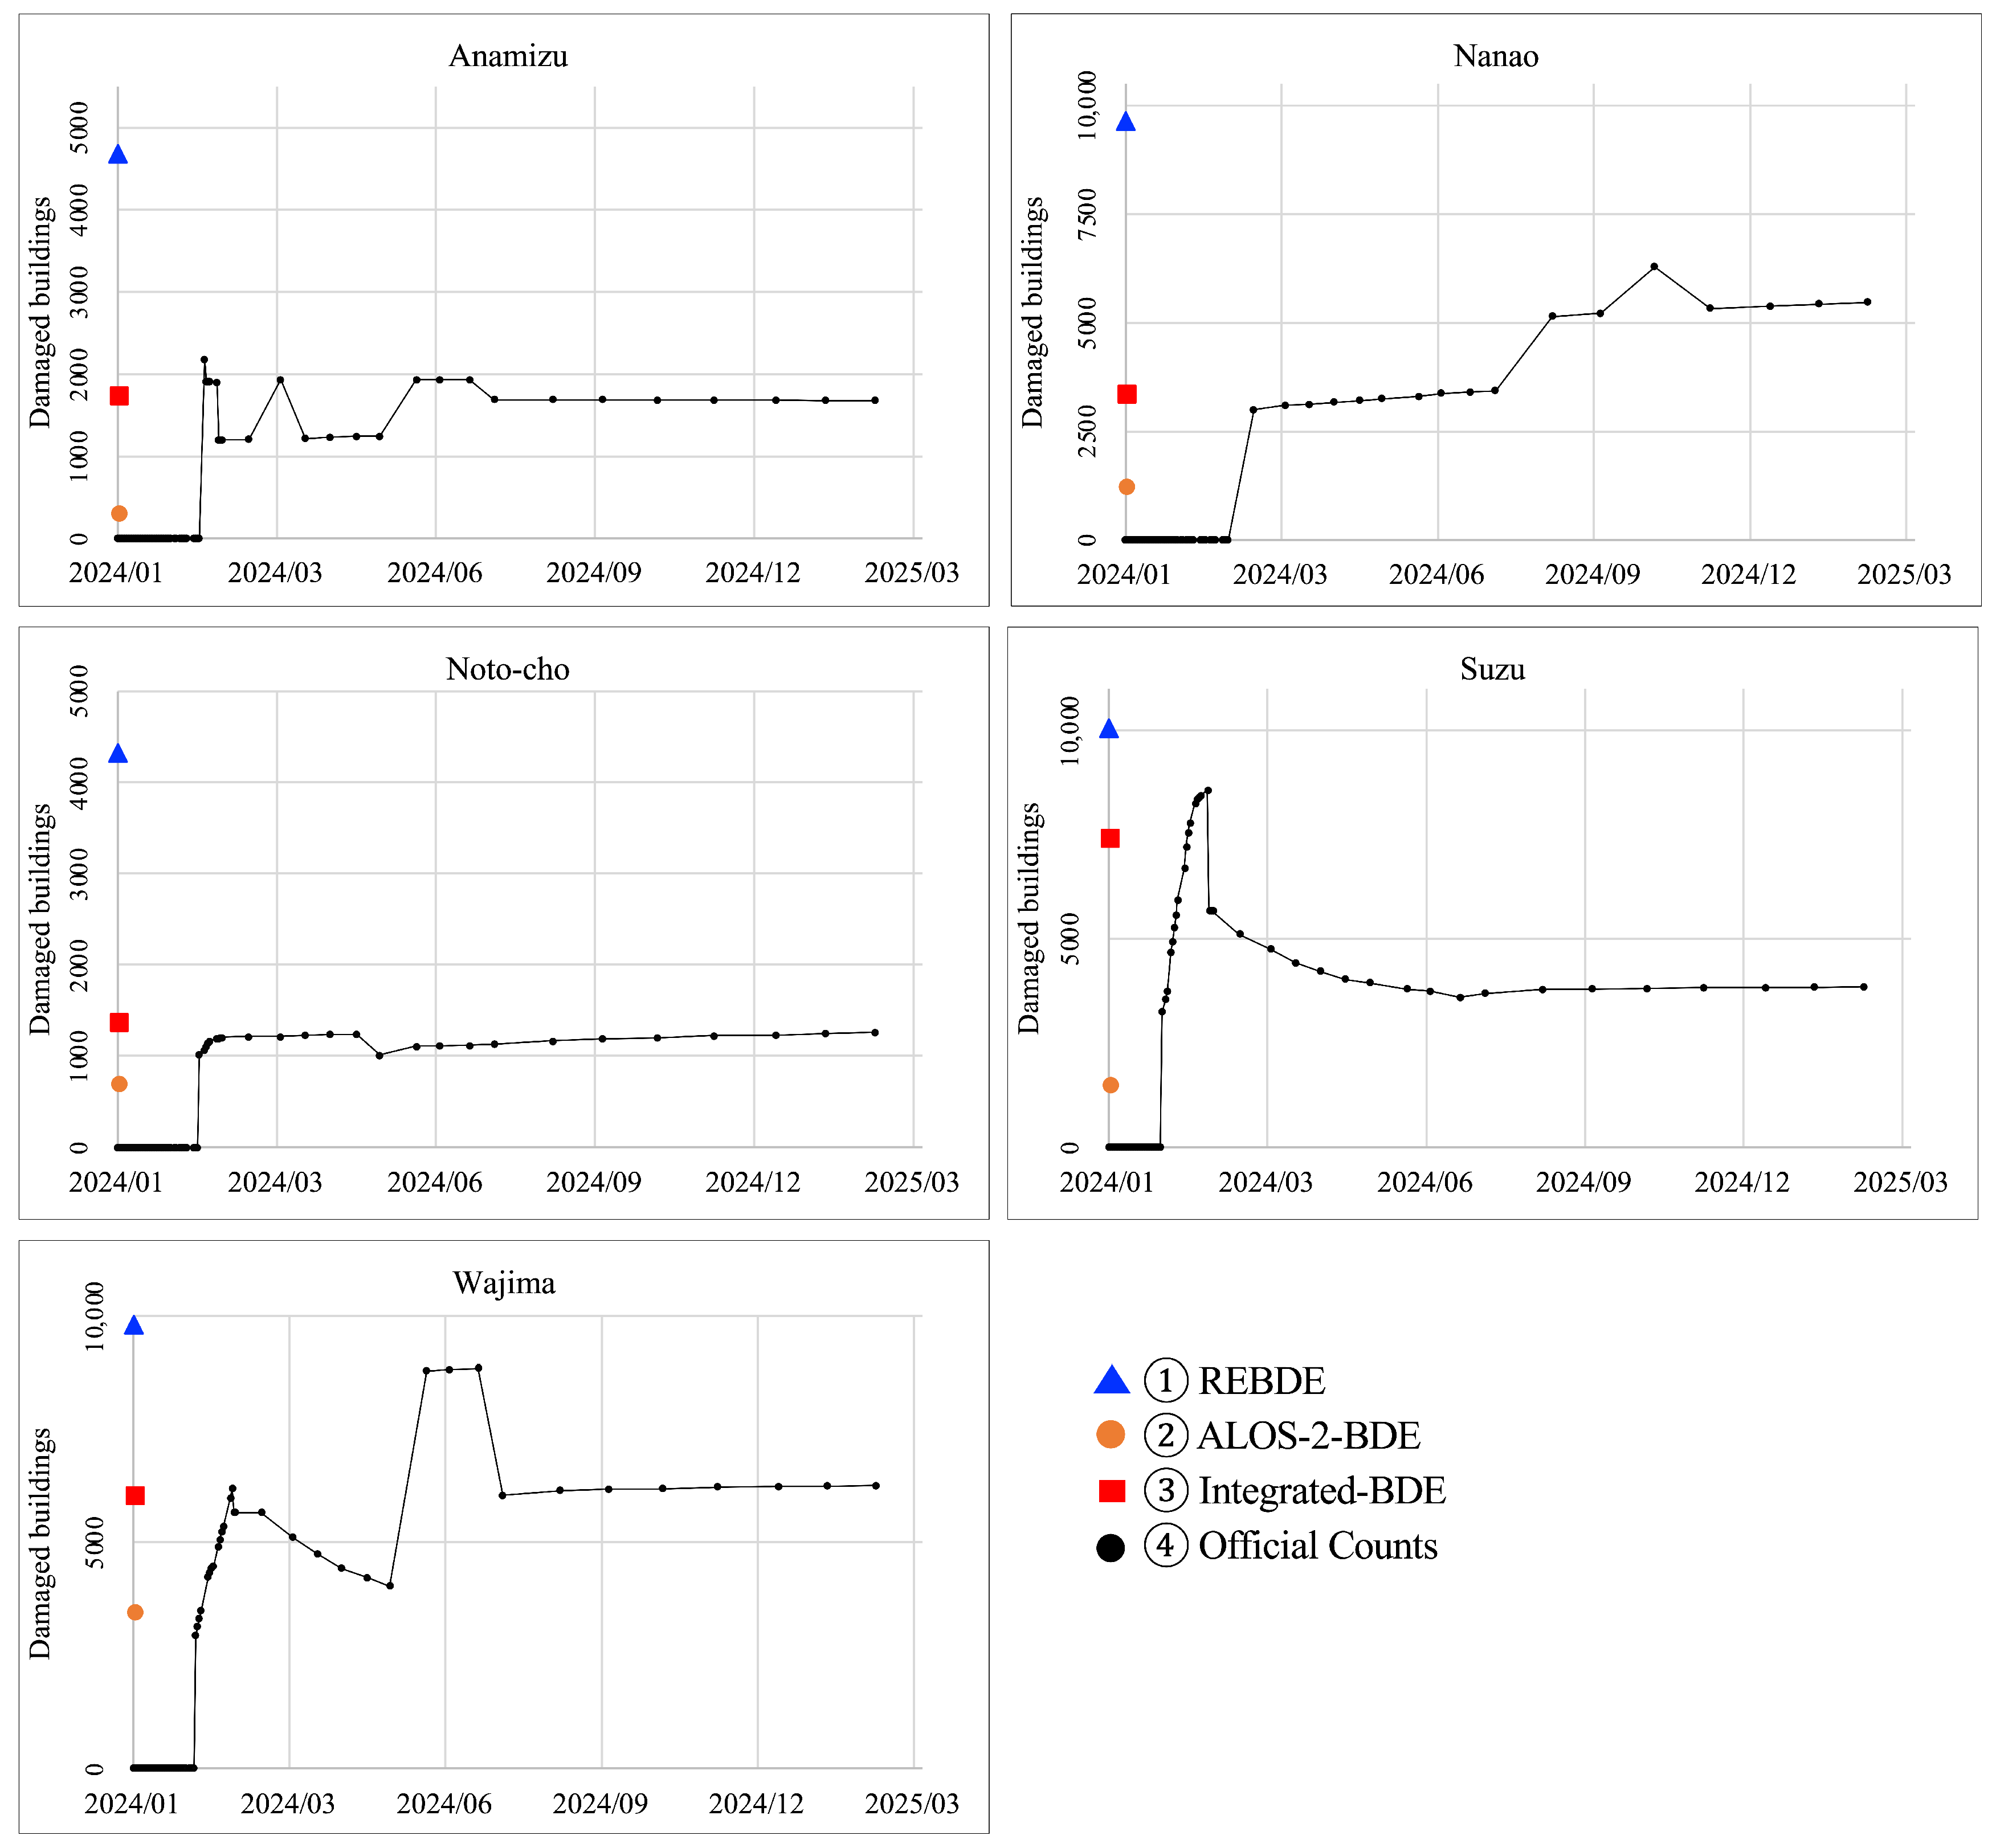
3.2. Comparison of Real-Time, Satellite Observation-Based, and Integrated-BDE Results

A comparative analysis was conducted between the REBDE and ALOS-2-BDE datasets. In the five study municipalities, ALOS-2-BDE estimated 5176 damaged buildings on 1 January and 3511 on 2 January 2024. The merged estimate was 7138. Integrated-BDE results were overlaid on REBDE data (Figure 7). Figure 7b–g highlight three key spatial patterns: (1) areas where both datasets identified severe building damage (Figure 7b,c), (2) areas where ALOS-2-BDE indicated more extensive damage than REBDE (Figure 7d,e), and (3) areas where only ALOS-2-BDE detected damage (Figure 7f,g). Field surveys confirmed that areas in category (1) experienced significant structural damage (Figure 7 ①). Several areas in category (2) were underestimated by REBDE (Figure 7 ②), and areas in category (3) also showed observable damage during field validation (Figure 7 ③). The integrated results, generated as described in Section 2.4.4, are presented alongside REBDE and ALOS-2-BDE in Figure 8.

3.3. Comparison of Simulation-Based, Satellite-Derived, and Integrated-BDE Results

Building damage estimates from REBDE, ALOS-2-BDE, and integrated-BDE were compared with official damage counts at the municipal level, as summarized in Table 4. According to official damage reports, Wajima recorded the highest number of damaged buildings (6133), followed by Suzu (3744), Nanao (3469), Anamizu (1686), and Noto-cho (1148). By contrast, REBDE produced substantially higher estimates: Suzu (10,064), Wajima (9807), Nanao (9660), Anamizu (4690), and Noto-cho (4324). ALOS-2-BDE generated comparatively lower figures: Wajima (3443), Suzu (1481), Nanao (1215), Noto-cho (698), and Anamizu (301). Integrated-BDE produced more balanced estimates: Suzu (7414), Wajima (6028), Nanao (3348), Anamizu (1731), and Noto-cho (1365). MAPE values were 172.4% for REBDE, 58.1% for ALOS-2-BDE, and 25.0% for integrated-BDE, demonstrating a noticeable improvement in estimation accuracy through multi-source data integration.
Figure 9 shows a municipality-level breakdown of damaged building counts. Stabilization in the reported numbers of fully or half-collapsed buildings was observed from June 2024 for Noto-cho (>~1100); followed by August for Anamizu (>~1600), Suzu (>~3700), and Wajima (>~6000); and by December for Nanao (>~5300). Compared with official statistics, REBDE results from 1 January 2024 generally overestimated the damage, whereas ALOS-2-BDE results from 2 January 2024 underestimated it. Integrated-BDE, also dated 2 January 2024, demonstrated the closest alignment with the official figures across all five municipalities.

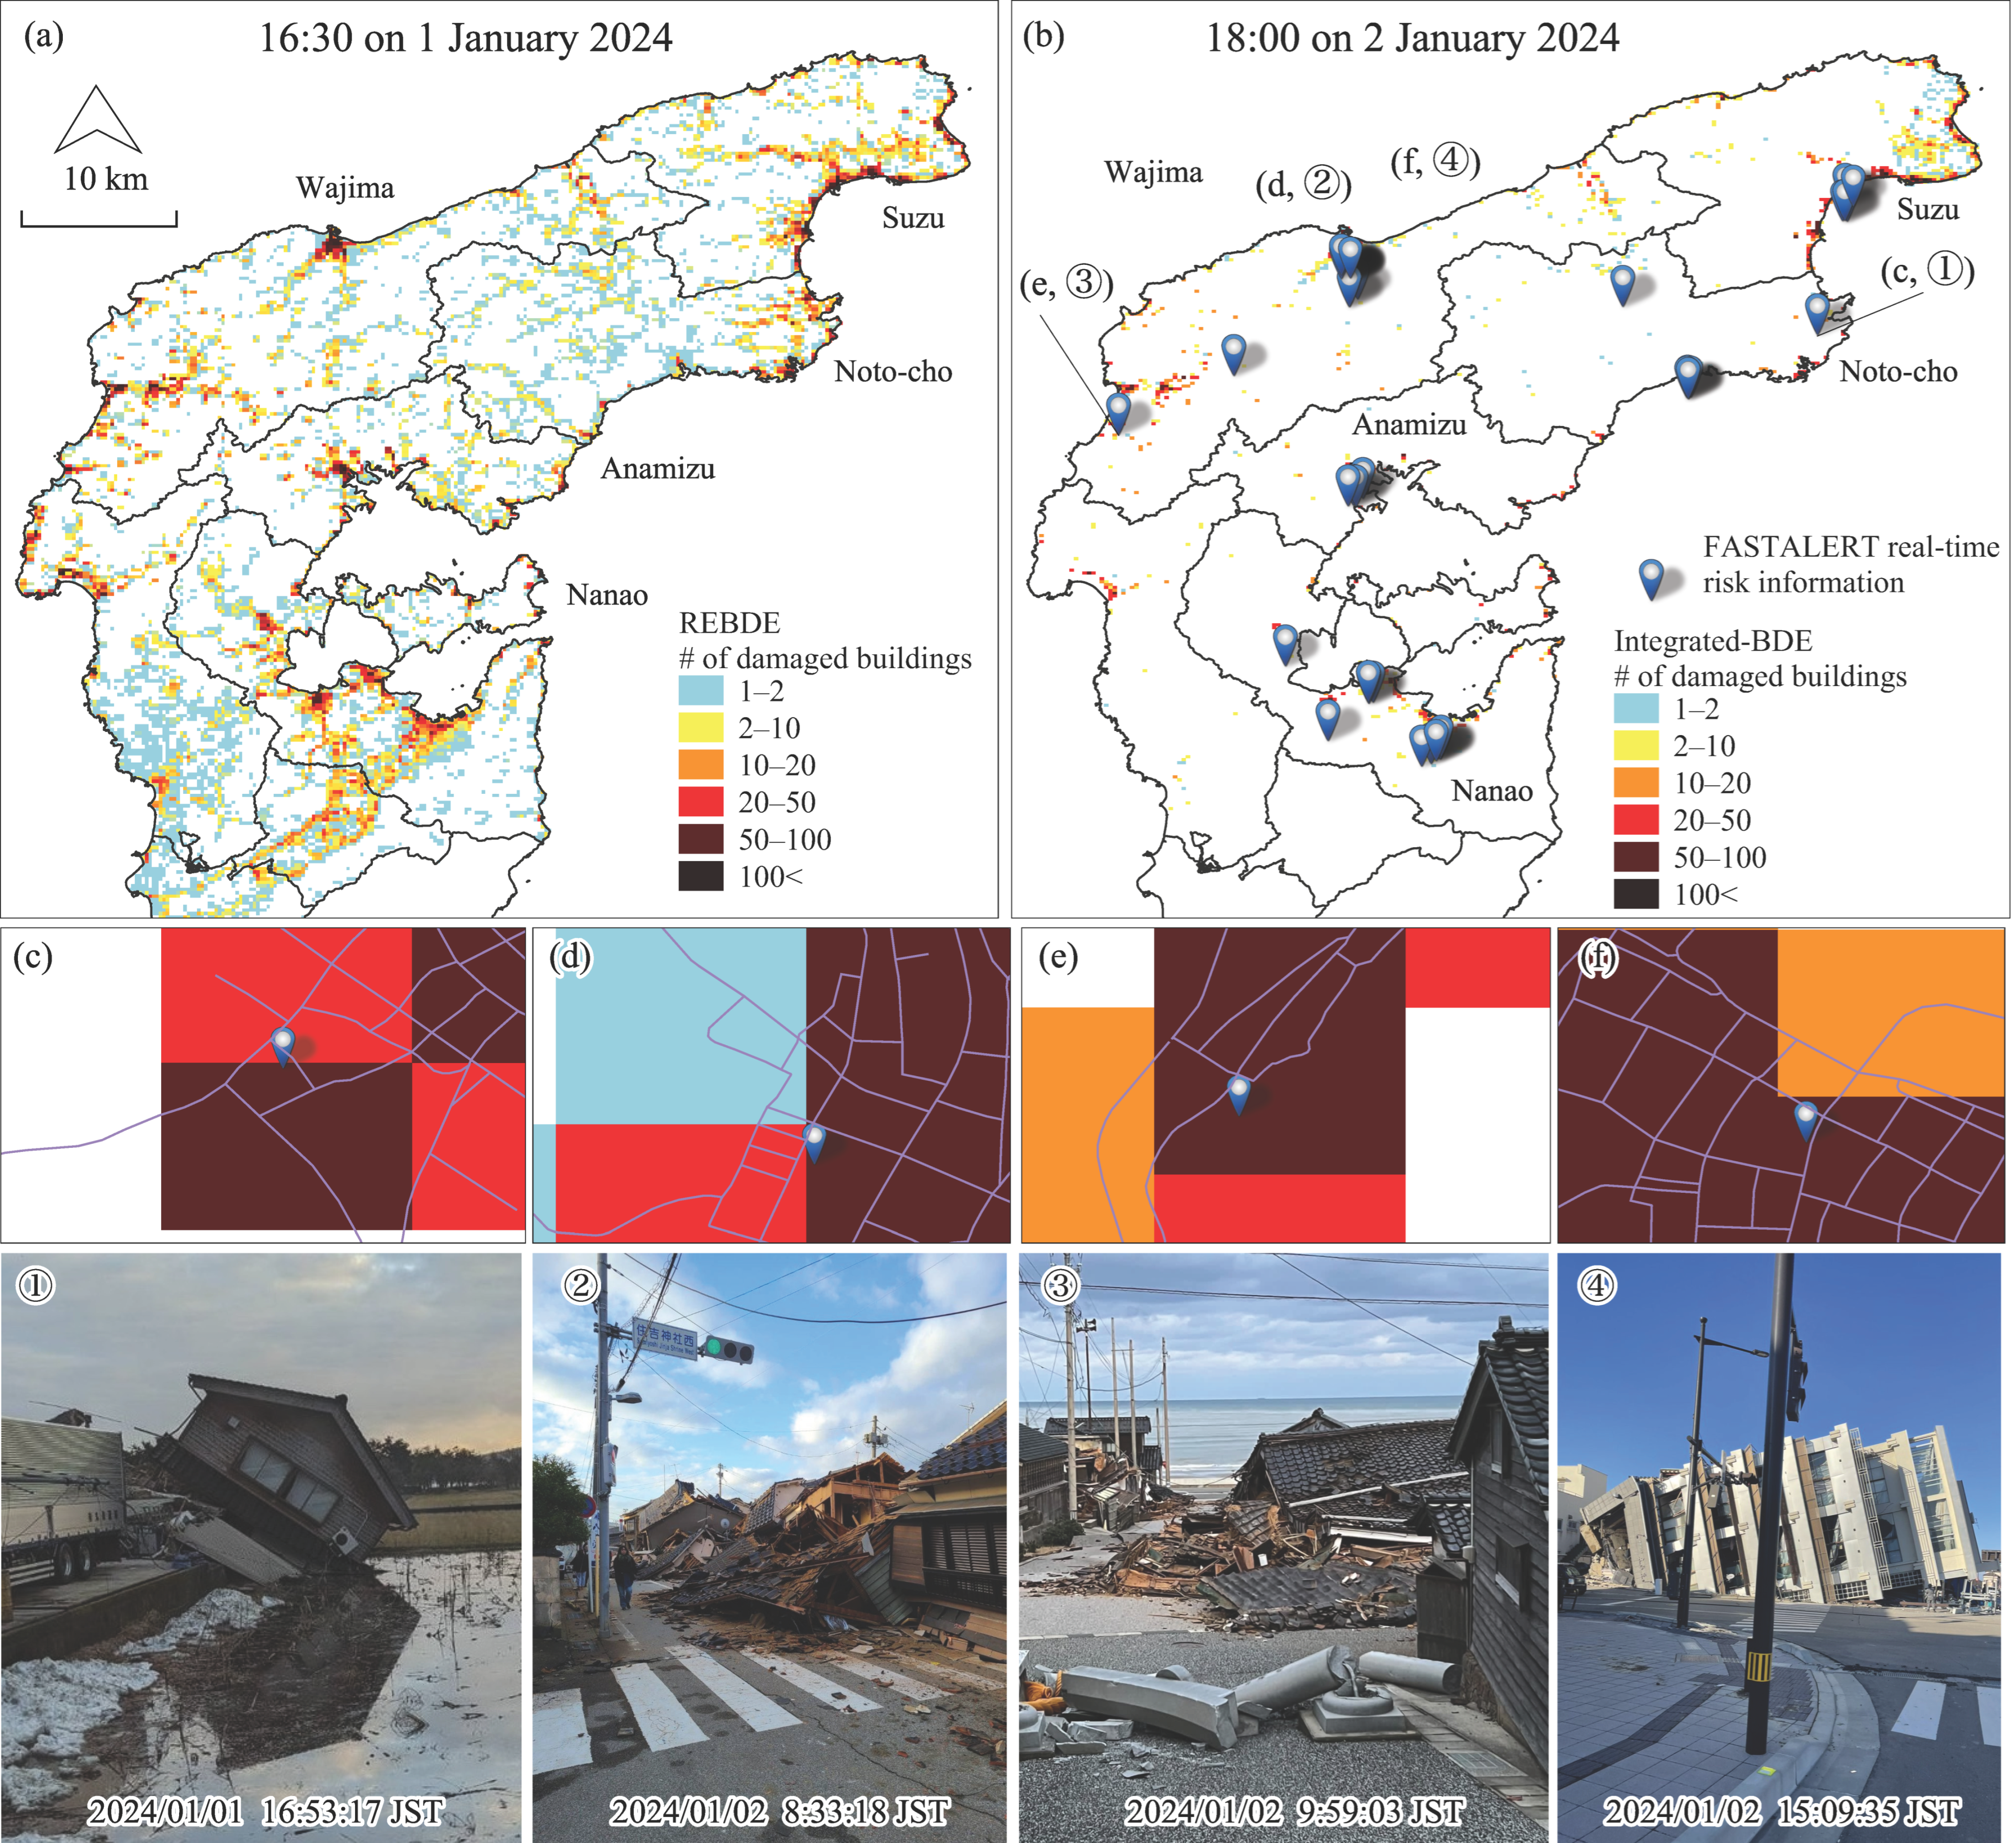
3.4. Spatiotemporal Summarization of Earthquake-Induced Building Damage-Related Social Media Data

Building damage-related information accounted for 22.1% (n = 52) of all FASTALERT real-time risk information entries recorded in the five study municipalities between 1 and 14 January 2024 (n = 235). At the municipal level, the highest proportion of posts was from Wajima (42.3%), followed by Nanao (25.0%), Noto-cho (13.5%), Suzu (11.5%), and Anamizu (7.7%). Temporally, 53.8% of building damage-related posts were recorded on 1 January, 42.3% on 2 January, and 3.8% on 3 January, with a peak on 1 January (Table 5). The spatial distribution of these social media-derived reports was overlaid with time-scaled BDE results for comparative visualization (Figure 10). REBDE data were released at 16:29 JST on 1 January 2024, and the release time of integrated-BDE was set to 18:00 JST on 2 January 2024, approximately 6 h after ALOS-2 image acquisition. No building damage-related FASTALERT posts had been distributed by 16:30 JST on 1 January 2024. By contrast, 49 FASTALERT posts—representing 94.4% of the total—were found between 16:30 JST on 1 January 2024 and 18:00 JST on 2 January 2024. These posts were spatially aligned with the integrated-BDE results (Figure 10a,b). The spatiotemporal locations of key FASTALERT entries are further compared with integrated-BDE in Figure 10c–f and validation images, ①–④, confirming the consistency and reliability of the integrated damage estimates.

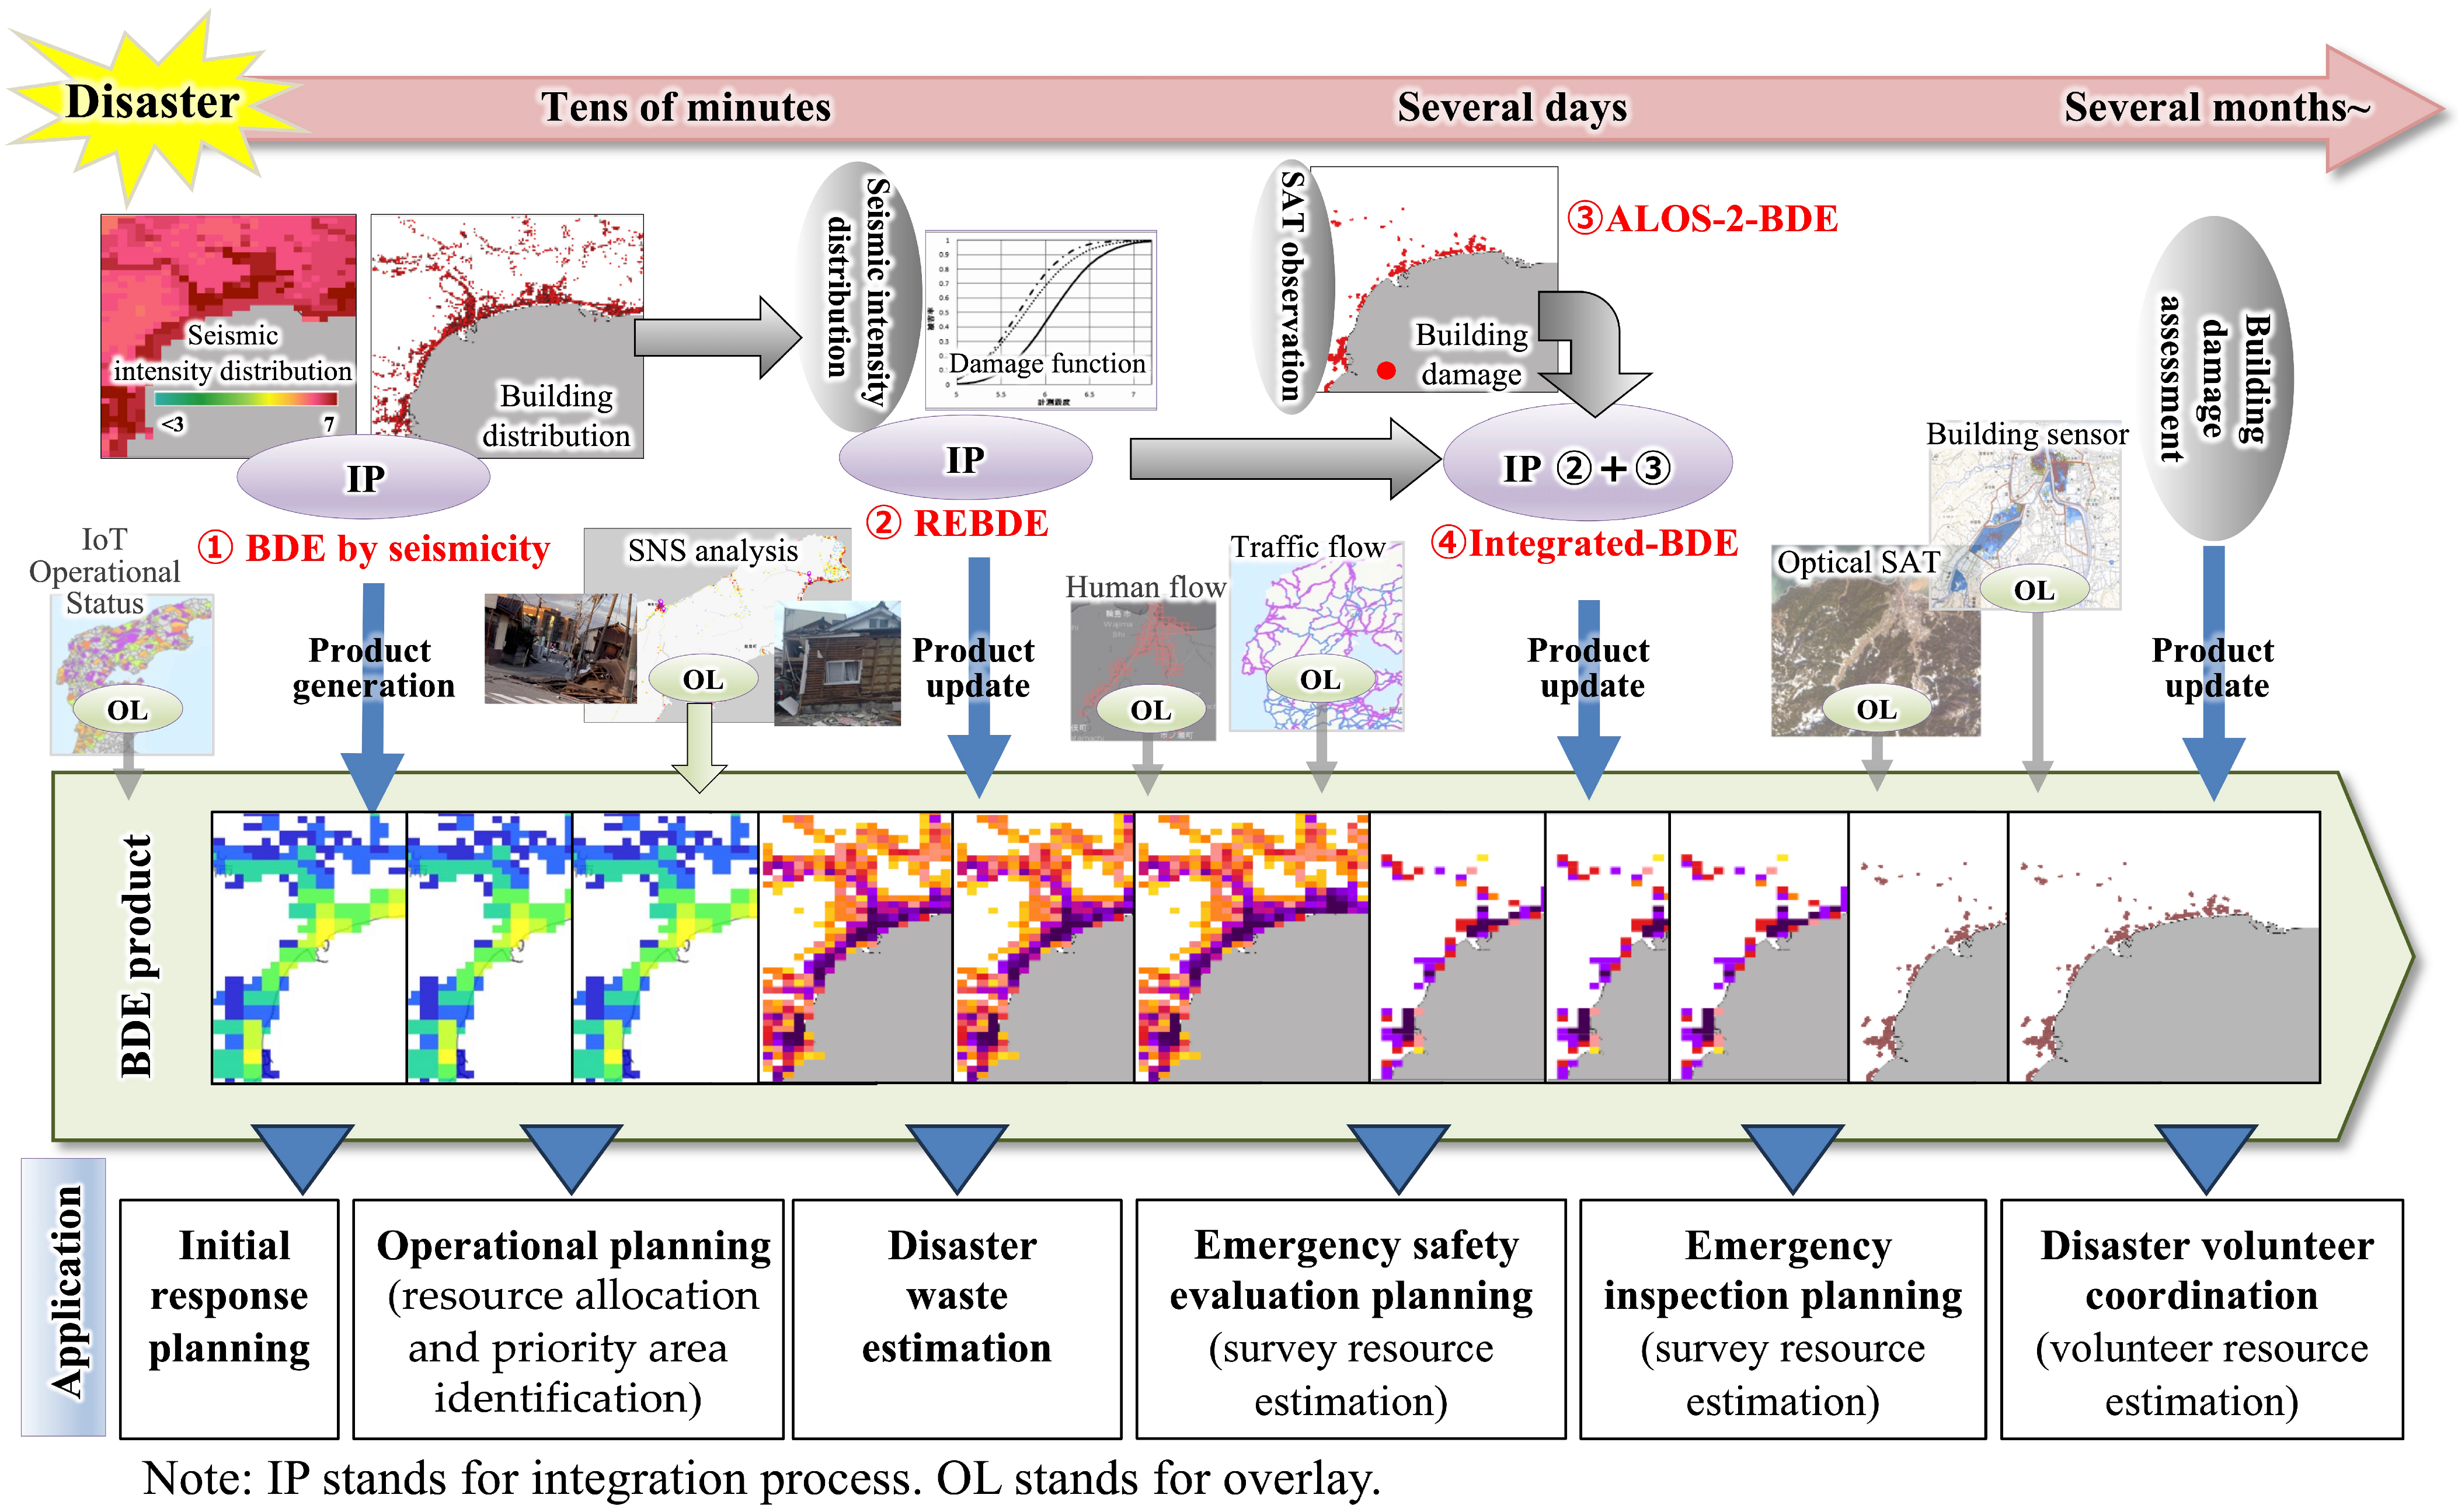
3.5. Proposed Stepwise Estimation of Building Damage Framework Using Time-Scaled Multi-Sensor Integration

Based on the results from REBDE, ALOS-2-BDE, and integrated-BDE, we propose a stepwise framework for estimating earthquake-induced building damage. This framework incorporates the most reliable multi-source sensing datasets and both disaster-specific and non-disaster-specific data and information (Figure 11). It is structured into three sequential phases: (1) immediate estimation following the seismic event (within tens of minutes); (2) integration with satellite-derived data in the following days; and (3) a refinement phase using incrementally acquired ground-truth data (approximately several months~). In the first phase, building exposure and estimates are generated using residential building datasets, the presumed seismicity distribution, and real-time simulation-based estimates (e.g., REBDE). Although these early outputs may lack accuracy, they provide critical information for initial emergency planning. In the second phase, satellite-based observations, such as ALOS-2-BDE, are integrated with the initial simulation-based estimates to improve the accuracy of damage assessments. This integration helps to reduce overestimates and addresses limitations of relying solely on a single data source. In the refinement phase, outputs are iteratively refined using ground-truth data, including field surveys and official post-disaster inspections. Additional disaster-specific and non-disaster-specific data sources—crowdsourced data (social media information), live monitoring systems (human and traffic flow), Internet of Things (IoT)- and sensor-based data (e.g., smart appliances, smart meters, and structural health monitoring), and remote sensing data (high-resolution satellite or aerial images)—are continuously incorporated to validate and enhance the final damage estimates across all phases.
Despite the abundance of information from diverse sources, the proposed temporally structured integration framework enables the generation of reliable, time-scaled BDE outputs to support a wide range of disaster response operations and to facilitate shared situational awareness among stakeholders. These applications include early response planning, operational decision-making (such as resource allocation and priority area identification), disaster waste estimation, emergency inspection planning (including survey resources estimation), post-disaster assessment surveys, and the coordination of volunteer efforts.

4. Discussion and Limitations

4.1. Stepwise Estimation of Building Damage Using Time-Scaled Multi-Sensor Integration

A prompt and comprehensive understanding of time-scaled, earthquake-induced building damage is essential for effective emergency response planning and rescue operations during the initial phase of a disaster. Despite this critical need, few studies have developed systematic BDE frameworks that leverage time-scaled, multi-source sensing datasets. The integration of advanced technologies offers substantial opportunities to improve situational awareness and provide a more complete understanding of the extent and distribution of damage. In this study, we proposed a stepwise estimation framework that continuously estimates and systematically updates time-scaled building damage products using the most reliable multi-sensor data sources available.
Although previous studies [16,22,24,25,26,32,35,37] have examined building damage at the regional scale using various methodologies and datasets, their temporal coverage was limited to discrete snapshots. By contrast, this study incorporated sequential data across multiple time scales: seismic distribution and REBDE, available within tens of minutes after the mainshock, and ALOS-2-BDE and integrated results, which became available in the following days. Stable official damage counts were released between April and December 2024—4 to 12 months after the event—highlighting the time lag in field-based confirmation (Section 3.3). Our analysis shows that estimation accuracy, measured by MAPE (%), significantly improved with the temporal integration of multi-source datasets: 172.4% for REBDE (1 January 2024), 58.1% for ALOS-2-BDE, and 25.0% for integrated-BDE (2 January 2024). The CDMC2012 model, which was originally developed based on the 1995 Great Hanshin Earthquake (Mw = 6.9) [55], models extreme scenarios for disaster preparedness [58]. Additionally, the model employs a 2015 residential building dataset [6], which is presumed to represent building stock with comparatively lower seismic resistance than more recent constructions. These factors collectively contribute to the tendency of REBDE to overestimate damage during large seismic events [55], as reported in the literature and records [6,70,71,72,73,74,75,76,77]. By contrast, ALOS-2-BDE, which adopts the same methodological approach, has exhibited underestimation in past events such as the 2016 Kumamoto Earthquake (Mw = 7.0) [63]. A notable limitation of this approach is its reduced sensitivity to detecting DLs in buildings with footprints smaller than 200 m2, often resulting in lower accuracy for such structures. This constraint in coherence-based analysis presents a considerable challenge for accurately detecting and classifying. These findings support the utility of the proposed stepwise estimation framework in enhancing the reliability of BDE. The results show that multi-source integration helps offset the limitations of individual datasets, thereby improving overall accuracy. Furthermore, prompt satellite tasking and image acquisition [78] following a major seismic event may further enhance the performance of future BDE potentials.
Furthermore, incorporating both disaster-specific and non-disaster-specific data—social media posts—can further enhance the confirmation and reliability of BDE outputs. This study observed a temporal peak in FASTALERT entries on 1 January 2024, accounting for 53.8% of all building damage-related posts. This concentration can be explained by three primary factors: (1) increased cellular base station outages; (2) operational characteristics of the FASTALERT system; and (3) evacuation status of local residents. First, regarding power-related disruptions, the number of reported cellular base station outages was 524 on 1 January, 749 on 2 January, and 977 on 3 January 2024, with the peak occurring on 3 January [79]. These outages were gradually resolved in the following weeks. A correlation analysis between the number of FASTALERT entries and reported base station outages revealed a negative, though statistically non-significant, correlation (r(1) = −0.79, p = 0.42). This result may reflect the limited sample size, which reduced statistical power and hindered the detection of a meaningful association. Second, the FASTALERT system is designed to prioritize real-time incident reporting and excludes retrospective or delayed social media posts from its operational dataset. Consequently, the volume of FASTALERT entries decreased significantly after 3 January, coinciding with a decline in aftershock activity [60]. Third, widespread evacuation efforts likely influenced posting behavior. Following the earthquake, evacuation orders were issued across the affected regions, resulting in a peak of 31,537 evacuees in shelters across the five study municipalities on 4 January 2024 [45]. This displacement probably limited residents’ access to damaged buildings, reducing the frequency of social media posts. Although the widespread use of social media enables real-time dissemination of disaster-related information to a diverse set of stakeholders—individuals, media outlets, academic institutions, and governmental and non-governmental organizations—a major challenge is the prevalence of misinformation and disinformation in user-generated content [80,81]. Implementing data quality-assurance mechanisms, such as continuous updates and user feedback loops, can reduce the impact of misleading information and improve the reliability of social media-derived data for validation of BDE results and further disaster response applications.
Incorporating additional auxiliary datasets can further enhance the quality and validation of BDE outputs (Figure 11). For example, although electric utility companies typically release power outage data at the municipal level [82], IoT-based home appliance data can detect localized outages at much finer spatial resolutions of postal code scale [83,84]. These insights offer a valuable indirect approach for assessing building damage. Additionally, real-time traffic flow data from navigation systems and mobile devices can serve as supplementary indicators of physical disruptions. Abnormal declines in traffic speed or volume near residential areas may suggest road closures or restricted access due to building collapses or debris. In addition, recent advances in very-high-resolution imagery with various techniques have substantially improved building-level damage detection, enabling precise and spatially detailed damage mapping [31,85]. Sensor data from structural health monitoring systems can further refine damage assessments by capturing displacements and other indicators of structural integrity [86]. The single-damage estimation products generated by the proposed framework are designed to be continuously updated as new data become available. Temporally aligning these auxiliary datasets with time-scaled BDE outputs can enhance the accuracy, timeliness, and responsiveness of earthquake-induced building damage estimation.

4.2. Utilization of Stepwise BDE Approach

The proposed stepwise BDE approach enables rapid estimation and systematic updating of time-scaled building damage information products. This framework facilitates the development of a commonly shared understanding of disaster impacts among diverse stakeholders. For example, building damage counts derived from integrated-BDE on 2 January 2024 were 6028 in Wajima, 7414 in Suzu, 3348 in Nanao, 1731 in Anamizu, and 1365 in Noto-cho. By contrast, official damage reports for the same date recorded only 7 damaged buildings in Nanao and 16 in Anamizu [69] (Section 3.3). Although early-stage BDEs—even those based on the most reliable available datasets—may exhibit reduced accuracy, they remain essential inputs for operational planning and prioritizing emergency response activities, particularly when comprehensive official damage reports are unavailable, as was the case on 2 January 2024.
This stepwise framework enhances both the timeliness and the accuracy of building damage assessments while promoting shared situational awareness among emergency responders, policymakers, and the public. Moreover, its modular structure enables the integration of new datasets as technologies evolve, ensuring adaptability and scalability in future disaster response scenarios.
Japan faces a high-probability risk of three catastrophic earthquakes, namely the Tokyo Metropolitan, Nankai Trough, and Japan Trench/Chishima Trench Earthquakes, occurring within the next 30 years. The projected impact of the Tokyo Metropolitan Earthquake includes 25.4 million affected individuals (seismic intensity > lower 6), 23,000 fatalities, 98 million tons of debris, and JPY 95 trillion in economic losses [87]. In comparison, the Nankai Trough Earthquake is projected to affect 40.7 million individuals, result in 231,000 fatalities, generate 310 million tons of debris, and cause JPY 220 trillion in damages [87]. The Japan Trench/Chishima Trench Earthquake is projected to impact 272 earthquake- and 108 tsunami-affected municipalities, with 199,000 earthquake-related and 100,000 tsunami-related fatalities, 110 million tons of debris, and JPY 48 trillion in economic losses [87] (Table 6). Accordingly, the effective integration of available data and proactive application of the stepwise BDE framework in future large-scale disasters is imperative to strengthen national preparedness, response, and recovery capabilities.

4.3. Limitations

Several limitations are inherent in the datasets and methods used in this study. First, REBDE and ALOS-2-BDE rely on building datasets derived from the Zenrin Building Dataset 2015 [57] and the GSI [65], respectively, which may not fully reflect recent construction changes and structural vulnerabilities. Second, the applicability of the proposed framework is constrained by the damage function of CDMC2012, which models extreme disaster scenarios for preparedness [58]. Third, the ALOS-2-BDE results are limited to areas covered by the satellite observations, excluding regions outside the imaging footprint of the sensor. Fourth, although SAR technology provides weather-independent imaging capabilities, it is subject to geometric distortions such as foreshortening and layover, particularly in mountainous terrain. These distortions can lead to the misclassification or omission of structural damage. Finally, the use of a 250 m spatial resolution in BDE outputs may limit the detection of highly localized damage, potentially affecting fine-scale decision-making for emergency response.

5. Conclusions

This study developed a stepwise estimation framework for earthquake-induced building damage, enabling continuous estimation and systematic updating of time-scaled building damage products. The framework integrates multiple data sources—REBDE and ALOS-2-BDE—and is validated against official damage counts. Estimation accuracy, measured by MAPE, improved significantly with the temporal integration of multi-source datasets: 172.4% for REBDE, 58.1% for ALOS-2-BDE, and 25.0% for integrated-BDE. Incorporating routinely available supplementary datasets, such as social media content, can further improve the reliability and accuracy of BDE outputs. Additional improvements may be achieved by integrating auxiliary data sources, including IoT-enabled home appliances, real-time traffic data, very-high-resolution imagery, and structural health monitoring systems. The proposed stepwise framework enhances both the timeliness and the accuracy of building damage assessments while promoting a commonly shared understanding of disaster impacts among diverse stakeholders. It supports timely emergency response planning, resource allocation, and informed decision-making in the early stages of disaster management. Future research should expand the range of input datasets by incorporating these auxiliary sources to strengthen the robustness, scalability, and applicability of BDE methodologies in large-scale disaster contexts.

Author Contributions

S.K. contributed to the conceptualization of the research, methodology, data analysis, data visualization, and writing—original draft preparation as well as review and editing. C.P., S.F. and M.H. provided comments. S.T. and H.T. secured funding and provided comments. All authors have read and agreed to the published version of the manuscript.

Funding

This work was supported by the Council for Science, Technology and Innovation, Cross-ministerial Strategic Innovation Promotion Program, “Development of a Resilient Smart Network System against Natural Disasters” Grant Number JPJ012289 (funding agency: NIED).

Institutional Review Board Statement

Not applicable.

Informed Consent Statement

Not applicable.

Data Availability Statement

The original contributions presented in this study are included in the article. Further inquiries can be directed to the corresponding author.

Acknowledgments

We thank JAXA for providing BDE datasets. We also thank JX-press Corporation for supplying the social media data. We acknowledge the support of the Japan Real-time Information System for earthQuake (J-RISQ) in providing the presumed seismicity distribution and REBDE datasets for this research. We owe special thanks to Shohei Naito and Yoshinobu Mizui, NIED, for the valuable information provided by them. We are grateful to the Japan Meteorological Agency for providing the unified hypocenter catalog.

Conflicts of Interest

The authors declare no conflicts of interest.

References

  1. Ministry of Land, Infrastructure, Transport and Tourism. White Paper on Land, Infrastructure, Transport and Tourism in Japan; MLIT: Tokyo, Japan, 2011. [Google Scholar]
  2. Japan Broadcasting Corporation. Death by Crushing, Hypothermia, and Freezing. Available online: https://www3.nhk.or.jp/news/html/20240131/k10014341451000.html (accessed on 20 June 2025).
  3. National Research Institute for Earth Science and Disaster Resilience. About NIED. Available online: https://www.bosai.go.jp/e/about/ (accessed on 20 June 2025).
  4. Kinoshita, S. Kyoshin Net (K-NET). Seismol. Res. Lett. 1998, 69, 309–332. [Google Scholar] [CrossRef]
  5. Aoi, S.; Obara, K.; Hori, S.; Kasahara, K.; Okada, Y. New strong-motion observation network: KiK-net. EOS 2000, 81, F863. [Google Scholar]
  6. Fujiwara, H.; Nakamura, H.; Takahashi, I.; Senna, S.; Wakai, A.; Naito, S.; Morikawa, N.; Maeda, T.; Azuma, H.; Iwaki, A.; et al. Development of Real-time System for Earthquake Damage Information in Japan (J-RISQ); National Research Institute for Earth Science and Disaster Prevention (NIED): Tsukuba, Japan, 2019. [Google Scholar]
  7. Fujiwara, H.; Nakamura, H.; Senna, S.; Otani, H.; Tomii, N.; Ohtake, K.; Mori, T.; Kataoka, S. Development of a Real-Time Damage Estimation System. J. Disaster Res. 2019, 14, 315–332. [Google Scholar] [CrossRef]
  8. Japan Real-time Information System for earthQuake. Earthquake Early Warning. Available online: https://www.j-risq.bosai.go.jp/report/ (accessed on 20 June 2025).
  9. The Japan Building Disaster Prevention Association. Postearthquake Quick Inspection of Damaged Buildings. Available online: https://www.kenchiku-bosai.or.jp/files/2013/11/epanfall.pdf (accessed on 20 June 2025).
  10. Kumamoto Prefectural Government. Damage Report. Available online: https://www.pref.kumamoto.jp/uploaded/attachment/266620.pdf (accessed on 20 June 2025).
  11. Forest Agency. The 2011 Great East Japan Earthquake and Damage Situation. Available online: https://www.rinya.maff.go.jp/tohoku/koho/saigaijoho/attach/pdf/kinennsi-3.pdf (accessed on 20 June 2025).
  12. Ishikawa Prefecture. Damage Report 191: 14:00, 25 February 2024. Available online: https://www.pref.ishikawa.lg.jp/saigai/documents/higaihou_191_0225_1400.pdf (accessed on 20 June 2025).
  13. Tsuchimoto, K.; Narazaki, Y.; Spencer, B.F. Development and Validation of a Post-Earthquake Safety Assessment System for High-Rise Buildings Using Acceleration Measurements. Mathematics 2021, 9, 1758. [Google Scholar] [CrossRef]
  14. Giardina, G.; Macchiarulo, V.; Foroughnia, F.; Jones, J.N.; Whitworth, M.R.Z.; Voelker, B.; Milillo, P.; Penney, C.; Adams, K.; Kijewski-Correa, T. Combining remote sensing techniques and field surveys for post-earthquake reconnaissance missions. Bull. Earthq. Eng. 2024, 22, 3415–3439. [Google Scholar] [CrossRef]
  15. Casagli, N.; Intrieri, E.; Tofani, V.; Gigli, G.; Raspini, F. Landslide detection, monitoring and prediction with remote-sensing techniques. Nat. Rev. Earth Environ. 2023, 4, 51–64. [Google Scholar] [CrossRef]
  16. Japan Aerospace Exploration Agency. ALOS User Handbook; JAXA Earth Observation Research Center: Tsukuba, Japan, 2007. [Google Scholar]
  17. The National Aeronautics and Space Administration. What Is Synthetic Aperture Radar? Available online: https://www.earthdata.nasa.gov/learn/earth-observation-data-basics/sar (accessed on 20 June 2025).
  18. Kimijima, S.; Nagai, M. Monitoring Mining-Induced Geo-Hazards in a Contaminated Mountainous Region of Indonesia Using Satellite Imagery. Remote Sens. 2023, 15, 3436. [Google Scholar] [CrossRef]
  19. Kimijima, S.; Nagai, M. High Spatiotemporal Flood Monitoring Associated with Rapid Lake Shrinkage Using Planet Smallsat and Sentinel-1 Data. Remote Sens. 2023, 15, 1099. [Google Scholar] [CrossRef]
  20. Kimijima, S.; Nagai, M.; Wani, Z.M.; Bachriadi, D. Synergistic Impacts of Land Deformation and Rapid Socio-Ecological Changes on Disaster Risk in Indonesian Alluvial Plains Using Multiple Satellite Datasets. Remote Sens. 2025, 17, 1514. [Google Scholar] [CrossRef]
  21. Dong, L.G.; Shan, J. A comprehensive review of earthquake-induced building damage detection with remote sensing techniques. ISPRS J. Photogramm. Remote Sens. 2013, 84, 85–99. [Google Scholar] [CrossRef]
  22. Yamazaki, F. Extraction of Building Damage due to 2016 Kumamoto Earthquake from PALSAR-2 Data. In Proceedings of the 12th International Conference on Structural Safety and Reliability, Vienna, Austria, 6–10 August 2017. [Google Scholar]
  23. Chen, S.W.; Wang, X.S.; Sato, M. Urban Damage Level Mapping Based on Scattering Mechanism Investigation Using Fully Polarimetric SAR Data for the 3.11 East Japan Earthquake. IEEE Trans. Geosci. Remote Sens. 2016, 54, 6919–6929. [Google Scholar] [CrossRef]
  24. Bai, Y.; Adriano, B.; Mas, R.; Koshimura, S. Identifying Building Damage Patterns in the 2016 Meinong, Taiwan Earthquake Using Post-Event Dual-Polarimetric ALOS-2/PALSAR-2 Imagery. J. Disaster Res. 2018, 13, 291–302. [Google Scholar] [CrossRef]
  25. Liu, W.; Yamazaki, F. Extraction of Collapsed Buildings in the 2016 Kumamoto Earthquake Using Multi-Temporal PALSAR-2 Data. J. Disaster Res. 2017, 12, 241–250. [Google Scholar] [CrossRef]
  26. Matsuoka, M.; Nojima, N. Building Damage Estimation by Integration of Seismic Intensity Information and Satellite L-band SAR Imagery. Remote Sens. 2010, 2, 2111–2126. [Google Scholar] [CrossRef]
  27. Zhang, X.; Liu, W.; He, S. Urban Change Detection in TerraSAR Image Using the Difference Method and SAR Coherence Coefficient. J. Eng. Sci. Technol. Rev. 2018, 11, 18–23. [Google Scholar]
  28. Dong, Y.F.; Li, Q.; Dou, A.X.; Wang, X.Q. Extracting damages caused by the 2008 Ms 8.0 Wenchuan earthquake from SAR remote sensing data. J. Asian Earth Sci. 2010, 40, 907–914. [Google Scholar] [CrossRef]
  29. Kim, M.; Park, S.E.; Lee, S.J. Detection of Damaged Buildings Using Temporal SAR Data with Different Observation Modes. Remote Sens. 2023, 15, 308. [Google Scholar] [CrossRef]
  30. Ge, P.L.; Gokon, H.; Meguro, K. A review on synthetic aperture radar-based building damage assessment in disasters. Remote Sens. Environ. 2020, 240, 111693. [Google Scholar] [CrossRef]
  31. Gu, J.C.; Xie, Z.T.; Zhang, J.D.; He, X.H. Advances in Rapid Damage Identification Methods for Post-Disaster Regional Buildings Based on Remote Sensing Images: A Survey. Buildings 2024, 14, 898. [Google Scholar] [CrossRef]
  32. Matsuoka, M.; Yamazaki, F. Use of satellite SAR intensity imagery for detecting building areas damaged due to earthquakes. Earthq. Spectra 2004, 20, 975–994. [Google Scholar] [CrossRef]
  33. Matsuoka, M.; Yamazaki, F. Comparative analysis for detecting areas with building damage from several destructive earthquakes using satellite synthetic aperture radar images. J. Appl. Remote Sens. 2010, 4, 041867. [Google Scholar] [CrossRef]
  34. Zhang, R.; Li, H.; Duan, K.F.; You, S.C.; Liu, K.; Wang, F.T.; Hu, Y. Automatic Detection of Earthquake-Damaged Buildings by Integrating UAV Oblique Photography and Infrared Thermal Imaging. Remote Sens. 2020, 12, 2621. [Google Scholar] [CrossRef]
  35. Adriano, B.; Xia, J.S.; Baier, G.; Yokoya, N.; Koshimura, S. Multi-Source Data Fusion Based on Ensemble Learning for Rapid Building Damage Mapping during the 2018 Sulawesi Earthquake and Tsunami in Palu, Indonesia. Remote Sens. 2019, 11, 886. [Google Scholar] [CrossRef]
  36. Bai, Y.; Adriano, B.; Mas, E.; Koshimura, S. Machine Learning Based Building Damage Mapping from the ALOS-2/PALSAR-2 SAR Imagery: Case Study of 2016 Kumamoto Earthquake. J. Disaster Res. 2017, 12, 646–655. [Google Scholar] [CrossRef]
  37. Pang, L.; Sun, J.J.; Chi, Y.C.; Yang, Y.W.; Zhang, F.L.; Zhang, L. CD-TransUNet: A Hybrid Transformer Network for the Change Detection of Urban Buildings Using L-Band SAR Images. Sustainability 2022, 14, 9847. [Google Scholar] [CrossRef]
  38. UNOSAT Services. Available online: https://unosat.org/services (accessed on 20 June 2025).
  39. Federal Emergency Management Agency. Hazus Earthquake Model Technical Manual. Available online: https://www.fema.gov/sites/default/files/documents/fema_hazus-earthquake-model-technical-manual-5-1.pdf (accessed on 20 June 2025).
  40. European Union. Copernicus: Emergency Management Servic—Mapping. Available online: https://mapping.emergency.copernicus.eu/ (accessed on 20 June 2025).
  41. Japan Meteorological Agency. Information Regarding the Noto-Peninsula Earthquake in 2024. Available online: https://www.jma.go.jp/jma/press/2401/01a/kaisetsu202401011810.pdf (accessed on 20 June 2025).
  42. The National Aeronautics and Space Administration. Earthquake Lifts the Noto Peninsula. Available online: https://earthobservatory.nasa.gov/images/152350/earthquake-lifts-the-noto-peninsula (accessed on 20 June 2025).
  43. National Research Institute for Earth Science and Disaster Resilience. bosaiXview: 2024 Noto Peninsula Earthquake. Available online: https://xview.bosai.go.jp/view/index.html?appid=41a77b3dcf3846029206b86107877780 (accessed on 20 June 2025).
  44. Geospatial Information Authority of Japan. Information About the Noto Peninsula Earthquake. Available online: https://www.gsi.go.jp/BOUSAI/20240101_noto_earthquake.html (accessed on 20 June 2025).
  45. Ishikawa Prefecture. Damage Report. Available online: https://www.pref.ishikawa.lg.jp/saigai/202401jishin-taisakuhonbu.html (accessed on 20 June 2025).
  46. Ishikawa Prefecture. Damage Report 192: 14:00, 4 March 2024. Available online: https://www.pref.ishikawa.lg.jp/saigai/documents/higaihou_192_0304_1400.pdf (accessed on 20 June 2025).
  47. Cabinet Office. The 2024 Noto Peninsula Earthquake Damage Report. Available online: https://www.bousai.go.jp/updates/r60101notojishin/r60101notojishin/pdf/r60101notojishin_55.pdf (accessed on 20 June 2025).
  48. National Research Institute for Earth Science and Disaster Resilience. Hi-net Hypocenter Maps. Available online: https://www.hinet.bosai.go.jp/hypomap/?ft=1&LANG=en (accessed on 20 June 2025).
  49. Horie, K. Seismic Damage Assessment of Completely Collapsed Wooden Buldings in the Great Hanshin-Awaji Earthquake. J. Earthq. 2004, 38, 30–40. [Google Scholar]
  50. Murao, O.; Yamazaki, F. Development of Fragility Curves for Buildings Based on Damage Survey Data of a Local Government after the L995 Hyogoken−Nanbu Earthquake. J. Struct. Constr. Eng. 2000, 527, 189–196. [Google Scholar] [CrossRef]
  51. Murao, O.; Yamazaki, F. Building fragility curves for the 1995 Hyogoken0Nanbu earthquake based on CPIJ & AIJ’s survey results with detailed inventory. J. Struct. Constr. Eng. 2002, 555, 185–192. [Google Scholar]
  52. Cabinet Office. Damage Estimation Methodology for Tokyo Metropolitan Epicentral Earthquake. Available online: https://www.bousai.go.jp/jishin/syuto/pdf/shiryou3.pdf (accessed on 20 June 2025).
  53. Cabinet Office. Summary of Potential Damages and Approaches Toward the Great Nankai Trough Earthquake. Available online: https://www.bousai.go.jp/jishin/nankai/taisaku_wg/pdf/2_sanko2.pdf (accessed on 20 June 2025).
  54. Monma, N.; Nakamura, H.; Fujiwara, H.; Naito, S.; Shimomura, H.; Yamad, T. Construction of Spatial Information Database on Earthquake-induced Building Damage and Assessment of Building Damage Curves. In Proceedings of the 15th Japan Earthquake Engineering Symposium, Sendai, Japan, 6–8 December 2018. [Google Scholar]
  55. Midorikawa, S.; Ito, Y.; Miura, H. Vulnerability Functions of Buildings based on Damage Survey Data of Earthquakes after the 1995 Kobe Earthquake. J. Jpn. Assoc. Earthq. Eng. 2011, 11, 34–47. [Google Scholar] [CrossRef]
  56. Shimizu, S.; Fujiwara, H.; Nakamura, H.; Morikawa, N.; Saeki, T.; Komaru, Y.; Wakaura, M.; Tokizane, Y.; Hayakawa, Y. Study of the Fragility Function of the Response Spectrum based on the difinition of disaster victim certificate. Proc. Inst. Soc. Saf. Sci. 2016, 39, 19–20. [Google Scholar]
  57. ZENRIN Co., Ltd. Residential Map Database: Zmap-TOWNII. Available online: https://www.zenrin.co.jp/product/category/gis/basemap/zmaptown/index.html (accessed on 20 June 2025).
  58. Goda, K.; Yasuda, T.; Mori, N.; Muhammad, A.; De Risi, R.; De Luca, F. Uncertainty quantification of tsunami inundation in Kuroshio, Kochi Prefecture, Japan, using the Nankai-Tonankai megathrust rupture scenarios. Nat. Hazards Earth Syst. Sci. 2020, 20, 3039–3056. [Google Scholar] [CrossRef]
  59. Japan Real-Time Information System for earthQuake. The 2024 Noto Peninsula Earthquake Update: 2024/01/01 16:29:16 (UTC+9) Ver.3 Final Report. Available online: https://www.j-risq.bosai.go.jp/report/en/R-20240101161121-0132 (accessed on 20 June 2025).
  60. Japan Real-Time Information System for earthQuake. The 2024 Noto Peninsula Earthquake Update: 2024/01/03 18:40:54 (UTC+9) Ver.4 Final Report. Available online: https://www.j-risq.bosai.go.jp/report/en/R-20240101161121-0133 (accessed on 20 June 2025).
  61. Japan Aerospace Exploration Agency. About JAXA. Available online: https://global.jaxa.jp/about/index.html (accessed on 20 June 2025).
  62. Japan Aerospace Exploration Agency. Observation Results of the 2024 Noto Peninsula Earthquake by ALOS-2. Available online: https://www.eorc.jaxa.jp/ALOS/jp/library/disaster/dis_pal2_noto_earthquake_20240110_j.htm (accessed on 20 June 2025).
  63. Natsuaki, R.; Nagai, H.; Tomii, N.; Tadono, T. Sensitivity and Limitation in Damage Detection for Individual Buildings Using InSAR CoherenceA Case Study in 2016 Kumamoto Earthquakes. Remote Sens. 2018, 10, 245. [Google Scholar] [CrossRef]
  64. Grunthal, G.E. European Macroseismic Scale 1998; Centre Europeen de Geodynamique et de Seismologie: Luxembourg, 1998. [Google Scholar]
  65. Geospatial Information Authority of Japan. Vector-Format Feature Data. Available online: https://www.gsi.go.jp/kiban/ (accessed on 20 June 2025).
  66. JX-press corporation. DATA INTELLIGENCE PLATFORM. Available online: https://jxpress.net/ (accessed on 20 June 2025).
  67. JX-press corporation. FASTALERT. Available online: https://fastalert.jp/ (accessed on 20 June 2025).
  68. Google. Google Street View. Available online: https://maps.app.goo.gl/tZ6TUFCLK3vHGRZa7 (accessed on 20 June 2025).
  69. Ishikawa Prefecture. Damage Report 6: 21:30, 2 January 2024. Available online: https://www.pref.ishikawa.lg.jp/saigai/documents/202401022130higaihou.pdf (accessed on 20 June 2025).
  70. Japan Real-Time Information System for earthQuake. Kumamoto Earthquake Update: 2016/04/21 18:01:50 (UTC+9) Ver.9. Available online: https://www.j-risq.bosai.go.jp/report/en/R-20160416012514-0424 (accessed on 20 June 2025).
  71. Japan Real-Time Information System for earthQuake. The 2018 Hokkaido Eastren Iburi Earthquake Update: 2019/02/19 21:58:19 (UTC+9) Ver.8. Available online: https://www.j-risq.bosai.go.jp/report/en/R-20180906030811-0131 (accessed on 20 June 2025).
  72. Japan Real-Time Information System for earthQuake. 2021 Fukushima Earthquake Update: 2021/02/13 23:24:58 (UTC+9) Ver.6. Available online: https://www.j-risq.bosai.go.jp/report/en/R-20210213230811-0227 (accessed on 20 June 2025).
  73. Japan Real-Time Information System for earthQuake. 2022 Fukushima Earthquake Update: 2022/04/06 17:24:35 (UTC+9) Ver.8. Available online: https://www.j-risq.bosai.go.jp/report/en/R-20220316233451-0254 (accessed on 20 June 2025).
  74. Cabinet Office. Kumamoto Earthquake Update: 2019/04/12 18:00 (UTC+9) Ver.54. Available online: https://www.bousai.go.jp/updates/h280414jishin/pdf/h280414jishin_55.pdf (accessed on 20 June 2025).
  75. Hokkaido Government. The 2018 Hokkaido Eastren Iburi Earthquake Update: 2024/08/01 Ver.126. Available online: https://www.pref.hokkaido.lg.jp/fs/1/0/6/3/8/0/1/1/_/%E5%B9%B3%E6%88%9030%E5%B9%B4%E8%83%86%E6%8C%AF%E6%9D%B1%E9%83%A8%E5%9C%B0%E9%9C%87%E3%81%AB%E3%82%88%E3%82%8B%E8%A2%AB%E5%AE%B3%E7%8A%B6%E6%B3%81%E7%AD%89(%E7%AC%AC126%E5%A0%B1).pdf (accessed on 20 June 2025).
  76. Fire and Disaster Management Agency. 2021 Fukushima Earthquake Update: 2022/11/18 17:00 (UTC+9) Ver.20. Available online: https://www.fdma.go.jp/disaster/info/items/6613c8ca1e09424cb4303b357dcac400abdc6231.pdf (accessed on 20 June 2025).
  77. Cabinet Office. 2022 Fukushima Earthquake Update: 2022/04/19 10:00 (UTC+9). Available online: https://www.bousai.go.jp/updates/r4fukushima_eq_0317/pdf/r4fukushima_eq_0317_08.pdf (accessed on 20 June 2025).
  78. Taguchi, H.; Ishimaru, K.; Kudo, T.; Ping, C.; Sakai, N.; Rokugawa, S. Towards the Practical Use of Satellite Remote Sensing in Disaster Response—Development of Satellite One-Stop System and its Social Implementation. 2023, pp. 1–170. Available online: https://nied-repo.bosai.go.jp/records/6525 (accessed on 20 June 2025).
  79. Ministry of Internal Affairs and Communications. Information Related to the 2024 Noto Peninsula Earthquake. Available online: https://www.soumu.go.jp/menu_kyotsuu/important/index.html (accessed on 20 June 2025).
  80. Seneviratne, K.; Nadeeshani, M.; Senaratne, S.; Perera, S. Use of Social Media in Disaster Management: Challenges and Strategies. Sustainability 2024, 16, 4824. [Google Scholar] [CrossRef]
  81. Acikara, T.; Xia, B.; Yigitcanlar, T.; Hon, C. Contribution of Social Media Analytics to Disaster Response Effectiveness: A Systematic Review of the Literature. Sustainability 2023, 15, 8860. [Google Scholar] [CrossRef]
  82. Hokuriku Electric Power Transmission & Distribution Company. Press Release Emergency: Disasters and Power Outages. Available online: https://www.rikuden.co.jp/press/saigai.html (accessed on 3 January 2024).
  83. Toride, S.; Sato, K. The Research and Development of Phase-Free Disaster Risk Reduction Communication Utilizing IoT Home Appliances; Public Relations Association for Social Sector: Tokyo, Japan, 2023. [Google Scholar]
  84. Toride, S.; Fujita, S.; Kimijima, S.; Borjigin, H.; Taguchi, H. Phase-Free Disaster Prevention Solutions Utilizing Existing IoT Products -SIP Phase 3 Development of a Resilient Smart Network System Against Natural Disasters; The Institute of Image Information and Television Engineers: Osaka, Japan, 2025; pp. 51–54. [Google Scholar]
  85. Wang, C.; Qiu, X.; Huan, H.; Wang, S.; Zhang, Y.; Chen, X.H.; He, W. Earthquake-Damaged Buildings Detection in Very High-Resolution Remote Sensing Images Based on Object Context and Boundary Enhanced Loss. Remote Sens. 2021, 13, 3119. [Google Scholar] [CrossRef]
  86. López-Castro, B.; Haro-Baez, A.G.; Arcos-Aviles, D.; Barreno-Riera, M.; Landázuri-Avilés, B. A Systematic Review of Structural Health Monitoring Systems to Strengthen Post-Earthquake Assessment Procedures. Sensors 2022, 22, 9206. [Google Scholar] [CrossRef]
  87. Kawata, Y. An Overview of the Key Challenges Associated with Large-Scale National Disasters. Available online: https://www.scj.go.jp/ja/event/pdf3/330-s-1022-2-s2.pdf (accessed on 20 June 2025).
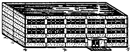
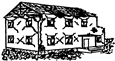
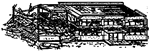
Figure 1. Overall methodological workflow. The numbered steps in the figure correspond to the specific objectives outlined in the Introduction. The methods applied in each step are detailed in the subsequent sections.
Remotesensing 17 02638 g001
Figure 2. Study area of the 2024 Noto Peninsula Earthquake. (a) Overview of the study area. (b) Circles indicate aftershocks exceeding M3, from 1 to 31 January 2024 [48].
Remotesensing 17 02638 g002
Figure 3. REBDE: (a) Overview of the study area overlaid with the presumed seismicity distribution. (b) REBDE output, with red areas indicating regions of significant damage, is shown in detail in (ch). (ch) Enlarged views of high-damage areas highlighted in red in panel (b).
Remotesensing 17 02638 g003
Figure 4. Estimated building damage. (a) Damaged buildings estimated from imagery acquired on 1 January 2024 (descending pass), overlaid with the presumed seismicity distribution; (b) damaged buildings estimated from imagery acquired on 2 January 2024 (ascending pass); (c) observation coverage for 1 January 2024 (red) and 2 January 2024 (blue).
Remotesensing 17 02638 g004
Figure 5. Example of integration of REBDE and ALOS-2-BDE data. (a) REBDE data overlaid with ALOS-2-BDE data. The labels ①–③, ⑤ represent a cell with ALOS-2-BDE data. The label ④ represents a cell without ALOS-2-BDE data. The label ⑥ represents a cell without REBDE data. (b) Integrated-BDE data.
Remotesensing 17 02638 g005
Figure 6. Number of damaged buildings (full, half, or partial collapse) by municipalities reported between 1 January 2024 and 4 March 2025.
Remotesensing 17 02638 g006
Figure 7. Comparison of spatial distribution results. (a) Overview of the study area overlaid with REBDE results. (bg) and ①–③ in panel (a) indicate key regions examined in detail in panels (bg) and ①–③. (b,c) Areas corresponding to key pattern (1). (d,e) Areas corresponding to key pattern (2). (f,g) Areas corresponding to key pattern (3). ① Field photograph of the location shown in panel (c). ② Field photograph of the location shown in panel (d). ③ Google Street View imagery of the location shown in panel (f) [68].
Remotesensing 17 02638 g007
Figure 8. Comparison of results of (a) REBDE and (b) integrated-BDE.
Remotesensing 17 02638 g008
Figure 9. Breakdown of damaged building counts (full or half collapse) in timeline by municipality.
Remotesensing 17 02638 g009
Figure 10. Time-scaled BDE results overlaid with FASTALERT real-time risk information. (a) REBDE data released at 16:29 JST on 1 January 2024. (b) Integrated-BDE overlaid with building damage-related FASTALERT posts. (cf) and ①–④ in panel (b) indicate the spatial and temporal locations of FASTALERT posts recorded between 16:30 JST on 1 January and 18:00 JST on 2 January 2024. ① FASTALERT post corresponding to panel (c); ② corresponding to (d); ③ corresponding to (e); and ④ corresponding to (f). JST in ①–④ indicates the original posting times of the users.
Remotesensing 17 02638 g010
Figure 11. Stepwise estimation framework for earthquake-induced building damage and its applications.
Remotesensing 17 02638 g011
Table 1. Classification of damage to masonry and reinforced buildings [64].
Masonry BuildingsReinforced BuildingsClassification of Damages
Remotesensing 17 02638 i001Remotesensing 17 02638 i002Grade 1: Negligible to slight damage
(no structural damage, slight non-structural damage)
Remotesensing 17 02638 i003Remotesensing 17 02638 i004Grade 2: Moderate damage
(slight structural damage, moderate non-structural damage)
Remotesensing 17 02638 i005Remotesensing 17 02638 i006Grade 3: Substantial to heavy damage
(moderate structural damage, heavy non-structural damage)
Remotesensing 17 02638 i007Remotesensing 17 02638 i008Grade 4: Very heavy damage
(heavy structural damage, very heavy non-structural damage)
Remotesensing 17 02638 i009Remotesensing 17 02638 i010
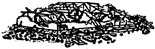
Grade 5: Destruction
(very heavy structural damage)
Table 2. Human casualties and building damages from the 2024 Noto Peninsula Earthquake in the study area (as of 4 March 2025).
MunicipalityHuman CasualtiesBuilding Damage Level (Residential)
FatalitiesMissingInjuredTotalFullHalfPartialTotal
Disaster-Related DeathSevereMinor
Nanao4439 34381515495111,26216,728
Wajima19695221330371423073951432110,579
Suzu15760 472024061754208917555598
Shika1917 1997135562247044197451
Anamizu4626 33225304387128916473323
Noto5351 292510726999145055765
Total51528823758551747579415,74127,90950,127
Table 3. Main specifications of the data used in this study.
Estimation Results/
Information/Data
Issued/Acquisition Date (dd/mm/yyyy)Spatial Res. (m)Method/Operational Mode (Polarization)Agency
Presumed seismicity distribution1 January 2024250NIED [3]
Real-time BDE1 January 2024250CDMC 2012
Fully and half-collapsed
NIED [3]
ALOS-2-based BDE1 January 2024
2 January 2024
Stripmap mode
Horizontal–Horizontal polarization
JAXA [61]
Official damage report1 January 2024–
4 March 2025
Ishikawa Prefectural Government [45]
Residence building data2023Zenrin [57]
FASTALERT real-time risk information in Japan1–14 January 2024JX-press Corporation [66]
Table 4. Comparison of damaged residential building counts and MAPE.
1 January 20242 January 20244 March 2025
Seismic Intensity > 6 UpperREBDEALOS-2-BDEIntegrated-BDEOfficial Report
Wajima5925 (–)9807 (–)3443 (–)6028 (–)6133
Suzu7014 (–)10,064 (–)1481 * (–)7414 * (–)3744
Nanao6344 (–)9660 (–)1215 (7)3348 (7)3469
Anamizu3990 (–)4690 (–)301 (16)1731 (16)1686
Noto-cho1749 (–)4324 (–)698 (–)1365 (–)1148
Total25,022 (–)38,546 (–)7138 (23)19,886 (23)16,180
MAPE (%) 172.458.125.0
Note: Values in parentheses in the REBDE, ALOS-2-BDE, and integrated-BDE columns indicate the corresponding official building damage counts reported by the Ishikawa Prefectural Government for that date. “–” indicates that the official count was not available for that day [69]. * The eastern part of Suzu was not covered in ALOS-2 acquisition (Figure 4c).
Table 5. Distribution of building damage-related social media information by municipality and date (%).
1 January 20242 January 20243 January 2024Grand Total
Anamizu3.83.87.7
Nanao9.613.51.925.0
Noto-cho3.89.613.5
Suzu5.85.811.5
Wajima30.89.61.942.3
Grand Total (n = 52)53.842.33.8100.0
Note: All values are presented as percentages. “—” indicates no reported cases on that day.
Table 6. Estimated national-level earthquakes occurring within the next 30 years in Japan [87].
Earthquake NameScale (M)Probability of Occurrence (30 Years>)Seismic Intensity (SI)Number of Affected PopulationDeaths
(Thousands)
Debris (Million Tons)Damage
(Trillion JPY)
Tokyo Metropolitan7.370%725.4M (SI 6L>)239895
Nankai Trough9.070–80%740.7M (SI 6L>)231310220
Japan Trench/
Chishima Trench
9.1/9.360%7Earthquake: 272 Municipalities
Tsunami: 108 Municipalities
199/10011048
Disclaimer/Publisher’s Note: The statements, opinions and data contained in all publications are solely those of the individual author(s) and contributor(s) and not of MDPI and/or the editor(s). MDPI and/or the editor(s) disclaim responsibility for any injury to people or property resulting from any ideas, methods, instructions or products referred to in the content.

