
Fine Recognition of MEO SAR Ship Targets Based on a Multi-Level Focusing-Classification Strategy

 , ,
, ,
Abstract

1. Introduction
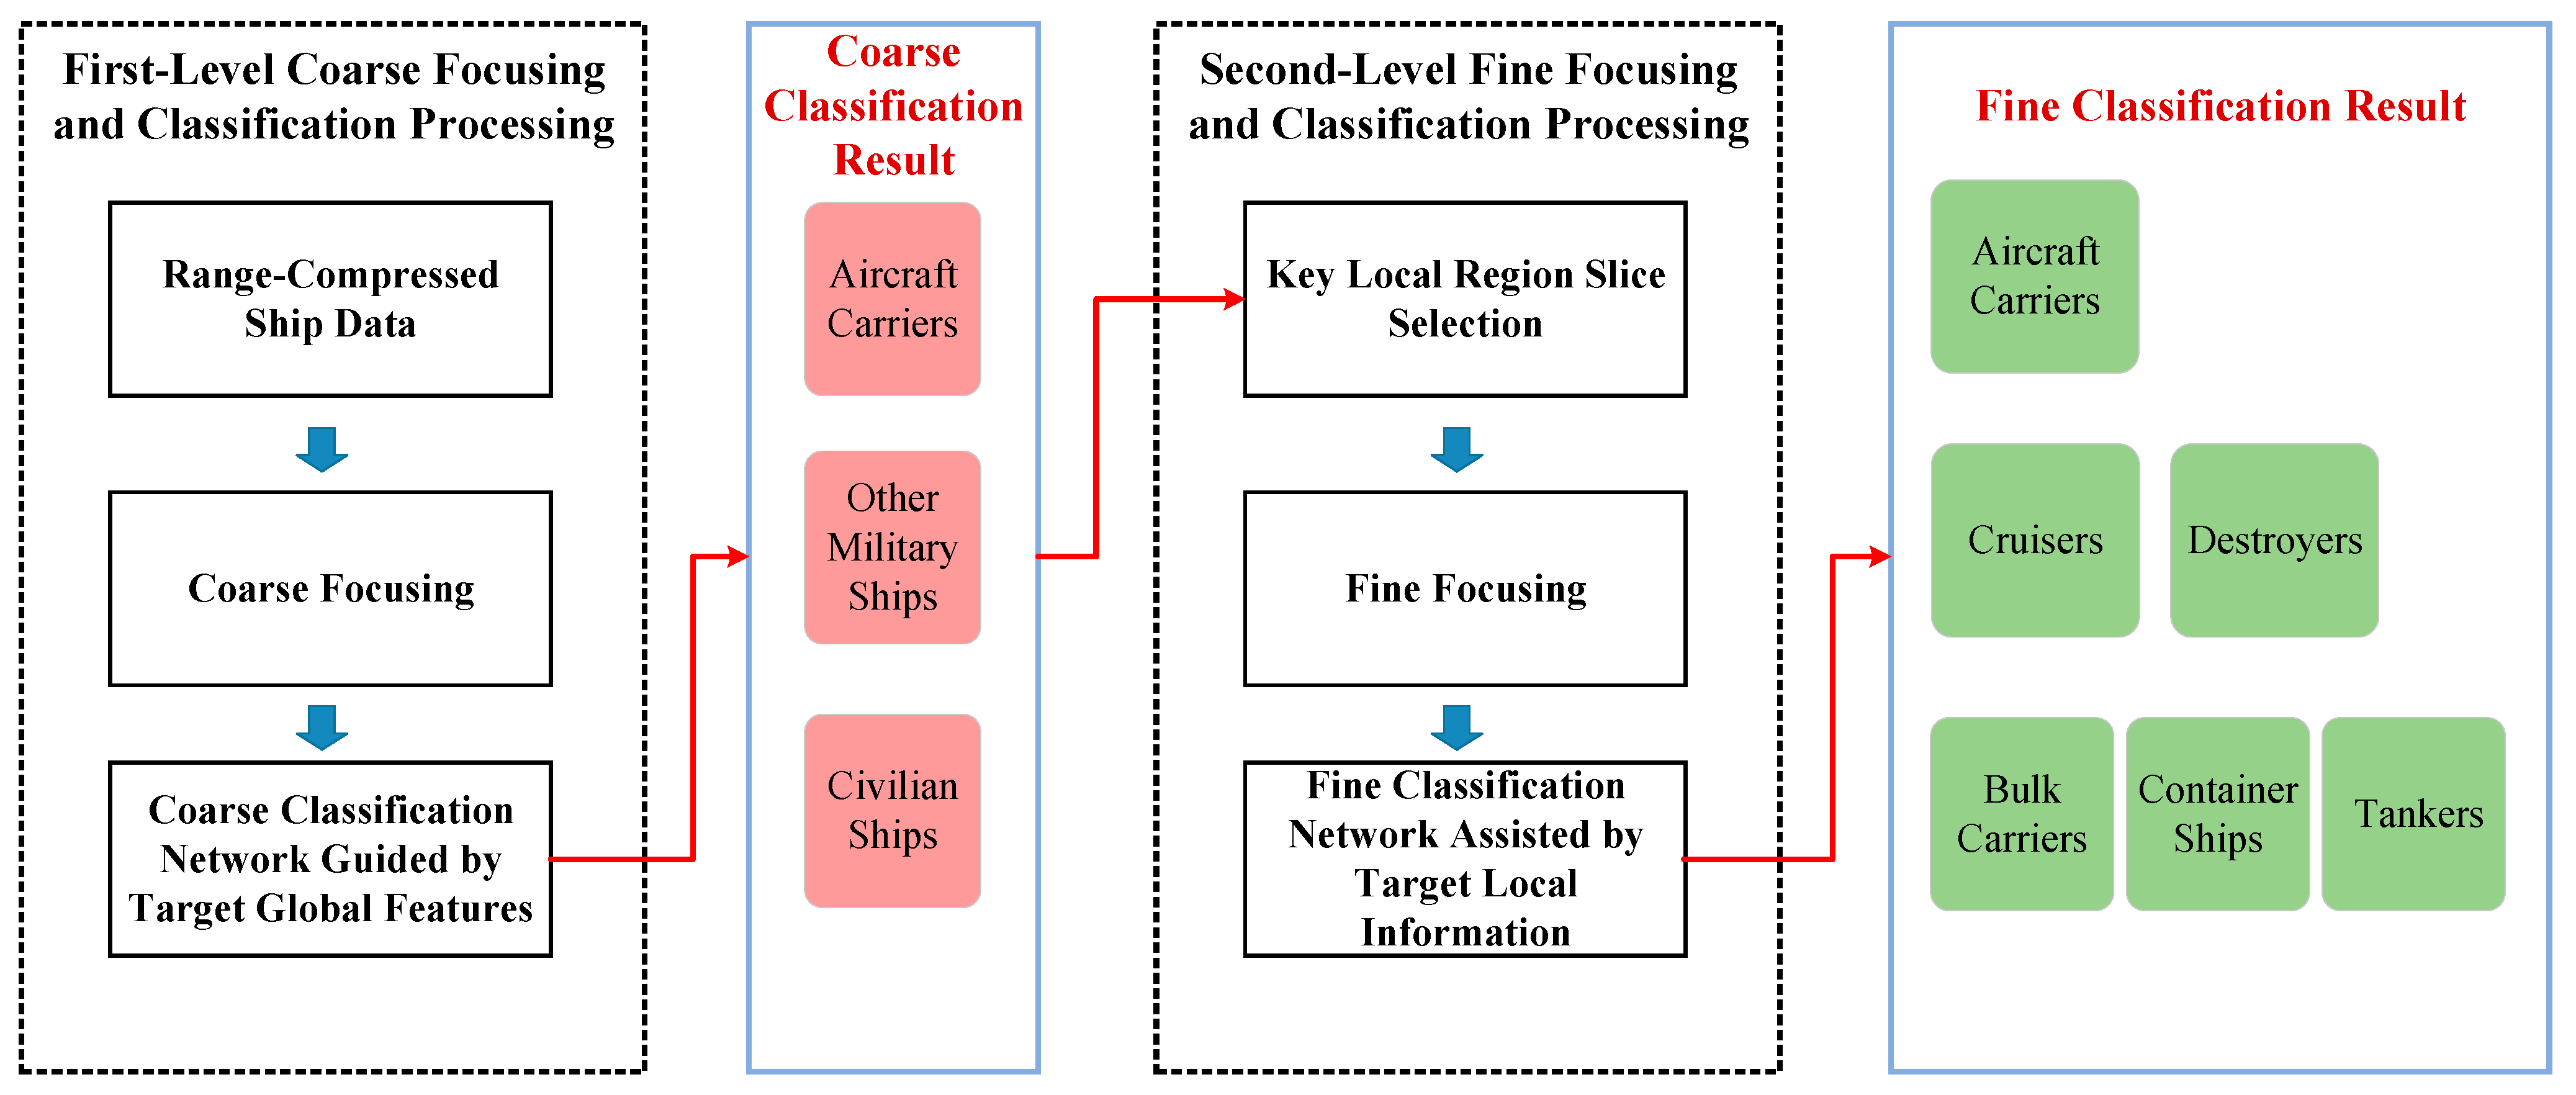
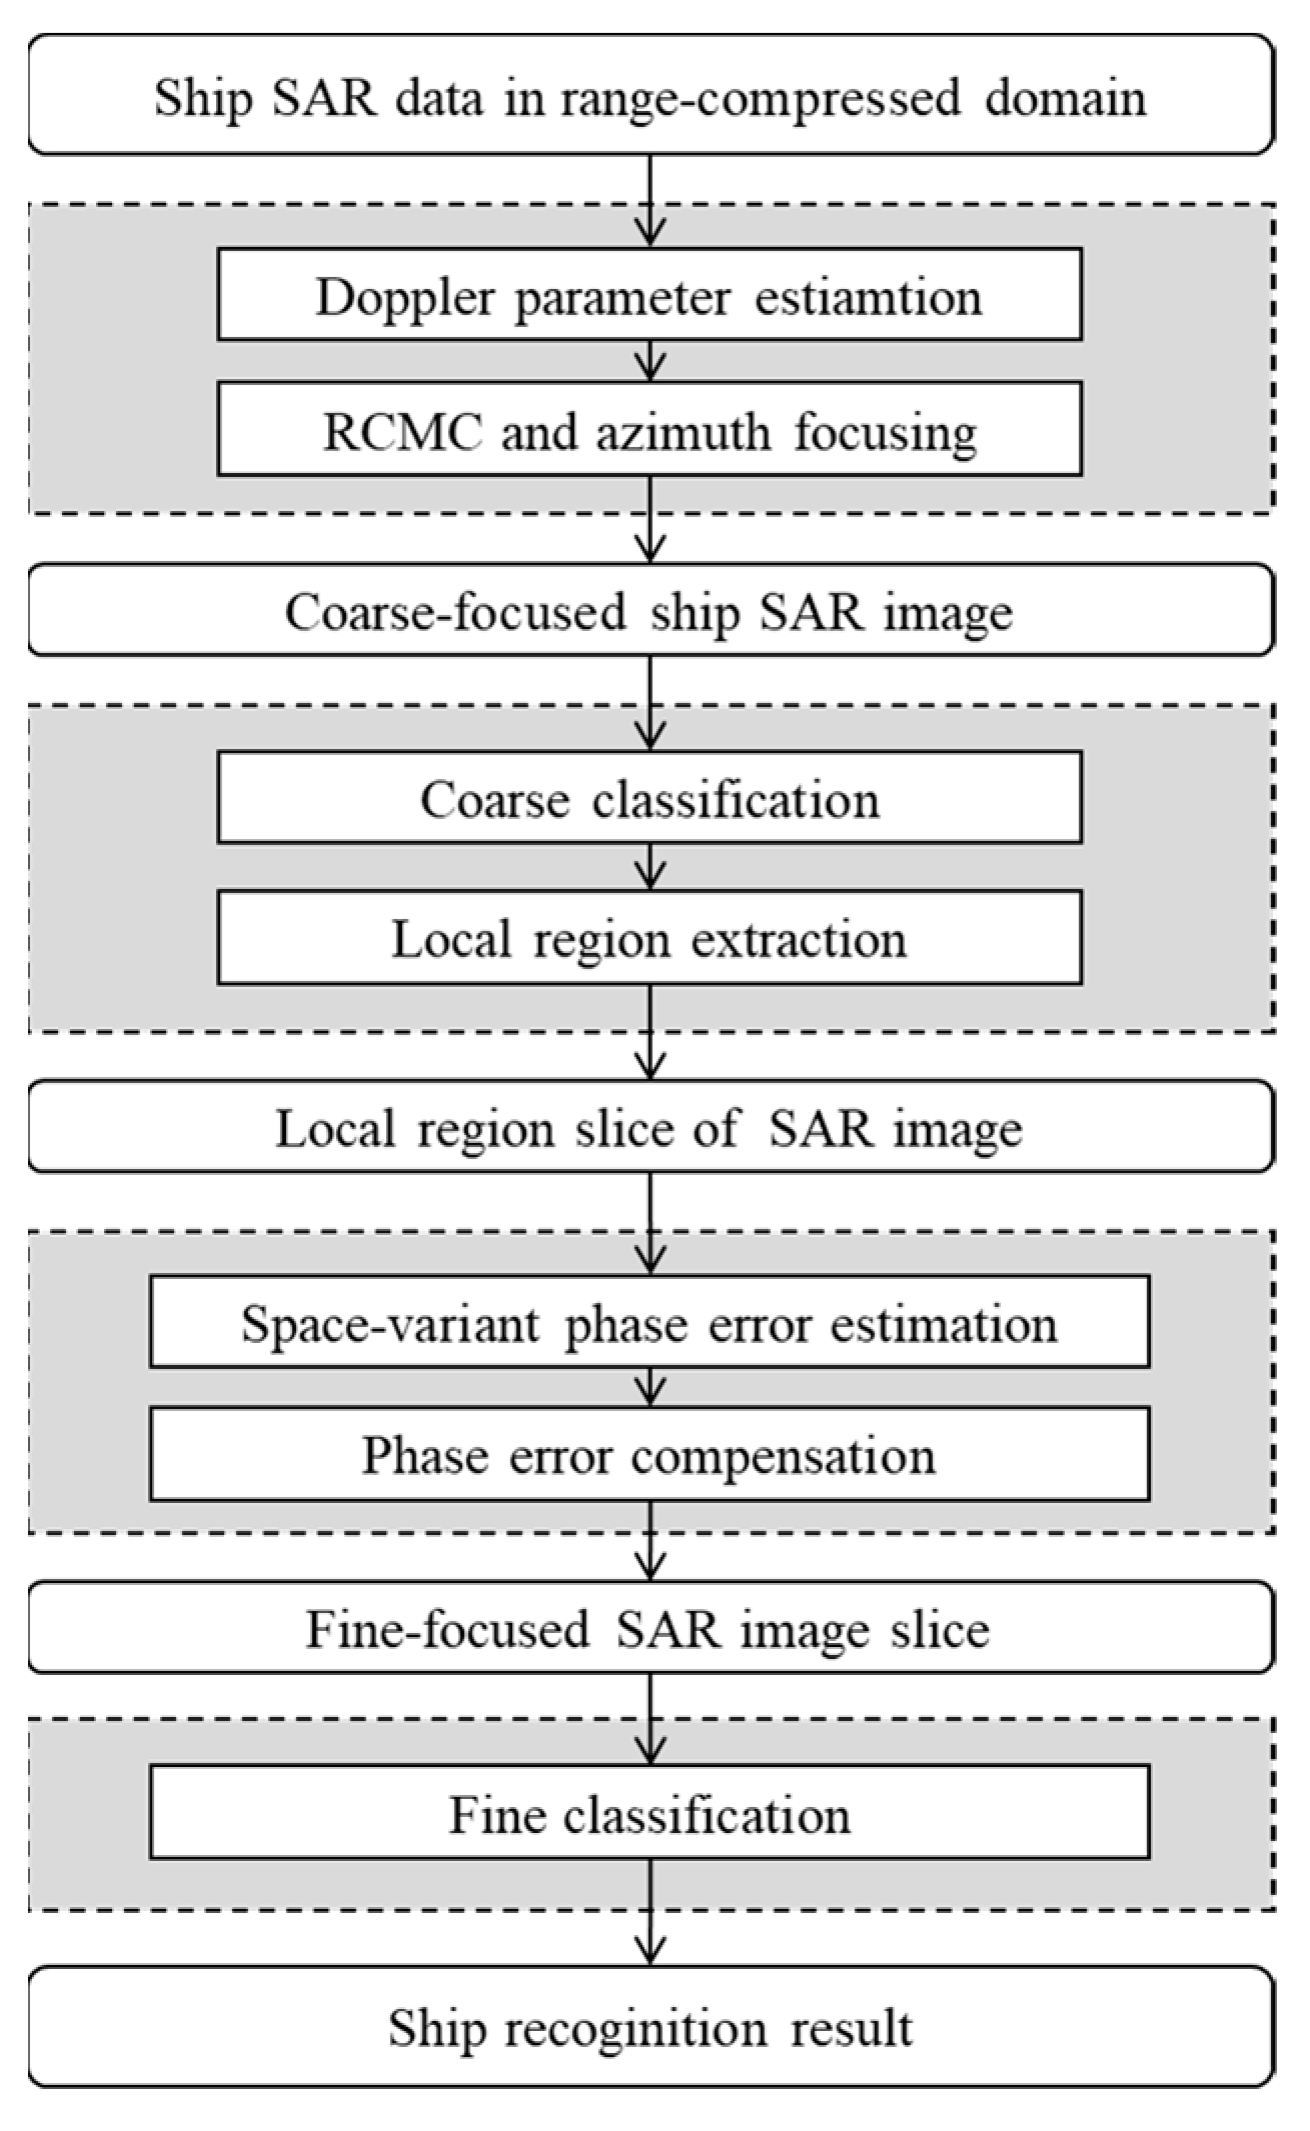
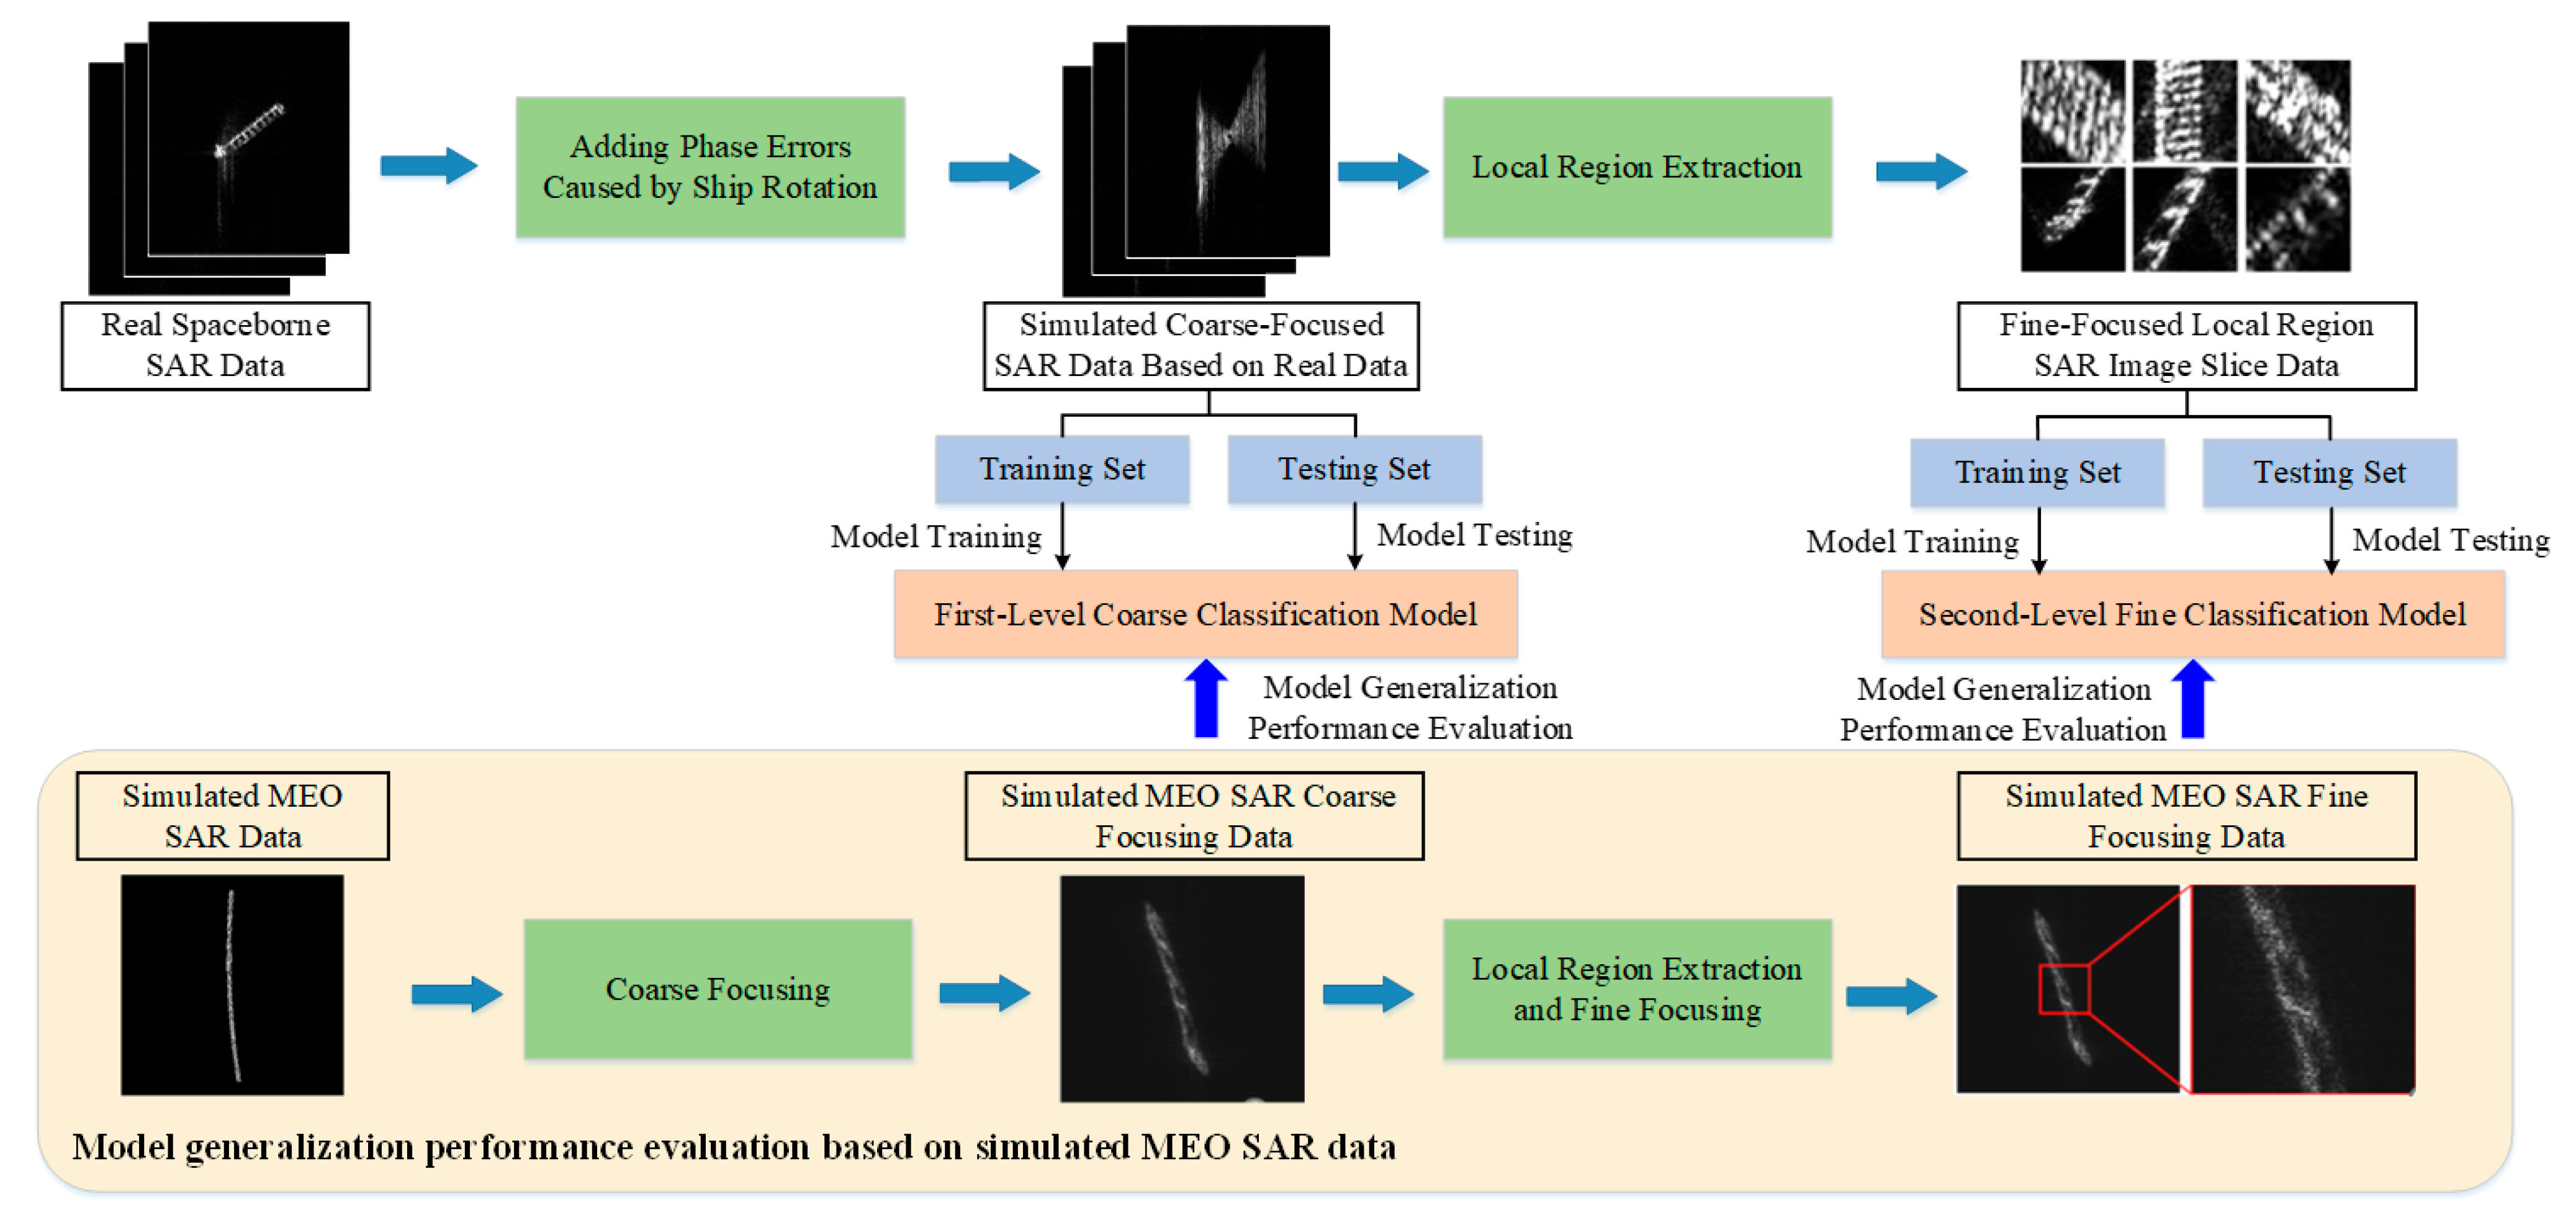
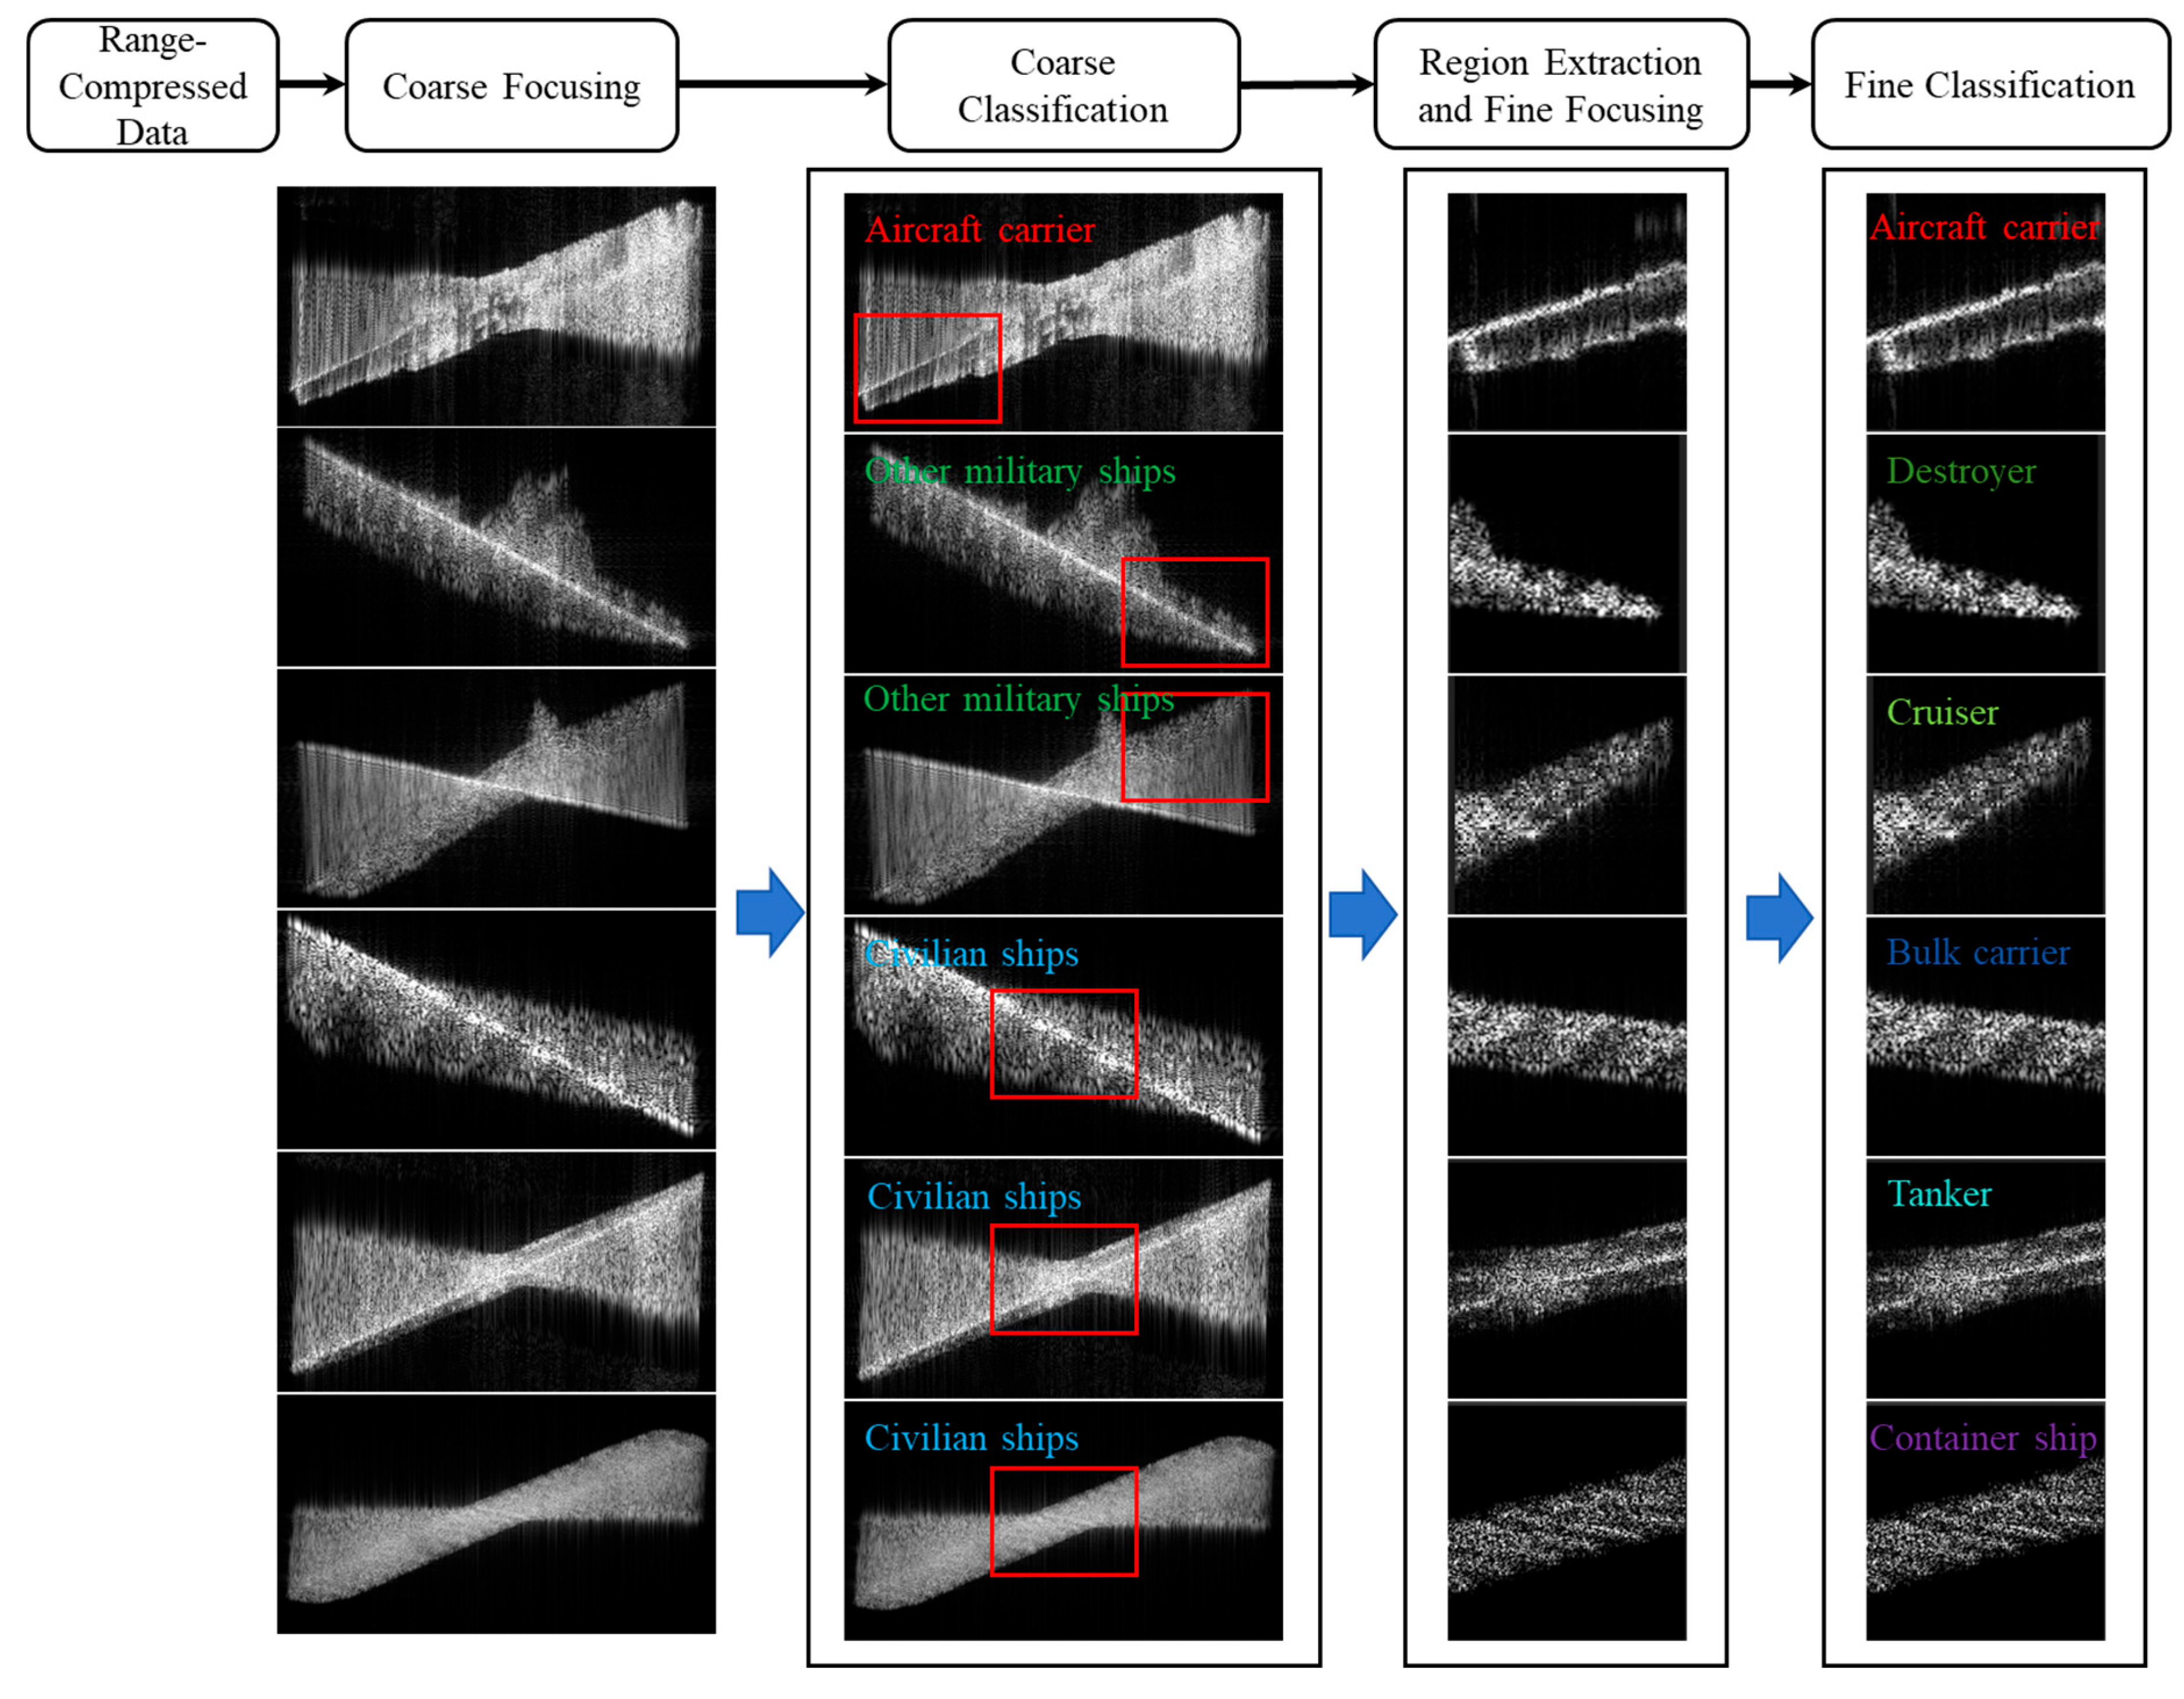
- (1)
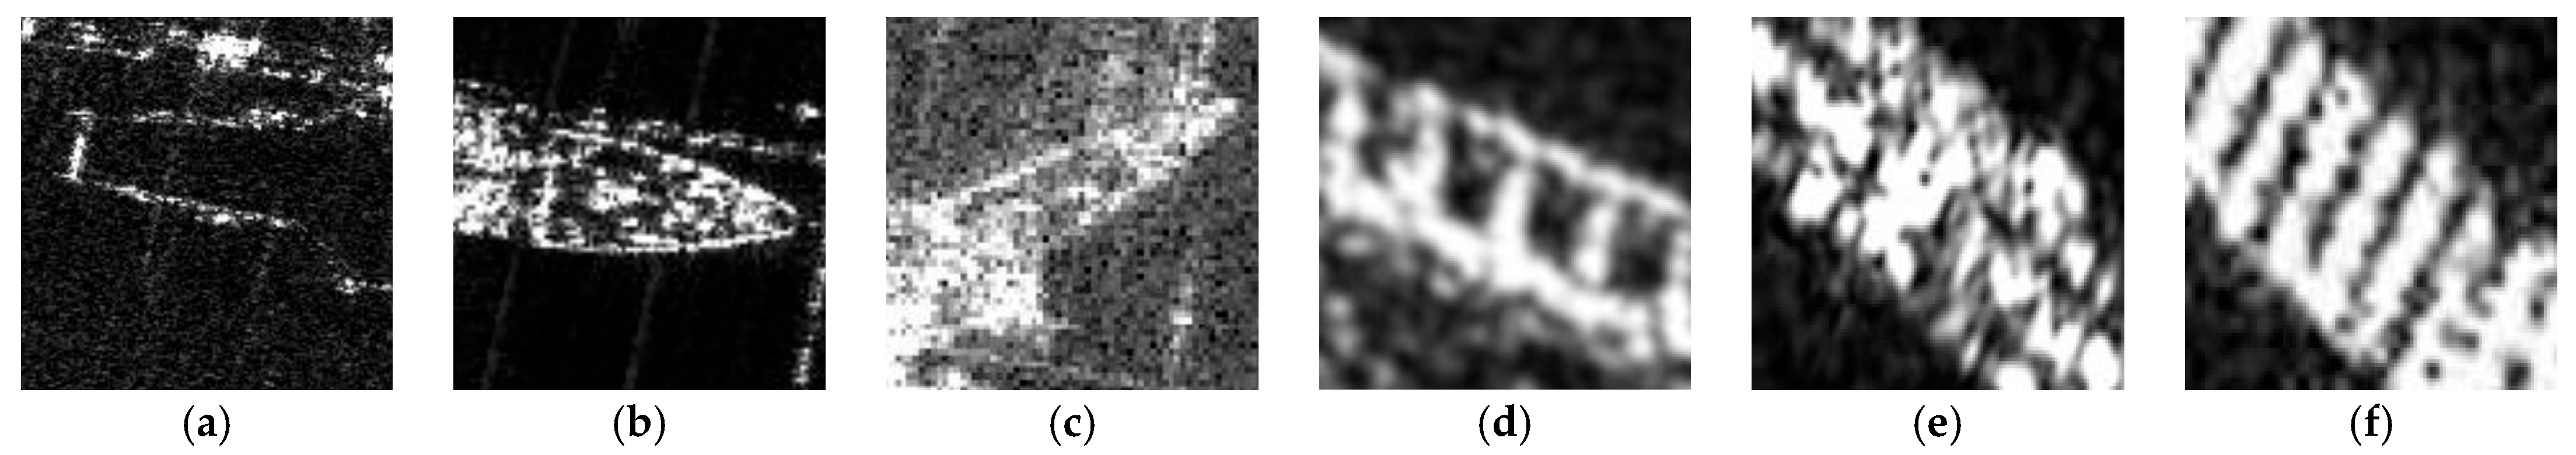
- Coarse focusing: Ship targets are coarsely focused on by estimated Doppler parameters. Motion errors induced by target sailing velocity are compensated for in this step.
- (2)
- Coarse classification: Each coarsely focused ship image is input into the coarse classification network to complete the classification of major target categories, including aircraft carriers, other military ships, and civilian ships.
- (3)
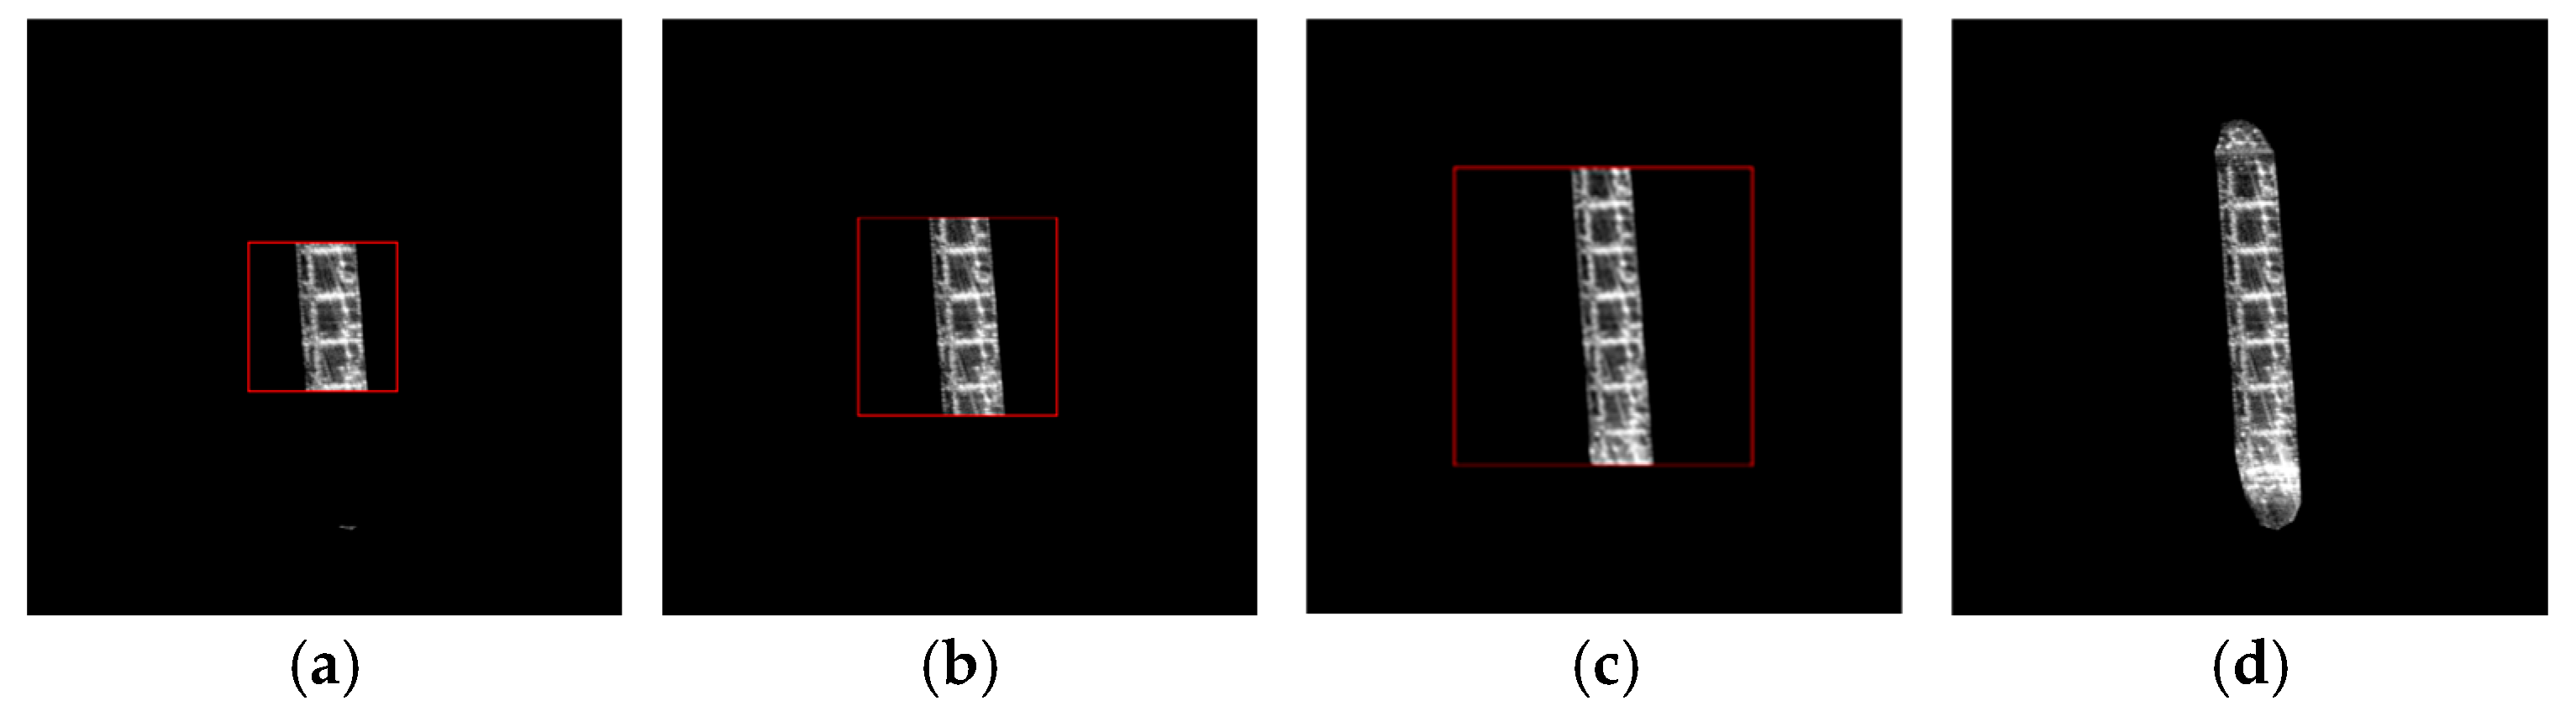
- Fine refocusing: The local region slice of the ship target image is extracted and fine-refocused by estimating and compensating for spatially varying higher-order motion errors.
- (4)
- Fine classification: The finely-focused image slice is input into the fine classification network to achieve fine recognition of specific target categories.
2. Signal Modeling and Characteristic Analysis of MEO SAR Ships
2.1. Signal Model Establishment
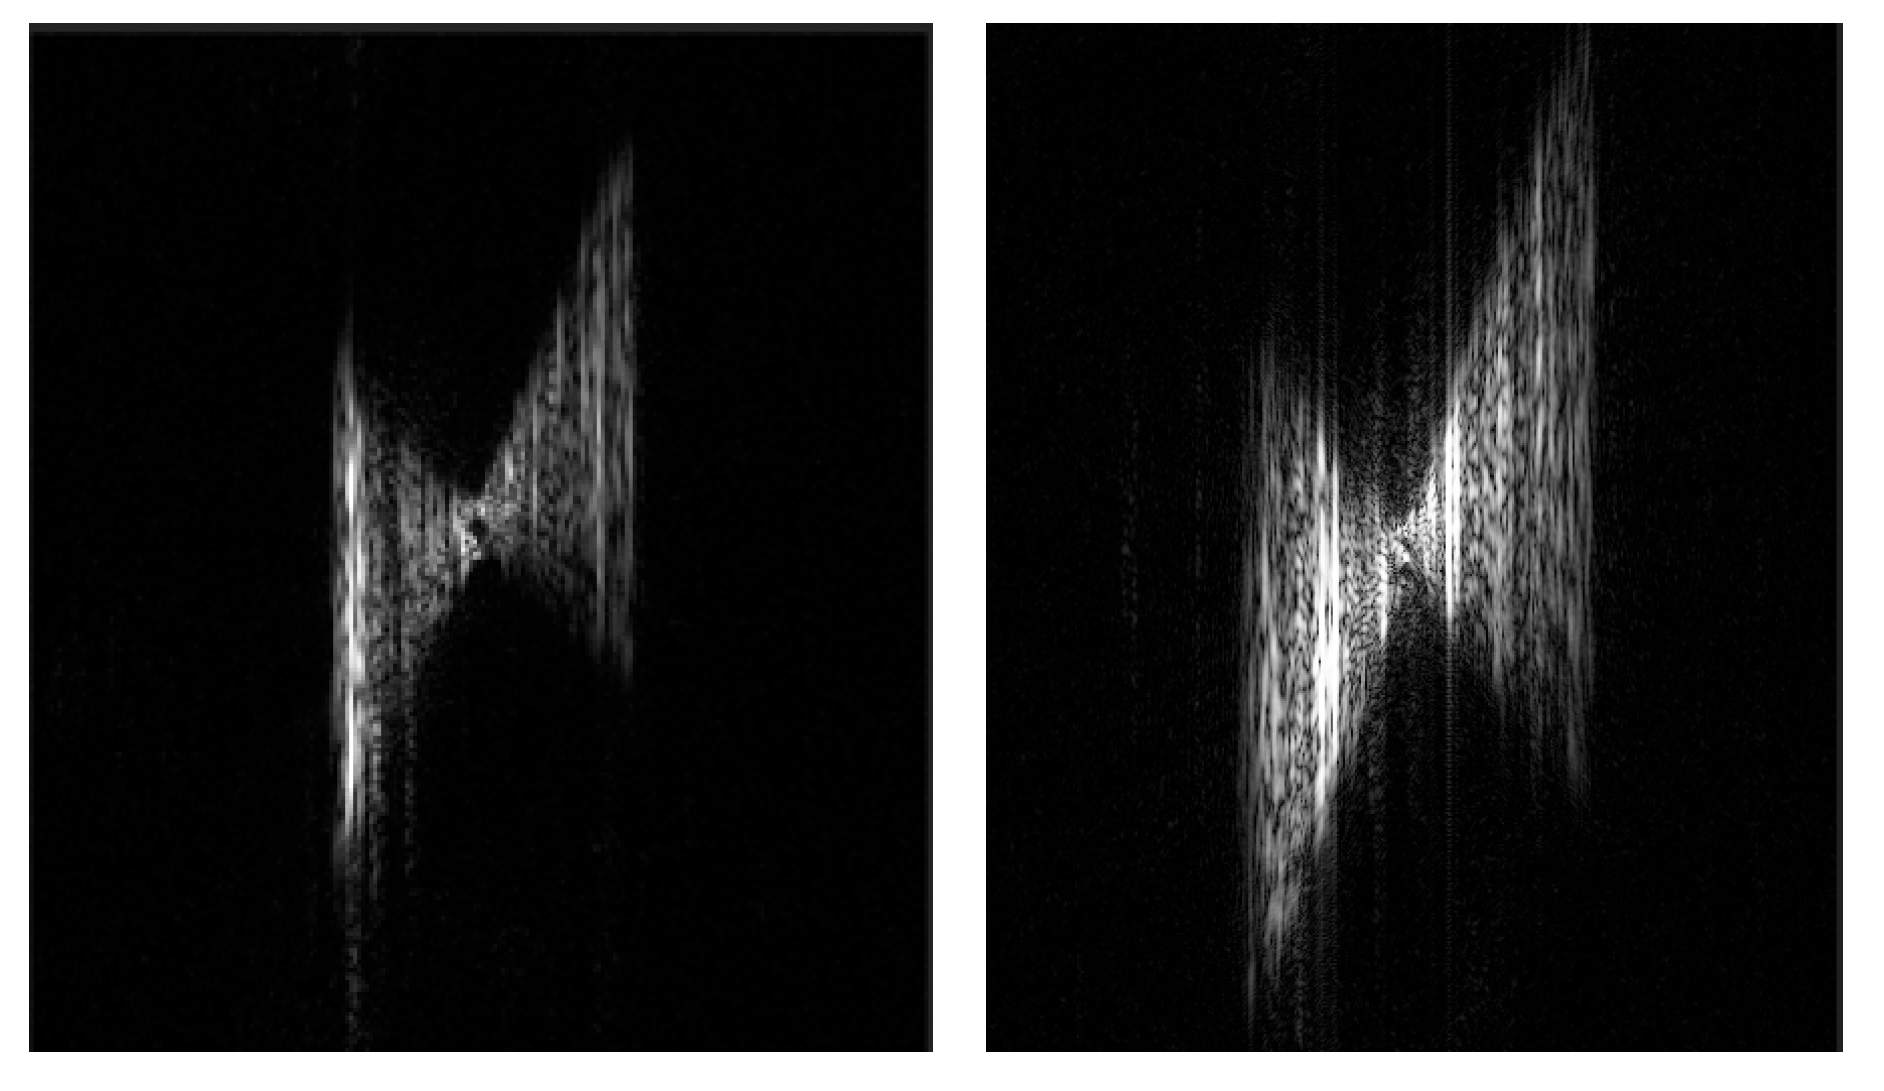
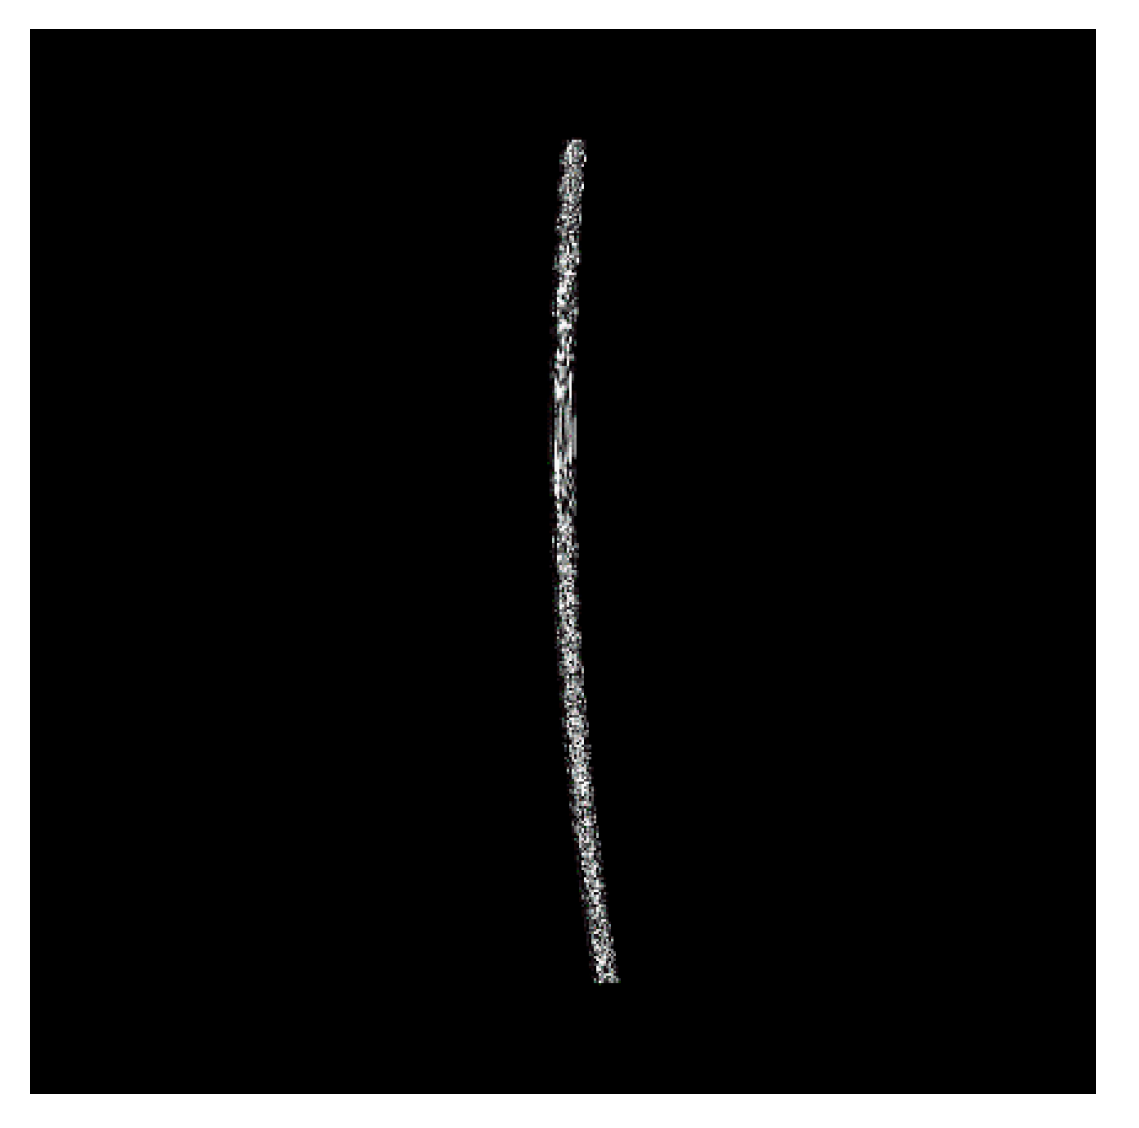
2.2. MEO SAR Image Defocusing Caused by Ship Sailing
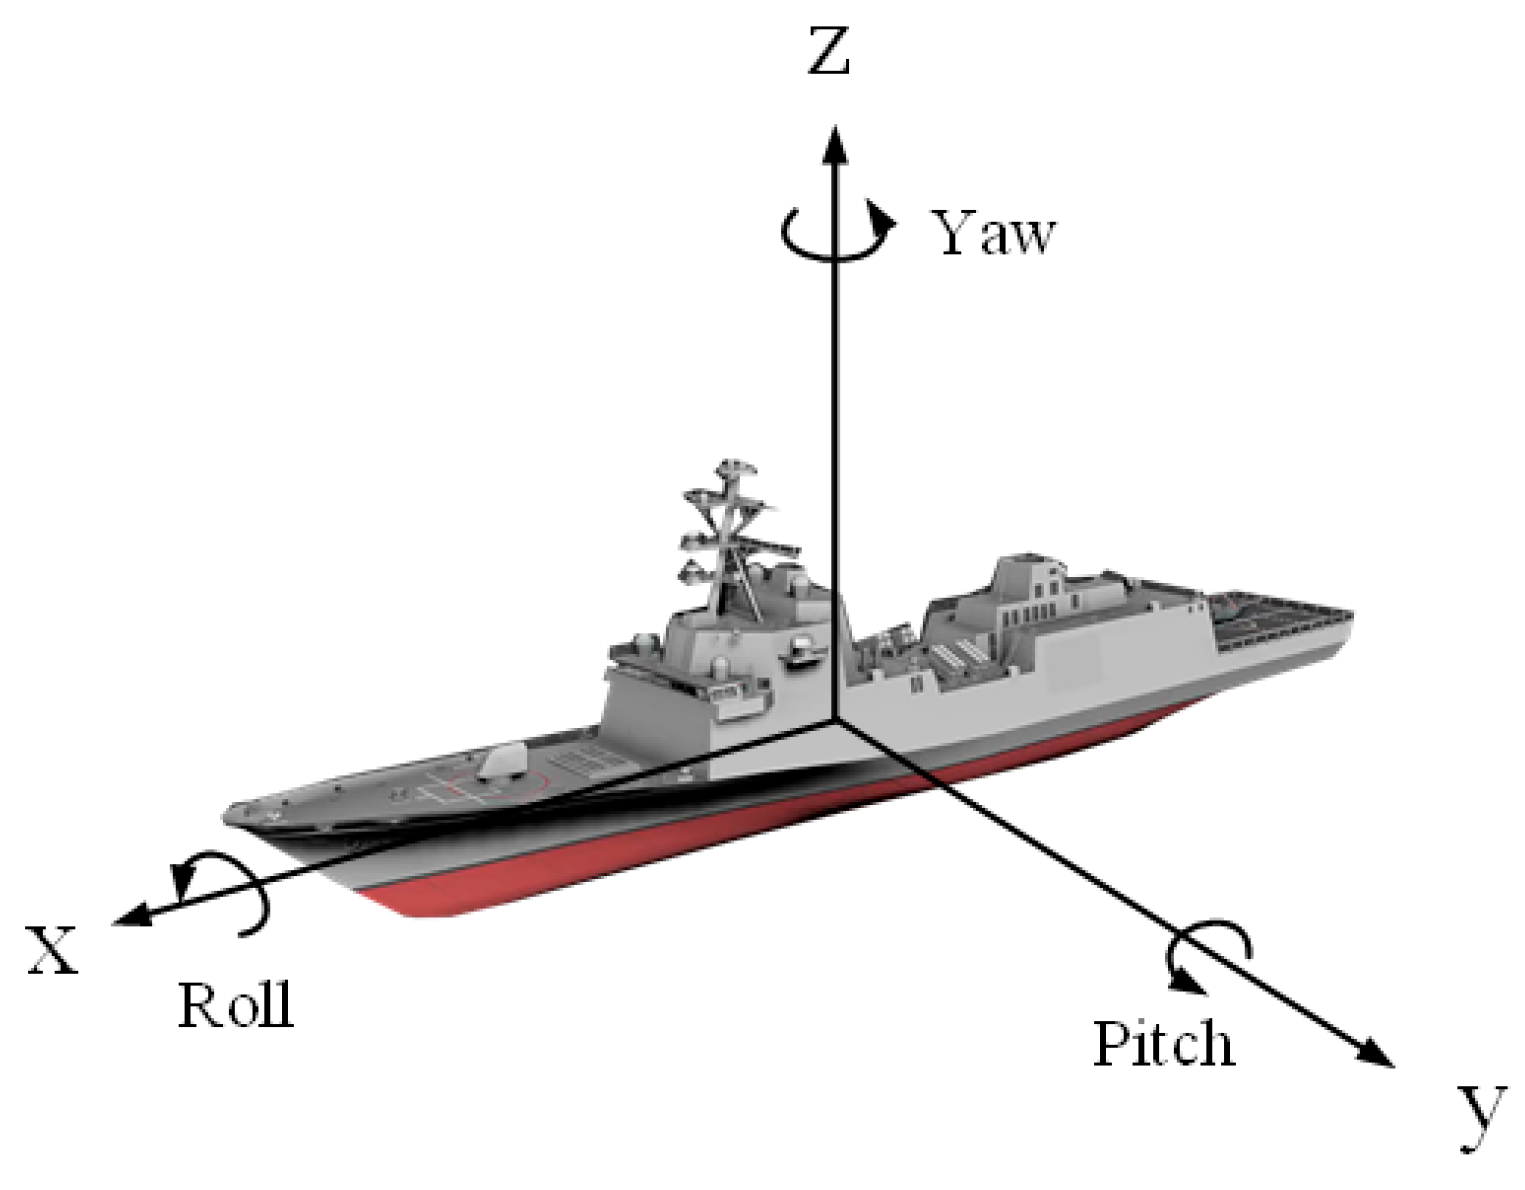
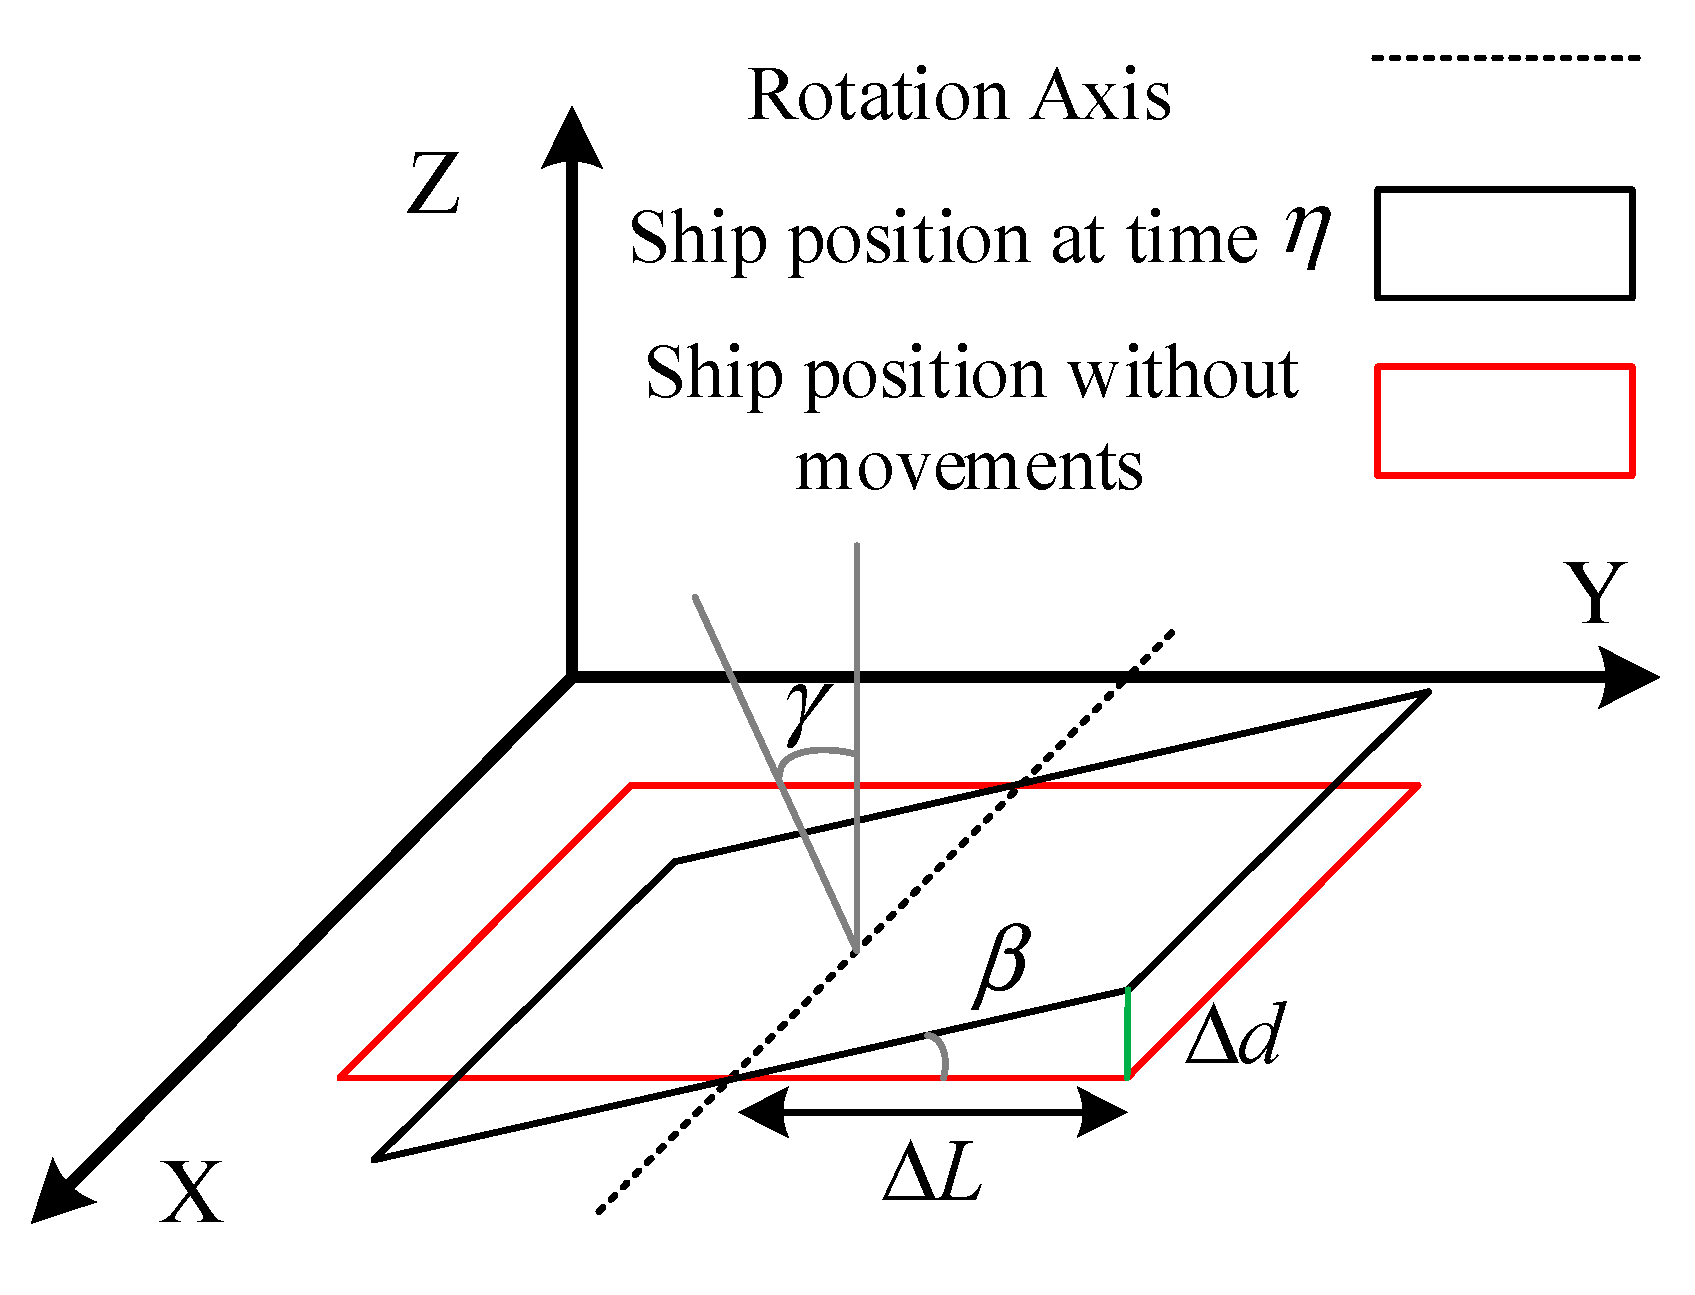
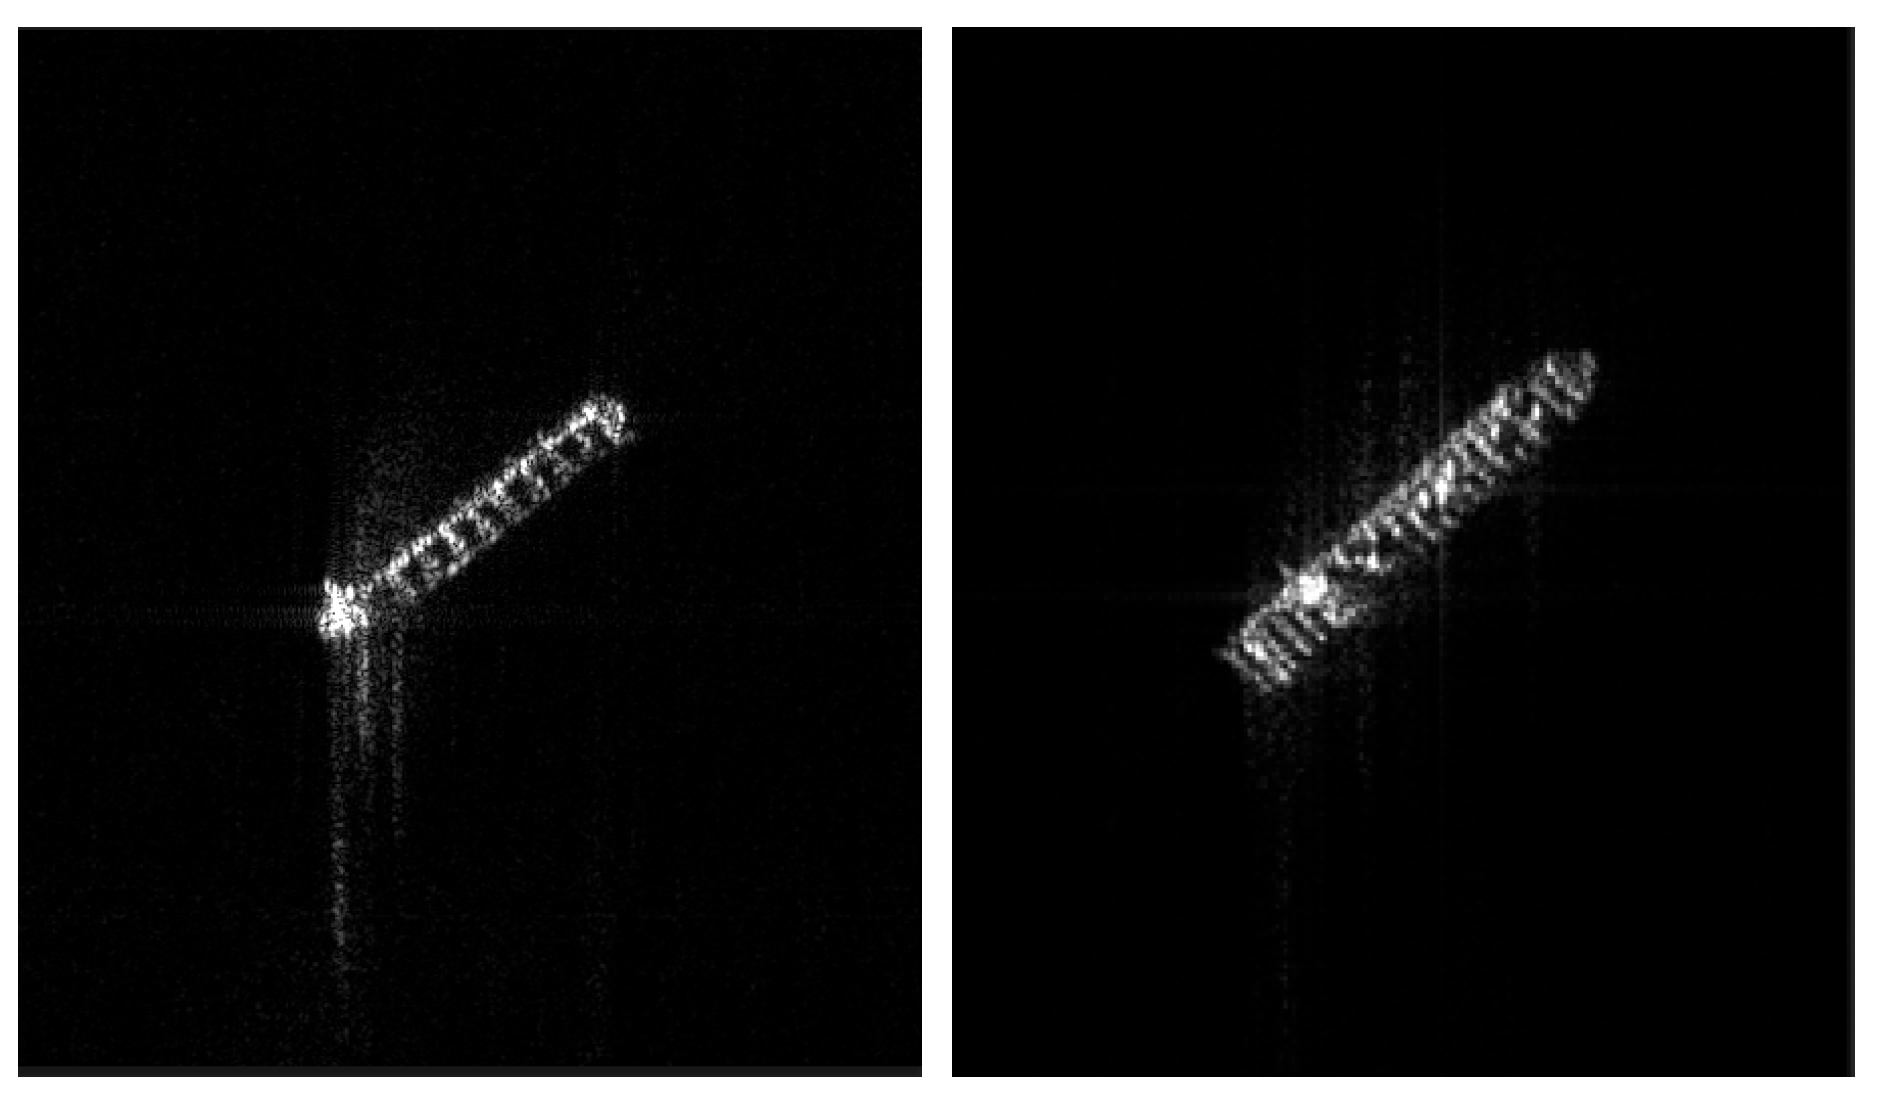
2.3. MEO SAR Image Defocusing Caused by Ship Rotation
3. Coarse-Level Focusing and Classification of MEO SAR Ship Targets
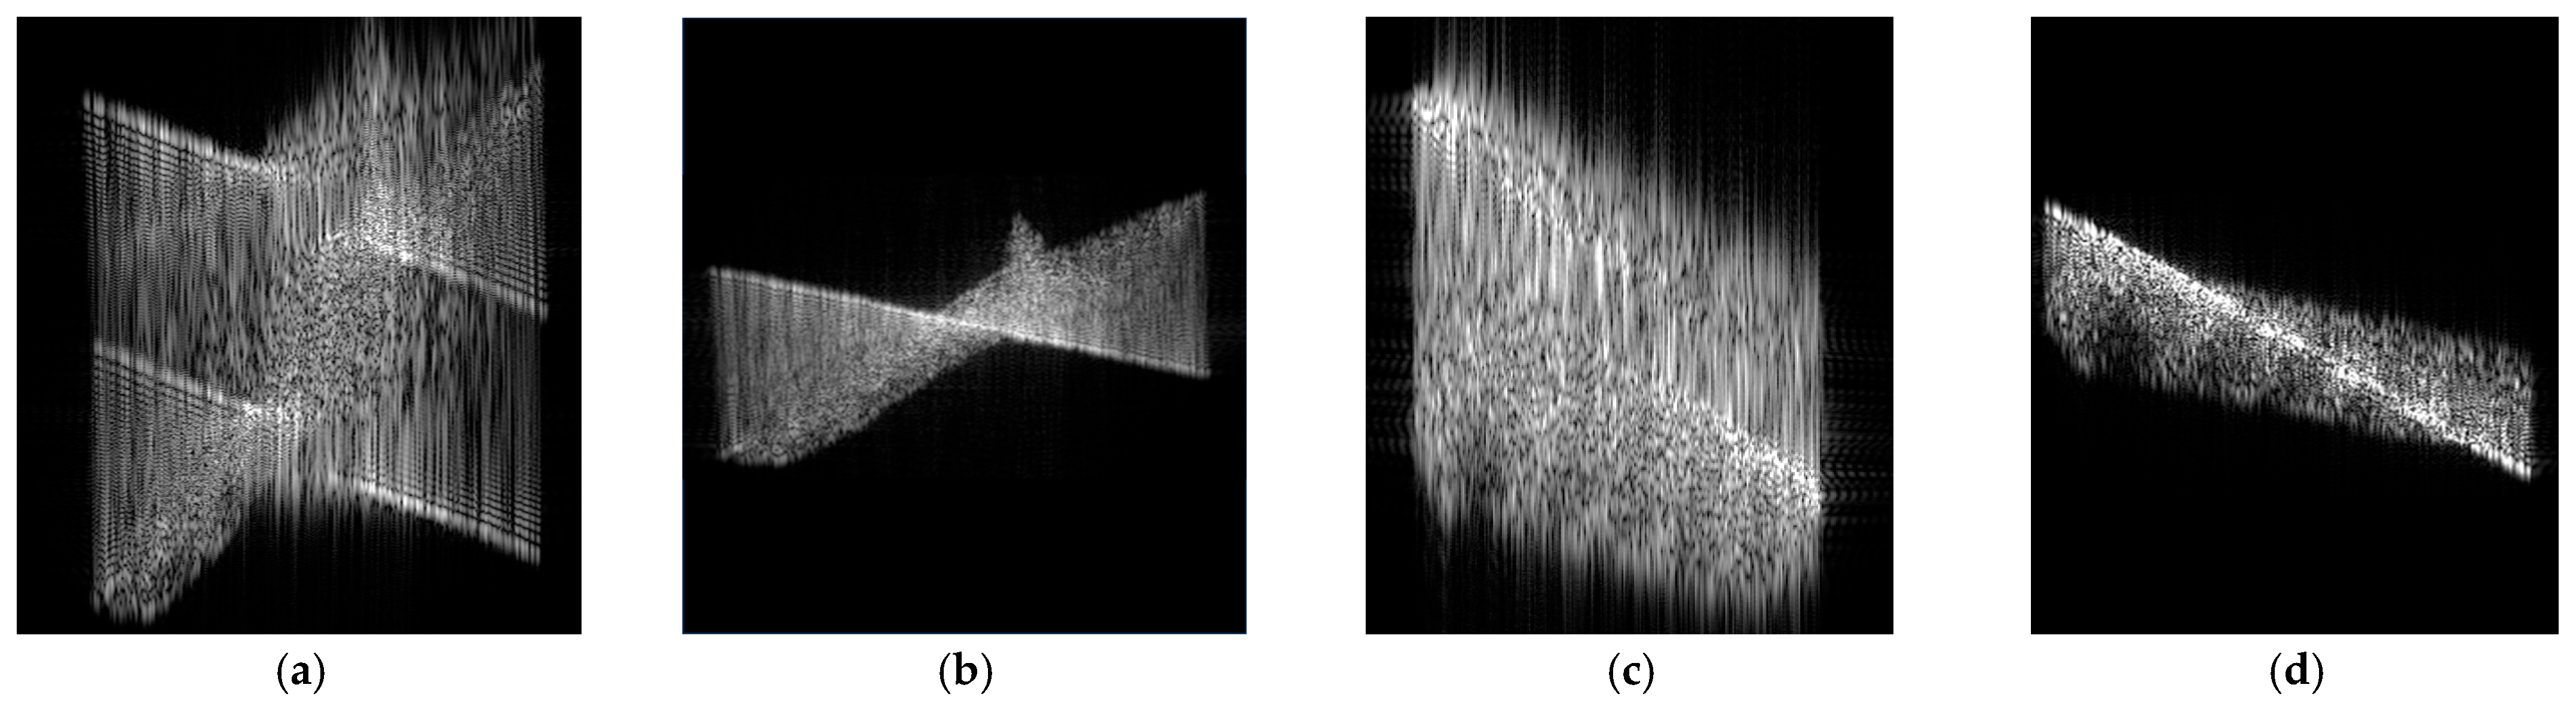
3.1. Ship Target Coarse-Focusing Based on Doppler Parameter Estimation
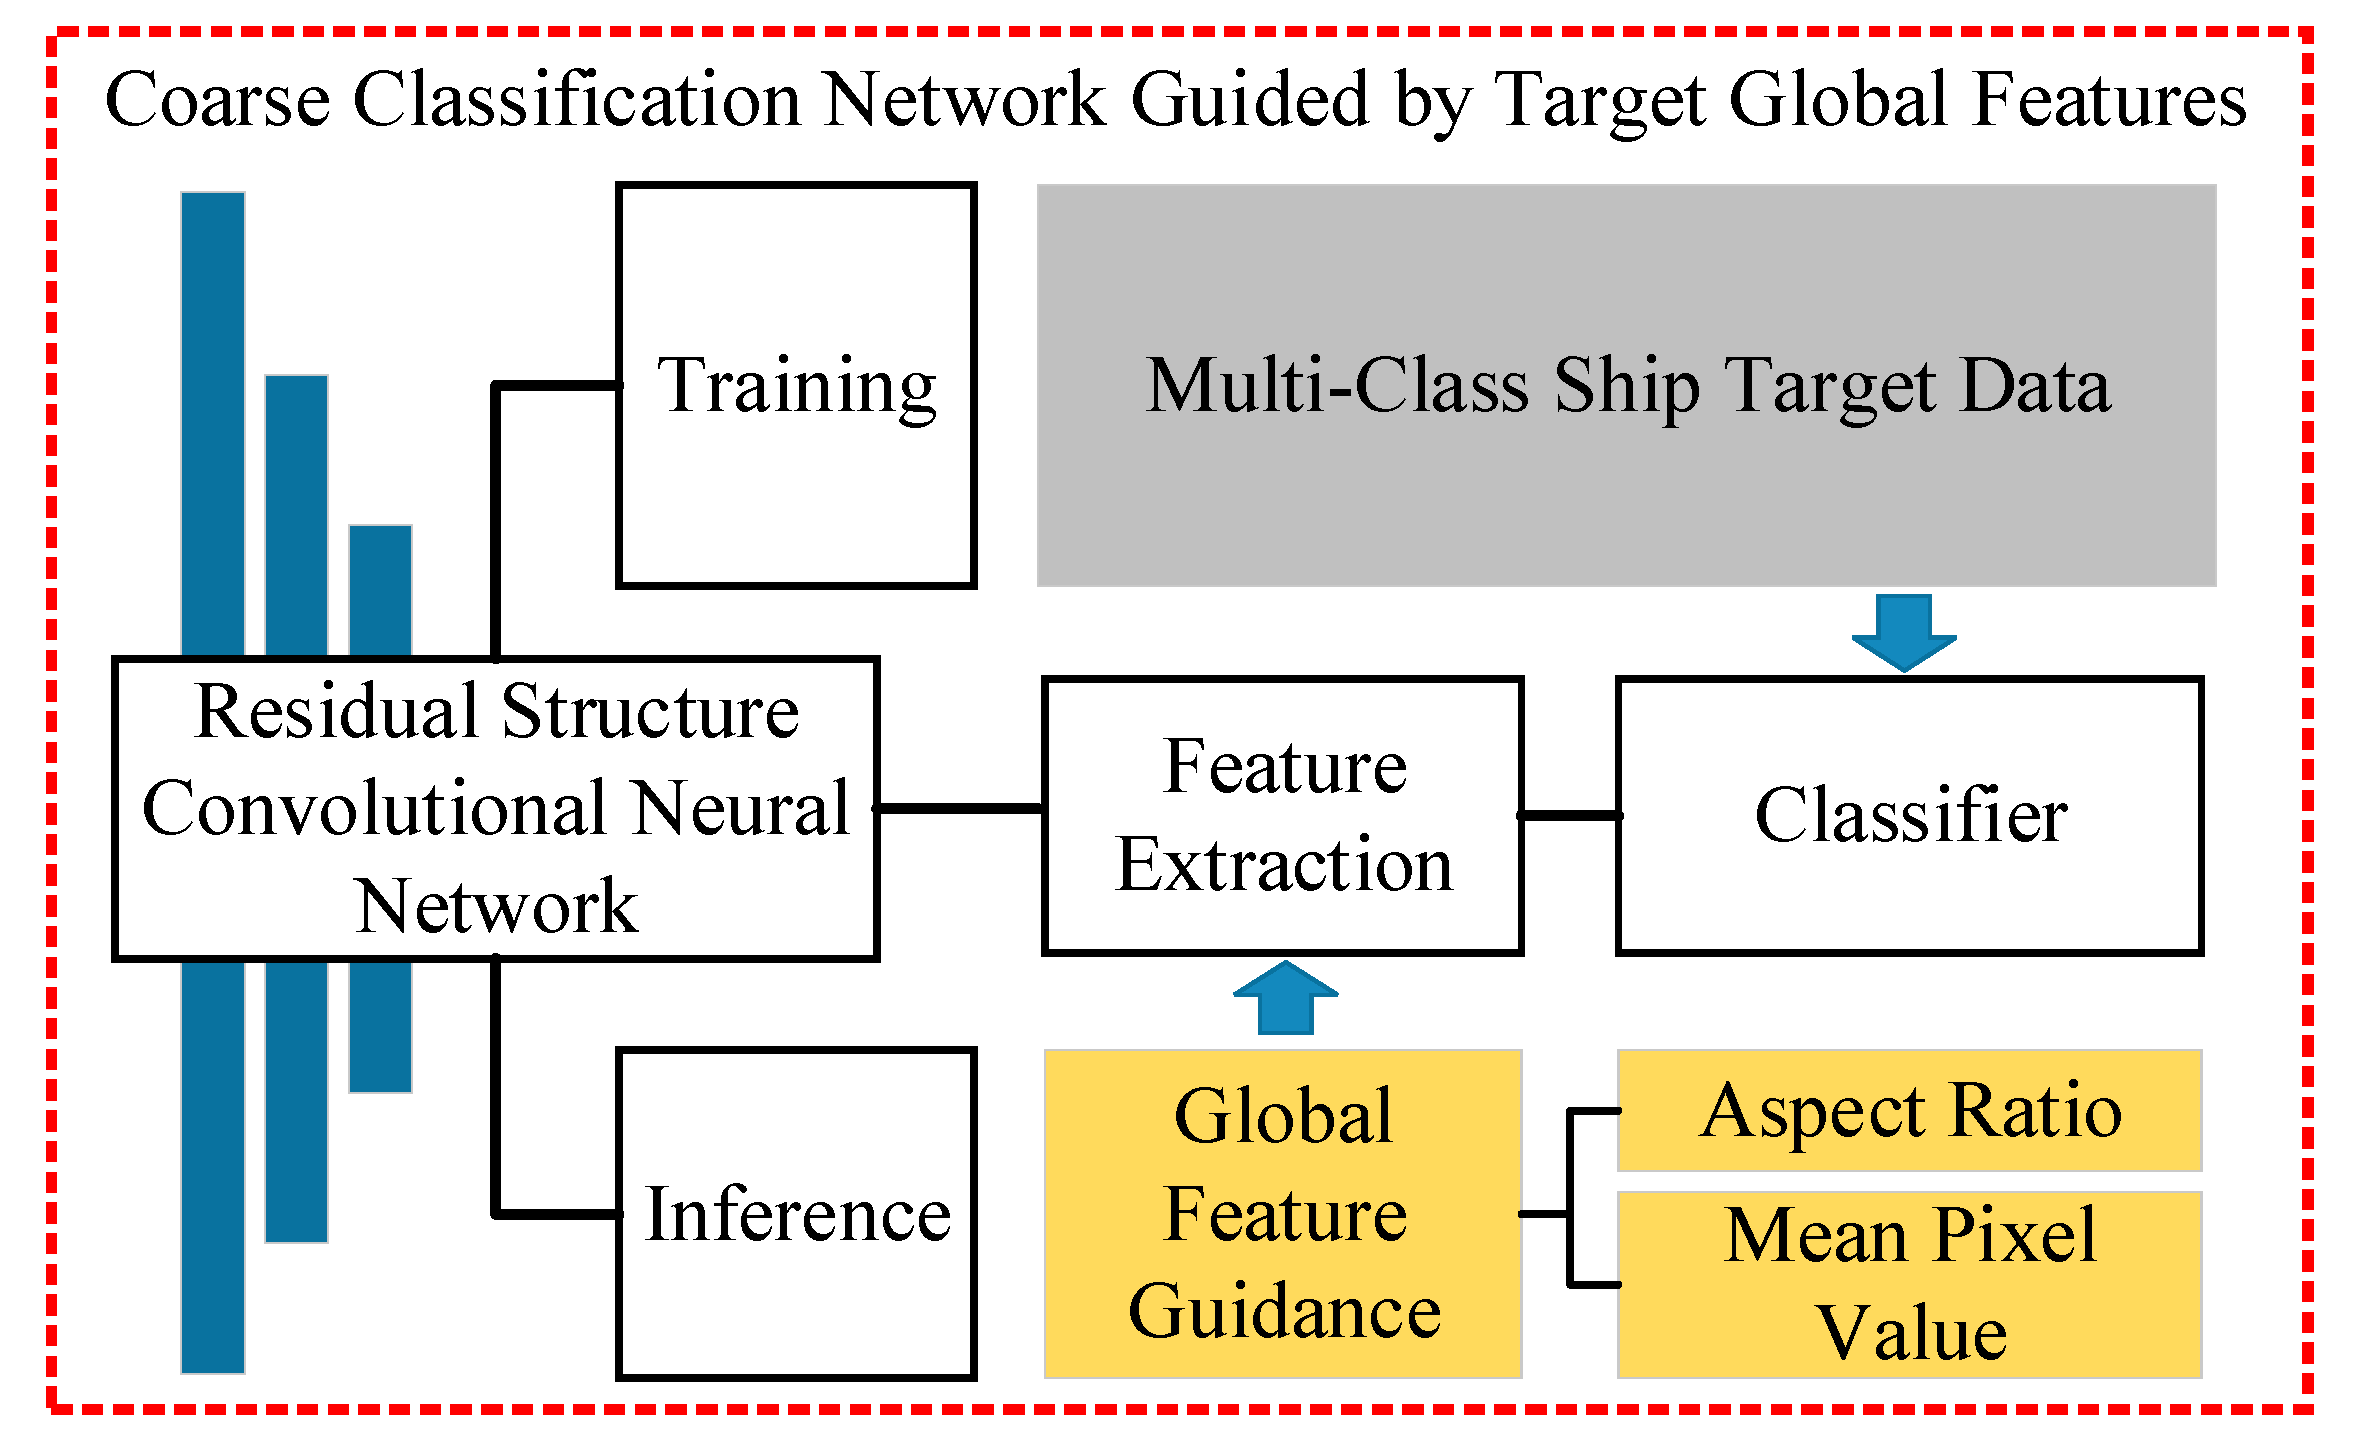
3.2. Ship Target Coarse Classification Based on Global Features
4. Fine-Level Focusing and Classification of MEO SAR Ship Targets
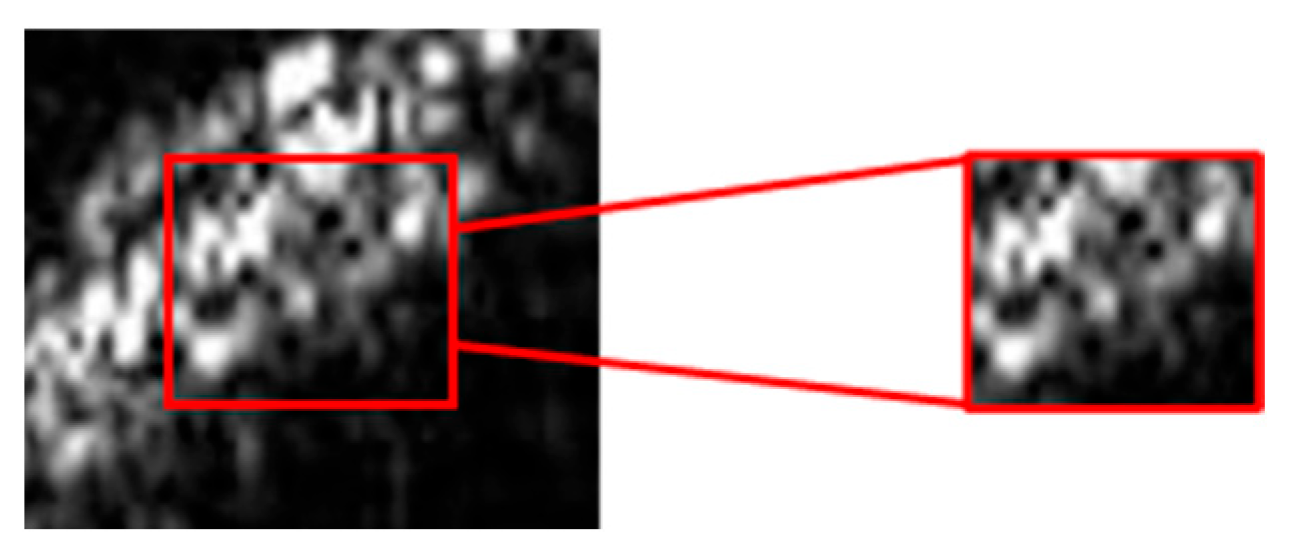
4.1. Ship Target Fine-Focusing Based on Local Region Slice
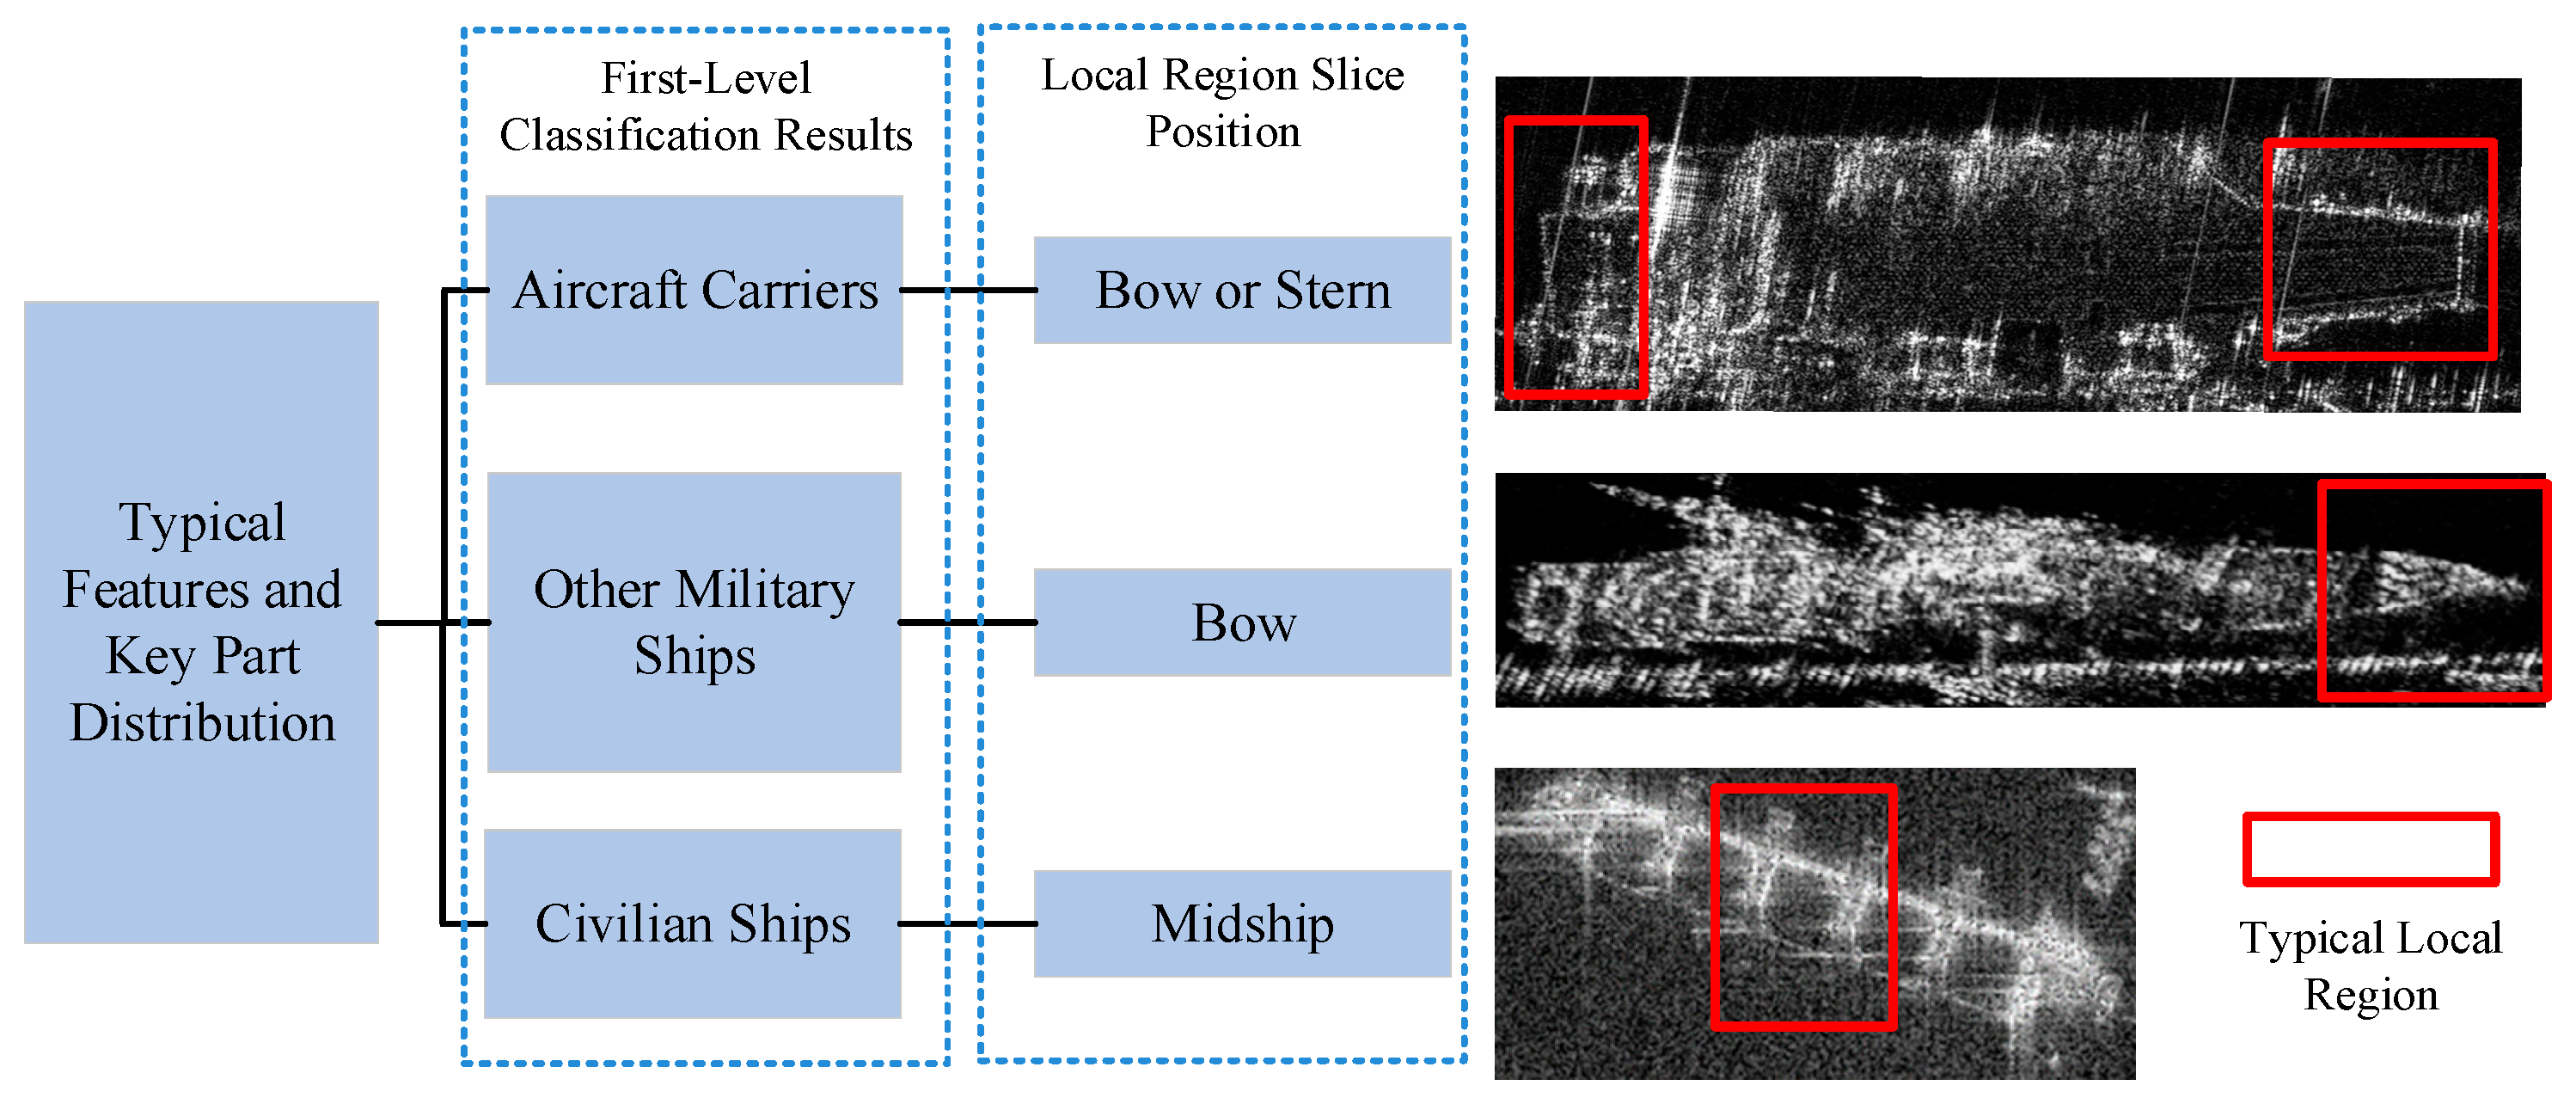
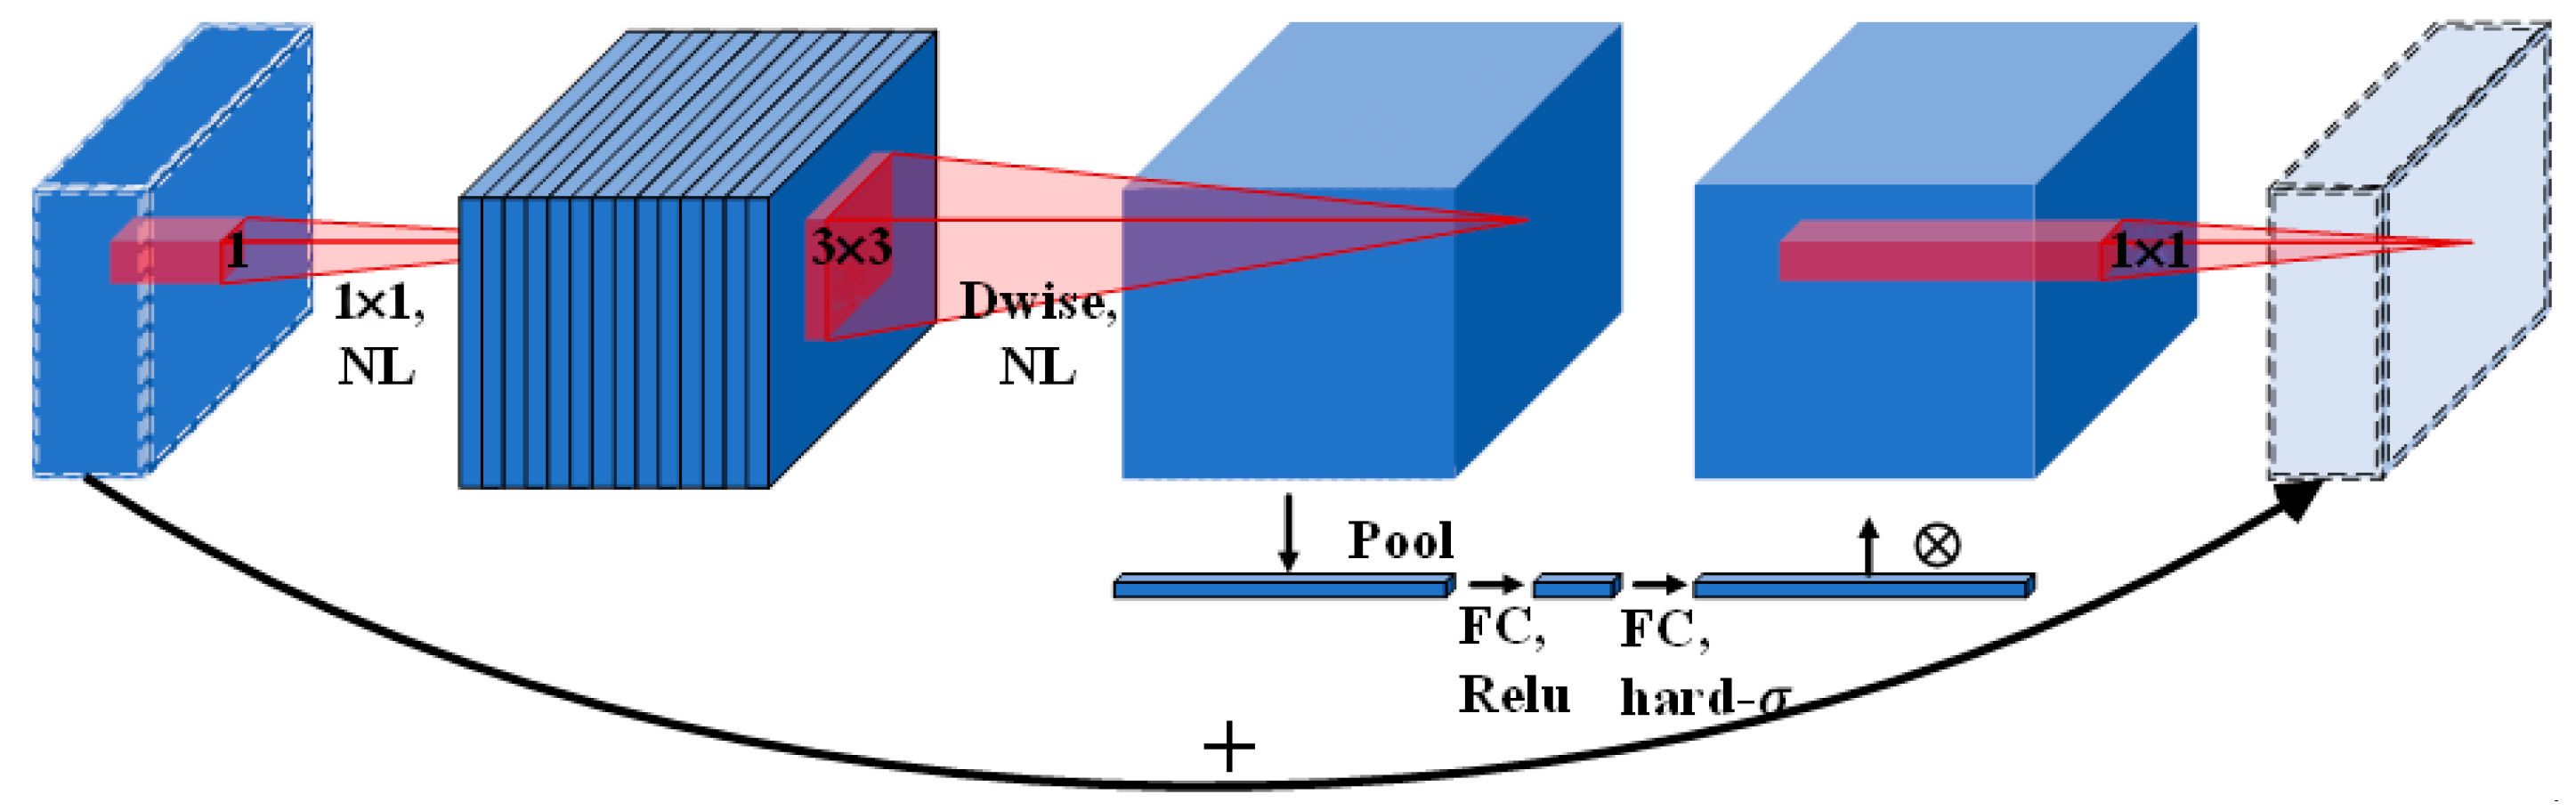
4.2. Ship Target Fine Classification Based on Local Features
5. Dataset Construction and Experimental Results
5.1. Dataset Construction
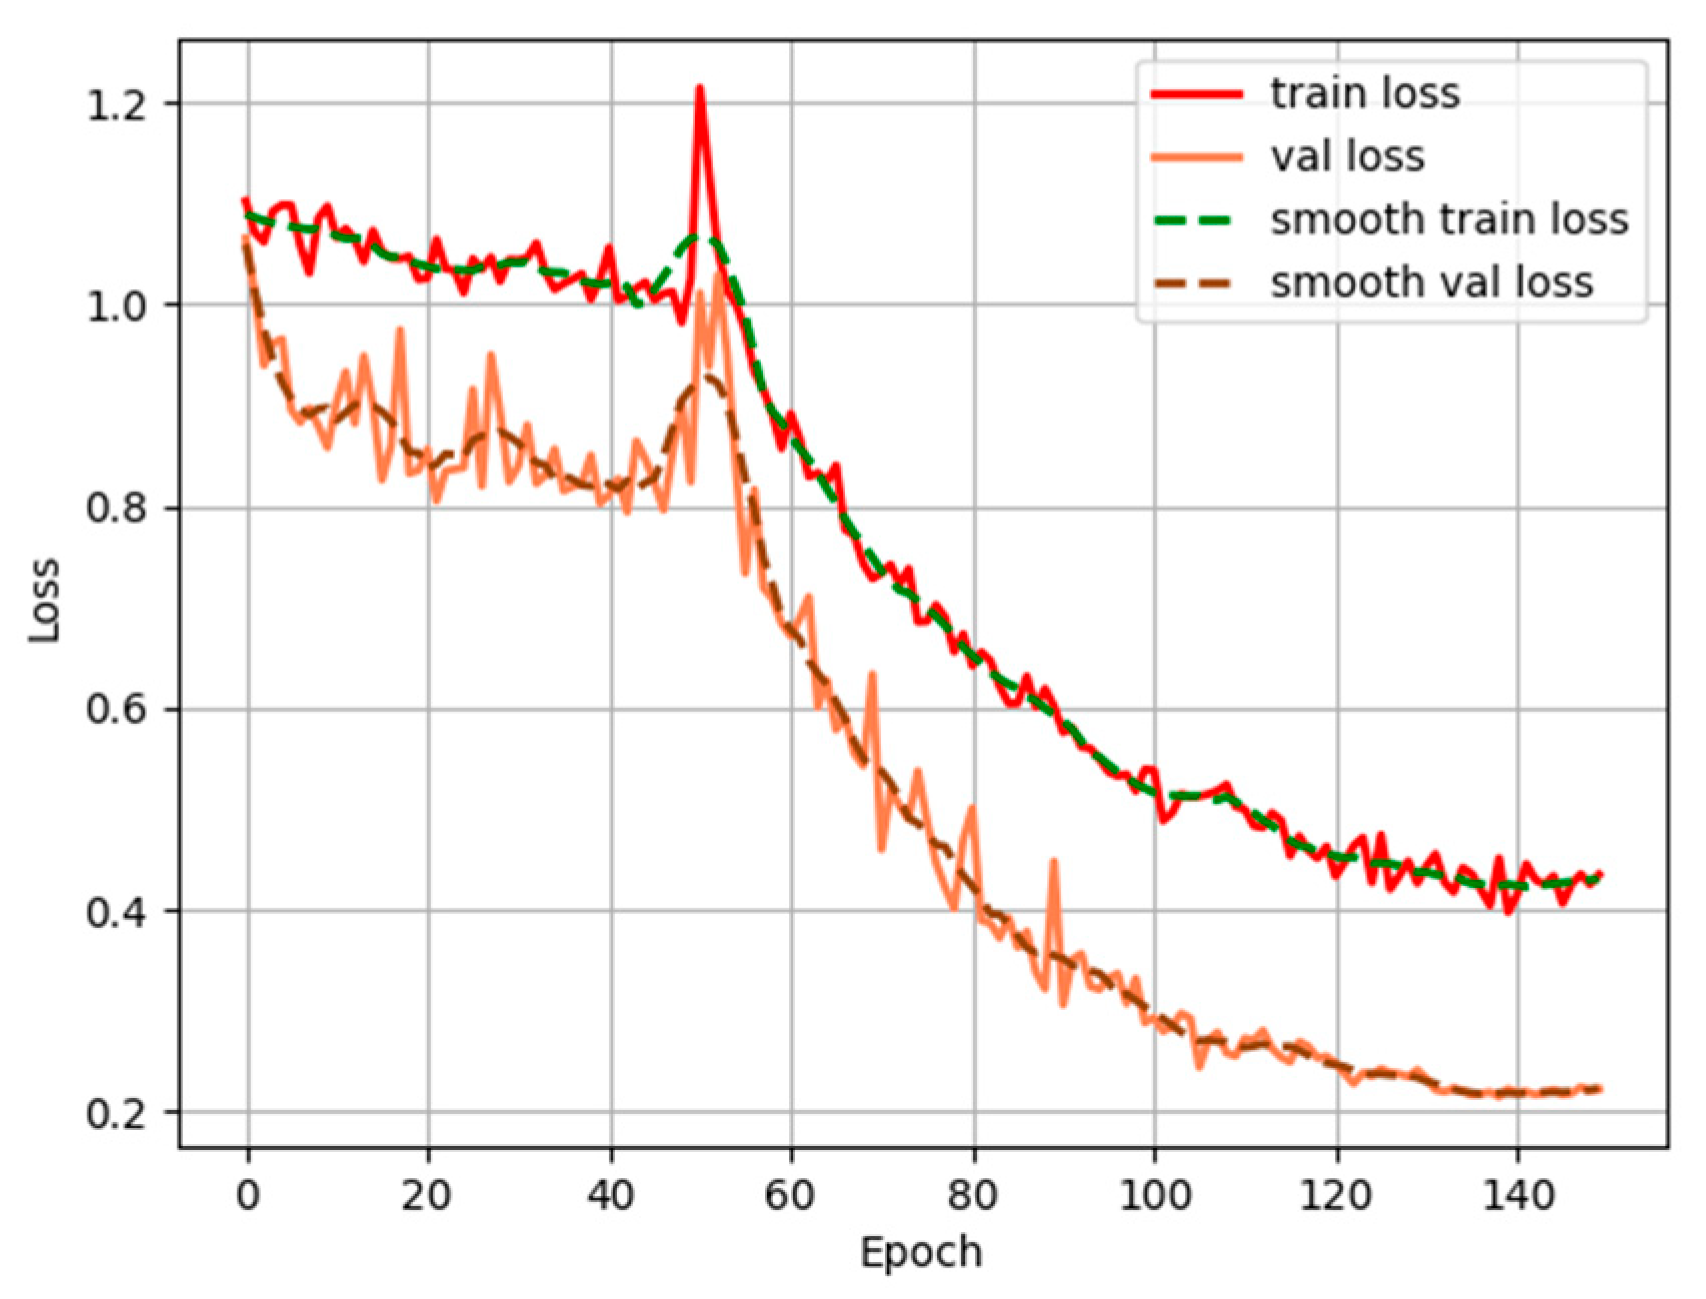
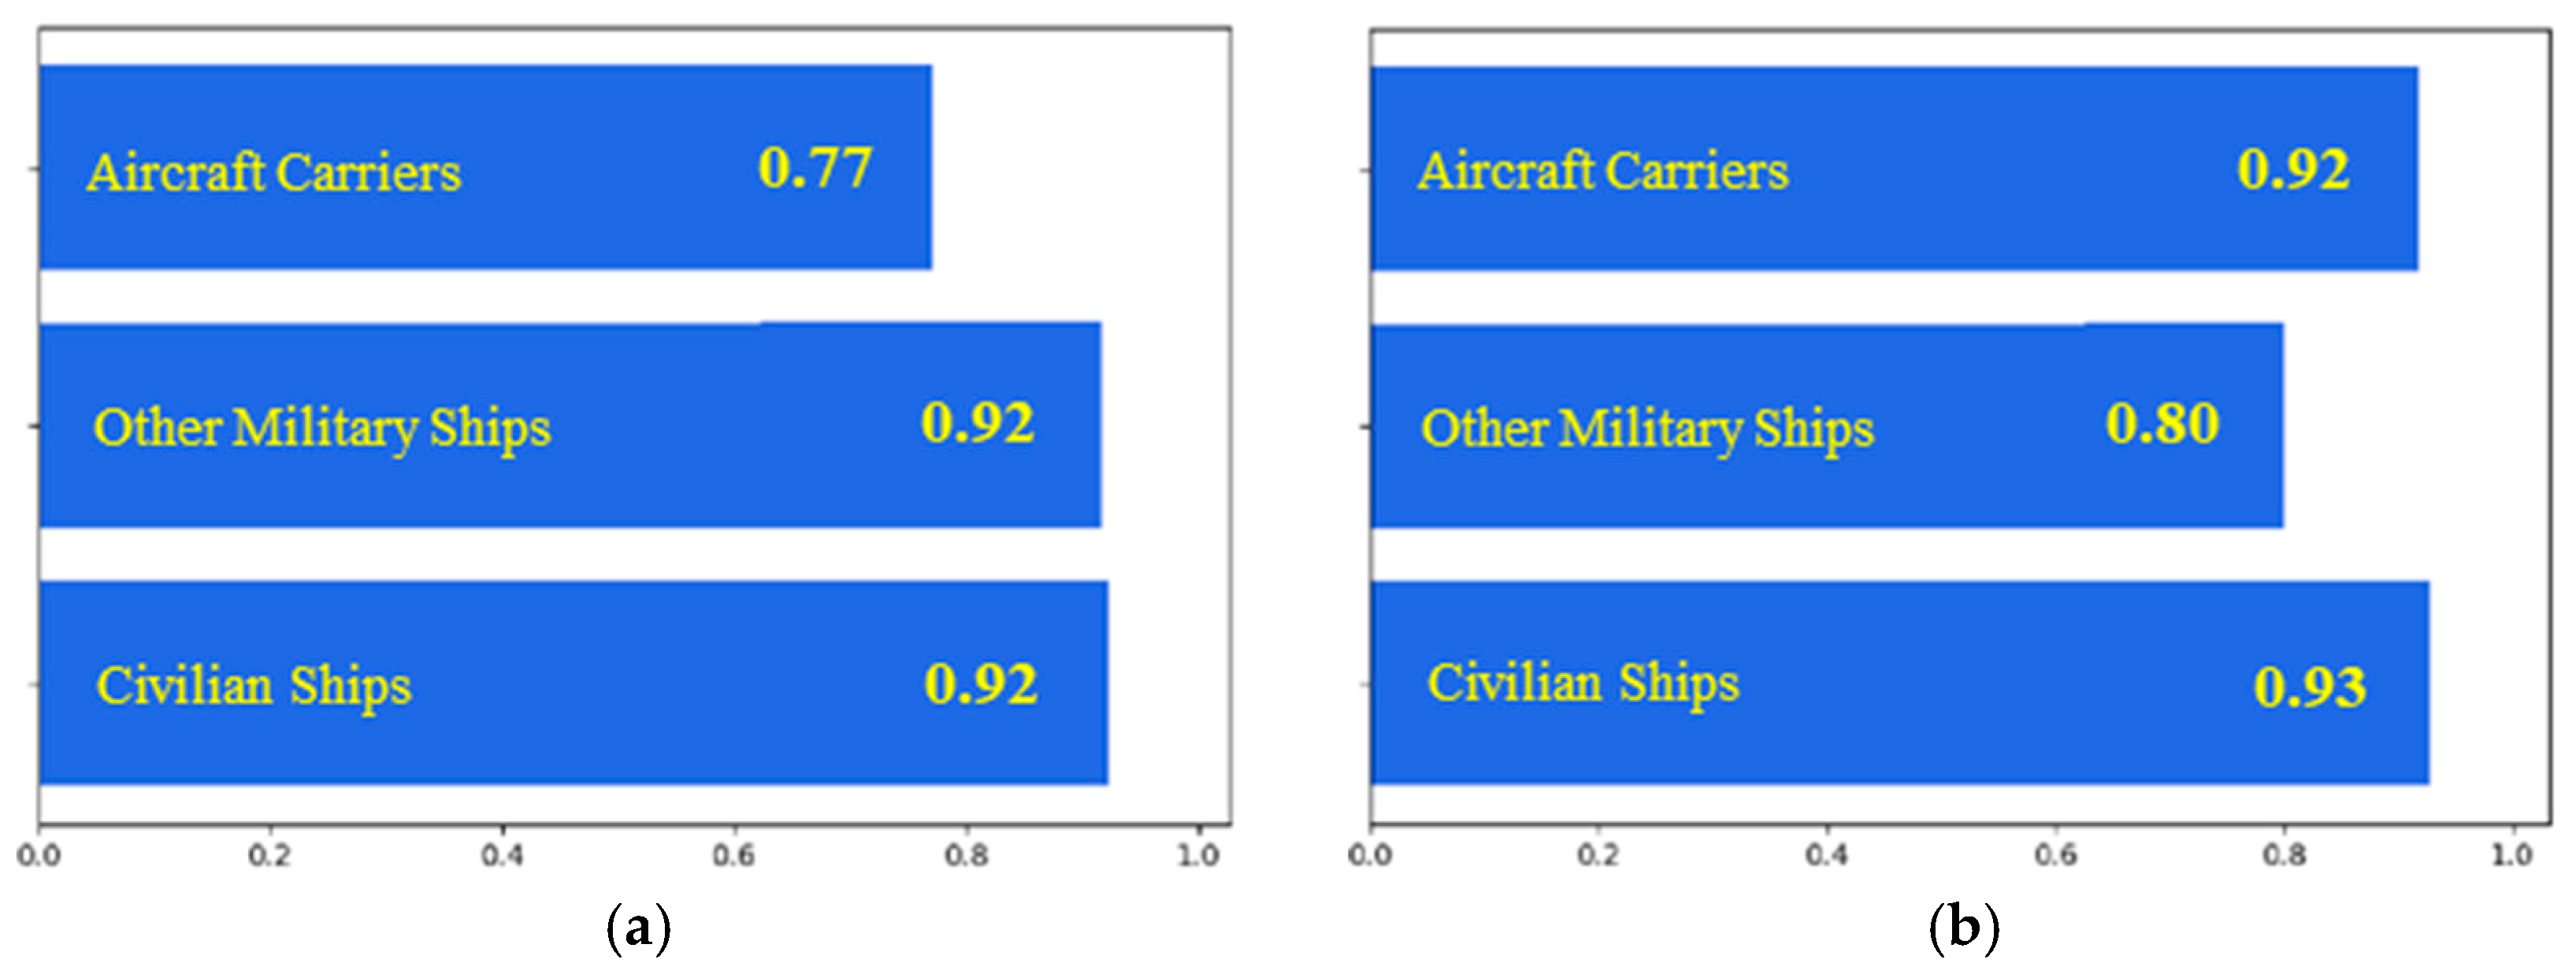
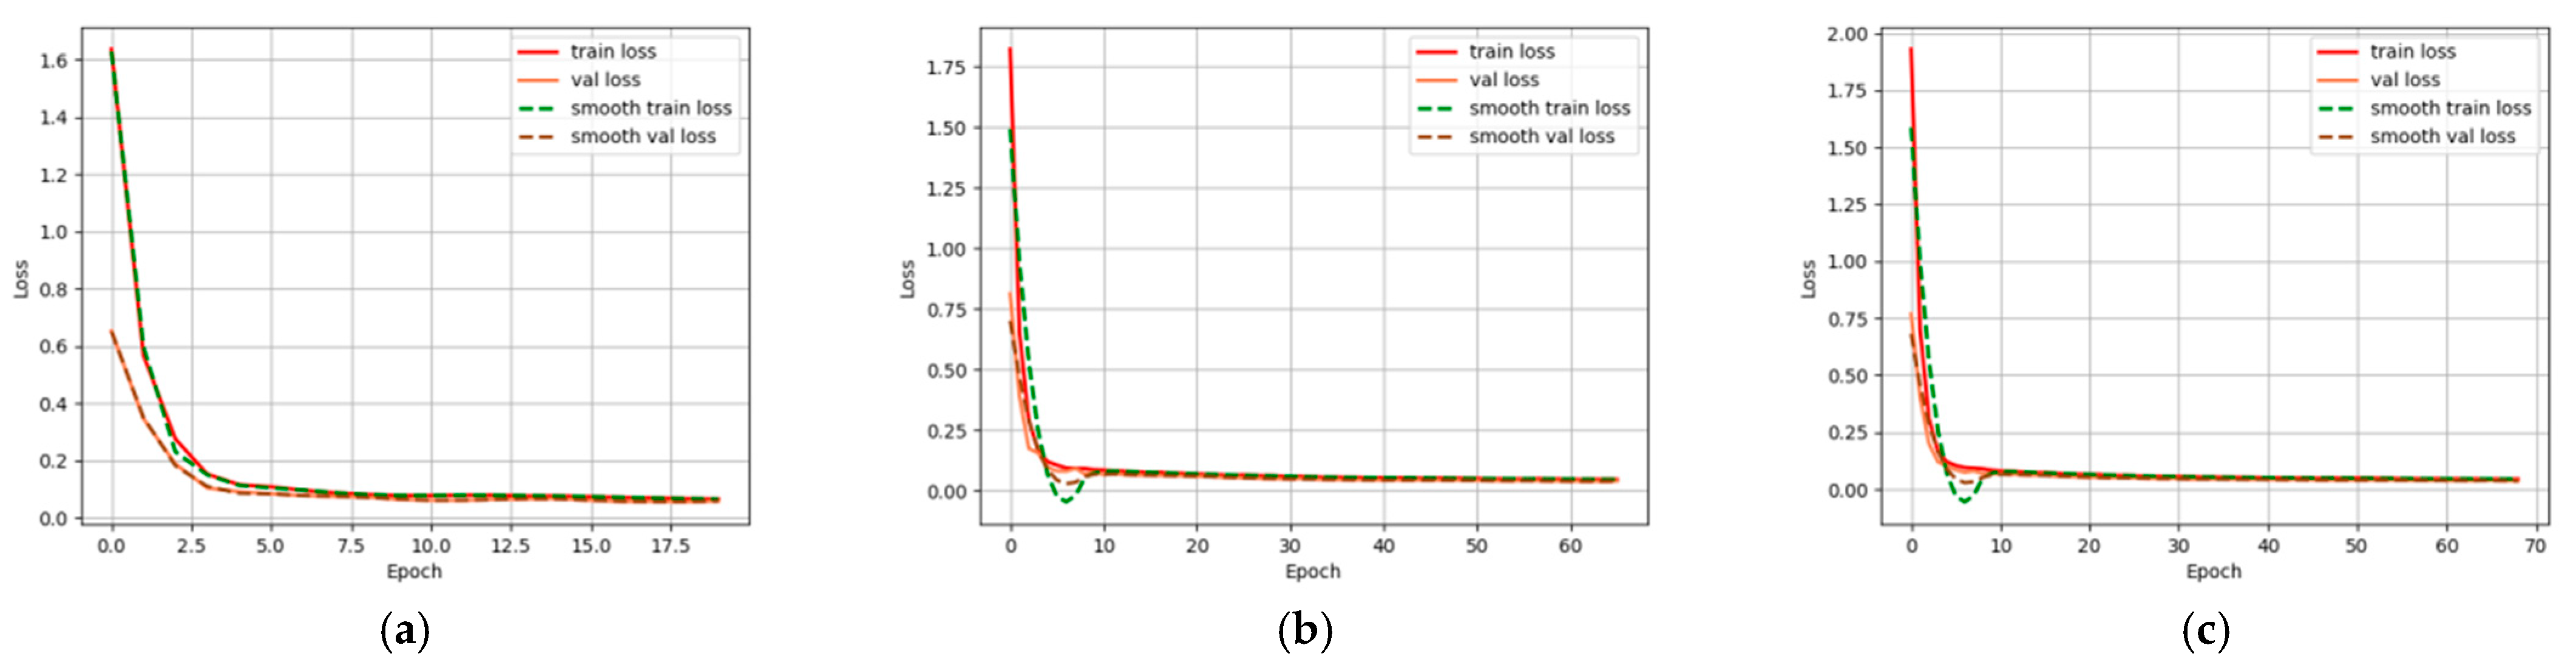
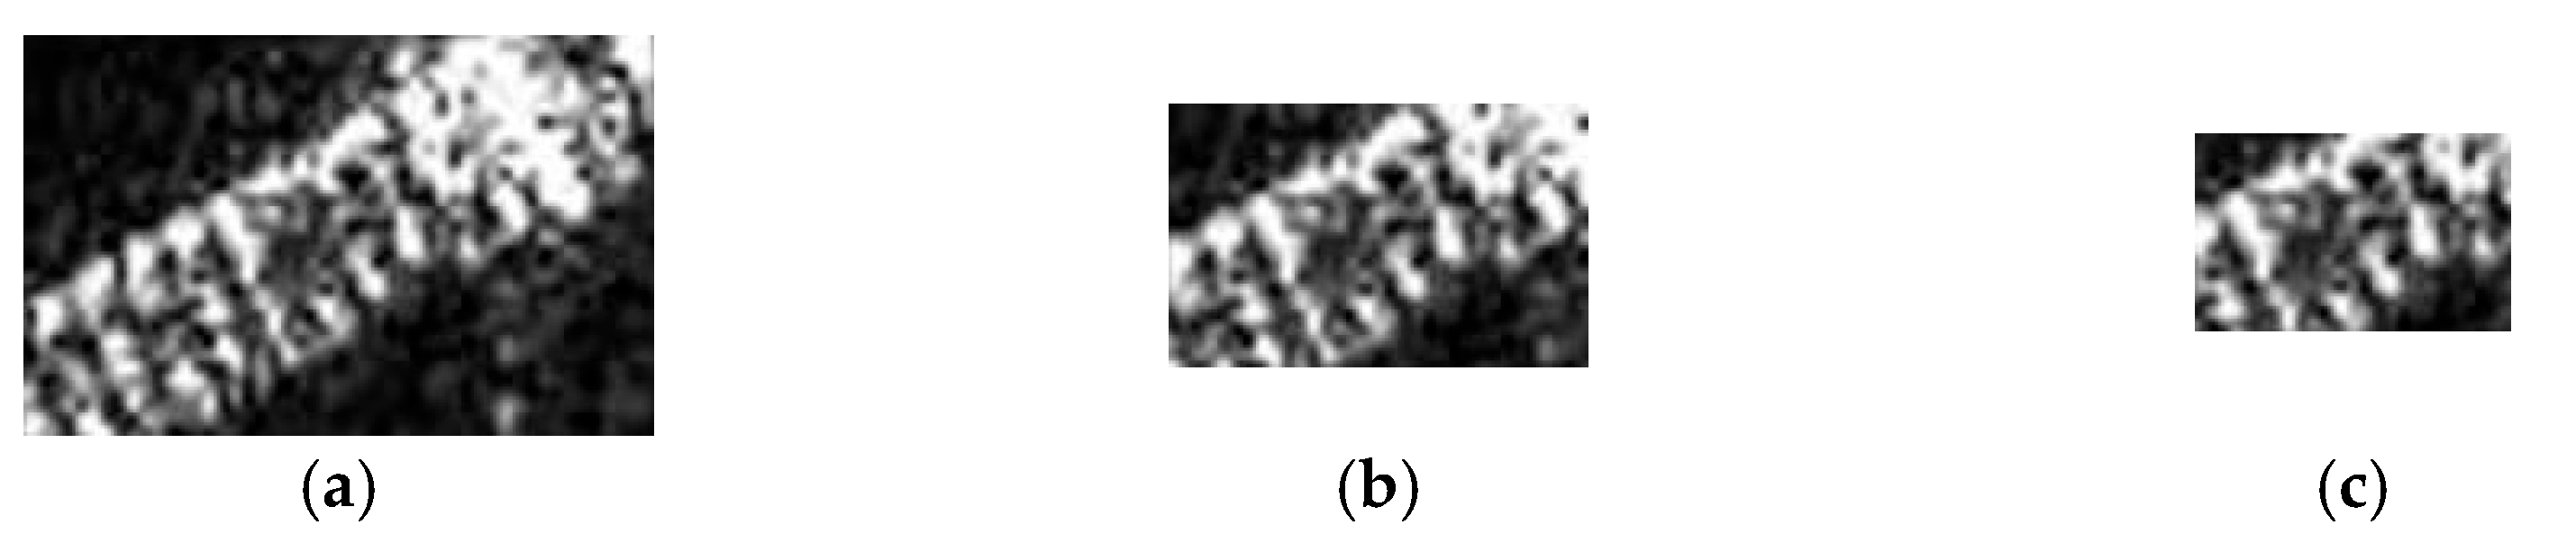
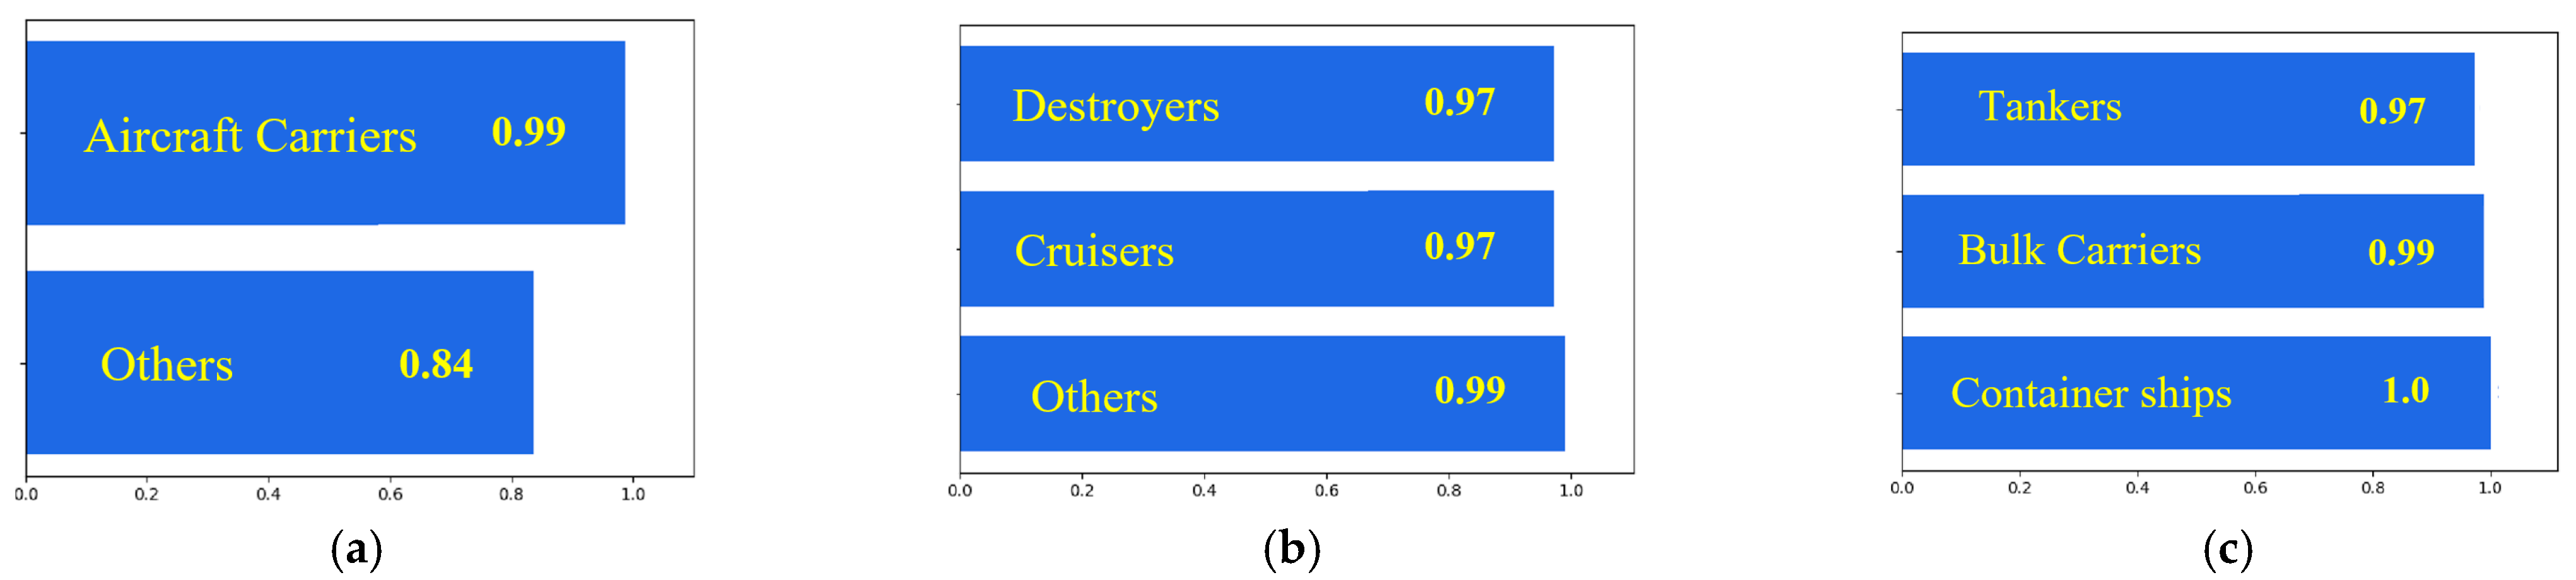
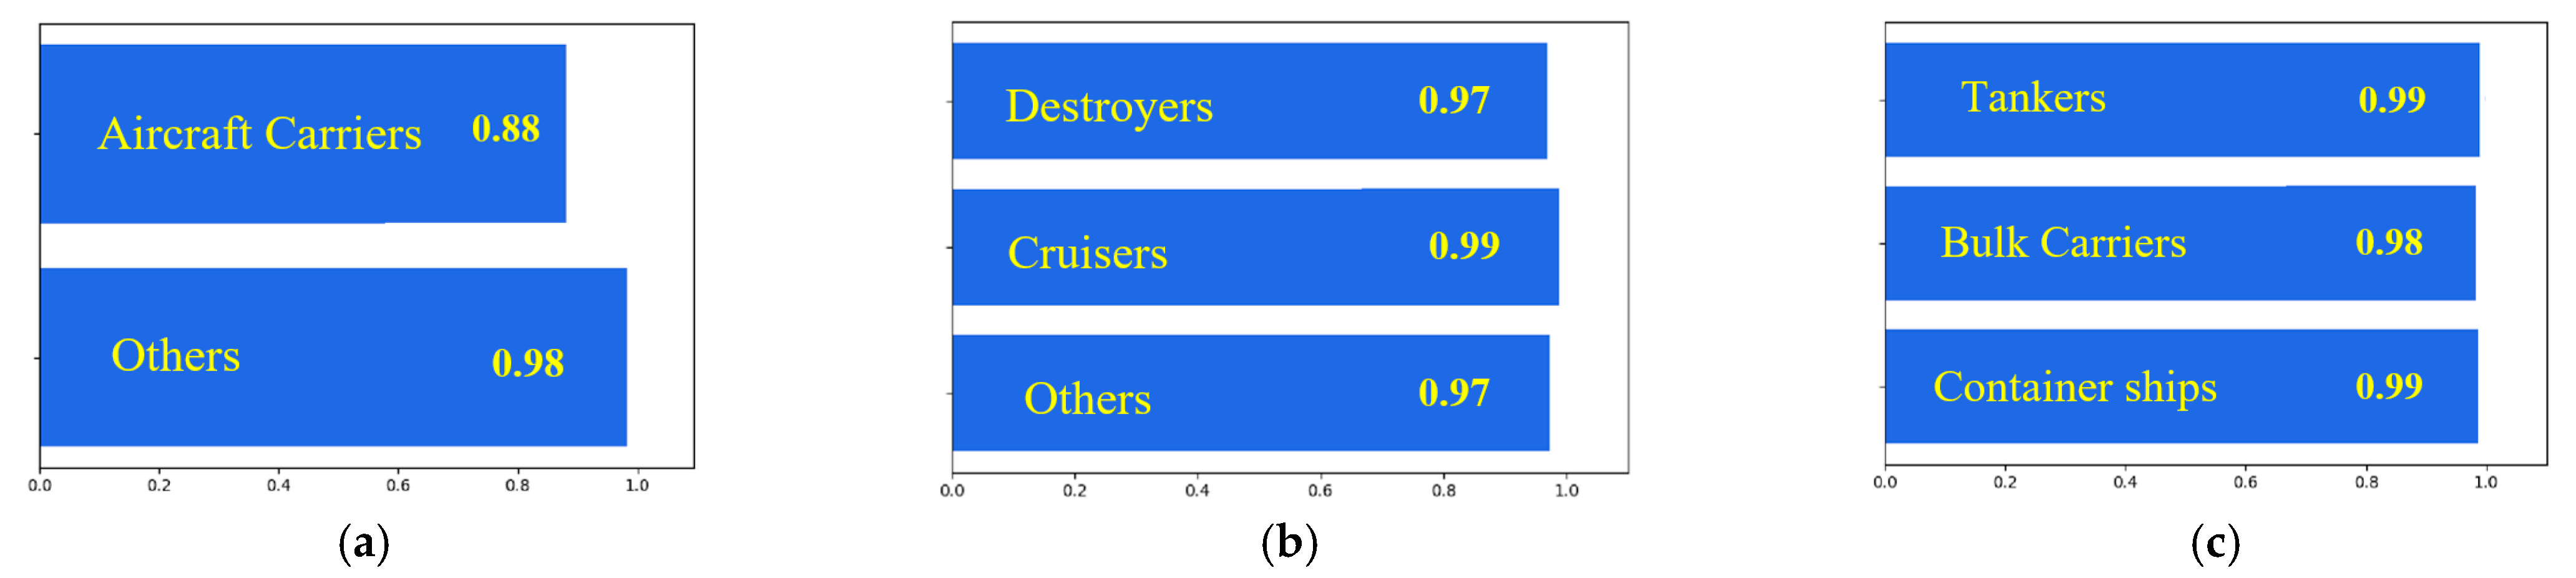
5.2. Coarse Focusing-Classification Experiment
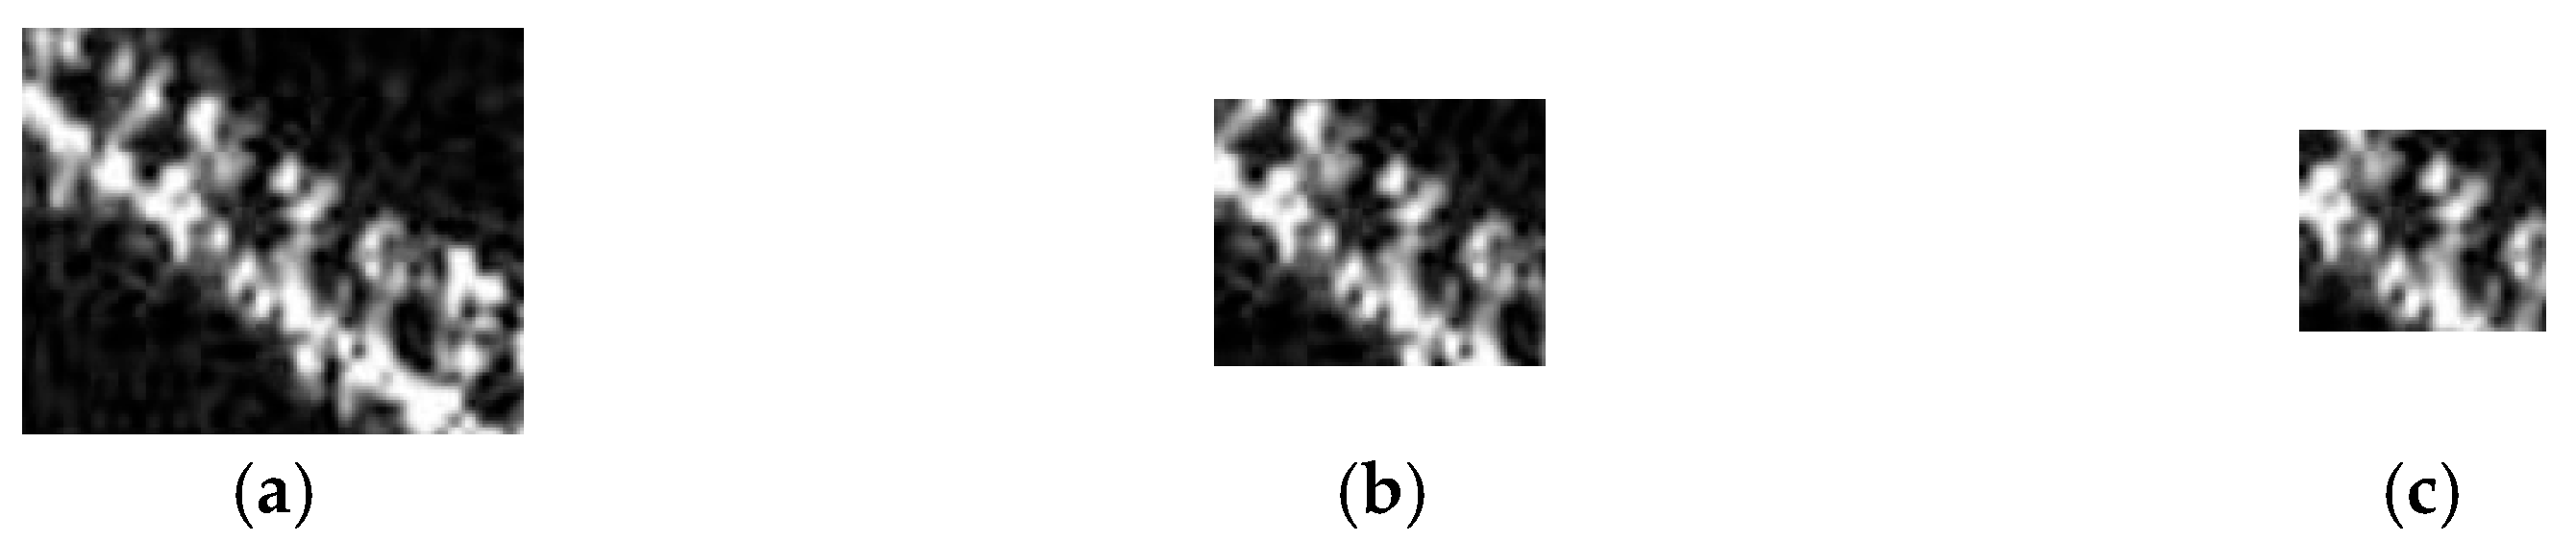
5.3. Fine Focusing-Classification Experiment
6. Conclusions
Author Contributions
Funding
Data Availability Statement
Conflicts of Interest
References
- Matar, J.; Rodriguez-Cassola, M.; Krieger, G.; López-Dekker, P.; Moreira, A. MEO SAR: System Concepts and Analysis. IEEE Trans. Geosci. Remote Sens. 2020, 58, 1313–1324. [Google Scholar] [CrossRef]
- Matar, J.; Rodriguez-Cassola, M.; Krieger, G.; Zonno, M.; Moreira, A. Potential of MEO SAR for Global Deformation Mapping. In Proceedings of the EUSAR 2021—13th European Conference on Synthetic Aperture Radar 2021, Leipzig, Germany, 29–31 March 2021; pp. 1–5. [Google Scholar]
- Dai, D.; Wu, H.; Wang, Y.; Ji, P. LHSDNet: A Lightweight and High-Accuracy SAR Ship Object Detection Algorithm. Remote Sens. 2024, 16, 4527. [Google Scholar] [CrossRef]
- Feng, Y.; You, Y.; Tian, J.; Meng, G. OEGR-DETR: A Novel Detection Transformer Based on Orientation Enhancement and Group Relations for SAR Object Detection. Remote Sens. 2024, 16, 106. [Google Scholar] [CrossRef]
- Ai, J.; Tian, R.; Luo, Q.; Jin, J.; Tang, B. Multi-scale rotation-invariant Haar-like feature integrated CNN-based ship detection algorithm of multiple-target environment in SAR imagery. IEEE Trans. Geosci. Remote Sens. 2019, 57, 10070–10087. [Google Scholar] [CrossRef]
- Shang, Y.; Pu, W.; Liao, D.; Yang, J.; Wu, C.; Huang, Y.; Zhang, Y.; Wu, J.; Yang, J.; Wu, J. SA2 Net: Ship Augmented Attention Network for Ship Recognition in SAR Images. IEEE J. Sel. Top. Appl. Earth Obs. Remote Sens. 2023, 16, 10036–10049. [Google Scholar] [CrossRef]
- Shang, Y.; Pu, W.; Wu, C.; Liao, D.; Xu, X.; Wang, C.; Huang, Y.; Zhang, Y.; Wu, J.; Yang, J.; et al. HDSS-Net: A novel hierarchically designed network with spherical space classifier for ship recognition in SAR images. IEEE Trans. Geosci. Remote Sens. 2023, 61, 1–20. [Google Scholar] [CrossRef]
- He, J.; Wang, Y.; Liu, H. Ship classification in medium-resolution SAR images via densely connected triplet CNNs integrating Fisher discrimination regularized metric learning. IEEE Trans. Geosci. Remote Sens. 2020, 59, 3022–3039. [Google Scholar] [CrossRef]
- Ma, M.; Chen, J.; Liu, W.; Yang, W. Ship classification and detection based on CNN using GF-3 SAR images. Remote Sens. 2018, 10, 2043. [Google Scholar] [CrossRef]
- Liu, W.; Sun, G.C.; Xing, M.; Li, H.; Bao, Z. Focusing of MEO SAR data based on principle of optimal imaging coordinate system. IEEE Trans. Geosci. Remote Sens. 2020, 58, 5477–5489. [Google Scholar] [CrossRef]
- Zhang, Y.; Ren, H.; Lu, Z.; Yang, X.; Li, G. Focusing of Highly Squinted Bistatic SAR with MEO Transmitter and High Maneuvering Platform Receiver in Curved Trajectory. IEEE Trans. Geosci. Remote Sens. 2024, 62, 5227522. [Google Scholar] [CrossRef]
- Guo, J.; Yang, W.; Chen, J.; Zou, F. Refocusing of Moving Ship Targets in SAR Images with Long Synthetic Aperture Time. In Proceedings of the IGARSS 2022—2022 IEEE International Geoscience and Remote Sensing Symposium, Kuala Lumpur, Malaysia, 17–22 July 2022; pp. 2079–2082. [Google Scholar]
- Zhang, Y.; Li, L.; Liao, W.; Qi, X.; Ren, H. Three-Dimensional Reconstruction of Ship Target on MEO SAR/ISAR Hybrid Imaging. In Proceedings of the IGARSS 2024—2024 IEEE International Geoscience and Remote Sensing Symposium, Athens, Greece, 7–12 July 2024; pp. 3344–3347. [Google Scholar]
- Wang, C.; Guo, B.; Song, J.; He, F.; Li, C. A novel CFAR-based ship detection method using range-compressed data for spaceborne SAR system. IEEE Trans. Geosci. Remote Sens. 2024, 62, 5215515. [Google Scholar] [CrossRef]
- Tan, X.; Leng, X.; Ji, K.; Kuang, G. RCShip: A dataset dedicated to ship detection in range-compressed SAR data. IEEE Geosci. Remote Sens. Lett. 2024, 21, 4004805. [Google Scholar] [CrossRef]
- Tan, X.; Leng, X.; Luo, R.; Sun, Z.; Ji, K.; Kuang, G. YOLO-RC: SAR ship detection guided by characteristics of range-compressed domain. IEEE J. Sel. Top. Appl. Earth Obs. Remote Sens. 2024, 17, 18834–18851. [Google Scholar] [CrossRef]
- Wahl, D.E.; Eichel, P.H.; Ghiglia, D.C.; Jakowatz, C.V. Phase gradient autofocus-a robust tool for high resolution SAR phase correction. IEEE Trans. Aerosp. Electron. Syst. 2002, 30, 827–835. [Google Scholar] [CrossRef]
- Seo, K.; Kwon, Y.; Kim, C.K. An Enhanced Phase Gradient Autofocus Algorithm for SAR: A Fractional Fourier Transform Approach. Remote Sens. 2025, 17, 1216. [Google Scholar] [CrossRef]
- Zhu, D.; Jiang, R.; Mao, X.; Zhu, Z. Multi-subaperture PGA for SAR autofocusing. IEEE Trans. Aerosp. Electron. Syst. 2013, 49, 468–488. [Google Scholar] [CrossRef]
- Martorella, M.; Berizzi, F.; Haywood, B. Contrast maximization based technique for 2-D ISAR autofocusing. IEE Proc.-Radar Sonar Navig. 2005, 152, 253–262. [Google Scholar] [CrossRef]
- Morrison, R.L.; Do, M.N.; Munson, D.C. SAR image autofocus by sharpness optimization: A theoretical study. IEEE Trans. Image Process. 2007, 16, 2309–2321. [Google Scholar] [CrossRef]
- Doerry, A.W. Ship Dynamics for Maritime ISAR Imaging; Sandia National Laboratories (SNL): Albuquerque, NM, USA; Livermore, CA, USA, 2008. [Google Scholar]
- Zhou, B.; Qi, X.; Zhang, J.; Zhang, H. Effect of 6-DOF Oscillation of Ship Target on SAR Imaging. Remote Sens. 2021, 13, 1821. [Google Scholar] [CrossRef]
- Liu, W.; Sun, G.C.; Xia, X.G.; Fu, J.; Xing, M.; Bao, Z. Focusing challenges of ships with oscillatory motions and long coherent processing interval. IEEE Trans. Geosci. Remote Sens. 2020, 59, 6562–6572. [Google Scholar] [CrossRef]
- Sommer, A.; Ostermann, J. Backprojection subimage autofocus of moving ships for synthetic aperture radar. IEEE Trans. Geosci. Remote Sens. 2019, 57, 8383–8393. [Google Scholar] [CrossRef]
- Yu, J.; Yu, Z.; Li, C. GEO SAR imaging of maneuvering ships based on time–frequency features extraction. IEEE Trans. Geosci. Remote Sens. 2022, 60, 1–21. [Google Scholar] [CrossRef]
- Xu, X.; Leng, X.; Sun, Z.; Tan, X.; Ji, K.; Kuang, G. Adaptive Fast Refocusing for Ship Targets with Complex Motion in SAR Images. IEEE J. Sel. Top. Appl. Earth Obs. Remote Sens. 2025, 18, 8559–8572. [Google Scholar] [CrossRef]
- Guo, J.; Yang, W.; Qi, W.; Deng, J.; Zeng, H.; Chen, J.; Wang, Y.; Ji, W.; Wang, W. Refocusing of Rotating Ships in Spaceborne SAR Imagery based on NLCS Principle. IEEE Trans. Geosci. Remote Sens. 2024, 62, 5207015. [Google Scholar] [CrossRef]
- Cumming, I.G.; Wong, F. Digital Processing of Synthetic Aperture Radar Data: Algorithms and Implementation; Artech House: Norwood, MA, USA, 2005. [Google Scholar]
- Bamler, R. A comparison of range-Doppler and wavenumber domain SAR focusing algorithms. IEEE Trans. Geosci. Remote Sens. 1992, 30, 706–713. [Google Scholar] [CrossRef]
- Li, J.; Chen, J.; Cheng, P.; Yu, Z.; Yu, L.; Chi, C. A survey on deep-learning-based real-time SAR ship detection. IEEE J. Sel. Top. Appl. Earth Obs. Remote Sens. 2023, 16, 3218–3247. [Google Scholar] [CrossRef]
- Qiao, M.; Liu, Y.; Xu, M.; Deng, X.; Li, B.; Hu, W.; Borji, A. Joint learning of audio–visual saliency prediction and sound source localization on multi-face videos. Int. J. Comput. Vis. 2024, 132, 2003–2025. [Google Scholar] [CrossRef]
- He, K.; Zhang, X.; Ren, S.; Sun, J. Deep residual learning for image recognition. In Proceedings of the CVPR, Las Vegas, NV, USA, 27–30 June 2016; pp. 770–778. [Google Scholar]
- Jorge, N.; Stephen, J.W. Numerical Optimization, 2nd ed.; Springer: Berlin/Heidelberg, Germany, 2006. [Google Scholar]
- Shanno, D.F. Conditioning of quasi-Newton methods for function minimization. Math. Comput. 1970, 24, 647–656. [Google Scholar] [CrossRef]
- Howard, A.; Sandler, M.; Chu, G.; Chen, L.C.; Chen, B.; Tan, M.; Wang, W.; Zhu, Y.; Pang, R.; Vasudevan, V.; et al. Searching for MobileNetV3. In Proceedings of the IEEE/CVF International Conference on Computer Vision (ICCV), Seoul, Republic of Korea, 27 October–2 November 2019; pp. 1314–1324. [Google Scholar]
- Howard, A.G.; Zhu, M.; Chen, B.; Kalenichenko, D.; Wang, W.; Weyand, T.; Andreetto, M.; Adam, H. Mobilenets: Efficient convolutional neural networks for mobile vision applications. arXiv 2017, arXiv:1704.04861. [Google Scholar] [CrossRef]
- Sun, J.; Yu, W.; Deng, Y. The SAR Payload Design and Performance for the GF-3 Mission. Sensors 2017, 17, 2419. [Google Scholar] [CrossRef]


| Parameters | MEO SAR | LEO SAR |
|---|---|---|
| Wavelength (m) | 0.03 | 0.03 |
| Bandwidth (MHz) | 300 | 300 |
| Orbit height (km) | 7500 | 600 |
| Look angle (°) | 15 | 15 |
| Parameters | Roll | Pitch | Yaw |
|---|---|---|---|
| Amplitude (°) | 2 | 1 | 0.2 |
| Period (s) | 10 | 12 | 20 |
| Initial Phase (km) | 45 | 45 | 45 |
| ResNet101 | Output Size | |
|---|---|---|
| Conv1 | 7 × 7, 64, stride 2 | 112 × 112 |
| Conv2_x | 3 × 3, max pool, stride 2 | 56 × 56 |
| Conv3_x | 28 × 28 | |
| Conv4_x | 14 × 14 | |
| Conv5_x | 7 × 7 | |
| Average pool, 1000-d fc, softmax | 1 × 1 | |
| FLOPS | 7.6 × 10⁹ | |
| Target Category | Training Set | Validation Set | Testing Set |
|---|---|---|---|
| Aircraft carriers | 190 | 54 | 27 |
| Other military ships | 269 | 77 | 39 |
| Civilian ships | 294 | 84 | 42 |
| Target Category | Number of Test Data Points | Number of Correct Data Points | Precision | Average Precision |
|---|---|---|---|---|
| Aircraft carriers | 10 | 8 | 80% | 88.3% |
| Other military ships | 20 | 17 | 85% | |
| Civilian ships | 30 | 28 | 93.3% |
| Target Category | Training Set | Validation Set | Testing Set |
|---|---|---|---|
| Aircraft carriers | 190 | 54 | 27 |
| Destroyers | 161 | 47 | 23 |
| Cruisers | 108 | 31 | 15 |
| Bulk carriers | 105 | 30 | 15 |
| Tankers | 82 | 26 | 13 |
| Container ships | 97 | 28 | 14 |
| Extraction Ratio | Ship Category | Recall Rate | Precision Rate |
|---|---|---|---|
| 1/2 | Tankers | 98% | 95% |
| Bulk carriers | 96% | 99% | |
| Container ships | 99% | 98% | |
| Average | 97.49% | 97.39% | |
| 1/3 | Tankers | 90% | 92% |
| Bulk carriers | 91% | 96% | |
| Container ships | 97% | 88% | |
| Average | 92.12% | 92.72% | |
| 1/4 | Tankers | 54% | 19% |
| Bulk carriers | 53% | 89% | |
| Container ships | 75% | 67% | |
| Average | 60.60% | 58.56% |
| Target Category | Number of Test Data Points | Number of Correct Data Points | Precision | Average Precision |
|---|---|---|---|---|
| Aircraft carriers | 10 | 7 | 0.7 | 81.7% |
| Destroyers | 10 | 7 | 0.7 | |
| Cruisers | 10 | 7 | 0.7 | |
| Bulk carriers | 10 | 9 | 0.9 | |
| Tankers | 10 | 10 | 1.0 | |
| Container ships | 10 | 9 | 0.9 |
| Method | Coarse Focusing (s) | Coarse Classification (s) | Fine Focusing (s) | Fine Classification (s) | Total (s) |
|---|---|---|---|---|---|
| Proposed two-stage strategy | 0.8 | 0.009 | 1.5 | 0.01 | 2.319 |
| Single-stage strategy | / | / | 11.1 | 0.01 | 11.11 |
Disclaimer/Publisher’s Note: The statements, opinions and data contained in all publications are solely those of the individual author(s) and contributor(s) and not of MDPI and/or the editor(s). MDPI and/or the editor(s) disclaim responsibility for any injury to people or property resulting from any ideas, methods, instructions or products referred to in the content. |
© 2025 by the authors. Licensee MDPI, Basel, Switzerland. This article is an open access article distributed under the terms and conditions of the Creative Commons Attribution (CC BY) license (https://creativecommons.org/licenses/by/4.0/).
Share and Cite
Li, Z.; Yang, W.; Su, C.; Zeng, H.; Wang, Y.; Guo, J.; Xu, H. Fine Recognition of MEO SAR Ship Targets Based on a Multi-Level Focusing-Classification Strategy. Remote Sens. 2025, 17, 2599. https://doi.org/10.3390/rs17152599
Li Z, Yang W, Su C, Zeng H, Wang Y, Guo J, Xu H. Fine Recognition of MEO SAR Ship Targets Based on a Multi-Level Focusing-Classification Strategy. Remote Sensing. 2025; 17(15):2599. https://doi.org/10.3390/rs17152599
Chicago/Turabian StyleLi, Zhaohong, Wei Yang, Can Su, Hongcheng Zeng, Yamin Wang, Jiayi Guo, and Huaping Xu. 2025. "Fine Recognition of MEO SAR Ship Targets Based on a Multi-Level Focusing-Classification Strategy" Remote Sensing 17, no. 15: 2599. https://doi.org/10.3390/rs17152599
APA StyleLi, Z., Yang, W., Su, C., Zeng, H., Wang, Y., Guo, J., & Xu, H. (2025). Fine Recognition of MEO SAR Ship Targets Based on a Multi-Level Focusing-Classification Strategy. Remote Sensing, 17(15), 2599. https://doi.org/10.3390/rs17152599