Technical Note

Obtaining the Highest Quality from a Low-Cost Mobile Scanner: A Comparison of Several Pipelines with a New Scanning Device

1
Faculty of Forestry and Wood Sciences, Czech University of Life Sciences Prague, Kamýcká 129, 16500 Prague, Czech Republic
2
Graduate School of Agriculture, Kyoto University, Kyoto 606-8502, Japan
3
mapry Co., Ltd., Tamba 669-4125, Japan
4
Department of Geography, University College London, Gower Street, London WC1E 6BT, UK
*
Author to whom correspondence should be addressed.
Remote Sens. 2025, 17(15), 2564; https://doi.org/10.3390/rs17152564
Submission received: 13 May 2025 / Revised: 24 June 2025 / Accepted: 22 July 2025 / Published: 23 July 2025

Abstract

The accurate measurement of the tree diameter is vital for forest inventories, urban tree quality assessments, the management of roadside and railway vegetation, and various other applications. It also plays a crucial role in evaluating tree growth dynamics, which are closely linked to tree health, structural stability, and vulnerability. Although a range of devices and methodologies are currently under investigation, the widespread adoption of laser scanners remains constrained by their high cost. This study therefore aimed to compare high-end laser scanners (Trimble TX8 and GeoSLAM ZEB Horizon) with cost-effective alternatives, represented by the Apple iPhone 14 Pro and the LA03 scanner developed by mapry Co., Ltd. (Tamba, Japan). It further sought to evaluate the feasibility of employing these more affordable devices, even for small-scale forest owners or managers. Given the growing availability of 3D-based forest inventory algorithms, a selection of such processing pipelines was used to assess the practical potential of the scanning devices. The tested low-cost device produced moderate results, achieving a tree detection rate of up to 78% and a relative root mean square error (rRMSE) of 19.7% in diameter at breast height (DBH) estimation. However, performance varied depending on the algorithms applied. In contrast, the high-end mobile laser scanning (MLS) and terrestrial laser scanning (TLS) systems outperformed the low-cost alternative across all metrics, with tree detection rates reaching up to 99% and DBH estimation rRMSEs as low as 5%. Nevertheless, the low-cost device may still be suitable for scanning small sample plots at a reduced cost and could potentially be deployed in larger quantities to support broader forest inventory initiatives.

Graphical Abstract

1. Introduction

The mapping and monitoring of trees on a global scale are becoming increasingly critical, particularly in light of the growing need to address climate change and rapid ecosystem transformations. This heightened awareness has catalysed the development of innovative strategies, such as climate-smart forestry [1]. In this context, managed forests are expected to become more resilient to climate change by adopting more structured and diverse compositions. However, these changes present new challenges for forest inventories, which must adapt to increasingly complex forest structures.
The integration of advanced technologies into forest inventory practices is thus essential—not only due to their growing availability but also because of their capacity to enhance efficiency, improve accuracy, and facilitate more frequent and extensive data acquisition [2]. At present, national forest inventories (NFIs) serve as the primary mechanism for the monitoring of forests, typically employing statistical sampling frameworks [3]. NFIs generate substantial datasets that are indispensable for policymaking and forest management at national and broader scales [4,5]. However, these inventories suffer from limited spatial coverage relative to the total forested area. Standard NFI protocols employ grid sampling at 1 × 1 km or, in some instances, 2 × 2 km intervals, with each plot representing between 0.05 and 0.2 hectares. Consequently, NFIs cover less than one per cent of the total forest area. Remote sensing technologies offer a promising solution to this limitation by significantly expanding the spatial extent of forest monitoring. As a result, current research is increasingly focused on developing cost-effective and operationally viable remote sensing methodologies. For instance, Čerňava et al. [6] demonstrated the feasibility of mounting mobile LiDAR scanners on forest tractors, enabling efficient scanning along forest roads and skidding trails. Similarly, wearable scanning devices have been recognised as practical tools for the collection of data over broader areas with minimal logistical constraints [7,8].
Among the tree attributes that are commonly assessed, the most fundamental include the diameter at breast height (DBH), tree height, tree volume, and species. These parameters form the basis for the estimation of additional characteristics through the application of allometric models [9] or other methods. The DBH, measured at 1.3 m above ground level, is widely used due to its ease of acquisition and its reduced susceptibility to variation caused by root flare [10]. While calliper-based DBH measurement is technically straightforward, it is labour-intensive and time-consuming. Moreover, this method captures only the partial stem geometry, introducing a risk of measurement bias—an issue noted by Shangyang et al. [11]. Similarly, tree height measurements in traditional forestry practices are frequently hampered by visual obstructions in dense, closed-canopy stands. This parameter, although critical, is often subject to significant errors due to limited visibility and operator subjectivity [12]. In contrast, other tree parameters, such as the crown architecture and volume, are generally more challenging to quantify in the field. As a result, most well-established allometric models primarily rely on the DBH and tree height as key input variables [13,14]. Over time, various tools have been developed to improve the speed, precision, and cost-effectiveness of DBH measurement, ranging from traditional callipers to modern LiDAR-based systems [3,4]. Over the past two decades, significant progress has been made in the application of ground-based remote sensing technologies, particularly those employing laser scanning (LiDAR) and photogrammetric techniques. Among these, LiDAR has demonstrated notable operational potential for forest inventory purposes [15]. The introduction of close-range laser scanning devices has led to new possibilities for forestry measurements, contributing to both forest inventory enhancement [16] and forest ecology research [17]. Nonetheless, the effective operational integration of these devices necessitates further research to establish practical workflows and tools tailored to routine use in forestry applications [15].
Terrestrial laser scanners (TLS) were among the first close-range devices adapted for forest measurement. These instruments typically offer high precision but are limited by their requirement for stationary operation during scanning. This constraint leads to occlusions—particularly behind tree stems—that complicate data processing and interpretation [18,19]. A common mitigation strategy involves employing a multi-scan approach, whereby data from multiple vantage points are merged to reduce occlusion. However, this method significantly increases both the data volume and acquisition time [20].
Mobile laser scanning (MLS) offers a compelling alternative to TLS. MLS systems have been extensively studied for forest applications and can be mounted on various carriers, such as all-terrain vehicles (ATVs) or tractors, or operated in handheld configurations [21,22]. When carried by an operator, MLS devices may be either handheld or backpack-mounted [23,24]. Despite the operational advantages of MLS—particularly its mobility and reduced occlusion—the high cost of most commercial systems remains a substantial barrier to widespread adoption. This has prompted growing interest in the development of low-cost MLS alternatives [18].
One such alternative is smartphone-based laser scanning, particularly using LiDAR-equipped iPhones or iPads [25,26]. These devices offer immediate visual feedback, enabling real-time verification and rescanning if necessary. Additionally, they serve as valuable educational tools, allowing students to perform and interpret field scans interactively [26].
Studies have demonstrated the potential of these devices for DBH estimation, achieving root mean square errors (RMSEs) as low as 2.27 cm [23] and up to 4.51 cm [26] in applications using LiDAR-equipped iPhones. Gollob et al. [27] evaluated five DBH estimation approaches using iPad LiDAR, with the best-performing model yielding an RMSE of 3.13 cm. Similarly, Çakir et al. [23] achieved an RMSE of 1.9 cm in managed forests using iPad LiDAR, while Mokroš et al. reported an RMSE of 3.14 cm [28], and Tatsumi et al. achieved 2.32 cm [25]. These results are generally considered acceptable for operational use. However, the primary limitation of this approach lies in its scanning range, which necessitates close proximity to each tree, raising questions about its efficiency for large-scale data collection.
Beyond Apple devices, Android smartphones equipped with the ARTree-Watch application have also demonstrated promising performance. This application generates point clouds by fusing RGB imagery with inertial measurement unit (IMU) data, achieving DBH estimation RMSEs as low as 1.14 cm [29]. Likewise, Hyyppä et al. [30] derived point clouds from range images using the Microsoft Azure Kinect and Google Tango, attaining DBH estimation errors of 1.9 cm and 0.73 cm, respectively. Tomaštík et al. [31] also reported RMSEs ranging from 1.61 to 2.10 cm using the Google Tango.
As highlighted in the aforementioned studies, the equipment cost remains one of the primary constraints to the broader adoption of advanced forest scanning technologies [32]. Addressing this issue, the present study introduces a new handheld, low-cost MLS prototype, developed with an estimated production cost of approximately EUR 2000. This prototype has the potential to be mass-produced, offering an accessible solution for small-scale forest owners, researchers, and institutions with limited budgets.
This study evaluates the performance of the proposed low-cost MLS device in comparison with another affordable alternative—an iPhone LiDAR sensor—and two state-of-the-art systems: the Trimble TLS and the Geoslam ZEB Horizon handheld MLS. Both are widely recognised for their precision and reliability but are associated with significantly higher costs. The comparison focuses on the tree detection capabilities and DBH measurement accuracy, with results from the other devices included to provide insights into the performance achievable across different cost categories. The prototype is described in detail in the following sections, including its hardware specifications and operational features. Furthermore, the study examines the prototype’s performance across various open-source data processing pipelines to assess the practical value of the resulting point clouds for forest inventory applications.

2. Materials and Methods
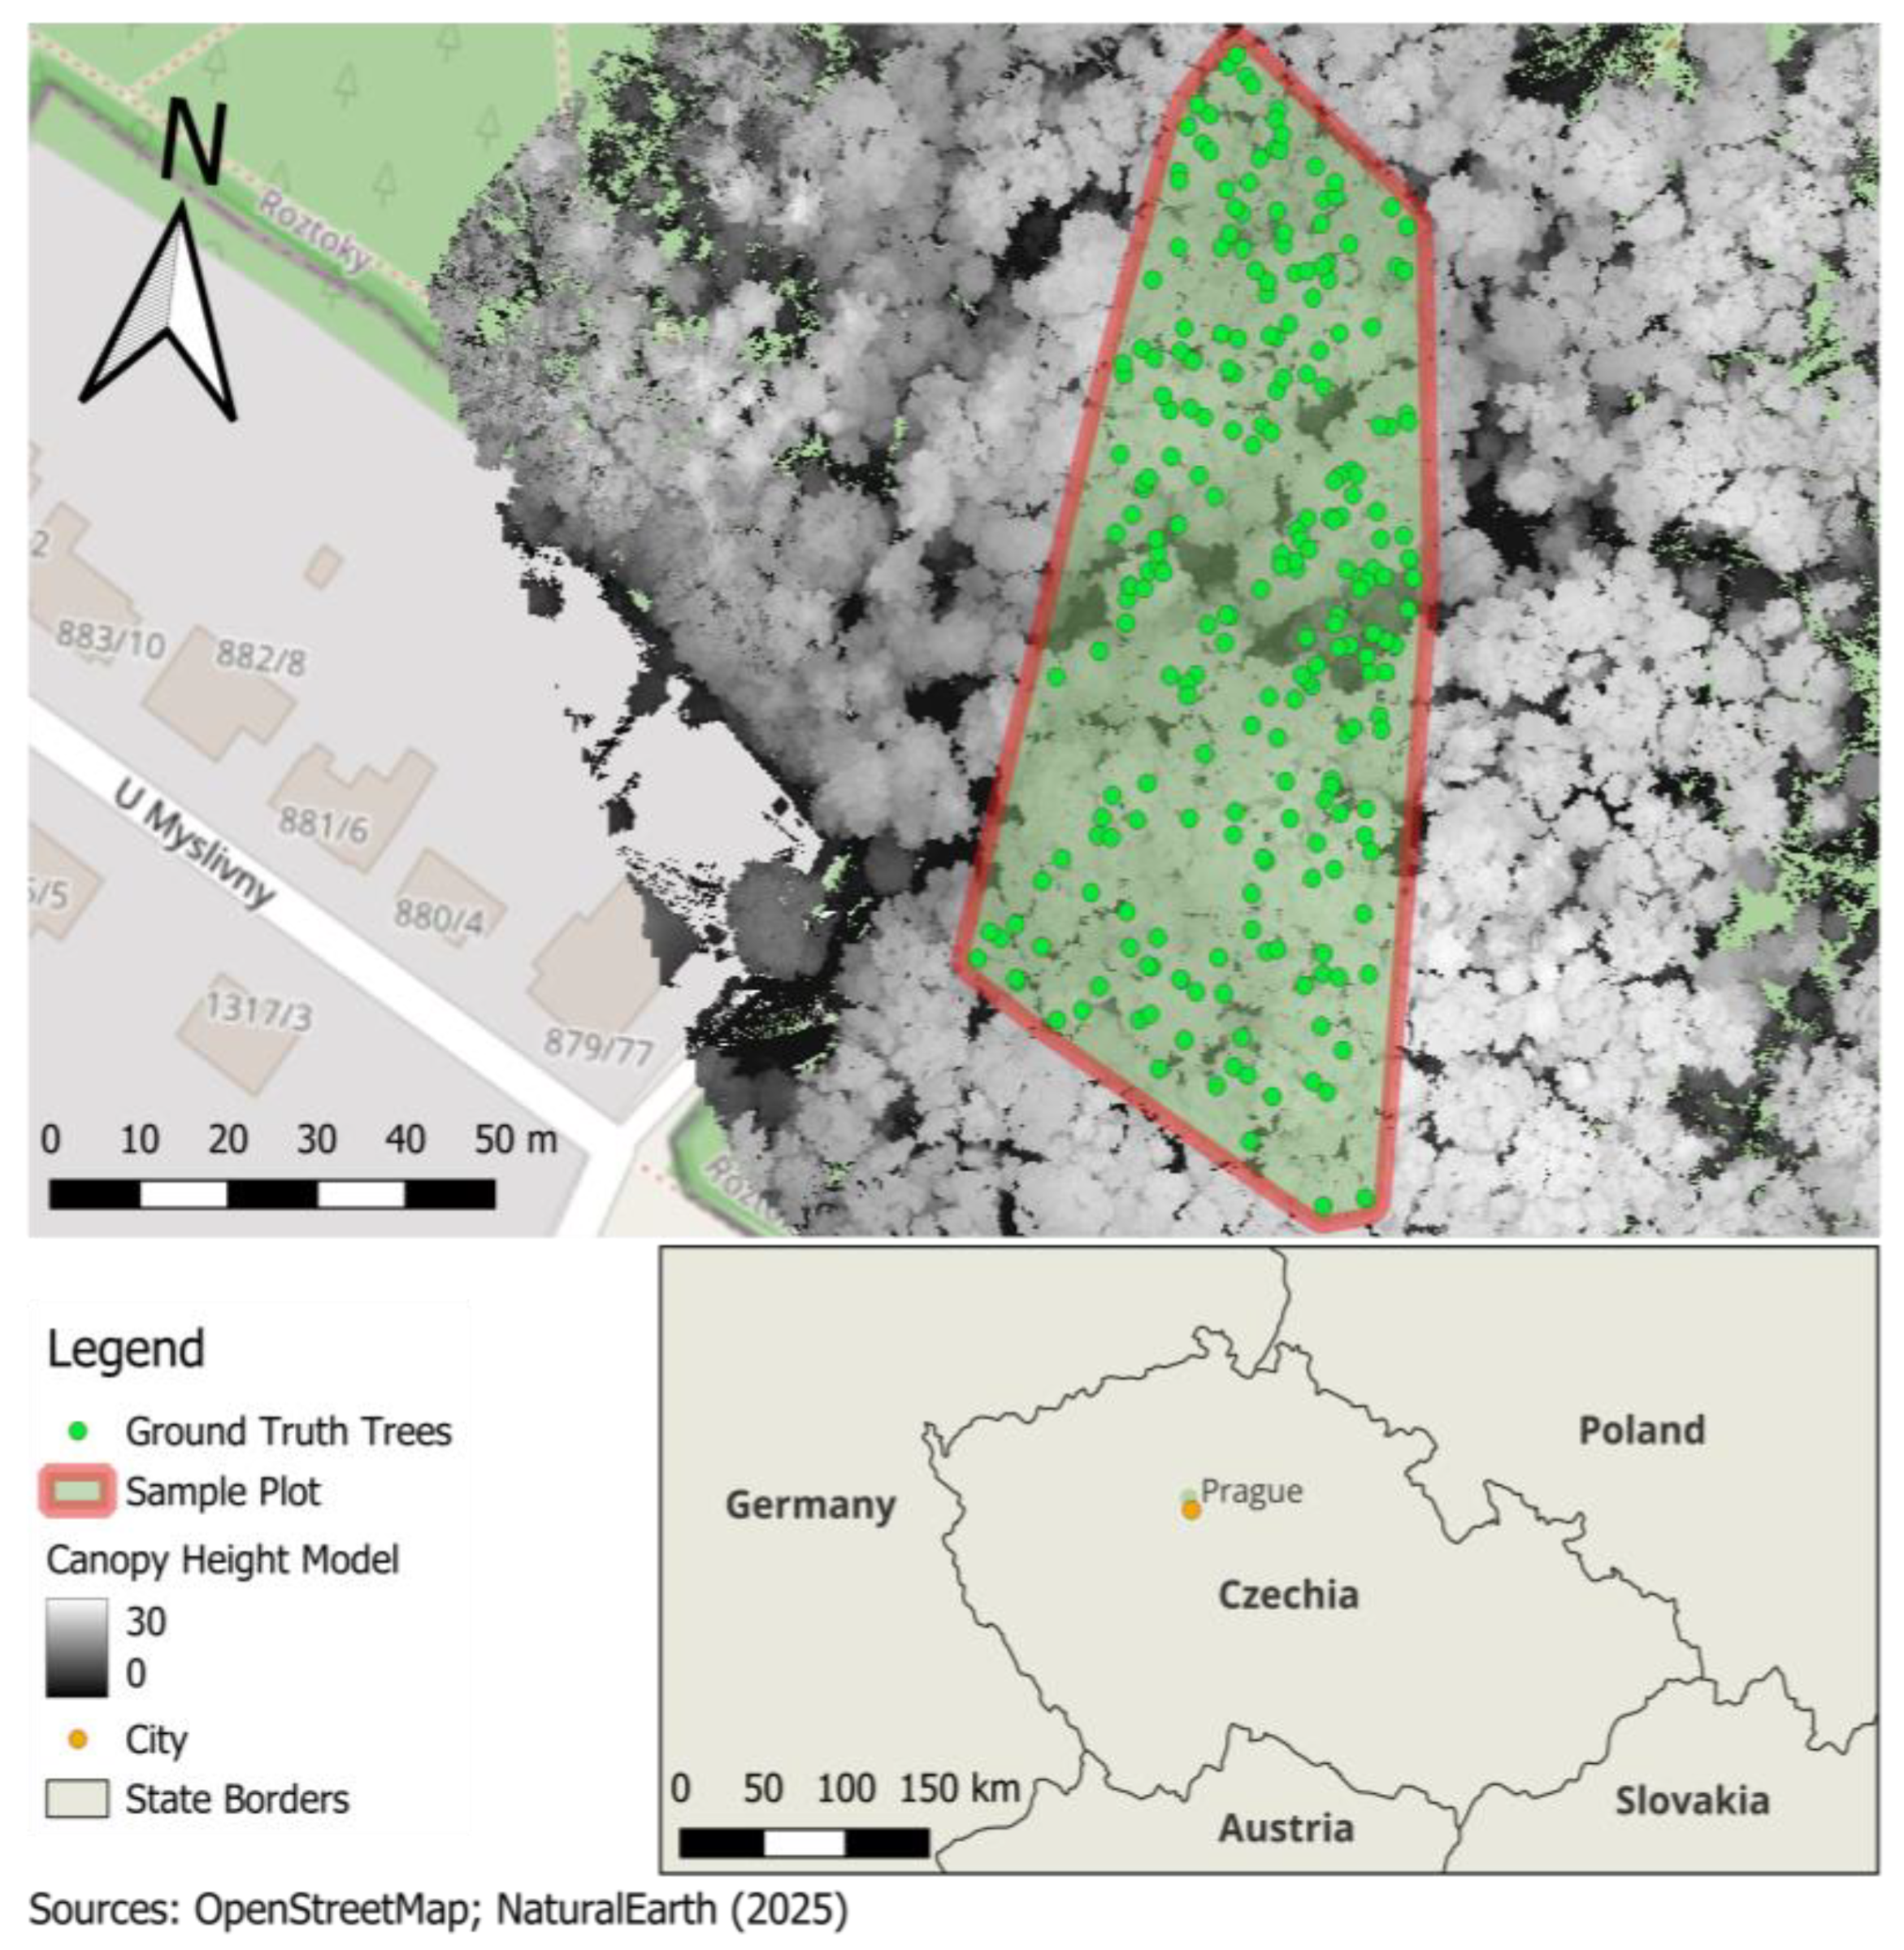
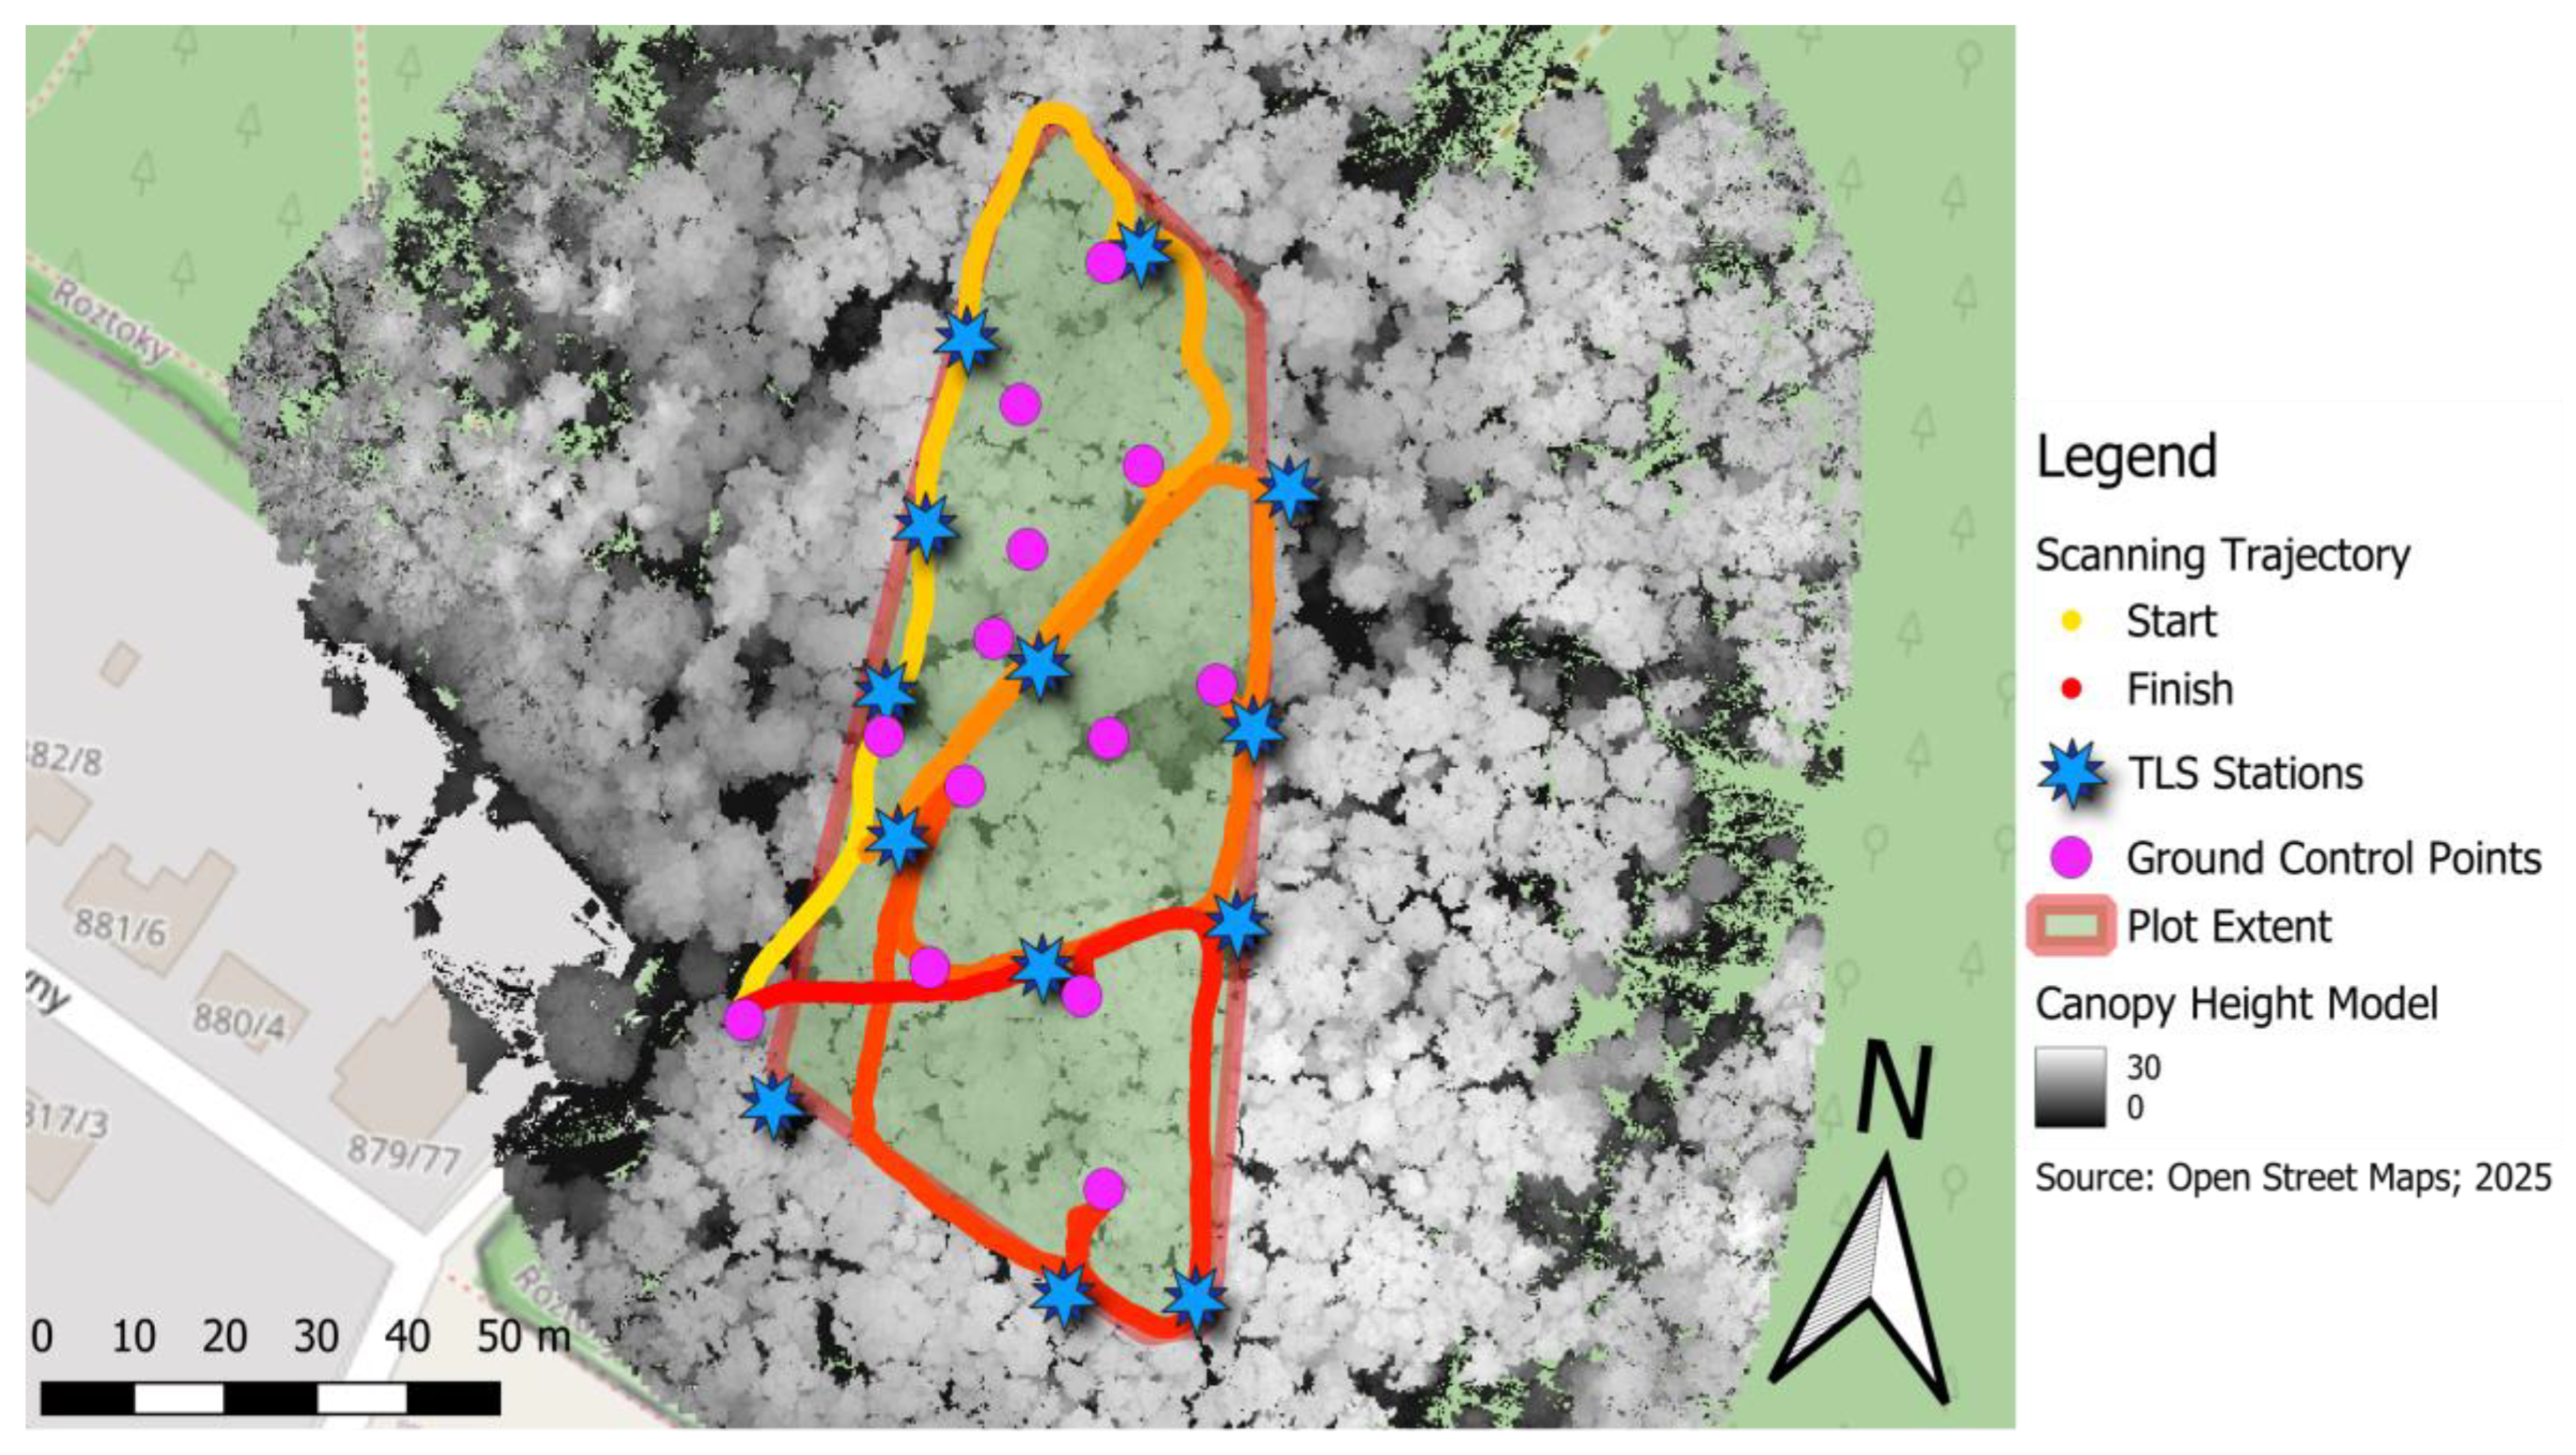
2.1. Study Area

This study was conducted in a forested area on the outskirts of Prague, Czech Republic, within the boundaries of the Roztocký háj–Tiché údolí nature reserve.
The research plot covers an area of approximately 0.4 hectares and comprises a two-storey forest structure dominated by Sessile Oak (Quercus petraea) and Northern Red Oak (Quercus rubra). The lower storey primarily consists of dense regeneration of Northern Red Oak and Common Hornbeam (Carpinus betulus).
The terrain across the entire plot is flat and easily accessible through many pathways, which also determined the shape of the sample plot.
The geographical location of the plot, as well as the positions of 236 individual measured trees, is illustrated in Figure 1.

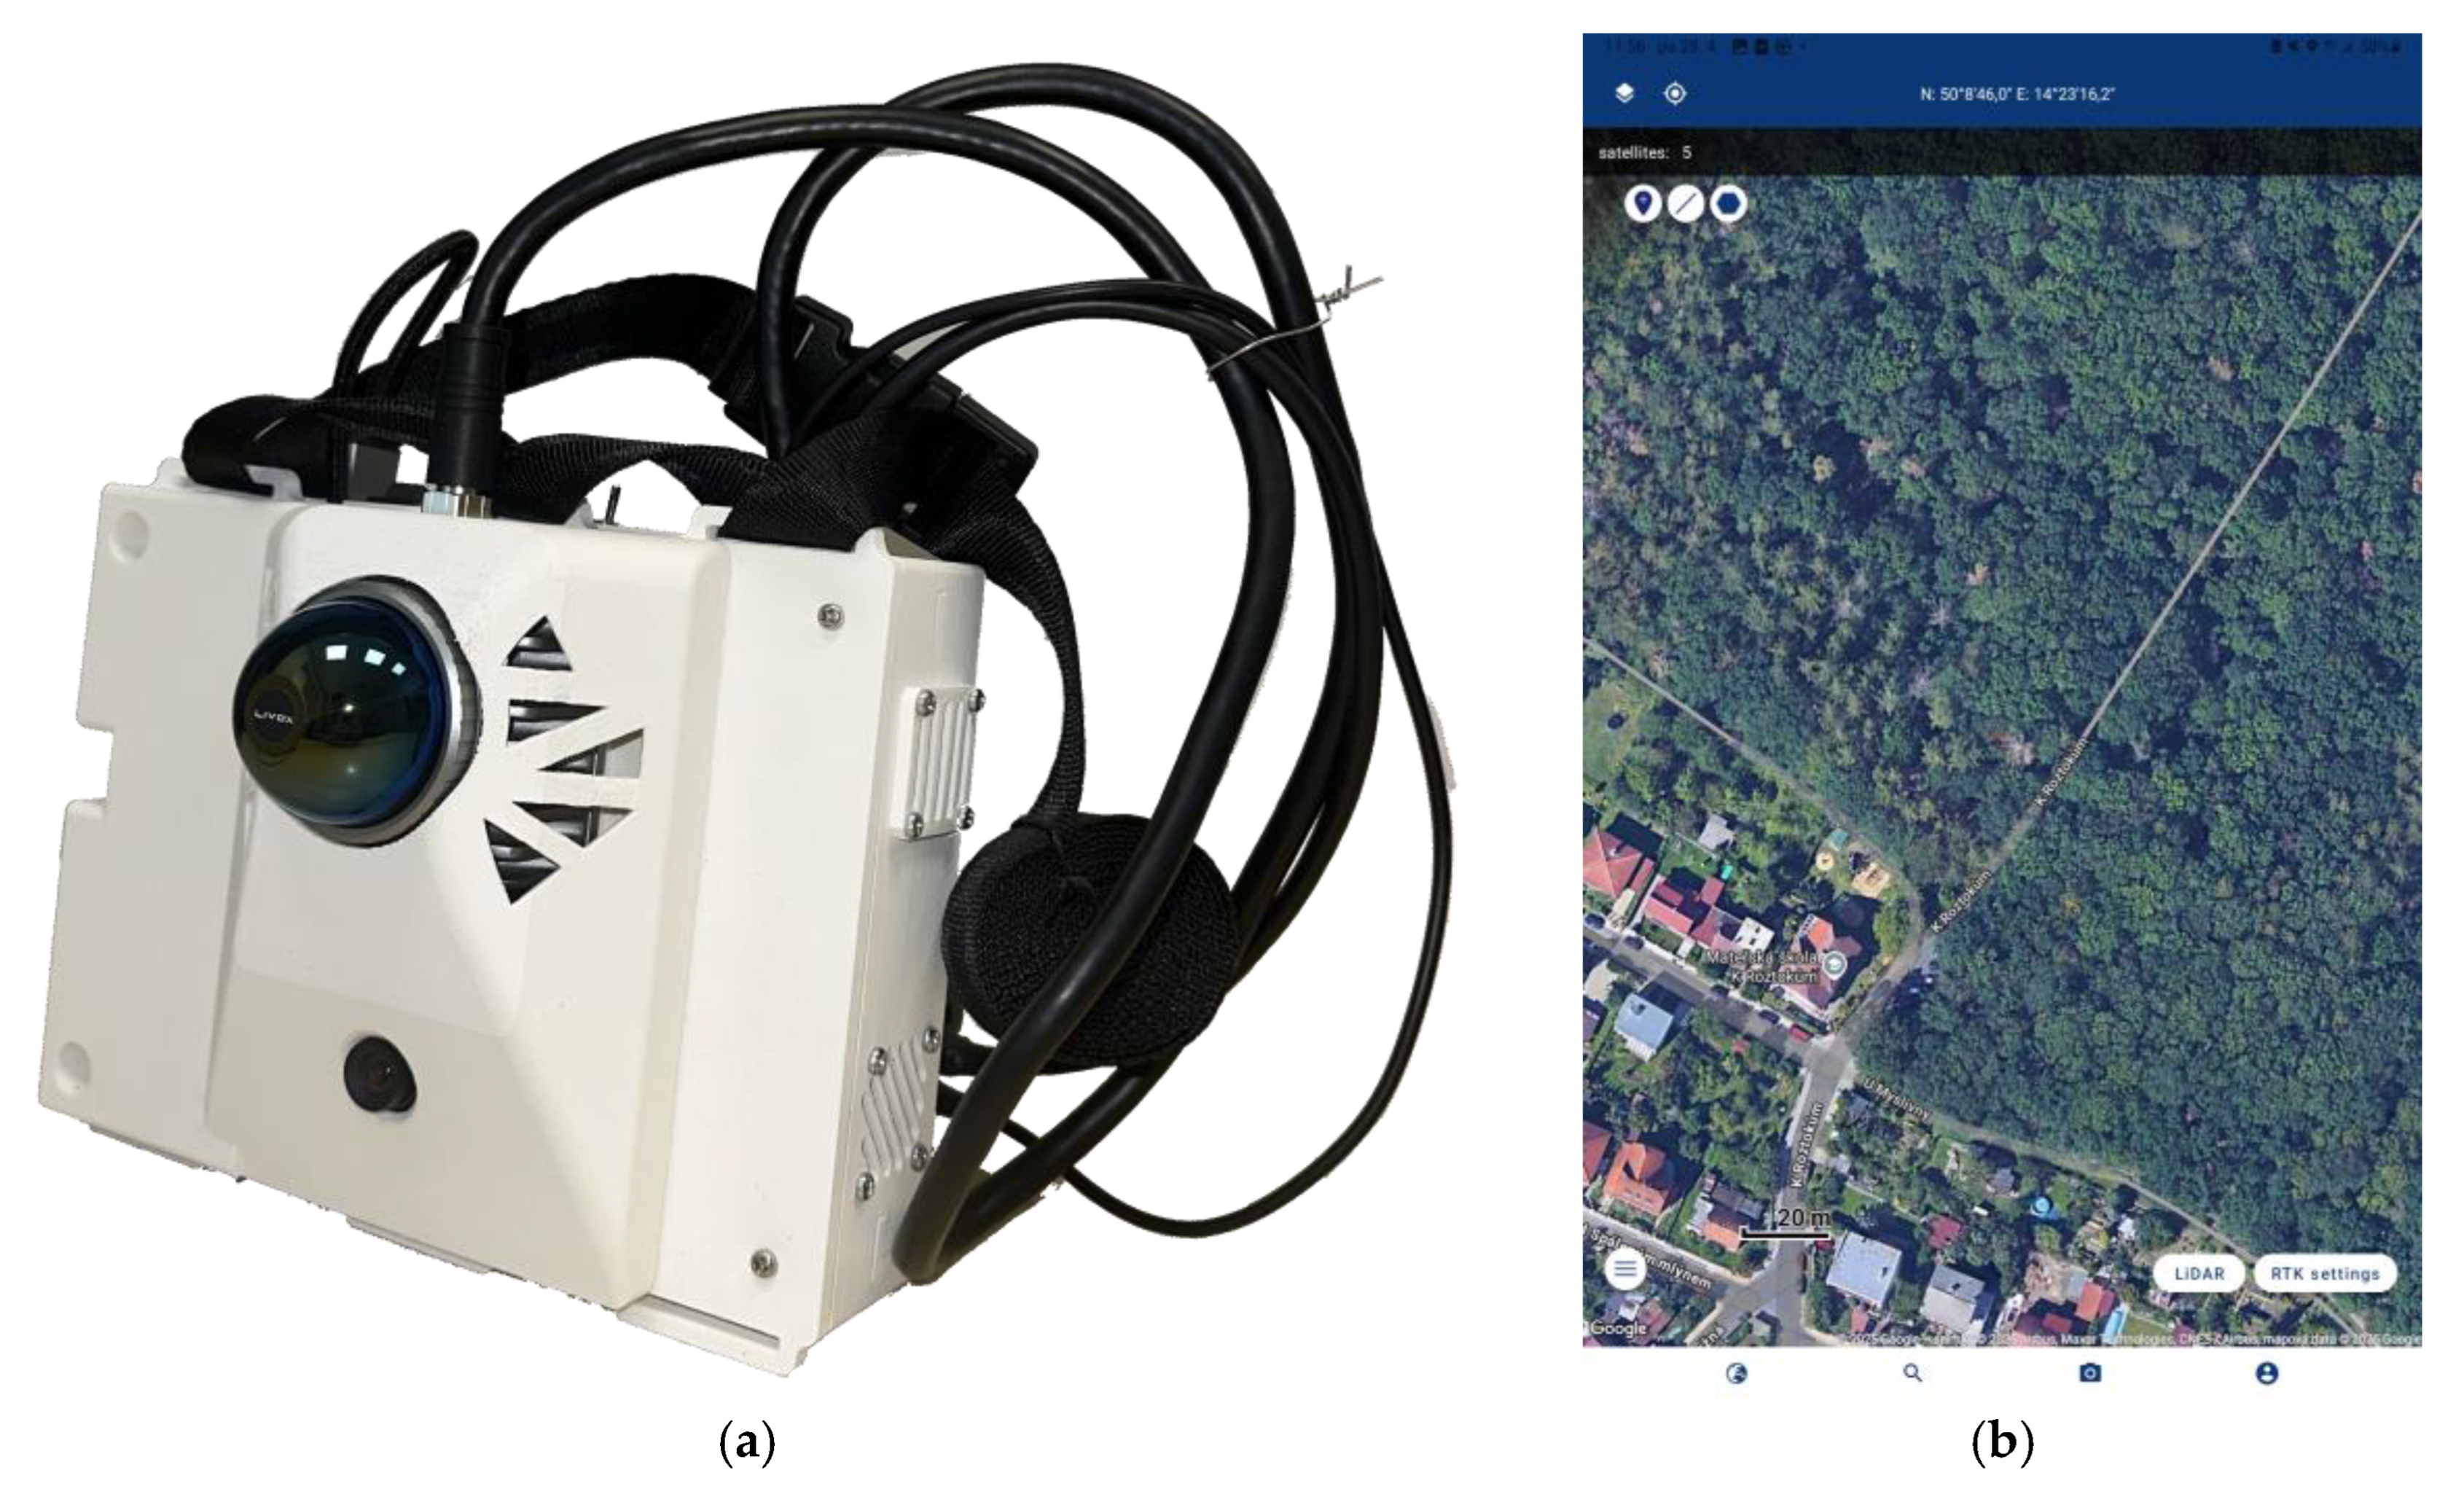
2.2. The LiDAR Scanner Prototype

The prototype scanning device, designated as LA03 (illustrated in Figure 2a), was developed to provide a compact, cost-effective solution for terrestrial forest data acquisition. At the core of the system is the Livox MID-360 LiDAR sensor (Livox Technology Company Ltd., Wan Chai, Hong Kong) [33], which is capable of detecting objects at distances of up to 40 m. The sensor offers a comprehensive 360° horizontal field of view (FoV), accompanied by a vertical FoV ranging from −7° to 52°, allowing for extensive spatial coverage with a single pass. This wide-angle sensing capability is particularly advantageous for forest applications, where complex canopy structures and understory vegetation necessitate broad and detailed scanning perspectives.
The Livox MID-360 sensor operates by collecting 200,000 first-return points per second, ensuring a dense and continuous stream of three-dimensional data. However, a multi-return scanning mode is not supported. The manufacturer specifies measurement precision of less than 2 cm at a target distance of 10 m, which is suitable for estimating tree attributes such as the diameter at breast height (DBH), stem form, and canopy structure. Additionally, the sensor is produced with an integrated inertial measurement unit (IMU, model ICM40609-D produced by TDK Electronics Ltd (Shanghai, China) [34]), which records orientation and movement data during operation. This information is crucial for post-processing tasks such as trajectory estimation and point cloud registration. Weighing only 265 g, the sensor is compact and lightweight, making it suitable for mobile, backpack-mounted configurations that do not impede operator mobility in forested environments.
The full LA03 system includes several auxiliary components that support its functionality and ensure independent field operation. Power is supplied by an external power bank, allowing for extended use without reliance on fixed infrastructure. Data captured by the sensor are stored locally on a USB flash drive, ensuring robustness and portability in field conditions. A Bluetooth low energy (BLE) module is integrated into the system to enable wireless communication with a dedicated smartphone application, which provides a user-friendly interface for the management of the scanning process. In addition, the device includes a compact RGB camera for the capture of supplementary visual data, which can assist in ground truthing and further documentation.
Control of the scanner is facilitated through the mapry mobile application (Figure 2b), which was developed by one of the study’s authors (Keiji Yamaguchi, mapry Co., Ltd., Tamba, Japan) and is currently available for download on the Google Play platform. The primary function of the application is to establish and maintain communication with the LiDAR sensor, enabling real-time monitoring of the system status and sensor diagnostics. Upon confirming that all components are functioning correctly, users can initiate the scanning process directly from the mobile interface. The application allows for the seamless transfer and saving of collected data to a USB storage device in the widely used point cloud data (.pcd) file format, ensuring compatibility with various open-source and commercial point cloud processing tools.
Overall, the LA03 prototype represents a promising advancement in the development of lightweight and affordable mobile laser scanning systems for forestry applications. Its modular design, reliance on off-the-shelf components, and ease of operation make it particularly suitable for fieldwork conducted by smaller research teams, educational institutions, or forest managers operating with limited financial resources.

2.3. Data Collection

As indicated in Figure 3, the data collection process involved terrestrial and mobile LiDAR scanning using four different devices, each representing a distinct category of forest measurement technology.
Ground truth reference data were collected in accordance with standard forest inventory methodologies. These included the manual measurement of the diameter at breast height (DBH) at 1.3 m above ground level for each tree (DBH > 4 cm) within the study plot. This was achieved using an electronical calliper, the Haglöf Mantax Digitech (Haglöf, Långsele, Sweden), which was applied to the trees from a random direction to eliminate the possible impact of systematic stem shape irregularities throughout the forest stand. Along with the DBH, the precise geolocation of tree positions using a Sokkia GRX3 (TOPCON EUROPE POSITIONING BV, Zoetermeer, The Netherlands) global navigation satellite system (GNSS) receiver was conducted. The high-accuracy GNSS device ensured reliable spatial reference data, which served as a benchmark in evaluating the geometric accuracy of the point cloud data generated by each scanning system. In such a manner, 236 trees in both the upper and lower storeys were measured, and the overall properties of the measured trees are presented in Figure 4.
All scanning procedures followed a predefined trajectory through the plot (Figure 5), designed to maintain consistency across devices and facilitate the direct comparison of the resulting datasets. The trajectory was established by following distinct pathways within the forest, thereby ensuring consistency across all scanners. The common scanning path ensured that variations in data quality and completeness could be attributed primarily to the characteristics of the scanning systems themselves, rather than differences in spatial coverage or operator behaviour. Although this approach may not be ideal for certain scanner types, particularly those with limited LiDAR beam reach, this study focused on evaluating the potential of the 3D outputs that could be obtained within a comparable time frame. This was performed with consideration of the device cost, which does not necessarily scale proportionally with the scanning performance.
The LiDAR devices used in this study were as follows.
  • Trimble TX8 (TLS)
    The Trimble TX8 (Trible Inc., Westminster, CA, USA) is a high-end terrestrial laser scanner that employs a multi-scan acquisition strategy. This approach, widely recognised as the most established and conventional LiDAR scanning method in forestry applications, offers the highest spatial resolution and geometric accuracy. In this study, scanning was performed from 13 individual, georeferenced stations strategically distributed along the predefined trajectory to ensure maximum visibility and coverage. The multi-scan technique mitigates occlusion effects by capturing the forest structure from multiple angles, making it the most precise reference system in the comparison. The raw scan data must be processed using the dedicated software Trimble RealWorks (v11.1), which also provides a registration workflow for the processing and merging of multi-scan missions [35]. In this study, cloud-Based registration was employed.
  • GeoSLAM ZEB Horizon (MLS)
    The GeoSLAM ZEB Horizon (GeoSLAM Ltd., Ruddington, UK) is a handheld mobile laser scanner that collects data through a single-pass scan along the designated trajectory. Scanning began and ended at the same location to form a closed-loop trajectory, which supports improved SLAM (Simultaneous Localisation And Mapping) correction [36]. During scanning, the operator maintained a consistent orientation towards the centre of the plot to ensure optimal coverage of the forest structure. The ZEB Horizon is a commercial-grade mobile laser scanning (MLS) system, recognised for its robustness and reliability in forest environments. Similarly to the Trimble TX8, this device also relies on dedicated commercial software, namely GeoSLAM Hub v6.1.0, for the processing of raw data into point clouds.
  • iPhone (MLS)
    A modern Apple iPhone 14 Pro (Apple Inc., Cupertino, CA, USA), equipped with an integrated LiDAR sensor, was used to perform mobile scanning along the same trajectory. Data collection was carried out using the 3D Scanner App [37], which enables the real-time acquisition and export of point cloud data. The same scanning principles were applied as with the ZEB Horizon and LA03, including consistent device orientation and a closed-loop trajectory, to maintain uniform scanning conditions. However, in the case of this device, suboptimal results can be expected due to the limited 5-metre reach of its LiDAR sensor [38].
  • mapry LA03 (MLS)
    The custom-developed LA03 prototype was evaluated using the same scanning protocol as the ZEB Horizon to ensure comparability. The device was carried along the predefined trajectory, with the operator consistently orienting the sensor towards the plot centre. This ensured consistent scanning geometry and data acquisition conditions, enabling a direct assessment of the prototype’s performance relative to more established devices. The device operates via the dedicated Android application mapry, which provides a user interface for the control of the scanner. The collected data are output directly to a USB drive.
This comparative study design enabled a systematic evaluation of each device’s capabilities in terms of tree detection, DBH estimation, and overall point cloud quality. By adhering to a consistent scanning strategy and integrating high-accuracy reference data, the methodology provides a robust framework for the assessment of the feasibility and performance of low-cost mobile scanning solutions in forest inventory applications.

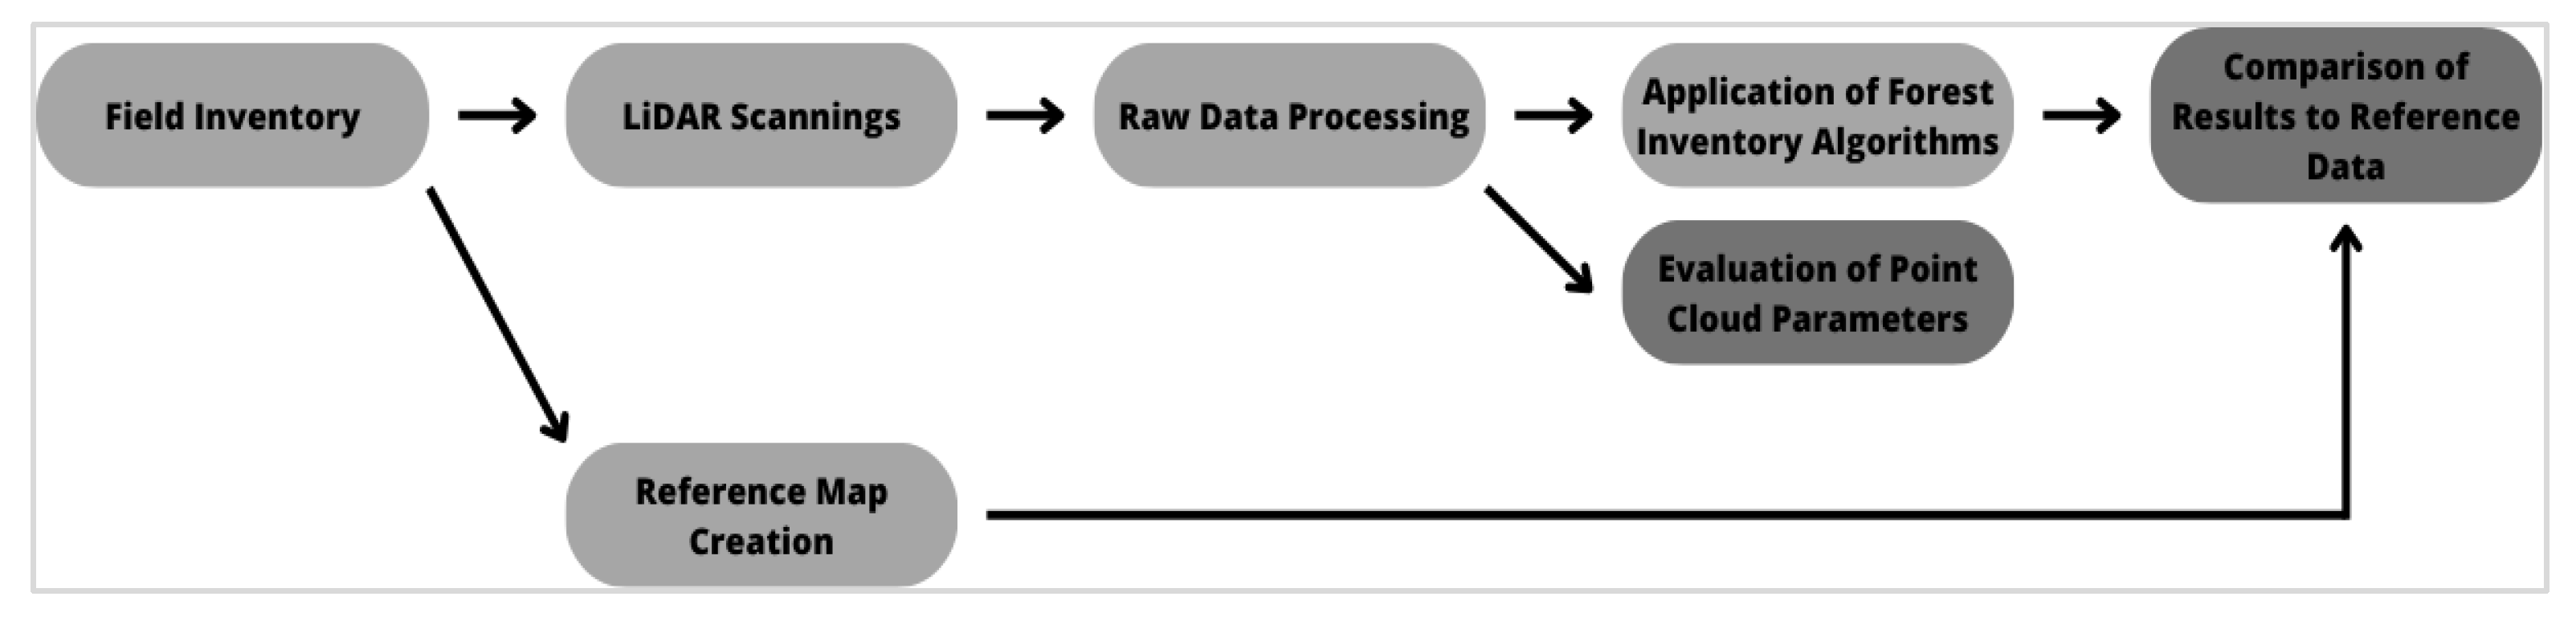
2.4. Data Processing and Evaluation

The primary objective of this study is to evaluate the performance of a low-cost mobile laser scanning (MLS) device—specifically, the mapry LA03—by comparing it with other established LiDAR scanning tools. This analysis is conducted under the premise that scanning devices with differing technical specifications—such as point cloud density, spatial resolution, and effective scanning range—may produce varied outputs, which in turn can affect the accuracy of forest inventory metrics, most notably tree detection and diameter at breast height (DBH) estimation.
Recognising that the quality and structure of input 3D data can significantly influence analytical outcomes, this study also investigates how various forest inventory algorithms respond to data from different scanning sources. In particular, it explores whether the data collected by the low-cost mapry device are robust and versatile enough to yield reliable results across a range of analytical approaches. This dual focus enables a comprehensive assessment of both the hardware’s capabilities and the practical usability of its output data within common forest inventory workflows.
To this end, five algorithmic pipelines are employed to assess the influence of methodological variations on tree detection and DBH estimation. The intention is not to conduct a comparative evaluation of the algorithms themselves or to identify the “best” pipeline. Rather, the aim is to evaluate the extent to which the data captured by the mapry scanner can support different approaches to automated tree measurement. This approach allows for a broader understanding of the scanner’s practical applicability in diverse analytical contexts and enhances the reproducibility of the results.
Each of the tested pipelines relies on the Random Sample Consensus (RANSAC) algorithm for DBH estimation, using a circle-fitting approach to approximate tree stem cross-sections. This method is commonly used for its robustness against incomplete scans or outliers, as illustrated in Figure 6. While the circle-fitting component remains consistent across all methods, the pipelines differ significantly in their strategies of detecting tree cross-sections within the point cloud. These detection techniques vary in their sensitivity to point cloud properties such as density, completeness, and noise, all of which are influenced by the characteristics of the scanning device and scanning conditions.
Among the factors influencing the DBH estimation accuracy, tree detection plays the most critical role. Incomplete or inaccurate detection of tree stems can lead to substantial errors in DBH values, regardless of the precision of the circle-fitting algorithm. For this reason, this study places particular emphasis on comparing how effectively each pipeline identifies tree stems across the datasets generated by the various scanners. By doing so, it offers insight into the strengths and limitations of the mapry device, not only in terms of raw data capture but also in its integration with existing data processing methodologies commonly used in forest inventory analysis.
As mentioned before, five pipelines are used within this study to assess the reliability of the mapry scanner. These will be described below.
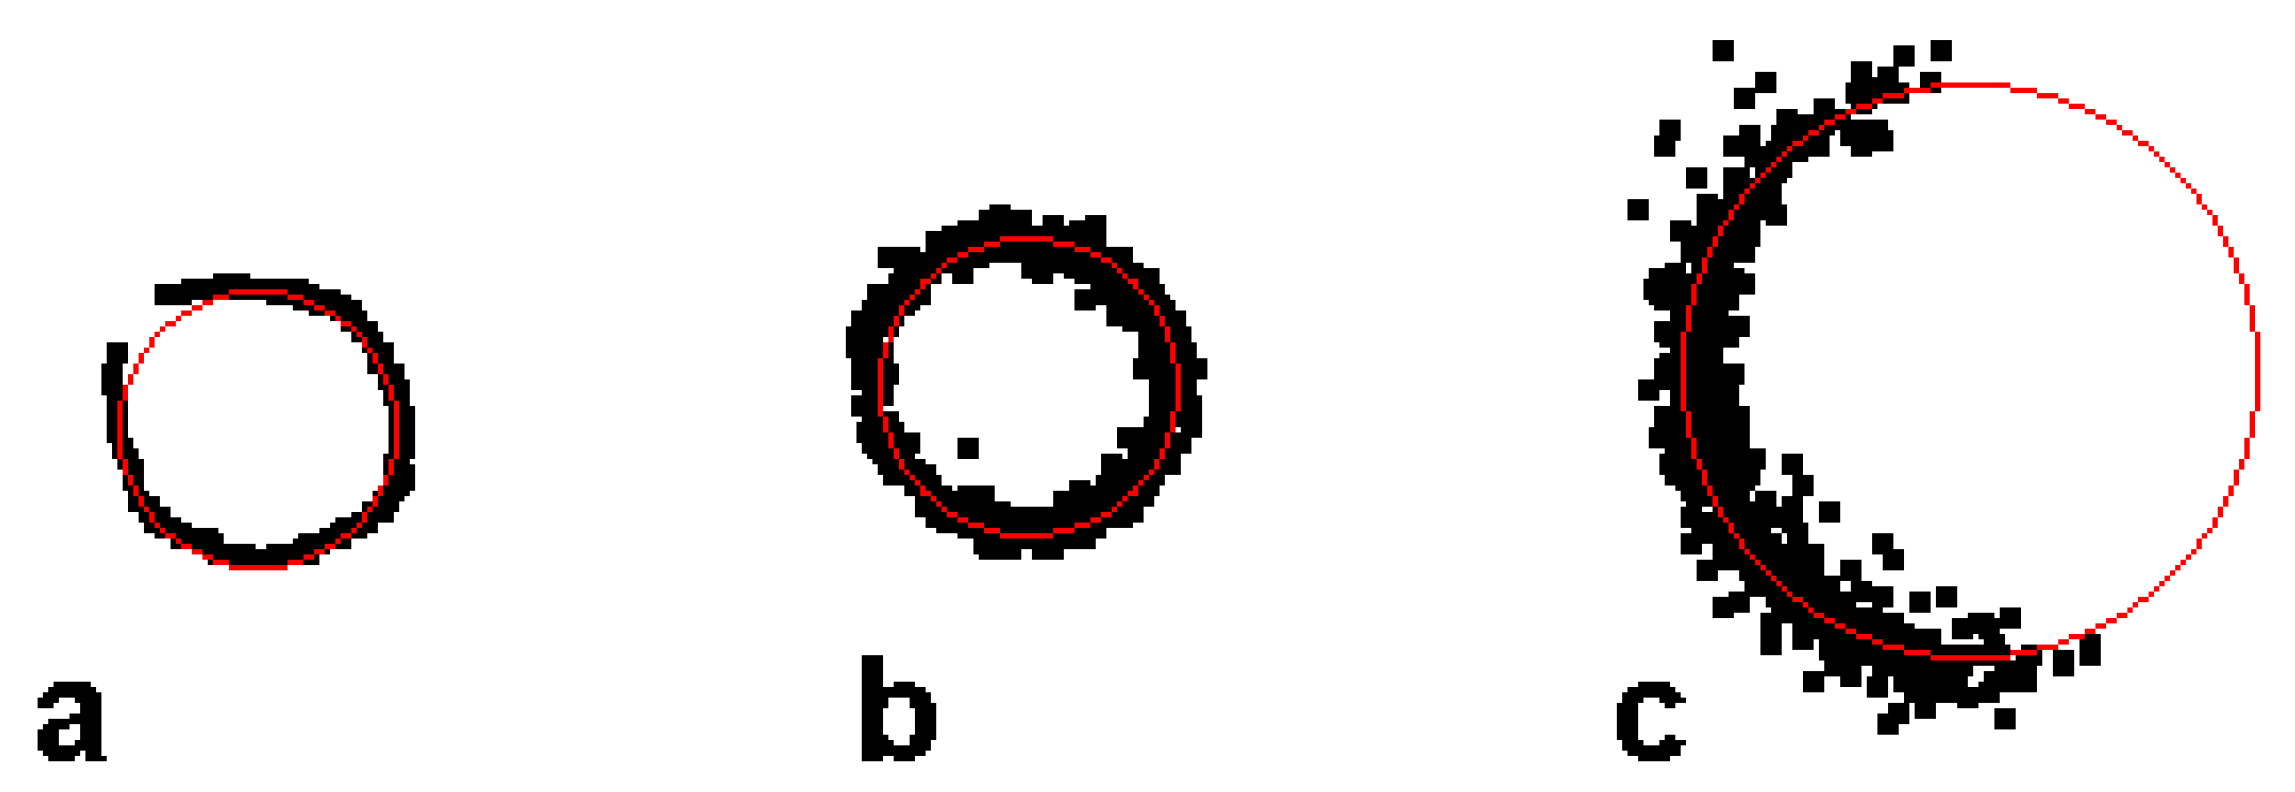
  • Manual Approach—This method is designed to provide the most accurate information obtainable from LiDAR scans, relying on the manual identification and extraction of stem cross-sections from the data. In contrast, the other methods—3DFIn, FORTLS, SAMICE, and DendRobot—perform fully automated data processing, as detailed in the following sections. While these automated approaches offer greater efficiency, they may introduce potential errors. Such discrepancies can be assessed by comparing their outputs to those obtained through manual processing, which serves as the benchmark for accuracy.
    For the purpose of this method, point clouds from all devices were normalised to a digital terrain model (DTM), created through the rasterisation of the point cloud, detecting the lowest points within 1 m grid cells. Afterwards, a 10-cm-thick horizontal slice at 1.3 m above ground level was extracted. Tree-specific segments were then isolated from these slices using the CloudCompare (v2.13.2) software by combining the Label Connected Components tool [39], with ambiguous segments manually excluded, resulting in a total of up to hundreds of usable cross-sections. Due to the computational limitations of the custom RANSAC algorithm used in this method, the number of points in each section was reduced to a maximum of 600 via random subsampling and further optimised by voxelisation with 1 cm steps. This process takes less than one minute per tree and its duration increases approximately linearly with larger DBHs.
    The RANSAC algorithm in general identifies the most common radius within a dataset by analysing randomly sampled subsets of points. This sampling may be either purely random or exhaustive, testing all possible point combinations. In this study, the latter, known as the brute-force method, was employed. To mitigate its computational demands, the algorithm was optimised for datasets containing fewer than 600 points, thereby avoiding the need for billions of iterations and the substantial storage and processing resources required. For most trees, a sample size of 600 points was found to be sufficient.
    The algorithm determines the size and position of a circle for each triplet of points, and the most frequently occurring circle is identified as the correct one. Figure 6 illustrates examples of the outputs generated using this approach.
  • FORTLS—All aforementioned point cloud data were analysed using the R package FORTLS (v1.2.0) [40]. This package provides an automated workflow for the processing of terrestrial and mobile laser scanning data and is designed to minimise manual intervention while maintaining flexibility through user-defined parameter settings. FORTLS generates key forest inventory outputs, including the diameter at breast height (DBH) and tree spatial location, and is particularly suitable for large-scale or repeatable forest structure assessments.
    During processing, ground points are classified using the Cloth Simulation Filter, and a digital terrain model is generated by spatial interpolation with a k-nearest neighbour approach using inverse distance weighting at a resolution of 0.2 m. The DTM is then used to normalise the point clouds by adjusting point elevations relative to the ground level.
    Tree detection in FORTLS is based on the identification of multiple horizontal cross-sections that are vertically aligned and located above the same ground point. This vertical consistency in cross-section positioning is used to infer the presence of a tree stem [41]. The algorithm searches for such cross-sections at various height intervals above ground level, allowing it to capture trees with varying structures and understorey interference.
    Once a stem is detected, FORTLS employs two distinct methodologies for the estimation of the DBH, both of which are applied to the extracted cross-sections.
RANSAC-Based Approach: This method employs a RANSAC algorithm to fit a circle to the stem cross-section, identifying the most consistent subset of points that conform to a circular shape. The RANSAC function used is natively implemented within the FORTLS package and has been adapted for use with noisy or incomplete data, which are common in forest point clouds.
Grid-Based Approach: In this alternative method, a square grid is overlaid on the cross-section of the tree stem. The algorithm identifies the grid point that minimises the variance in the distances between itself and all other points in the detected cluster. This point is considered the centre of the cross-section, and the mean of the radial distances from this centre to the surrounding points is used to estimate the stem radius.
  • Both approaches produce an estimate of the DBH; however, the algorithm selects the final value based on the variance in the calculated radii. When both methods produce similar results, the RANSAC-based estimate is preferred due to its robustness in fitting circular geometries to natural stem profiles.
  • FORTLS thus offers a balanced combination of automation and analytical rigour, making it a valuable tool to assess the utility of point clouds generated by both high-end and low-cost scanning devices. Its implementation within the R environment also facilitates integration with broader data analysis workflows, including statistical modelling and spatial analysis.
  • DendRobot—Another pipeline used for mapry-provided point cloud quality estimation was the DendRobot (v0.3) software [42]. This program integrates a suite of established algorithms for point cloud and raster data processing, combining both conventional methods and custom-designed procedures for effective tree detection and measurement. DendRobot incorporates elements commonly used in spatial data analysis, such as geographic information system (GIS) spatial queries, reverse watershed-based tree crown delineation, and the RANSAC circle-fitting algorithm. These are integrated within a cohesive workflow specifically tailored to forest inventory applications.
    The tree detection procedure within DendRobot follows a distinctive methodology. Initially, the 3D point cloud is projected into 2D space, where a point neighbourhood density analysis is performed. This approach identifies areas of high local point density, which are assumed to correspond to the bases of tree stems. By retaining only these densely populated regions and subsequently reprojecting them into 3D space, the software effectively isolates individual trees. Once tree locations have been identified, the program locates multiple cross-sections along the height of each stem and calculates their diameters, enabling the estimation of key parameters such as the DBH, total tree height, and tree position. The above-terrain height was determined using a 3D mesh DTM, generated through rasterisation and local minima detection within each grid cell.
    For DBH estimation, DendRobot employs the RANSAC algorithm to fit circles to automatically extracted cross-sections of the tree stems. In this study, the number of RANSAC iterations was fixed at 1000 to ensure robust fitting, and the thickness of the DBH sampling disc was set at 7 cm. This parameter choice was based on findings from previous research, which demonstrated that a disc thickness of 7 cm yields optimal accuracy in DBH estimation [43]. The DendRobot software supports automated processing while allowing users to define input parameters if desired.
  • 3DFIn (Cloud Compare Plugin)—This pipeline comes as a plugin for the CloudCompare (v2.13.2) [39] software, making it widely accessible to researchers, practitioners, and forest managers, with minimal barriers to entry. The availability of this tool within a well-established platform significantly enhances its usability and potential for integration into existing workflows.
    The pipeline’s tree detection algorithm operates on a normalised point cloud, where normalisation is performed using a digital terrain model (DTM) generated by the Cloth Simulation Filter. From this normalised cloud, the algorithm extracts a horizontal “slice” of a predefined thickness, typically intersecting the lower portion of the forest stand, where tree stems are more distinct and less affected by canopy occlusion. Within this extracted section, the algorithm applies a geometric feature descriptor known as “Verticality” [44], which quantifies the alignment of points with respect to the vertical axis. This feature is used to differentiate tree stems—typically exhibiting strong verticality—from other structures such as branches, undergrowth, and noise, which tend to have more irregular or non-vertical geometries. Once high-verticality regions are identified, they are treated as initial seed points for further stem detection. The algorithm then expands from these seed locations using a spatial clustering approach to identify and segment complete individual tree stems. Each detected stem is assigned a unique label, allowing for further morphological analysis at the tree level.
    To quantify stem dimensions, the pipeline performs cross-sectional diameter measurements at regular vertical intervals along the length of each identified stem. At each interval, a RANSAC-based circle-fitting algorithm is applied to estimate the local diameter. This procedure yields detailed information about stem tapering, in addition to key metrics such as the diameter at breast height (DBH), total tree height, and tree position [45].
  • SAMICE—The workflow referred to as Search And Measure In Complex Environments (SAMICE) was developed as a fully automated pipeline for the segmentation and measurement of trees within structurally complex forest environments, such as those found in selection forests and close-to-nature silvicultural systems. It is specifically designed to handle noisy point clouds generated by SLAM-based mobile laser scanning (MLS) devices.
    The SAMICE(v0.1) workflow employs a multi-layered approach, analysing vertical projections of seven horizontal slices extracted from the normalised point cloud, covering a height range between 0.8 and 1.8 m above the detected ground level. Ground elevation is estimated by computing the first percentile of Z-values within 0.2 m grid cells. The resulting raster is then smoothed using a local quantile filter to reduce the influence of noise and outliers. Height anomalies are removed based on their statistical deviation from the median of elevation differences between the raw and smoothed surfaces. Any missing ground values are interpolated using a nearest neighbour approach. A local slope correction is subsequently applied to mitigate systematic underestimation of the ground elevation. The final digital terrain model (DTM) is used to normalise the original point cloud by subtracting the ground elevation from each Z-value.
    Each extracted slice is then processed using the mean shift clustering algorithm [46], followed by a RANSAC-based circle-fitting procedure. To improve the robustness of the fitting, additional filtering conditions are applied, including thresholds for the circle radius, completeness, the ratio of inliers to total points, and the homogeneity of the point distribution along the stem perimeter. Candidate trees are identified and their DBH is estimated based on a consensus of radius and centre position values derived across the set of horizontal slices.
    For further details of the workflow design and parameterisation, please refer to the work by Kuželka et al. [46].

2.5. Statistical Metrics

To evaluate the accuracy of individual scanners and processing algorithms, several key metrics were considered. These metrics were used to characterise the accuracy of the scanners and the quality of their resulting point clouds by assessing the observed diameter at breast height (DBH) and the number of detected trees—parameters of particular relevance in forest inventory. However, the number of detected trees typically depends on the evaluation algorithm used; therefore, multiple software tools were employed, as described previously. This approach facilitates a more comprehensive assessment of the true potential of the 3D data.
To assess the tree detection performance, the detection rate parameter was calculated. This is defined as the ratio of the number of trees identified in the point cloud by the algorithm ( n o b s ) to the number of trees measured in the field inventory ( n e x p ):
D e t e c t i o n   R a t e =   n o b s n e x p
Metrics related to the DBH accuracy were used to evaluate the capacity of the scanners and algorithms to generate complete, noise-free, and sufficiently dense point clouds without SLAM-related alignment issues. For this purpose, the root mean square error (RMSE) and the relative RMSE (rRMSE) were calculated using Formulas (2) and (3):
R M S E =   1 n i = 1 n ( y i y ^ i ) 2
where n is the number of observations, y i is the true value of the ith data point, and y i ^ is the corresponding observed value.
The relative RMSE (rRMSE) provides a normalised measure of error, facilitating comparison with other studies or methods. It is computed as
r R M S E = R M S E y ¯ × 100
where y ¯ denotes the mean of the observed DBH values in this study.
In addition to the RMSE, the mean absolute error (MAE) was calculated. While the RMSE squares the residuals and may exaggerate larger errors, the MAE offers a more intuitive indication of the average error magnitude, thus providing clearer insights into the actual performance of scanners or algorithms in DBH estimation. The MAE is calculated using the same variables as the RMSE, according to Formula (4):
M A E =   1 n i = 1 n y i y i ^
Together, these parameters offer a comprehensive set of evaluation metrics that can be consistently applied when assessing forest inventory algorithms across data derived from different 3D scanners. Such analysis supports the identification of each scanner’s performance potential and facilitates meaningful comparisons between devices.

3. Results

The results obtained from the aforementioned scanners and algorithms were compared to ground truth data, and several metrics (MAE, RMSE, rRMSE, and detection rate) were computed to describe the quality and potential of the datasets. Alignment between the ground truth data and point cloud processing results was performed manually within the GIS software (QGIS v3.40.1). Consequently, the results may contain a degree of subjective bias arising from the incorrect linkage of a ground truth tree to a 3D-detected tree.
The key performance metrics considered in this study were the mean absolute error (MAE), root mean square error (RMSE), relative RMSE (rRMSE), and detection rate. The detection rate represents the proportion of ground truth trees correctly identified within the point clouds by each algorithm and scanner type. Given that LiDAR scanning typically captures a spatial extent larger than that of the manually delineated reference sample plots, the actual area scanned by each sensor was also assessed. This information is summarised in Table 1 and illustrated in Figure 7. The scanned area was determined by creating a rasterised version of the point cloud and calculating the sum of 10 × 10 cm pixels containing at least one point. In addition to the total area covered by the scans, the point density for both vegetation and terrain was calculated, based on the total number of points within the plot and the actual area of the sample plot. These evaluations provide insight into the relative performance of the mapry scanner compared to other devices, particularly in terms of their capacity to operate effectively in complex environments under uniform testing conditions.
Table 2 presents the evaluation metrics for tree detection and diameter at breast height (DBH) estimation across various combinations of scanners and algorithms. The “manual approach” method, employed here as a manual reference approach, consistently achieved some of the highest performance levels across all devices. This result is expected, as this approach relies on manual intervention, which helps to minimise processing errors during point cloud filtering and evaluation.
For the high-end scanners—specifically the terrestrial laser scanner (TLS) and the handheld ZEB device—the manual approach yielded excellent outcomes, with very low mean absolute error (MAE) values ranging from 0.8 to 0.9 cm and root mean square error (RMSE) values between 1.0 and 1.2 cm. These corresponded to relative RMSE (rRMSE) values below 6%, along with tree detection rates exceeding 99%. Among the fully automated methods, SAMICE demonstrated performance comparable to that of the manual approach for both scanners, achieving MAE and RMSE values of 0.8–1.3 cm, rRMSE values of 4.6% to 7.3%, and detection rates as high as 98.7%. These results underscore its potential as a robust and fully automated alternative to manual approaches. The 3DFIn algorithm also performed reasonably well, with moderate MAE values (1.4–1.6 cm) and RMSE values (2.2–2.4 cm), although its detection rates were notably lower, ranging from 72.0% to 77.1%. In contrast, FORTLS exhibited the highest RMSE values (7.4–7.9 cm) and the lowest detection rates, particularly when applied to data from the ZEB scanner (44.5%).
The low-cost devices—the iPhone and the LA03 scanner—exhibited considerably lower accuracy. The iPhone, in particular, produced high MAE values (9.5–15.1 cm) and RMSE values (13.0–23.0 cm) across all methods, with rRMSE values exceeding 43% and tree detection rates generally falling below 22%. Nevertheless, SAMICE marginally outperformed the other automated methods on this device, achieving the lowest MAE (9.5 cm), the lowest RMSE (13.0 cm), and a detection rate of 21.6%, which was close to the result obtained using the manual approach (22.5%). Both 3DFIn and FORTLS showed the poorest detection rates on the iPhone, at just 8.1% and 7.2%, respectively, highlighting the limitations of the sensor rather than deficiencies in the processing algorithms.
The LA03 scanner demonstrated improved performance relative to the iPhone, with MAE values ranging from 3.6 to 13.6 cm and RMSE values between 4.4 and 20.3 cm. Notably, SAMICE again achieved the best results among the automated methods, recording the lowest MAE (3.6 cm), RMSE (4.4 cm), and rRMSE (19.7%), as well as a high detection rate of 76.7%, second only to the manual approach benchmark (78.0%). These results highlight the critical role of algorithm selection in determining the overall performance, particularly when using lower-cost sensors.
In summary, the findings reaffirm the superior performance of high-end TLS and ZEB scanners across all evaluated metrics. However, the LA03 scanner, when combined with effective processing algorithms such as SAMICE, presents a promising low-cost alternative for broader operational use. It is important to note that the manual approach serves as an idealised benchmark and, in practice, scalable deployment will require the adoption of automated methods to ensure both efficiency and feasibility in large-scale applications.

4. Discussion

This study evaluates the potential of a low-cost, novel LiDAR system for the estimation of the tree diameter at breast height (DBH) in a large-scale forest sample plot. Accurate DBH estimation is critical for a wide range of applications, from traditional forestry [47] to urban tree management [23], roadside and railway vegetation maintenance, and beyond. Furthermore, detailed information about forest structures, including tree diameters and the spatial distribution, is vital not only for ecological assessments but also in supporting the movement and operation of forestry machinery in complex environments [48].
To benchmark the performance of the prototype, high-end mobile and terrestrial laser scanning (MLS and TLS) systems were selected, given their established reputations in terms of accuracy, albeit at significantly higher costs [49]. As a low-cost comparator, the iPhone LiDAR sensor was used, representing a device of a similar cost to the prototype mapry LA03 scanner. While photogrammetry is another potential benchmarking method, having demonstrated high precision in close-range DBH estimation in previous studies [50,51,52], it is more sensitive to data quality and less practical for broader forest applications. To maintain the focus on LiDAR technologies, photogrammetry was excluded from this comparison. Unlike photogrammetry, LiDAR provides a more intuitive workflow and increased robustness when scanning objects at greater distances, making it a promising tool for future forest inventory applications [18,53]. For these reasons, it remains a point of interest even within this study.
Although different LiDAR scanners, generally used in scientific studies, exhibit comparable performance in terms of raw data acquisition [54], TLS remains the benchmark for DBH estimation due to its superior data quality and reliability [55]. Consistent with these findings, the TLS-based results in this study demonstrated the highest precision. In comparison, the low-cost mapry scanner exhibited significantly lower performance, underscoring the trade-offs between affordability and accuracy. A comparison between the ZEB Horizon MLS and the mapry LA03—both handheld systems—revealed notable differences in scan quality and result reliability, despite the manufacturers’ claims of comparable performance. The most substantial difference relates to the SLAM algorithms employed: the mapry device experienced difficulties over larger areas and, in certain cases, failed to align terrain or vegetation accurately. Consequently, the mapry scanner may be suitable only for sample plot-level scanning rather than for stand-level forest assessments, given the limitations of its current SLAM algorithm version.
A further comparison between the iPhone 14 Pro LiDAR and the mapry LA03 showed that, despite being in the same price range, the LA03 outperformed the iPhone. This is not unexpected, as the iPhone’s sensor is not primarily designed for scanning large environments and has a limited reach of approximately 5 m. Conversely, these results suggest that smartphone-based forest inventory may prove neither cost-effective nor sufficiently accurate for practical forestry applications.
Importantly, this study also investigated the influence of data processing algorithms. Semi-automatic measurements using the manual approach were compared with fully automated methods, including the FORTLS package [41], SAMICE algorithm [46], 3DFIn (v 0.5.0a0) software [45], and DendRobot software [42]. As expected, the manual approach, which involved the manual selection of tree sections, outperformed the fully automated approaches. However, the SAMICE algorithm emerged as a significant exception, matching and, in several scenarios, even surpassing the performance of the manual approach in both its accuracy and detection rate. SAMICE consistently produced results that were more closely aligned with manual measurements, particularly when applied to point clouds with higher noise levels. The manual intervention in the manual approach enabled the exclusion of complex features such as branches and leaves, thereby reducing errors that automated pipelines were required to address. This advantage was particularly evident when processing point clouds from the mapry scanner, which exhibited higher noise levels due to SLAM matching errors—an issue previously reported in studies involving MLS data [6].
Among the automated methods, 3DFIn and DendRobot achieved relatively high tree detection rates but suffered from higher RMSE values compared to the other results. This outcome underscores the ongoing challenge in automated LiDAR data processing: the need for improved techniques to filter out non-trunk elements such as branches and understorey vegetation.
The performance metrics obtained in this study showed that the RMSE values ranged from 1.0 cm to 23.0 cm, depending on the scanner and algorithm used. The relative RMSE (rRMSE) varied accordingly, with the TLS and ZEB scanners achieving rRMSE values below 10% for most algorithms (except FORTLS), whereas the iPhone and mapry LA03 devices exhibited substantially higher error rates, often exceeding 20%. Importantly, both the manual approach and SAMICE consistently yielded the lowest error values across all devices, supporting their roles as high-accuracy references for DBH estimation. However, it should be noted that, while the manual approach serves as a near-ideal benchmark, SAMICE represents a promising, fully automated solution with practical applicability in operational settings.
The results from the TLS and high-end MLS systems were in line with outcomes reported in previous studies [6,21,23,26], whereas the low-cost mapry device demonstrated higher error levels. Nonetheless, considering its affordability and portability, the mapry scanner may still serve as a viable option for specific applications where ultra-high precision is not essential. In this study, the prototype was able to provide DBH information for up to 78% of individual trees within the large-scale sample plot. As the majority of trees on the research plot had DBH values below 12 cm, the device showed promising results even in such an unevenly aged forest stand. However, scanning trajectories must be carefully adjusted to mitigate the effects of laser beam divergence and reduced accuracy over greater distances.
High-end systems such as the GeoSLAM ZEB Horizon may maintain better detection rates over longer scanning ranges, likely due to more advanced SLAM algorithms. Although both the ZEB and mapry devices have similar beam divergence, the qualitative difference in performance likely stems from broader system optimisation—reflected in their price difference.
It is worth noting that the mapry LA03 scanner is available for under EUR 1800, which is approximately one-tenth of the cost of a newer MLS device not used in this study, the Faro Orbis. Deploying ten LA03 units instead of a single high-end device could be advantageous for rapid surveys of standard sample plots (approximately 15 ares in size). On plots of this scale, the SLAM performance may remain reliable, scanning can be completed within minutes, and sufficient information about the tree height and stem diameter distribution can be effectively collected. However, further research is needed to evaluate this approach. Future studies, therefore, should focus on optimising the deployment of such low-cost devices, refining data processing workflows, and aligning technological choices with the intended application’s accuracy requirements and budget constraints.

5. Conclusions

In summary, this study demonstrates that, while high-end terrestrial laser scanning (TLS) and mobile laser scanning (MLS) systems continue to serve as the benchmarks for DBH estimation—achieving relative RMSE (rRMSE) values as low as 4.7% and tree detection rates exceeding 99%—low-cost alternatives, such as the mapry LA03 device, exhibit promising potential for cost-sensitive applications. Under optimal conditions, the mapry scanner achieved tree detection rates of up to 78% and rRMSE values of approximately 20%. However, its performance was found to vary considerably depending on the processing algorithm applied. Although the accuracy of low-cost systems currently does not meet the standards required for high-precision forest inventories, their affordability, portability, and ease of deployment present clear advantages for applications where moderate precision is acceptable. Notably, the robust performance of the SAMICE algorithm suggests that algorithmic advancements can partially compensate for limitations in data quality, helping to narrow the gap between low- and high-end scanning systems.
Future research should prioritise the optimisation of data acquisition protocols, the development of advanced noise filtering techniques, and the refinement of automated tree detection algorithms. These improvements are essential to fully realise the potential of emerging low-cost LiDAR technologies, particularly in the context of scalable and frequent forest monitoring initiatives.

Author Contributions

Conceptualisation, P.S., S.T., M.M. and M.H.; methodology, P.S., M.H. and K.Y.; software, K.Y., P.S., M.H., K.K. and J.A.M.-V.; validation, M.H. and P.S.; writing—original draft preparation, M.H., Z.M., J.A.M.-V. and P.S.; writing—review and editing, M.H., M.M., Z.M. and P.S.; project administration, P.S.; funding acquisition, P.S. All authors have read and agreed to the published version of the manuscript.

Funding

The work was financially supported by project TH74010001, funded by the Technological Agency of the Czech Republic through the program Chist-era and the Faculty of Forestry and Wood Sciences, Czech University of Life Sciences Prague, through grant FORESTin3D.

Data Availability Statement

Data are available upon request from the authors.

Conflicts of Interest

Author Keiji Yamaguchi was employed by the company mapry Co., Ltd. The remaining authors declare that the research was conducted in the absence of any commercial or financial relationships that could be construed as a potential conflict of interest.

References

  1. Torresan, C.; Benito Garzón, M.; O’Grady, M.; Robson, T.M.; Picchi, G.; Panzacchi, P.; Tomelleri, E.; Smith, M.; Marshall, J.; Wingate, L.; et al. A New Generation of Sensors and Monitoring Tools to Support Climate-Smart Forestry Practices. Can. J. For. Res. 2021, 51, 1751–1765. [Google Scholar] [CrossRef]
  2. Surovỳ, P.; Kuželka, K. Acquisition of Forest Attributes for Decision Support at the Forest Enterprise Level Using Remote-Sensing Techniques-a Review. Forests 2019, 10, 273. [Google Scholar] [CrossRef]
  3. Temperli, C.; Santopuoli, G.; Bottero, A.; Barbeito, I.; Alberdi, I.; Condés, S.; Gschwantner, T.; Bosela, M.; Neroj, B.; Fischer, C.; et al. National Forest Inventory Data to Evaluate Climate-Smart Forestry. In Climate-Smart Forestry in Mountain Regions; Springer: Berlin/Heidelberg, Germany, 2022; pp. 107–139. [Google Scholar]
  4. Alberdi, I.; Cañellas, I.; Vallejo Bombín, R. The Spanish National Forest Inventory: History, Development, Challenges and Perspectives. Pesqui. Florest. Bras. 2017, 37, 361. [Google Scholar] [CrossRef]
  5. Avitabile, V.; Camia, A. An Assessment of Forest Biomass Maps in Europe Using Harmonized National Statistics and Inventory Plots. Ecol. Manag. 2018, 409, 489–498. [Google Scholar] [CrossRef] [PubMed]
  6. Čerňava, J.; Mokroš, M.; Tuček, J.; Antal, M.; Slatkovská, Z. Processing Chain for Estimation of Tree Diameter from GNSS-IMU-Based Mobile Laser Scanning Data. Remote Sens. 2019, 11, 615. [Google Scholar] [CrossRef]
  7. Cabo, C.; Del Pozo, S.; Rodríguez-Gonzálvez, P.; Ordóñez, C.; González-Aguilera, D. Comparing Terrestrial Laser Scanning (TLS) and Wearable Laser Scanning (WLS) for Individual Tree Modeling at Plot Level. Remote Sens. 2018, 10, 540. [Google Scholar] [CrossRef]
  8. Xie, Y.; Yang, T.; Wang, X.; Chen, X.; Pang, S.; Hu, J.; Wang, A.; Chen, L.; Shen, Z. Applying a Portable Backpack Lidar to Measure and Locate Trees in a Nature Forest Plot: Accuracy and Error Analyses. Remote Sens. 2022, 14, 1806. [Google Scholar] [CrossRef]
  9. Muukkonen, P. Generalized Allometric Volume and Biomass Equations for Some Tree Species in Europe. Eur. J. Res. 2007, 126, 157–166. [Google Scholar] [CrossRef]
  10. Luoma, V.; Saarinen, N.; Wulder, M.A.; White, J.C.; Vastaranta, M.; Holopainen, M.; Hyyppä, J. Assessing Precision in Conventional Field Measurements of Individual Tree Attributes. Forests 2017, 8, 38. [Google Scholar] [CrossRef]
  11. Li, S.; Fang, L.; Sun, Y.; Xia, L.; Lou, X. Development of Measuring Device for Diameter at Breast Height of Trees. Forests 2023, 14, 192. [Google Scholar] [CrossRef]
  12. Wang, Y.; Lehtomäki, M.; Liang, X.; Pyörälä, J.; Kukko, A.; Jaakkola, A.; Liu, J.; Feng, Z.; Chen, R.; Hyyppä, J. Is Field-Measured Tree Height as Reliable as Believed–A Comparison Study of Tree Height Estimates from Field Measurement, Airborne Laser Scanning and Terrestrial Laser Scanning in a Boreal Forest. ISPRS J. Photogramm. Remote Sens. 2019, 147, 132–145. [Google Scholar] [CrossRef]
  13. Barbosa, R.I.; Ramírez-Narváez, P.N.; Fearnside, P.M.; Villacorta, C.D.A.; Carvalho, L.C.d.S. Allometric Models to Estimate Tree Height in Northern Amazonian Ecotone Forests. Acta Amaz. 2019, 49, 81–90. [Google Scholar] [CrossRef]
  14. Blanchard, E.; Birnbaum, P.; Ibanez, T.; Boutreux, T.; Antin, C.; Ploton, P.; Vincent, G.; Pouteau, R.; Vandrot, H.; Hequet, V.; et al. Contrasted Allometries between Stem Diameter, Crown Area, and Tree Height in Five Tropical Biogeographic Areas. Trees 2016, 30, 1953–1968. [Google Scholar] [CrossRef]
  15. Liang, X.; Hyyppä, J.; Kaartinen, H.; Lehtomäki, M.; Pyörälä, J.; Pfeifer, N.; Holopainen, M.; Brolly, G.; Francesco, P.; Hackenberg, J.; et al. International Benchmarking of Terrestrial Laser Scanning Approaches for Forest Inventories. ISPRS J. Photogramm. Remote Sens. 2018, 144, 137–179. [Google Scholar] [CrossRef]
  16. White, J.C.; Coops, N.C.; Wulder, M.A.; Vastaranta, M.; Hilker, T.; Tompalski, P. Remote Sensing Technologies for Enhancing Forest Inventories: A Review. Can. J. Remote Sens. 2016, 42, 619–641. [Google Scholar] [CrossRef]
  17. Calders, K.; Adams, J.; Armston, J.; Bartholomeus, H.; Bauwens, S.; Bentley, L.P.; Chave, J.; Danson, F.M.; Demol, M.; Disney, M.; et al. Terrestrial Laser Scanning in Forest Ecology: Expanding the Horizon. Remote Sens. Environ. 2020, 251, 112102. [Google Scholar] [CrossRef]
  18. Bauwens, S.; Bartholomeus, H.; Calders, K.; Lejeune, P. Forest Inventory with Terrestrial LiDAR: A Comparison of Static and Hand-Held Mobile Laser Scanning. Forests 2016, 7, 127. [Google Scholar] [CrossRef]
  19. Gollob, C.; Ritter, T.; Wassermann, C.; Nothdurft, A. Influence of Scanner Position and Plot Size on the Accuracy of Tree Detection and Diameter Estimation Using Terrestrial Laser Scanning on Forest Inventory Plots. Remote Sens. 2019, 11, 1602. [Google Scholar] [CrossRef]
  20. Dassot, M.; Constant, T.; Fournier, M. The Use of Terrestrial LiDAR Technology in Forest Science: Application Fields, Benefits and Challenges. Ann. Sci. 2011, 68, 959–974. [Google Scholar] [CrossRef]
  21. Bienert, A.; Georgi, L.; Kunz, M.; Maas, H.G.; von Oheimb, G. Comparison and Combination of Mobile and Terrestrial Laser Scanning for Natural Forest Inventories. Forests 2018, 9, 395. [Google Scholar] [CrossRef]
  22. Čerňava, J.; Chudý, F.; Tunák, D.; Saloň, Š.; Vyhnáliková, Z. The Vertical Accuracy of Digital Terrain Models Derived from the Close-Range Photogrammetry Point Cloud Using Different Methods of Interpolation and Resolutions. Cent. Eur. For. J. 2019, 66, 198–205. [Google Scholar] [CrossRef]
  23. Çakir, G.Y.; Post, C.J.; Mikhailova, E.A.; Schlautman, M.A. 3D LiDAR Scanning of Urban Forest Structure Using a Consumer Tablet. Urban Sci. 2021, 5, 88. [Google Scholar] [CrossRef]
  24. Ning, X.; Ma, Y.; Hou, Y.; Lv, Z.; Jin, H.; Wang, Z.; Wang, Y. Trunk-Constrained and Tree Structure Analysis Method for Individual Tree Extraction from Scanned Outdoor Scenes. Remote Sens. 2023, 15, 1567. [Google Scholar] [CrossRef]
  25. Tatsumi, S.; Yamaguchi, K.; Furuya, N. ForestScanner: A Mobile Application for Measuring and Mapping Trees with LiDAR-equipped IPhone and IPad. Methods Ecol. Evol. 2023, 14, 1603–1609. [Google Scholar] [CrossRef]
  26. Hrdina, M.; Surový, P. Internal Tree Trunk Decay Detection Using Close Range Remote Sensing Data and the PointNet Deep Learning Method. Remote Sens. 2023, 15, 5712. [Google Scholar] [CrossRef]
  27. Gollob, C.; Ritter, T.; Kraßnitzer, R.; Tockner, A.; Nothdurft, A. Measurement of Forest Inventory Parameters with Apple Ipad pro and Integrated Lidar Technology. Remote Sens. 2021, 13, 3129. [Google Scholar] [CrossRef]
  28. Mokroš, M.; Mikita, T.; Singh, A.; Tomaštík, J.; Chudá, J.; Wężyk, P.; Kuželka, K.; Surový, P.; Klimánek, M.; Zięba-Kulawik, K.; et al. Novel Low-Cost Mobile Mapping Systems for Forest Inventories as Terrestrial Laser Scanning Alternatives. Int. J. Appl. Earth Obs. Geoinf. 2021, 104, 102512. [Google Scholar] [CrossRef]
  29. Wu, F.; Wu, B.; Zhao, D. Real-Time Measurement of Individual Tree Structure Parameters Based on Augmented Reality in an Urban Environment. Ecol. Inf. 2023, 77, 102207. [Google Scholar] [CrossRef]
  30. Hyyppä, J.; Virtanen, J.-P.; Jaakkola, A.; Yu, X.; Hyyppä, H.; Liang, X. Feasibility of Google Tango and Kinect for Crowdsourcing Forestry Information. Forests 2017, 9, 6. [Google Scholar] [CrossRef]
  31. Tomaštík, J.; Saloň, Š.; Tunák, D.; Chudý, F.; Kardoš, M. Tango in Forests–An Initial Experience of the Use of the New Google Technology in Connection with Forest Inventory Tasks. Comput. Electron. Agric. 2017, 141, 109–117. [Google Scholar] [CrossRef]
  32. Liang, X.; Kankare, V.; Hyyppä, J.; Wang, Y.; Kukko, A.; Haggrén, H.; Yu, X.; Kaartinen, H.; Jaakkola, A.; Guan, F.; et al. Terrestrial Laser Scanning in Forest Inventories. ISPRS J. Photogramm. Remote Sens. 2016, 115, 63–77. [Google Scholar] [CrossRef]
  33. Livox. Livox MID-360 Specs; Livox: Shenzhen, China, 2023. [Google Scholar]
  34. TDK ICM-40609-D Data Sheet. Available online: http://upload.cdn.oneyac.com/upload/document/1594170998146_7512.pdf (accessed on 21 July 2025).
  35. Trimble. Trimble RealWorks User Guide, 1st ed.; Trimble Inc.: Sunnyvale, VA, USA, 2021. [Google Scholar]
  36. GeoSLAM. ZEB Family Brochure; GeoSLAM: Ruddington, UK, 2019. [Google Scholar]
  37. Laan Labs. 3d Scanner App; Laan Labs: New York, NY, USA, 2023. [Google Scholar]
  38. Apple Inc. IPhone 14 Pro-Technical Specifications; Apple Inc.: Cupertino, CA, USA, 2022. [Google Scholar]
  39. CloudCompare (Version 2.13.2) [GPL Software]. 2025. Available online: http://www.cloudcompare.org/ (accessed on 21 July 2025).
  40. Molina-Valero, J.A.; Villamayor, M.J.G.; Pérez, M.A.N.; Álvarez-González, J.G.; Montes, F.; Martínez-Calvo, A.; Pérez-Cruzado, C. FORTLS: An R Package for Processing TLS Data and Estimating Stand Variables in Forest Inventories. Environ. Sci. Proc. 2021, 3, 38. [Google Scholar]
  41. Molina-Valero, J.A.; Martínez-Calvo, A.; Ginzo Villamayor, M.J.; Novo Pérez, M.A.; Álvarez-González, J.G.; Montes, F.; Pérez-Cruzado, C. Operationalizing the Use of TLS in Forest Inventories: The R Package FORTLS. Environ. Model. Softw. 2022, 150, 105337. [Google Scholar] [CrossRef]
  42. Hrdina, M. DendRobot v0.3. Available online: www.dendrobot.czu.cz (accessed on 28 April 2025).
  43. Akpo, H.A.; Atindogbé, G.; Obiakara, M.C.; Gbedolo, M.A.; Laly, F.G.; Lejeune, P.; Fonton, N.H. Accuracy of Tree Stem Circumference Estimation Using Close Range Photogrammetry: Does Point-Based Stem Disk Thickness Matter? Trees For. People 2020, 2, 100019. [Google Scholar] [CrossRef]
  44. Hackel, T.; Wegner, J.D.; Schindler, K. Contour Detection in Unstructured 3D Point Clouds. In Proceedings of the 2016 IEEE Conference on Computer Vision and Pattern Recognition (CVPR), Las Vegas, NV, USA, 23–27 June 2016; IEEE: Piscataway, NJ, USA; pp. 1610–1618. [Google Scholar]
  45. Laino, D.; Cabo, C.; Prendes, C.; Janvier, R.; Ordonez, C.; Nikonovas, T.; Doerr, S.; Santin, C. 3DFin: A Software for Automated 3D Forest Inventories from Terrestrial Point Clouds. For. Int. J. For. Res. 2024, 97, 479–496. [Google Scholar] [CrossRef]
  46. Kuželka, K.; Marušák, R.; Surový, P. Inventory of Close-to-Nature Forest Stands Using Terrestrial Mobile Laser Scanning. Int. J. Appl. Earth Obs. Geoinf. 2022, 115, 103104. [Google Scholar] [CrossRef]
  47. Kuželka, K.; Slavík, M.; Surový, P. Very High Density Point Clouds from UAV Laser Scanning for Automatic Tree Stem Detection and Direct Diameter Measurement. Remote Sens. 2020, 12, 1236. [Google Scholar] [CrossRef]
  48. Rybansky, M. Determination of Forest Structure from Remote Sensing Data for Modeling the Navigation of Rescue Vehicles. Appl. Sci. 2022, 12, 3939. [Google Scholar] [CrossRef]
  49. Surový, P.; Kuželka, K. Application of Remote Sensing in Forestry; Czech University of Life Sciences: Prague, Czech Republic, 2019; ISBN 978-80-213-3008-5. [Google Scholar]
  50. Eliopoulos, N.J.; Shen, Y.; Nguyen, M.L.; Arora, V.; Zhang, Y.; Shao, G.; Woeste, K.; Lu, Y.H. Rapid Tree Diameter Computation with Terrestrial Stereoscopic Photogrammetry. J. For. 2020, 118, 355–361. [Google Scholar] [CrossRef]
  51. Mokro, M.; Liang, X.; Surový, P.; Valent, P.; Čerňava, J.; Chudý, F.; Tunák, D.; Saloň, I.; Merganič, J. Evaluation of Close-Range Photogrammetry Image Collection Methods for Estimating Tree Diameters. ISPRS Int. J. Geoinf. 2018, 7, 93. [Google Scholar] [CrossRef]
  52. Miller, J.; Morgenroth, J.; Gomez, C. 3D Modelling of Individual Trees Using a Handheld Camera: Accuracy of Height, Diameter and Volume Estimates. Urban For. Urban Green. 2015, 14, 932–940. [Google Scholar] [CrossRef]
  53. Solares-Canal, A.; Alonso, L.; Picos, J.; Armesto, J. Automatic Tree Detection and Attribute Characterization Using Portable Terrestrial Lidar. Trees-Struct. Funct. 2023, 37, 963–979. [Google Scholar] [CrossRef]
  54. Stal, C.; Verbeurgt, J.; De Sloover, L.; De Wulf, A. Assessment of Handheld Mobile Terrestrial Laser Scanning for Estimating Tree Parameters. J. Res. 2021, 32, 1503–1513. [Google Scholar] [CrossRef]
  55. Luoma, V.; Saarinen, N.; Kankare, V.; Tanhuanpää, T.; Kaartinen, H.; Kukko, A.; Holopainen, M.; Hyyppä, J.; Vastaranta, M. Examining Changes in Stem Taper and Volume Growth with Two-Date 3D Point Clouds. Forests 2019, 10, 382. [Google Scholar] [CrossRef]
Figure 1. Testing area map showing actual locations of trees.
Remotesensing 17 02564 g001
Figure 2. The mapry scanning device LA03 (a) and the “mapry” application interface (b).
Remotesensing 17 02564 g002
Figure 3. A simple workflow diagram, showing all main steps of the study.
Remotesensing 17 02564 g003
Figure 4. (a) The measured DBH values sorted into 8 cm intervals, depicting the distribution of the DBH throughout the whole sample plot, indicating a two-storey forest stand. (b) The distribution of tree heights in relation to the DBH.
Remotesensing 17 02564 g004
Figure 5. Common trajectory for all scanner types. TLS stations were placed on the trajectory as well.
Remotesensing 17 02564 g005
Figure 6. Examples illustrating the circle fitting (red colour) application of the RANSAC algorithm in various scenarios. (a)—A nearly complete scan from terrestrial static scanning (TLS). (b)—A complete scan from MLS scanning with higher variability. (c)—An incomplete scan captured by the mapry device.
Remotesensing 17 02564 g006
Figure 7. Visualisation of scanning methods’ spatial coverage across the sample plot area delineated by the red outline.
Remotesensing 17 02564 g007
Table 1. Spatial coverage of the scanners based on the rasterisation of the point clouds, along with point density statistics for vegetation and terrain. Vegetation and terrain points were separated using a height threshold of 0.2 m above the ground surface. “Plot” method describes actual extent of the sample plot examined during field inventory.
MethodTotal Data
Extent [m2]
Points Within PlotPoints/m2
(Height > 0.2 m)
Points/m2
(Height < 0.2 m)
TLS30,158.3176,492,53533,122.211,546.5
ZEB14,027.6116,743,69819,487.710,059.1
iPhone1101.31,744,17053.6387.9
LA037601.924,644,0014026.02211.2
Plot3951.1N/AN/AN/A
Table 2. Comparison of errors for individual scanning methods and analysis methods. Only 95% of the best results were used for the MAE, RMSE, and rRMSE statistics’ computation.
ScannerTLSZEB
AlgorithmManual3DFInFORTLSDendRobotSAMICEManual3DFInFORTLSDendRobotSAMICE
MAE [cm]0.81.44.72.70.80.91.64.21.81.3
RMSE [cm]1.02.27.94.81.01.22.47.42.51.6
rRMSE [%]4.78.424.918.84.65.49.422.110.87.3
Detection Rate [%]99.672.053.471.298.799.277.144.586.097.0
ScanneriPhoneLA03
AlgorithmManual3DFInFORTLSDendRobotSAMICEManual3DFInFORTLSDendRobotSAMICE
MAE [cm]10.015.111.713.19.53.713.65.86.73.6
RMSE [cm]13.623.018.322.213.06.020.38.210.54.4
rRMSE [%]44.355.044.557.543.824.866.522.337.119.7
Detection Rate [%]22.58.17.214.021.678.030.516.547.076.7
Disclaimer/Publisher’s Note: The statements, opinions and data contained in all publications are solely those of the individual author(s) and contributor(s) and not of MDPI and/or the editor(s). MDPI and/or the editor(s) disclaim responsibility for any injury to people or property resulting from any ideas, methods, instructions or products referred to in the content.

