1. Introduction
Farmland is a necessary resource to ensure agricultural development and food production. The quantity and quality of agricultural parcels are decisive factors in ensuring the sustainable development of agriculture and have a direct impact on the development of the national economy [
1]. Against the background of accelerated global urbanization and population growth, the expansion of urban construction land has led to the reduction in agricultural land. It is particularly important for agricultural managers to obtain accurate agricultural information [
2]. In the field of agricultural remote sensing, agricultural information extraction is a key research topic [
3,
4]. Carrying out information extraction of agricultural parcels is not only a long-term plan to ensure agricultural development, but also an urgent task to maintain the stability of cultivated land reserve resources [
5]. Agricultural parcels generally refer to agricultural land with clear boundaries for the continuous planting of a crop. It is the basic unit for agricultural management, supervision, and statistics, and plays an important role in agricultural management and land use planning [
6]. The extraction of agricultural parcels can be applied in various fields such as agricultural yield forecasting [
7], farmland area investigation [
8], land resource evaluation [
9], land use management [
10], and the sustainable development of resources and the environment [
11,
12].
Previous agricultural parcel division mainly depended on site measurements to obtain spatial distribution data and draw plot distribution maps [
13]. However, this method often consumes a lot of manpower and time and is inefficient, so it is difficult to extract large-scale agricultural parcels [
14]. With the continuous development of remote sensing technology, high-spatial resolution, spectral resolution, and multi temporal remote sensing images have been obtained by us. The extraction of agricultural parcels using remote sensing images has been widely used by researchers [
15,
16]. Remote sensing has the characteristics of real-time acquisition, rapid monitoring, and wide coverage. Using remote sensing images to automatically delimit agricultural parcels is a hot research topic [
17,
18].
The traditional remote sensing image extraction method of agricultural parcels is to use the relevant algorithm to classify the edge or region of agricultural parcels at the pixel level. For example, the Sobel or Canny filter operator is used to extract the edges of agricultural parcels in the image, and the extracted edge is used as the field boundary to divide farmland and non-farmland [
19]. Conversely, the clustering threshold segmentation algorithm can be used to classify the pixels with similar characteristics into the same category to extract the agricultural parcels in the remote sensing image [
20]. Although the above method is simple and easy to implement, it only considers the shallow features and cannot use the high-level semantic features of remote sensing images [
21]. In the face of complex environmental backgrounds, the extraction accuracy is poor and it is difficult to extract complete agricultural parcels.
In recent years, with the development of deep learning, the method of extracting land cover categories using deep learning has been widely used, especially for the extraction of single-category features [
22,
23,
24,
25]. Deep learning semantic segmentation to extract agricultural parcels from remote sensing images has been used by many scholars. Compared with traditional machine learning and threshold segmentation, deep learning networks can extract high-dimensional semantic information and has stronger adaptability to complex and changeable terrain [
26,
27]. At first, some scholars used convolutional neural network to extract agricultural parcels from remote sensing images for semantic segmentation, such as u-net, FCN, segnet, and other networks [
28,
29,
30]. Convolutional neural networks extract agricultural parcels by convolutionally checking the color, texture, and other features of the agricultural parcel. However, this is affected by the size of the convolutional kernel receptive field. For convolutional neural networks, it is difficult to effectively integrate the context information of the image, and its extraction ability is weak over a large area. In this regard, some scholars have proposed the Deeplabv3 convolution model [
30], which uses hole convolution to expand the receptive field and obtain a wider range of influence characteristics. Some scholars use the Swin Transformer as the backbone network and the Transformer’s self-attention mechanism to integrate image contexts [
31]. However, in terms of the integration of global features and local details, it is difficult to extract the global features of the image using Deeplabv3, and the Swin transformer trunk has a poor ability to extract local information features. Therefore, integrating global features and local details remains a challenge in agricultural parcel extraction from remote sensing images.
In the process of semantic segmentation for extracting agricultural parcels, the effect of parcel edge segmentation is often poor. In the process of image feature extraction, with the sampling under the feature layer, the edge detail feature is often lost [
32]. In order to solve this problem, some scholars have proposed a special edge detection algorithm [
24], such as the RCF and HED [
33,
34] network models, which extract pixels at the edge of the parcel by capturing features at multiple scales. Demarcating agricultural parcels by extracting their edges is essentially the semantic segmentation of edge pixels. Therefore, some scholars have proposed multitask learning network models to extract both the region and edge of agricultural parcels, improving model accuracy by integrating multiple related tasks. For example, François et al. have proposed Resunet-a, a multitask network model that uses three tasks: extracting parcel boundary, extracting parcel area, and extracting distance to boundary. The addition of related tasks improves the shape and boundary of the extraction results [
35]. In addition et al. have proposed the SEANet multitask model, which takes into account the uncertainty between different tasks on the basis of designing regional, edge, and distance tasks, and sets the multitask adaptive loss weight to balance the loss between different tasks [
36]. Jiang et al. have proposed the BsiNet lightweight multitask network model. On the basis of completing the same task, the parameters of the model are less than those of Resunet-a and SEANet, so the calculation speed is faster and the extraction efficiency is higher [
37]. Although the above methods can improve the accuracy of agricultural parcel edge extraction, they are all at the pixel level. This introduced problems such as the fact that the edges of the parcels will not be closed, the extracted adjacent parcel will be bonded, and there will be holes in the middle of the parcel, as well as fragmentation and salt and pepper-like phenomena. The pixel-based extraction method cannot reflect the topological relationship between agricultural parcels, so the agricultural parcels extracted by the model are difficult to be vectorized directly, and need to undergo post processing before mapping.
In the remote sensing community, contour segmentation is often used to extract targets. Jiao et al. have proposed a PolyR-CNN contour segmentation network model to extract polygonal buildings in remote sensing images [
38]. Xu et al. proposed to integrate Mask RCNN and DeepSnake to improve the recognition ability of cultivated land [
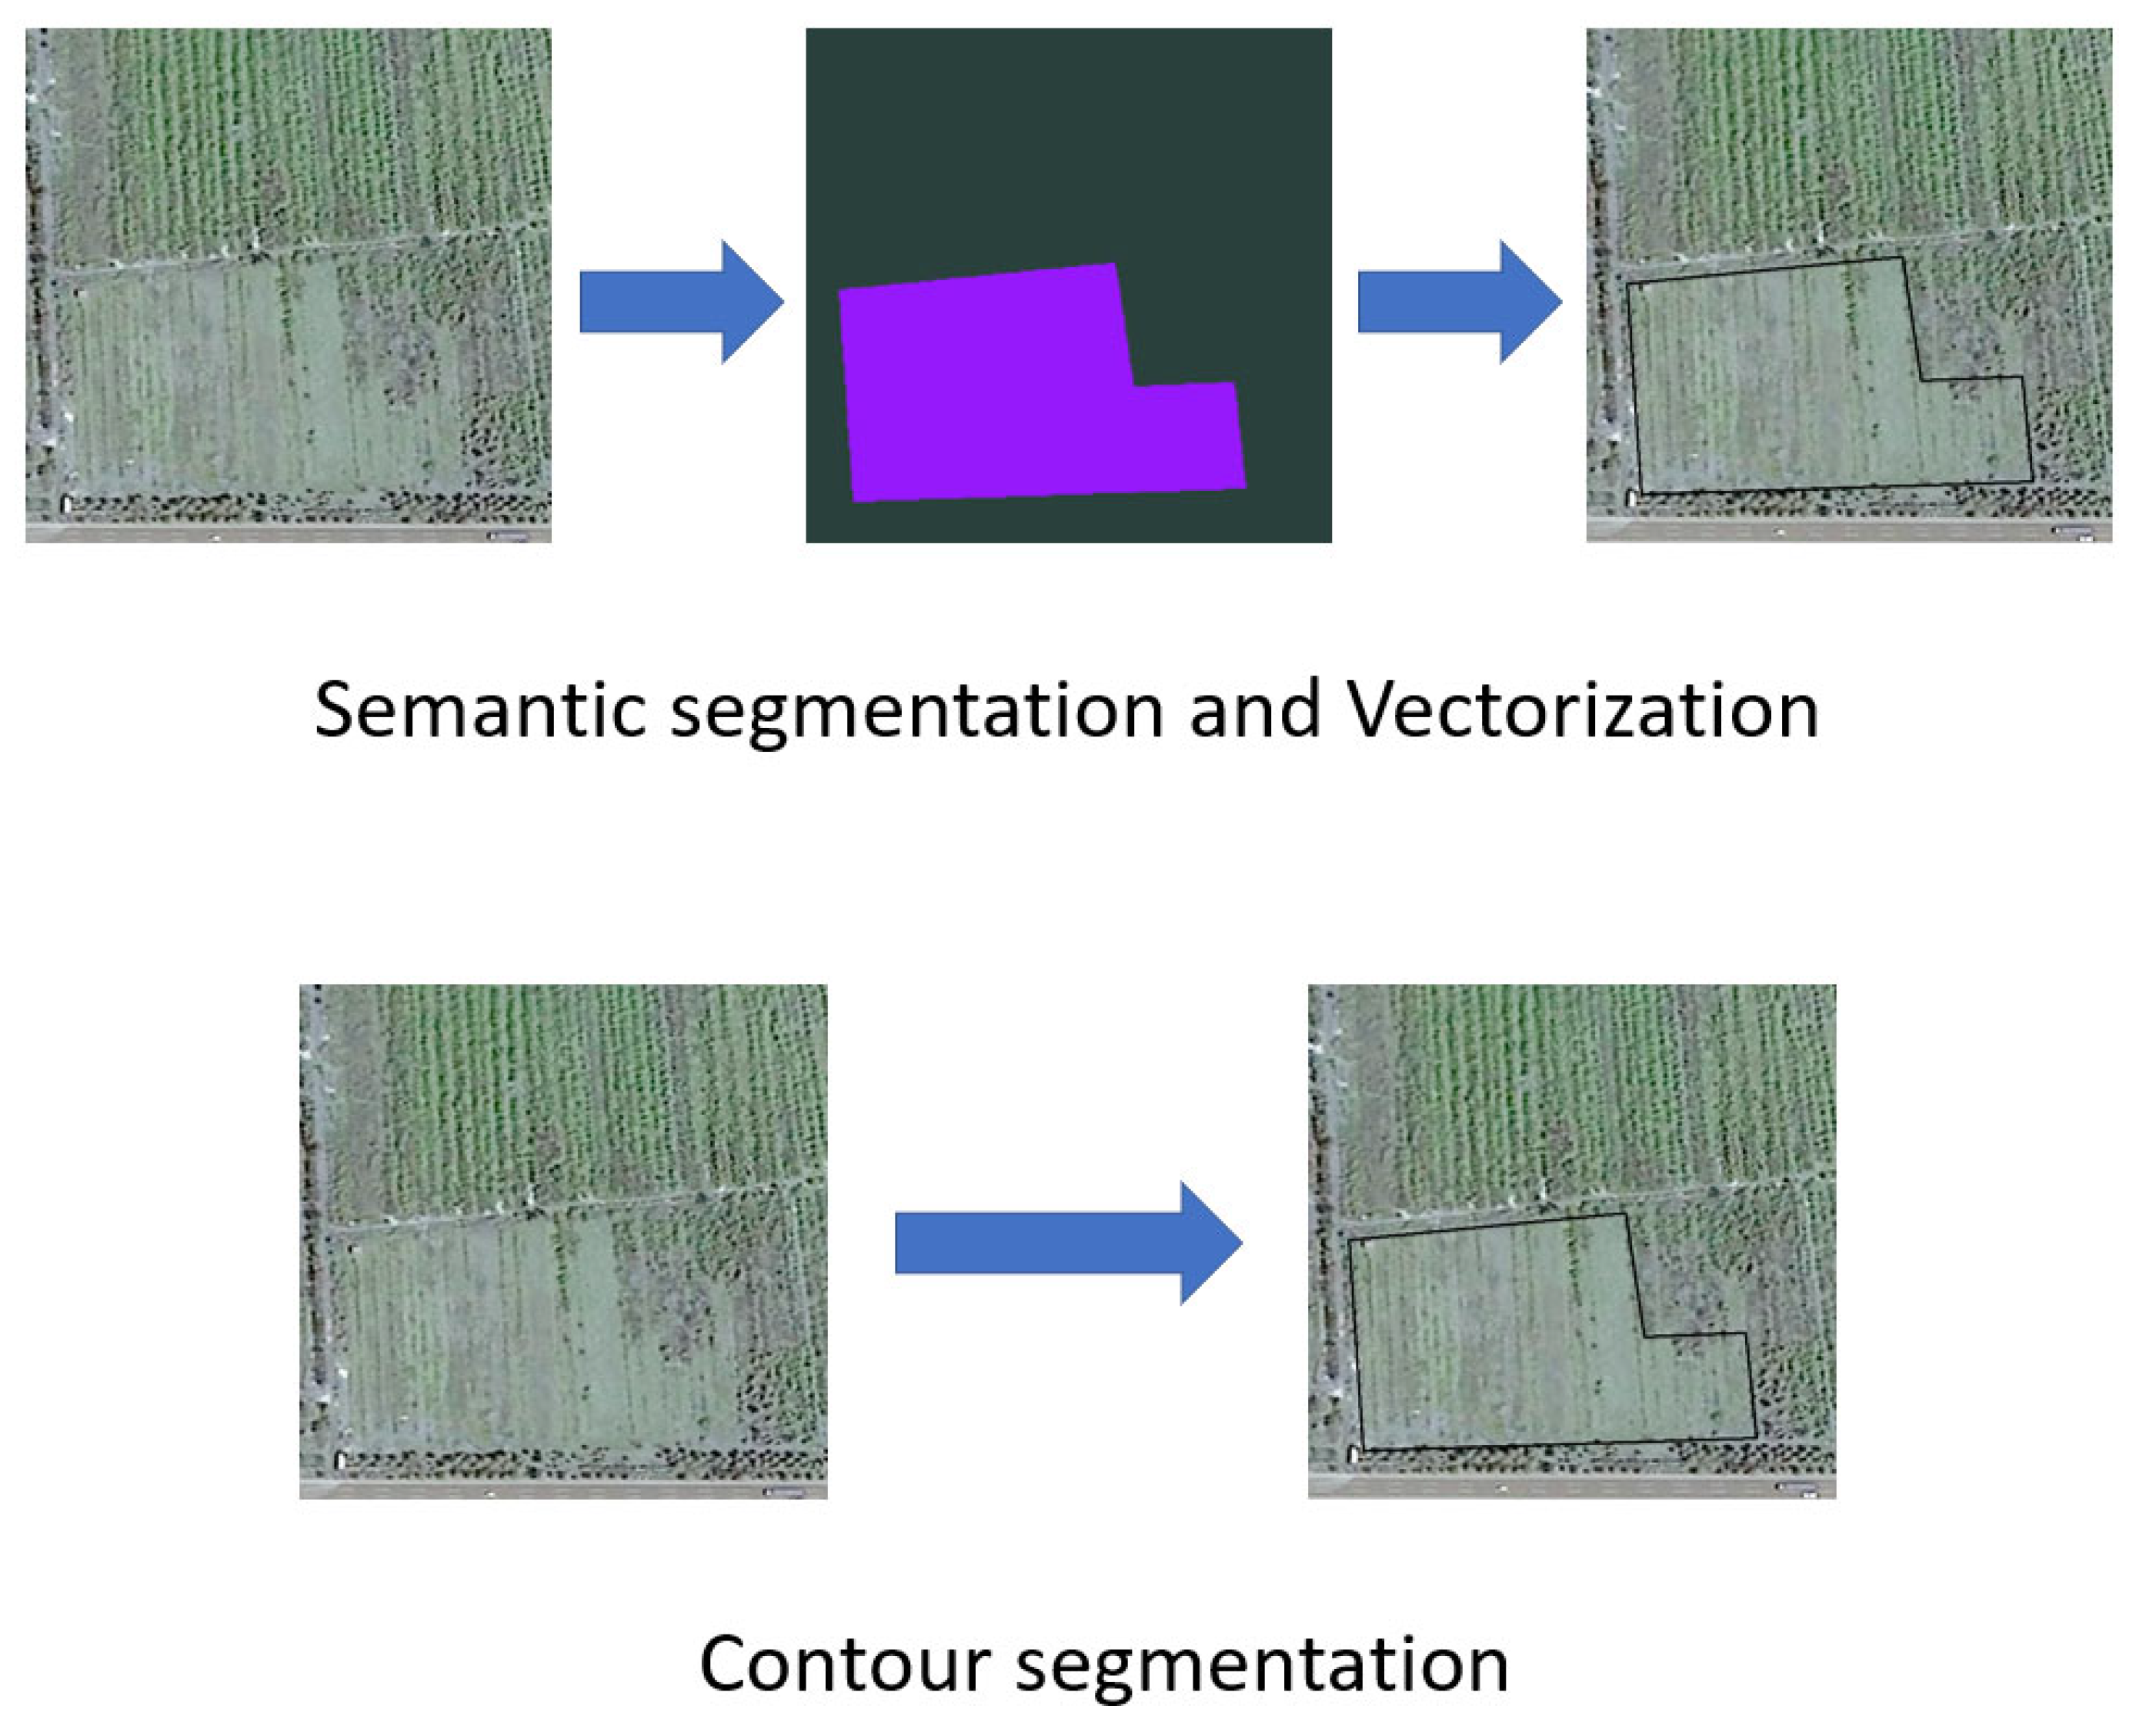
39]. Semantic segmentation extracts agricultural parcels from remote sensing images by first generating raster masks and then using a vectorization scheme to convert these masks into vector polygons of agricultural parcels, as shown in
Figure 1. In contrast, contour segmentation generates a set of contour points from remote sensing image features, which are used to represent the vector polygon of the target. This is an object-based extraction method, as shown in
Figure 1. For agricultural parcels, the boundary of agricultural parcels extracted by contour segmentation is closed, and can provide topological information between parcels. Therefore, the vector contour extraction is more in line with the actual situation than the raster pixel extraction. But, the existing contour extraction models, such as PolarMask [
40] and Point Set [
41], are unable to extract complete parcels for large areas. It cannot achieve good results in contour boundary fitting, therefore, contour segmentation is rarely used to extract agricultural parcels from remote sensing images.
To address the issues of voids, fragmentation, and unclosed boundaries in raster masks extracted from agricultural parcels using semantic segmentation, this paper proposes a vector contour prediction network based on a hybrid backbone and multiscale edge feature extraction module (HEVNet) for agricultural parcel extraction in remote sensing images. This solved the problems of poor extraction performance and fine edge refinement for agricultural parcels of different scales, and improved the geographic measurement accuracy of agricultural parcel delineation. The main contributions of this study are summarized as follows:
The hybrid backbone combining Resnet 50 and Swin Transformer is used to extract the texture features of agricultural parcels while taking into account the context information. It breaks through the limitation of the receptive field of the traditional convolutional network and enhances the recognition ability of the network for agricultural parcels of different sizes.
The multiscale edge feature extraction module is added to predict and calculate the loss of the parcel edge from the multiscale features, so as to supervise and restrict the prediction of the parcel edge and improve the accuracy of contour prediction.
We use the vector contour prediction module based on contour instance segmentation to extract the agricultural parcels in an object-based manner, and directly generate the vector polygon of the agricultural parcels to solve the problems of internal cavity and unclosed edge of the agricultural parcels.
2. Materials and Methods
2.1. Research Region and Data
In this paper, we selected three public datasets: the cultivated land dataset in the Netherlands, the cultivated land dataset in Denmark, and a cultivated land dataset from the iFLYTEK challenge in 2021. In addition, we also selected Hengyang in Hunan Province as the research area, and outlined the cultivated land in the remote sensing images of Hengyang as the dataset. Data mapping and processing using ARCGIS 10.2. The overview of the four study areas is shown in
Figure 2.
Netherlands data: The remote sensing image of the Netherlands is from a Sentinel-2 multispectral 10-m resolution remote sensing image downloaded from GEE. The image was collected in May 2020, including RGB and NIR bands, and the cloud content in the image accounted for less than 10%. Agricultural parcel vector labels are obtained from the key registered crop parcel dataset provided by Publieke Dienstverlening Op de Kaart (PDOK). The registered crop parcel dataset includes farmland, grassland, wasteland, natural areas, and other parcels. Here, we only extract farmland as the label of our dataset. The whole area is located in the northeast of the Netherlands, covering an area of about 15000 square kilometers. The mechanization mode is used in a large area of Dutch agriculture. The parcel is densely distributed, the shape is relatively regular, and there are obvious boundaries or obvious planting patterns.
Denmark data: The dataset of Denmark is from the European Union Land Parcel Identification System (LPIS), which includes two Sentinel-2 true-color synthetic images obtained on May 8th, 2016 and the polygon vector files of agricultural parcels manually created in the region. The remote sensing image has a resolution of 10 m and contains three bands of RGB. The whole area is located in the east of Denmark, covering an area of more than 23000 square kilometers. Agricultural parcels in Denmark are relatively densely distributed, but the area is different, and the shapes of parcels are diverse, with many irregular parcels.
iFLYTEK data: iFLYTEK dataset is from the iFLYTEK Challenge 2021 cultivated land extraction from high-resolution remote sensing image. The image data is composed of high-spatial resolution images obtained by the Jilin-1 satellite, with a total of 31 images, of which the spatial resolution is between 0.75 m and 1.1 m. Each image contains RGB and NIR bands. The parcels in the whole dataset are unevenly distributed in the image, but the shape is regular and the structure is simple, without obvious fragmentation, and the boundary between adjacent parcels is not obvious.
Hengyang data: We collected the remote sensing images obtained by the GF-2 satellite during the receiving season of Hengyang in 2023, highlighting the diversified farmland landscape in the region. The spatial resolution of the panchromatic band and the multispectral band (RGB and NIR) of the remote sensing images provided by the GF-2 satellite is 0.8m and 3.2m, respectively. The downloaded remote sensing image is calibrated by radiation and atmospheric correction, and the panchromatic sharpening method is used to fuse the multispectral band and panchromatic band in the image, and its spatial resolution is improved to 1 m. In the processed high-resolution remote sensing image, 1802 agricultural parcels in the study area were sketched by hand as sample labels. Under the influence of topography and climate, the farmland in Hengyang is seriously fragmented, the agricultural parcels are scattered, of different sizes, have irregular shapes, and have a disorderly distribution, and farmland boundaries are fuzzy.
2.2. Data Preprocessing
Two regions were randomly selected in the Netherlands and Denmark datasets as the training set and test set of their respective images. The first 26 images in the iFLYTEK dataset were used as the training set, and the last 5 images were used as the test set. Most of the western regions in Hengyang dataset are used as the training set of the model, and a small part of the eastern regions are used as the test set of the model. In order to make the experimental data acceptable to the model, the image and label data were sliced. The remote sensing image is cut into 512 × 512 slices by a sliding window. According to experience, the overlap rate between adjacent parcels is 25%, and then the sliced data is cleaned to filter out the slices with less than 20% of the farmland area. For the Hengyang data, due to the small sample size, the data were enhanced, and the sample size was amplified by horizontal and vertical flipping, mixing, and color jitter. The relevant information of the obtained data is shown in
Table 1. The number of training validation sample slices obtained from the Netherlands, Denmark, iFLYTEK, and Hengyang datasets was 2287, 3658, 3744, and 1152, respectively, and the number of test set samples obtained was 1428, 1356, 566, and 365. Then, the samples of the training validation set are divided into training samples and validation samples according to the ratio of 4:1. At the same time, the vector file of the parcel annotation is sorted into two labels, raster mask and COCO format, for model reasoning and accuracy evaluation. Finally, we obtained four datasets, which are mutually independent. The model was trained, validated, and tested on each dataset separately.
2.3. Methods
In this paper, we propose a vector contour prediction network based on a hybrid backbone and multiscale edge feature extraction module (HEVNet) to extract agricultural vector parcels from remote sensing images. The network model is composed of the following components: a hybrid backbone, a multiscale edge feature extraction module, and a vector contour prediction module. The overall structure is shown in
Figure 3. The hybrid backbone module combines two feature extraction models, Resnet 50 and Swin Transformer, to extract multiscale features from remote sensing images and generate feature pyramids. The multiscale edge feature extraction module predicts the edge pixels of the agricultural parcels by obtaining the extracted information, and returns the edge enhancement information. The vector prediction module uses the method of instance segmentation, regarding the farmland as a polygon, and generates the vector polygon boundary box of the farmland through the regression and discrimination of the position of the contour points, so as to solve the problems of internal cavity and the unclosed phenomenon of the parcel boundary in the previous pixel-based prediction.
2.3.1. Hybrid Backbone
In the past, convolutional neural networks were usually used for the feature extraction of remote sensing images. Convolutional neural networks have a good effect on image local feature extraction, but due to the limitation of the convolutional kernel receptive field, it is difficult to recognize large-scale targets and obtain global information. In this regard, some scholars proposed the Transformer model with an attention mechanism as the core, and developed a Swin Transformer image feature extraction module similar to convolution feature extraction. The Swin Transformer feature extracts features efficiently through the attention mechanism of the window, breaks through the limitation of the convolution layer on the receptive field, and can use the self-attention mechanism to better capture the global context information. However, when dealing with fine-grained features, it may ignore local details, resulting in small local features that may be covered by global information.
According to the characteristics of convolutional networks with strong local information extraction and the Swin Transformer with strong global semantic information extraction, we use a feature extraction module that combines the convolutional network Resnet 50 and the Swin Transformer model, and propose a feature fusion module that can fuse the features of different scales extracted by the two in the channel and space. As shown in
Figure 4, the two feature extraction modules extract features at different scales from remote sensing images, import the extracted image features at each level into the feature fusion module for feature fusion, and use the fused features as the input of the next level feature extraction module. The fused feature maps of different scales are used to form the feature pyramid of the remote sensing image.
As shown in
Figure 4, the feature fusion module references the previous CBAM attention mechanism and fuses image features from both spatial and channel perspectives [
42]. Firstly, the feature images of different channel numbers are stitched, and the number of characteristic channels is adjusted through 1 × 1 convolution. Then, the channel and spatial position are weighted by means of average pooling, maximum pooling, global average pooling, and global maximum pooling, that is, spatial attention and channel attention. Finally, the fused feature layer is output through a 1 × 1 convolution layer.
2.3.2. Multiscale Edge Feature Extraction Module
The process of the continuous down sampling of image features will cause a loss of edge detail information. Therefore, we propose an edge prediction module to predict the edge pixels of agricultural parcels, and restrict the extraction of edge features by the hybrid backbone network. As shown in
Figure 5, the edge decoder is connected to the four different scale features extracted from the hybrid backbone network. The decoder can obtain the probability prediction of the edges of agricultural parcels with different scales, and return the extracted edge features to the backbone network. Finally, the prediction results of each scale are superimposed and fused through the convolution network to obtain the final fused edge prediction map. Finally, the loss function of each scale edge prediction and the fused edge prediction loss function are calculated.
Edge decoder: In order to enhance the ability of the model to perceive the edge information in the feature graph, the edge perception module is added to integrate the gradient information in the feature graph. As shown in
Figure 6, Sobel filters with four different directions are used for filtering. The edge of the agricultural parcels usually appear in the region with obvious difference in pixel values and fixed directions. Sobel filters can better capture the edge features of different directions in remote sensing images. The filtered image is stitched and fused through a 3 × 3 convolution network. The fused edge features are first returned to the backbone network, and then the fused edge feature image is reduced to one channel dimension through a 1 × 1 convolution operation. Finally, the image resolution is restored to the original image size using bilinear interpolation, and the prediction results of the agricultural parcels edges are obtained.
Loss function: Referring to the HED edge detection loss function, we design the edge detection loss function in this paper [
34]. For the prediction of agricultural parcel edges, the edge loss function is divided into the loss of the lateral output layer and the loss of the fusion layer. The loss of the lateral output layer is as follows:
where
represents the loss of four different lateral output layers.
and
represent the sample label value and the predicted value, respectively.
is the weight parameter. Because the number of edge pixels and non-edge pixels in the edge detection task is extremely unbalanced, it is necessary to introduce a weight parameter to balance the weights of different categories, and its expression is as follows:
where
and
represent the number of edge and non-edge pixels, respectively.
The loss of the fusion layer is calculated as follows:
where
represents the cross-entropy loss function, and
is the prediction result of fusing all side output layers through the activation function σ as follows:
where
represents the result of each lateral output layer.
The final edge prediction loss function is the sum of the losses of the fusion layer and the lateral output layer as follows:
2.3.3. Vector Contour Prediction Module
In the past, the extraction of farmland blocks was essentially the pixel-level classification of remote sensing images, so the extracted farmland blocks would inevitably have the phenomenon of incomplete edges and empty parcels. In this regard, we propose a method to extract the parcel in the form of a vector, taking a single farmland area as an example, representing the contour of the target parcel with a polygon composed of the coordinate set of feature points, and extracting the agricultural parcel in an end-to-end manner. The contour prediction module proposed by us refers to the Fast R-CNN target detection model, and predicts the vector contour of the target object on the basis of generating the target detection box.
As shown in
Figure 3, the contour prediction structure is similar to the Fast R-CNN structure [
43]. Before vector contour prediction, target detection must be performed to generate a target detection box, and then the parcel contour is predicted in the target detection box. The remote sensing image is feature extracted through the previous hybrid backbone network, and edge features are enhanced through the multiscale edge feature extraction module. Then, the extracted feature map is put into the RPN (region proposal network) module to generate the extraction candidate box. According to the obtained candidate box, the features of the corresponding region are clipped in the feature map, and then the clipped part is imported into the ROI Align module. The ROI Align module is responsible for extracting the regional features in the candidate box and converting the regional features of different scales into the same scale size. The obtained regional features are transmitted to the full connection network and then transferred to the target box prediction module and contour prediction module. The target box prediction module generates the category and regression parameters of the target box, and the contour prediction module generates the confidence and regression parameters of the contour points.
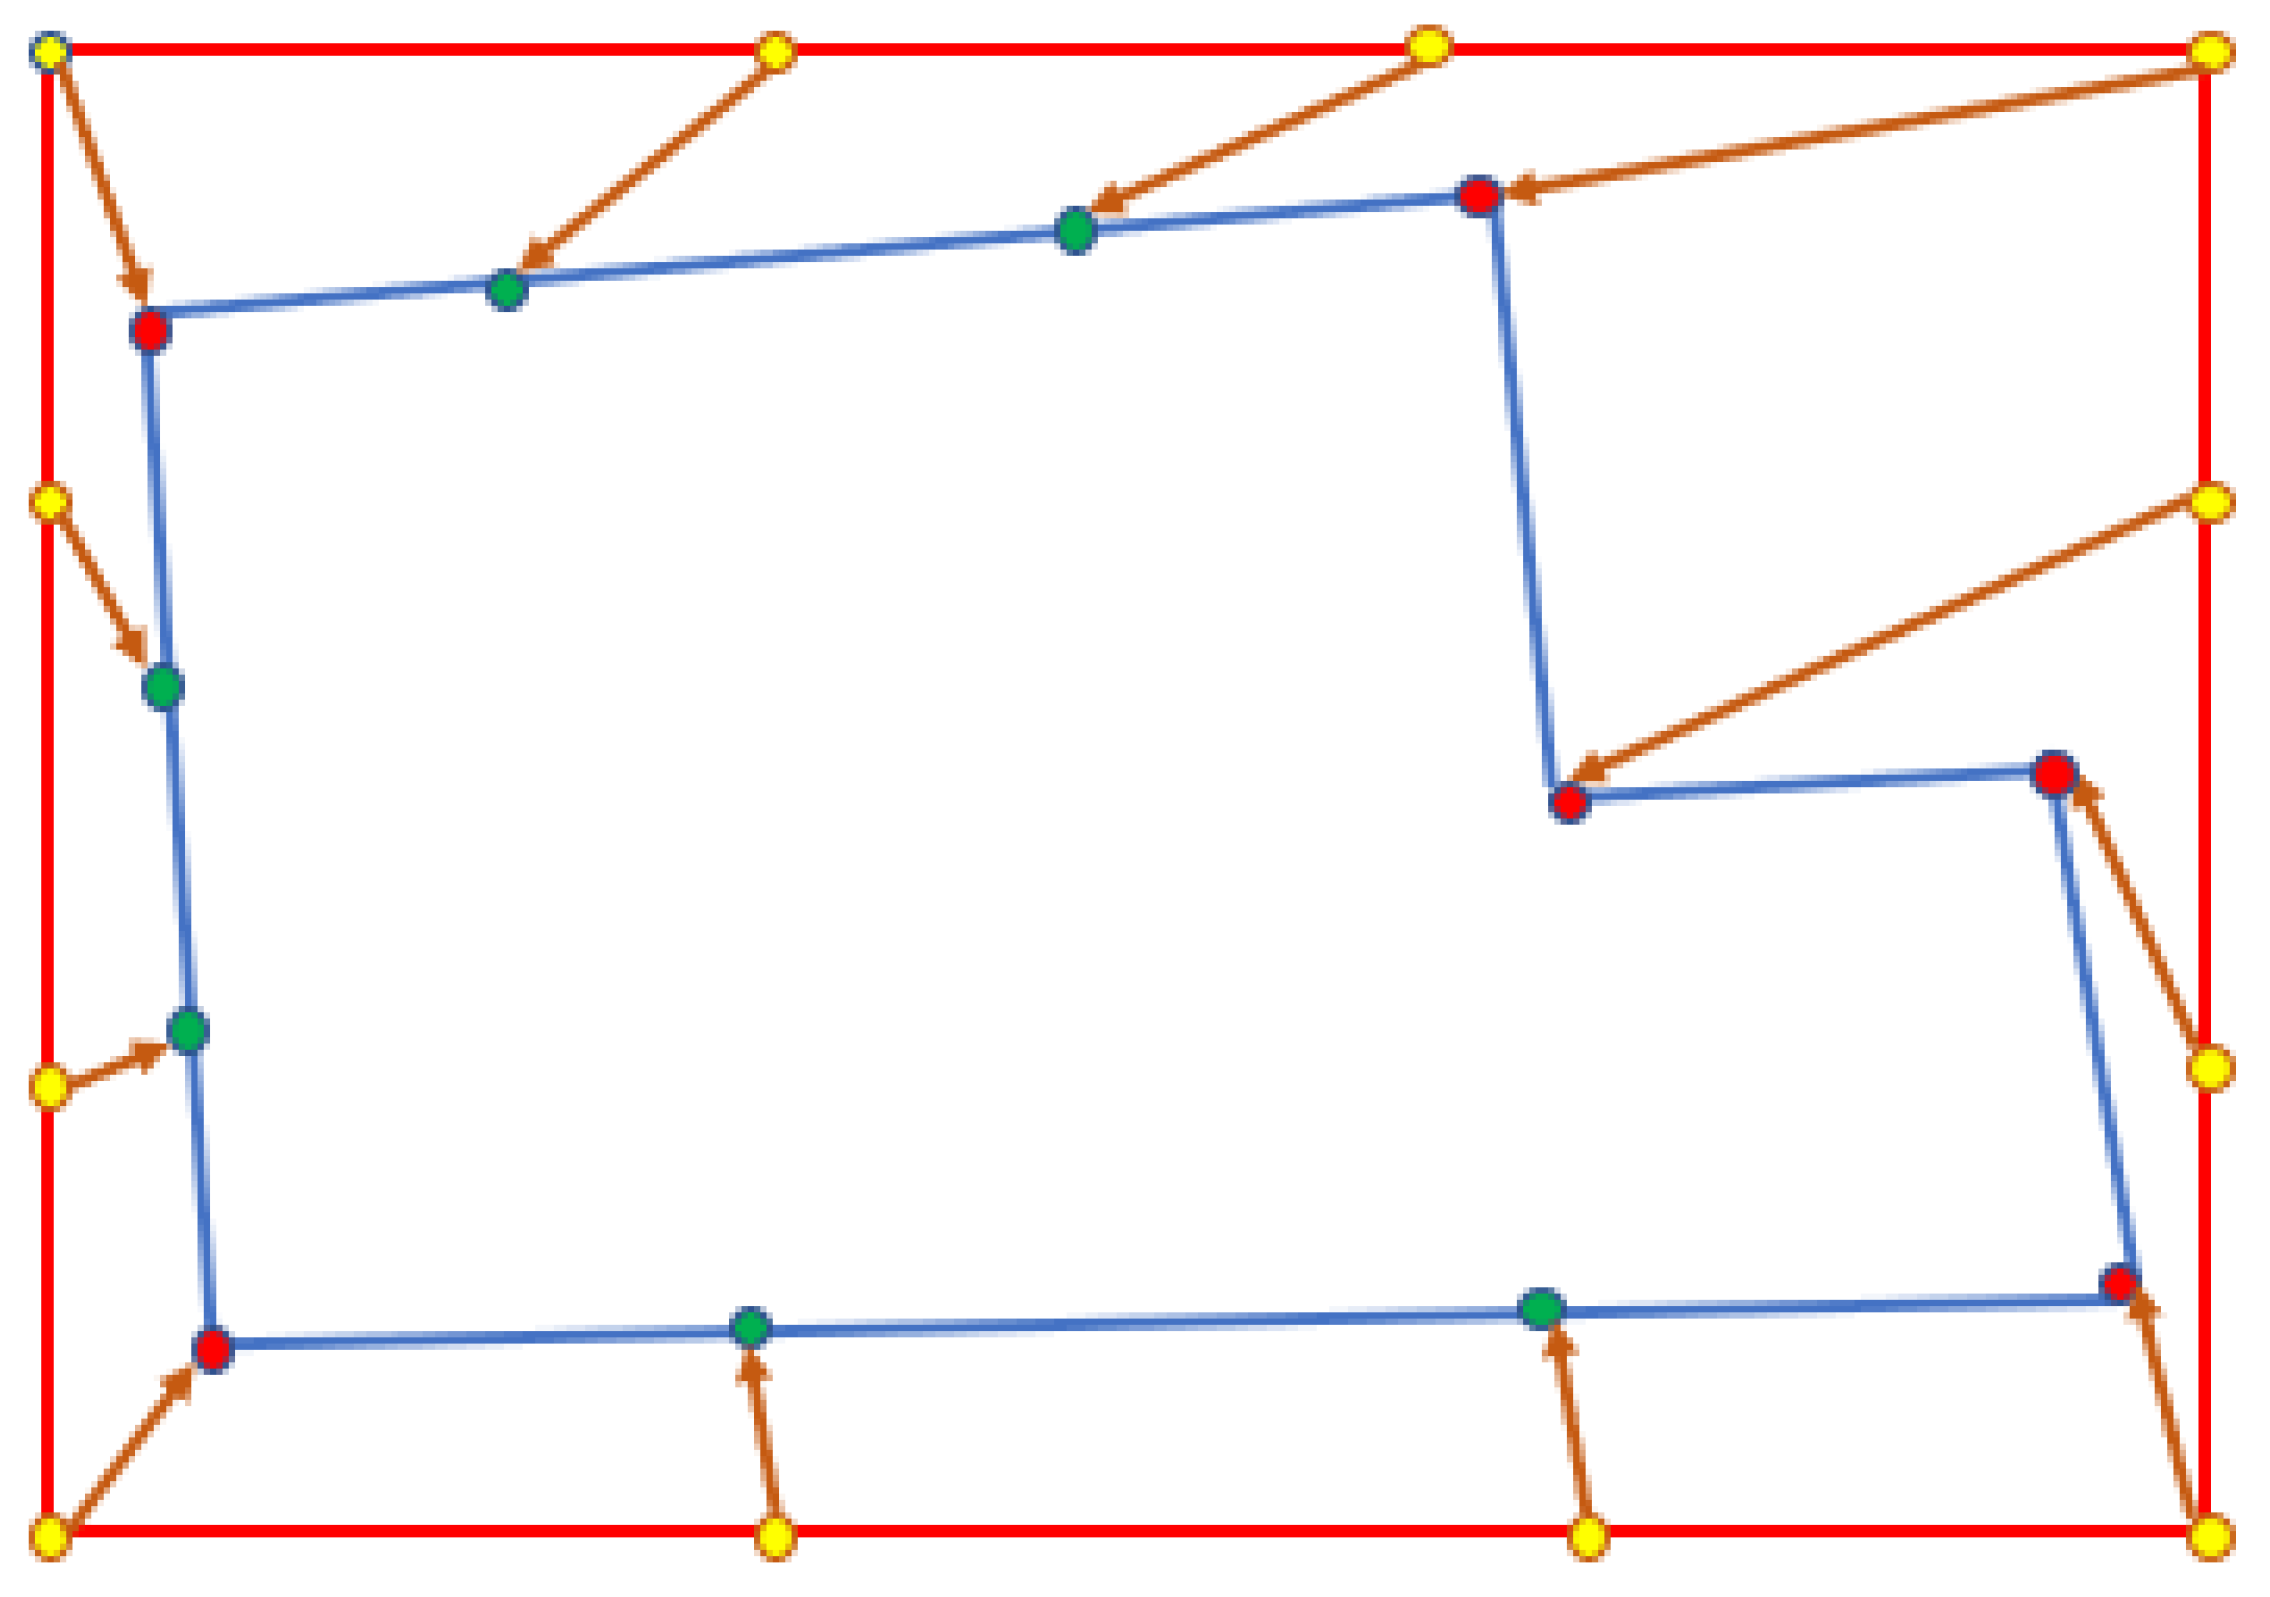
The polygon representing the agricultural parcel is formed by a series of contour points. The prediction of agricultural parcel contour is essentially a task of identifying and regressing contour points. As shown in
Figure 7, according to the target parcel boundary box obtained by target detection, points are generated by uniformly sampling along the surrounding boundaries of the target parcel boundary box as initial polygon contour points. According to the features in the target boundary box extracted by ROI Align, the offset of each initial contour point is obtained through the calculation of the convolution layer and the full connection layer, and the position of the contour points is adjusted. Each contour point is offset in the direction of the closest real contour point, and all contour points are regressed according to the offset between the original point and the real point, and then the redundant contour points are deleted through the confidence judgment of contour points, and finally a contour point set is obtained.
In this experiment, 64 contour points are preset for each polygon, and 64 points are also sampled in the annotation as the corresponding ones. According to the confidence of the contour points obtained, whether they are effective contour points is determined, and the vector polygons of agricultural parcel in remote sensing images can be obtained by connecting the effective contour points.
Loss function: For contour prediction, the loss function is divided into three parts, regional proposal network loss, detection box loss, and contour point loss. Each part of the loss is divided into classification loss and regression loss. The classification loss of RPN and the box is used to determine whether each anchor box contains targets, and the point classification loss is used to determine whether each point is a valid contour point. For the loss of classification and regression, the traditional Fast R-CNN loss function is used for calculation [
43].The calculation formula of classified loss is
where
is the real label of the target frame (the foreground is 1 and the background is 0),
is the foreground probability predicted by the model, and
is the number of anchor frames participating in the training.
Regression loss is used to adjust the coordinates of the bounding box (or contour point) to make it closer to the true value. The calculation formula is as follows:
where
is the indicating function, which is 1 when the anchor box is a positive sample,
represents the predicted boundary box (contour point) coordinates, and
represents the real boundary box (contour point) coordinates.
is used to calculate the offset between the predicted value and the real value.
The loss of vector contour prediction module is as follows:
The classification loss and regression loss of RPN, box, and point are considered for contour prediction loss. λ is the weight of different losses. Referring to the settings of the weight of the loss function for instance segmentation in previous studies [
38,
39,
43], and considering that this study focuses more on predicting contour points, we set the weight λ as 2, 2, 3, 3, 6, and 6 in this experiment.
The overall loss of this model: combined with the multiscale edge feature extraction module and the vector contour module, the overall loss function is constructed according to the proportion of 0.3 and 0.7.
2.4. Accuracy Evaluation
For the accuracy evaluation of the experimental results, in order to not only make a comparison with the traditional method, but also reflect the characteristics of vector extraction, we use two kinds of evaluation indexes for accuracy evaluation, the traditional semantic segmentation evaluation index and the evaluation index based on the contour object.
The semantic segmentation rating indicators include precision (P), recall (R), overall accuracy (ACC), intersection union ratio (IOU), and F1 score (F1). The calculation formula is as follows:
where TP and TN are the areas correctly identified as agricultural parcels and non-agricultural parcels, while FN and FP are the number of pixels incorrectly identified as non-agricultural parcels and the area of agricultural parcels.
Object evaluation refers to taking the parcel as a single object to evaluate the geometric accuracy of the extracted results [
38,
44]. It includes over-classification error, under-classification error, and polygon similarity score (PoLiS).
The over-classification error and under-classification error [
44] are used to indicate the excessive segmentation and insufficient segmentation of a single parcel object, as shown in the
Figure 8. The smaller the error value, the better the segmentation effect.
The calculation formula is as follows:
where
and
, respectively, represent the real value and predicted value of a single parcel. The over error and under error can be calculated by calculating the ratio of their overlapping area to their respective areas.
The polygon similarity score (PoLiS) is mainly used to measure the similarity between the extracted polygon contour and the real contour [
38]. The smaller the value is, the closer the extraction result is to the real contour. The calculation formula is as follows:
where
represents the predicted fixed-point coordinate set,
represents the real fixed-point coordinate set, and the formula represents the average distance between the predicted fixed-point coordinates and the nearest point of the real fixed-point coordinates.
4. Discussion
This study’s key innovation was exceeding the previous prediction of agricultural parcels based on the semantic segmentation of raster data and the use of object-based vector contour prediction to extract agricultural parcels. At the same time, a hybrid backbone combining Resnet and Transform is proposed, which combines the features extracted from the two networks at different scales with the spatial and channel attention mechanisms, so that it cannot only contact the global context information, but also take into account the local details. Additionally, a multiscale edge feature extraction module is proposed to solve the problem of the fuzzy edges of agricultural parcels. By extracting and constraining the edges and shapes of agricultural parcels at different scales, the accuracy of the edge extraction of agricultural parcels is improved.
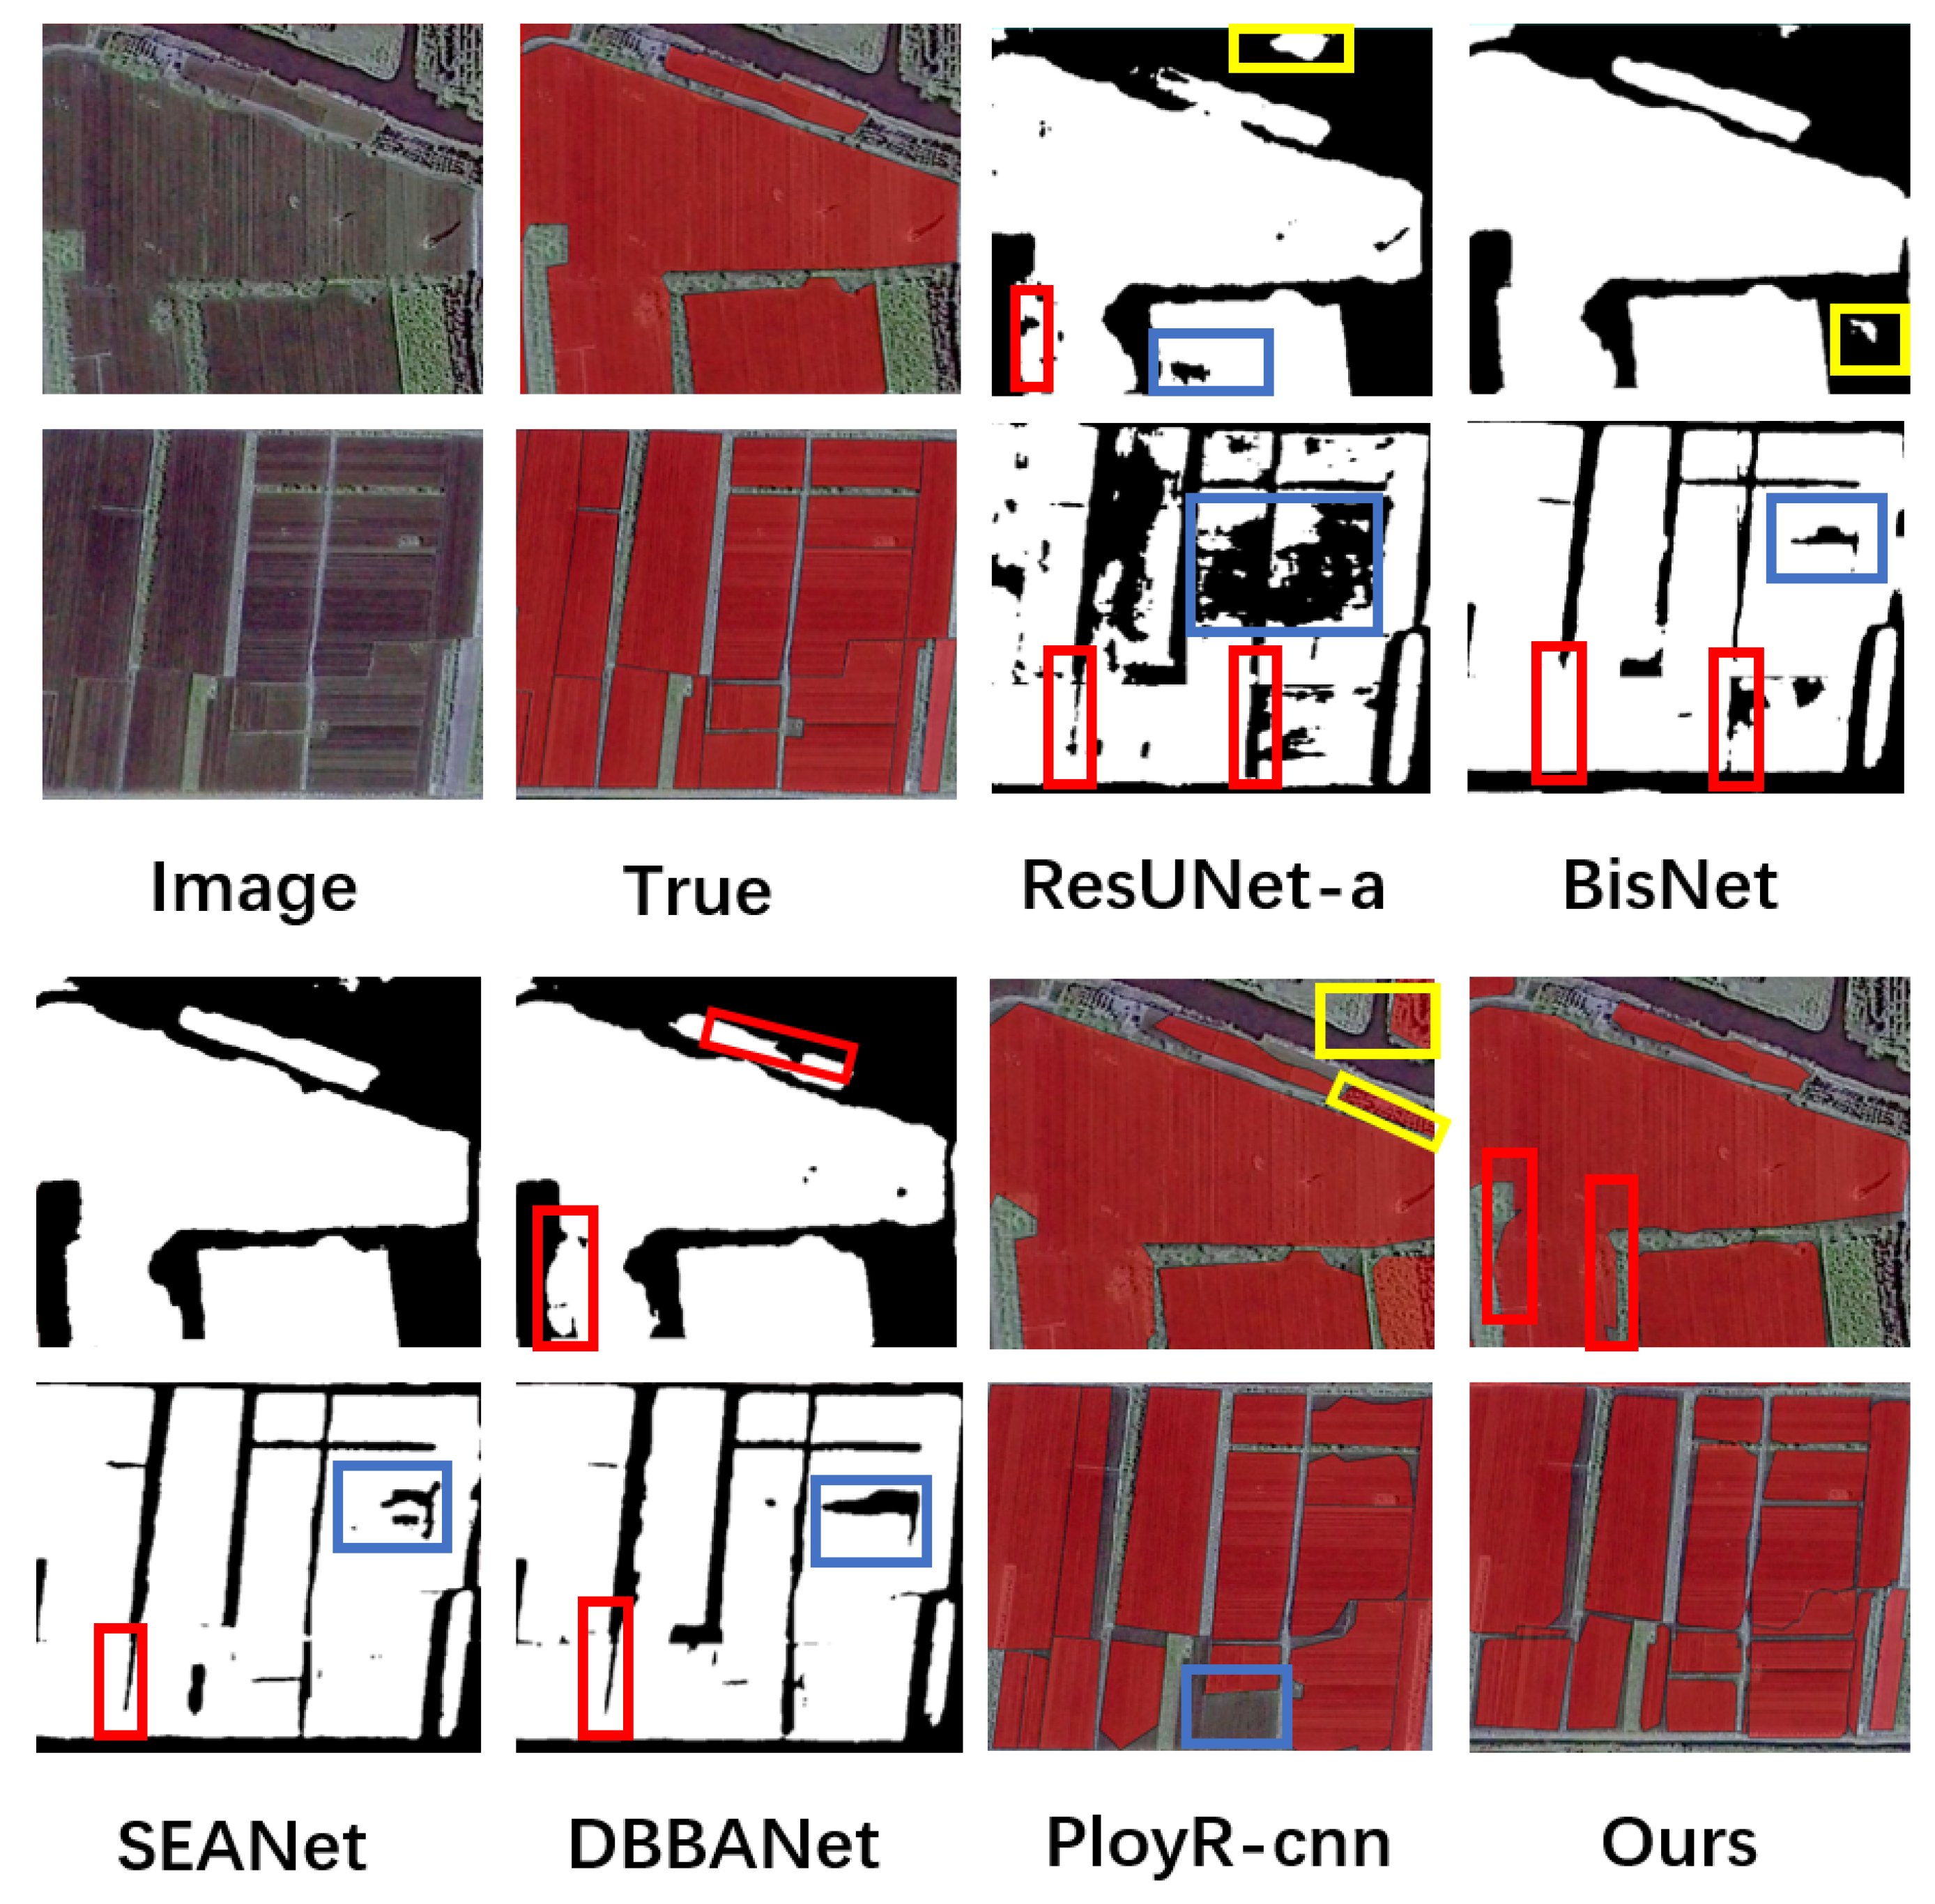
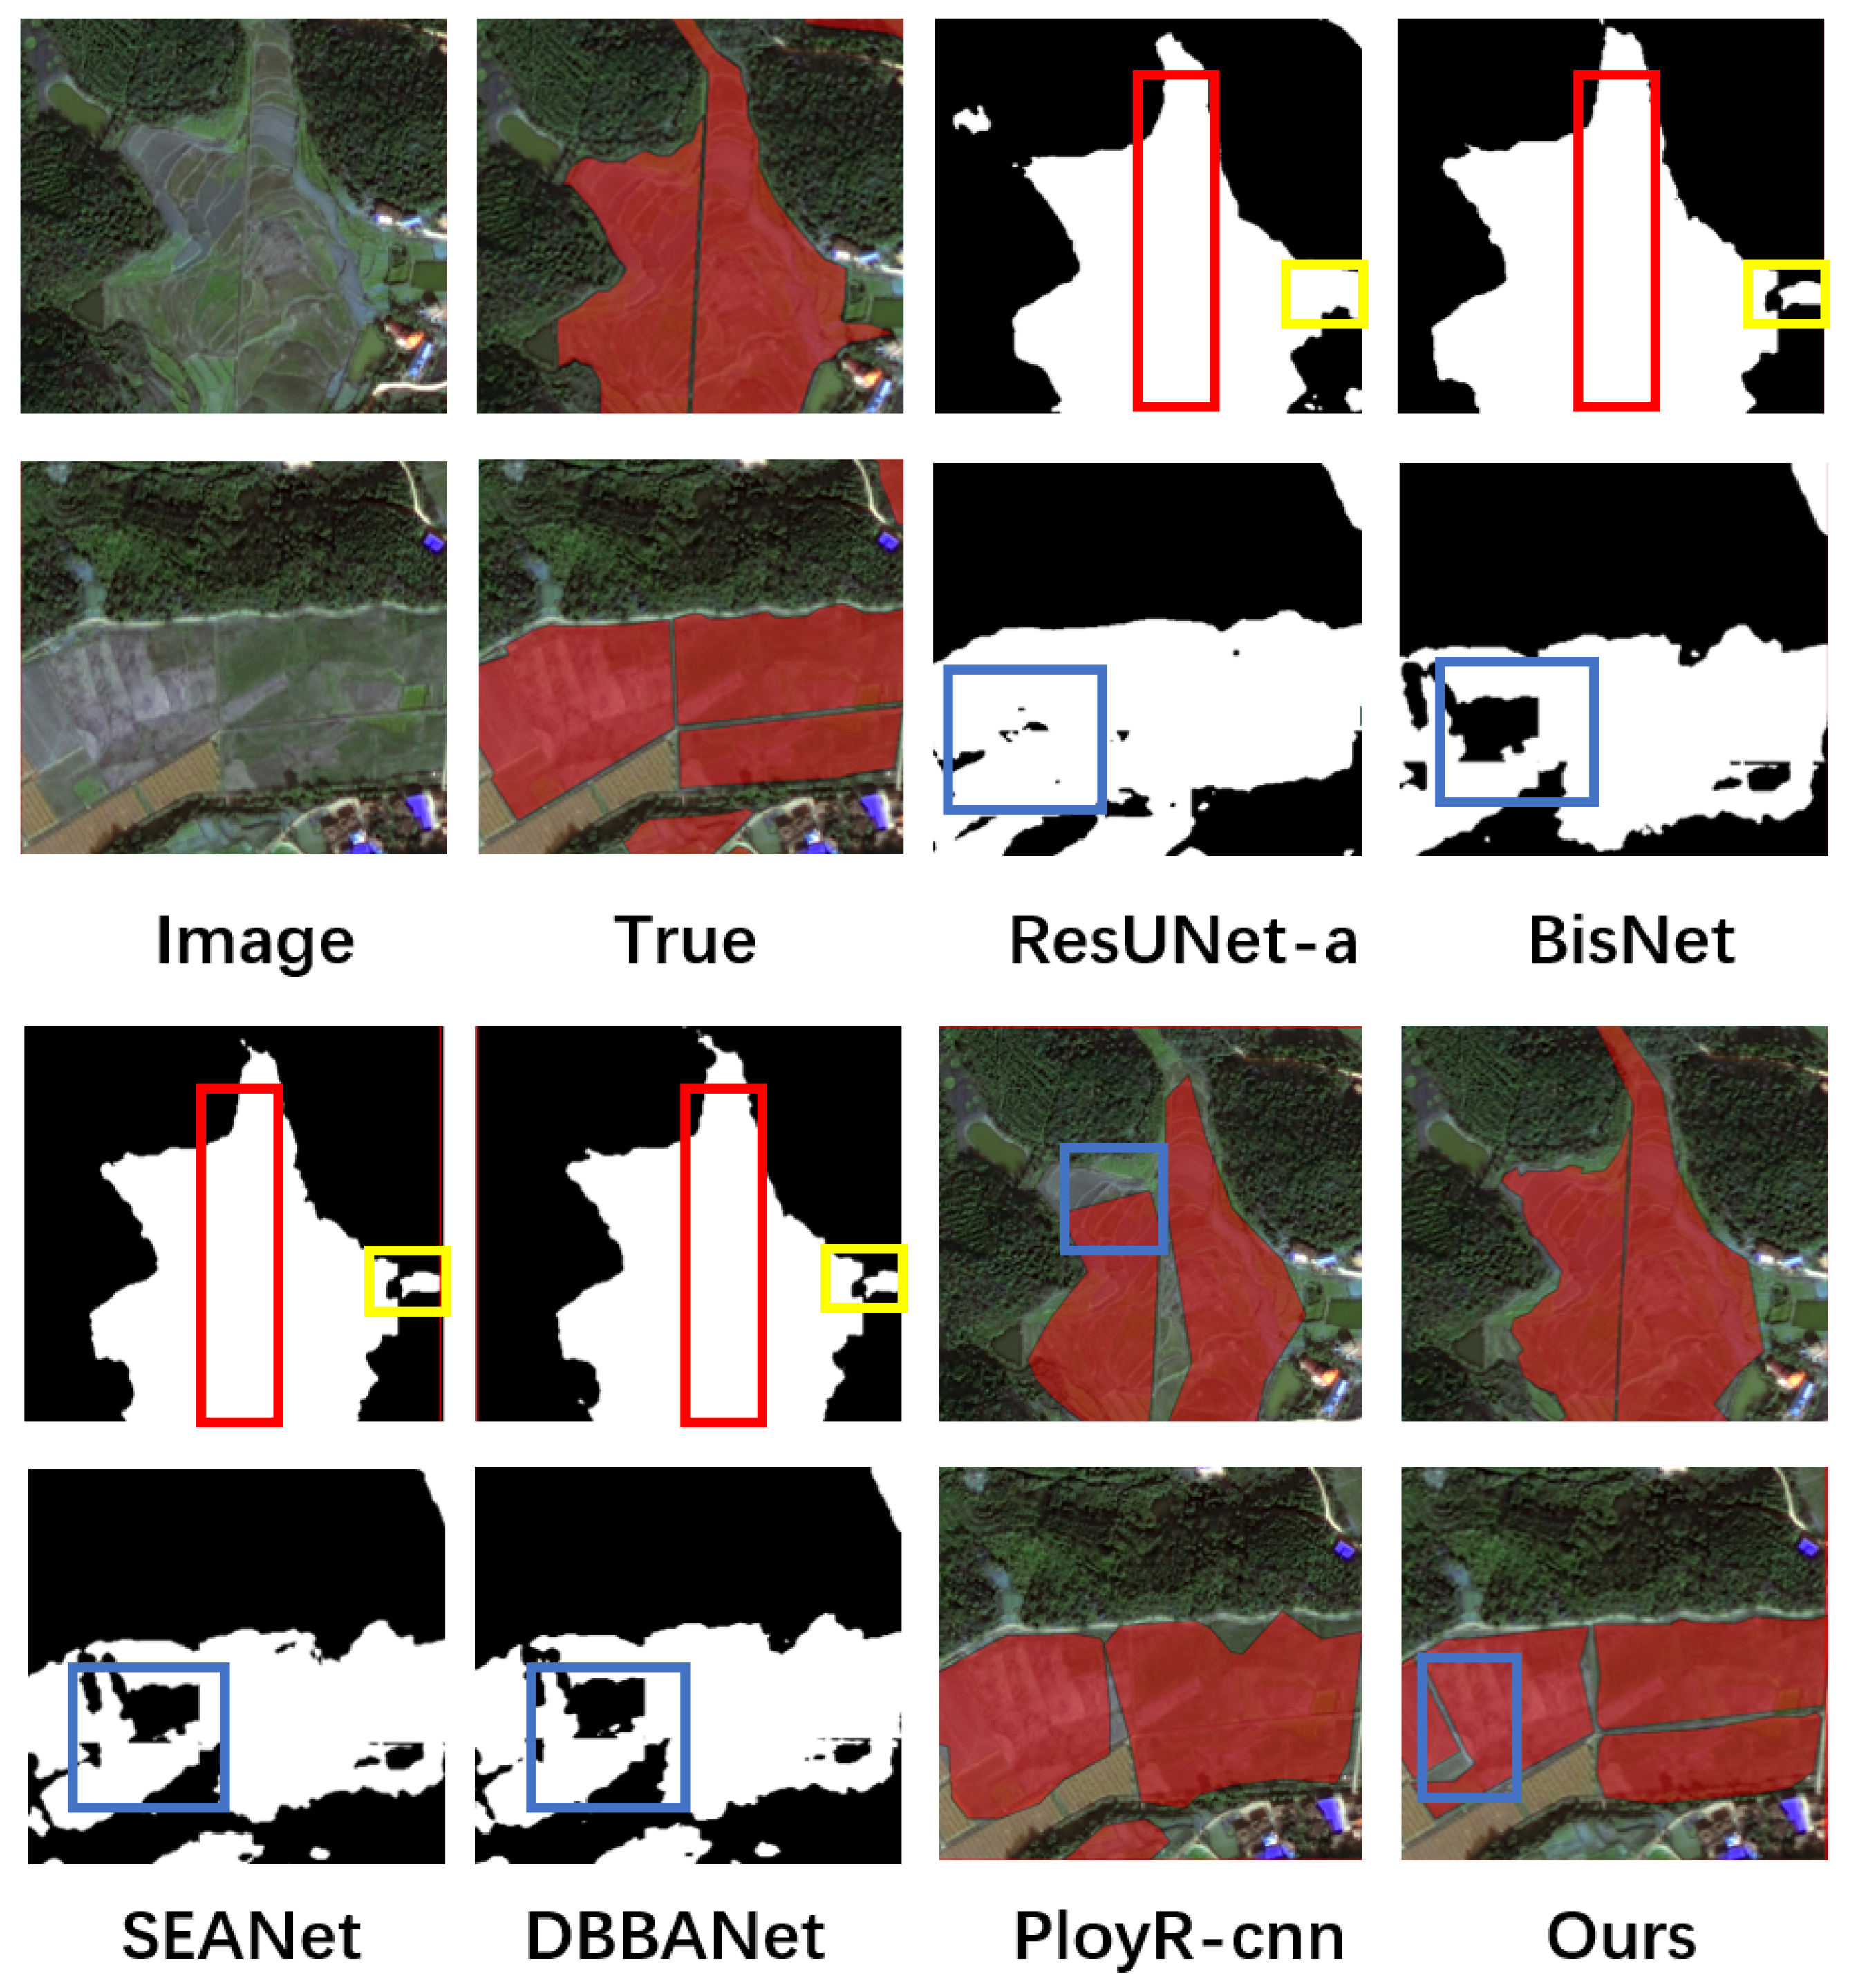
In terms of agricultural parcel extraction, our model has special advantages compared with previous raster-based extraction methods [
35,
36,
45]. Previous methods aimed to improve the accuracy of agricultural parcel extraction by adding attention mechanisms [
45], edge refinement [
36], and multitask extraction [
35]. However, due to the limitations of raster pixels, it was difficult to extract complete agricultural parcels. Our model extracts agricultural parcels in the form of objects, which is more efficient than raster-based methods. Compared with the raster-based approach, our model has a higher accuracy than the previous models in extracting agricultural parcels. The extracted parcels are more complete, the boundaries of the parcels are clearer, and the isolated segmentation is reduced, which shows a good effect in solving the hole phenomenon in the middle of large agricultural parcels. However, at the same time, our model has a low recall rate, which may result in missed detections for small agricultural parcels, and the recall rate of agricultural parcels is not as good as previous raster extraction methods.
Although the HEVNet model in this paper shows a good performance in extracting complete agricultural parcels, it still has some limitations. First of all, because the vector contour prediction model in this paper generates vector polygons by generating contour points, it can only predict closed agricultural parcels. For some farmland with houses and ponds inside, the agricultural parcels themselves have holes, so the model in this paper cannot predict their inner contours (such as
Figure 10). The method of generating a vector image containing voids to represent the corresponding shape of the parcel is an improvement in the direction of this model.
Secondly, the contour prediction points generated by our model represent the polygon of agricultural parcels. The number of contour points is usually set quite high to cover most farmland plots, but this may cause contour point redundancy, which will cause the distortion of the predicted polygon of agricultural parcels [
38] (such as
Figure 11). The method for reducing the redundant contour points of simple-shaped agricultural parcels while extracting complex-shaped agricultural parcels remains to be optimized.
In addition, we find that the HEVNet model has a poor fitting effect on the shape of fragmented agricultural parcels, and there can be the problem of mistakenly dividing one parcel into multiple parcels (such as
Figure 12). This may be because the edge features of scattered agricultural parcels are complex, and it is difficult for the multiscale edge feature extraction module to understand their features at a deeper level, thus similar texture features can be misjudged as agricultural parcel boundaries [
26]. In the future, we can improve the fitting effect of agricultural parcels by optimizing edge feature extraction modules [
36] and multitasking collaborative networks [
35].
In general, although our model has some problems in extracting some special-shaped parcels, it has achieved remarkable results in solving the problems of agricultural parcel cavity, edge blur, and so on compared with the previous raster extraction model. In the future, we can conduct relevant research to optimize the extraction methods for the edges of small agricultural parcels and solve the problem of contour boundary extraction for special-shaped agricultural parcels, which can be used to extract fragmented agricultural parcels in special terrains.
5. Conclusions
This paper proposes a HEVNet model based on a hybrid backbone network and multiscale edge feature extraction, which is used to extract the vector polygon of agricultural parcels in remote sensing images. In this model, we propose a hybrid trunk module and a multiscale edge prediction module to assist in agricultural parcel contour prediction. By integrating features from the ResNet 50 and Transformer modules, the hybrid backbone module fully extracts the texture features of agricultural parcels, overcomes the limitations of traditional convolutional receptive fields, and improves the extraction of parcels of varying sizes. The multiscale edge feature extraction module identifies the edges of agricultural parcels on different scale features, and designs a multiscale edge loss function to restrict the extraction of edge features, reducing the loss caused by edge features in the down sampling process, so as to obtain agricultural parcels with clearer edges. In this aspect of mapping, we use the method of directly generating contour points to generate an agricultural parcel vector map, instead of the previous method of first using raster extraction and then using raster to vector mapping. We conducted experiments using datasets from Denmark, the Netherlands, iFLYTEK, and Hengyang, China. From the results, our model achieved IOU indices of 67.92%, 81.35%, 78.02%, and 66.35% on the four datasets, and scores of 72.64%,89.79%, 90.43%, and 71.49%, respectively. The evaluation metrics are mostly higher than those of the previous raster models (ResUNet-a, BisNet, SEANet, and DBBANet) and the Ployr-cnn model in terms of IOU and index. The effect extracted from regular parcels is obviously higher than that extracted from irregular parcels. From the visual map, the agricultural parcels extracted by our model are more complete and the boundary is more accurate and clear. Compared with raster-based extraction, vector-based extraction focuses more on the geometric information of agricultural parcels, effectively addressing the issues such as empty parcels, unclosed edges, and blurred boundaries that were present in previous extraction methods.


