Article

Biomass Estimation of Apple and Citrus Trees Using Terrestrial Laser Scanning and Drone-Mounted RGB Sensor

1
Department of Forest Resources, Kookmin University, Seoul 02707, Republic of Korea
2
Forest Carbon Graduate School, Kookmin University, 77 Jeongneungro, Seongbukgu, Seoul 02707, Republic of Korea
3
Department of Climate Technology Convergence (Biodiversity and Ecosystem Functioning Major), Kookmin University, 77 Jeongneungro, Seongbukgu, Seoul 02707, Republic of Korea
4
Fruit Research Division, National Institute of Horticultural & Herbal Science, Wanju 55365, Republic of Korea
5
Citrus Research Institute, National Institute of Horticultural & Herbal Science, Jeju 63607, Republic of Korea
6
Department of Forestry, Environment, and Systems, Kookmin University, 77 Jeongneungro, Seongbukgu, Seoul 02707, Republic of Korea
*
Author to whom correspondence should be addressed.
Remote Sens. 2025, 17(15), 2554; https://doi.org/10.3390/rs17152554
Submission received: 2 June 2025 / Revised: 19 July 2025 / Accepted: 21 July 2025 / Published: 23 July 2025
(This article belongs to the Special Issue Biomass Remote Sensing in Forest Landscapes II)

Abstract

Developing accurate activity data on tree biomass using remote sensing tools such as LiDAR and drone-mounted sensors is essential for improving carbon accounting in the agricultural sector. However, direct biomass measurements of perennial fruit trees remain limited, especially for validating remote sensing estimates. This study evaluates the potential of terrestrial laser scanning (TLS) and drone-mounted RGB sensors (Drone_RGB) for estimating biomass in two major perennial crops in South Korea: apple (‘Fuji’/M.9) and citrus (‘Miyagawa-wase’). Trees of different ages were destructively sampled for biomass measurement, while volume, height, and crown area data were collected via TLS and Drone_RGB. Regression analyses were performed, and the model accuracy was assessed using R2, RMSE, and bias. The TLS-derived volume showed strong predictive power for biomass (R2 = 0.704 for apple, 0.865 for citrus), while the crown area obtained using both sensors showed poor fit (R2 ≤ 0.7). Aboveground biomass was reasonably estimated (R2 = 0.725–0.865), but belowground biomass showed very low predictability (R2 < 0.02). Although limited in scale, this study provides empirical evidence to support the development of remote sensing-based biomass estimation methods and may contribute to improving national greenhouse gas inventories by refining emission/removal factors for perennial fruit crops.

1. Introduction

As the global climate crisis becomes increasingly severe, the IPCC underscores the urgency of addressing the accelerating and intensifying impacts of human-induced climate change and calls for concerted global efforts to mitigate climate change and global warming [1]. One of these efforts is to emphasize the importance of land management through land reports, such as reducing land use change and degradation resulting from land use behavior that leads to greenhouse gas emissions [2]. Agriculture, Forestry and Other Land Use (AFOLU) is a major source of greenhouse gas emissions (e.g., CO2, CH4, N2O). According to the special report on ‘Climate Change and Land’ published by the IPCC in 2019, while land is a critical foundation for providing food and water, agriculture, forestry, and other land use and conversion types account for 23% of greenhouse gas emissions from human activities (2007–2016) [1]. This suggests the importance of understanding sustainable land management and carbon dynamics in relation to land use.
The National Inventory Report (NIR) emphasizes the importance of land use and land use change and forestry (LULUCF) as a carbon sink [3]. Forests are the only land type that is recognized as a carbon sink among all land use types (e.g., agricultural land, wetlands), and thus unlike for trees in forests in most countries, carbon sequestration coefficients for agricultural crops have not been calculated, so they are still recognized as a source of emissions [4,5,6]. However, many countries are conducting research to estimate the amount of carbon absorbed from agricultural land to enhance the completeness and transparency of national greenhouse gas statistics. In Italy, the biomass of fruit trees was measured by digging individual trees in apple, citrus, grape, olive and peach orchards to estimate carbon sequestration in the agricultural sector [7]. In addition, in the Cachar district of Assam, northeastern India, biomass equations for rubber and tea trees, which are representative agricultural woody plants, were developed and carbon emission and removal were estimated [8,9]. In South Korea, the fresh and dry weight and carbon content by diameter of apple trees were measured, and an aboveground biomass equation was developed for five-year-old apple varieties [10,11]. In addition, a study was conducted to explore appropriate methodologies for estimating greenhouse gas emissions and removals from the biomass of perennial woody fruit crops in Korea, with the aim of incorporating them into the national greenhouse gas inventory [12]. Many nations still lack sufficient data on agricultural activity and systematic methodologies. This gap hinders the accurate estimation of global greenhouse gas (GHG) emissions and removals, making it challenging to develop effective international mitigation strategies. Moreover, the absence of comprehensive data from the agricultural sector limits the transparency and completeness of national GHG inventories, especially within the LULUCF sector [13]. In response to these limitations, remote sensing technologies are increasingly recognized as essential tools for acquiring biophysical information over large areas in a rapid, accurate, and non-destructive manner [14,15]. In the context of agricultural carbon inventories, these technologies offer a promising alternative to conventional field-based approaches, which are often labor-intensive, time-consuming, and destructive. If carbon stock estimation in orchard systems can be achieved without physically damaging or removing trees, remote sensing would serve a clearly defined and valuable role in supporting climate change mitigation efforts through enhanced GHG monitoring and reporting. Despite this potential, the application of remote sensing in developing spatially explicit activity data for perennial fruit crops remains underexplored. Therefore, this study seeks to clarify and emphasize the contribution of remote sensing in enabling scalable, transparent, and non-destructive carbon accounting in the land use sector.
The LULUCF emission and removal calculation methodology is defined as Tier 1, 2, or 3 depending on the application of emission factors and activity data. Tier 1 uses default emission factors and the IPCC’s global or regional activity data, making it the most straightforward approach, but it is limited in accuracy. Tier 2 applies country-specific emission factors and more detailed national activity data, improving accuracy compared with Tier 1. Similarly to Tier 2, Tier 3 develops and utilizes country-specific emission factors, but requires activity data to be constructed with a more detailed and clear spatial resolution. In other words, this stage can be applied when detailed assessment data on land use patterns are constructed based on field surveys and/or remote sensing [2]. LiDAR (Light Detection and Ranging) and drone-mounted (unmanned aerial vehicle, UAV) sensors, along with satellites, are the types of remote sensing equipment most commonly used for building precise activity data on carbon sequestration [2]. LiDAR is a remote sensing technology that works by emitting laser pulses and measuring the time it takes for those pulses to hit an object and then reflect back [16]. Datasets built using LiDAR are point cloud data representing the 3D structure of the scanned environment. LiDAR has recently been used in the forestry and agricultural fields to evaluate and analyze plant structural traits such as tree height, spacing, volume, and canopy structure; estimate biomass; and even detect diseases [17,18,19]. Aerial photography is increasingly being used to manage canopy coverage and spacing in forests and agricultural areas. It also has the advantage of a higher resolution than satellite photography and the ability to cover large areas (e.g., 1000 ha or more) with a single flight [20]. However, it is expensive and resource-intensive, because it relies on expensive aircrafts for surveying. To address this limitation, unmanned aerial vehicle (drone)-based RGB imagery, which represents a form of low-altitude aerial photography, has been increasingly adopted as a cost-effective and flexible alternative for collecting high-resolution spatial data over relatively small areas [18,21].
Recent advances in precision agriculture have led to increased use of terrestrial laser scanning (hereafter referred to as ‘TLS’) and drone-mounted RGB sensors (hereafter referred to as ‘Drone_RGB’) for analyzing the structural traits of fruit trees and estimating their biomass. For example, in vineyards, TLS and various drone sensors have been compared to estimate crown parameters such as height, projected area, and volume, with TLS showing the highest accuracy and Drone_RGB and multispectral sensors also demonstrating meaningful correlations [22]. In addition, studies on apple orchards have used drone- mounted RGB point clouds to identify fruit positions and automatically estimate yields [23]. However, most previous studies have focused solely on estimating aboveground biomass (AGB) based on morphological traits. It is important to note that traditional forestry-based allometric models, which rely on variables such as DBH (diameter of breast height) and tree height, may not be appropriate for orchard systems. This is due to irregular pruning practices and cultivation-specific growth patterns, which can cause significant over- or underestimation of carbon inventories when applying DBH-based estimation formulas. During the course of this study, we visited numerous orchards across South Korea and found that only a limited number followed standardized management practices that align with IPCC sampling standards. Therefore, there is a clear need to explore alternative modeling approaches that reflect the structural heterogeneity of fruit trees and can be reliably integrated into national GHG inventory systems. Consequently, attempts to assess total tree biomass—including AGB and belowground biomass (BGB)—through direct destructive sampling have been limited. While some studies have estimated the biomass of crops such as corn or the branches of apple trees through direct destructive sampling to predict yields, these approaches typically involve partial measurements or short time frames and, therefore, lack the representativeness required for the development of national greenhouse gas inventory coefficients [24,25]. Moreover, studies on perennial fruit trees that combine rigorous sampling protocols with remote sensing validation are still rare. Therefore, this study was conducted to overcome these limitations, support the development of national emission and removal coefficients for major agricultural land categories, and evaluate the suitability of TLS and Drone_RGB for estimating agricultural carbon inventories. To achieve these objectives, we selected samples of apple (‘Fuji’/M.9) and citrus (‘Miyagawa-wase’) trees—two major perennial woody crops in South Korea—and measured their biomass through destructive sampling. In addition, we plan to evaluate the feasibility of estimating the dry weight of each species based on structural traits such as volume, height, and crown area derived from TLS and Drone_RGB observations (Figure 1).

2. Materials and Methods

2.1. Site Selection and Sampling of Individual Trees of Apple and Citrus

For this study, we first selected the main cultivation areas of apples (Malus domestica Borkh.) and citrus (Citrus unshiu Marc.), which are major perennial woody crops in South Korea (Table 1 and Figure S1). The apple tree surveyed in this study was the ‘Fuji’/M.9 variety, which is a cultivar commonly cultivated in South Korea in the long ‘slender spindle form’ dense planting method (planting density: 1000 trees/ha; planting spacing: 3.5–5.0 m × 1.5–2.5 m) [26]. A total of 15 samples between the ages of 4 and 14 were selected, and sample collection and measurements were performed in 5 districts in the Gyeongsang-do region of South Korea—Yeongyang, Yeongju, Uiseong, Cheongsong, and Miryang—which is a major apple production area and also the region where the largest number of apple trees are grown in South Korea. The citrus tree surveyed in this study was the ‘Miyagawa-wase’ satsuma mandarin variety, cultivated using the ‘open center natural form’ single-crop cultivation method (planting density: 750 trees/ha; planting spacing: 2.5–4.0 m × 1.5–3.0 m). A total of 21 samples aged between 10 and 40 years were selected, and sample collection and measurements were performed at two cities Jeju Special Self-Governing Province—Jeju and Seogwipo [27]. The districts of this province are the major citrus production areas and also the regions where the largest number of citrus trees are grown in South Korea.
In order to select individual trees of each fruit species, an orchard suitable for each diameter grade and tree age was selected. Following this, the survey area was set according to the scion diameter grade of the fruit tree, 2–3 sampling plots (e.g., 20 m × 20 m or 10 m × 40 m) were installed in each survey area, and 3–4 standard fruit trees were randomly selected per sampling plot. At this time, trees with a general tree shape were selected, and individuals requiring a large amount of pruning, such as cutting off the main trunk, or with poor vitality were not selected [28].

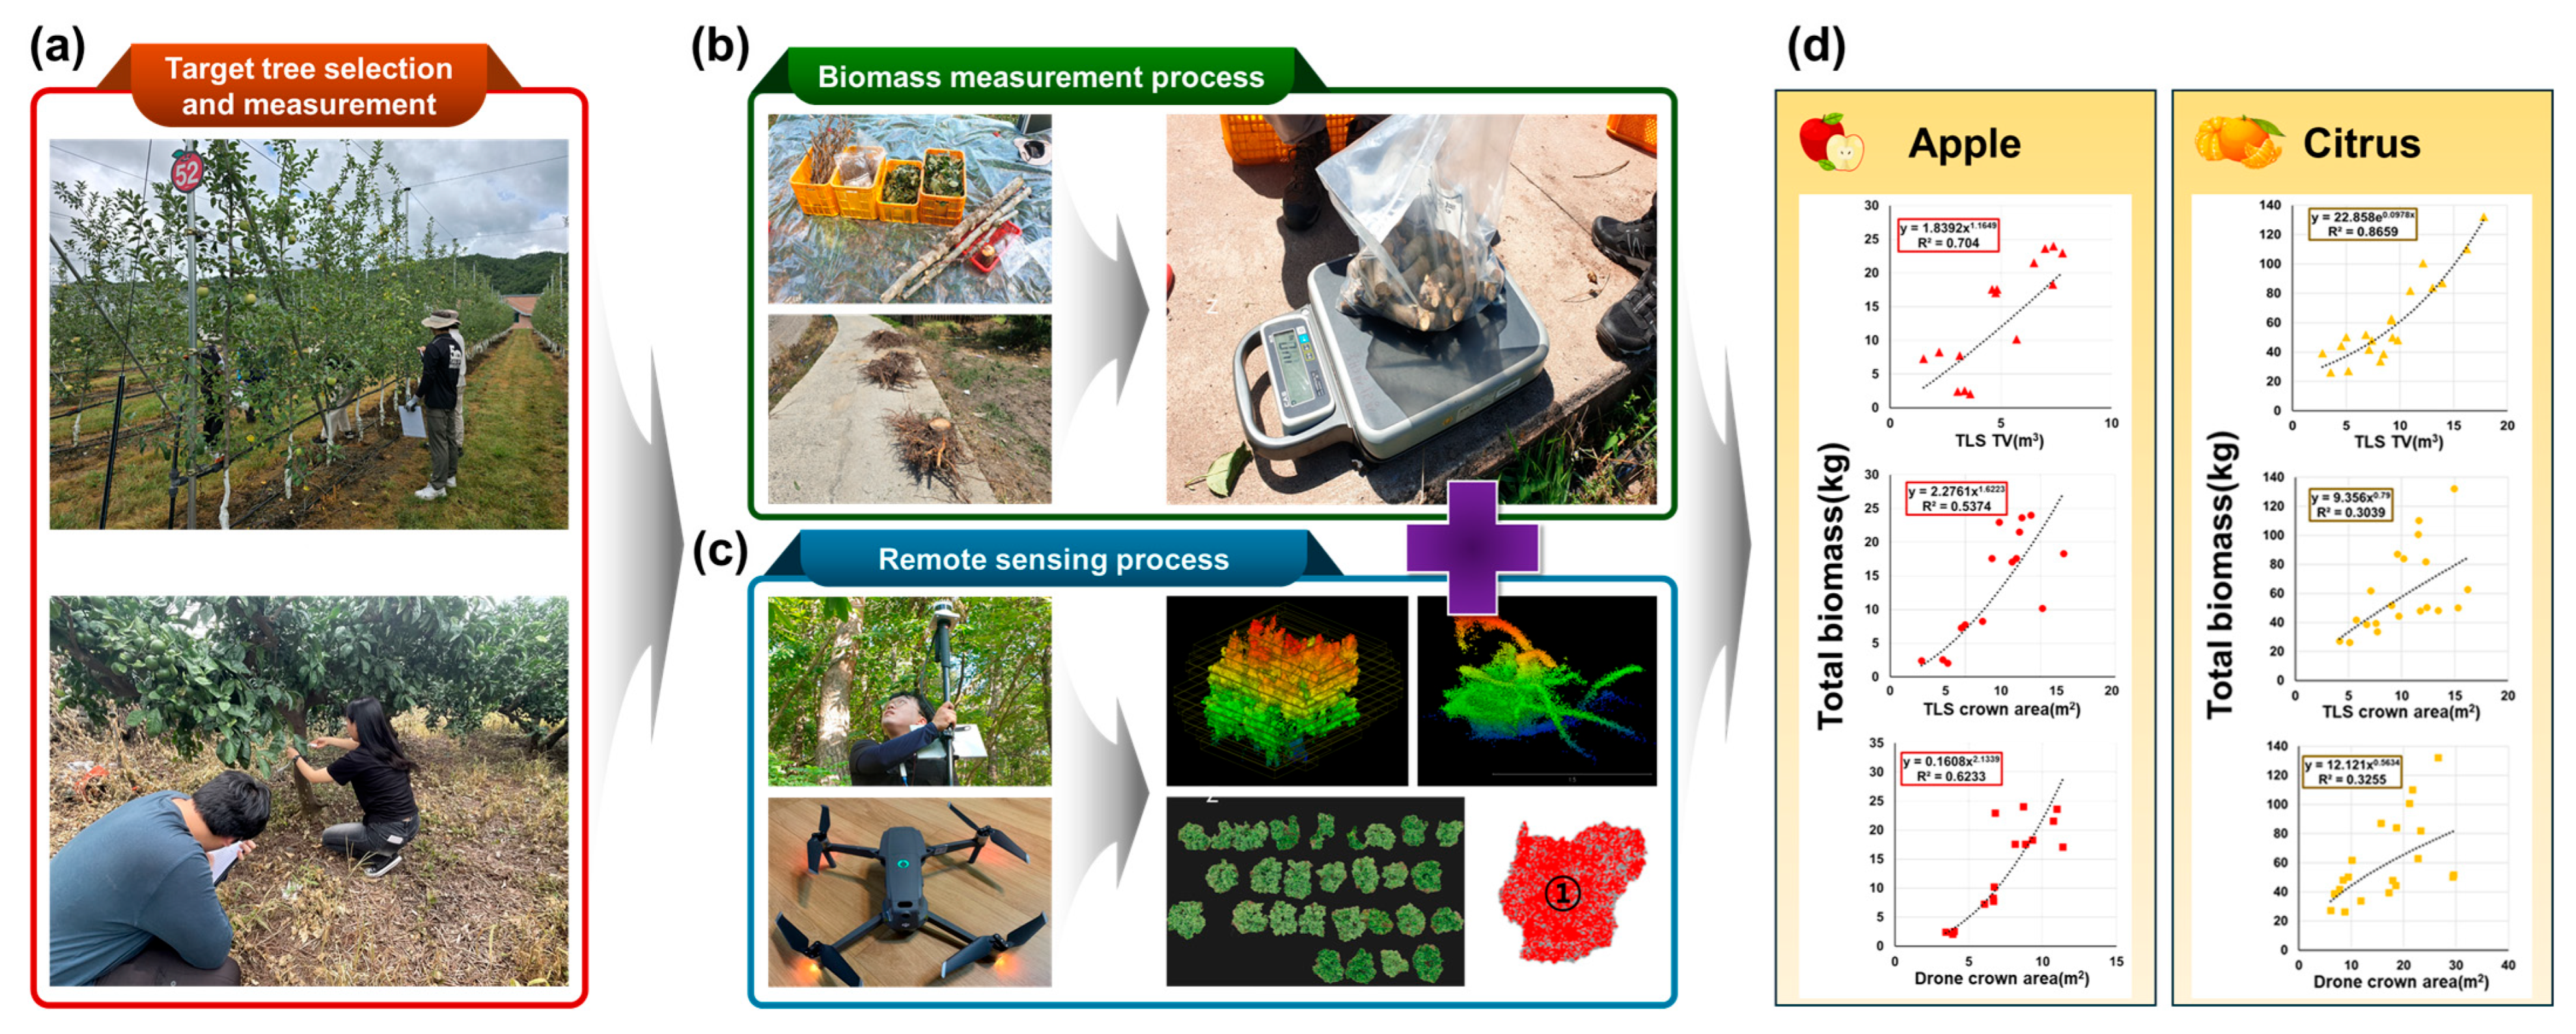
2.2. Sampling and Biomass Measurement

We followed the standardized methodology outlined in the Standard Guidelines for the Assessment of Fruit Tree Biomass (2024) and the quality assurance procedures recommended by the IPCC [29]. Following these protocols, we excavated 3–4 representative trees per 5-year age class from orchards employing typical cultivation practices. This ensures the applicability of biomass equations across diverse growth stages and management conditions. Sampling was conducted during the peak growth period (July–August 2023–2024), immediately preceding fruiting. All procedures and selection criteria were reviewed through quality assurance (QA) and quality control (QC) systems established by the Greenhouse Gas Inventory and Research Center of South Korea. Experts from the National Institute of Horticultural & Herbal Science and the National Institute of Forest Science—also listed on the UNFCCC/IPCC expert rosters—participated in this verification. Only samples meeting institutional representativeness standards were used for analysis. Selected trees were felled, and all components of aboveground biomass (AGB) and belowground biomass (BGB) were separated into main stem, main branches, secondary branches, side branches, leaves, and roots. Fresh weights were measured using a 50 kg electronic scale. Roots (≥2.5 mm diameter) were excavated within a 1 m radius and 1 m depth using shovels and an excavator. Root samples were washed and air-dried to remove soil residue. For each component, three subsamples (0.15–0.30 kg) were placed in plastic bags, weighed with a 5 kg scale, and stored to prevent moisture loss before lab transfer. In the lab, subsamples were oven-dried (85 °C for AGB; 105 °C for roots) for ~10 days until constant weight. Dry-to-fresh weight ratios were calculated for each component and applied to total fresh weights to estimate dry biomass. AGB was calculated by summing the dry weights of all aboveground components, and BGB was estimated using the dry root mass. Total biomass (TB) was derived by summing AGB and BGB (Table 2).

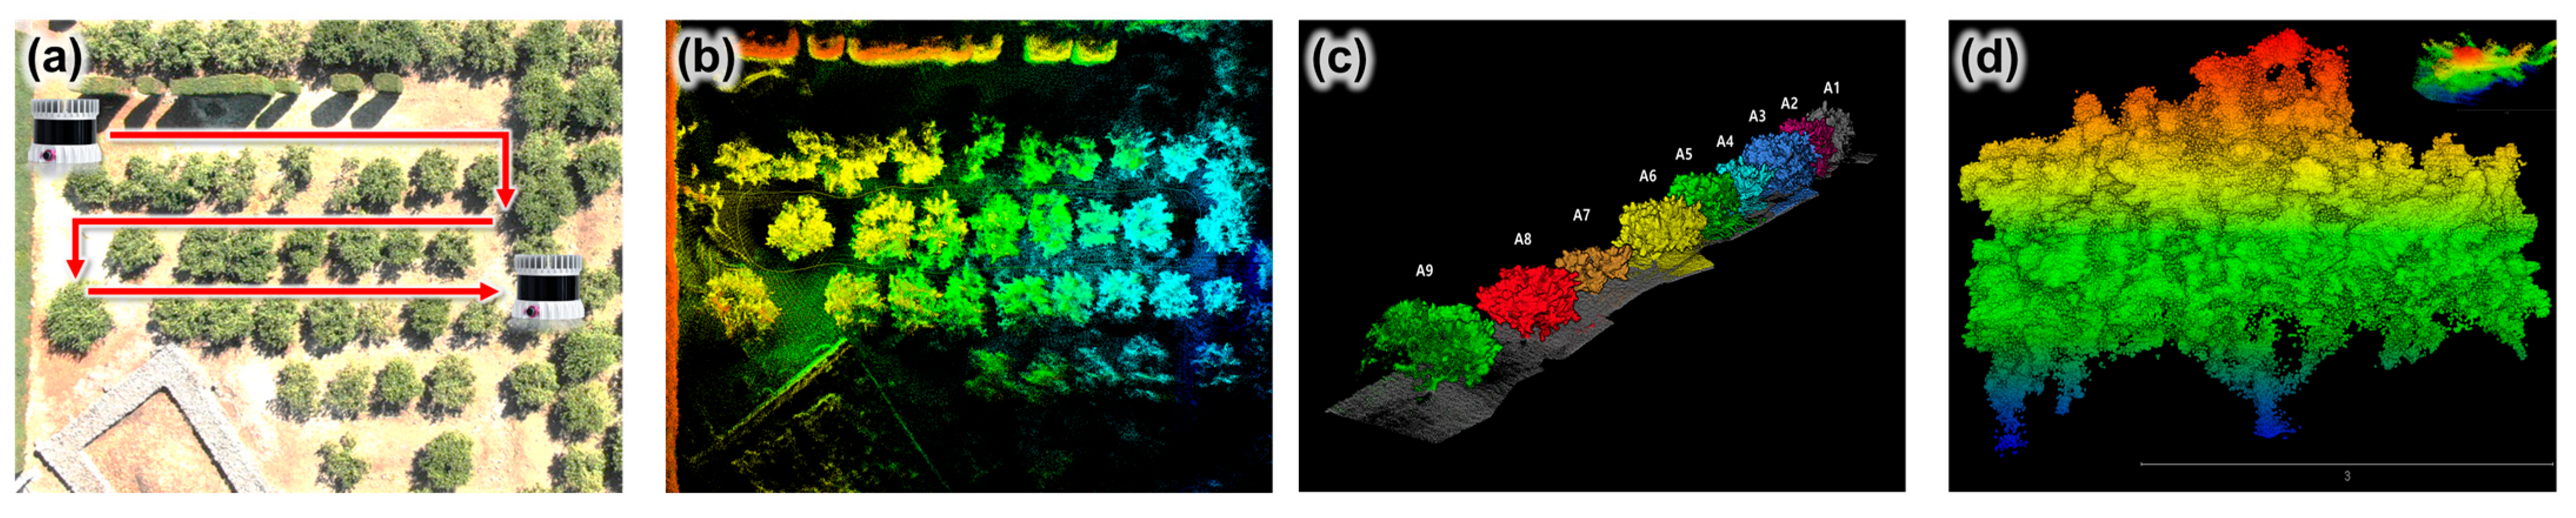
2.3. TLS and Drone_RGB Scanning and Data Preprocessing

2.3.1. TLS Data Acquisition and Preprocessing

TLS and drone-based RGB scanning were conducted to measure aboveground volume and crown area prior to tree excavation. TLS was also used to scan the excavated root systems (belowground biomass). To preserve root structure, each root sample was inverted so that the stump rested on flat ground, preventing compression of the 3D root distribution [30]. Three-dimensional point cloud data were collected using the Ouster OS1-64 sensor (Ouster, San Francisco, CA, USA) a mobile TLS unit with a 120 m range, 360° horizontal and 45° vertical field of view, and up to 2,621,440 points/sec across 64 channels. Each tree was scanned three times, and the resulting data were stored as BAG files via the Robot Operating System (ROS). Using ROS topics ‘ouster/points’ (3D point cloud) and ‘ouster/imu’ (inertial data), high-resolution 3D models were reconstructed with KUDAN’s SDK, which incorporates Google Cartographer and OpenSLAM Gmapping algorithms [31,32,33,34]. The resulting point clouds were denoised and deduplicated using CloudCompare (Daniel Girardeau-Montaut, Telecom ParisTech & EDF R&D, Nice, France) and saved in PLY format [28]. The cleaned TLS data were processed using LiDAR360 v8 (GreenValley International, Berkeley, CA, USA), a software commonly used for forest and tree analysis. Point clouds were classified into terrain cloud (TC, ground surface) and vegetation cloud (VC, aboveground structure). VC was normalized by subtracting TC Z-values to yield a point cloud representing true heights above ground level. This normalization enabled the accurate identification of individual trees and the extraction of parameters. Individual trees or roots were automatically segmented using the ‘Point Cloud Segmentation’ function. Each was assigned a unique ID and spatial coordinates. Structural traits, including crown/root volume (TLSvolume, m3) and crown area (TLScrown_area, m2), were extracted with the ‘Standing Tree Volume Analysis’ function based on the reconstructed 3D models (Figure 2).
Individual tree segmentation and structural trait extraction were conducted using the “Point Cloud Segmentation” function in the TLS Forestry module of LiDAR360. This algorithm, based on the method by [32], selects the highest point as a seed and classifies surrounding points into individual trees based on relative elevation and horizontal distance. Segmentation was controlled by a critical spacing parameter, which approximated the average crown radius, and was iteratively adjusted to minimize over- or under-segmentation. The normalized point cloud was used as input for segmentation and subsequent parameter extraction. The following parameters were applied: grid size, minimum tree height, minimum height above ground, Gaussian smoothing sigma, and smoothing window radius. Gaussian filtering was applied to reduce noise and refine crown boundary detection. The smoothing intensity was adjusted using the sigma value: higher values produced smoother results, but with a risk of overgeneralized segmentation. The output was exported in CSV format, containing key per-tree attributes including TreeID, TreeLocationX/Y, TreeHeight (m), CrownDiameter (m), CrownArea (m2), and CrownVolume (m3). Total tree volume was calculated by summing trunk and crown volumes, which were estimated separately to avoid overlap. Trunk volume was measured from ground level to the crown base (the lowest point of major branching), and crown volume from the crown base to the treetop. Trunk volume was extracted using the “Standing Tree Volume Analysis” function, and crown volume using the “Point Cloud Segmentation” function in the TLS Forestry module of LiDAR360.

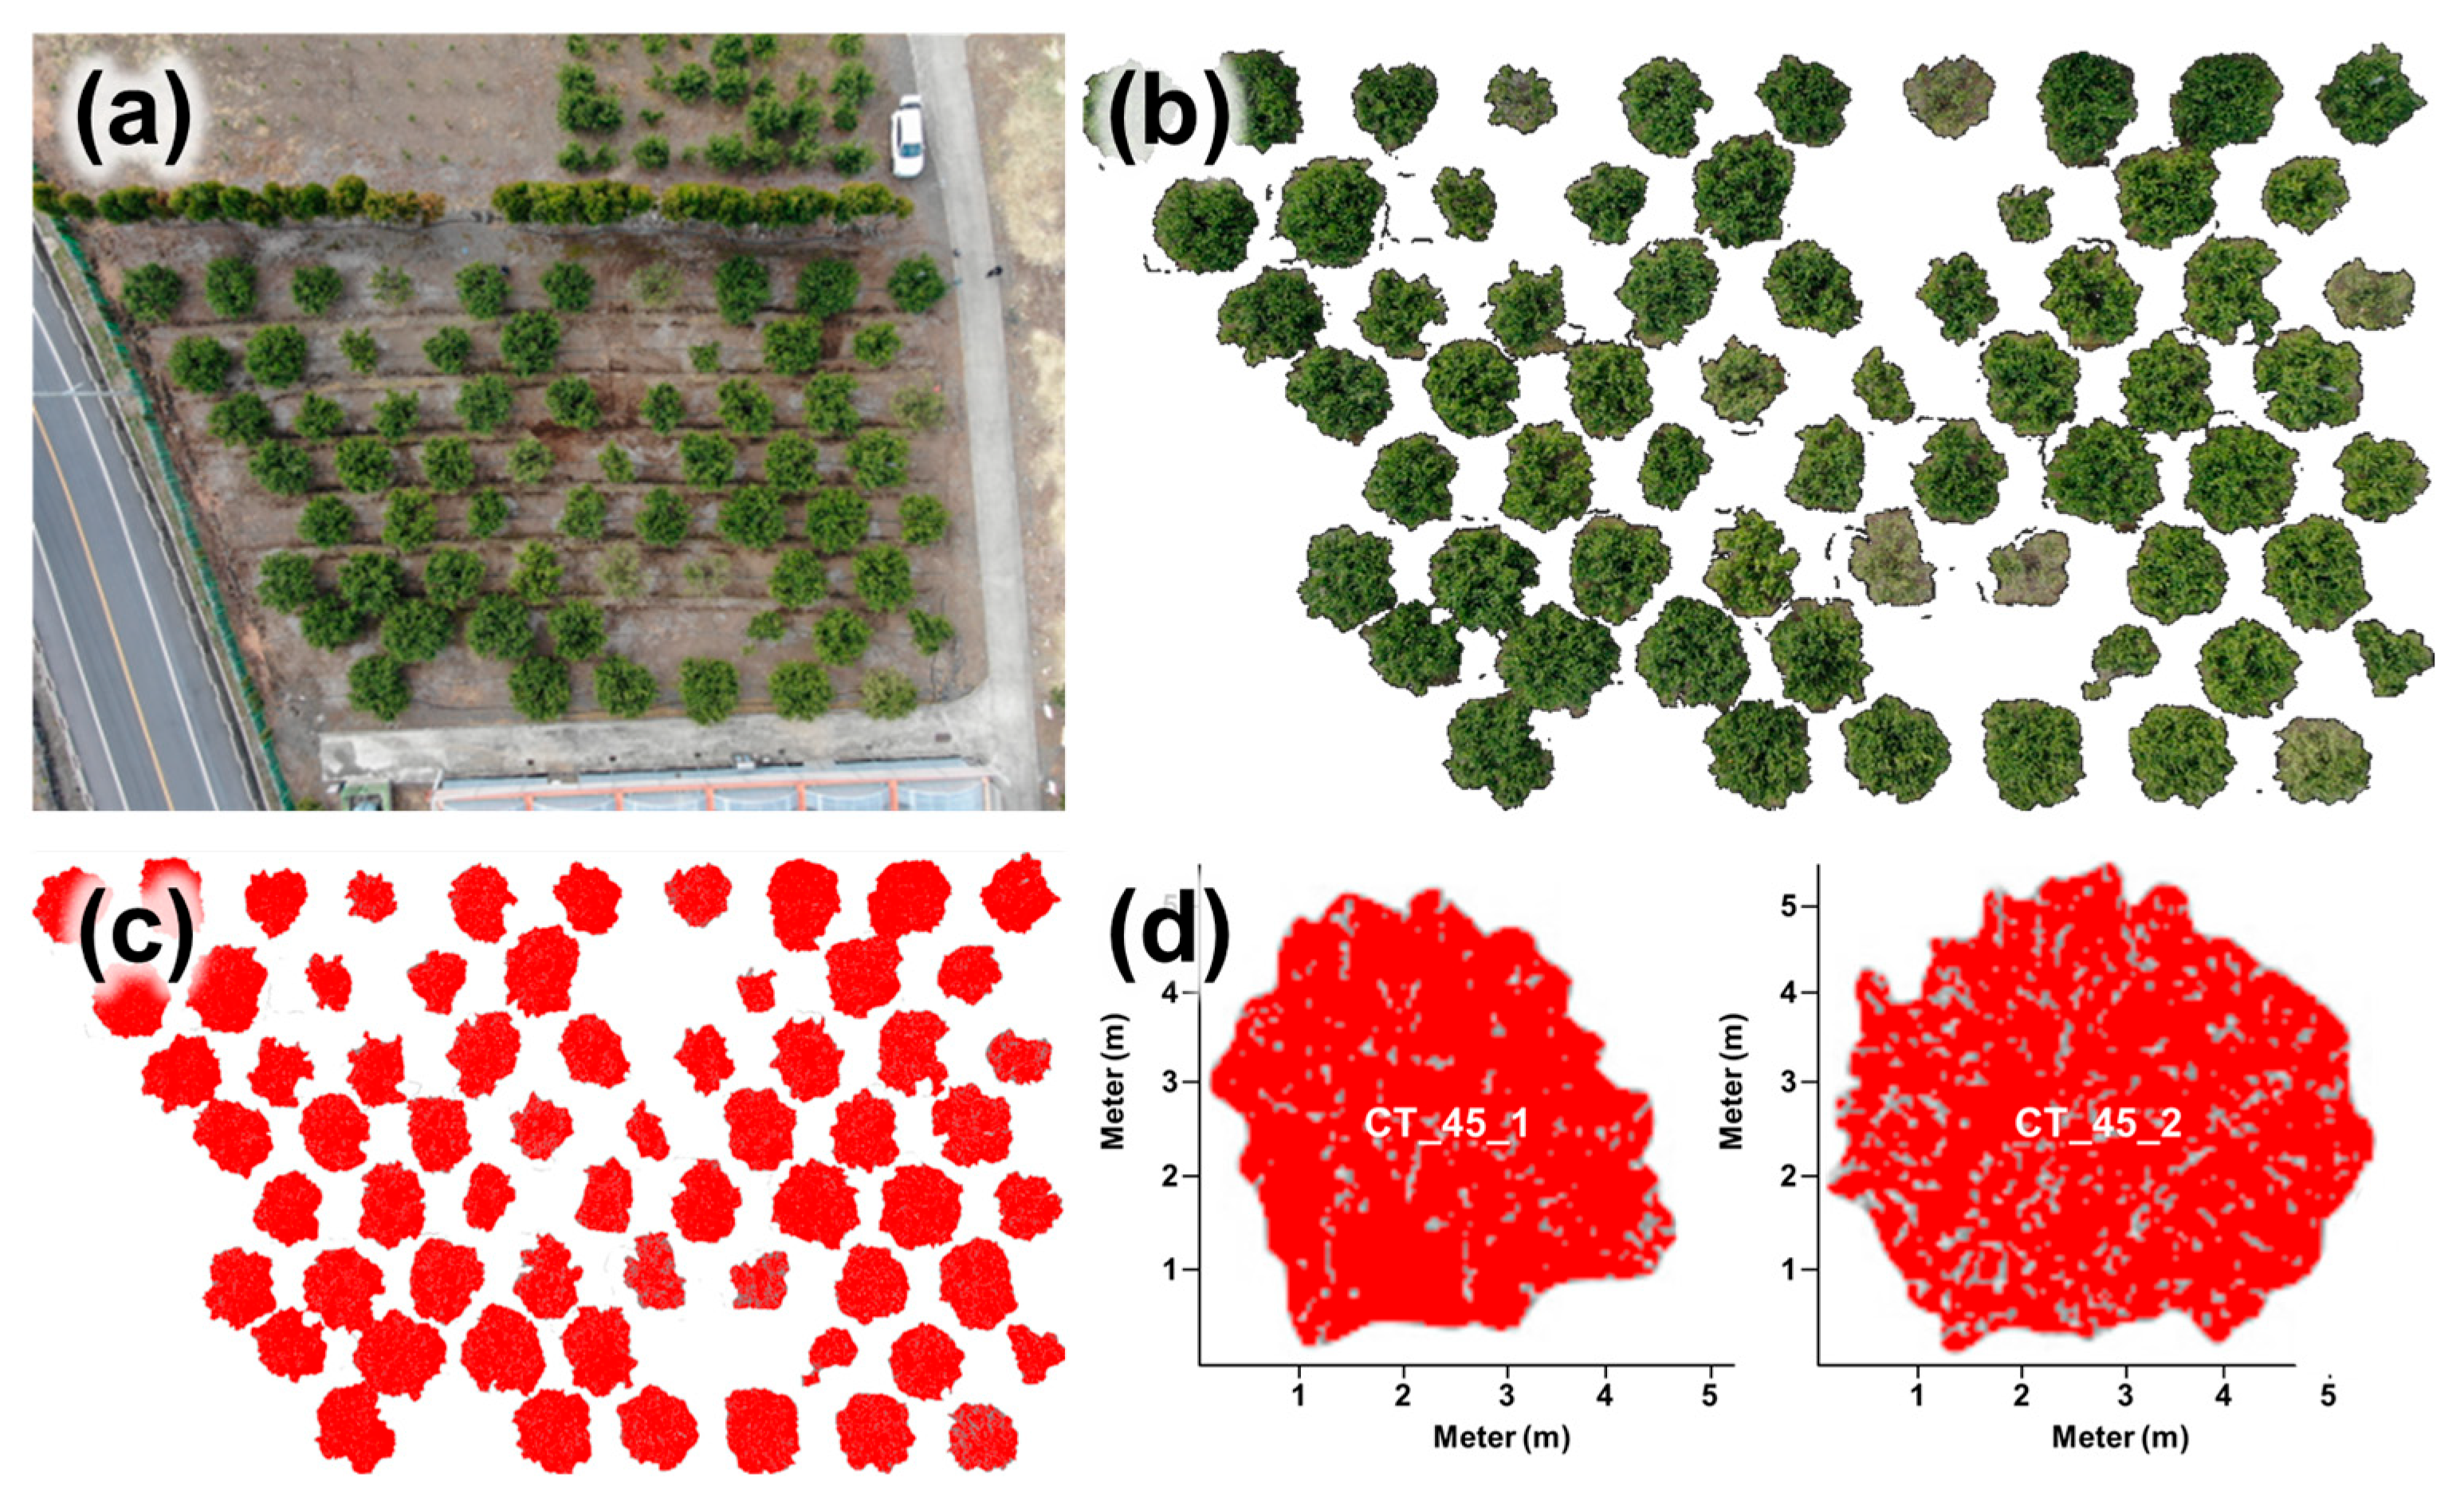
2.3.2. Drone_RGB Data Acquisition and Processing

In this study, the tree crown area was measured after collecting aerial photographs using a DJI MAVIC2 PRO Drone (DJI, Shenzhen, China). The shooting time was set between 12:00 and 13:00 to minimize the influence of direct sunlight, and RGB photos were taken at a standard shooting altitude of 50 m for all standard trees. After Drone_RGB photography, the captured images were processed using ArcGIS10.5 (Esri, Redlands, CA, USA) and ImageJ (National Institutes of Health, Bethesda, MD, USA) programs to measure the tree crown area [35]. The ImageJ2.14 software provides advanced analysis tools such as cell area, particle size, and distance measurement, and enables precise measurement and automated data processing at the pixel level in JPEG, PNG, TIFF, and BMP formats [36]. We used the Tree Segmentation tool in ArcGIS Pro to segment and label individual orchard trees. To improve accuracy, particularly in areas with crown overlap or segmentation artifacts, the initial results were further refined through manual digitization, based on visual interpretation of high-resolution RGB imagery. This semi-automated approach enabled efficient delineation of crown boundaries while ensuring precision in cases of overlapping or irregularly shaped crowns. Subsequently, ImageJ was used to calculate the cell-level crown area (Dronecrown_area; m2) from the captured images (Figure 3).

2.4. Model Development and Model Validation

To develop predictive models for AGB, BGB, and TB, various tree structural parameters, including volume and crown area, were tested as independent variables. The best-fit models exhibited an exponential form based on the observed relationships. To assess the models’ predictive performance and generalizability, Leave-One-Out Cross-Validation (LOOCV) was employed. In this approach, each sample is used once as a validation set while the model is trained on all remaining samples. This process is repeated for every observation, making LOOCV especially suitable for small datasets, as it maximizes training data and enhances model robustness.
The accuracy of the model was evaluated by analyzing statistical indicators such as R2, RMSE, RMSE%, bias, and bias%. The R2 value ranged from 0 to 1, with a higher value indicating a stronger explanatory power between the dependent and independent variables [37]. RMSE measures the accuracy of an estimate by evaluating the difference between the observed and predicted values, while bias assesses the degree of overestimation or underestimation compared with the actual measurements [38]. These metrics are commonly used to evaluate the difference between an estimate and a measured value, with values closer to 0 indicating higher data quality. The detailed equations related to these are presented below.
R 2 = 1 ( x l f l ) 2 ( x l x ¯ l ) 2
B i a s = l = 1 n ( x l f l ) n
B i a s % = B i a s x ¯ l × 100 %
R M S E = 1 n l = 1 n ( x l f l ) 2
R M S E % = R M S E x ¯ l × 100 %
where xl, fl, and x ¯ l represent the measurement values (i.e., TLS and Drone_RGB measurements), the reference value (i.e., biomass measurements), and the mean of the reference value, respectively. n is the number of trees. All statistical analyses were performed using the nlme [39] and Metrics [40] packages in R version 4.3.3.

3. Results

3.1. Data Collection Results by Tree Age

Descriptive statistics of destructively measured AGB and BGB, as well as TLS- and Drone_RGB-derived structural parameters for both apple and citrus trees, are summarized in Table 2 and Table 3. These results highlight the wide variability in tree structure and biomass within both species, which emphasizes the importance of accurate and scalable measurement methods. Notably, the crown area derived from drone RGB imagery tended to be larger than that obtained from TLS, indicating potential overestimation. This discrepancy may result from the top-down perspective and limited vertical structural information in RGB images, which can lead to blurred canopy boundaries, especially in dense or overlapping canopies.
The analysis of the relationship between tree age and dependent variables (i.e., above- and belowground volumes measured with TLS, and crown area measured with TLS and Drone_RGB, AGB, and BGB) showed a strong positive correlation (r ≥ 0.7) in all measured variables except for the belowground volume measured using TLS and crown area measured with Drone_RGB, depending on the age of the apple and citrus trees (Figures S2 and S3). This means that most measured variables significantly increased as tree age increased. Detailed field survey data for each fruit species and dry weight data by part for biomass measurement are detailed in Supplementary Materials (Tables S1 and S2).

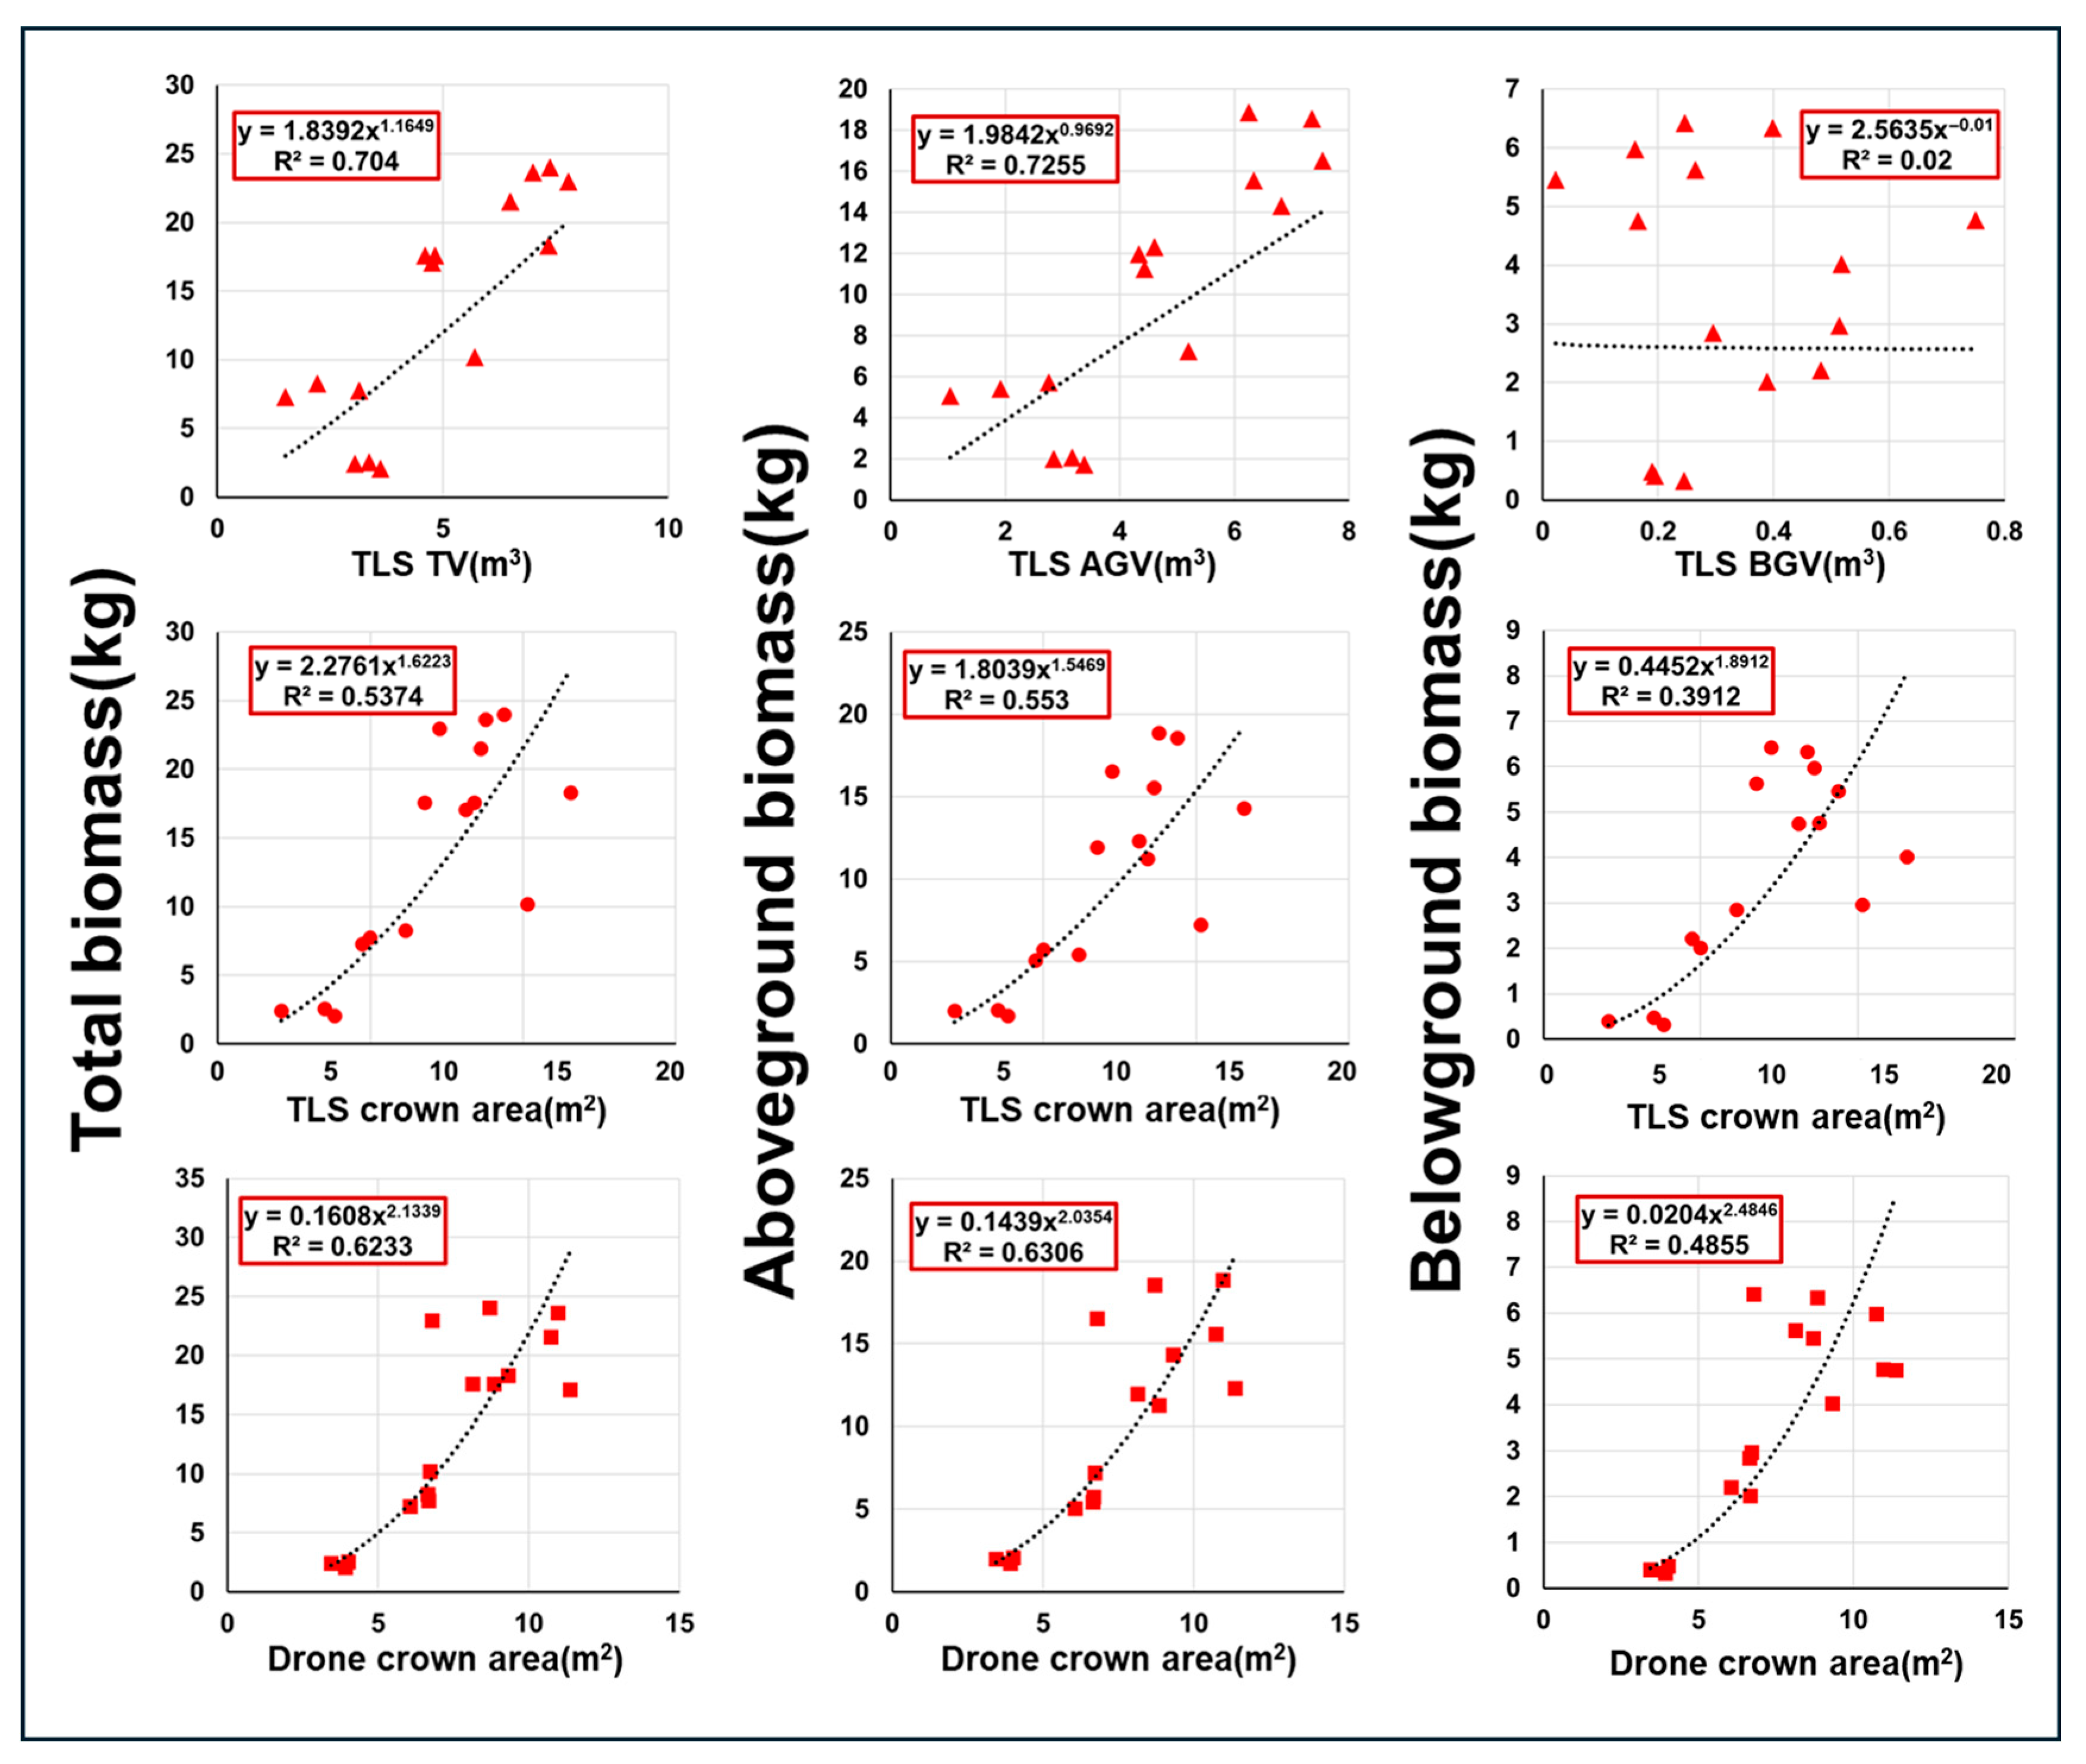
3.2. Evaluation of Fruit Tree Biomass Using TLS and Drone_RGB Data

As a result of this study, equation models were developed to estimate AGB, BGB, and TB of apple and citrus trees using remote sensing equipment (Table 4 and Figure 4 and Figure 5).
In addition, statistical metrics for evaluating these models were derived (Table 5). Based on these results, TLSvolume showed the best performance among all biomass components for apple trees. For TB, the TLSvolume model achieved the highest R2 (0.70) and the lowest RMSE (0.45, 4.02%), indicating a stronger predictive capability compared to TLScrown_area (R2 = 0.54) and Dronecrown_area (R2 = 0.62). A similar trend was observed for AGB, with TLSvolume yielding R2 = 0.73 and RMSE = 0.52 (5.28%). In contrast, for BGB, the predictive performance of TLSvolume dropped drastically (R2 = 0.02), while Drone-derived crown area performed relatively better (R2 = 0.49, RMSE = 0.62, bias = −5.38%). This suggests that BGB is less strongly correlated with TLS-derived volume due to the inherent limitations of TLS in capturing belowground structures. A large proportion of missing or unreliable BGB data in the TLS-derived variables may also have contributed to this weaker relationship.
For citrus trees, TLSvolume showed the highest predictive performance for total TB and AGB, with R2 values of 0.87 for both. In contrast, TLScrown_area and Dronecrown_area yielded much lower R2 values (0.30–0.32), indicating that crown area alone whether derived from TLS or Drone_RGB was a weaker predictor of total and aboveground biomass. TLSvolume also produced the lowest RMSE (4.25 for TB and 4.43 for AGB), and the smallest bias, demonstrating both higher accuracy and lower systematic error. This may be attributed to the fact that TLSvolume captures detailed 3D structural attributes, including trunk and canopy depth, which are more closely related to overall biomass. In contrast, Dronecrown_area exhibited a substantial positive bias in TB (+24.08%), suggesting that crown size was likely overestimated in RGB imagery, possibly due to the projection of outermost foliage without accounting for depth. Like the apple tree, BGB and TLSvolume showed almost no correlation (R2 = 0.01), and had the highest RMSE (14.97) and bias (−35.23%). This suggests that belowground biomass is not well captured by aboveground structural parameters obtained from TLS, likely due to occlusion near the base and the inability of TLS to observe belowground traits.
Leave-One-Out Cross-Validation was employed to evaluate the generalization performance of the developed models (Table 6) [41]. The results are presented for the AGB, BGB, and total biomass data measurements of each fruit species, as well as the volume and crown area measured using TLS and Drone_RGB equipment. In the generalized models based on cross-validation, the overall predictive performance showed a decreasing trend compared to the full-data regression models. While the coefficient of determination (R2) values was consistently lower across all biomass types (AGB, BGB, and TB), the relative performance pattern among predictors remained similar. In particular, TLSvolume consistently outperformed crown area-based predictors on both TLS- and drone-derived data for both apple and citrus trees. This suggests that the relative importance of structural variables in predicting biomass remains consistent. Still, the overall predictive performance decreases when the sample size is limited, or the model is subjected to stricter validation criteria. Notably, the models for BGB continued to show weak predictive capacity across all variables, reflecting the inherent limitations of non-invasive measurements in estimating root biomass. Given the consistently low predictive accuracy of BGB models, BGB may be more effectively estimated indirectly from AGB using specific allometric relationships. Although the results of the generalized model from this analysis confirm the structural validity of the predicted relationships, the overall decrease in explanatory power appears to be due to the limited sample size.

4. Discussion

TLS and Drone_RGB managements methods have recently been in the spotlight for their ability to obtain precise data in the agriculture and forestry fields in a non-destructive manner [42,43,44,45,46]. This study evaluated the possibility of estimating the above- and belowground carbon inventory of apples and citrus in South Korea using remote sensing equipment such as TLS and Drone_RGB. Beyond model evaluation, these findings provide a foundation for applying the developed models in practical scenarios. Structural parameters acquired via TLS and drone-based imaging can be used to estimate tree-level biomass, which can then be aggregated to the plot or orchard level. In practice, remote sensing surveys can be conducted across orchard plots (e.g., 20 × 20 m or 10 × 40 m, as in this study), and individual trees segmented using software such as LiDAR360. Extracted variables (e.g., TLSvolume) can be input into the developed models to estimate AGB, BGB, or TB for each tree. Summing individual tree estimates enables calculation of total plot biomass, which can be converted to biomass density (e.g., Mg/ha). At larger scales, when spatial data on species and age class are available, these models can be applied to regional or national inventories. This framework enables diverse applications, including precision agriculture, yield estimation, and carbon accounting. Furthermore, the integration of empirically validated remote sensing models with geospatial data supports IPCC Tier 3 reporting standards, contributing to more accurate, country-specific greenhouse gas inventories.
To lay the foundation for such an approach, this study first compared tree age, structural variables measured using remote sensing and destructively obtained biomass data (AGB and BGB). As a result, most measured variables, except for the belowground volume measured using TLS significantly, increased with tree age. The high correlation between measured data and age indicates that the fruit tree samples used in this study accurately reflect the tendency of actual growth and biomass to increase systematically with age. This suggests that the sample selection provides a suitable range of growth stage characteristics and is based on a reliable dataset for evaluating the relationship between structural indices and biomass. However, the belowground volume estimated using TLS showed a low correlation with age. This suggests that this index has inherent limitations in capturing cumulative structural development, which explains why it has relatively low explanatory power in biomass estimation models [45].
Furthermore, we compared the predictability of AGB and BGB using remote sensing equipment. In evaluating the potential of estimating AGB and BGB using TLSvolume, the results showed high explanatory power and model performance in estimating AGB for apples and citrus. On the other hand, the results indicated that TLSvolume was not appropriate for estimating the BGB of apple and citrus. The results of TLScrown_area and Dronecrown_area also showed clear limitations in estimating belowground biomass. Although the BGB tended to increase significantly with the tree age, the TLSvolume did not significantly correlate with the increase in age. This could be due to the limitations of the TLS resolution used in this study and the structural complexity of the roots [45]. In this study, roots with a minimum diameter of 2.5 mm or more were collected to measure the weight of the roots, but it was judged that complex and thin roots increased the uncertainty of the model because they were difficult to recognize at the TLS resolution [45]. Although the TLS variables did not effectively explain the variation in BGB, previous studies have used species-specific or generalized AGB and BGB ratios to estimate belowground biomass [46,47]. Incorporating such ratios could be a practical approach in future research, especially for large-scale or non-destructive carbon inventory assessments. In fact, in this study, the statistical analysis results for AGB and BGB showed R2 = 0.78 and R2 = 0.75 for apple trees, respectively, supporting this (Figure S4).
We analyzed and compared the performance of different remote sensing equipment in estimating fruit tree biomass. The total tree volume acquired using TLS equipment was shown to have high explanatory power in estimating biomass in both fruit apple and citrus fruit tree species. Generally, a model is evaluated as good when the RMSE % is 20% or less, and as very good when it is 10% or less. In most studies that evaluated the actual tree data (height, DBH, etc.) using previous TLS data, a model was evaluated as excellent when the RMSE was less than 10% [34,48]. The results of this study showed that both fruit trees were excellent models with RMSEs of less than 10%. In particular, the RMSE and bias, which evaluate the degree of overestimation of the model, were evaluated to be lower for apple trees than for citrus trees. This seems to be because the leaf density of citrus trees is higher and more complex than that of apple trees, and the degree of branching of the trunk is also simpler for apple trees (slender spindle form; 1 branch) than for citrus trees (open center natural form; 3–4 branches). This is consistent with the results of a previous study that found that accuracy of TLS varies depending on the complexity of the tree structure, and that volume estimation accuracy decreases as crown complexity and leaf density increase [49].
On the other hand, in the case of crown area data acquired using TLS and Drone_RGB, the total biomass estimated by TLScrown_area and Dronecrown_area for apple trees showed relatively low explanatory power and model performance compared with TLSvolume. This significantly reduced the explanatory power and model performance, indicating that it is not appropriate to estimate the biomass of fruit trees with the crown area calculated using TLS and Drone_RGB. There are two explanations for these results. The first is the difference in the dimension of the measurement data. In the case of TLSvolume mapped with 3D data, there is a difference in the weight of each part of the tree (leaves, primary branches, secondary branches, etc.), but it seems to increase significantly compared with the crown area as the tree age increases. However, in the case of the crown area mapped with 2D data, only the surface area of the tree is measured, and the height and ground height are not reflected, so the suitability seems to decrease relatively. In general, as the height of a tree increases, the crown area also increases [50]. However, the fruit trees that are the subjects of this study undergo continuous pruning depending on management purposes and yields [51]. Therefore, there appears to be a high level of uncertainty because the weight of the main stem, which accounts for most of the biomass in the crown area, cannot be reflected [52]. Second, the ease of distinguishing individual trees largely depends on the type of fruit species. In this study, apple trees could be clearly identified due to distinct gaps between individual trees, whereas citrus trees exhibited significant crown overlap, making it difficult to separate individuals. This may explain why the crown area of apple trees showed relatively higher explanatory power compared with that of citrus trees. Previous studies have reported challenges in estimating crown area using Drone_RGB and TLS, such as data omission and errors caused by shadows, especially when crown density is high [53]. Accordingly, low explanatory power was found for the crown area data with relatively high data deviation depending on the orchard environment, pruning intensity, and management purpose.

5. Conclusions

Establishing and improving activity data related to tree biomass as a carbon sequestration matrix using remote sensing equipment such as TLS and Drone_RGB is essential for managing and assessing national carbon emissions and removals. In the agricultural and forestry fields, previous studies scanned trees using TLS and Drone_RGB and compared and analyzed the obtained image data with simple measurements such as the diameter, height, and crown area. However, few studies have compared and analyzed the dry weight (i.e., biomass) of excavated trees to estimate carbon storage [24,34]. Therefore, our study tried to overcome the limitations of previous studies using TLS and Drone_RGB for comparison with simple measurements.
Although our study found that tree age was indeed strongly correlated with both AGB and BGB variables (r ≥ 0.7), it is not always a practical predictor for orchard management or biomass estimation. In this study, a representative and rigorously selected set of orchards, identified by a panel of experts, provided reliable data on tree age. However, accurate records of the planting year are lacking in many orchards, and the tree age may not fully capture the variability introduced by management practices such as pruning intensity, thinning, and cultivar differences—all of which significantly affect biomass accumulation. In contrast, TLS- and Drone_RGB-based structural features can provide spatially explicit and non-destructive estimates of tree architecture. These features are particularly valuable for developing generalizable biomass estimation models that are applicable across a wide range of orchard conditions and management regimes. Furthermore, by developing models based on spatially explicit remote sensing data that have been calibrated with validated destructive samples, this study offers a scalable and non-destructive alternative that is suitable for national MRV systems and carbon market applications.
In this context, we evaluated the potential estimation of the AGB and BGB of apple and citrus trees, which are representative commercial fruit trees in Korea, based on data acquired using remote sensing equipment. As a result, we confirmed that TLS volume data is suitable for estimating the biomass of apple and citrus trees. On the other hand, biomass tended to be underestimated when based on the crown area using TLS and Drone_RGB, and this method was not appropriate for accurate biomass estimation. In particular, in biomass estimation using TLS, the explanatory power and model fit were significantly lower for BGB than for AGB. This is interpreted as being due to the complex root structure and limitations of TLS resolution.
The TLS used in this study is suitable for small-scale data acquisition, but there are cost and time limitations in acquiring data for large-scale orchards. More extensive activity data are needed to construct detailed assessment data for national land use patterns. Therefore, based on the results of this study, it is essential to advance research on acquiring tree volumes for large-scale orchards using airborne laser scanning. In addition, this study highlights limitations in estimating BGB. Therefore, to improve accuracy, we suggest using higher-resolution TLS, exploring its correlation with AGB, and applying simple statistical methods such as ratio estimation. Lastly, although Drone_RGB imaging was conducted at noon to minimize shadow and overlap effects, limitations in accurately delineating crown boundaries may remain. Future studies could incorporate multi-temporal flights or spectral indices (e.g., NDVI) to improve the accuracy of crown delineation. These approaches may help enhance crown boundary detection and reduce classification uncertainty in shaded or overlapping areas.

Supplementary Materials

The following supporting information can be downloaded at https://www.mdpi.com/article/10.3390/rs17152554/s1: Table S1: The dry weight of tree parts and remote sensing measurements of ‘Fuji’/M.9 were measured in this study. Abbreviations: TLS, terrestrial laser scanning; Drone, drone-mounted RGB sensor; AGB, aboveground biomass; BGB, belowground biomass; AGV, aboveground volume; BGV, belowground volume. Table S2: The dry weight of tree parts and remote sensing measurements of ‘Miyagawa–wase’ were measured in this study. Abbreviations are shown in Table S1. Figure S1: Geographic location where tree excavation was performed. Figure S2: Relationships of six dependent variables with age for apple trees, ‘Fuji’/M.9 variety. Each plot shows the correlation coefficient (r), and the plot without a dotted line indicates statistical nonsignificance of the correlation analysis (p > 0.05). Abbreviations: AGB, aboveground biomass; AGV, aboveground volume; BGB, belowground biomass; BGV, belowground volume; TLS, terrestrial laser scanning; Drone, drone-mounted RGB sensor. Figure S3: Relationships between six dependent variables and age for citrus trees, ‘Miyagawa-wase’ satsuma mandarin variety. Each plot shows the correlation coefficient (r), and the plot without the dotted line indicates statistical nonsignificance of the correlation analysis (p > 0.05). Abbreviations are shown in Figure S2. Figure S4: Bivariate graph comparing the relationship between above- and belowground biomass of apple and citrus trees. Abbreviations are shown in Figure S2.

Author Contributions

M.-K.L.: writing—original draft preparation, conceptualization, investigation, data curation, methodology; Y.-J.L.: investigation, data curation, methodology; D.-Y.L.: investigation, data curation, validation; J.-S.P.: investigation, data curation, validation; C.-B.L.: writing—review and editing, conceptualization, project administration, supervision. All authors have read and agreed to the published version of the manuscript.

Funding

This study was conducted with support from the Cooperative Research Program for Agriculture Science and Technology Development (Project No. RS-2023-00220456) and the R&D Program for Forest Science Technology provided by Korea Forest Service (Korea Forestry Promotion Institute) (Project No. RS-2024-00358413).

Data Availability Statement

The original contributions presented in this study are available in Supplementary Materials Tables S1 and S2; further inquiries can be directed to the corresponding author, Chang-Bae Lee.

Acknowledgments

We sincerely thank the members of the Biodiversity–Ecosystem Functioning Laboratory at Kookmin University, the Urban Environment Research Laboratory at the University of Seoul, the National Institute of Horticultural & Herbal Science, and the National Institute of Agricultural Sciences. We also thank Team Leader Chang–sik Kang of UCS Co., Ltd.

Conflicts of Interest

The authors declare no conflicts of interest.

References

  1. Masson-Delmotte, V.; Zhai, P.; Pörtner, H.O.; Roberts, D.; Skea, J.; Shukla, P.R.; Waterfield, T. Global warming of 1.5 C. IPCC Spec. Rep. Impacts Glob. Warm. 2019, 1, 93–174. [Google Scholar]
  2. Mbow, H.O.P.; Reisinger, A.; Canadell, J.; O’Brien, P. Special Report on Climate Change, Desertification, Land Degradation, Sustainable Land Management, Food Security, and Greenhouse Gas Fluxes in Terrestrial Ecosystems (SR2); IPCC: Ginevra, Switzerland, 2017; p. 650. [Google Scholar]
  3. Jung, J.A.; Cho, Y.; Lee, S.; Lee, M.J. Actions to expand the use of geospatial data and satellite imagery for improved estimation of carbon sinks in the LULUCF Sector. Korean J. Remote Sens. 2024, 40, 203–217. [Google Scholar]
  4. Johnson, J.M.F.; Franzluebbers, A.J.; Weyers, S.L.; Reicosky, D.C. Agricultural opportunities to mitigate greenhouse gas emissions. Environ. Pollut. 2007, 150, 107–124. [Google Scholar] [CrossRef] [PubMed]
  5. Houghton, R.A.; House, J.I.; Pongratz, J.; Van Der Werf, G.R.; Defries, R.S.; Hansen, M.C.; Ramankutty, N. Carbon emissions from land use and land-cover change. Biogeosciences 2012, 9, 5125–5142. [Google Scholar] [CrossRef]
  6. Lu, X.; Kuang, B.; Li, J.; Han, J.; Zhang, Z. Dynamic evolution of regional discrepancies in carbon emissions from agricultural land utilization: Evidence from Chinese provincial data. Sustainability 2018, 10, 552. [Google Scholar] [CrossRef]
  7. Scandellari, F.; Caruso, G.; Liguori, G.; Meggio, F.; Palese, A.M.; Zanotelli, D.; Tagliavini, M. A survey of carbon sequestration potential of orchards and vineyards in Italy. Eu. J. Hortic. Sci. 2016, 81, 106–114. [Google Scholar] [CrossRef]
  8. Brahma, B.; Sileshi, G.W.; Nath, A.J.; Das, A.K. Development and evaluation of robust tree biomass equations for rubber tree (Hevea brasiliensis) plantations in India. For. Ecosyst. 2017, 4, 14. [Google Scholar] [CrossRef]
  9. Kalita, R.M.; Das, A.K.; Nath, A.J. Role of smallholder tea growers in carbon sink management. Curr. Sci. 2019, 116, 1560–1566. [Google Scholar] [CrossRef]
  10. Seo, Y.J.; Park, J.H.; Cho, D.H.; Choe, S.Y. Study on Carbon Sink Inventory in the Apple Production System; The Research Report of Gyongsangbuk-do Agricultural Research & Extension Service; Gyongsangbuk-do Agricultural Research & Extension Service: Daegu, Republic of Korea, 2012; pp. 25–30, (In Korean with English Abstract). [Google Scholar]
  11. Jo, H.K.; Park, S.M.; Kim, J.Y.; Park, H.M. Carbon uptake and emissions of apple orchards as a production-type greenspace. J. Korean Inst. Landsc. 2014, 42, 64–72. [Google Scholar] [CrossRef]
  12. Lee, K.; Lee, C. Estimation of greenhouse gas emissions and removals from fruit tree biomass in Korea: A study on appropriate inventory methodologies. J. Agric. Life Sci. 2022, 56, 151–159. [Google Scholar]
  13. Intergovernmental Panel on Climate Change (IPCC). Climate Change 2022: Mitigation of Climate Change. Contribution of Working Group III to the Sixth Assessment Report. Chapter 7: Agriculture, Forestry, and Other Land Uses (AFOLU); IPCC: Geneva, Switzerland, 2022. [Google Scholar]
  14. Mozdzer, T.J.; McGlathery, K.J.; Mills, A.L.; Zieman, J.C. Latitudinal variation in the availability and use of dissolved organic nitrogen in Atlantic coast salt marshes. Ecology 2014, 95, 3293–3303. [Google Scholar] [CrossRef]
  15. Puliti, S.; Ørka, H.O.; Gobakken, T.; Næsset, E. Inventory of small forest areas using an unmanned aerial system. Remote Sens. 2015, 7, 9632–9654. [Google Scholar] [CrossRef]
  16. Sakib, S.M. LiDAR Technology—An Overview. IUP J. Electr. Electron. Eng. 2022, 15, 36. [Google Scholar]
  17. Morgenroth, J.; Gómez, C. Assessment of tree structure using a 3D image analysis technique—A proof of concept. Urban. For. Urban. Green. 2014, 13, 198–203. [Google Scholar] [CrossRef]
  18. Chen, R.; Li, C.; Yang, G.; Yang, H.; Xu, B.; Yang, X.; Dong, Z. Extraction of crown information from individual fruit tree by UAV LiDAR. Trans. Chin. Soc. Agric. Eng. 2020, 36, 50–59. [Google Scholar]
  19. Abbas, A.; Zhang, Z.; Zheng, H.; Alami, M.M.; Alrefaei, A.F.; Abbas, Q.; Zhou, L. Drones in plant disease assessment, efficient monitoring, and detection: A way forward to smart agriculture. Agronomy 2023, 13, 1524. [Google Scholar] [CrossRef]
  20. Van Leeuwen, M.; Nieuwenhuis, M. Retrieval of forest structural parameters using LiDAR remote sensing. Eur. J. For. Res. 2010, 129, 749–770. [Google Scholar] [CrossRef]
  21. Dong, X.; Kim, W.Y.; Lee, K.H. Drone-based three-dimensional photogrammetry and concave hull by slices algorithm for apple tree volume mapping. J. Biosyst. Eng. 2021, 46, 474–484. [Google Scholar] [CrossRef]
  22. Di Gennaro, S.F.; Vannini, G.L.; Berton, A.; Dainelli, R.; Toscano, P.; Matese, A. Missing plant detection in vineyards using UAV angled RGB imagery acquired in dormant period. Drones 2023, 7, 349. [Google Scholar] [CrossRef]
  23. Hobart, M.; Pflanz, M.; Tsoulias, N.; Weltzien, C.; Kopetzky, M.; Schirrmann, M. Fruit detection and yield mass estimation from a UAV-based RGB dense cloud for an apple orchard. Drones 2025, 9, 60. [Google Scholar] [CrossRef]
  24. Zhang, C.; Yang, G.; Jiang, Y.; Xu, B.; Li, X.; Zhu, Y.; Yang, H. Apple tree branch information extraction from terrestrial laser scanning and backpack-LiDAR. Remote Sens. 2020, 12, 3592. [Google Scholar] [CrossRef]
  25. Jin, S.; Su, Y.; Song, S.; Xu, K.; Hu, T.; Yang, Q.; Guo, Q. Non-destructive estimation of field maize biomass using terrestrial LiDAR: An evaluation from plot level to individual leaf level. Plant Methods 2020, 16, 69. [Google Scholar] [CrossRef] [PubMed]
  26. Yang, S.J.; Park, M.Y.; Song, Y.Y.; Sagong, D.H.; Yoon, T.M. Influence of tree height on vegetative growth, productivity, and labour in slender spindle of ‘Fuji’/M.9 apple trees. J. Bio-Environ. Control 2009, 18, 492–501. [Google Scholar]
  27. Joa, J.H.; Kang, S.B.; Park, Y.S.; Kim, M.S.; Kim, H.N.; Oh, B.S. Effects of water Microspraying, foliar application of calcium carbonate and kaolin solution on sunburn and quality of fruits in Satusma Mandarin. J. Bio-Environ. Control 2022, 31, 261–269. [Google Scholar] [CrossRef]
  28. Son, Y.M.; Kim, R.H.; Lee, K.H.; Pyo, J.K.; Kim, S.W.; Hwang, J.S.; Park, H. Carbon Emission Factors and Biomass Allometric Equations by Species in Korea; Korea Forest Research Institute: Seoul, Republic of Korea, 2014. [Google Scholar]
  29. Department of Environmental Horticulture, University of Seoul. Standard Guidelines for the Analysis of Fruit Tree Biomass Assessment; Department of Environmental Horticulture, University of Seoul: Seoul, Republic of Korea, 2024. [Google Scholar]
  30. Montagnoli, A.; Hudak, A.T.; Raumonen, P.; Lasserre, B.; Terzaghi, M.; Silva, C.A.; Dumroese, R.K. Terrestrial laser scanning and low magnetic field digitization yield similar architectural coarse root traits for 32-year-old Pinus ponderosa trees. Plant Methods 2024, 20, 102. [Google Scholar] [CrossRef] [PubMed]
  31. Asenova, M.; Donchev, G.; Evangelov, E. Personal laser scanning technology for 3D mapping and forest inventory. Int. Multidiscip. Sci. 2022, 22, 347–354. [Google Scholar]
  32. Li, W.; Guo, Q.; Jakubowski, M.K.; Kelly, M. A new method for segmenting individual trees from the LiDAR point cloud. Photogramm. Eng. Remote Sens. 2012, 78, 75–84. [Google Scholar] [CrossRef]
  33. Proudman, A.; Ramezani, M.; Digumarti, S.T.; Chebrolu, N.; Fallon, M. Towards real-time forest inventory using handheld LiDAR. Robot. Auton. Syst. 2022, 157, 104240. [Google Scholar] [CrossRef]
  34. Ko, C.; Kang, J.; Park, J.; Lee, M. Assessing Forest resources with terrestrial and backpack LiDAR: A case study on leaf-on and leaf-off conditions in Gari Mountain, Hongcheon, Republic of Korea. Forests 2024, 15, 19994907. [Google Scholar] [CrossRef]
  35. Miranda-Fuentes, A.; Llorens, J.; Gamarra-Diezma, J.L.; Gil-Ribes, J.A.; Gil, E. Towards an optimized method of olive tree crown volume measurement. Sensors 2015, 15, 3671–3687. [Google Scholar] [CrossRef] [PubMed]
  36. Treder, W.; Klamkowski, K.; Tryngiel-Gać, A.; Wójcik, K. Application of ImageJ software in the assessment of flowering Intensity and growth vigor of pear Trees. J. Hortic. Res. 2021, 29, 85–94. [Google Scholar] [CrossRef]
  37. Lewis-Beck, M.S.; Skalaban, A. The R-squared: Some straight talk. Political Anal. 1990, 2, 153–171. [Google Scholar] [CrossRef]
  38. Chai, T.; Draxler, R.R. Root mean square error (RMSE) or mean absolute error (MAE)?—Arguments against avoiding RMSE in the literature. Geosci. Model. Dev. 2014, 7, 1247–1250. [Google Scholar] [CrossRef]
  39. Pinheiro, J.; Bates, D.; DebRoy, S.; Sarkar, D.; Heisterkamp, S.; Van Willigen, B.; Maintainer, R. Package ‘nlme’. Linear and Nonlinear Mixed Effects Models, Version. 2017, 3, 274. Available online: https://cran.r-project.org/package=nlme (accessed on 15 July 2025).
  40. Hamner, B.; Frasco, M.; LeDell, E. Package ‘Metrics’; R Foundation for Statistical Computing, 2018. Available online: https://cran.r-project.org/package=Metrics (accessed on 15 July 2025).
  41. Wong, T.T. Performance evaluation of classification algorithms by k-fold and leave-one-out cross validation. Pattern Recognit. 2015, 48, 2839–2846. [Google Scholar] [CrossRef]
  42. Dong, N.; Chi, R.; Zhang, W. LiDAR odometry and mapping based on semantic information for maize field. Agronomy 2022, 12, 3107. [Google Scholar] [CrossRef]
  43. Debnath, S.; Paul, M.; Debnath, T. Applications of LiDAR in agriculture and future research directions. J. Imaging 2023, 9, 57. [Google Scholar] [CrossRef] [PubMed]
  44. Farhan, S.M.; Yin, J.; Chen, Z.; Memon, M.S. A comprehensive review of LiDAR applications in crop management for precision agriculture. Sensors 2024, 24, 5409. [Google Scholar] [CrossRef] [PubMed]
  45. Whelan, A.W.; Cannon, J.B.; Bigelow, S.W.; Rutledge, B.T.; Meador, A.J.S. Improving generalized models of forest structure in complex forest types using area-and voxel-based approaches from LiDAR. Remote Sens. Environ. 2023, 284, 113362. [Google Scholar] [CrossRef]
  46. Nie, X.; Yang, Y.; Yang, L.; Zhou, G. Above-and belowground biomass allocation in shrub biomes across the northeast Tibetan Plateau. PLoS ONE 2016, 11, e0154251. [Google Scholar] [CrossRef] [PubMed]
  47. Jonson, J.H.; Freudenberger, D. Restore and sequester: Estimating biomass in native Australian woodland ecosystems for their carbon-funded restoration. Aust. J. Bot. 2011, 59, 640–653. [Google Scholar] [CrossRef]
  48. Yang, S.; Xing, Y.; Xing, T.; Deng, H.; Xi, Z. Multi-sensors fusion SLAM-aided forest plot mapping with backpack dual-LiDAR system. IEEE J. Sel. Top. Appl. Earth Obs. Remote Sens. 2024, 17, 16051–16070. [Google Scholar] [CrossRef]
  49. Liang, X.; Kankare, V.; Hyyppä, J.; Wang, Y.; Kukko, A.; Haggrén, H.; Vastaranta, M. Terrestrial laser scanning in forest inventories. ISPRS J. Photogramm. Remote Sens. 2016, 115, 63–77. [Google Scholar] [CrossRef]
  50. Yang, J.; Swenson, N.G. Height and crown allometries and their relationship with functional traits: An example from a subtropical wet forest. Ecol. Evol. 2023, 13, e9804. [Google Scholar] [CrossRef] [PubMed]
  51. Martí, B.V.; González, E.F. The influence of mechanical pruning in cost reduction, production of fruit, and biomass waste in citrus orchards. Appl. Eng. Agric. 2010, 26, 531–540. [Google Scholar] [CrossRef]
  52. Ximenes, F.A.; Gardner, W.D.; Kathuria, A. Proportion of above-ground biomass in commercial logs and residues following the harvest of five commercial forest species in Australia. For. Ecol. Manag. 2008, 256, 335–346. [Google Scholar] [CrossRef]
  53. Htun, N.M.; Owari, T.; Tsuyuki, S.; Hiroshima, T. Detecting canopy gaps in uneven–aged mixed forests through the combined use of Unmanned Aerial Vehicle imagery and deep learning. Drones 2024, 8, 484. [Google Scholar] [CrossRef]
Figure 1. Processes for conducting research including (a) target tree selection and measurement, (b) biomass measurement process, (c) remote sensing process, and (d) comparison and analysis of field data and remote sensing data.
Remotesensing 17 02554 g001
Figure 2. Data acquisition processes using terrestrial laser scanning: (a) scanning the orchard where the target tree belongs, (b) generating a 3D cloud point map using SLAM technology, (c) separating individual trees using the Cloud Compare and LiDAR 360 software packages, and (d) calculating volume and crown area based on the separated individual trees.
Remotesensing 17 02554 g002
Figure 3. Data acquisition processes using Drone_RGB: (a) scanning the orchard where the target tree belongs, (b) separating individual trees using ArcGIS, (c) mapping the classified individual trees using the ImageJ software, and (d) calculating the crown area based on the mapped individual trees.
Remotesensing 17 02554 g003
Figure 4. Bivariate plots showing the relationship between the variables measured by TLS and Drone_RGB and measured biomass for the ‘Fuji’/M.9 apple variety. Abbreviations: TLS, terrestrial laser scanning; Drone, drone-mounted RGB sensor; TV, total volume; AGV, aboveground volume; BGV, belowground volume.
Remotesensing 17 02554 g004
Figure 5. Bivariate plots showing the relationship between variables measured by TLS and Drone_RGB and measured biomass for the ‘Miyagawa-wase’ satsuma mandarin citrus variety. Abbreviations are shown in Figure 4.
Remotesensing 17 02554 g005
Table 1. Summary of collected samples of apple ‘Fuji’/M.9 variety and citrus ‘Miyagawa-wase’ variety.
Fruit TreeSampling RegionTree AgeNumber of SamplesYear of Sampling
StateDistrict/City
Apple ‘Fuji’/M.9
variety
Gyeongsangbuk-doUiseong district632023
Yeongju district103
Yeongyang district143
Gyeongsangbuk-doCheongsong district432024
Gyeongsangnam-doMiryang district103
Citrus ‘Miyagawa-wase’ satsuma mandarin varietyJeju Special Self-Governing ProvinceSeogwipo city1032023
183
456
Seogwipo city1932024
Jeju city302
352
402
Table 2. Summary of field data on biomass of apple and citrus trees. SD indicates Standard Deviation.
VariablesUnitMinMaxMeanSD
Apple tree
 Aboveground biomasskg1.7318.879.916.10
 Belowground biomasskg0.336.423.642.19
 Total biomasskg2.0624.0313.568.11
Citrus tree
 Aboveground biomasskg17.1798.543.5420.72
 Belowground biomasskg5.835.2617.529.19
 Total biomasskg26.33132.2861.0729.07
Table 3. Summary of volume and crown area using TLS and Drone_RGB for apple and citrus trees. Abbreviations: SD, Standard Deviation.
VariablesUnitMinMaxMeanSD
Apple tree
 TLS aboveground volumem31.037.534.522.02
 TLS belowground volumem30.020.750.320.19
 TLS crown aream20.834.622.781.08
 Drone crown aream23.4311.367.482.54
Citrus tree
 TLS aboveground volumem31.9817.518.514.20
 TLS belowground volumem30.071.310.520.34
 TLS crown aream24.1416.2110.093.47
 Drone crown aream26.0829.416.577.60
Table 4. Equation models developed to estimate AGB, BGB, and TB of apple and citrus trees using remote sensing equipment. Abbreviations: TLS, terrestrial laser scanning; Drone, drone-mounted RGB sensor.
Fruit TreeBiomassEquipment/VariableEquation Model
Apple ‘Fuji’/M.9
variety
TotalTLS/volumey = 1.8392x1.1649
TLS/crown areay = 2.2761x1.6223
Drone/crown areay = 0.1608x2.1339
AbovegroundTLS/volumey = 1.9842x0.9692
TLS/crown areay = 1.8039x1.5469
Drone/crown areay = 0.1439x2.0354
BelowgroundTLS/volumey = 2.5635x−0.01
TLS/crown areay = 0.4452x1.8912
Drone/crown areay = 0.0204x2.4846
Citrus ‘Miyagawa-wase’ satsuma mandarin varietyTotalTLS/volumey = 22.858e0.0978x
TLS/crown areay = 9.356x0.79
Drone/crown areay = 12.121x0.5634
AbovegroundTLS/volumey = 17.789e0.0935x
TLS/crown areay = 6.7186x0.7866
Drone/crown areay = 8.8945x0.5526
BelowgroundTLS/volumey = 15.571x0.0113
TLS/crown areay = 2.4491x0.8181
Drone/crown areay = 2.8608x0.6253
Table 5. Statistical summary of biomass estimated based on variables measured using different equipment for apple and citrus trees. Abbreviations: TLS, terrestrial laser scanning; Drone, drone-mounted RGB sensor; R2, Coefficient of Determination; RMSE, Root Mean Square Error.
Fruit TreeBiomassEquipment/VariableR2RMSERMSE%BiasBias%
Apple ‘Fuji’/M.9
variety
TotalTLS/volume0.7040.4544.0190.0871.607
TLS/crown area0.5370.6454.758−0.202−3.142
Drone/crown area0.6230.5444.092−0.151−2.736
AbovegroundTLS/volume0.7250.5235.2790.1342.573
TLS/crown area0.5530.6486.546−0.231−3.564
Drone/crown area0.6300.5605.658−0.251−4.486
BelowgroundTLS/volume0.021.36737.540−0.558−4.079
TLS/crown area0.3910.72419.892−0.743−10.23
Drone/crown area0.4850.61816.961−0.332−5.384
Citrus ‘Miyagawa-wase’ satsuma mandarin varietyTotalTLS/volume0.8654.2526.964−0.248−5.836
TLS/crown area0.3039.31915.2620.8328.934
Drone/crown area0.3259.22515.1077.75724.08
AbovegroundTLS/volume0.8654.42510.1631.97518.08
TLS/crown area0.3019.33021.428−32.372−54.693
Drone/crown area0.3209.20521.140−18.51−40.108
BelowgroundTLS/volume0.01214.97085.426−22.802−35.231
TLS/crown area0.2539.79355.883−13.06−33.336
Drone/crown area0.2749.77755.7931.97916.248
Table 6. Results of Leave-One-Out Cross-Validation performed to further evaluate the generalizability and robustness of the regression model. Abbreviations: TLS, terrestrial laser scanning; Drone, drone-mounted RGB sensor; TV, total volume; AGV, aboveground volume; BGV, belowground volume; R2, Coefficient of Determination; RMSE, Root Mean Square Error; MAE, Mean Absolute Error.
Fruit TreeModelR2RMSEMAE
Apple ‘Fuji’/M.9
variety
Total biomass~TLS_TV0.6521.1520.922
Total biomass~TLS_crown area0.3650.8280.598
Total biomass~Drone_crown area0.4881.7541.324
AGB~TLS_AGV0.6401.1710.944
AGB~TLS_crown area0.3230.8550.633
AGB~Drone_crown area0.4551.8091.425
BGB~TLS_BGV>0.012.6452.269
BGB~TLS_crown area0.2190.9190.667
BGB~Drone_crown area0.3621.9581.509
Citrus ‘Miyagawa-wase’ satsuma mandarin varietyTotal biomass~TLS_TV0.84611.1199.148
Total biomass~TLS_crown area0.04627.67223.652
Total biomass~Drone_crown area0.01828.07322.725
AGB~TLS_AGV0.8368.1636.885
AGB~TLS_crown area0.03919.79816.119
AGB~Drone_crown area0.03719.81615.739
BGB~TLS_BGV>0.019.3337.882
BGB~TLS_crown area0.0158.8887.659
BGB~Drone_crown area>0.019.2197.740
Disclaimer/Publisher’s Note: The statements, opinions and data contained in all publications are solely those of the individual author(s) and contributor(s) and not of MDPI and/or the editor(s). MDPI and/or the editor(s) disclaim responsibility for any injury to people or property resulting from any ideas, methods, instructions or products referred to in the content.

