


Coastal Eddy Detection in the Balearic Sea: SWOT Capabilities

 , , , ,
  and
and
Abstract

1. Introduction
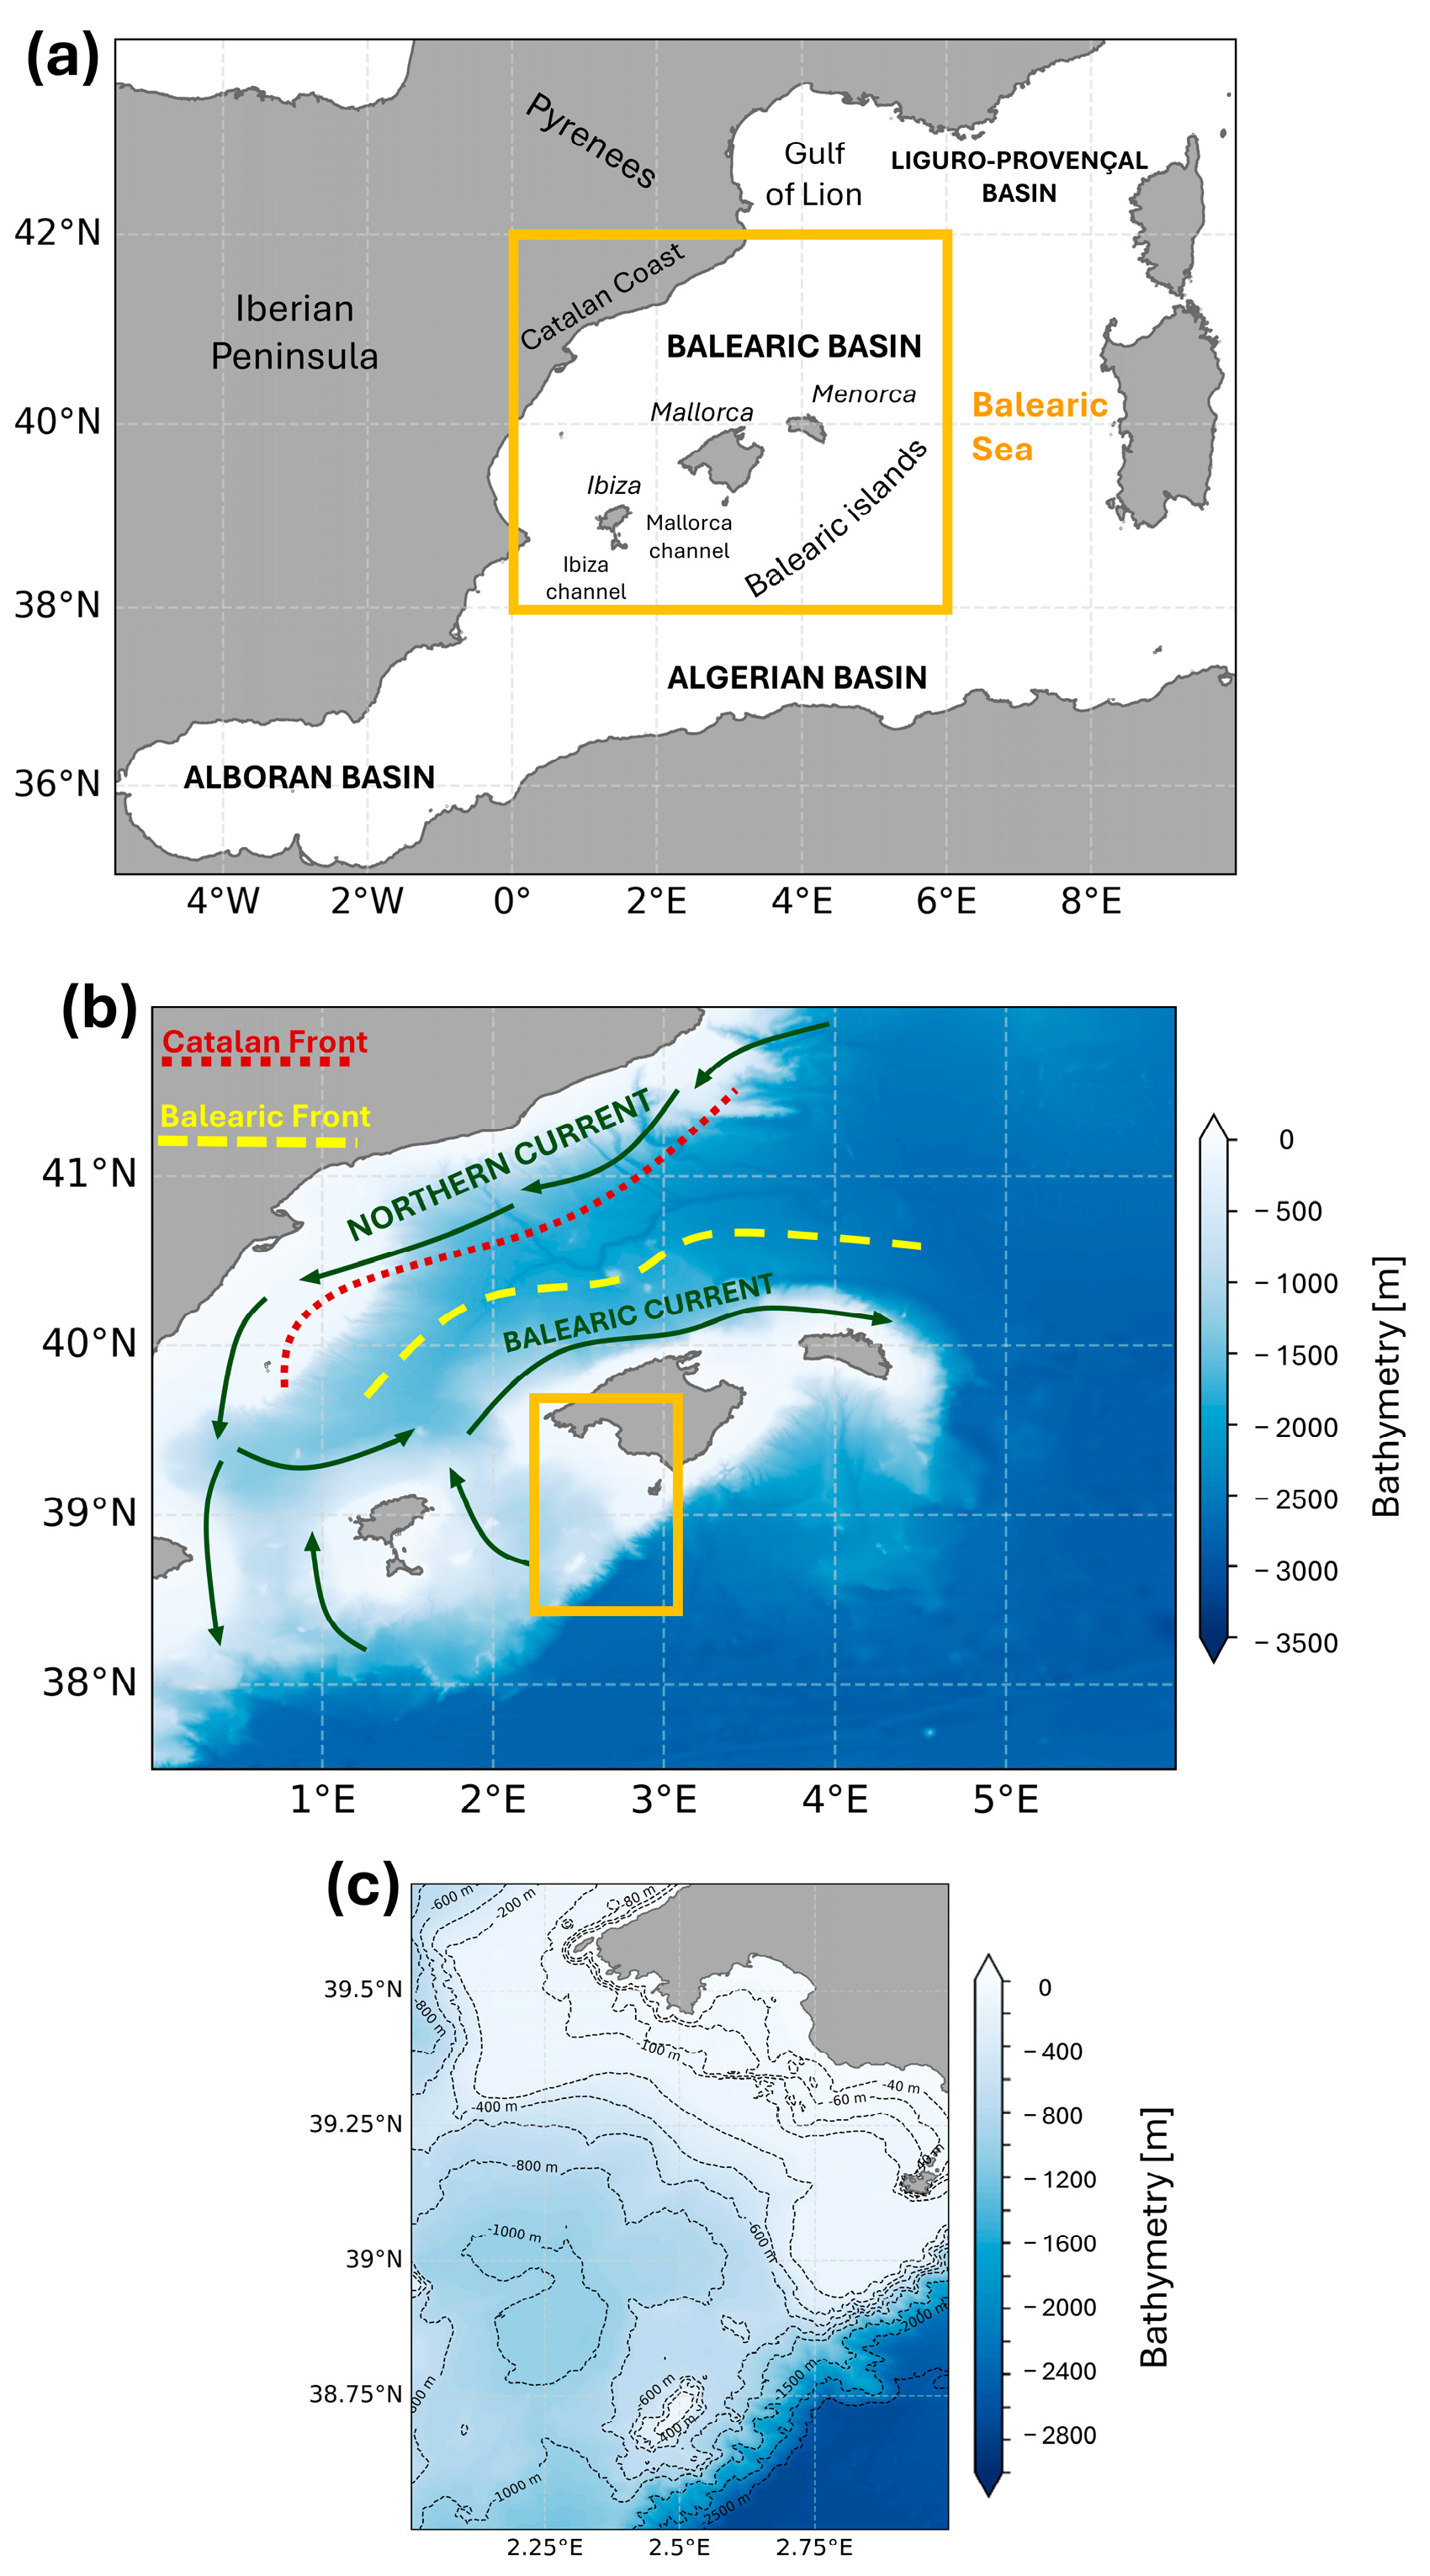
2. Study Area
3. Materials and Methods
3.1. Satellite Ocean Color
3.2. Satellite Altimetry
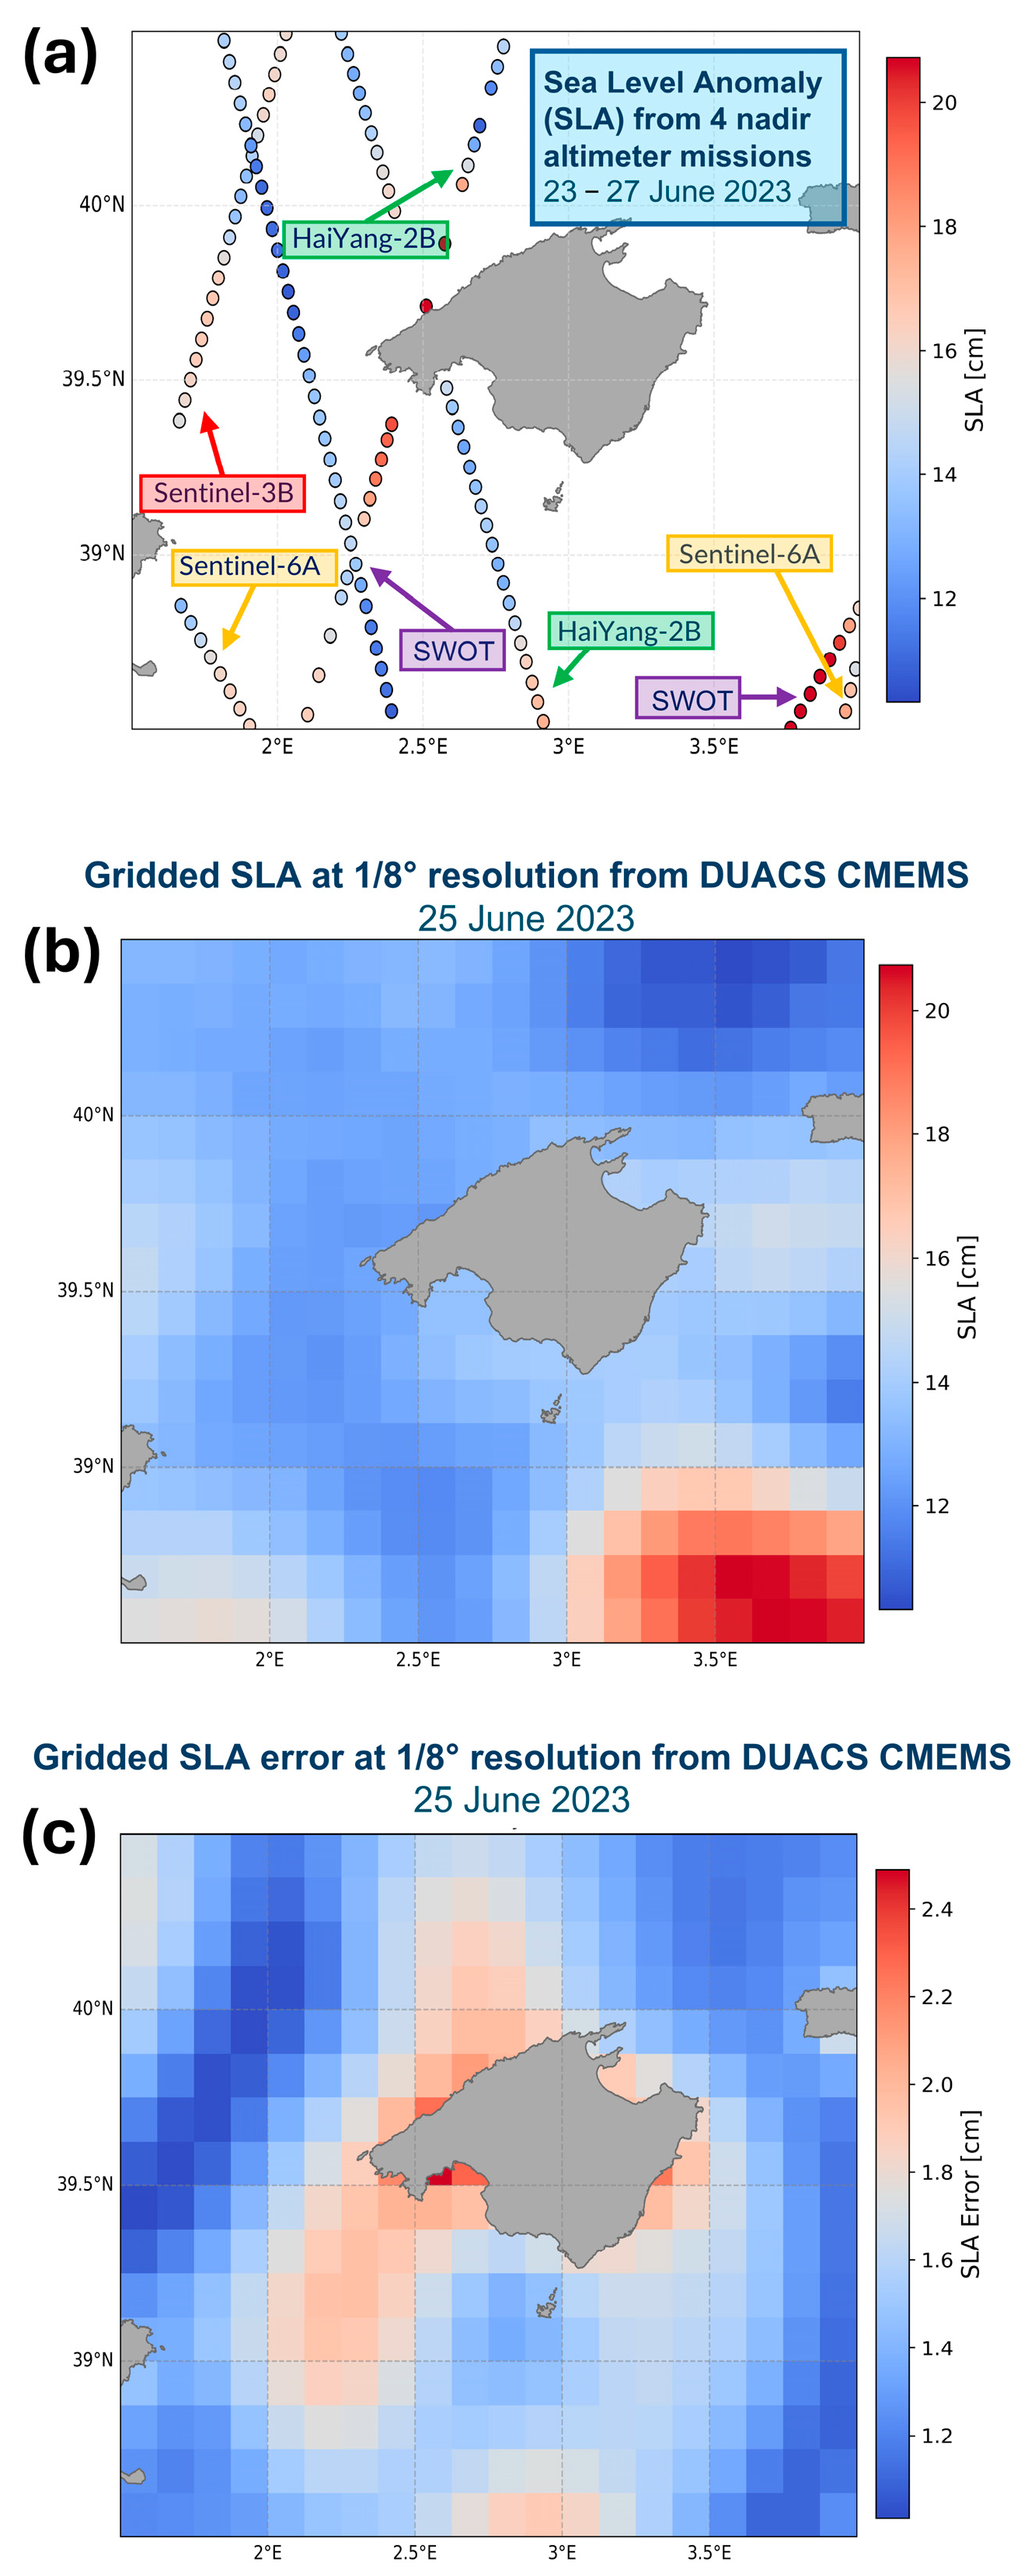
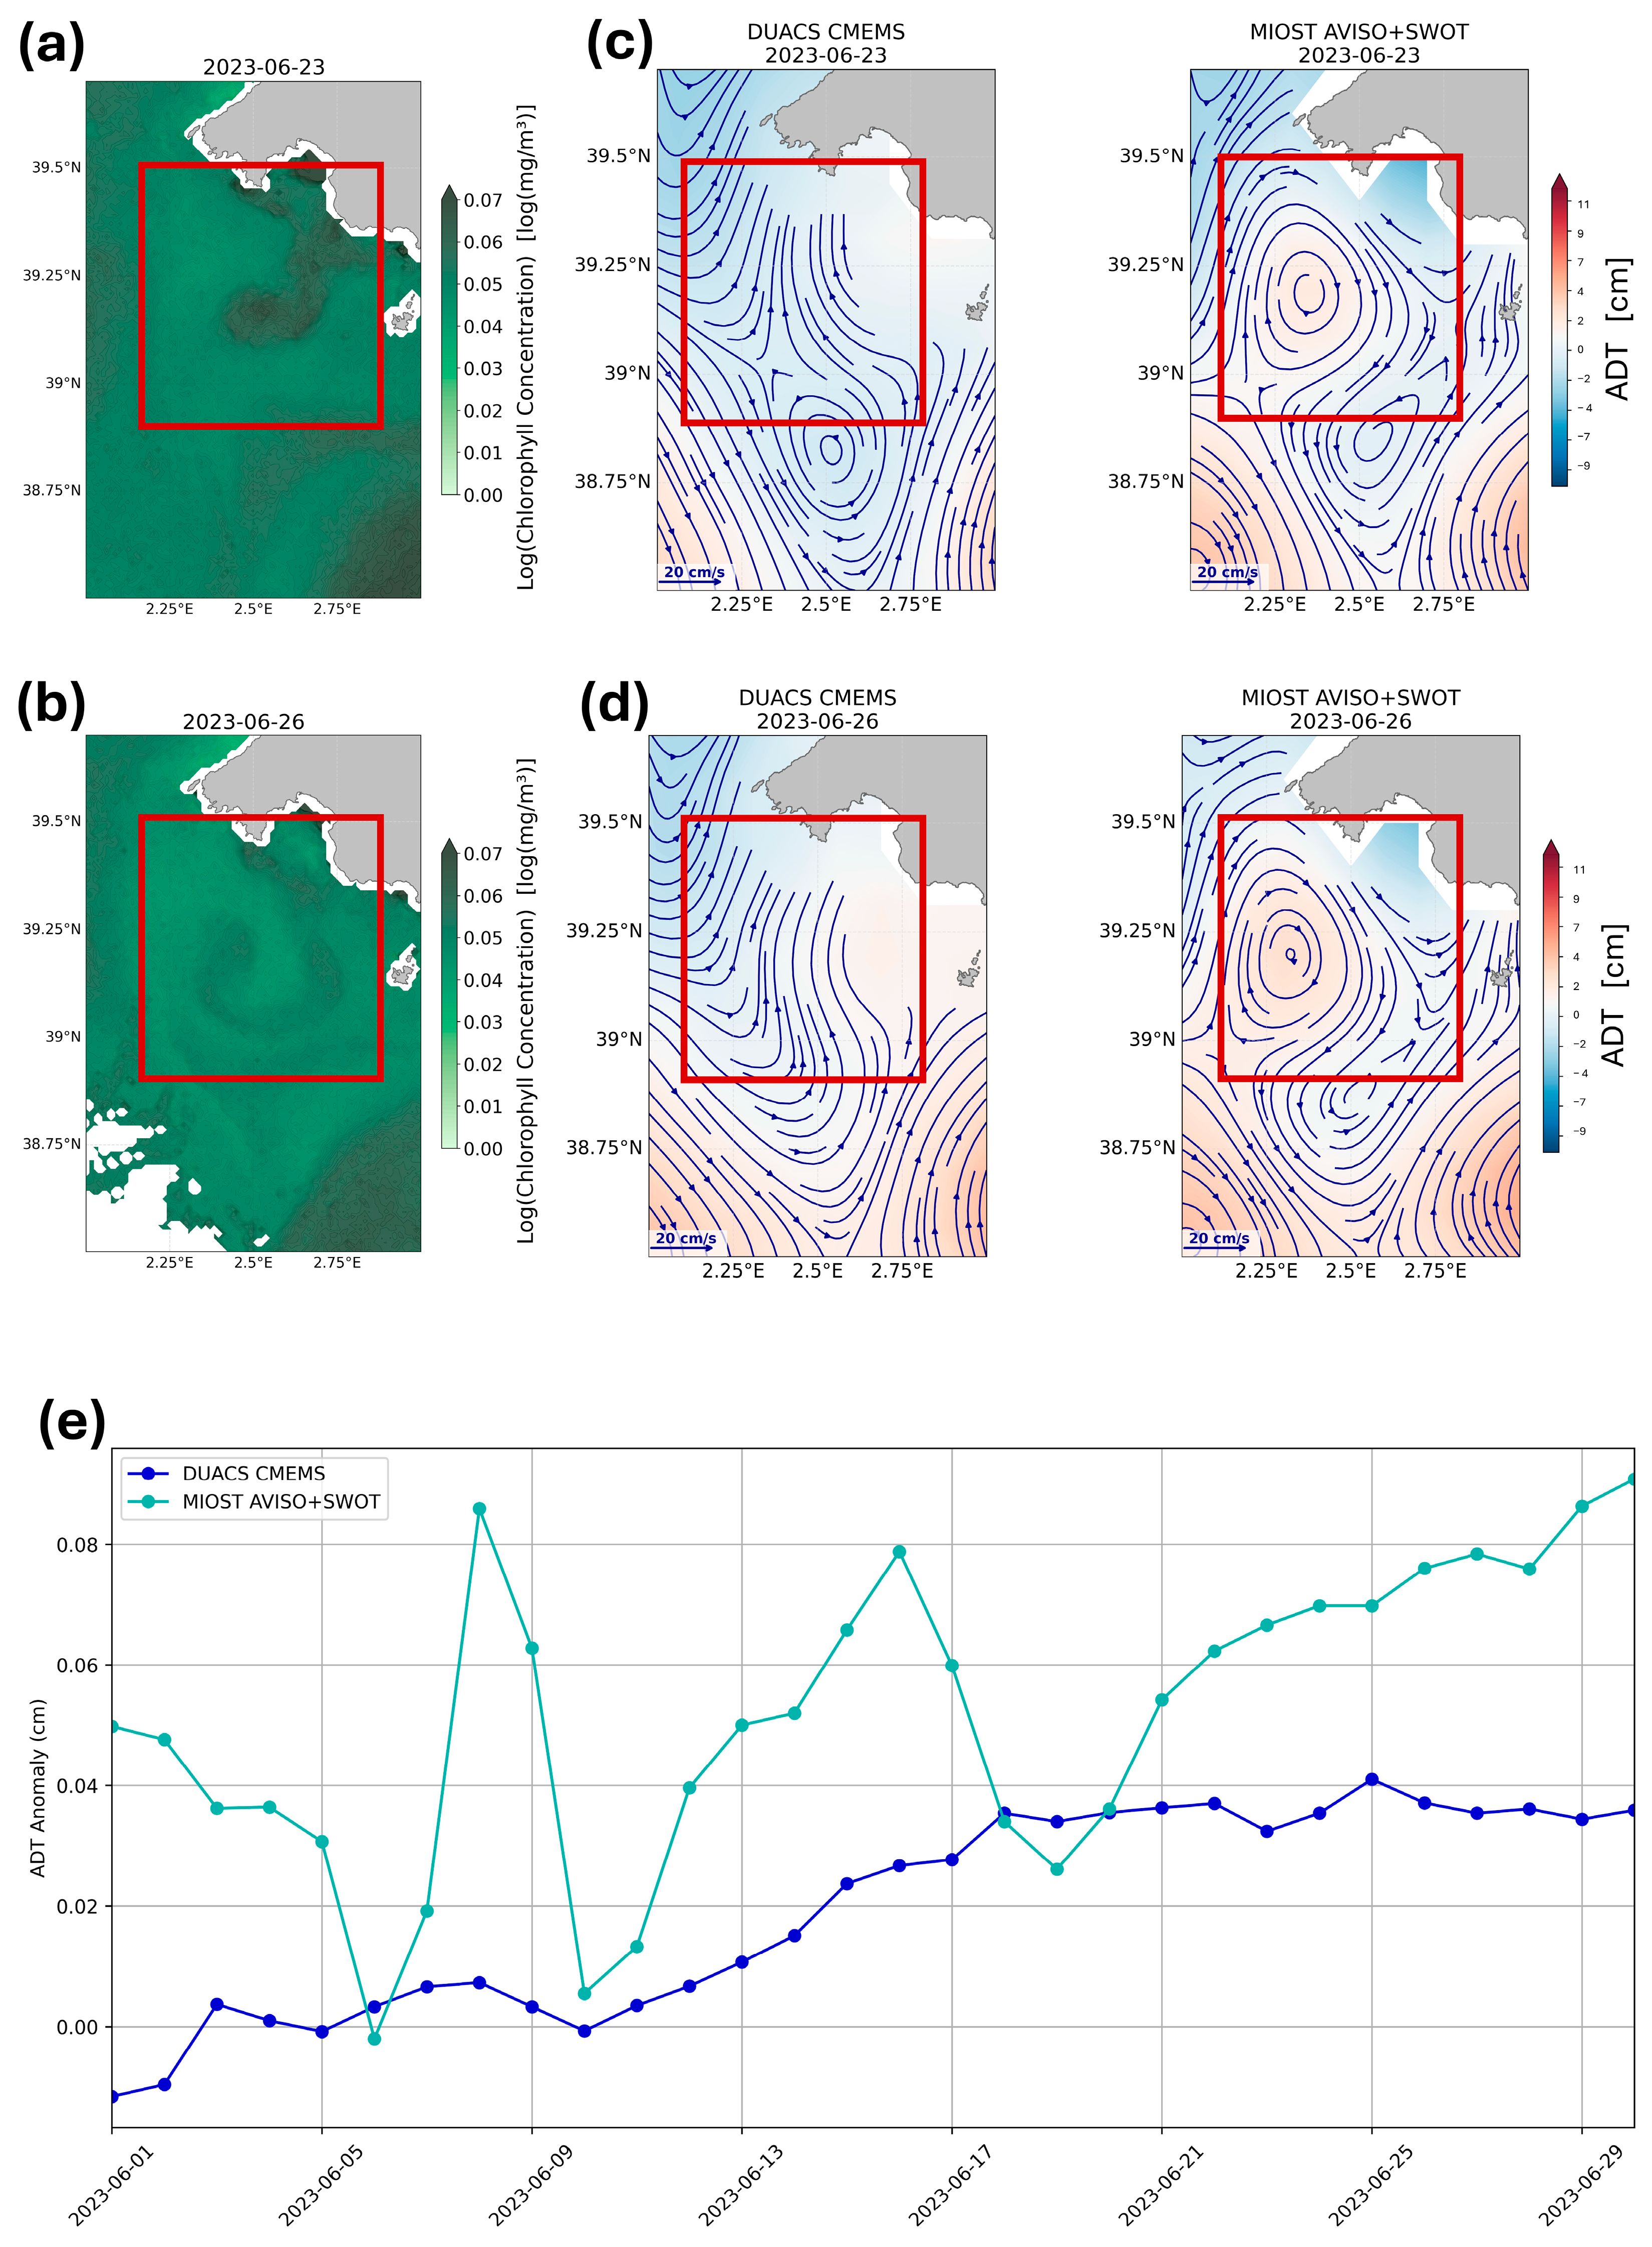
- The conventional product used is the CMEMS product European Seas Gridded L4 Sea Surface Heights and Derived Variables NRT (SEALEVEL_EUR_PHY_L4_NRT_008_060, DOI: https://doi.org/10.48670/moi-00142), processed by the DUACS (Data Unification and Altimeter Combination System) multimission altimeter data processing system. This product provides daily gridded Level-4 (L4) Sea Level Anomaly (SLA) maps for European Seas at 1/8° × 1/8° spatial resolution, computed relative to a 20-year reference period (1993–2012). The processing methodology is based on Optimal Interpolation, integrating measurements from 10 altimeter missions (TOPEX/Poseidon, Jason series, ERS, ENVISAT, GFO, CryoSat-2, Saral/AltiKa, Haiyang-2A) as detailed in Pujol et al. [61].
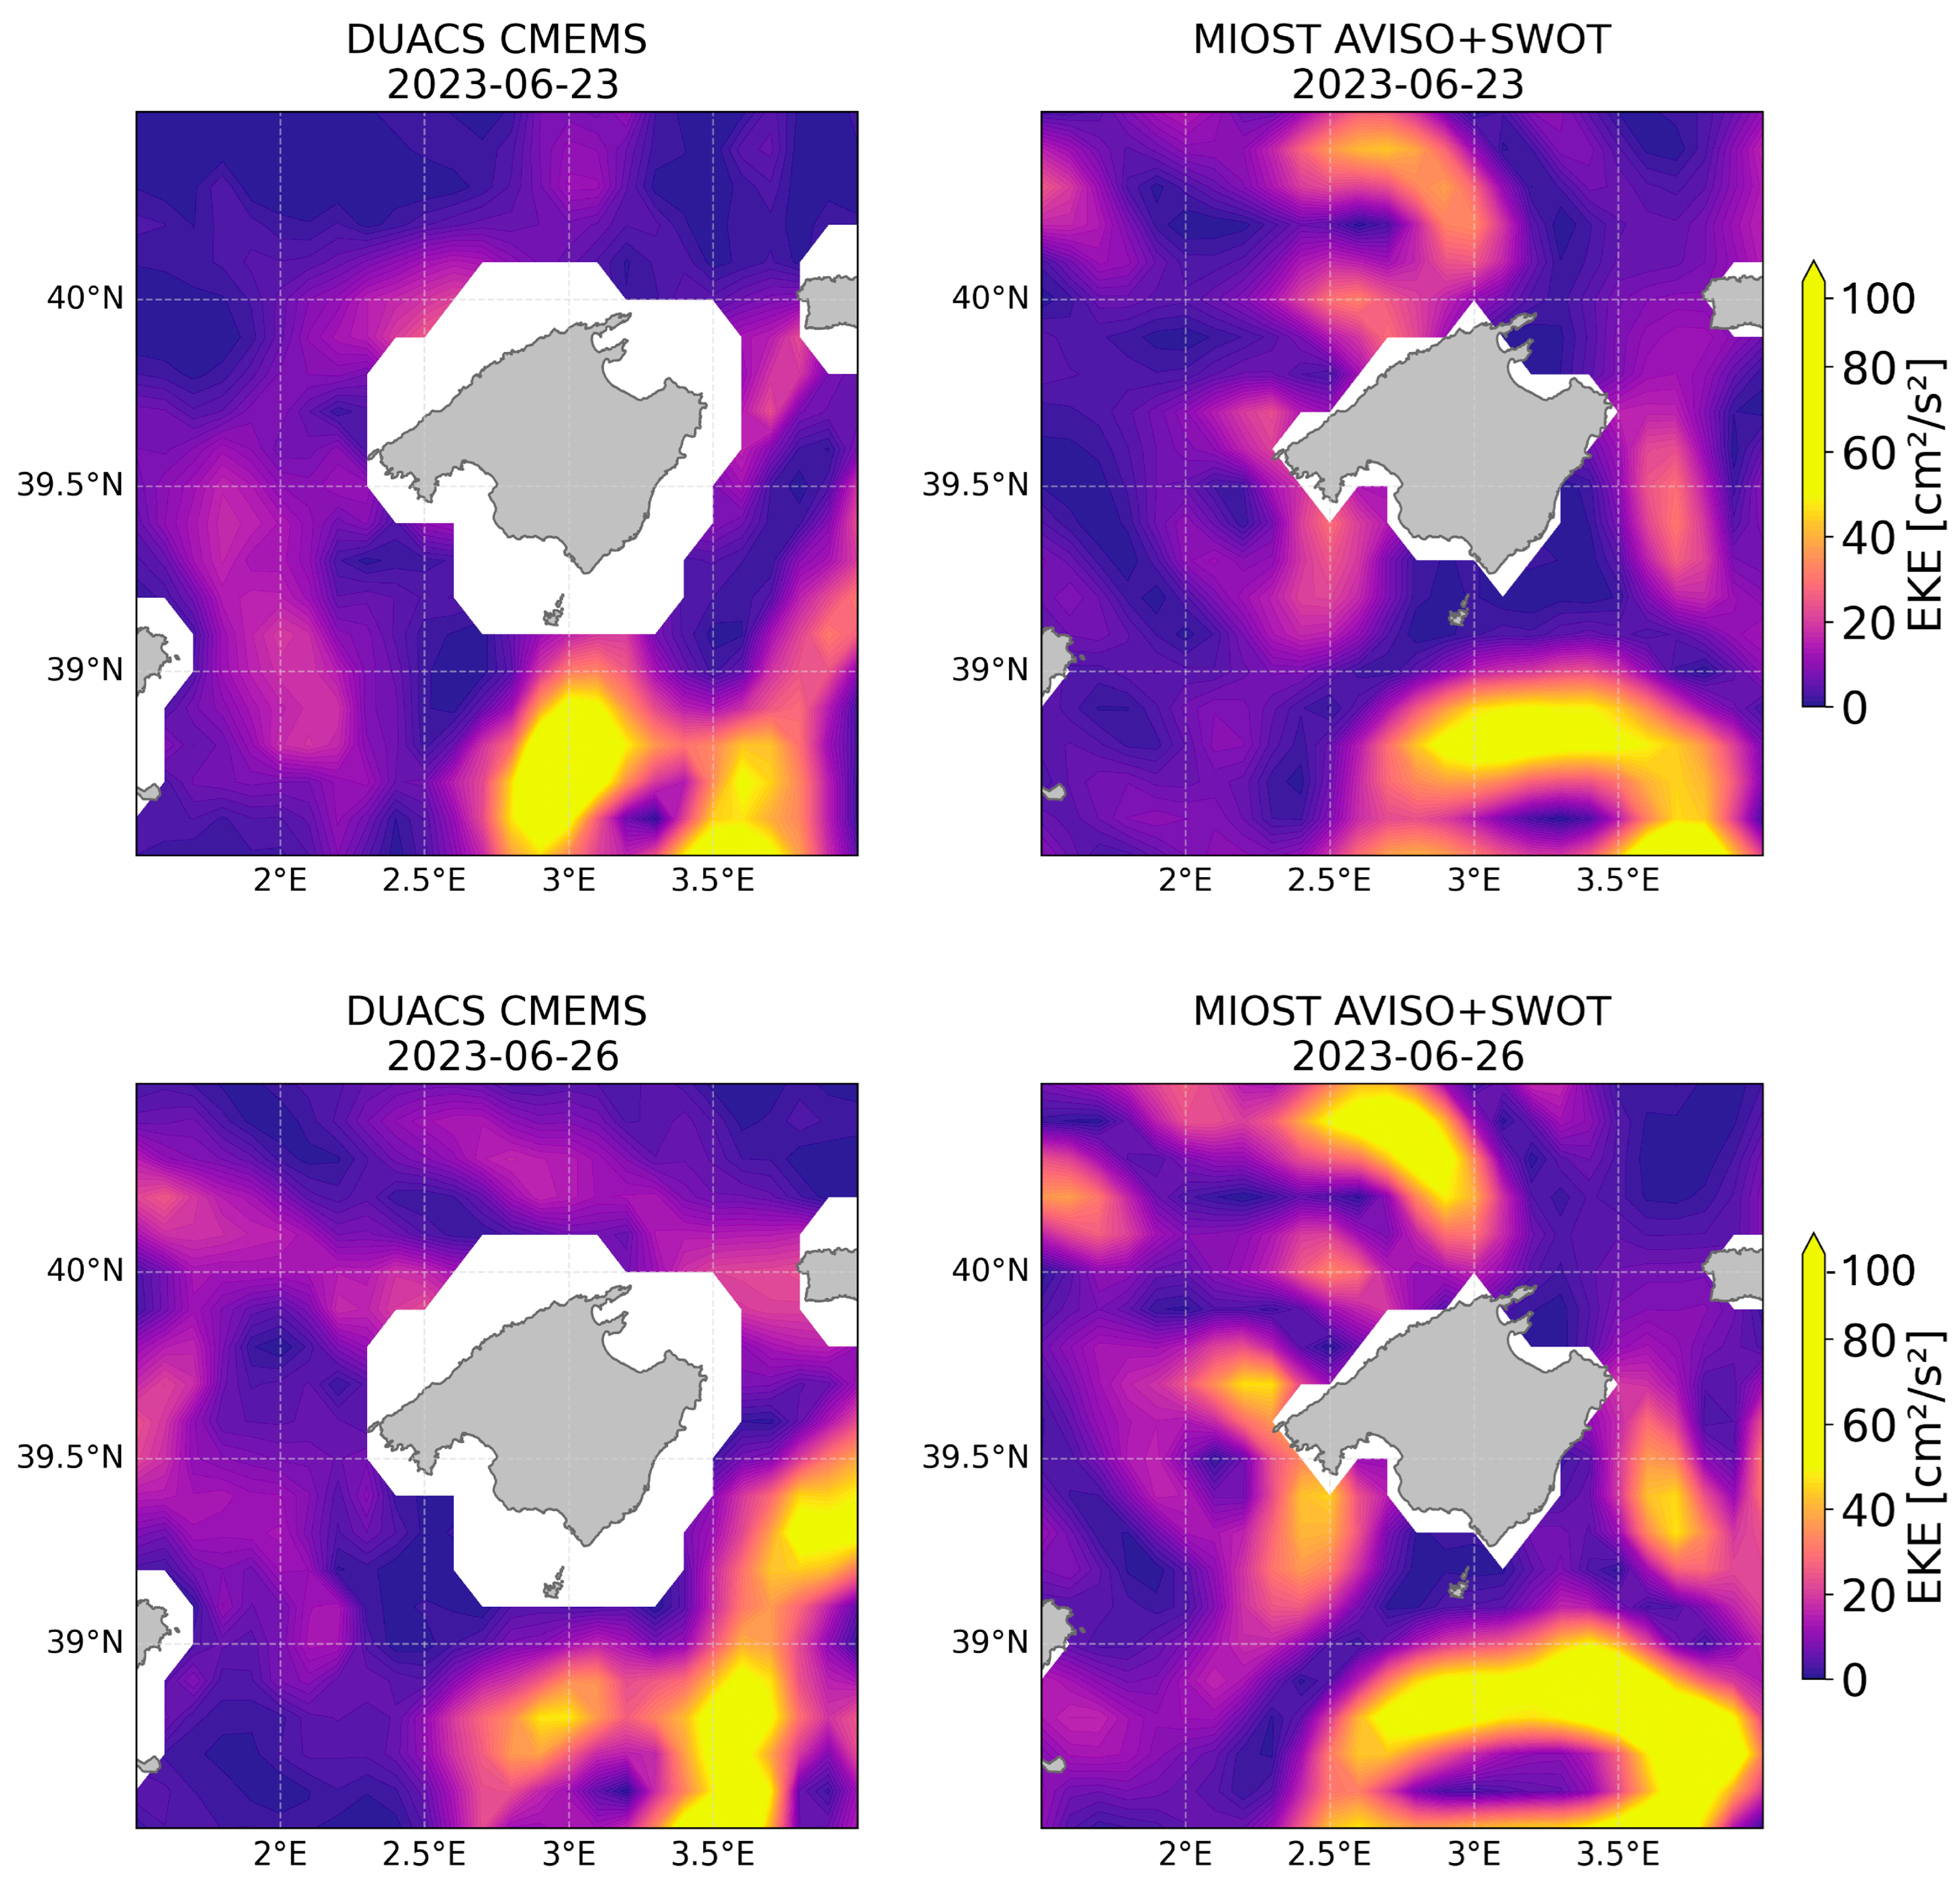
- The Experimental multimission gridded L4 sea level heights and velocities with SWOT is a gridded product derived from the along-track (or Level-3) SEA LEVEL products (DOI: doi.org/10.48670/moi-00147) provided by CMEMS for the satellites SARAL/AltiKa, CryoSat-2, HaiYang-2B, Jason-3, Copernicus Sentinel-3A & 3B, Sentinel-6A, SWOT nadir, and SWOT Level-3 KaRIn sea level products (DOI: https://doi.org/10.24400/527896/A01-2023.018). The product is processed by SSALTO/DUACS and distributed by AVISO (https://www.aviso.altimetry.fr, accessed on 20 November 2024), supported by CNES (version 1.0.0) (DOI: https://doi.org/10.24400/527896/A01-2024.007). This dataset has daily temporal resolution and a spatial resolution of 1/10° × 1/10°. It uses the MIOST (Multiscale Interpolation Ocean Science Topography) approach [62,63], which models various modes of ocean surface topography variability to improve the representation of mesoscale ocean variability [64].
- Additionally, the study used European Seas Along Track L3 Sea Surface Heights Reprocessed 1993–Ongoing Tailored For Data Assimilation (SEALEVEL_EUR_PHY_L3_MY_008_061, DOI: https://doi.org/10.48670/moi-00139), processed by the DUACS multimission altimeter data processing system. This product provides along-track, Level-3 (L3) sea surface height (SSH) observations reprocessed for consistency and optimized for data assimilation applications. It processes data from all altimeter missions available (e.g., TOPEX/Poseidon, Jason-1/2/3, Sentinel-3A/B, HaiYang-2A/B, etc.) and covers the European Seas from 1993 to the present. This dataset includes SWOT-nadir Calibration/Validation (CalVal) data used to validate SWOT KaRIn measurements and support mesoscale structure interpretation.
- Finally, the SWOT Expert Level 3 Low-Rate Sea Surface Height (L3_LR_SSH_Expert) product (DOI: https://doi.org/10.24400/527896/A01-2023.018) is a gridded ocean topography dataset derived from Level-2 KaRIn and nadir altimetry observations collected by the SWOT satellite. This expert-level product includes a variety of key variables for oceanographic and geodetic research, such as Sea Surface Height Anomaly (SSHA), Mean Dynamic Topography (MDT), geostrophic currents (both absolute and anomalies), backscatter coefficient (sigma0), and the Mean Sea Surface (MSS). Additionally, it integrates quality flags, altimetric corrections, and external model outputs as separate layers, ensuring data accuracy and flexibility. The data are mapped onto a regular grid with a spatial resolution of approximately 0.05° (~5 km), covering the KaRIn swath. This product is derived from the L2 SWOT KaRIn low-rate ocean data products (NASA/JPL and CNES) and is produced and made freely available by the AVISO and DUACS teams as part of the DESMOS Science Team project. It is designed to offer high-resolution global ocean surface topography measurements, which are particularly useful for studying mesoscale ocean variability.
3.3. Altimetric Data Coverage and Uncertainty
3.4. Lagrangian Simulator for Particle Tracking
4. Results
4.1. Comparison Between Altimetric Products
4.1.1. Absolute Dynamic Topography (ADT)
4.1.2. Eddy Kinetic Energy
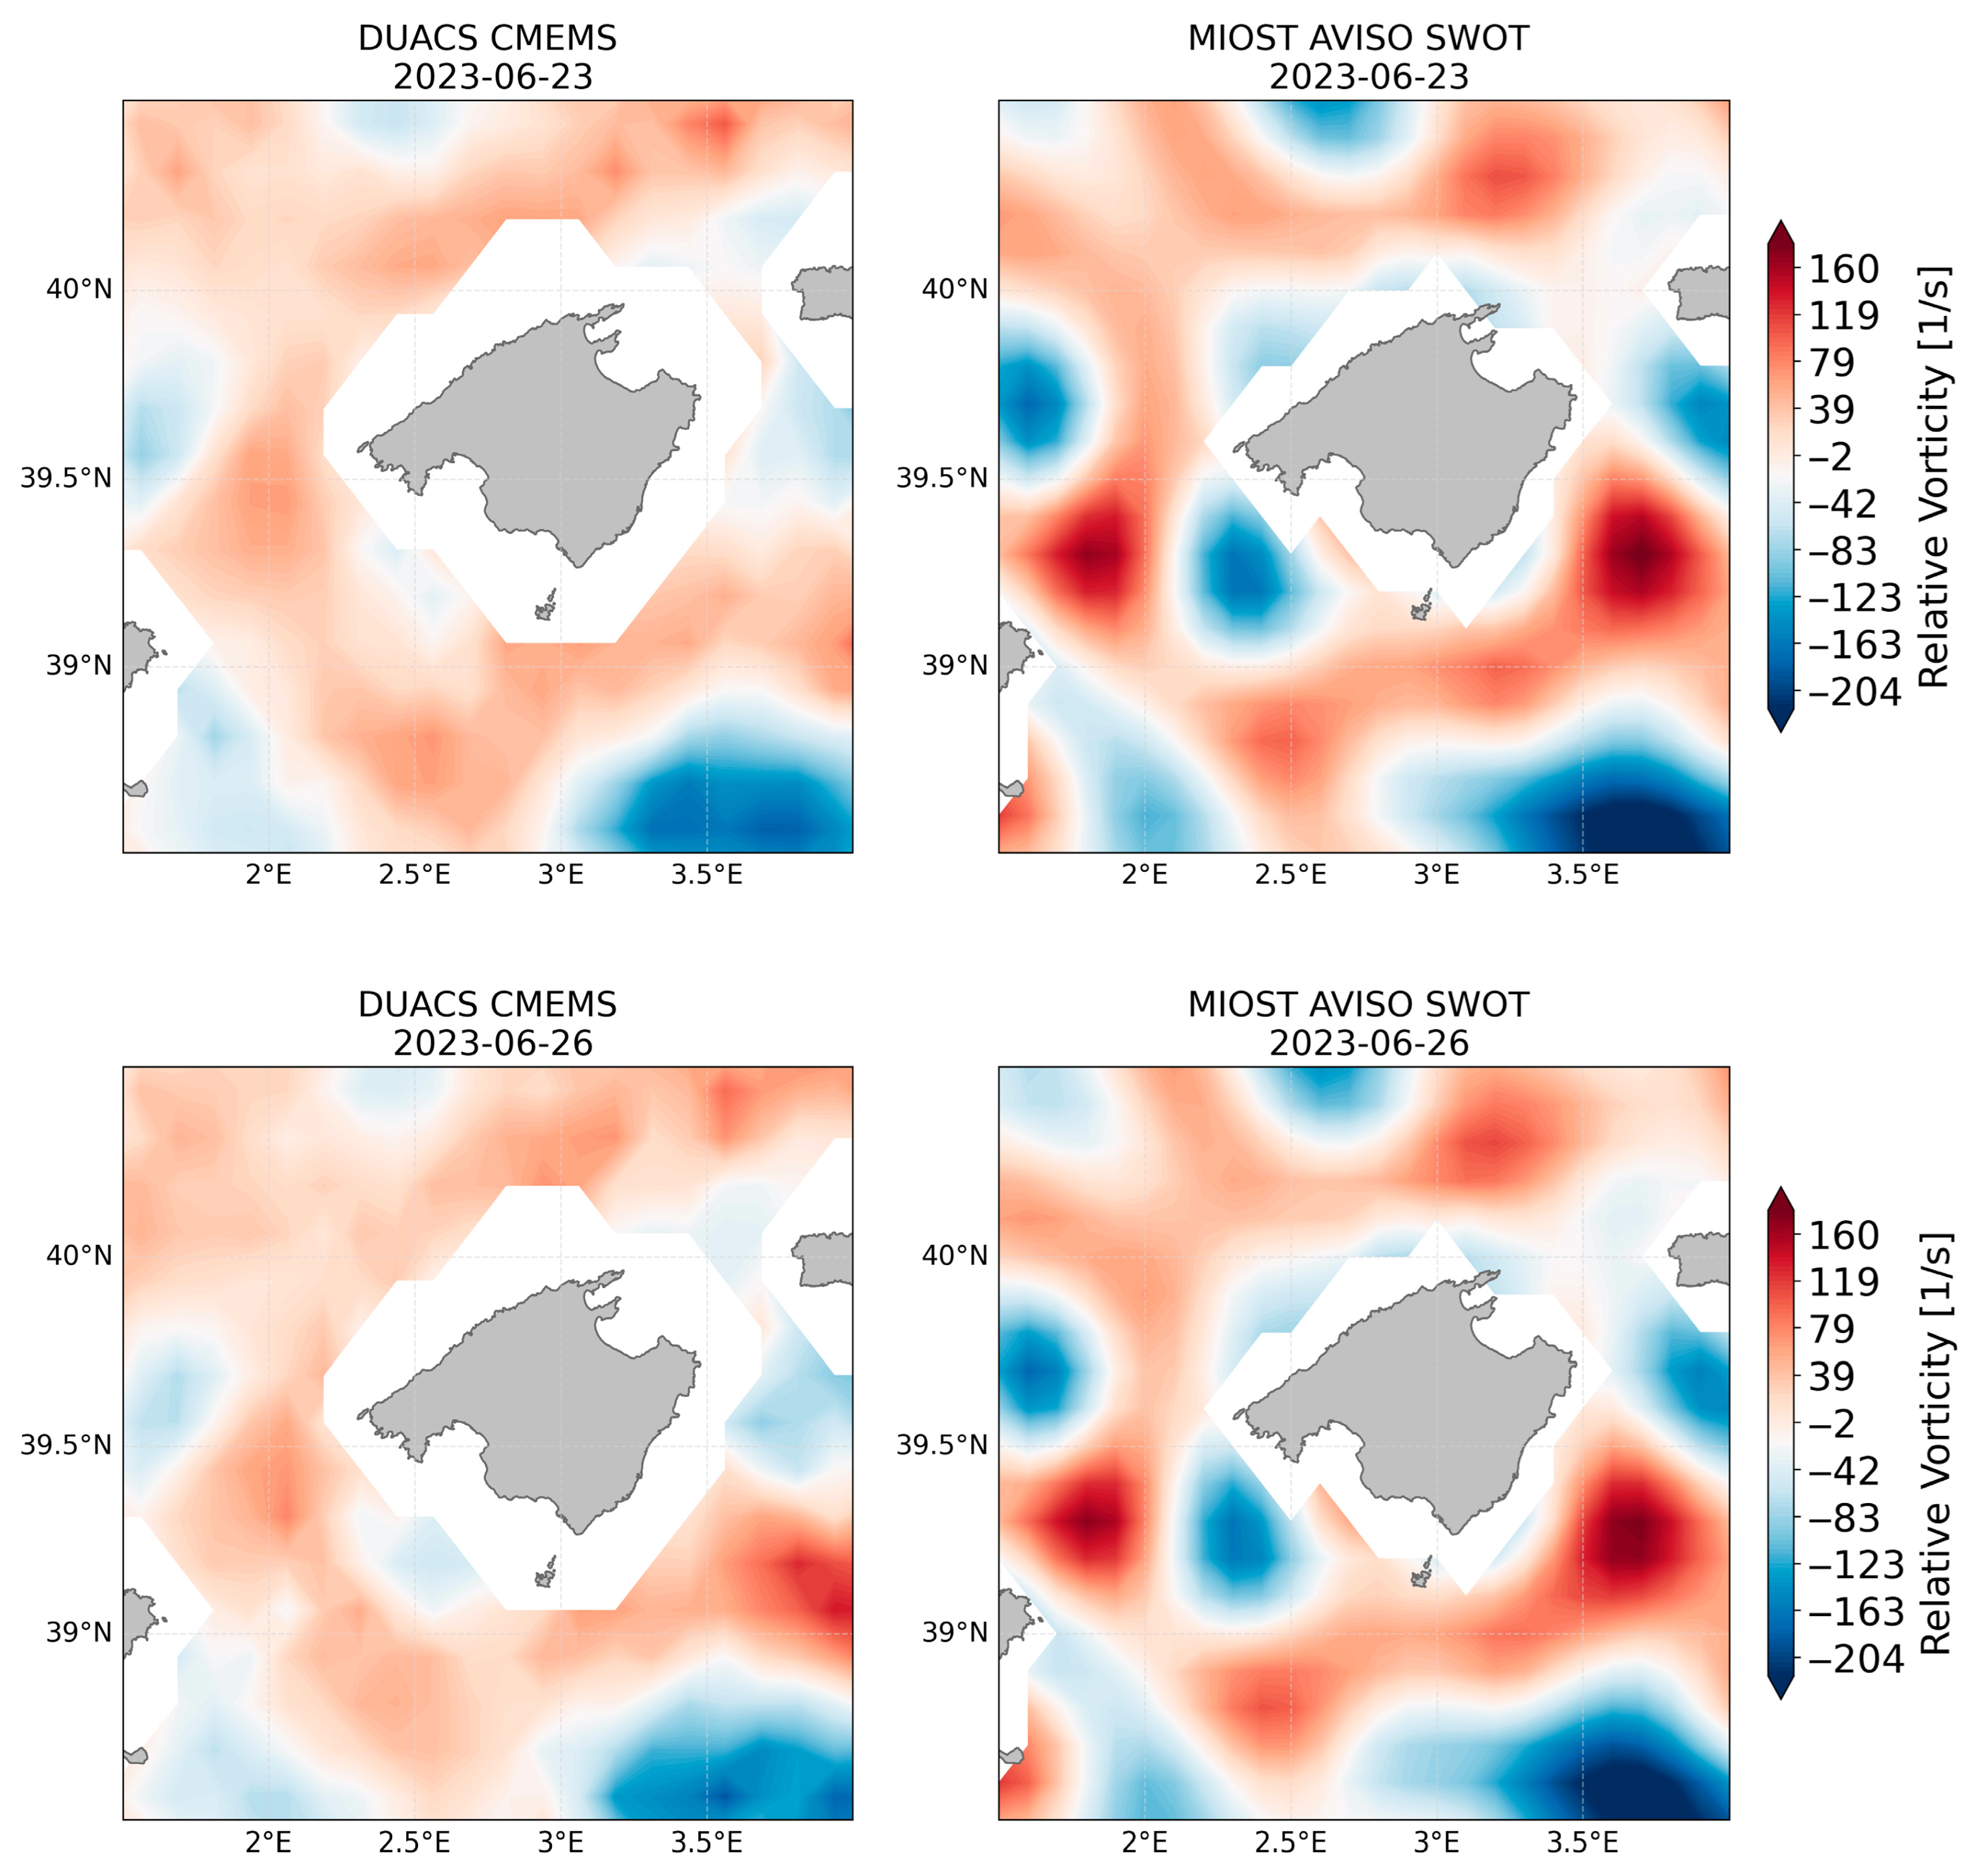
4.1.3. Relative Vorticity
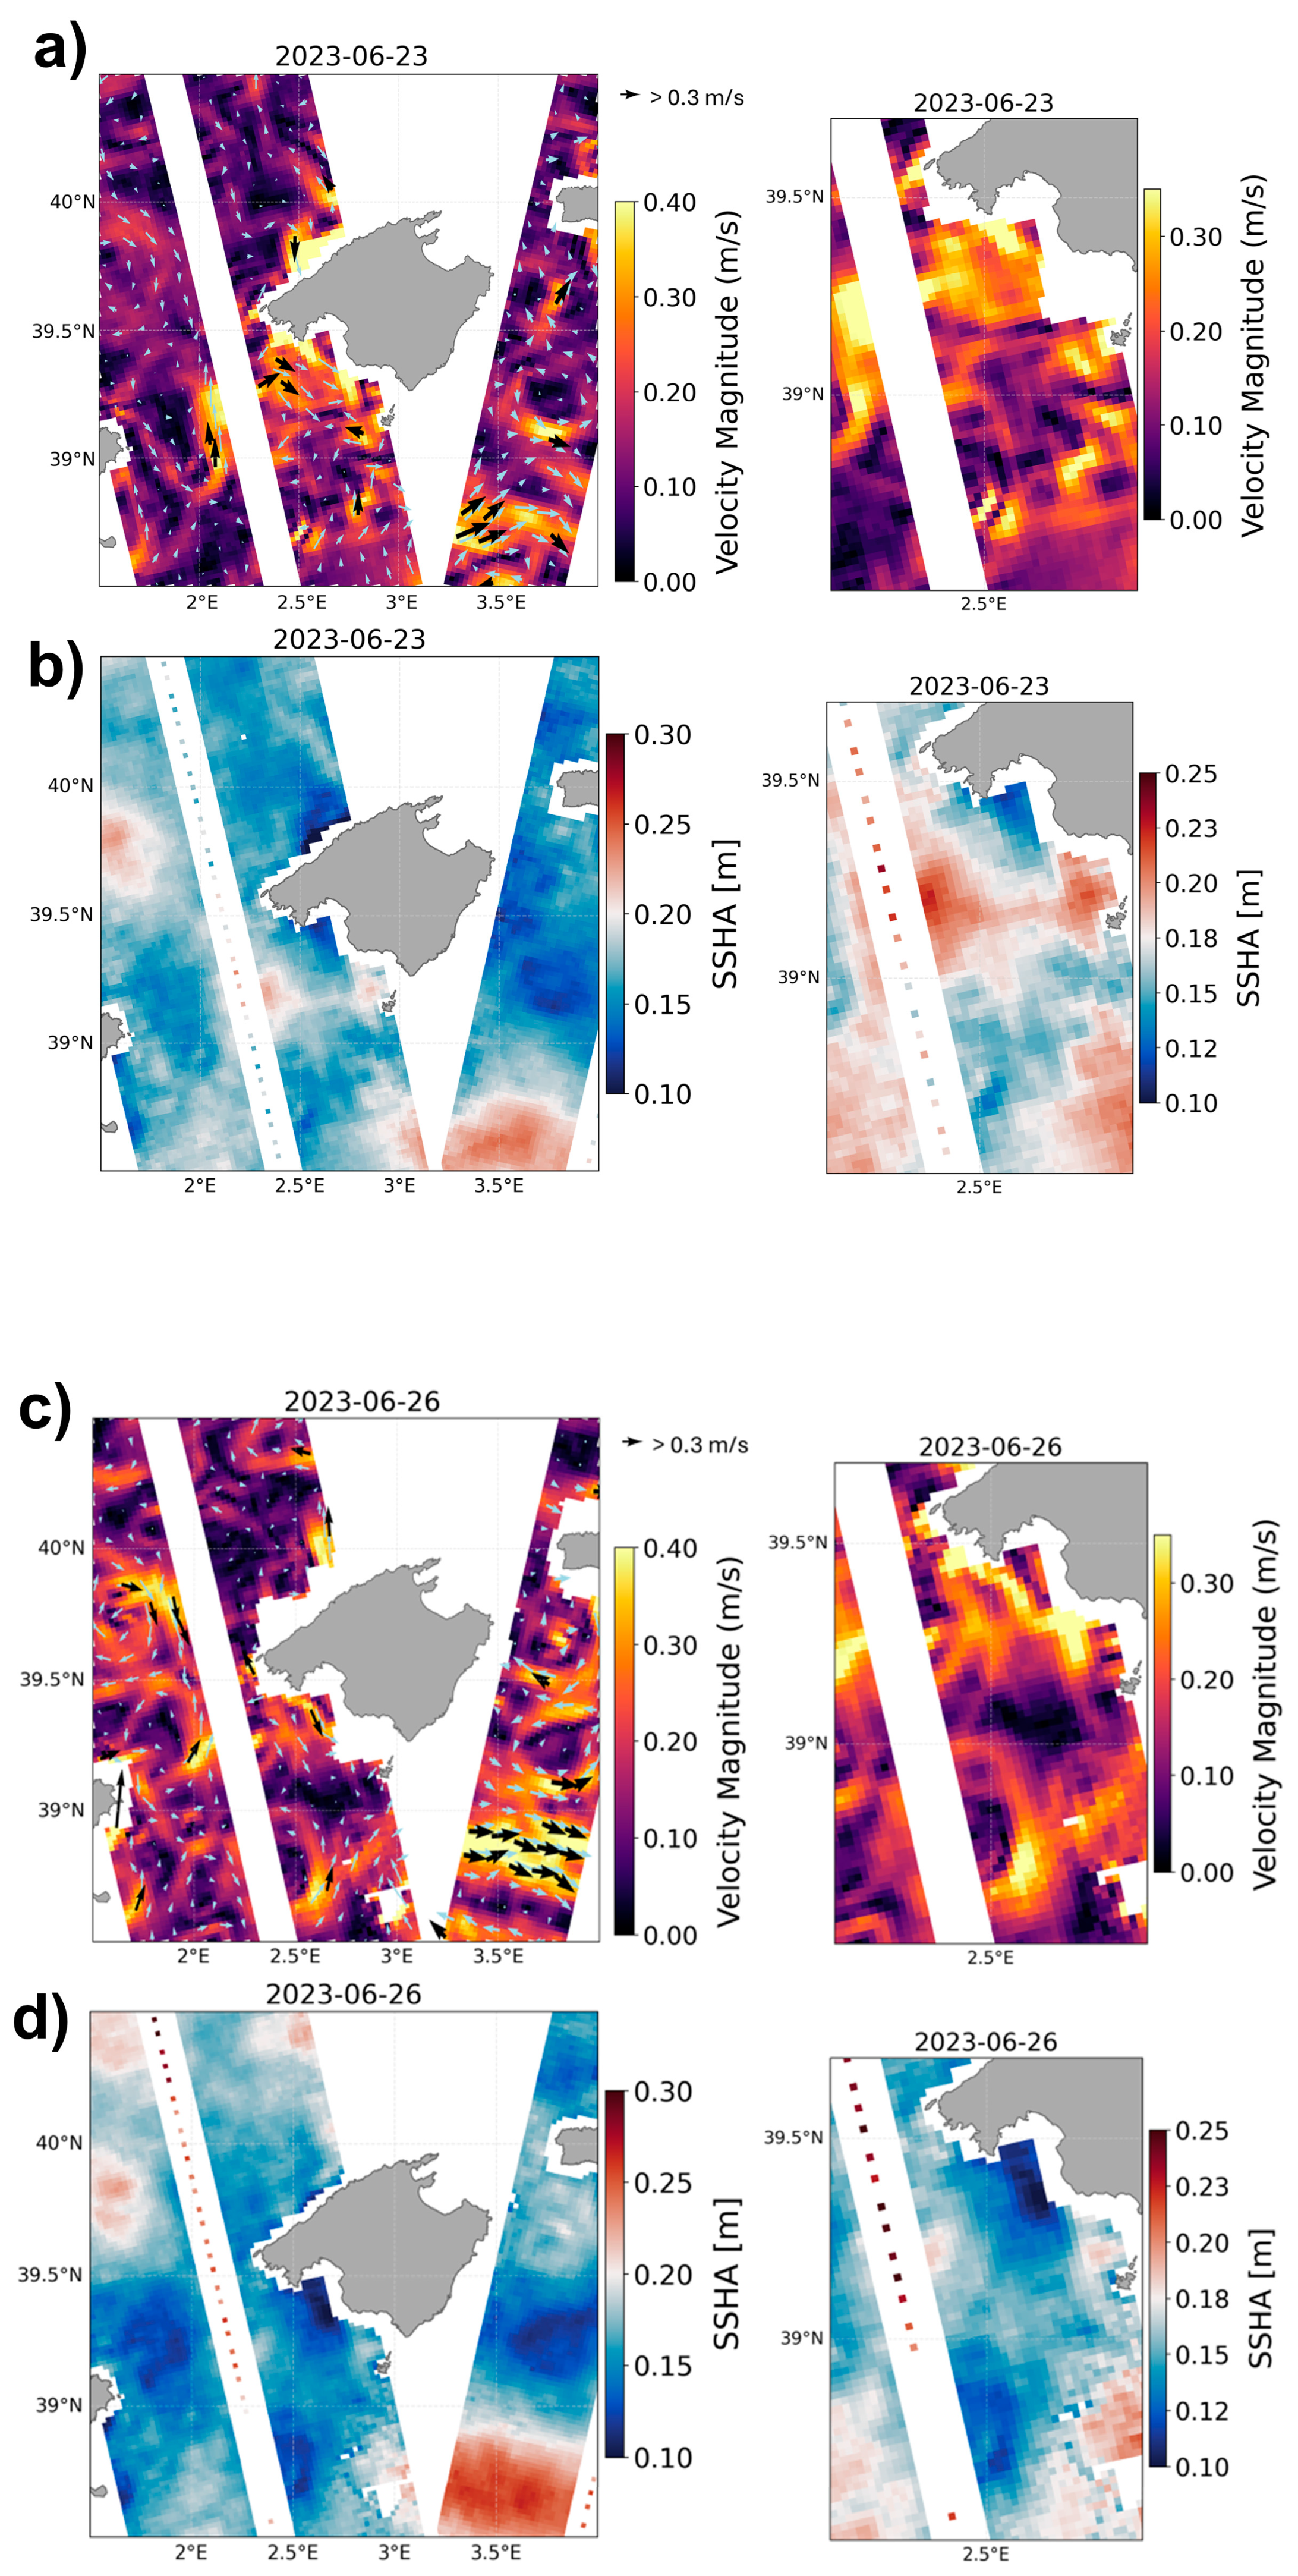
4.2. Comparison Between Gridded and Along-Track SWOT Data
4.3. Comparison Between SWOT L3 Product and Ocean Color Imagery
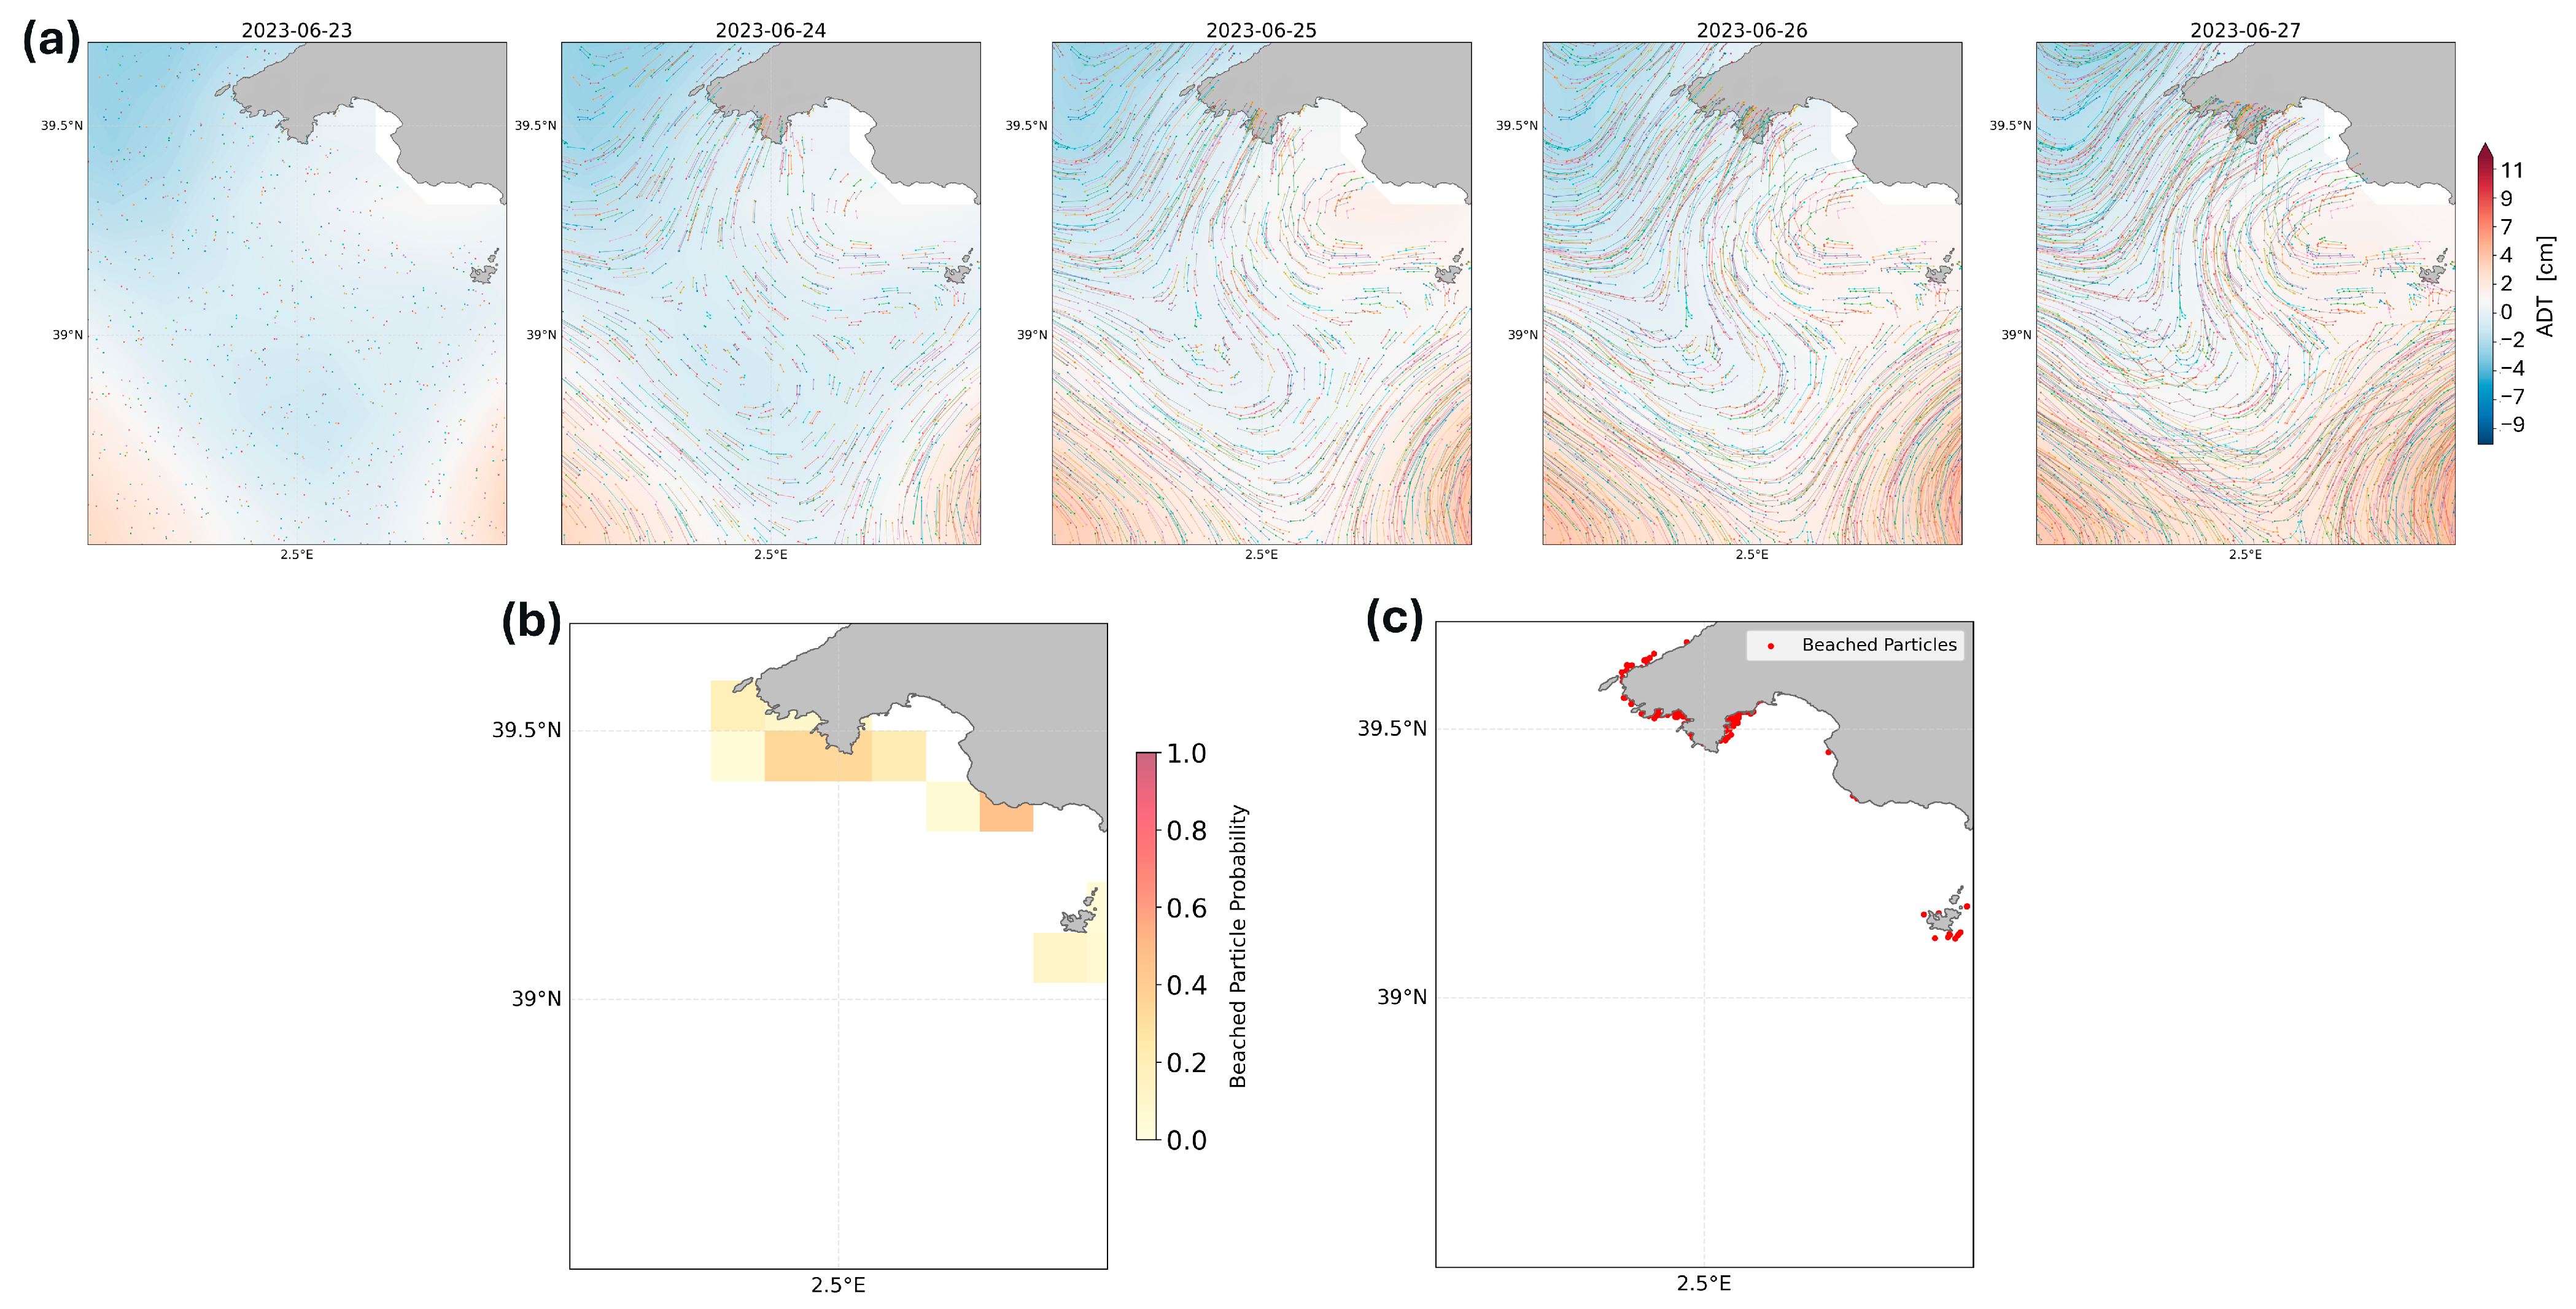
4.4. Lagrangian Simulations and Eddy Dynamics
5. Discussion
6. Conclusions
Supplementary Materials
Author Contributions
Funding
Data Availability Statement
Acknowledgments
Conflicts of Interest
References
- Chelton, D.B.; Schlax, M.G.; Samelson, R.M. Global observations of nonlinear mesoscale eddies. Prog. Oceanogr. 2011, 91, 167–216. [Google Scholar] [CrossRef]
- Cotroneo, Y.; Budillon, G.; Fusco, G.; Spezie, G. Cold core eddies and fronts of the Antarctic Circumpolar Current south of New Zealand from in situ and satellite data. J. Geophys. Res. Ocean. 2013, 118, 2653–2666. [Google Scholar] [CrossRef]
- Dong, C.; McWilliams, J.C.; Liu, Y.; Chen, D. Global heat and salt transports by eddy movement. Nat. Commun. 2014, 5, 3294. [Google Scholar] [CrossRef] [PubMed]
- Gaube, P.; McGillicuddy, D.J., Jr.; Chelton, D.B.; Behrenfeld, M.J.; Strutton, P.G. Regional variations in the influence of mesoscale eddies on near-surface chlorophyll. J. Geophys. Res. Ocean. 2014, 119, 8195–8220. [Google Scholar] [CrossRef]
- Gaube, P.; McGillicuddy, D.J. The influence of Gulf Stream eddies and meanders on near-surface chlorophyll. Deep Sea Res. Part I Oceanogr. Res. Pap. 2017, 122, 1–16. [Google Scholar] [CrossRef]
- Kahru, M.; Mitchell, B.G.; Gille, S.T.; Hewes, C.D.; Holm-Hansen, O. Eddies enhance biological production in the Weddell-Scotia confluence of the Southern Ocean. Geophys. Res. Lett. 2007, 34, L14601. [Google Scholar] [CrossRef]
- Mahadevan, A.; Archer, D. Modeling the impact of fronts and mesoscale circulation on the nutrient supply and biogeochemistry of the upper ocean. J. Geophys. Res. 2000, 105, 1209–1225. [Google Scholar] [CrossRef]
- Nagai, T.; Gruber, N.; Frenzel, H.; Lachkar, Z.; McWilliams, J.C.; Plattner, G.-K. Dominant role of eddies and filaments in the offshore transport of carbon and nutrients in the California Current System. J. Geophys. Res. Ocean. 2015, 120, 5318–5341. [Google Scholar] [CrossRef]
- Siegel, D.A.; Peterson, P.; McGillicuddy, D.J., Jr.; Maritorena, S.; Nelson, N.B. Bio-optical footprints created by mesoscale eddies in the Sargasso Sea. Geophys. Res. Lett. 2011, 38, L13605. [Google Scholar] [CrossRef]
- Wang, Y.; Zhang, H.-R.; Chai, F.; Yuan, Y. Impact of mesoscale eddies on chlorophyll variability off the coast of Chile. PLoS ONE 2018, 13, e0203598. [Google Scholar] [CrossRef] [PubMed]
- Zhang, Z.; Wang, W.; Qiu, B. Oceanic mass transport by mesoscale eddies. Science 2014, 345, 322–324. [Google Scholar] [CrossRef] [PubMed]
- Lévy, M. The modulation of biological production by oceanic mesoscale turbulence. In Transport in Geophysical Flow: Ten Years After; Weiss, J.B., Provenzale, A., Eds.; Springer: Berlin/Heidelberg, Germany, 2008; Volume 744, pp. 219–261. [Google Scholar] [CrossRef]
- McGillicuddy, D.J., Jr.; Robinson, A.R.; Siegel, D.A.; Jannasch, H.W.; Johnson, R.; Dickey, T.D.; McNeil, J.; Michaels, A.F.; Knap, A.H. Influence of mesoscale eddies on new production in the Sargasso Sea. Nature 1998, 394, 263–265. [Google Scholar] [CrossRef]
- Volkov, D.L.; Lee, T.; Fu, L.-L. Eddy-induced meridional heat transport in the ocean. Geophys. Res. Lett. 2008, 35, L20601. [Google Scholar] [CrossRef]
- Bouffard, J.; Renault, L.; Ruiz, S.; Pascual, A.; Dufau, C.; Tintoré, J. Subsurface small-scale eddy dynamics from multi-sensor observations and modeling. Prog. Oceanogr. 2012, 106, 62–79. [Google Scholar] [CrossRef]
- Fu, L.L.; Chelton, D.B.; Le Traon, Y.; Morrow, R. Eddy dynamics from satellite altimetry. Oceanography 2010, 23, 14–25. Available online: http://www.jstor.org/stable/24860859 (accessed on 20 November 2024). [CrossRef]
- Fu, L.L.; Alsdorf, D.; Rodriguez, E.; Morrow, R.; Mognard, N.; Lambin, J.; Lafon, T. The SWOT (Surface Water and Ocean Topography) mission: Spaceborne radar interferometry for oceanographic and hydrological applications. In Proceedings of the OceanObs’09: Sustained Ocean Observations and Information for Society, Venice, Italy, 21–25 September 2009; Volume 9, pp. 21–25. [Google Scholar]
- Brach, L.; Deixonne, P.; Bernard, M.-F.; Durand, E.; Desjean, M.-C.; Perez, E.; Lambert, C.; Sire, O.; Baudrimont, M.; Gasperi, J.; et al. Mesoscale anticyclonic eddies increase accumulation of microplastic in the North Atlantic subtropical gyre. Mar. Pollut. Bull. 2018, 126, 191–196. [Google Scholar] [CrossRef] [PubMed]
- Condie, S.; Condie, R. Retention of plankton within ocean eddies. Glob. Ecol. Biogeogr. 2016, 25, 1274–1286. [Google Scholar] [CrossRef]
- Krom, M.D.; Brenner, S.; Kress, N.; Neori, A.; Gordon, L.I. Nutrient dynamics and new production in a warm-core eddy from the eastern Mediterranean Sea. Deep Sea Res. Part A Oceanogr. Res. Pap. 1992, 39, 467–480. [Google Scholar] [CrossRef]
- Salihoğlu, İ.; Saydam, C.; Başturk, O.; Yilmaz, K.; Gocmen, D.; Hatipoğlu, E.; Yilmaz, A. Transport and distribution of nutrients and chlorophyll-a by mesoscale eddies in the northeastern Mediterranean. Mar. Chem. 1990, 29, 375–390. [Google Scholar] [CrossRef]
- Lobel, P.S.; Robinson, A.R. Transport and entrapment of fish larvae by ocean mesoscale eddies and currents in Hawaiian waters. Deep Sea Res. Part A Oceanogr. Res. Pap. 1986, 33, 483–500. [Google Scholar] [CrossRef]
- Sabates, A.; Salat, J.; Palomera, I.; Emelianov, M.; Fernandez de Puelles, M.L.; Olivar, M.P. Advection of anchovy (Engraulis encrasicolus) larvae along the Catalan continental slope (NW Mediterranean). Fish. Oceanogr. 2007, 16, 130–141. [Google Scholar] [CrossRef]
- Sabates, A.; Salat, J.; Raya, V.; Emelianov, M. Role of mesoscale eddies in shaping the spatial distribution of the coexisting Engraulis encrasicolus and Sardinella aurita larvae in the northwestern Mediterranean. J. Mar. Syst. 2013, 111, 108–119. [Google Scholar] [CrossRef]
- Gaube, P.; Barceló, C.; McGillicuddy, D.J., Jr.; Domingo, A.; Miller, P.; Giffoni, B.; Marcovaldi, N.; Swimmer, Y. The use of mesoscale eddies by juvenile loggerhead sea turtles (Caretta caretta) in the southwestern Atlantic. PLoS ONE 2017, 12, e0172839. [Google Scholar] [CrossRef] [PubMed]
- Gaube, P.; Braun, C.D.; Lawson, G.L.; McGillicuddy, D.J., Jr.; Penna, A.D.; Skomal, G.B.; Fischer, C.; Thorrold, S.R. Mesoscale eddies influence the movements of mature female white sharks in the Gulf Stream and Sargasso Sea. Sci. Rep. 2018, 8, 7363. [Google Scholar] [CrossRef] [PubMed]
- Roda, S.B.; Rotger, A.; Santangeli, A.; Tavecchia, G.; Sola, A.; Catchot, S.; Sanz-Aguilar, A. Coping with ocean dynamics: Foraging strategy and implications for conservation of a small petrel. Biol. Conserv. 2025, 302, 110913. [Google Scholar] [CrossRef]
- Sánchez-Román, A.; Gómez-Navarro, L.; Fablet, R.; Oro, D.; Mason, E.; Arcos, J.M.; Ruiz, S.; Pascual, A. Rafting behaviour of seabirds as a proxy to describe surface ocean currents in the Balearic Sea. Sci. Rep. 2019, 9, 17775. [Google Scholar] [CrossRef] [PubMed]
- Gomez-Navarro, L.; Sánchez-Román, A.; Pascual, A.; Fablet, R.; Hernandez-Carrasco, I.; Mason, E.; Oro, D. Seabird drift as a proxy to estimate surface currents in the western Mediterranean? In EGU General Assembly Conference Abstracts; European Geosciences Union: Vienna, Austria, 2017; p. 9548. Available online: https://www.researchgate.net/publication/318211642_Seabird_drift_as_a_proxy_to_estimate_surface_currents_in_the_western_Mediterranean (accessed on 20 November 2024).
- Morrow, R.; Le Traon, P.-Y. Recent advances in observing mesoscale ocean dynamics with satellite altimetry. J. Adv. Space Res. 2011, 47, 1067–1082. [Google Scholar] [CrossRef]
- Lehahn, Y.; d’Ovidio, F.; Levy, M.; Heifetz, E. Stirring of the Northeast Atlantic spring bloom: A Lagrangian analysis based on multisatellite data. J. Geophys. Res. 2007, 112, C08005. [Google Scholar] [CrossRef]
- Ducet, N.; Le Traon, P.Y.; Reverdin, G. Global high-resolution mapping of ocean circulation from TOPEX/Poseidon and ERS-1 and -2. J. Geophys. Res. Ocean. 2000, 105, 19477–19498. [Google Scholar] [CrossRef]
- Dussurget, R.; Birol, F.; Morrow, R.A.; De Mey, P. Fine resolution altimetry data for a regional application in the Bay of Biscay. Mar. Geod. 2011, 34, 447–476. [Google Scholar] [CrossRef]
- Pascual, A.; Pujol, M.I.; Larnicol, G.; Le Traon, P.Y.; Rio, M.H. Mesoscale mapping capabilities of multisatellite altimeter missions: First results with real data in the Mediterranean Sea. J. Mar. Syst. 2007, 65, 190–211. [Google Scholar] [CrossRef]
- Pascual, A.; Faugère, Y.; Larnicol, G.; Le Traon, P.Y. Improved description of the ocean mesoscale variability by combining four satellite altimeters. Geophys. Res. Lett. 2006, 33. [Google Scholar] [CrossRef]
- Morrow, R.; Fu, L.-L.; Ardhuin, F.; Benkiran, M.; Chapron, B.; Cosme, E.; D’Ovidio, F.; Farrar, J.T.; Gille, S.T.; Lapeyre, G.; et al. Global observations of fine-scale ocean surface topography with the surface water and ocean topography (SWOT) mission. Front. Mar. Sci. 2019, 6, 232. [Google Scholar] [CrossRef]
- Fu, L.L.; Pavelsky, T.; Cretaux, J.F.; Morrow, R.; Farrar, J.T.; Vaze, P.; Dibarboure, G. The surface water and ocean topography mission: A breakthrough in radar remote sensing of the ocean and land surface water. Geophys. Res. Lett. 2024, 51, e2023GL107652. [Google Scholar] [CrossRef]
- Verger Miralles, E.; Mourre, B.; Barceló Llull, B.; Casas Pérez, B.; Combes, V.; Cutolo, E.; Pascual Ascaso, A. Study of fine-scale dynamics in the Balearic Sea through high-resolution observations and SWOT satellite data. Instrum. Viewp. 2024, 23, 21–22. Available online: https://hdl.handle.net/2117/411406 (accessed on 20 November 2024).
- Mourre, B.; Verger-Miralles, E.; Gómez-Navarro, L.; Barceló-Llull, B.; Casas, B.; Combes, V.; Cutolo, E.; Diaz-Barroso, L.; Garcia-Jove, M.; Lizarrán, I.; et al. FaSt-SWOT field campaigns combining high-resolution observations and modelling for SWOT validation in the Western Mediterranean Sea. In EGU General Assembly Conference Abstracts; European Geosciences Union: Vienna, Austria, 2024; p. 11336. [Google Scholar] [CrossRef]
- Pascual, A.; Mourre, B.; Balaguer, P.; Barceló-Llull, B.; Calafat, N.; Casas, B.; Combes, V.; Cutolo, E.; Díaz-Barroso, L.; Fernández, J.G.; et al. Fine-Scale Ocean Currents from Integrated Multi-Platform Experiments and Numerical Simulations: Contribution to the New SWOT Satellite Mission (FaSt-SWOT, PID2021-122417NB-I00); Cruise Plan; IMEDEA (CSIC-UIB): Esporles, Spain, 2023. [Google Scholar]
- Gómez-Navarro, L.; Cosme, E.; Le Sommer, J.; Papadakis, N.; Pascual, A. Development of an image de-noising method in preparation for the surface water and ocean topography satellite mission. Remote Sens. 2020, 12, 734. [Google Scholar] [CrossRef]
- Gómez-Navarro, L.; Fablet, R.; Mason, E.; Pascual, A.; Mourre, B.; Cosme, E.; Le Sommer, J. SWOT spatial scales in the western Mediterranean Sea derived from pseudo-observations and an Ad Hoc filtering. Remote Sens. 2018, 10, 599. [Google Scholar] [CrossRef]
- Aguiar, E.; Mourre, B.; Alvera-Azcárate, A.; Pascual, A.; Mason, E.; Tintoré, J. Strong long-lived anticyclonic mesoscale eddies in the Balearic Sea: Formation, intensification, and thermal impact. J. Geophys. Res. Ocean. 2022, 127, e2021JC017589. [Google Scholar] [CrossRef]
- Pessini, F.; Cotroneo, Y.; Olita, A.; Sorgente, R.; Ribotti, A.; Jendersie, S.; Perilli, A. Life history of an anticyclonic eddy in the Algerian basin from altimetry data, tracking algorithm and in situ observations. J. Mar. Syst. 2020, 207, 103346. [Google Scholar] [CrossRef]
- Cotroneo, Y.; Aulicino, G.; Ruiz, S.; Sánchez Román, A.; Torner Tomàs, M.; Pascual, A.; Budillon, G. Glider data collected during the Algerian basin circulation unmanned survey. Earth Syst. Sci. Data 2019, 11, 147–161. [Google Scholar] [CrossRef]
- Cotroneo, Y.; Aulicino, G.; Ruiz, S.; Pascual, A.; Budillon, G.; Fusco, G.; Tintoré, J. Glider and satellite high resolution monitoring of a mesoscale eddy in the Algerian basin: Effects on the mixed layer depth and biochemistry. J. Mar. Syst. 2016, 162, 73–88. [Google Scholar] [CrossRef]
- Aulicino, G.; Cotroneo, Y.; Ruiz, S.; Román, A.S.; Pascual, A.; Fusco, G.; Tamburini, A.; Budillon, G. Glider, satellite altimetry and numerical simulations for the monitoring of the Algerian Basin along a SARAL/AltiKa track. J. Mar. Syst. 2018, 179, 55–71. [Google Scholar] [CrossRef]
- Pascual, A.; Buongiorno Nardelli, B.; Larnicol, G.; Emelianov, M.; Gomis, D. A case of an intense anticyclonic eddy in the Balearic Sea (western Mediterranean). J. Geophys. Res. 2002, 107, 3183. [Google Scholar] [CrossRef]
- Bouffard, J.; Pascual, A.; Ruiz, S.; Faugère, Y.; Tintoré, J. Coastal and mesoscale dynamics characterization in the Balearic Sea. J. Geophys. Res. 2010, 115, C10029. [Google Scholar] [CrossRef]
- Malanotte-Rizzoli, P.; Artale, V.; Borzelli-Eusebi, G.L.; Brenner, S.; Crise, A.; Gacic, M.; Kress, N.; Marullo, S.; Ribera d’alcalà, M.; Sofianos, S.; et al. Physical forcing and physical/biochemical variability of the Mediterranean Sea: A review of unresolved issues and directions for future research. Ocean Sci. 2014, 10, 281–322. [Google Scholar] [CrossRef]
- Millot, C. Circulation in the Western Mediterranean Sea. J. Mar. Syst. 1999, 20, 423–442. [Google Scholar] [CrossRef]
- Millot, C.; Taupier-Letage, I. Circulation in the Mediterranean Sea. In The Mediterranean Sea. Handbook of Environmental Chemistry; Saliot, A., Ed.; Springer: Berlin/Heidelberg, Germany, 2005; Volume 5K, pp. 29–66. [Google Scholar] [CrossRef]
- López García, M.J.; Millot, C.; Font, J.; García-Ladona, E. Surface circulation variability in the Balearic Basin. J. Geophys. Res. 1994, 99, 3285–3296. [Google Scholar] [CrossRef]
- La Violette, P.E.; Tintoré, J.; Font, J. The surface circulation of the Balearic Sea. J. Geophys. Res. 1990, 95, 1559–1568. [Google Scholar] [CrossRef]
- Wang, F.; Vieira, M.; Salat, J.; Tintoré, J.; La Violette, P.E. A shelf/slope filament off the Northeast Spanish Coast. J. Mar. Res. 1988, 46, 321–332. Available online: https://elischolar.library.yale.edu/journal_of_marine_research/1891 (accessed on 20 November 2024). [CrossRef]
- Pinot, J.M.; López-Jurado, J.L.; Riera, M. The CANALES experiment (1996–1998). Interannual, seasonal, and mesoscale variability of the circulation in the Balearic Channels. Prog. Oceanogr. 2002, 55, 335–370. [Google Scholar] [CrossRef]
- Tintoré, J.; Wang, D.P.; La Violette, P.E. Eddies and thermohaline intrusions of the shelf/slope front off Northeast Spain. J. Geophys. Res. 1990, 95, 1627–1633. [Google Scholar] [CrossRef]
- Pascual, A.; Gomis, D.; Haney, R.L.; Ruiz, S. A quasigeostrophic analysis of a meander in the Palamós canyon: Vertical velocity, geopotential tendency and a relocation technique. J. Phys. Oceanogr. 2004, 34, 2274–2287. [Google Scholar] [CrossRef]
- Rubio, A.; Barnier, B.; Jordà, G.; Espino, M.; Marsaleix, P. Origin and dynamics of mesoscale eddies in the Catalan Sea (NW Mediterranean): Insight from a numerical model study. J. Geophys. Res. 2009, 114, C06009. [Google Scholar] [CrossRef]
- Volpe, G.; Colella, S.; Brando, V.E.; Forneris, V.; Padula, F.L.; Cicco, A.D.; Santoleri, R. Mediterranean ocean colour Level 3 operational multi-sensor processing. Ocean Sci. 2019, 15, 127–146. [Google Scholar] [CrossRef]
- Pujol, M.-I.; Faugère, Y.; Taburet, G.; Dupuy, S.; Pelloquin, C.; Ablain, M.; Picot, N. DUACS DT2014: The new multi-mission altimeter data set reprocessed over 20 years. Ocean Sci. 2016, 12, 1067–1090. [Google Scholar] [CrossRef]
- Ubelmann, C.; Dibarboure, G.; Gaultier, L.; Ponte, A.; Ardhuin, F.; Ballarotta, M.; Faugère, Y. Reconstructing ocean surface current combining altimetry and future spaceborne Doppler data. J. Geophys. Res. Ocean. 2021, 126, e2020JC016560. [Google Scholar] [CrossRef]
- Ubelmann, C.; Carrere, L.; Durand, C.; Dibarboure, G.; Faugère, Y.; Ballarotta, M.; Briol, F.; Lyard, F. Simultaneous estimation of ocean mesoscale and coherent internal tide sea surface height signatures from the global altimetry record. Ocean Sci. 2022, 18, 469–481. [Google Scholar] [CrossRef]
- Ballarotta, M.; Ubelmann, C.; Bellemin-Laponnaz, V.; Le Guillou, F.; Meda, G.; Anadon, C.; Dibarboure, G. Assimilation of wide-swath altimetry in level-4 multi-mission satellite maps. Ocean Sci. 2025, 21, 63–80. [Google Scholar] [CrossRef]
- OceanParcels Project. What Is Oceanparcels? Available online: http://oceanparcels.org/ (accessed on 16 October 2019).
- Delandmeter, P.; van Sebille, E. The Parcels v2.0 Lagrangian framework: New field interpolation schemes. Geosci. Model Dev. 2019, 12, 3571–3584. [Google Scholar] [CrossRef]
- Butcher, J.C. Numerical Methods for Ordinary Differential Equations, 3rd ed.; John Wiley & Sons: Hoboken, NJ, USA, 2016. [Google Scholar] [CrossRef]
- Ioannou, A.; Zervakis, V.; Tzortziou, M. Cyclostrophic corrections of AVISO/DUACS surface velocities and its application to mesoscale eddies in the Mediterranean Sea. J. Geophys. Res. Ocean. 2019, 124, 8995–9012. [Google Scholar] [CrossRef]
- Lévy, M.; Klein, P.; Treguier, A.-M. Impact of sub-mesoscale physics on production and subduction of phytoplankton in an oligotrophic regime. J. Mar. Res. 2001, 59, 535–565. [Google Scholar] [CrossRef]
- Rossi, V.; Ser-Giacomi, E.; López, C.; Hernández-García, E. Hydrodynamic provinces and oceanic connectivity from a transport network help designing marine reserves. Geophys. Res. Lett. 2014, 41, 2883–2891. [Google Scholar] [CrossRef]
- Beron-Vera, F.J.; Wang, Y.; Olascoaga, M.J.; Goni, G.J.; Haller, G. Objective detection of oceanic eddies and the Agulhas leakage. J. Phys. Oceanogr. 2013, 43, 1426–1438. [Google Scholar] [CrossRef]
- McWilliams, J.C. Submesoscale currents in the ocean. Proc. R. Soc. A Math. Phys. Eng. Sci. 2016, 472, 20160117. [Google Scholar] [CrossRef] [PubMed]
- Mahadevan, A. The impact of submesoscale physics on primary productivity of plankton. Annu. Rev. Mar. Sci. 2016, 8, 161–184. [Google Scholar] [CrossRef] [PubMed]
- Vignudelli, S.; Kostianoy, A.G.; Cipollini, P.; Benveniste, J. (Eds.) Coastal Altimetry; Springer Science and Business Media: Berlin/Heidelberg, Germany, 2011; pp. 3–50. [Google Scholar] [CrossRef]
- Dibarboure, G.; Boy, F.; Desjonqueres, J.D.; Labroue, S.; Lasne, Y.; Picot, N.; Poisson, J.C.; Thibaut, P. Investigating short-wavelength correlated errors on low-resolution mode altimetry. J. Atmos. Ocean. Technol. 2014, 31, 1337–1362. [Google Scholar] [CrossRef]
- Barceló-Llull, B.; Pascual, A. Recommendations for the design of in situ sampling strategies to reconstruct fine-scale ocean currents in the context of SWOT satellite mission. Front. Mar. Sci. 2023, 10, 1082978. [Google Scholar] [CrossRef]
- Tintoré, J.; Pinardi, N.; Álvarez-Fanjul, E.; Aguiar, E.; Álvarez-Berastegui, D.; Bajo, M.; Balbin, R.; Bozzano, R.; Nardelli, B.B.; Cardin, V.; et al. Challenges for sustained observing and forecasting systems in the Mediterranean Sea. Front. Mar. Sci. 2019, 6, 568. [Google Scholar] [CrossRef]
- Escudier, R.; Renault, L.; Pascual, A.; Brasseur, P.; Chelton, D.; Beuvier, J. Eddy properties in the Western Mediterranean Sea from satellite altimetry and a numerical simulation. J. Geophys. Res. Ocean. 2016, 121, 3990–4006. [Google Scholar] [CrossRef]
- Mason, E.; Pascual, A. Multiscale variability in the Balearic Sea: An altimetric perspective. J. Geophys. Res. Ocean. 2013, 118, 3007–3025. [Google Scholar] [CrossRef]
- Barceló-Llull, B.; Pascual, A.; Sánchez-Román, A.; Cutolo, E.; d’Ovidio, F.; Fifani, G.; Ser-Giacomi, E.; Ruiz, S.; Mason, E.; Cyr, F.; et al. Fine-scale ocean currents derived from in situ observations in anticipation of the upcoming SWOT altimetric mission. Front. Mar. Sci. 2021, 8, 679844. [Google Scholar] [CrossRef]
- De Mey-Frémaux, P.; Ayoub, N.; Barth, A.; Brewin, R.; Charria, G.; Campuzano, F.; Ciavatta, S.; Cirano, M.; Edwards, C.A.; Federico, I.; et al. Model-observations synergy in the coastal ocean. Front. Mar. Sci. 2019, 6, 436. [Google Scholar] [CrossRef]


| Abbreviation | Full Product Name | Processing Level | Temporal Resolution | Spatial Resolution | Source/Processor |
|---|---|---|---|---|---|
| DUACS CMEMS | European Seas Gridded L4 Sea Surface Heights and Derived Variables (NRT) | L4 | Daily | 1/8° × 1/8° | CMEMS/DUACS |
| MIOST AVISO+SWOT | Experimental multimission gridded L4 sea level heights and velocities with SWOT | L4 | Daily | 1/10° × 1/10° | CMEMS, AVISO, SSALTO/DUACS, CNES |
| Along-Track SWOT L3 | European Seas Along Track L3 Sea Surface Heights Reprocessed—Tailored for Data Assimilation | L3 | Along-track (varies by altimeter) | Along-track (varies by altimeter) | CMEMS, DUACS, AVISO, CNES |
| SWOT L3 | SWOT Level3 experimental products | L3 | Daily | 2 km × 2 km, covering the KaRIn swath | AVISO, DUACS, NASA/JPL, CNES |
Disclaimer/Publisher’s Note: The statements, opinions and data contained in all publications are solely those of the individual author(s) and contributor(s) and not of MDPI and/or the editor(s). MDPI and/or the editor(s) disclaim responsibility for any injury to people or property resulting from any ideas, methods, instructions or products referred to in the content. |
© 2025 by the authors. Licensee MDPI, Basel, Switzerland. This article is an open access article distributed under the terms and conditions of the Creative Commons Attribution (CC BY) license (https://creativecommons.org/licenses/by/4.0/).
Share and Cite
Fortunato, L.; Gómez-Navarro, L.; Combes, V.; Cotroneo, Y.; Aulicino, G.; Pascual, A. Coastal Eddy Detection in the Balearic Sea: SWOT Capabilities. Remote Sens. 2025, 17, 2552. https://doi.org/10.3390/rs17152552
Fortunato L, Gómez-Navarro L, Combes V, Cotroneo Y, Aulicino G, Pascual A. Coastal Eddy Detection in the Balearic Sea: SWOT Capabilities. Remote Sensing. 2025; 17(15):2552. https://doi.org/10.3390/rs17152552
Chicago/Turabian StyleFortunato, Laura, Laura Gómez-Navarro, Vincent Combes, Yuri Cotroneo, Giuseppe Aulicino, and Ananda Pascual. 2025. "Coastal Eddy Detection in the Balearic Sea: SWOT Capabilities" Remote Sensing 17, no. 15: 2552. https://doi.org/10.3390/rs17152552
APA StyleFortunato, L., Gómez-Navarro, L., Combes, V., Cotroneo, Y., Aulicino, G., & Pascual, A. (2025). Coastal Eddy Detection in the Balearic Sea: SWOT Capabilities. Remote Sensing, 17(15), 2552. https://doi.org/10.3390/rs17152552