Review

A Comprehensive Review of Mathematical Error Characterization and Mitigation Strategies in Terrestrial Laser Scanning

by
Mansoor Sabzali
* and
Lloyd Pilgrim
Surveying Discipline, School of Engineering, University of Newcastle, Callaghan, NSW 2308, Australia
*
Author to whom correspondence should be addressed.
Remote Sens. 2025, 17(14), 2528; https://doi.org/10.3390/rs17142528
Submission received: 23 May 2025 / Revised: 18 July 2025 / Accepted: 18 July 2025 / Published: 20 July 2025

Abstract

In recent years, there has been an increasing transition from 1D point-based to 3D point-cloud-based data acquisition for monitoring applications and deformation analysis tasks. Previously, many studies relied on point-to-point measurements using total stations to assess structural deformation. However, the introduction of terrestrial laser scanning (TLS) has commenced a new era in data capture with a high level of efficiency and flexibility for data collection and post processing. Thus, a robust understanding of both data acquisition and processing techniques is required to guarantee high-quality deliverables to geometrically separate the measurement uncertainty and movements. TLS is highly demanding in capturing detailed 3D point coordinates of a scene within either short- or long-range scanning. Although various studies have examined scanner misalignments under controlled conditions within the short range of observation (scanner calibration), there remains a knowledge gap in understanding and characterizing errors related to long-range scanning (scanning calibration). Furthermore, limited information on manufacturer-oriented calibration tests highlights the motivation for designing a user-oriented calibration test. This research focused on investigating four primary sources of error in the generic error model of TLS. These were categorized into four geometries: instrumental imperfections related to the scanner itself, atmospheric effects that impact the laser beam, scanning geometry concerning the setup and varying incidence angles during scanning, and object and surface characteristics affecting the overall data accuracy. This study presents previous findings of TLS calibration relevant to the four error sources and mitigation strategies and identified current challenges that can be implemented as potential research directions.

1. Introduction

To acquire high-quality TLS deliverables, the knowledge gained from research activities must enhance the overall expertise in advanced sensors that can be employed under various measurement conditions. Due to many intellectual property reasons, the information provided by the manufacturers to accomplish the factory-oriented accuracy assessment is very limited. On the other hand, according to the technical specifications stated by manufacturers, the application of TLS under these proposals can be guaranteed within a restricted range of observations. In other words, the precision presented for observations can be replicated within certain isolated manufacturing conditions [1]. Therefore, there is a requirement to validate the manufacturer-oriented calibration procedure using a robust user-oriented calibration procedure. However, rigorous user-designed calibration must be addressed at a more detailed level to improve the uncertainty of the measurements beyond the manufacturers’ specifications. As a result, distinguishing the error sources and their mitigation practices are two keys approaches to achieving the aims. From the literature, there are a number of reasons highlighting the importance of TLS calibration:
  • Manufacturers focus mostly on the subset of known systematic errors such as zero constant error or vertical index errors. However, more systematic errors have been identified that are worth investigating;
  • Instrument misalignments are generally determined under controlled laboratory circumstances by the manufacturers, away from normal measurement environments [2];
  • The need to return an instrument to the manufacturer for any form of calibration is an inefficient and often costly process for users of the technology [3];
  • The methodologies and parameters used by each manufacturer vary from instrument to instrument (from manufacturer to manufacturer) due to the differences in scanner construction [4];
  • The lack of a consistent standard or set of algorithms for TLS calibration has led to increasing research interest [5,6] (i.e., a standard deviation analysis comparing the instruments is required [7]).
Spatial (geometric 3D coordinates) and intensity (signal strength and return power) observations are two types of TLS deliverables. Similar to other geodetic measurements, TLS observations are prone to contamination as the result of any expected or unexpected deviations, which are called errors. Identification of the error sources (which can be systematic or non-systematic) and their relationships, on the one hand, and their corresponding mitigation practices, on the other hand, are the core focal points of the calibration process. It is also important to acknowledge the difference between the terms—verification, calibration, and validation—that are extensively used in the literature. The verification (also referring to evaluation) of TLS encompasses a comparison of the technical specifications provided by manufacturers with the definable and admissible maximum permissible error (MPE). A verification task is usually undertaken as an onsite instrumental evaluation by the TLS user to ensure that the employed TLS is prepared in accordance with the manufacturers’ specifications. Verification is considered as a pre-calibration assessment step. Calibration, on the other hand, focuses on the improvement in the quality of the acquired data by considering potential errors in the geometric error models, and, importantly, it determines the correction factors to the known error sources. Calibration requires more effort and detailed knowledge of spatial and optical principles, while verification can be simply completed by a non-complex scanning configuration without any reference back to the error sources [8]. Calibration also results in several advantages in addition to improving the quality of the point cloud (see examples in [5]). However, validation refers to the post-calibration task that aims to validate the physical existence of the misalignment in the geometric error model and the uniqueness of the calibration parameterization for different instruments [9,10,11].
A higher level of assessment and analysis (calibration) is required when the resulting data are assigned a level of legal standing of reassuring or if legal traceability of the datasets is required [12]. Typical and practical instances of TLS requiring calibration include 3D boundary related determinations (e.g., stratum and strata surveying [13], which are currently completed through the legal traceability of electronic distance measurements (EDM)), forensic measurements used to prosecute and investigate crimes [12], the geo-monitoring and deformation analysis of structures [14,15,16,17,18,19], and the quality assessment (QA) of various manufactured or constructed parts and items [20,21]. Eventually, due to the increasing applicability of TLS in different disciplines, it will be considerably beneficial that TLS is an alternative sensor for the creation of a 3D point cloud rather than conventional optical cameras.
There have been a number of review studies documenting the mentioned error sources quantified for TLS calibration (i.e., in chronological order [8,22,23,24,25]). In one of the early studies, W. Boehler et al. [22] introduced standardized tests to allow for comparison between different manufacturers. The concise methodologies for the angular and range accuracy, point cloud resolution, edge effects, and reflectivity of the surfaces were elaborated, and the final outcomes ultimately assisted the TLS manufacturers in comparing the performance of their instruments to those of their competitors. In 2013, T. Wunderlich et al. [23] considered the straightforward and standardized objective specifications of terrestrial laser scanners to propose a set of practical test arrangements, rather than using the pure manufacturers’ technical data specifications, for describing the quality of extracted features from TLS data (e.g., plane, surfaces, and edges). W. Liu et al. [25] also categorized the error sources of TLS into two classifications: the extrinsic error model (such as intensity values depending on the incidence angle of the laser while striking the targets) and the intrinsic error model (irrespective to the target characteristics). In this study, the overall accuracy of the TLS data could be enhanced with the help of the standard deviations of both the incidence angle and measuring distance errors in comparison with only using the intrinsic parameter corrections. In this work, the maximum permissible error for the two-face and point-to-point distance methods of calibration were formulated after investigation of the available measurement procedures [8].
The key significance of this research is the simultaneous incorporation of all systematic error sources engaged in the generic mathematical error model of TLS including the consideration of differing weights. The aims were fulfilled by using the previous findings on user-oriented calibration methodologies. Additionally, the research expresses the status of TLS calibration worldwide and emphasizes future pathways leading to rigorous calibration standardizations across different TLS systems.
Th rest of this paper is structured around four chronological steps in terms of the importance of TLS systematic error sources as found in the previous literature: instrumental imperfections (I.I), atmospheric effects (A.E), scanning geometry (S.G), and object - and surface-related issues (O.S). Each contains a discussion of error sources relevant to their geometry and mitigation practices, and the currently identified challenges and potential future areas of research are elaborated. A short description of the TLS principle is presented, followed by an outline of the four consecutive error sources.

2. Principle of TLS and Error Sources

In principle, TLS is a high-speed and movable total station that can potentially capture millions of points each second. TLS collects data in a simple spherical coordinate system, and similar to a total station instrument, consists of an electronic distance measurement system (EDM) that measures the range r as well as a digital angle measurement system to observe the horizontal angles h and vertical angles v, when each returned signal, reflected from a single point P, is received at the TLS (Figure 1).
The 3D Cartesian coordinates of a point [xyz] are then calculated from the measured spherical coordinates [rvh] [27]:
x p y p z p p = 1 n = r p cos v p cos h p r p cos v p sin h p r p sin v p p = 1 n     ,      
and the transformation can be applied back to spherical coordinates:
r p v p h p p = 1 n = x p 2 + y p 2 + z p 2 tan 1 ( z p x p 2 + y p 2 ) tan 1 ( y p x p ) p = 1 n          
The index i indicates the number of measured points from 1 to n .
While the modern TLS presents data to a user as [xyz], research into calibration has focused on the measurements or observations—[rvh]—used to generate the [xyz] and the mathematical relationship to acquire the TLS measurements.
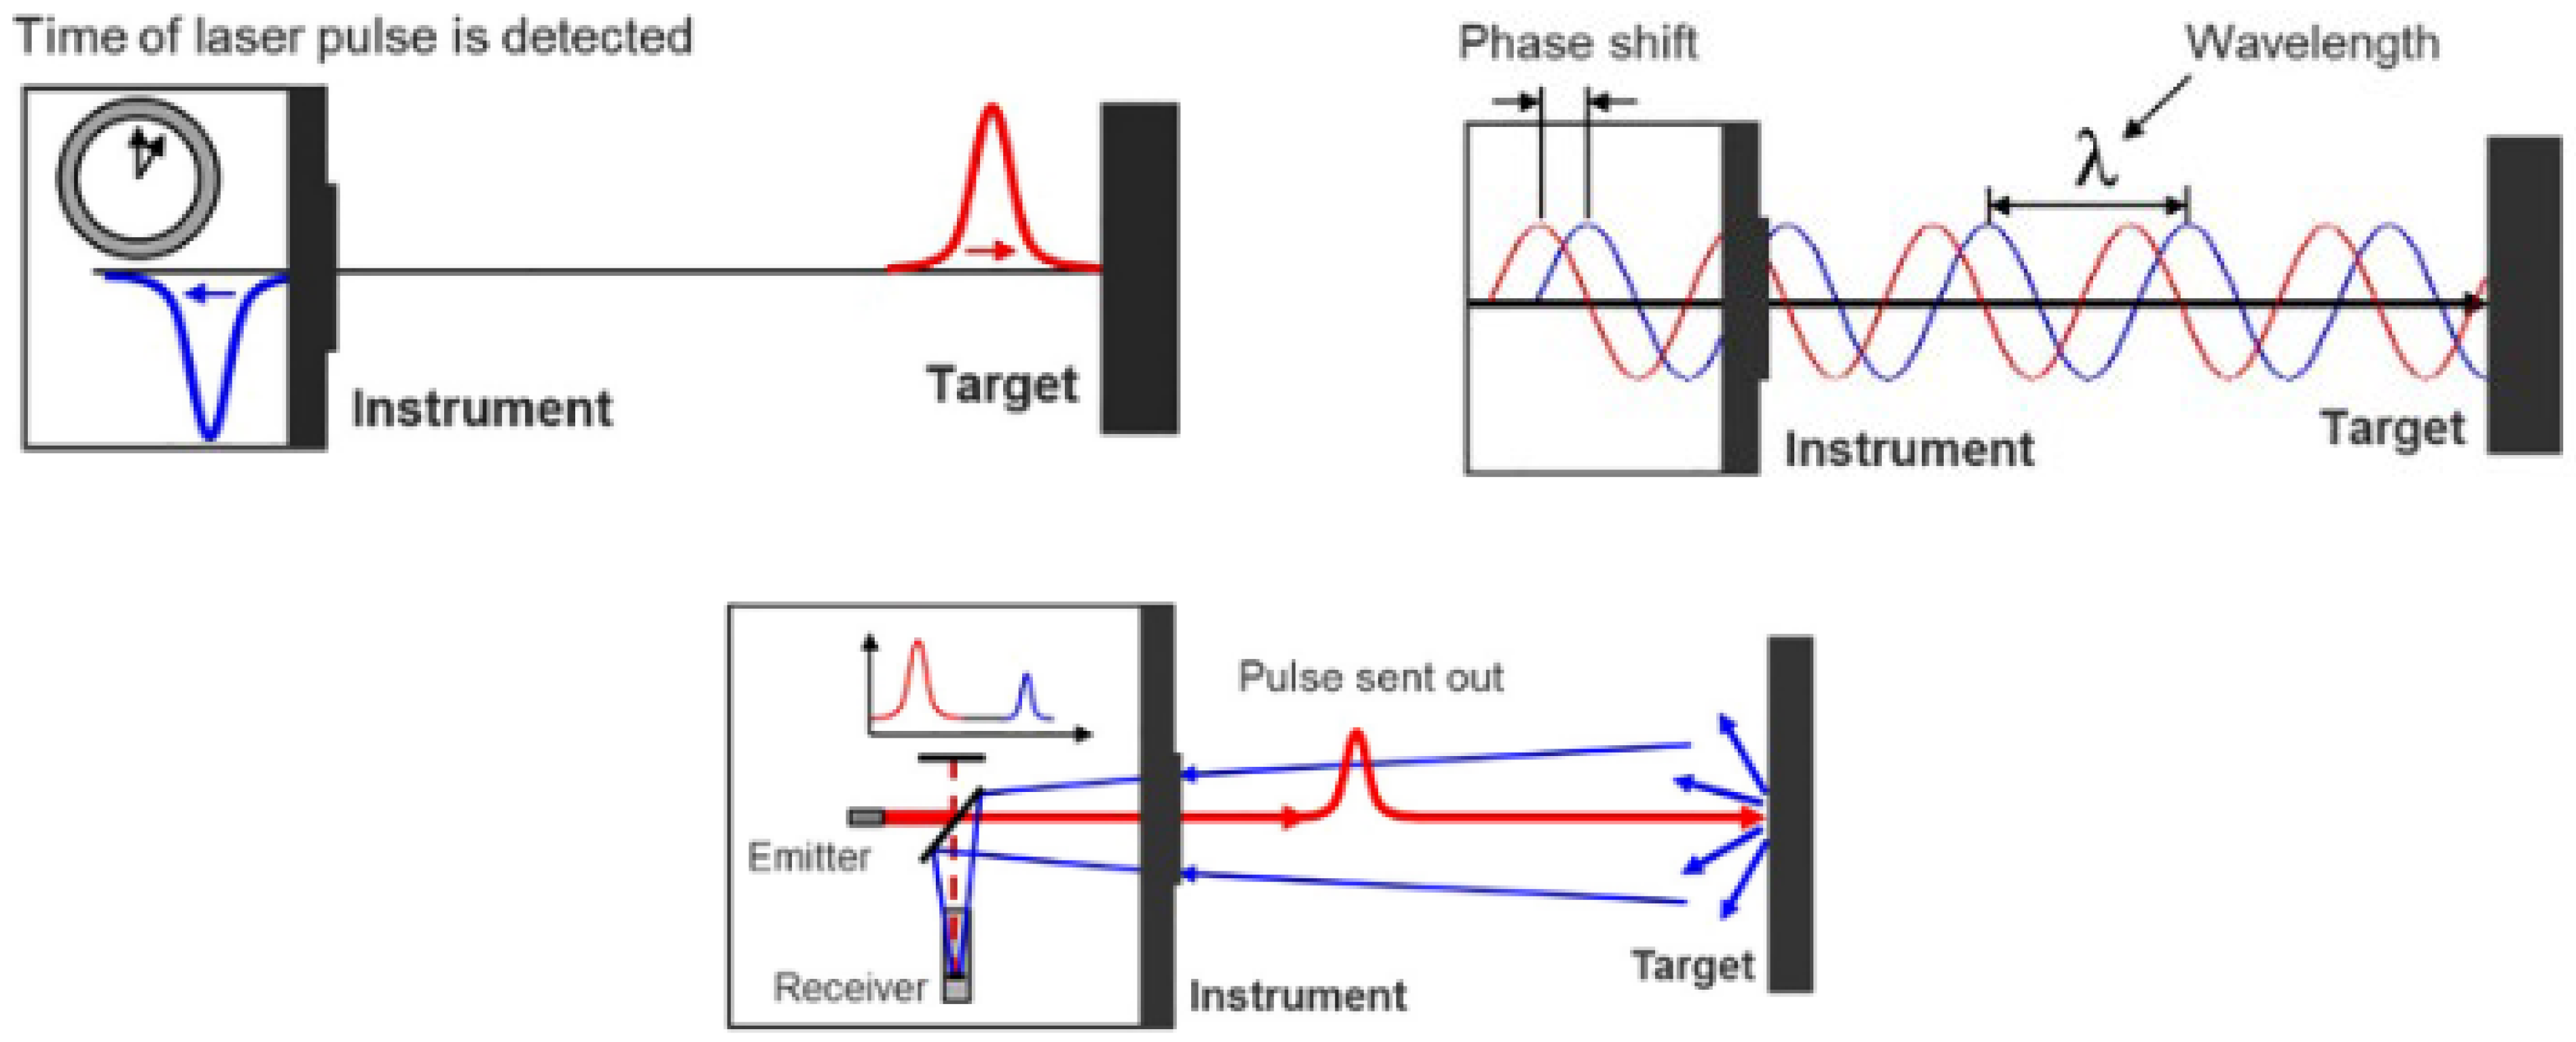
It is worthwhile clarifying that the generation of laser scanning has evolved in terms of scanning mechanisms to measure the range and angle. For instance, there are three technological modes to record the range from either pulse-based (time of flight (TOF)) or phase-based (phase-shift) to an advanced method of waveform digitizer (WFD) (Figure 2).
The TOF method is a technique in which time plays an integral role (the difference in time is recorded between emitting the signal pulse from the instrument and receiving the same pulse at the instrument). TOF uses either pulsed modulation or continuous wave modulation (CW) whereas the phase-based method conveys the data by modulating the phase of the signal (i.e., the range is determined by the shift in phase between the emitted and received signal and adding the number of full wavelengths). The important characteristics of the phase-based principle is to provide more information to evaluate the entire signal, including signal shape, channel amplification, etc., which enables highly accurate measurements. Dissimilar to that, TOF is appropriate for long-range measurement with a lower accuracy due to the larger spot size than phase-based equivalents. WFD is an advanced combination of both techniques in which the time between a start and stop pulse is calculated, and the entire received signals is digitized to provide greater resolution for range-based results.
However, for digital angle recordings, various technologies have also been introduced—camera, hybrid, and panoramic measurement system—depending on varying horizontal and vertical field-of-views (Figure 3). To determine the vertical and horizontal angles for panoramic scanners, instead of Equation (2), the following equations must be implied: v = π tan 1 ( z x 2 + y 2 ) and h = tan 1 ( y x ) π [4,29].
Then, given multiple scan stations in a network, the rigid transformation is applied from [xyz] of the point p in the jth scanner coordinate system to [XYZ] of the corresponding point P in the object coordinate system using exterior orientation parameters: translation [XSYSZS] and orientation M [27].
x p j y p j z p j = M · X P Y P Z P X S Y S Z S
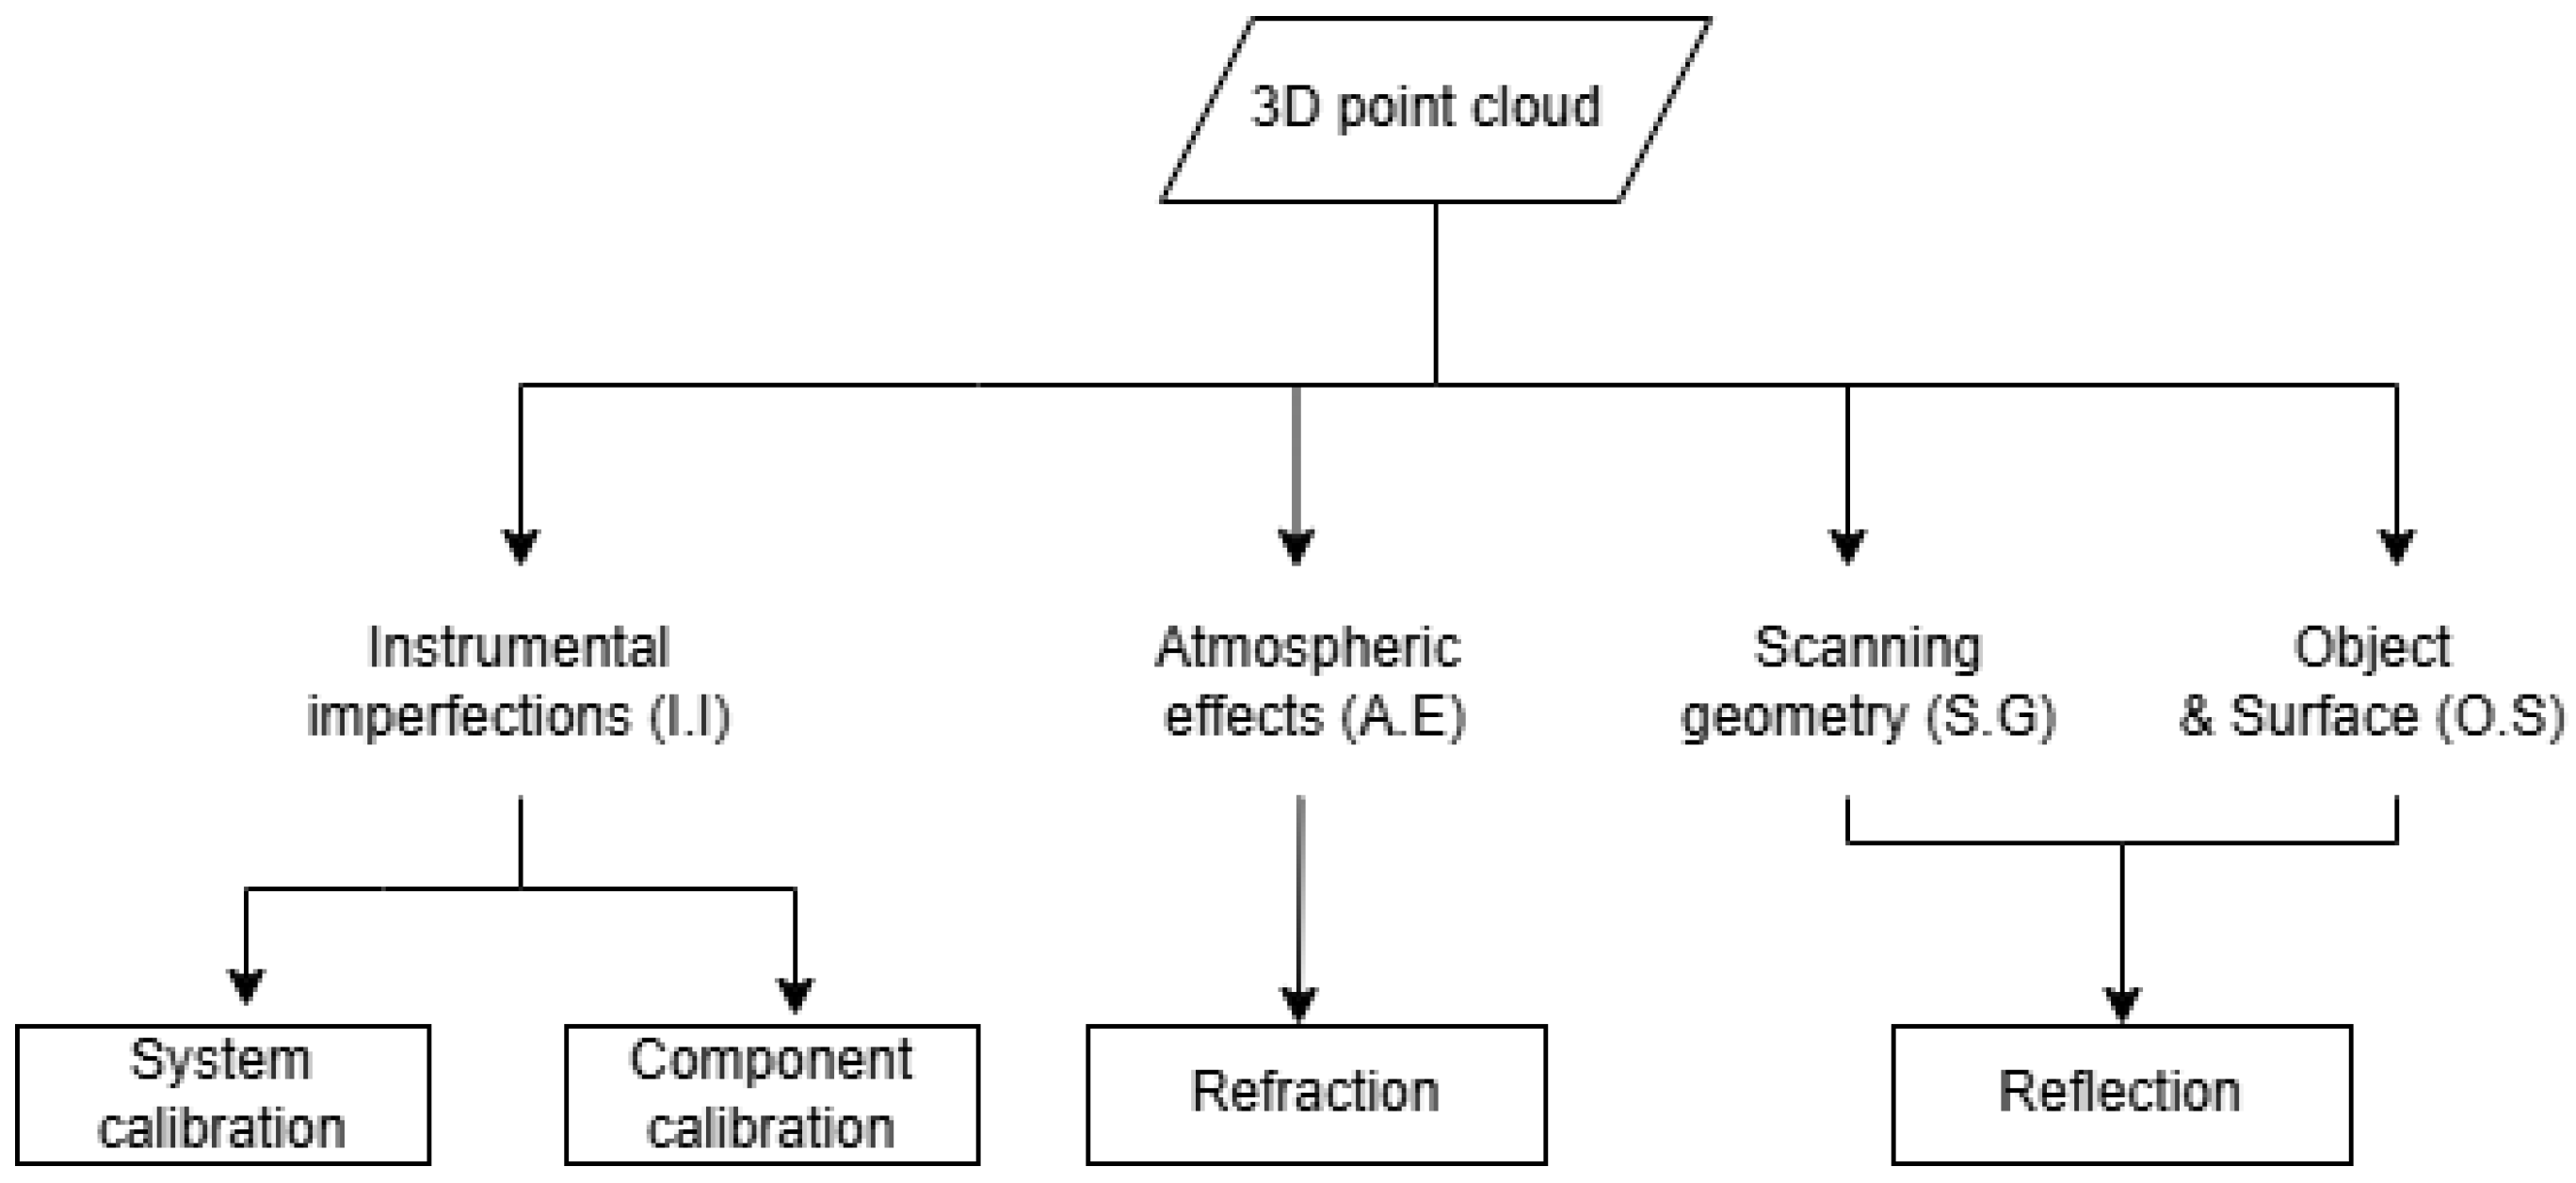
TLS measurements, similar to any other measured geodetic observations, are generally impacted by three main error sources—gross errors (blunders or outliers), random errors, and systematic errors. In short, systematic errors are those that can be mathematically modeled, and for TLSs, these are categorized into four geometries covering the scanner (instrument construction), laser (signal and atmosphere), scanning (measurement), and targets (noise) (Figure 4):
  • Instrumental imperfections (I.I), which include the misalignments and abnormalities of the instrument during the design and construction;
  • Atmospheric effects (A.E), which include the effects of the geometry of the line of sight in three different directions that are generated from the variations in atmospheric conditions;
  • Scanning geometry and measurement configuration (S.G), which is systematically related to the geometry of scanning and its relevant configuration;
  • Object- and surface-related issues (O.S), which are recognized by the reflected signals from any surface and are highly correlated to the properties and geometry of the scene.
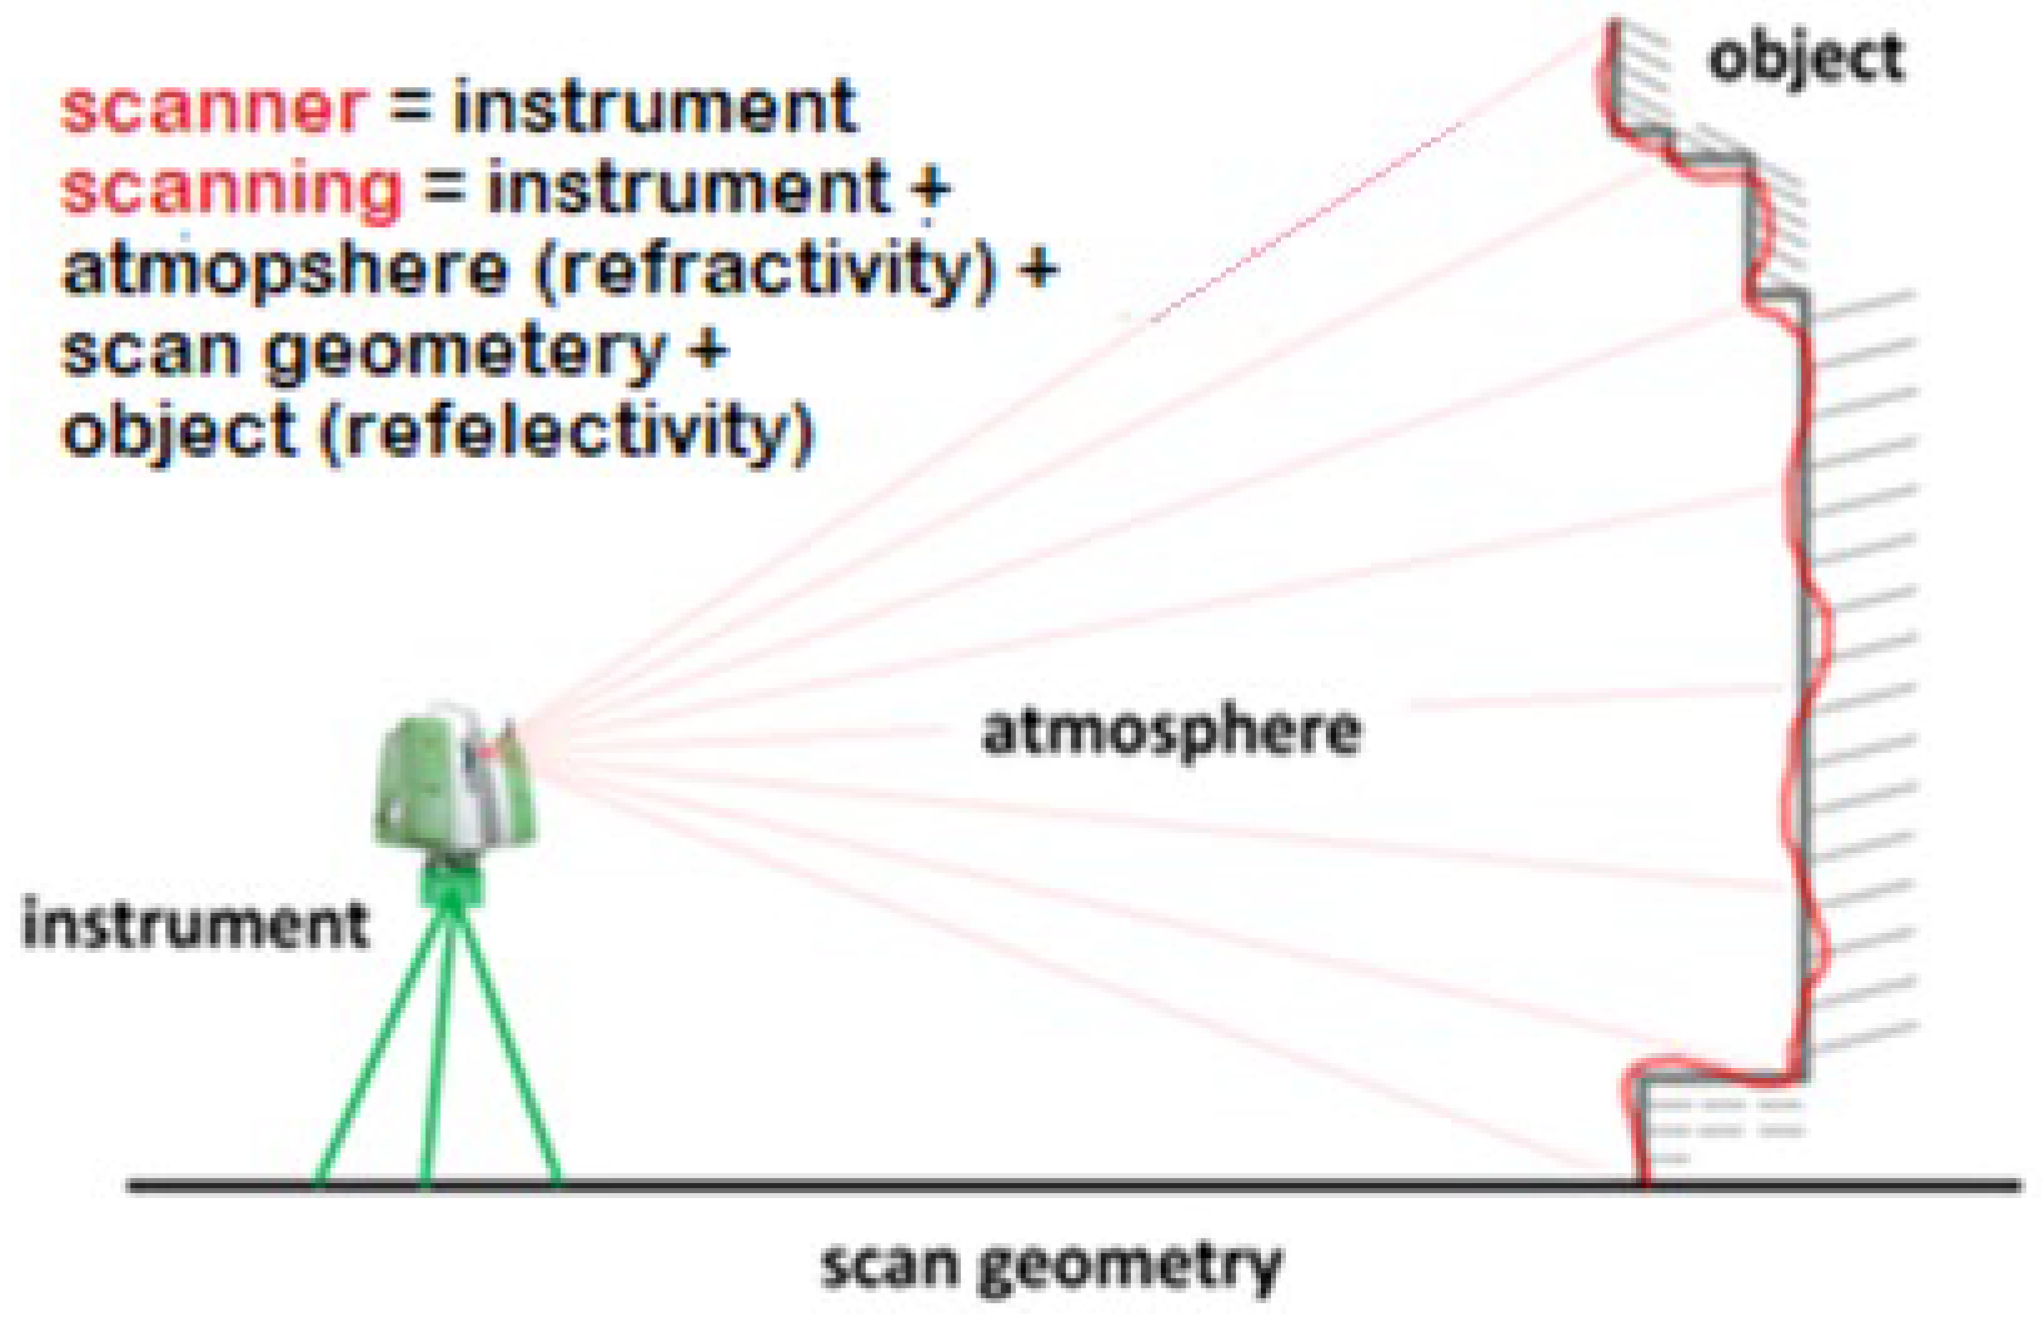
Figure 4. Four involved geometries affecting the 3D point cloud accuracy [31] (i.e., text was added by the authors).
Remotesensing 17 02528 g004
The detection of error sources affecting the quality of the measurements and the corresponding mitigation practices are commonly called calibration. In other words, calibration, in essence, refers to establishing a robust connection between the observations and traceable true values, considering the impact—if any—of the systematic, gross, and random errors existing in TLS observations. So far, there has not been adequate research integrating all expected geometries into one unique calibration study. Treating the geometries in isolation results in unreliable or incomplete calibration feedback due to the existing interrelation between the individual systematic error sources. Thus, the optimal response for TLS calibration requires the inspection of all impacting influences simultaneously, with due consideration of differing weights in the solution process. In this paper, we differentiated the calibration methods between scanner calibration and scanning calibration. The former concentrates on only instrumental imperfections with a minor impact of the other geometries on the raw measurements, while the latter embraces the four geometries simultaneously with the corresponding impacts on the measurements. To summarize, the generic mathematical error model for terrestrial laser scanning calibration is represented by:
r c = f r o ,   v o , h o , d r i . i , d r a . e , d r s . g ,   d r o . s v c = f r o ,   v o , h o , d r i . i ,   d v a . e , d v s . g ,   d v o . s , h c = f r o ,   v o , h o , d h i . i , d h a . e , d h s . g , d h o . s
The indices c and o stand for corrected and observed observations, respectively, while [drdvdh] are corresponding errors with their indices representing the geometry. Additionally, non-systematic errors of gross and random errors can also be added to Equation (4).
The following sections in this paper elaborate on each component of Equation (3), commencing with instrumental imperfections (I.I) ( d r i . i , d v i . i , d h i . i ) . This section addresses two potential calibration techniques of terrestrial laser scanners found in the literature: system and component calibration. The Section 2 encompasses the atmospheric effects on the geometry of the line of sight (A.E) ( d r A . E , d v A . E , d h A . E ) investigating the refraction over the path of the signal. The Section 3 and Section 4 are scanning geometry (configuration of measurement) (S.G) ( d r S . G , d v S . G , d h S . G ) , alongside object- and surface-related issues (O.S) ( d r O . S , d v O . S , d h O . S ) , which will be outlined later. The main issue considered in S.G and O.S is the reflectivity of the received signal varying with respect to the geometry of the targets and scanning (Figure 5).
An alternate classification of TLS calibration could be divided into spatial and intensity calibration. Spatial calibration embraces all phases of studies (i.e., spatial deliverables are influenced by all impacts). However, the intensity calibration deals with the strength of the reflected laser caused by the remaining effects such as refraction [32] and reflectivity [25,33].

3. Instrumental Imperfections (I.I)

This section concentrates on the scanner imperfections and misalignments that might occur during the design and construction of the scanners. Even though TLSs are designed to a high standard and the sensors are pre-calibrated in a sophisticated manufacture-based process before distribution, for very precise measurements, some parameters of instrumental systematic error are required for thorough studies, especially those that may be temporally unstable since the purchase time. One of the generic and recent parametrizations of instrumental systematic errors was presented by [34], although a unique set of parametrizations based on intrinsic scanner system is recommended:
d r I . I = a 2 sin ( v o ) + a 10 + E r d v I . I = a 1 n cos ( v o ) r o a 1 z sin v o r o + a 2 cos ( v o ) r o + a 4 + a 5 n cos ( v o ) a 5 z sin ( v o ) + a 9 n cos ( v o ) a 9 z sin ( v o ) + a 12 a cos ( 2 v o ) + a 12 b sin ( 2 v o ) + E v   , d h I . I = a 1 n r o + a 1 z r o tan ( v o ) + a 3 r o sin ( v o ) + a 5 z tan ( v o ) + 2 a 6 sin ( v o ) a 7 tan ( v o ) a 8 x sin ( h o ) + a 8 y cos ( h o ) + a 11 a cos ( 2 h o ) + a 11 b sin ( 2 h o ) + E h
For previous formulations found in the literature and the possibility of validating various parameterizations through the quality index tests [5,35], interested readers are referred to [9,11,25,36,37,38,39,40,41]. The systematic errors in instrumental imperfections (I.I) [drI.IdvI.IdhI.I] shown in Equation (5) include the coefficient a representing the abnormalities or misalignments (additional parameters or calibration parameters (CPs) of the instrumental imperfections). Table 1 describes each calibration parameter identified for TLSs found in Equation (5).
The calibration parameters are generally separated into physical parameters and empirical parameters. The physical parameters are classified into three geometric abnormalities: (1) offsets (transit (horizontal axis), beam, and mirror (vertical axis), eccentricity and scale error), (2) tilt (transit (horizontal axis), beam, and mirror (vertical axis)), and (3) constant errors (e.g., constant zero offset, mirror offset error, and vertical angle index offset). Offset might occur when the beam ray and the axis (either horizontal or vertical) of the instrument are assumed to be in a parallel condition, whereas the tilt is the geometric shift defined when that beam ray is NOT parallel to the horizontal and vertical axis. Empirical parameters are those being formulated based on several experiments and the analysis of the residuals in a least square adjustment process (LSA) [42,43] (i.e., here they are represented as E r ,   E v , and E h ).
To undertake rigorous calibration methods, in the literature, two calibration categories for instrumental imperfections have been realized: system calibration and component calibration [44]. System calibration is completed through the consideration of the whole measurement into a comprehensive system including all known systematic errors (i.e., calibration parameters of the TLS) using the photogrammetric bundle block adjustment and a robust design of the geodetic network (generally speaking, exterior orientation parameters, calibration parameters of TLSs, and object points are approximated in system calibration), whereas component calibration considers the calibration of each component of misalignment (calibration parameter) individually with no necessity for the construction of a geodetic network design. Either system calibration or component calibration implemented through user-oriented techniques must be reliable and accessible to consider the optimal calibration results with a higher quality than the manufacturer-oriented techniques. This ultimately leads to fulfilling different purposes of the accuracy assessment of terrestrial laser scanners (pre-calibration (verification), calibration, and post-calibration (validation)). The following sections demonstrate the variety of proposed user-oriented calibration techniques to deal with the instrumental components of TLS shown in the above parameterization.

3.1. System Calibration

System calibration, as explained previously, is the consideration of the whole measurement into the system calibration. Most of the time, the proposed system calibration enables the solution of all of the components given the appropriate calibration methods. It commonly needs well-defined system arrangements (geodetic network design) prior to acquiring the data and a robust parametrization scheme (using photogrammetric-based knowledge) to solve the unknown parameters. Several system calibration methods using bundle block adjustment have been examined so far. The major characteristics of all system calibration methods are listed below [45]:
  • They require the proper knowledge of geodetic network design (rational surveying study);
  • They can be finalized without a detailed study of each component and their interactions;
  • They do not necessarily require special facilities and equipment to validate observations (e.g., self-calibration is one of the techniques).
The most popular methodology for system calibration is completed through a network of targets in the volumetric measurement, in which the targets can be either uncalibrated or self-calibrated to update the calibration parameters.
System calibration can be accomplished using either a feature-based test field (i.e., using spheres [46,47,48], cylinders [49,50], planes [47,51,52,53,54,55], and other geometric features as the observations [40,56]), or a point-based test field (i.e., using the point target as the observations [48]). A unique mathematical parametrization was proposed for each method. To address different feature-wise test fields, Y. Zhou et al. [47] investigated the calibration test including five spherical targets and three plane targets. The results from the comparison between the acquired datasets indicated that more promising results could be obtained by the planar targets than spherical targets—providing an improvement of 30% in final precision [57]. However, to compare individual plane and point-based tests, the accuracy assessment of plane targets is not as reliable as point targets, particularly for user-oriented calibration tests. Firstly, the feature-based data include noisy and correlated observations due to their geometric shapes. Instead of using relatively noisy raw measurements, the approach of point targets concentrates on the determination of the center of the targets, which can be extracted from multiple measurements. Therefore, through this method of observation, it can disregard high unknown correlations by redundant correlated observations. Secondly, targets can be simple, portable, and inexpensive to configure into the scanning network geometry (i.e., this is required for an optimal network design). Thirdly, there are sufficiently developed statistical tools for pointwise measurement rather than feature-wise methods [7].
More findings on the comparison between point and plane targets can be found in [53,58,59]. However, it is worthwhile stating that the combination of both point and feature test fields was also implemented in [51], and satisfactory results of submillimeter accuracy were delivered after integrating both observation datasets.
In order to implement system calibration using either a point or feature test field, the processing of an optimizing geodetic design is required. Here, the optimization refers to the target (point and/or feature) locations and TLS station locations. The generic optimization was highlighted by considering four interrelated optimization orders, zero-order design (ZOD) (i.e., the problem of optimal design—datum problem), first-order design (FOD) (i.e., network configuration—configuration problem), second-order design (SOD) (i.e., optimal observation of weight problem (stochastic model of observations)—weight problem), and third-order design (TOD) (i.e., the problem of densification existing network—densification problem) [60,61,62]. However, TOD involves the introduction of measurements to the existing network to find a refined solution for the coordinates of the network. This optimization order has not been considered in designing a new TLS calibration network.
Different orders of optimization individually respond to the specified criteria of the network (e.g., the most important criteria are precision, reliability, correlation, and uncertainty [61,63,64]). In summary, precision refers to the standard deviations obtained from the variance covariance matrix of the estimated parameters, meaning that the precision of the parameters must be of a higher quality (especially the calibration parameters shown in Equation (5)). Furthermore, the existing dependency between the parameters (acquired from the covariances and variances of each pair of parameters) illustrates the amount of correlation between those parameters (the lower the correlation between the parameters, the higher the precision of their estimation). Reliability concentrates on the resistance of the network with regard to the existing outliers. Internal reliability deals with the detection of outliers, which might affect the estimation prior to implementation of the algorithm, while external reliability focuses on the impact of undetected outliers on the final estimation. The uncertainty of all of the estimated parameters and adjusted observations ultimately validates the robustness of the entire network configuration.
Apart from the four criteria of the network previously noted, there are two essential criteria worth investigating when designing a new geodetic network for TLS system calibration: the sensitivity and efficiency of the network. In a general sense, sensitivity is the ability to detect the possible displacements of the estimated parameters over time [5,11,50,65]. In different time periods, it is not guaranteed that the estimated parameters for the misalignments remain unchanged for the same instrument under the test. Hence, scanner calibration parameters, similar to camera calibration parameters, can be divided into stable or unstable parameters. D. Lichti [11] considered the stability of the parameters over the period of more than a year. The results of the research confirmed that only three calibration parameters were stable within the course of the investigation—with instability probably being caused as the consequence of insufficient statistical testing or real physical change in the misalignments. However, there is still a knowledge gap in this part of the current research. Alternatively, efficiency is the possibility of implementing the network for ordinary users of technology [8]. Mostly, this is achieved in the pre-calibration (verification) of the TLS by simplifying the error model (consolidating only three instrumental systematic errors [dri.idvi.idhi.i] (Equations (5))) by a non-complex network design.

3.1.1. Zero-Order Design (ZOD)

Zero-order design (ZOD) is the initial optimization order resolving the issues of the datum. In a 3D geodetic network design, at least six constraints—three translation and three orientation parameters—must be preliminarily defined to fix the datum (one additional constraint might also be regarded as the scale). Two approaches for ZOD have been recommended in the literature: minimal datum (free network or inner datum) and constrained/over-constrained datum [66,67,68]. Generally, zero-order design concentrates on the precision and correlation of the parameters simultaneously.
Minimal datum design (or sometimes it refers to minimum ordinary datum) is implemented by explicitly defining the minimum number of points required to fix the entire network. Six coordinate values must be distributed over three non-collinear points, and the scale is implicitly defined by one range observation. The ideal case for this datum definition approach is recommended by constraining the datum through two full control points and one coordinate of a third point [44,45]. The other straightforward approach of minimal datum constraints is to fix the exterior orientation parameters of one scan station and deal with either an arbitrary or defined scale [69]. Following either approach of minimal datum design, six or seven unknown parameters (related to exterior orientation) of the adjustment are assumed to be known (Equation (3)). The other manner of minimum ordinary datum constraints is to implement the inner constraints in the variance-covariance matrix of the estimated parameters. This is completed as the result of minimizing the trace of the variance-covariance matrix. Based on this method, the imposition of datum matrix D is added on the object points [9] or on the relevant feature parameters such as the plane, sphere parameters, etc., depending on the chosen system calibration [52]. The comparative analysis between different methods of minimal datum design for the point-based system calibration proves that the object points can be estimated with higher precision in inner constraints due to their imposed constraints, but with a higher correlation between the exterior orientation parameters and calibration parameters. In brief, the minimum ordinary datum delivers a higher correlation between the object points and calibration parameters and a lower precision for the exterior orientation parameters [30]. In contrast, a comparison between two methods of minimal datum design on the plane-based self-calibration showed that no changes could be detected in the estimation and correlation of the parameters of the adjustment through an onsite experiment (i.e., in the experiment, the calibrated photogrammetric network was used to validate the accuracy). Results in the literature confirm that there is not a major difference in the correlation and precision of the parameters as the result of the change in datum definition. In summary, the two criteria—precision and correlation—are datum definition independent.
A constrained or an over-constrained datum is the other option for ZOD, which is implemented through a known test field (i.e., using more control points than the minimum number required). This is also referred to as test range calibration. This has previously been evaluated for camera calibration, and some disadvantages of the process may lower the overall quality of scanner calibration [70,71,72,73]:
  • The high cost and effort of employing the test field for setting more control points. The process needs more accurate instruments and facilities to validate the observations;
  • The risk of having imprecise control points in the entire datum leads to the imprecise estimation of the TLS calibration parameters due to the higher number of points;
  • Existing high precision of the control points imposes additional strains (constraints) in the geometry of network configuration;
  • The stability of the points cannot be guaranteed over time.
The counter argument is that since there are many objects points available, it does not necessarily require a properly configured geodetic network to estimate the unknowns. This is a major advantage of using the constrained or over-constrained datum over a free network.
Having made the above clarifications, the investigation of these two methods of datum design—minimum and over-constrained datum definition—for the panoramic cameras uncovered the fact that the least correlation between the parameters occurs when establishing four unlevelled camera stations (ideally two levelling angles (ω and φ) > ±14°) at the same height. The reason for integrating the example of a panoramic camera is that panoramic cameras use the orientation and location in a 3D auxiliary coordinate system with respect to the object space (i.e., these exactly resemble the exterior orientation parameters of the scanner). Afterward, an average standard deviation lower than one millimeter for the target points was guaranteed under the assumptions. The other finding was that the change in orientation parameters, especially rotation in the horizontal plane from one station to the other, can reduce the correlation between the camera calibration parameters. This matter, however, could not be necessarily replicated in [70,72].
M. Sabzali et al. [74] proposed a new parameterization for bundle block adjustments in a system self-calibration network. The research aimed to reduce the existing correlation and potentially enhance the precision of five calibration parameters by the redefinition of the exterior orientation parameters (i.e., by implementing two-step relative and absolute orientation rather than one-step exterior orientation, e.g., the constrained collinearity condition with the help of coplanarity conditions (using structure from motion approaches). This configuration makes the network independent of the datum definition parameters. The findings demonstrated reasonable results in terms of the correlation and precision of the parameters. The advanced version of studies enabled the extended parametrization for all calibration parameters involved in instrumental systematic errors through the rigorous data acquisition steps (high number of redundancies for the network). Under the new formulated setups, the outcomes guarantee the acceptable correlation (lower than ±0.7) between the exterior orientation and calibration parameters and between the object points and calibration parameters. Additionally, a precision threshold was assigned for the estimation of the individual calibration parameters to encounter inter calibration parameter correlation. The uncertainty of the results was validated via five different scanners after an investigation of the reliability, correlation, and precision criteria of the parameters [75].

3.1.2. First-Order Design (FOD)

First-order design (FOD) is the second optimization order dealing with network configuration. Here, network configuration focuses on target and scanner station locations to maximize criteria such as the precision of the parameters of the network. There are fundamentally two approaches found in the literature for FOD: trial and error (simulation) practices or using analytical methods [61].
More simulated networks with the least effort on computational modes than the analytically configured networks have been established in the literature. D. Lichti et al. [27,76] initiated the notion to resolve the FOD through observation distribution functions. In this method, the variance-covariance matrix is reparametrized as the function of observation distribution functions. The observation distribution function is the mathematical expression describing the probability of possible outcomes for an experiment. D. Lichti et al. [27] aimed to address the probability of the observations for the more precise determination of four angle calibration parameters. The proposed observation distribution function was a bimodal raised cosine function. However, the major advantage of this proposal is that there is flexibility in applying alternate distribution functions such as uniform, triangular (tent function) [77], kernel density function [78], etc. The datasets obtained from 25 scanners after implying the bimodal raised cosine function were investigated, and the results were compared with Gaussian kernel density function and self-calibration results [27]. The root mean square (RMS) from the difference between raised cosine function and Gaussian kernel function was within a more acceptable range than the RMS between the raised cosine function and self-calibration method. Therefore, it can be concluded that the reliable observational function (e.g., raised cosine function) is able to provide more successful results than the conventional self-calibration method in the prediction of these four angle calibration parameters.
The other analytical method proposed for FOD can be found in [79]. This research aimed at supporting the minimal geometry of the network (i.e., the limited number of targets and optimal size of the calibration room) based on the most sensitive target to the instrument. This was accomplished by the iterative investigation of the signal to noise ratio (SNR) using simulated and empirical experiments to estimate the 10 calibration parameters as accurately as possible: absolute displacement of the single target, the length consistency method (to estimate a 1 z , a 5 z , and a 10 ) and the difference via the two-face method (using one target on the instrument horizon at a short distance to estimate a 2 and a 3 and the one at long range to estimate a 4 and a 6 ), and finally, one elevated target at the short distance to determine a 1 n + 2 and a 1 z and at the long distance for a 5 n and a 5 z + 7 .

3.1.3. Second-Order Design (SOD)

Second-order design (SOD) refers to the proper establishing of the weight matrix or stochastic problem of observations to design the geodetic network. Sometimes, FOD and SOD can be addressed simultaneously, and the combined approach is referred to as combined order design (COMD). Accordingly, a simultaneous study of the FOD and SOD impacts the precision, correlation, and reliability of the parameters of the network. Two different classifications for SOD methods in the literature can be identified: the direct use of the variances (standard deviations) of the observations or the indirect method using computational techniques to determine the stochastic model [80].
The most straightforward technique for the stochastic model of observations is the direct application of the variances (standard deviations) of observations provided by the manufacturers [σrσvσh], whether σ b e a m (i.e., the standard deviation of beam) can be considered or not. The σ b e a m value is employed due to the positional accuracy of the range measurements within the laser beam footprint on the object surface, and it is approximately equal to 1/4 of the beamwidth [3,45]. However, the standard deviation (±1σ) of the individual measurement stated by the manufacturer is the precision of single point measurement, and those values do not necessarily indicate the precision of the center of point target (for instance, the reported values by Leica for the range and angle accuracy of a Leica ScanStation P50 are within ±1.2 mm ± 10 ppm and ±8”, respectively (https://leica-geosystems.com/products/laser-scanners/scanners/leica-scanstation-p50, accessed on 20 June 2025). The center point of targets that are applied for the point-based test field calibration are usually derived from multiple factors such as the scanner to target distance, incidence angle, measurement resolution, and so forth. The other downside of this method is the dependency of the observations, which is disregarded (diagonal weight matrix with zero elements off-diagonal). T. Jurek et al. [31] acknowledged that the accuracy for the final observations could be enhanced as a result of considering the impact of the correlated observations.
The alternative approach of stochastic model implementation is the indirect method, rather than directly employing the variances from the manufacturers. Y. Reshtyuk [44] proposed the self-calibration method through a direct georeferencing network using the known target points and exterior orientation parameters. In this method, the known parameters are approximated as the unknown parameters under the constrained posterior weights. This method is recognized as the unified approach stochastic inner constraints [45]. The success of the algorithm lies in diminishing the high correlation between the four calibration parameters caused by attaching finite weights to them. Moreover, Y. Reshtyuk [44] emphasized that either levelled or unlevelled scan stations do not necessarily affect the correlation of the orientation parameters due to their decorrelation, whereas it is suggested that the translation parameters of exterior orientation must be estimated precisely. Additionally, having a higher number of known target points does not necessarily influence the estimation of CPs, and it only shifts the correlation from one parameter to the other parameter.
Another method to estimate the weight matrix was implemented through an iterative least square adjustment with the aid of the standard deviations provided by the manufacturers as the initial values [10]. The results for the validation of the algorithm were compared in each iteration to refine the ultimate approximation of the standard deviations. This technique embraces robust analytical programming rather than the direct application of stochastic modeling. The synthetic variance covariance matrix includes three components: non-correlating errors, the functional correlating error vector, and the stochastic correlating error vector, which is the computational effort to analytically address the stochastic model [81,82,83]. Hence, the presented stochastic model is able to distinguish the correlating and non-correlating observations to prevent a high correlation from arising among the observations, although the system requires more computation effort and time.

3.2. Component Calibration

An alternative approach in dealing with instrumental misalignments is component calibration. The major advantage of component calibration over system calibration is that, since the optimal condition to address all of the calibration parameters through one single system setup is not fully achieved, there is no serious requirement for the consideration of the detailed study of a geodetic network design (i.e., a geodetic network design is established to approximate all existing parameters of the network through one single system setup). Therefore, given Table 1, component calibration can be completed as the result of the thorough study of the specific misalignment and proposes a relevant mitigation practice to lower or correct that abnormality. This is typically finalized by referring back to the dedicated higher accuracy instrument, for instance, using a laser tracker to accurately calibrate the zero offset error in the range measurement [34,84]. General techniques in component calibration include the use of pre-calibrated artifacts, in situ calibration (in situ calibration implies that the calibration is evaluated in position or onsite), or a calibrated network of targets [2]. The prominent methods of undertaking this found in the literature are the two-face method, length consistency test, line length test, ray-tracing method, key point algorithm, etc. For example, a two-face method, derived from the front and back face measurements of the TLS, resolves the subsets of the calibration parameters [85]. Subsequently, it is worthwhile expressing that it would be feasible to implement alternate surveying methods to determine the specific abnormality of the TLS.
B. Muralikrishnan et al. [34] proposed a comprehensive calibration study that aimed to distinguish the variety of component calibration methodologies such as the two-face method (containing the two-face through the traverse, horizontal, and vertical directions), line length test, and volumetric length method (i.e., the method was calibrated using dedicated equipment with higher accuracy like a laser tracker). In short, a2 was first detected using the two-face method. Second, two range calibration parameters (e.g., a2 and a10) were addressed using the line length test. Afterward, the two-faced traverse test was able to determine the calibration parameters of the vertical angle (e.g., a1n, a4, and a5) using the least square adjustment. The identical configuration for investigating the horizontal angle calibration parameters (e.g., a1z, a3, a5z, a6, a7, a8x, and a8y) was accomplished afterward. On the other hand, a5z and a7 were again ensured via the volumetric length method using a calibrated 2.3 m length test. The other volumetric length method undertaken in the research was an 8 m uncalibrated horizontal length test to solve a11a and a11b. The remaining parameters were neglected due to their correlation. In the follow-up advanced calibration practice [85], the optimal solution for all of the calibration parameters in a reasonable order was proposed: a2 from the differences between the front-face and back-face of range measurement, a1z, a3, a5z, a7, a6, a8x, and a8y from the difference between two faces in the horizontal angle, and the difference in vertical angle direction to solve the a1n, a4, a5n, and a9n. Since there were still some unknown parameters, such as a5z, a9z, a10, a11a, a11b, a12a, and a12b, the length-consistency method was proposed to estimate all of the remaining parameters. The uncertainties were eventually evaluated with Monte Carlo simulation [2]. It was inferred that the two-face method has the possibility of reducing the angle differences for the calibration parameters (but not for all parameters), while the length-consistency approach and network method normally produce acceptable results for the calibration parameters when using both faces. Furthermore, the correlation obtained between parameters in the length consistency and two-face methods was considerably more satisfactory than the network method [86]. Regarding precision, all mitigation methods experienced approximately similar conditions [85].
The evaluation of the TLS via the International Organization for Standardization (ISO) was the other opportunity for component calibration [87]. The method for the range calibration was completed using the test line with a known nominal distance d   (Figure 6), which is a promising practice for EDM calibration.
A total of 21 distances (e.g., d1 to d6) were recorded starting at Station 1 (s1) and proceeding rightward to Station 7 (s7) on the site, and through a developed least square by comparison with the known nominal distance a10 and other empirical bias (irrespective of the measured distance), were determined. This research also resolved one correction factor of horizontal angle (i.e., using the resection technique including four targets located in approximately the same horizontal plane and the fifth target set up at a different level) and two correction factors of vertical angle—vertical index and vertical scale error (with the aid of establishing six targets each 50 cm apart on a single vertical staff) [87].
The ray-tracing approach is another method for the identification of the systematic error of the instrument [88]. The method quantifies the geometric simulation of the TLS system by explicitly modeling the laser ray path through the instrument (i.e., the method was achieved based on the differences between the outgoing ray and the errorless path). The underlying assumption is that the point in the mirror of the instrument to reflect the laser beam is defined as the origin of the internal coordinate system of the scanner. The advantage of the presumption is that many systematic errors in the instruments (i.e., calibration parameters) are excluded from the geometric error model. The remaining calibration parameters are only two calibration parameters along the horizontal angle—the collimation error and trunnion axis error—with an identical effect on the horizontal planes. It simplifies the eventual solution to the problem. Research has also demonstrated that the change in the orientation parameter around the vertical axis of the scanner can compensate for any inclinations in the horizontal plane [88].
The key point quality (KQ) algorithm was initially proposed by [40] for a feature-based self-calibration network. The algorithm was based on the quality of key points and reliable features to enhance the calibration accuracy. X. Li et al. [40] employed 65 initial feature point pairs to obtain 23 coarse feature points pairs into 8 fine feature points with regard to the precision of the measurements. In the study, the parameters of calibration were estimated through two methods, the two-face and network calibration methods, and then the estimation was finally compared with the 12 auxiliary target-based method. The accuracy obtained from 8 fine feature points was less accurate than 12 auxiliary targets. The reason for the low-quality results was diagnosed to be a lack of prior information such as target locations or additional observations. The other development in 2D key points was presented by [89] for the point-based calibration network. In this research, every measured point was assumed as a raster grid with the attached vertical and horizontal values assigned by 2D natural nearest neighbor interpolation. The comparison between the priori and posteriori standard deviation of observations, which was derived as the result of the two-face method for determining the nine calibration parameters (i.e., those that are sensitive to two-face methods), indicated that the existing high correlation between the parameters could not be reduced, and it consequently degraded the precision of the parameters. The major motives were associated with the limited number of observations.
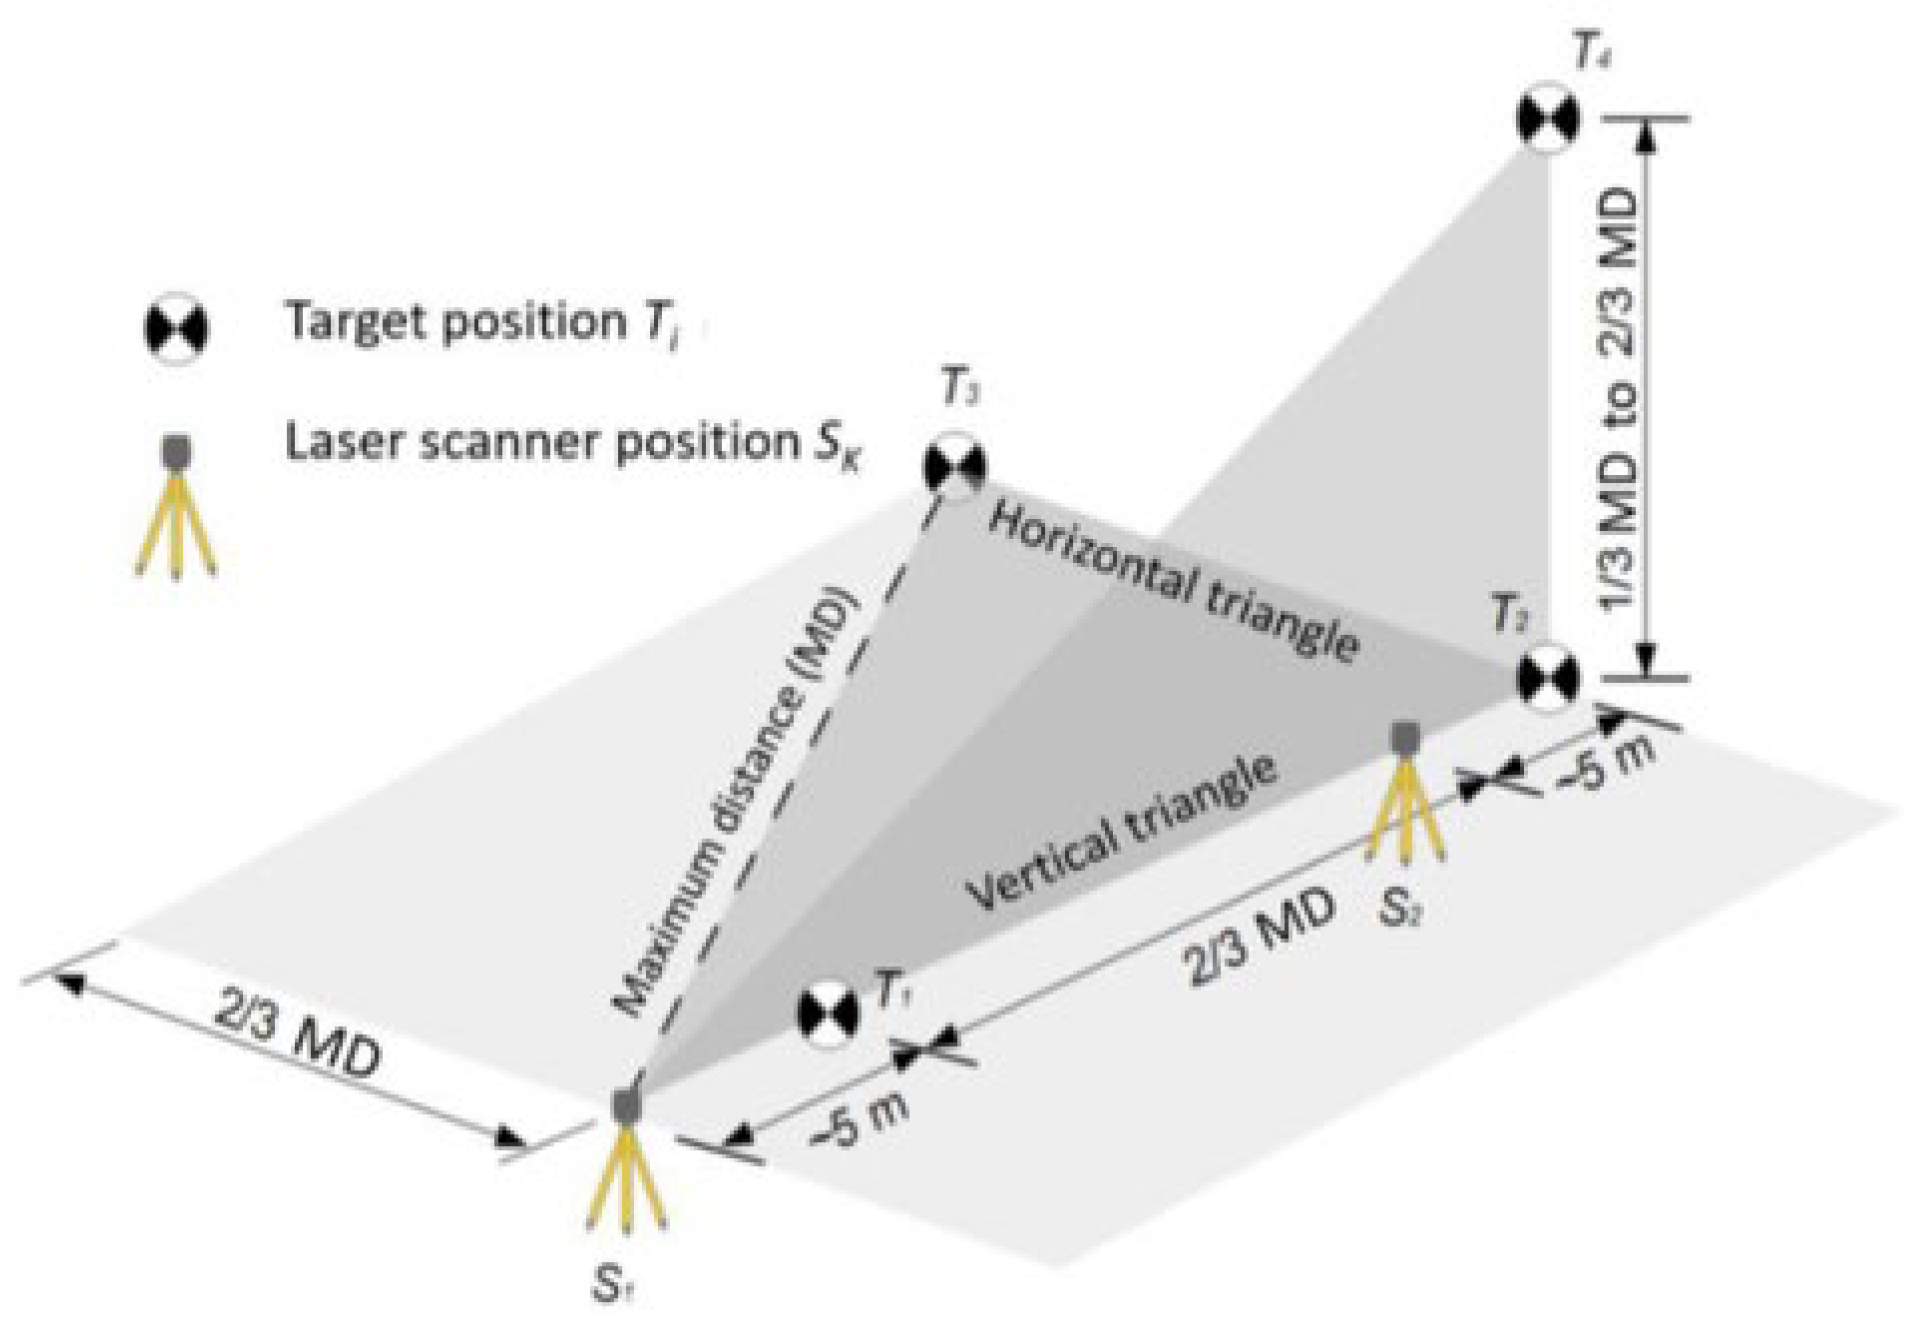
T. P. Kresten. et al. [84] proposed component calibration methods containing a comparison between the laboratory and updated field calibration experiments for five different manufactured scanners. One of the presented laboratory setups consisted of a 20 m comparator track, allowing for scanning within each interval of 1 m on the track. After, the spatial distances in each setup were extracted and compared with the reference distances acquired from the laser tracker for all scanners to obtain the geometric constant error (i.e., the laser tracker was located on the other side of the comparator track) [84]. The central aspect of the work was to update the field test practices primarily proposed by [90] for field terrestrial laser scanning calibration. To emphasize its significance, the configuration consisted of four targets with two scan stations, as illustrated in Figure 7.
The targets were scanned four times from each station within the proposed distances (maximum distances (MD)) (Figure 7). Afterward, the distances and their differences in addition to the measurement uncertainty were determined from the selection of target coordinates. Then, the ultimate precision of the instrument could simply be computed using straightforward computational practices [84,90,91].

4. Atmospheric Effects (A.E)

The second investigation conducted for the comprehensive study of terrestrial laser scanning calibration concentrated on the atmospheric effects on the laser along the line of sight (geometry of the laser). Since terrestrial laser scanning is facilitated by the laser as the main source of illumination to capture the data (i.e., TLS is categorized as the active electro-optical sensor), the characteristics of the signal in terms of the optical manner while passing through the atmosphere plays a critical role in better determination of the quality of deliverables. The fact is that the atmospheric and meteorological impacts influence the line of beam ray when the light beams travel within the atmosphere while crossing different media. This variation must be taken into consideration for long-range scanning under uncontrolled environmental conditions, which does not typically occur in laboratory short-range scanning under controlled environmental conditions.
The laser normally experiences variable atmospheric situations along its travelling line and follows the quickest path to reach its destination (target). The circumstances might be caused by either physical air components (leading to scattering, turbulence, etc.) or the variant atmospheric conditions including atmospheric temperature, pressure, humidity, carbon dioxide content of the air, etc., resulting in refraction (i.e., the primary focus of the calibration study is the refracted wave). Due to the insignificance of the atmospheric effects for short-range scanning, there has been inadequate knowledge on mathematical error developments and the relevant mitigation strategies for long-range scanning. However, these effects have played a substantially important role in long-range scanning tasks in recent years, particularly for the current deformation and monitoring tasks [14,16], to differentiate between actual geometric movements and inherent measurement uncertainty. Therefore, the current elaborations on refraction parametrizations can be further amended toward the standardization of atmospheric error modeling for long-range terrestrial laser scanning.
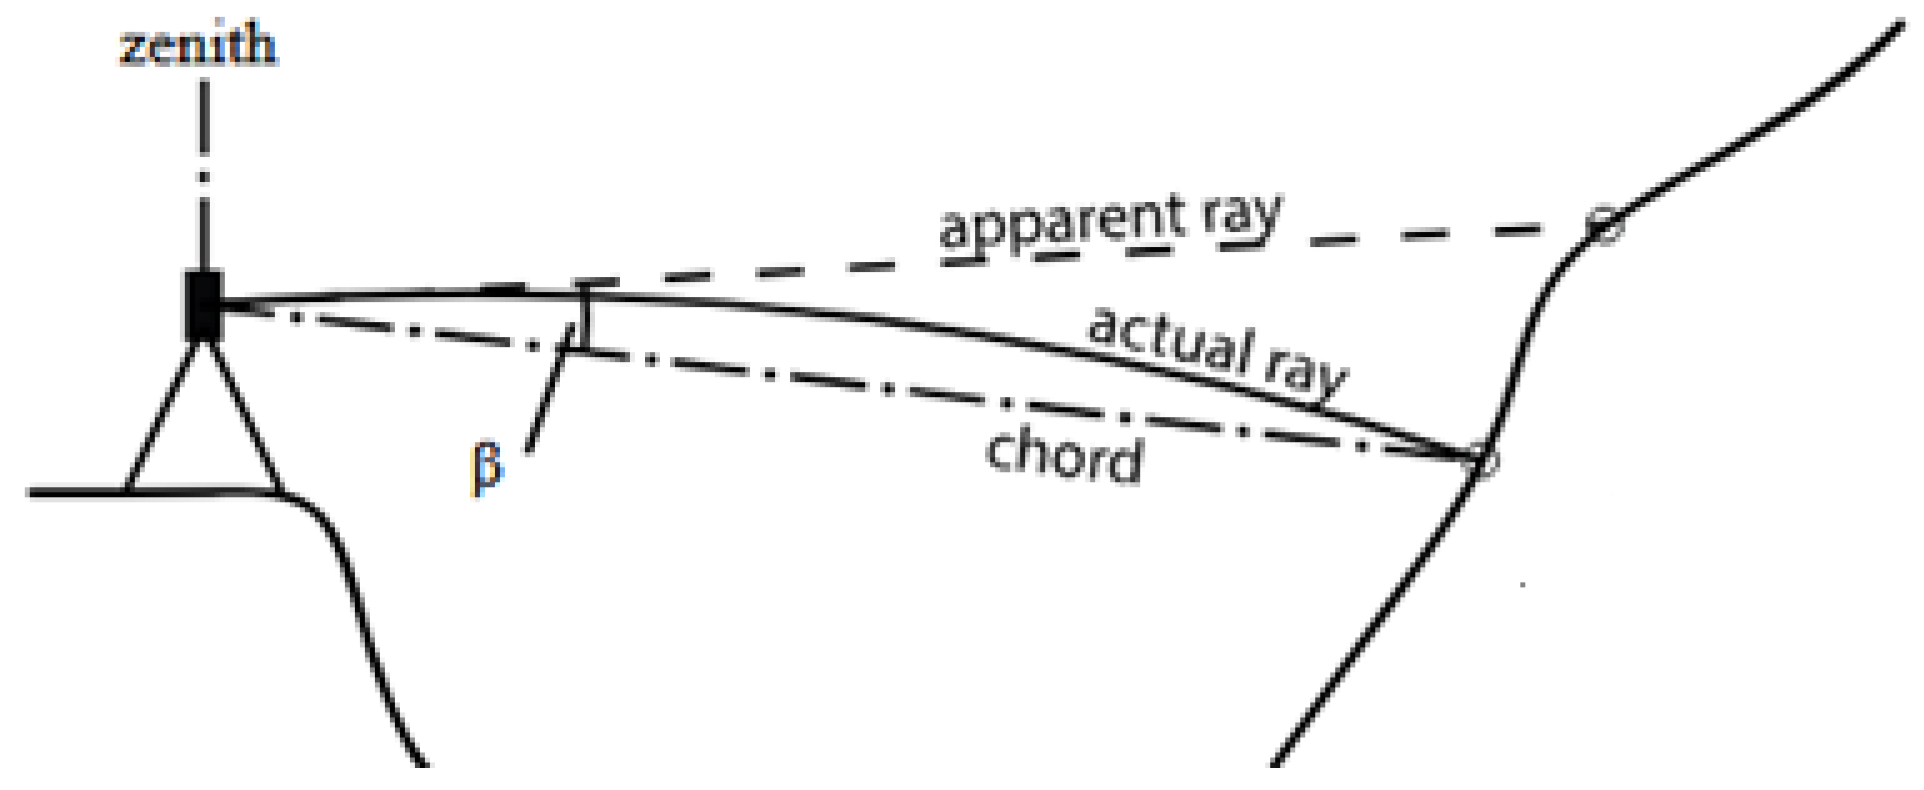
Figure 8 graphically represents the geodetic refraction of the line of sight between the instrument and the scanned scene (i.e., the straight line (real ray or chord) is the corrected path of measurement, and its deviation to the actual ray creates a deviation in range and potentially angle measurements.
The quantification of geodetic refraction via the refractive index n or refractivity N = (n − 1) × 106 (i.e., both are unitless variables) has been repeatedly studied and examined by different scientists to achieve updated results since the 19th century. The studies were sorted by years [93,94,95,96,97,98,99,100,101,102,103,104,105], and the model adopted by the International Association of Geodesy called the closed formula [106] from [103,104,107,108]. Under each proposed notion for refractive index modeling, at least three components of atmospheric conditions were evaluated—the most notable ones were air temperature, atmospheric pressure, and the relative humidity of air.
As an example, the updated version of the closed formula in 1999 was reformulated as seen below [106]:
N = n 1 × 10 6 = 273.15   N g P 1013.25   T 11.27   e T ,
where N g is the group reflectivity (to differentiate, the group refractive index n g determines the speed at which energy or information travels through a medium, while phase refractive index n p h governs the propagation of individual wavefronts. These can simply be converted using the wave number σ in μm−1, which is reciprocal of wavelength λ ( n g = n p h + σ d n p h d σ ) [103,108]) as a function of wavelength λ, T is the temperature in K, P is the pressure in hPa , and e is the relative humidity (refers to the water vapor pressure of air) in hPa. Therefore, the bending of the ray must be considered, as the laser experiences different atmospheric variations while passing through different media (i.e., that might take place several times along the path). The detailed theoretical developments of each model and the updated version of atmospheric model for the range measurements were entirely attained in [32].
Having the partial derivation of the refractive index n x , y , z with respect to 3D Cartesian coordinates, the refractive index can be rewritten as follows:
n = n x i ^ + n y j ^ + n z k ^ ,      
The elements on the horizontal plane n / x n / y affecting the horizontal angle are called the horizontal gradients of refraction (or lateral refraction), while n / z refers to the vertical gradient of refraction. Given any proposals argued above for refractive index modeling (Equation (6)) [32], the partial derivations with respect to at least three atmospheric conditions (horizontal and vertical gradient of temperature ∇T (K/m or °C/m), pressure P   hPa m , and humidity ∇e (hPa/m)) are determined by [109]:
n = n T T + n P P + n e e ,
To investigate each gradient component of atmosphere, interested readers are referred to [109,110]. Accordingly, the following sections, however, elaborate the influences of varying gradient refractive indices on three spherical coordinates, their relevant mitigation strategies, and numerical results found in the literature, which might be proficient toward long-range terrestrial laser scanning calibration.

4.1. Range Refraction

Range refraction plays the dominating role in computing the 3D Cartesian coordinates of the points (Equation (2)). As seen in Figure 8, the approximation of the curve to straight line— r c , the corrected range—accounting for the refractive index n x , y , z over the measured range r o (actual ray) is depicted below [111,112]:
r c = o r o d r n x , y , z ,
To address the range refraction, the index of refraction must be precisely determined along the entire length of the sight line. However, monitoring the refractive index variation along the path is not straightforward due to the nature of the problem. Additionally, no viable instrument is capable of measuring and recording the refractivity of the line. Therefore, referring to EDM calibration, it is theoretically reported that the estimation of the refractive index must have the precision at a level of [1–8] × 10−8 by introducing the mean values of the refractive index from both ends of the line [112].
M. Sabzali et al. [32] aimed to update the current atmospheric error model for range measurements as the result of an extensive research on the proposed parameterizations of the refractive index in the literature. The research indicated numerous different sets of calculations and eventually concluded on the appropriate algorithmic steps for range calibration datasets. The improved version of the model was mathematically validated for two types of range measurement techniques—time of flight (TOF) and phase-based—under simulated and real variant atmospheric conditions ( 10–40 °C, 600–110 hPa, and 0–100% for temperature, pressure, and relative humidity, respectively). This effect, occasionally mentioned in the literature, refers to the first velocity correction for TOF EDM due to the time differences in the calculation of range. Since TOF scanners are ideal for long-range scanning rather than phase-based scanners, this source of error brings a meaningful consideration for TOF’s inherent scanning mechanisms.
Subsequently, the findings from variant environmental conditions (i.e., dn refractive index variations) can be updated as follows [32,112,113]:
d n × 10 6 = 0.93   d T + 0.28   d P 0.039 d e ,      
where a single rise in temperature (either dT in K or dt in °C) introduces a refraction of −0.93 ppm, and the single increase in atmospheric pressure dP (hPa) and relative humidity de (hPa) delivers 0.28 ppm and −0.039 ppm refraction, respectively, over the measured range.
The refractive index variation dn —the difference in atmospheric conditions from the first to the second medium—is sometimes referred to as second velocity correction in the literature. As previously discussed, to achieve the desirable precision of the refractive index, the second velocity correction is typically applied (i.e., the atmospheric conditions of two ends are precisely recorded, and the average of the refractive index is employed). In most cases, for either end, the reference refractive index n r e f according to the default manufacturer setup is assumed [114,115]. Despite the ambiguous condition of the reference refractive index for the laser scanner devices, among the users of the technologies and inconsistency of the refractive index across the line of sight, it is suggested that the simultaneous calculation of both the first and second velocity correction after the precise acquisition of atmospheric conditions is sought.

4.2. Angle Refraction

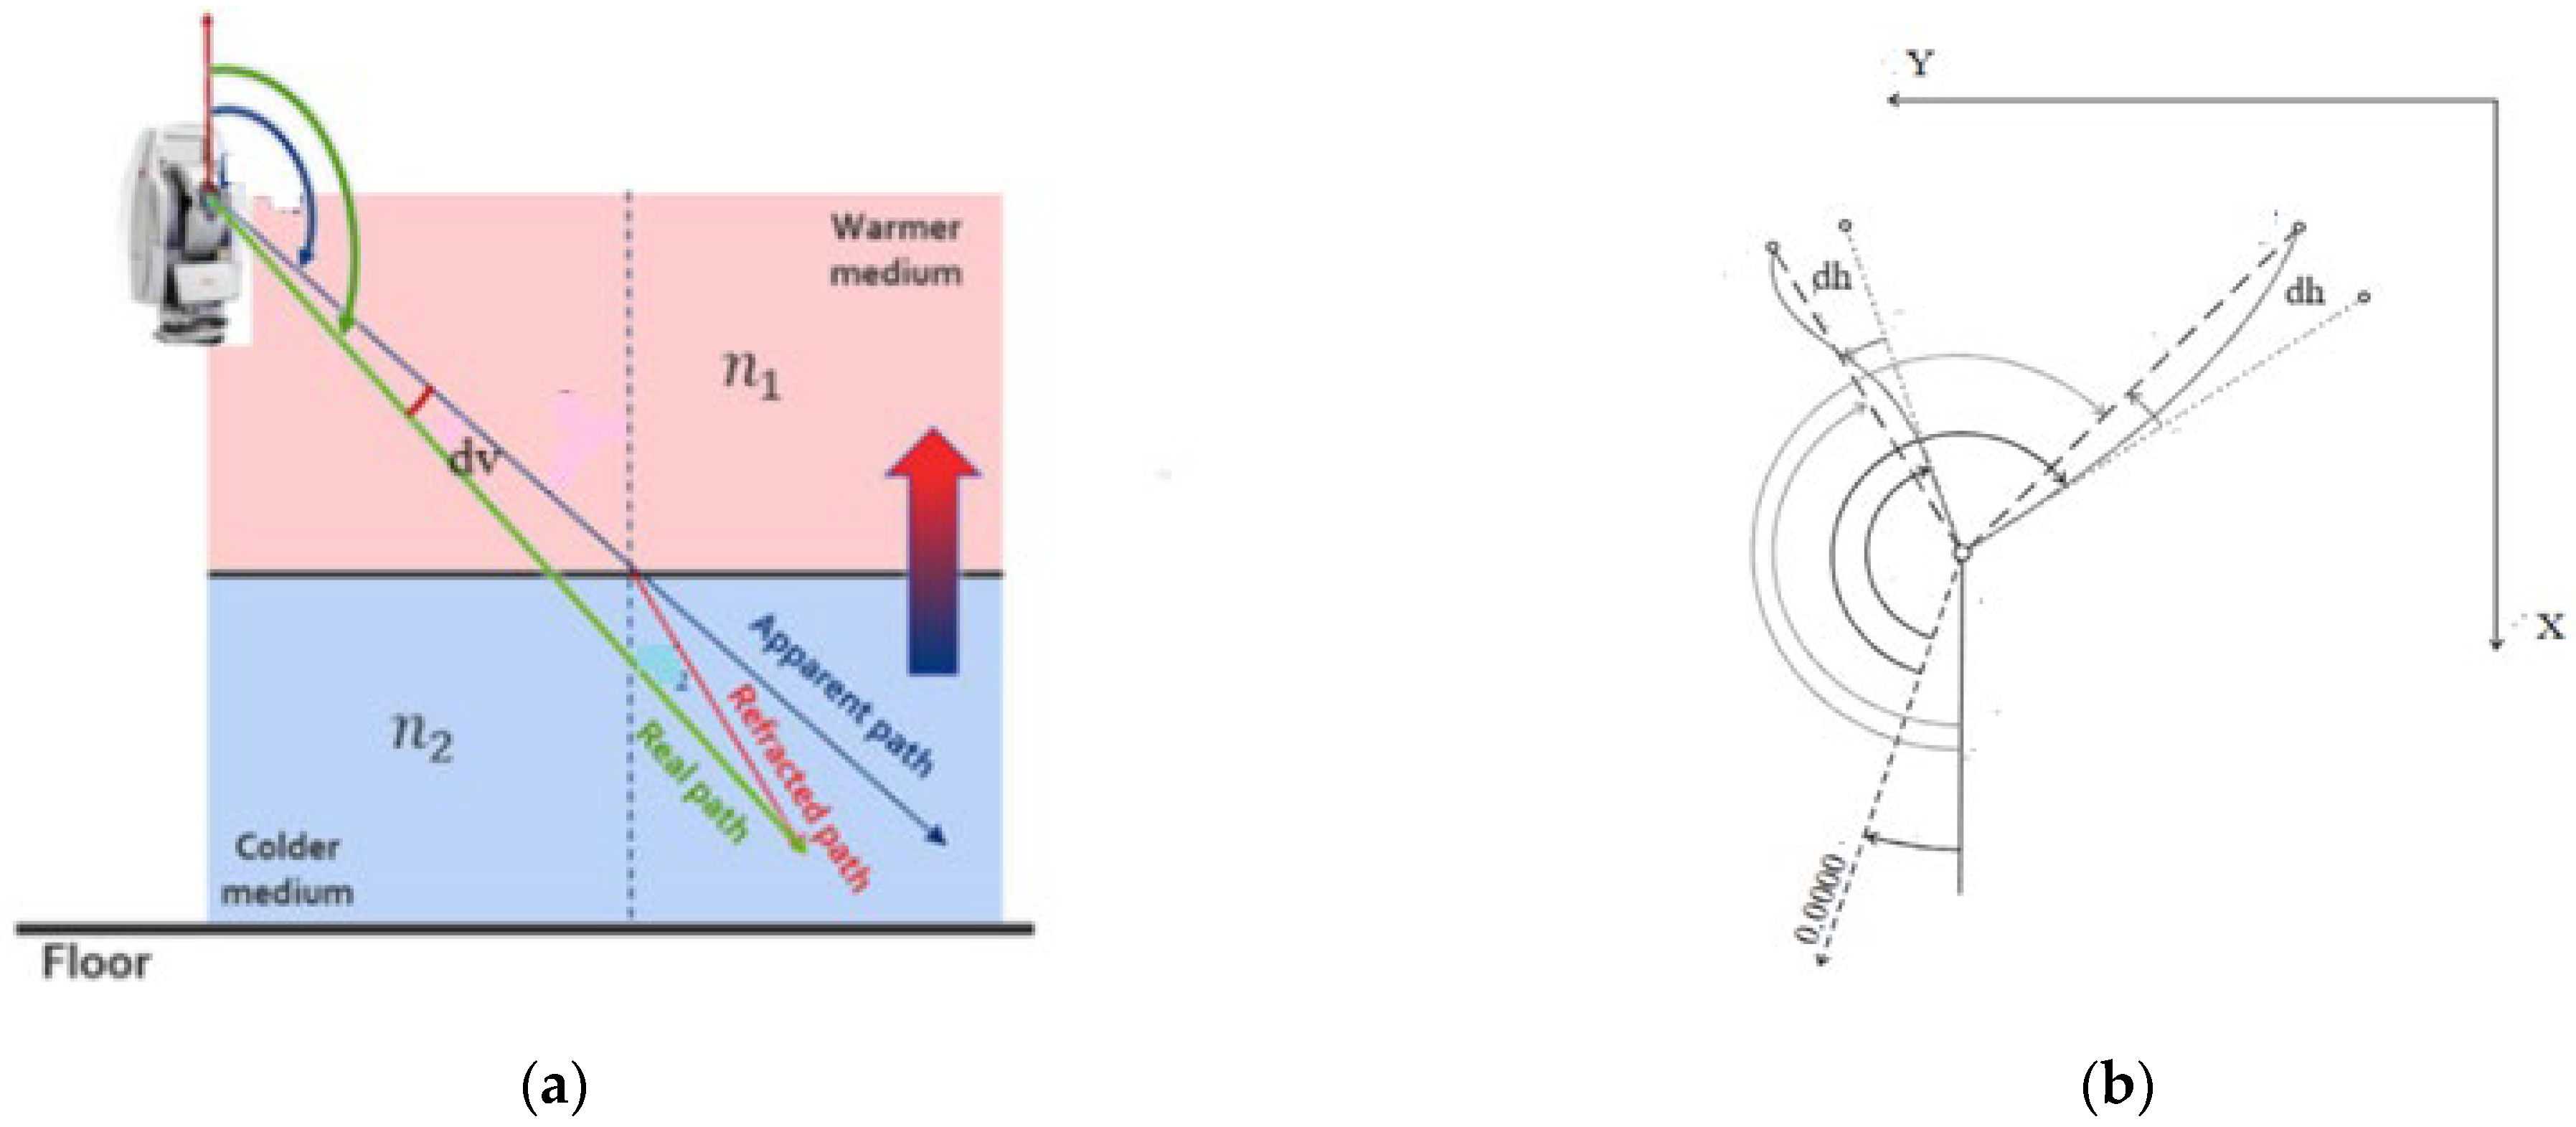
The horizontal and vertical gradients of refractivity over the line of sight directly influence the measured angles in the separate planes in a decorrelated manner (Equation (7)). In terms of their magnitude, horizontal refraction is about one or two orders of magnitude less than vertical refraction [111,116]. Figure 9 illustrates the effect of refraction on the vertical angle (left) and horizontal angle (right) measured using surveying instruments:
Given Equation (7), vertical and horizontal gradients of the refractive index over the entire path, with respect to the vertical and horizontal gradients of temperature, pressure, and humidity (mentioned in Equation (8)), can be rewritten as follows:
d v = o r o 1 n n z d r ,   d h = o r o 1 n n y d r ,    
Here, n y and n z correspond to the horizontal (suppose y is the direction of measured horizontal angle) refraction and vertical refraction, respectively.
In [109,110], several discussions on the precise determination of each gradient component of the atmospheric conditions were provided with respect to multiple atmospheric layers vertically and horizontally. Accordingly, the corresponding horizontal and vertical gradients of the refractive index with the aid of simulated and real acquired datasets were advised under the uncontrolled environmental conditions. The findings indicated that to implement refraction error modeling for terrestrial laser scanning, the correlation between the gradients of refractive index must be resolved. For more thorough studies of refractive indices, interested readers are referred to [32,109,110].
Under the proposed theoretical developments, the refracted vertical angle and refracted horizontal angle from the variation in the vertical gradient and horizontal gradient of refractive index d n z and d n y , respectively, result in [109,110]:
d n z = 0.00026 d T 0.00004   d P · r o ,
d n y = 0.001 × 10 6 d T + 1.7 × 10 6 d P · r o ,
where the variation in temperature either in K or °C and pressure (hPa) respectively brings 0.26” and −0.04” refraction over the measured vertical angles (for instance, within the assumed range of observation 1000 m with insignificant impact from humidity on angle measurements), while those values are considerably trivial for refracted horizontal refraction within the assumed range. In summary, a higher precision than [1–8] × 10−8 to estimate the refractive index along the entire line of sight is required, and following that precision, the decomposition of the index into three spherical coordinates in a decorrelated manner ensures a secure uncertainty assessment for systematic errors related to atmospheric effects in terrestrial laser scanning.

5. Scanning Geometry (S.G)

The scanning geometry is recognized as another error source involved in the system calibration of terrestrial laser scanning. It refers to the entire configuration of measurements including the locations of the targets and scanners (scanning geometry). Worth clarifying, the elements, highlighted under scanning geometry and object- and surface-related issues, are the contributing factors in determining the spatial calibration (geometric uncertainty) and intensity calibration (radiometric uncertainty) of laser scanning (i.e., the separation was generated in Section 2).
Therefore, although S.G is likely to inter-relate with some occurrences in the object and/or surface of targets (O.S) (with varying weights), three key parameters of scanning geometry as the most prominent error sources were retrieved from the literature and are expressed below [120]. The scanning configuration is composed of:
  • TLS placements (i.e., the optimal condition of the scanner locations to have full coverage of the scene);
  • Geometric resolution (i.e., the concern refers to the geometric point spacing between two consecutive points);
  • Incidence angle (i.e., the incidence angle here regards the angle of incidence ray when it strikes the target).

5.1. TLS Placements

In principle, TLS placements (or sensor placement) refer to the positions of the sensors (either relative or absolute positioning) to fulfill the pre-defined criteria such as the point density (Section 5.2), the acceptable quality from the individual point in terms of reflectivity (Section 5 and Section 6), and specifically, full coverage of the scanned targets. Relative geometry fundamentally describes the relative placements of the TLS (relative surface orientations of the TLS with respect to the scanned objects), while absolute geometry refers to the georeferencing or known orientation parameters of the scanner locations with respect to the scanned targets [121,122]. The division of scanning geometry might be partially responded to in the FOD of geodetic network design for instrumental abnormality calibration with the aim of maximizing the precision and minimizing the correlation of the parameters of bundle block adjustment [75] (Section 3.1.2).
There have been several proposals in the literature regarding TLS placements to ensure the level of detail of the scanned objects such as the greedy approach [123], art gallery problem [124], set-coverage problem [125], nondeterministic polynomial (NP) complete problem [126], next-best-view algorithm (NBV) [121,127,128,129], etc. However, not all of the proposed approaches for the purpose of terrestrial laser scanning calibration have been evaluated throughout the literature.
As an example, the principle of greedy approach acknowledges that by moving the scanner location 2   m closer to the targets, the point cloud quality can be enhanced by 25 % [123,130]. Furthermore, the derived horizontal cross section from the edges of the scanned room was able to define the level of 3D visibility of the TLS placements (they refer to viewpoints [123,130,131]). This was completed by imposing the constraints of two uncorrelated factors—the incidence angle and range constraints—to detect the optimal scanner locations, which can be improved as a result of integrating several scanner heights. However, the impact of the other techniques of TLS placements on calibration test practices are still under discussion among TLS researchers. In summary, although every proposed method of TLS placement plays a necessary role in the determination of the level of spatial characterization of the scanned objects, it was demonstrated that the level of radiometric strength of the laser pulse from the targets is influenced depending on the measured range and incidence angle [120,121].

5.2. Resolution

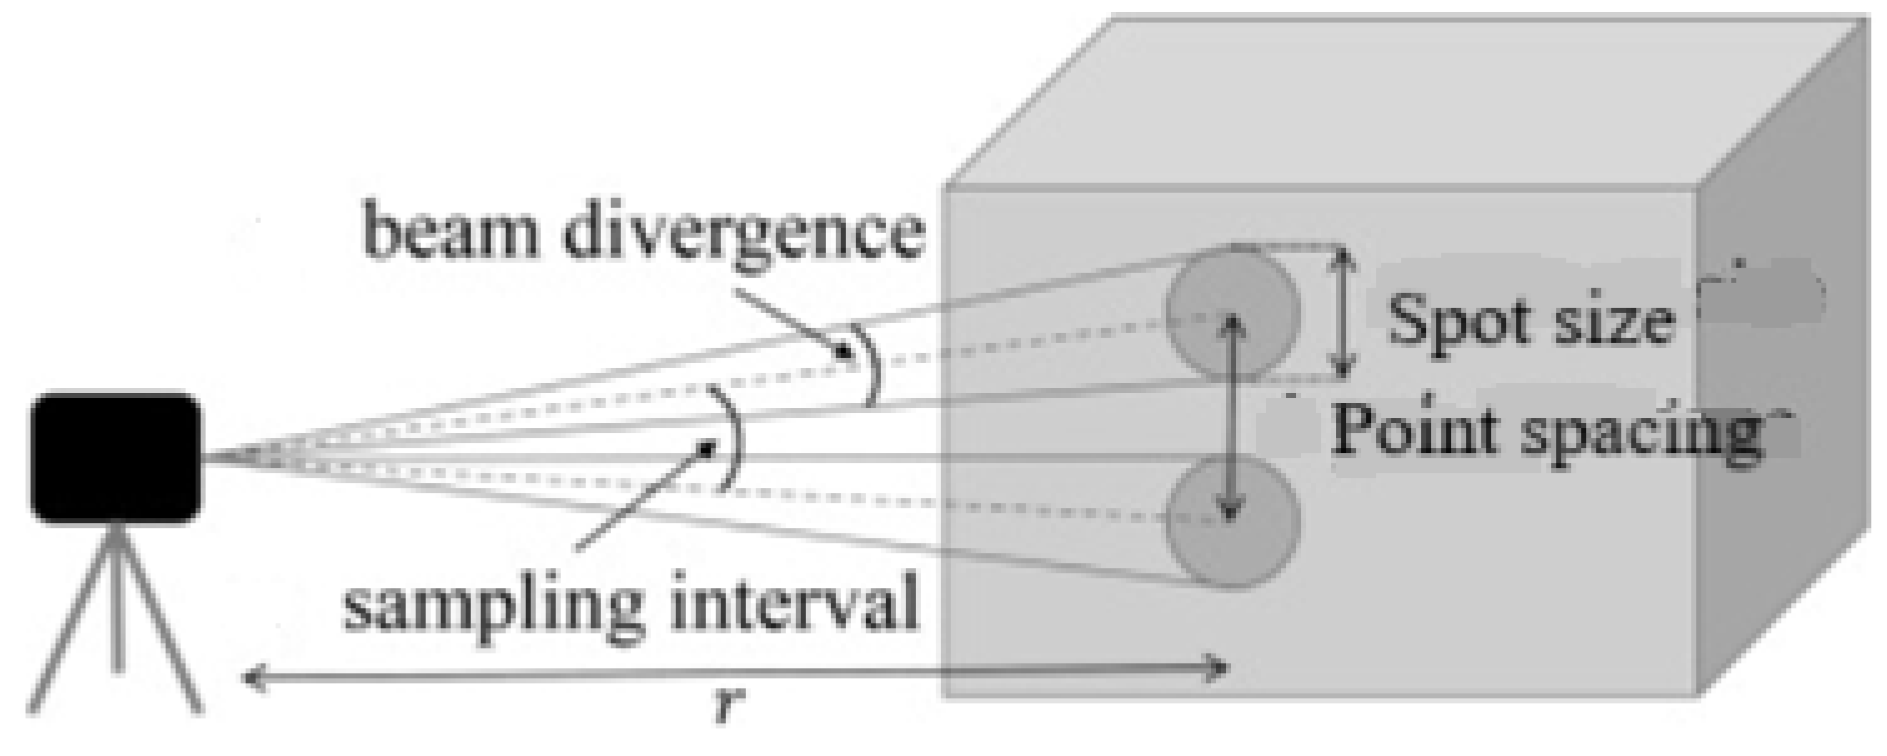
One of the leading attributes of a 3D point cloud is the attached resolution or point density. Hence, the point density of laser data generally quantifies the number of measurements within the defined dimension of measurement [132,133]. The point density in the areal dimension embraces the areal resolution, and the point spacing referring to the gap between two adjacent points horizontally and vertically is angular resolution. Figure 10 shows an example of angular resolution vertically.
According to Figure 10, determination of the geometric resolution of TLS is not a straightforward task, since it is dependent on several radiometric characteristics of the laser such as sampling interval, beamwidth (beam divergence), and spatial quantization (such as the measured range and incidence angle of a single pulse) [44,135,136]. To overcome the difficulty of overlapping effects between the sampling interval and beam divergence (when the sampling interval is smaller than beam divergence), their correlations were identified and introduced as the stochastic parameter [134]. This enables the resolution values to be dependent on spatial quantization (range and angular accuracy). Additionally, D. Lichti [135] described the effective instantaneous field of view (EIFOV) based on the three above factors. The angle is derived from an ensemble average modulation transfer function (AMTF) that enables projecting positional uncertainty due to varying sampling intervals and beamwidths. From a geometric perspective, the angle is the width of the average point spread function. The other relevant research on this angle clarified a reasonable distinction between the sampling interval and beam divergence [136]. When the sampling interval is larger than the beamwidth, the derived angle is equal to the EIFOV (very accurate conditions where the sampling interval exactly represents the resolution); otherwise, when the sampling interval is 55 % of the beamwidth, the beamwidth is equal to the EIFOV (where beamwidth represents the exact resolution). R. Yang et al. [137] later aimed to formulate an updated version of the algorithm depending on three simplified relationships: (1) when the EIFOV is equal to the sampling interval, (2) when the EIFOV is equal to the laser beamwidth, and (3) between the theoretical minimum EIFOV and angular quantization. The research summarized that the simplified version of parameterization had direct significance on the angular resolution and sampling interval, and could be improved by the underlying assumption of the parametrization [137].
Apart from the two above categories of resolution (either areal or angular), the other classification of spatial resolution for a TLS is range resolution (the capability of the point distinction in range within the single emitted pulse) [138]. Even though there have been inadequate studies considering the range resolution of TLS systems compared with angular resolution, a broad study for airborne laser scanning was presented in [138]. The research greatly emphasized range resolution parameterization for different range measurement techniques (TOF and phase based) and advanced the current version of formulation for airborne platform laser scanners. However, the principles and theories provided in the work can be extended toward TLS range resolution due to its similarity to the range mechanism system.

5.3. Incidence Angle

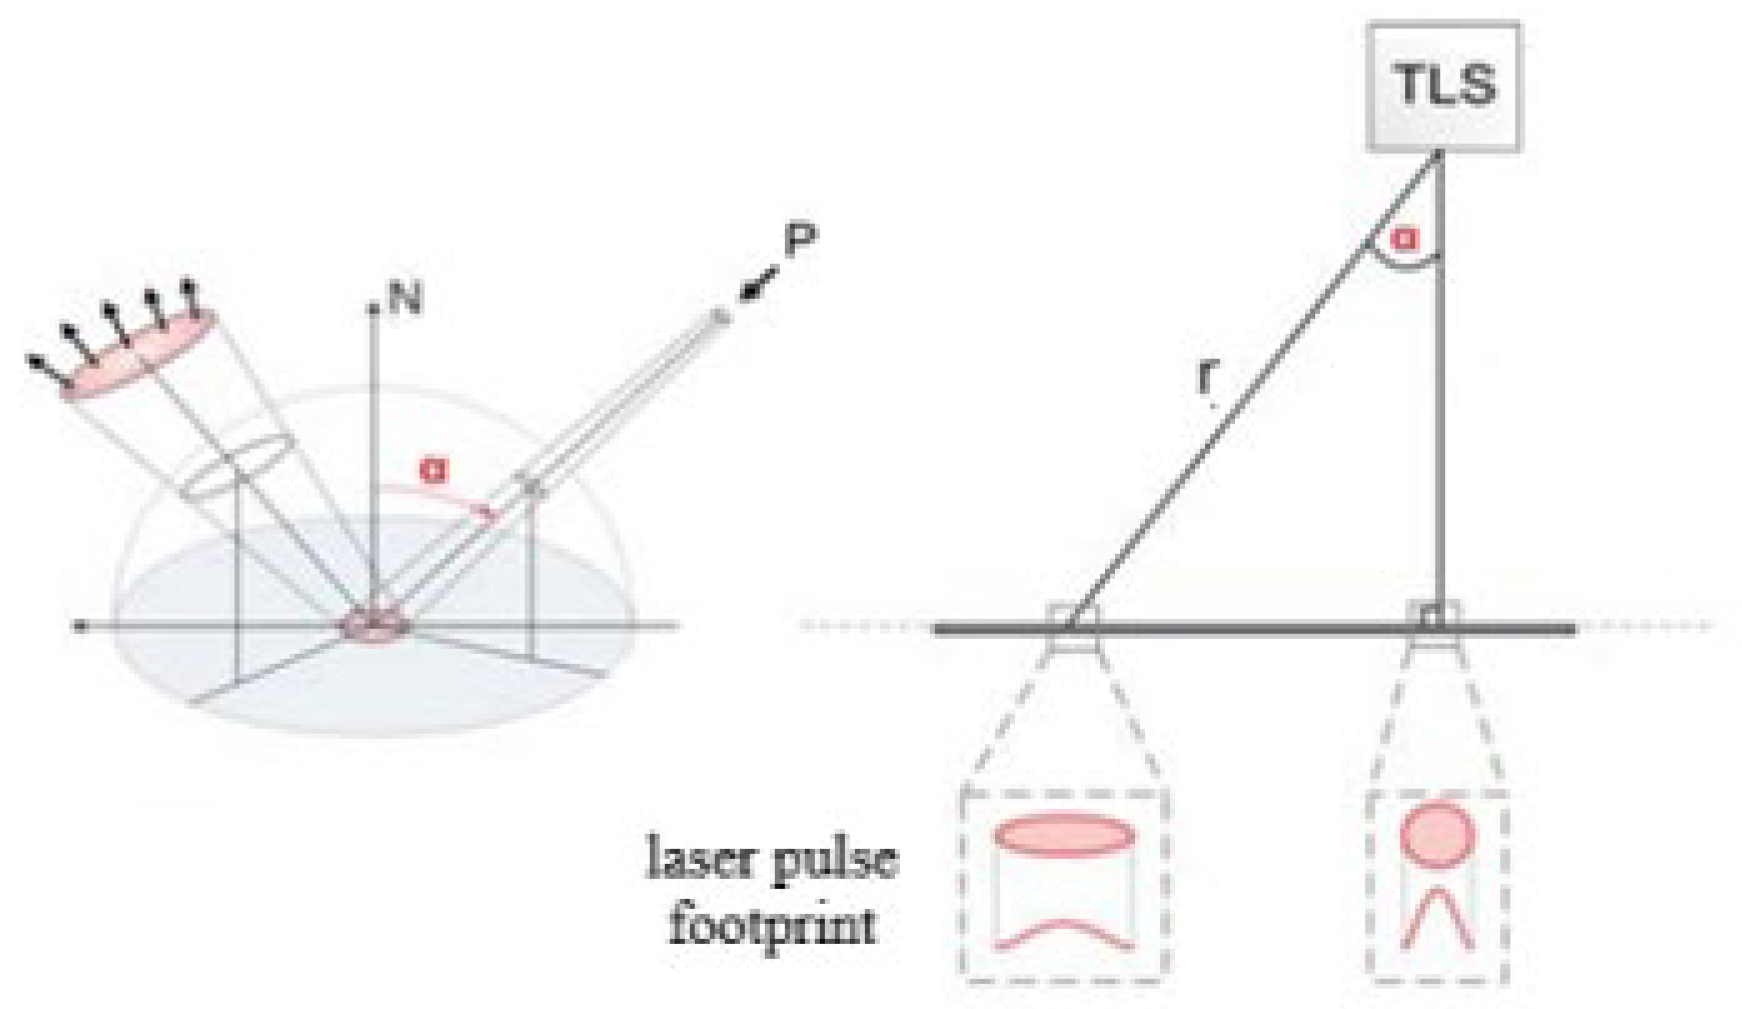
The third important impact of S.G on the uncertainty of 3D observations is the incidence angle. The incidence angle was detected as the largest contributing factor to regulate the level of reflected signal strength [120]. The incidence angle α is the artificial angle defined between the laser beam vector P and the surface normal vector N   . This angle plays a crucial role in characterizing the reflected signal from the surfaces of targets [120]. Every measured point in a 3D point cloud is accompanied by a corresponding incidence angle (Figure 11).
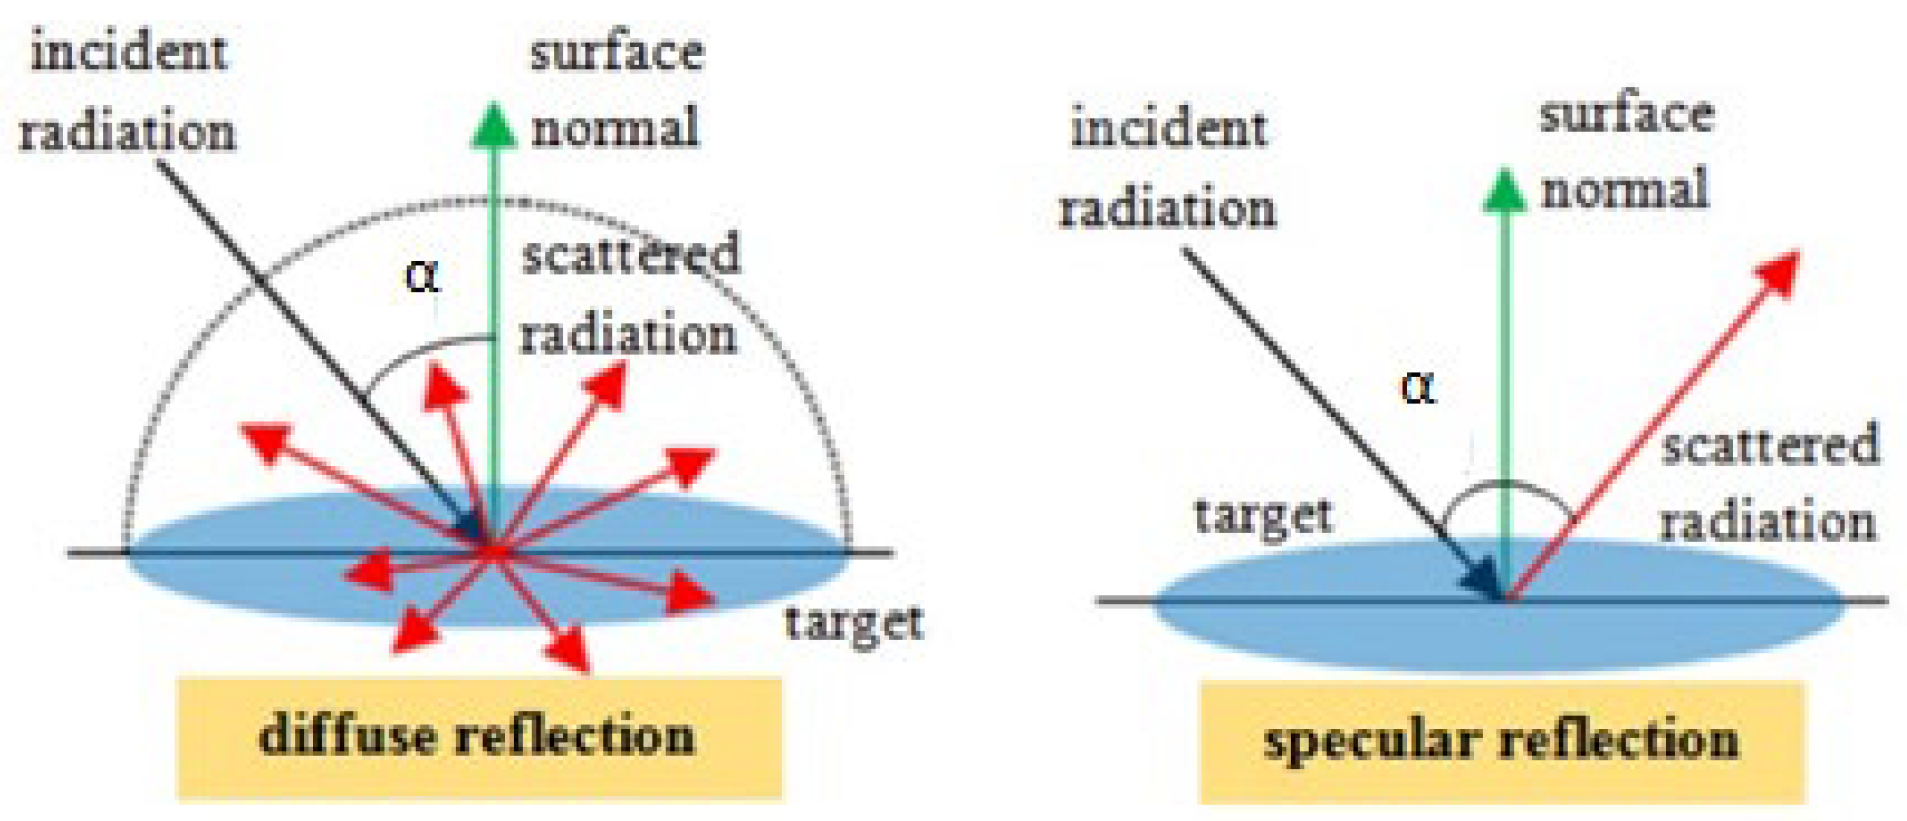
The ideal condition of the incidence angle is zero (the shape of the laser pulse footprint is round rather than elliptical). However, it seldom occurs in nature, and therefore, due to the different patterns of the reflection, the incidence angle is not identical to the back scattered angle [139,140]. Figure 12 compares two types of the reflectivity of a returned signal concerning the incidence angle α.
Reflectivity of the surface is the ability of the surface to reflect the incident radiation. When a beam generates the specular reflective return, the reflection is equal and all directed in the same direction (mirror like), meaning that it is uniformly illuminated by the laser beam. Specular returns are frequently referred to as a glint, and the phenomenon is unlikely to happen in nature. Alternatively, the reflected signal is scattered over a large volume and non-uniformly in different directions. This phenomenon is called diffuse reflection (i.e., this is the possible condition of reflection in nature). The perfect diffuse reflection is defined as Lambertian reflectance. More illustrations of reflectivity can be found in [139,142,143,144].
The dominating backscattering signal is diffuse rather than specular. To resolve the reflectivity pattern of the surfaces, the bidirectional reflectance distribution function (BRDF) plots of real surfaces typically display a combination of these two components: (1) specular reflection, whose root mean square (RMS) values of the smooth surface are significantly less than the laser wavelength, or generally trivial, and (2) Lambertian (diffuse) reflection, whose root mean squares of the rough surface is of the order of the laser wavelength or larger (based on the Rayleigh condition). The Rayleigh condition in the context of optical systems is used to define the minimum resolvable detail based on diffraction. It is expressed as ( θ = 1.22 λ D ), where λ is the wavelength, D is the diameter of the aperture in the same units, and θ is the angular resolution in radian. Then, the RMS from a multiple number of measurements N can be computed by R M S = 1 N i = 1 n θ m e s u r e d , i θ R a y l e i g h , i )) [139,145,146].
This effect on the quality of terrestrial laser scanning data was examined for the first time by [145] and in follow-up studies [120,145]. Their research proposed the two-way energy budget equation from the concept of the radar range equation to realize the characterization of the received signal to corresponding noise (signal to noise ratio (SNR)). The equation is the attenuation of the signal due to propagation and other possible deteriorations and are presented as follows:
P R = P T π γ cos α 4 r 2 η s y s   η a t m ,
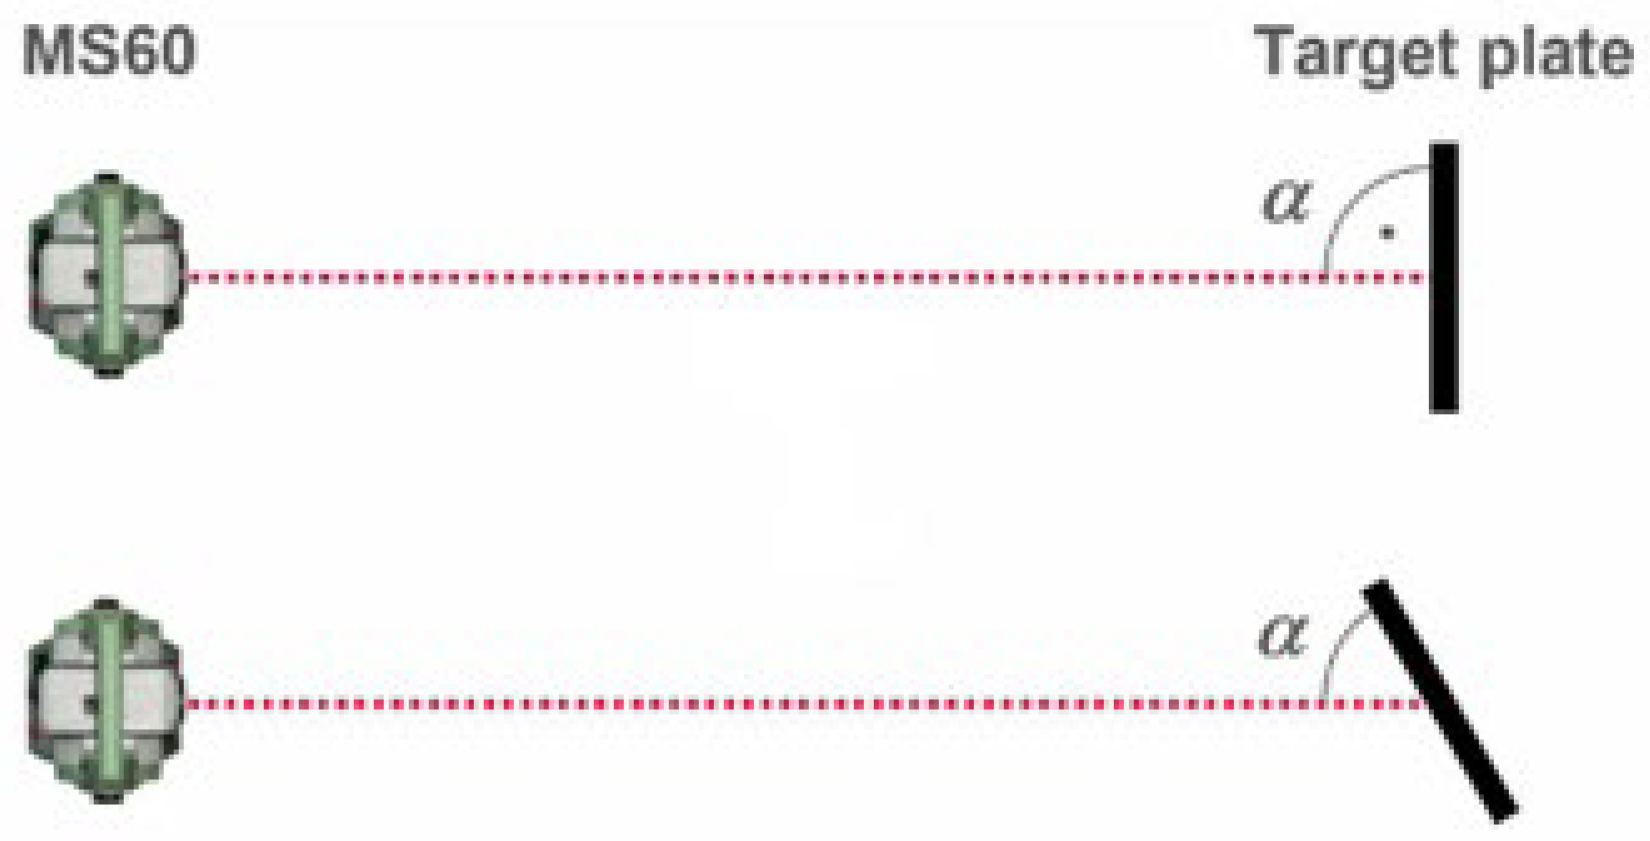
Here, P R , and P T are the received power and transmitted power, respectively W a t t , r is the laser beam range, α is the incidence angle, γ is the reflectivity of the material (dimensionless), η s y s and η a t m are the system and atmospheric losses, respectively (i.e., they account for the losses of beam propagation through the optical and atmospheric path). The experiments in [120,145] included scanning a reference plate from an arbitrary fixed location under the variant condition of range and incidence angle. It follows that an incidence angle higher than 60° at the fixed range of observation significantly dominated the entire scan point precision. In addition, it was demonstrated that more noise occurred in the measurements (more than 20%) when the incidence angle increased in the variant condition of the range.

6. Object- and Surface-Related Issues (O.S)

The effects of scanning geometry on the strength of the received signal are expressed as one of the influencing factors in both radiometric (intensity) and spatial (geometric) calibration. However, there are many other components dominating the level of strength and reflectivity of the backscattered signal. Essentially, the characteristics of the targets are the other notable error sources of terrestrial laser scanning calibration (Equation (14)). The dominating errors are related to the inherent qualities of the targets including color, material, roughness, and albedo as well as the exterior formations of the targets such as edges, tilted surface, or irregular topographies. In the following sections, a description of each item alongside the proposed mitigation guidelines realized in the literature are provided.

6.1. Material

The material of the targets is one of the contributing factors to reflectivity and change in the direction of the incidence angle, leading to the variant quality of the spatial and intensity values. The testing arrangements in [147], including nine samples of different materials such as red brick, limestone, white granite, black coal, concrete, limestone block, basalt, laterite, and white quartz, aimed to investigate the noise in the measured range and level of intensity values of those materials under short- and long-range scanning between 3 m and 53 m. Spatially, the findings anticipated that no significant range errors occurred in the acquired datasets under investigation; however, from a radiometric point of view, the materials strongly interacted with the distribution of the range measurements and return signal intensity. Thus, it was verified that the intensity values decrease with the increase in distance to the targets [147]. In another body of research, D. Bolkas et al. [148] considered two types of material: flat and semi-gloss textured targets. From their research, it was concluded that semi-gloss textures can reduce the noise more effectively than flat targets due to their exterior formation and intrinsic irregularities.

6.2. Roughness

Apart from the interior characteristics of the targets, the roughness of the scanned targets is the second impelling criterion on the incidence angle and corresponding power of the reflected signal. The roughness of the objects in previous studies was revised using two general methods of investigation: numerous geometrical calculations and surface roughness analysis. The former is a qualitative assessment of the visual evaluation of the roughness, while the latter is quantitative analysis allowing for standardized analyses of the surface [142,149]. Further studies can be found in the literature concerning surface roughness determination using optical instruments with specific aims in structural engineering with an adequate understanding of striking the laser on rough surfaces such as surface reconstruction from point clouds [150], roughness quantification methods for concrete surfaces [151], a comparison of surface roughness measurements [152], 3D laser imaging for surface roughness analysis [153], etc. However, there could be future pathways toward surface roughness calibration in terms of intensity and the spatial calibration of TLSs [15,19].

6.3. Color

Color and ambient light behind any given color cause other sources of error in individual point quality in terms of both intensity and spatial values [154]. This influence was primarily tested by [155]. In their experiment, a Macbeth color target (https://en.wikipedia.org/wiki/ColorChecker, accessed on 20 May 2025) was scanned in three variant range setups, close (less than 4 m), near (4 m to 6 m) and far range (7 m to 8 m), and the residuals of each color patch against the reference color with known reflectivity (e.g., neutral 8 gray color) were computed. The corresponding correction factors from geometric range distortion for every color were ultimately determined.
To validate the geometric range distortion, the Macbeth color target was again verified under the different illuminants with respect to the reference plane [154]. The individual distortions in range for each color under each illumination were indicated, and it was specified that the lighter colors exhibited a higher reflectance, higher point density, and minimal noise level than darker colors (i.e., typically black, red, green), recording less reflectance, less point density, and maximal noise level with higher attached range distortions.
Later, an alternate thorough intensity calibration was suggested in [156] to empirically model the three components of reflectivity, incidence angle, and range simultaneously with the aid of the laser range equation (Equation (14)). To implement the predicting algorithms, six laboratory setups at varying distances, incidence angle, and known reflectivity were intended. After the data analysis, the intensity was logarithmically predicted as a function of range based on the square inverse law but irrespective to the incidence angle and reflectivity. The principal methodologies indicated the range as the prime source of radiometric calibration of terrestrial laser scanning [156,157]. However, D. Wujanz et al. [158] also reflected the importance of polynomial prediction functions with respect to the range, incidence angle, and reflectivity for the robust investigation of the intensity values. The results showed that the applied parameterization of intensity does not necessarily lead to noteworthy variations in the results. It is worth pointing out that there was a reasonable reduction in the standard deviation of the observations after the proposed intensity correction factors were yielded.

6.4. Albedo

Albedo is the measure of a certain material’s ability to reflect the radiation emitted from the Sun [159]. This effect must be resolved in a different manner in comparison with inherent illumination behind each color of the targets since the main source of deviation here is external radiation from the Sun. The concentration of albedo on the quality of the 3D point cloud has not been adequately investigated in the literature. However, for future calibration guidelines, the theoretical developments and practical investigations executed for albedo resolution on satellite images are highly recommended (i.e., this impact has been mostly underestimated due to its perceived insignificance) [159].

6.5. Tilted and Edged Surface

Apart from inherent and external features of the scanned target, the geometric formations of the targets, such as their irregularities and topographies, play an integral role in reflected signal. The angle of back scattered signal changes with respect to the direction of tilted surface (as the result of the change in incidence angle). The ideal condition of reflectivity, as discussed already, with zero incidence angle is unlikely to occur.
In Figure 13, the incidence angle for the tilted objects predominately influenced the level of noise and precision [130]. In addition, the abnormal shape of the targets (either irregular or edgy formation) created a substantially different quality of scanned data spatially and radiometrically (Figure 14).
Depending on the laser spot size, a smaller laser spot size introduces a smaller footprint on the target for measurement, whereas a wider laser spot presents more inaccuracies into point measurement (i.e., the corresponding beamwidth projects the spot size on the surface). Therefore, this highlights the issue of overlapping neighboring laser pulses and the difficulty determining not only the precise spatial measurements, but also the reflected intensity values. For example, it has been reported that more accurate distance measurements and a higher intensity take place close to the edge parts of a surface [3]. However, edgy surfaces impact a number of other contributing qualities of 3D point clouds such as the incidence angle and reflectivity itself. These must be addressed using various sample targets. Subsequently, the existing characteristics of scanning and targets, as outlined in Section 5 and Section 6, vary the level of reflectance of the surfaces and radiometric uncertainty of terrestrial laser scanning.

7. Current Challenges and Paths Forward

In this section, the current challenges and future pathways toward a rigorous system calibration of terrestrial laser scanner and/or scanning are discussed. These aims were fulfilled according to the identified knowledge gaps in the literature. In the first attempt, it was presumed that underestimating any of the error sources in a broad calibration study of terrestrial laser scanning would ultimately predominantly lead to an unacceptable standardization of calibration practices. Hence, further explorations must be devoted to consider all four geometries simultaneously in 3D point cloud calibration, with specified varying weights depending on the purpose of the quality assessment: verification, calibration, or validation.
This review classified two major calibration strategies for scanner abnormalities: system calibration and component calibration. Although in recent years the current trend of scanner calibration acknowledges that system calibration outweighs component calibration, underscoring geodetic network design knowledge, component calibration for the detection and mitigation of the specific misalignment by using innovative surveying techniques should not be overlooked, in order to eventually achieve a unique consistency of calibration methodologies among multiple TLS systems (i.e., invariant standardized protocol for different devices). The distinguished advantage of system calibration, as stated earlier, is less dependency on the detailed study of misalignments individually. However, to accomplish satisfactory development for all misalignments (i.e., calibration parameters), the reasonable implementation of geodetic network design must be realized [75].
To resolve the ZOD of system calibration, supplementary insights into photogrammetry, especially from modern computer vision principles (e.g., collinearity conditions, coplanarity conditions, and direct linear transformation (DLT)) can be incorporated to reparametrize the exterior orientation parameters of bundle block adjustment to optimally enhance the quality of the estimated calibration parameters [75]. Similar to the existing awareness for camera calibration, further theoretical improvements are recommended [66,160,161,162,163]. Additionally, the sophisticated guidelines outlined in the literature for FOD, such as introduced distribution functions [27,77], ray tracing methods [88], etc., are a potential field of research to address an analytical situation rather than a heuristic simulation. It is worth elaborating that so far, numerous presented approaches have concentrated on trial-and-error and/or empirical simulations. Alternative feasible strategies, such as modifications of the criterion matrix borrowed from geodetic network design [61,69], enable the articulation of the FOD toward mathematical optimization. These principles guarantee the maximum level of precision and accuracy for the whole network. For SOD, the employment of the manufacture-dependent stochastic model (i.e., the standard deviations as reported by the manufacturers) must be limited. Instead, the number of statistically developed tools such as the Guide to the Expression of Uncertainty in Measurement (GUM) [164], Monte Carlo [165], etc. can be undertaken to determine the realistic precision and correlation of the measurements according to their nature. Next, apart from the criteria exposed for system calibration in the literature, such as precision, correlation, and uncertainty, as the most crucial ones, several other criteria, such as efficiency, reliability, and sensitivity, are worth further investigating in order not to propagate the impact of unreliable measurements in the approximations.
From a practical point of view, there have been many applications of the device for long-range terrestrial laser scanning under uncontrolled environmental conditions compared with laboratory applications under controlled environmental conditions. For example, to reconstruct surface-related monitoring tasks, laser scanners have been increasingly used in place of traditional optical sensors such as cameras, particularly in recent years [14].
Thus, inadequate or partial thought of the laser interaction, from an optical perspective in terms of refraction and reflection, might degrade the quality of the spatial and intensity deliverables. This generally results in untrustworthy error characterization. Refraction and other impacting factors over the line of the sight, such as scattering, emission, etc., require advanced field data collection setups and post-processing mathematical formulations. Preliminarily, in the literature, it was noticed that an appropriate review on the stochastic observational model for refraction modeling must be adopted due to the existing correlation between the parameters of atmospheric effects.
Reflection, which is caused by the laser striking the surface of the targets (depending on the inherent quality and external topography of the targets), is the next future research notion on terrestrial laser scanning calibration. It has been suggested that pointwise calibration methodologies must be accomplished to deal with the intensity value of individual points reflected from various sample targets, similar to the proposals of pointwise geometric calibration parametrization. The relevant radiometric concerns—beam divergence and the wavelength of each laser pulse—discussed in the scanning geometry section must be highlighted while resolving the reflectivity issues of the sample targets. This is factually influenced as the consequence of the variations in the incidence angle, range, and reflectivity between the neighboring points. With the advent of LiDAR range equation and reliance on the fundamental theories and principles of remote sensing and optical engineering, many challenges regarding the radiometric calibration of terrestrial laser scanning can be answered [166,167]. It is worth clarifying that the accuracy assessment of laser scanning is currently experiencing a new era encompassing artificial intelligence [168,169], meaning that several questions here can be potentially amended using deep learning processes.

8. Conclusions

This review provides an extensive overview of the calibration of terrestrial laser scanners and scanning, focusing on mathematical error characteristics, and presented mitigation strategies as reported in the literature. The complete generic error model of the TLS can be summarized into four geometries: the geometry of the instrument, laser, scanning, and targets. The current work highlights that underestimating one error source can simply lead to unreliable algorithmic setups for TLS calibration. However, different weights on each systematic error must be assigned depending on the purpose of the measurement configuration. It is worth emphasizing that the potential pathways—addressing numerous existing knowledge gaps and challenges—toward more robust TLS calibration studies are eventually detailed.

Author Contributions

Conceptualization, M.S. and L.P.; Methodology, M.S.; Validation, M.S. and L.P.; Formal analysis, M.S.; Investigation, M.S. and L.P.; Resources, M.S. and L.P.; Writing—original draft preparation, M.S.; Writing—review and editing, L.P.; Visualization, M.S. and L.P.; Supervision, L.P. All authors have read and agreed to the published version of the manuscript.

Funding

This research received no external funding.

Conflicts of Interest

The authors declare no conflicts of interest.

References

  1. Medic, T.; Holst, C.; Kuhlmann, H. Improving the results of terrestrial laser scanner calibration by an optimized calibration process. In Proceedings of the Oldenburger 3D-Tage 2019, Oldenburg, Germany, 6–7 February 2019. [Google Scholar]
  2. Shi, S.; Muralikrishnan, B.; Sawyer, D. Terrestrial laser scanner calibration and performance evaluation using the network method. Opt. Lasers Eng. 2020, 134, 106298. [Google Scholar] [CrossRef] [PubMed]
  3. Walsh, G. Leica ScanStation White Paper: Leica ScanStation P-Series—Details That Matter; Leica Geosystems AG: Heerbrugg, Switzerland, 2015. [Google Scholar]
  4. Abbas, M.A.; Setan, H.; Majid, Z.; Chong, A.K.; Luh, L.C.; Idris, K.M.; Ariff, M.F.M. Investigation of systematic errors for the hybrid and panoramic scanners. J. Teknol. 2014, 71, 65–70. [Google Scholar] [CrossRef]
  5. Garcia-San-Miguel, D.; Lerma, J.L. Geometric calibration of a terrestrial laser scanner with local additional parameters: An automatic strategy. ISPRS J. Photogramm. Remote Sens. 2013, 79, 122–136. [Google Scholar] [CrossRef]
  6. Holst, C.; Artz, T.; Kuhlmann, H. Biased and unbiased estimates based on laser scans of surface with unknown deformations. J. Appl. Geod. 2014, 8, 169–183. [Google Scholar] [CrossRef]
  7. Yen, J.; Leber, D.; Pibida, L. Comparing Instruments. NIST Technical Note 2016. Available online: https://nvlpubs.nist.gov/nistpubs/TechnicalNotes/NIST.TN.2106.pdf (accessed on 20 May 2025).
  8. Muralikrishnan, B. Performance evaluation of terrestrial laser scanners—A review. Meas. Sci. Technol. 2021, 32, 072001. [Google Scholar] [CrossRef] [PubMed]
  9. Al-Manasir, K.; Lichti, D.D. Self-calibration of a Leica HDS7000 Scanner. In Proceedings of the FIG Working Week 2015, Wisdom of the Ages to the Challenges of the Modern World, Sofia, Bulgaria, 17–21 May 2015; Available online: https://www.fig.net/resources/proceedings/fig_proceedings/fig2015/papers/ts07e/TS07E_al-manasir_lichti_7889.pdf (accessed on 20 May 2025).
  10. Medić, T.; Kuhlmann, H.; Holst, C. Designing and Evaluating a User-Oriented Calibration Field for the Target-Based Self-Calibration of Panoramic Terrestrial Laser Scanners. Remote Sens. 2020, 12, 15. [Google Scholar] [CrossRef]
  11. Lichti, D.D. Error modelling, calibration and analysis of an AM-CW terrestrial laser scanner system. ISPRS J. Photogramm. Remote Sens. 2007, 61, 307–324. [Google Scholar] [CrossRef]
  12. Legal Traceability of Length for Electronic Distance Measurement Equipment: Procedure Manual; Department of Natural Resources and Mines, Queensland Government: Brisbane, Australia, 2012.
  13. Zakaria, F.A.; Yatim, M.H.M.; Ariff, M.F.M.; Razali, A.F.; Choon, T.L.; Hamid, H.A. Utilizing Terrestrial Laser Scanning Dataset for Cadastral Surveying. J. Adv. Geospat. Sci. Technol. 2024, 4, 205–230. [Google Scholar] [CrossRef]
  14. Jia, D.; Zhang, W.; Liu, Y. Systematic Approach for Tunnel Deformation Monitoring with Terrestrial Laser Scanning. Remote Sens. 2020, 13, 3519. [Google Scholar] [CrossRef]
  15. Algadhi, A.; Psimoulis, P.; Grizi, A.; Neves, L. Assessment of the Accuracy of Terrestrial Laser Scanners in Detecting Local Surface Anomaly. Remote Sens. 2024, 16, 4647. [Google Scholar] [CrossRef]
  16. Hosseini, K.; Reindl, L.; Raffl, L.; Wiedemann, W.; Holst, C. 3D Landslide Monitoring in High Spatial Resolution by Feature Tracking and Histogram Analyses Using Laser Scanners. Remote Sens. 2024, 16, 138. [Google Scholar] [CrossRef]
  17. Xhou, Y.; Zhu, J.; Zhau, L.; Hu, G.; Xin, J.; Zhang, H.; Yang, J. High-Precision Monitoring Method for Bridge Deformation Measurement and Error Analysis Based on Terrestrial Laser Scanning. Remote Sens. 2024, 16, 2263. [Google Scholar] [CrossRef]
  18. Zhao, L.; Ma, X.; Xiang, Z.; Zhang, S.; Hu, C.; Zhou, Y.; Chen, G. Landslide Deformation Extraction from Terrestrial Laser Scanning Data with Weighted Least Squares Regularization Iteration Solution. Remote Sens. 2022, 14, 2897. [Google Scholar] [CrossRef]
  19. Yang, Y.; Balagne, L.; Gericke, O.; Scheer, D.; Zhang, L.; Sobek, W.; Schweiger, V. Monitoring of the Production Process of Graded Concrete Component Using Terrestrial Laser Scanning. Remote Sens. 2021, 13, 1622. [Google Scholar] [CrossRef]
  20. Holst, C.; Medić, T.; Kuhlmann, H. Dealing with systematic laser scanner errors due to misalignment at area-based deformation analyses. J. Appl. Geodesy 2018, 12, 169–185. [Google Scholar] [CrossRef]
  21. Holst, C.; Kuhlmann, H. Challenge and present fields of action at laser scanner-based deformation on analysis. J. Appl. Geod. 2016, 10, 17–25. [Google Scholar] [CrossRef]
  22. Boehler, W.; Vincent, M.B.; Marbs, A. Investigating laser Scanner Accuracy. IAPRS, XXXIV (5/C15). 2003, pp. 696–701. Available online: https://www.researchgate.net/publication/246536800_Investigating_laser_scanner_accuracy (accessed on 20 May 2025).
  23. Wunderlich, T.; Wasmeier, P.; Ohlmann-Lauber, J.; Schaefer, T.; Reidi, F. Objective Specification of TLS—A Contribution of the Geodetic Laboratory at the TUM; Blue Series Book at the Chair of Geodesy; Technical University of Munich: Munich, Germany, 2013; Volume 21, Available online: https://mediatum.ub.tum.de/doc/1188549/document.pdf (accessed on 20 May 2025).
  24. Jaafar, H.A.; Meng, X.; Sowter, A. Terrestrial laser scanner error quantification for the purpose of monitoring. Surv. Rev. 2018, 50, 232–248. [Google Scholar] [CrossRef]
  25. Liu, W.; Sun, S.; Li, Z.; Ge, S.; Sotelo, M.A.; Li, W. Compensation of Geometric Parameter Errors for Terrestrial Laser Scanner by Integrating Intensity Correction. IEEE Trans. Geosci. Remote Sens. 2020, 58, 7483–7495. [Google Scholar] [CrossRef]
  26. Kermarrec, G.; Loesler, M. How to account for temporal correlations with a diagonal correlation model in a nonlinear functional model: A plane fitting with simulated and real TLS measurements. J. Geod. 2021, 95, 5. [Google Scholar] [CrossRef]
  27. Lichti, D.D.; Pexman, K.; Tredoux, X. New method for first-order network design applied to TLS self-calibration networks. ISPRS J. Photogramm. Remote Sens. 2021, 177, 306–318. [Google Scholar] [CrossRef]
  28. Maar, H.; Zogg, H.M. WFD—Wave Form Digitizer Technology White Paper; Leica Geosystem: Heerbrugg, Switzerland, 2021. [Google Scholar]
  29. Lichti, D.D. The impact of angle parameterization on terrestrial laser scanner self-calibration. In Laser Scanning 2009; Bretar, F., Pierrot-Deseilligny, M., Vosselman, G., Eds.; IAPRS: Paris, France, 2009. [Google Scholar]
  30. Abbas, M.A.; Setan, H.; Majid, Z.; Idris, K.M.; Ariff, M.F.M.; Lichti, D.D. The effect of datum constraints for terrestrial laser scanner self-calibration. In Proceedings of the FIG Congress 2014, Kuala Lumpur, Malaysia, 16–21 June 2014. [Google Scholar]
  31. Jurek, T.; Kuhlmann, H.; Holst, C. Impact of spatial correlations on the surface estimation based on TLS. J. Appl. Geod. 2017, 11, 143–155. [Google Scholar] [CrossRef]
  32. Sabzali, M.; Jazirian, I. Improvemnt of modelling of atmospheric effects for electronic distance measurements (EDM): Analysis of air temperature, atmospheric pressure and relative humidity of the air. Geod. Cartogr. 2022, 48, 20–30. [Google Scholar] [CrossRef]
  33. Kaasalainen, S.; Jaakkola, A.; Kaasalainen, M.; Krooks, A.; Kukko, A. Analysis of Incidence Angle and Distance Effects on Terrestrial Laser Scanner Intensity: Search for Correction Methods. Remote Sens. 2011, 3, 2207–2221. [Google Scholar] [CrossRef]
  34. Muralikrishnan, B.; Ferrucci, M.; Sawyer, D.; Gerner, G.; Lee, V.; Blackburn, C.; Phillips, S.; Petrov, P.; Yakovlev, Y.; Astrelin, A.; et al. Volumetric performance evaluation of a laser scanner based on geometric error model. Precis. Eng. 2015, 40, 139–150. [Google Scholar] [CrossRef]
  35. Lerma, J.L.; Garcia-San-Miguel, D. Self-Calibration of Terrestrial Laser Scanners: Selection on the best Geometric Additional Parameters. ISPRS Ann. Photogramm. Remote Sens. Spat. Inf. Sci. 2014, 2, 219–226. [Google Scholar] [CrossRef]
  36. Neitzel, F. Investigation of Axes Errors of Terrestrial Laser Scanners. In Proceedings of the Fifth International Symposium Turkish-German Joint Geodetic Days, Berlin, Germany, 29–31 March 2006. [Google Scholar]
  37. Lichti, D.D. A review of geometric models and self-calibration methods for terrestrial laser scanner. Bol. Ciências Geodésicas 2010, 10, 3–19. [Google Scholar]
  38. Pareja, T.F.; Pablos, A.G.; Oliva, J.D.V. Terrestrial Laser Scanner (TLS) Equipment Calibration. Procedia Eng. 2013, 63, 278–286. [Google Scholar] [CrossRef]
  39. Holst, C.; Kuhlmann, H. Aiming at self-calibration of terrestrial laser scanners only one single object and one single scan. Appl. Geodesy 2014, 8, 295–310. [Google Scholar] [CrossRef]
  40. Li, X.; Li, Y.; Xie, X.; Xu, L. Terrestrial laser scanner autonomous self-calibration with no prior knowledge of point-clouds. IEEE Sens. J. 2018, 18, 9277–9285. [Google Scholar] [CrossRef]
  41. Li, X.; Li, Y.; Xie, X.; Xu, L. Lab-built terrestrial laser scanner self-calibration using mounting angle error correction. Opt. Express 2018, 26, 14444–14460. [Google Scholar] [CrossRef] [PubMed]
  42. Zhou, T.; Cheng, X.; Shan, R. A Self-Calibration Method for Terrestrial Laser Scanner. In Proceedings of the Asian Conference on Remote Sensing, Daejeon, Republic of Korea, 14–18 October 2019. [Google Scholar]
  43. Stark, E.; Mikhail, E. Least Squares & Non-Linear Functions. Photogramm. Eng. 1973, 39, 405–412. [Google Scholar]
  44. Reshetyuk, Y. Self-Calibration and Direct Georeferencing in Terrestrial Laser Scanning. Ph.D. Thesis, KTH University, Stockholm, Sweden, 2009. [Google Scholar]
  45. Reshetyuk, Y. A unified approach to self-calibration of terrestrial laser scanners. ISPRS J. Photogramm. Remote Sens. 2010, 65, 445–456. [Google Scholar] [CrossRef]
  46. Hughes, B.; Ferrucci, M.; Forbes, A. Preliminary Investigation into the Use of a Network-Based Technique for Calibration of 3D Laser Scanners; National Physical Library: Middlesex, UK, 2015. [Google Scholar]
  47. Zhou, Y.; Shen, S.; Hu, Z. Detail preserved surface reconstruction from point cloud. Sensors 2019, 19, 1278. [Google Scholar] [CrossRef] [PubMed]
  48. Chow, J.C.K.; Lichti, D.D.; Glennie, C. Point-based versus plane-based self-calibration of static terrestrial laser scanning. Int. Arch. Photogramm. Remote Sens. Spat. Inf. Sci. 2011, 38, 121–126. [Google Scholar] [CrossRef]
  49. Chan, T.O.; Lichti, D.D. Cylinder-based self-calibration of a panoramic terrestrial laser scanner. Int. Arch. Photogramm. Remote Sens. Spat. Inf. Sci. 2012, 39, 169–174. [Google Scholar] [CrossRef]
  50. Chan, T.O.; Lichti, D.D.; Belton, D. Temporal analysis and automatic calibration of the Velodyne HDL-32E Lidar Systems. ISPRS Ann. Photogramm. Remote Sens. Spat. Inf. Sci. 2013, 2, 61–66. [Google Scholar] [CrossRef]
  51. Chow, J.; Ebeling, A.; Teskey, B. Low cost artificial planar target measurement techniques for terrestrial laser scanning. In Proceedings of the FIG Congress 2010, Sydney, Australia, 11–16 April 2010. [Google Scholar]
  52. Lichti, D.D.; Chow, J.C.K. Inner constraints for planar features. Photogramm. Rec. 2013, 28, 74–85. [Google Scholar] [CrossRef]
  53. Glennie, C.; Lichti, D.D. Static Calibration and Analysis of the Velodyne HDL-64E32 for High Accuracy Mobile Scanning. Remote Sens. 2010, 2, 1610–1624. [Google Scholar] [CrossRef]
  54. Abbas, M.A.; Lichti, D.D.; Chong, A.K.; Setan, H.; Majid, Z. An on-site approach for the self-calibration of terrestrial laser scanners. Measurement 2014, 52, 111–123. [Google Scholar] [CrossRef]
  55. Qiao, J.; Butt, J.A. Self-calibration of terrestrial laser scanner using a M3C2-based planar patch algorithm. ISPRS J. Photogramm. Remote Sens. 2023, 197, 335–345. [Google Scholar] [CrossRef]
  56. Alkan, R.M.; Karsidag, G. Analysis of the Accuracy of Terrestrial Laser Scanning measurements. In Proceedings of the FIG Working Week 2012, Rome, Italy, 6–10 May 2012. [Google Scholar]
  57. Bae, K.H.; Lichti, D.D. On-site self-calibration planar features for Terrestrial laser scanners. Int. Arch. Photogramm. Remote Sens. Spat. Inf. Sci. 2007, 36, 14–19. [Google Scholar]
  58. Chow, J.C.K.; Lichti, D.D.; Teskey, W.F. Accuracy assessment of the Faro Focus and Leica HDS6100 panoramic-type terrestrial laser scanners through point-based and plane-based user self-calibration. In Proceedings of the FIG Working Week, Rome, Italy, 6–10 May 2012. [Google Scholar]
  59. Medić, T.; Kuhlmann, H.; Holst, C. Empirical Evaluation of Terrestrial Laser Scanner Calibration Strategies: Manufacturer-Based, Target-Based and Keypoint-Based. In Contributions to International Conferences on Engineering Surveying; Kopáčik, A., Kyrinovič, P., Erdélyi, J., Paar, R., Marendić, A., Eds.; Springer Proceedings in Earth and Environmental Sciences; Springer: Cham, Switzerland, 2021; pp. 41–56. [Google Scholar] [CrossRef]
  60. Grafarend, E.W. Optimization of Geodetic Network. Can. Surv. 1974, 28, 716–723. [Google Scholar] [CrossRef]
  61. Amiri-Simkooei, A.R. Analytical Methods in Optimization and Design of Geodetic Networks. Master’s Thesis, University of Khaje Nasir Toosi (KNTU), Tehran, Iran, 1998. [Google Scholar]
  62. Alizadeh-Khameneh, M.A. On Optimization and Design of Geodetic Networks. Ph.D. Thesis, KTH University, Stockholm, Sweden, 2015. [Google Scholar]
  63. Amiri-Simkooei, A.R.; Asgari, J.; Zanganeh-Nejad, F.; Zaminpardaz, S. Basic Concepts of Optimization and Design of Geodetic Networks. J. Surv. Eng. 2012, 138, 172–183. [Google Scholar] [CrossRef]
  64. Lichti, D.D. Terrestrial Laser Scanner Self-Calibration: Correlation Sources and their Mitigation. ISPRS J. Photogramm. Remote Sens. 2010, 65, 93–102. [Google Scholar] [CrossRef]
  65. Sossan, B. Criteria for choosing test objects type for terrestrial laser scanners calibration. Geod. Cartogr. Arial Photogr. 2022, 95, 31–38. [Google Scholar]
  66. Gruen, A.; Huang, S.T. Calibration and Orientation of Cameras in Computer Vision; Springer: Berlin/Heidelberg, Germany, 2010. [Google Scholar]
  67. Mikhail, E.M.; Bethel, J.S.; McGlone, J.C. Introduction to Modern Photogrammetry; John Wiley & Sons: Hoboken, NJ, USA, 2001. [Google Scholar]
  68. Rodriguez, F.C.; Medeiros, L.; Klein, I.; Veiga, L.A.K. Free Network Adjustment: Minimum Inner Constraints and Pseudo-Inverse Approaches. Revista ud y La Geomatica. 2020. Available online: https://www.researchgate.net/publication/344211053_Free_network_adjustment_Minimum_inner_constraints_and_Pseudo-inverse_approaches (accessed on 20 May 2025).
  69. Ogundare, J.O. Understanding Least Squares Estimation and Geomatics Data Analysis; John Wiley & Sons: Hoboken, NJ, USA, 2018. [Google Scholar]
  70. Parian, J.A.; Gruen, A. Self-Calibrating Network Analysis for Panoramic Camera by Heuristic Simulation; ETH Library: Zurich, Switzerland, 2006; Available online: https://www.isprs.org/PROCEEDINGS/XXXVI/part5/paper/PARI_655.pdf (accessed on 20 May 2025).
  71. Parian, J.A. Sensor modeling, self-calibration and accuracy testing of panoramic cameras and laser scanners. ISPRS J. Photogramm. Remote Sens. 2010, 65, 60–76. [Google Scholar] [CrossRef]
  72. Parian, J.A.; Gruen, A. Integrated laser scanner and intensity Image calibration and accuracy assessment. In Proceedings of the ISPRS III/3, III/4, V/3 Workshop “Laser Scanning 2005”, Eschede, The Netherlands, 12–14 September 2005. [Google Scholar]
  73. Remondino, F.; Fraser, C. Digital camera calibration methods: Considerations and comparisons. ISPRS Comm. V Symp. Image Eng. Vis. Metrol. 2005, 36, 266–272. Available online: https://www.isprs.org/proceedings/xxxvi/part5/paper/remo_616.pdf (accessed on 20 May 2025).
  74. Sabzali, M.; Pilgrim, L. Investigation of Correlation Between Self-Calibration Parameters of Terrestrial Laser Scanner (TLS). Asian J. Geoinf. 2024. Available online: https://aars-ajg.org/article/24/AJG-2311016.pdf (accessed on 20 May 2025).
  75. Sabzali, M.; Pilgrim, L. New Parametrization of Bundle Block Adjustment for Self-calibration of Terrestrial Laser Scanner (TLS). Photogramm. Rec. 2025, 40, 190. [Google Scholar] [CrossRef]
  76. Lichti, D.D. The impact of distribution of observations on TLS self-calibration quality. Int. Arch. Photogramm. Remote Sens. Spat. Inf. Sci. 2020, 43, 315–322. [Google Scholar] [CrossRef]
  77. Lichti, D.D.; Chan, T.O.; Belton, D. Linear regression with an observation distribution model. Geodesy 2021, 95, 1–14. [Google Scholar] [CrossRef]
  78. Chen, Y.C. A tutorial on Kernel Density Estimation and Recent Advances. Biostat. Epidemiology 2017, 1, 161–187. [Google Scholar] [CrossRef]
  79. Medic, T.; Kuhlmann, H.; Holst, C. Sensitivity Analysis and minimal measurement geometry for the target-based calibration high end panoramic TLS. Remote Sens. 2019, 11, 1519. [Google Scholar] [CrossRef]
  80. Zhou, T.; Cheng, X.; Lin, P.; Wu, Z.; Liu, E. A General Point-Based Method for Self-Calibration of Terrestrial Laser Scanners Considering Stochastic Information. Remote Sens. 2020, 12, 2923. [Google Scholar] [CrossRef]
  81. Kerekes, G.; Schwieger, V. Elementary Error Model Applied to Terrestrial Laser Scanning Measurements: Study Case Arch Dam Kops. Mathematics 2020, 8, 593. [Google Scholar] [CrossRef]
  82. Kerekes, G.; Schwieger, V. Determining Variance-Covariance Matrices for Terrestrial Laser scans: A Case Study of the Arch Dam Kops. In Proceedings of the Contributions to International Conferences on Engineering Surveying; 2021. Available online: https://link.springer.com/chapter/10.1007/978-3-030-51953-7_5 (accessed on 20 May 2025).
  83. Raschhofer, J.; Kerekes, G.; Harmening, C.; Neuner, H.; Schwieger, V. Estimating Control Points for B-Spline Surfaces Using Fully Populated Synthetic Variance–Covariance Matrices for TLS Point Clouds. Remote Sens. 2021, 13, 3124. [Google Scholar] [CrossRef]
  84. Kresten, T.P.; Lindstaedt, M. Geometric Accuracy Investigations of Terrestrial Laser Scanner Systems in the Laboratory and in the Field. Appl. Geomat. 2022, 14, 421–434. [Google Scholar] [CrossRef]
  85. Wang, L.; Muralikrishnan, B.; Rachakonda, P.; Sawyer, D. Determining geometric error model parameters of a terrestrial laser scanner through Two-face, Length-consistency, and Network methods. Meas. Sci. Technol. 2017, 28, 065016. [Google Scholar] [CrossRef] [PubMed]
  86. Muralikrishnan, B.; Wang, L.; Rachakonda, P.; Sawyer, D. Terrestrial laser scanner geometric error model parameter correlations in the Two-face, Length-consistency, and Network methods of self-calibration. Precis. Eng. 2018, 52, 15–29. [Google Scholar] [CrossRef]
  87. Tsakiri, M.; Pagounis, V.; Arabatzi, O. Evaluation of a pulsed terrestrial laser scanner based on ISO standards. Surf. Topogr. Metrol. Prop. 2015, 3, 015006. [Google Scholar] [CrossRef]
  88. Lichti, D.D. Ray-Tracing Method for Deriving Terrestrial Laser Scanner Systematic Errors. J. Surv. Eng. 2017, 143. [Google Scholar] [CrossRef]
  89. Medić, T.; Kuhlmann, H.; Holst, C. Automatic in-situ self-calibration of a panoramic TLS from a single station using 2D key points. ISPRS Ann. Photogramm. Remote Sens. Spat. Inf. Sci. 2019, 4, 413–420. [Google Scholar] [CrossRef]
  90. Neitzel, F.; Gordon, B.; Wujanz, D. Verfahren zur Standardisierten Überprüfung von Terrestrischen Laserscannern (TLS); DVW. EV Society for Geodesy, Geoinformation and land management: Berlin, Germany, 2014. [Google Scholar]
  91. Holst, C.; Neuner, H.; Wieser, A.; Wunderlich, T. Calibration of Terrestrial Laser Scanner. Allgem. Verm. Nachr. 2016, 123, 147–157. [Google Scholar]
  92. Friedli, E.; Presl, R.; Wieser, A. Influence of atmospheric refraction on terrestrial laser scanning at long range. In Proceedings of the 4th Joint International Symposium on Deformation Monitoring (JISDM), Athens, Greece, 15–17 May 2019. [Google Scholar]
  93. Barrell, H.; Sears, J.E. The refraction and dispersion of air for the visible spectrum. J. Philos. Trans. R. Soc. Lond. 1939, 238, 1–64. [Google Scholar]
  94. Edlen, B. The dispersion of standard air. J. Opt. Soc. Am. 1956, 43, 339–344. [Google Scholar] [CrossRef]
  95. Edlen, B. The refractive index of air. J. Meterologia 1966, 2, 71–80. [Google Scholar] [CrossRef]
  96. Owens, J.C. Optical refractive index of air: Dependence on pressure, temperature, and composition. Appl. Opt. 1967, 6, 51–59. [Google Scholar] [CrossRef] [PubMed]
  97. Peck, E.R.; Reeder, K. Dispersion of Air. J. Opt. Soc. Am. 1972, 62, 958–962. [Google Scholar] [CrossRef]
  98. Jones, C.E. The air density equation and the transfer of the mass unit. J. Res. Natl. Bur. Stand. 1978, 83, 419–428. [Google Scholar] [CrossRef] [PubMed]
  99. Jones, C.E. The refractivity of air. J. Res. National Bur. Standards 1981, 86, 27–32. [Google Scholar] [CrossRef] [PubMed]
  100. Matsumoto, H. The refractive index of moist air in the 3-µ region. Metrologia 1982, 18, 49–52. [Google Scholar] [CrossRef]
  101. Birch, K.; Downs, M. The results of a comparison between calculated and measured values of the refractive index of air. J. Phys. E Sci. Instruments 1988, 21, 694–695. [Google Scholar] [CrossRef]
  102. Birch, K.; Downs, M. An updated Edlen equation for the refractive index of air. Metrologia 1993, 30, 155–162. [Google Scholar] [CrossRef]
  103. Ciddor, P.E. Refractive Index of Air: New Equation for Visible and Near Infrared. Appl. Opt. 1996, 35, 1566–1573. [Google Scholar] [CrossRef] [PubMed]
  104. Ciddor, P.E.; Hill, R.J. Refractive index of air. 2. Group Index. J. Appl. Opt. 1999, 59, 1663–1667. [Google Scholar] [CrossRef] [PubMed]
  105. Bonsch, G.; Potulski, E. Measurement of the refractive index of air and comparison with modified Edlen’s formulae. J. Meteologia 1998, 28, 133–139. [Google Scholar]
  106. IAG Resolutions. International Association of Geodesy [IAG]. In Proceedings of the IAG Resolutions at the XXIIth General Assembly, Birmingham, UK, 18–30 July 1999. [Google Scholar]
  107. Mathar, R.J. Refractive index of humid air in the infrared: Model fits. J. Opt. A Pure Appl. Opt. 2007, 9, 470–476. [Google Scholar] [CrossRef]
  108. Pollinger, F. Refractive index of air. 2. Group index: Comment. Appl. Opt. 2020, 59, 9771–9772. [Google Scholar] [CrossRef] [PubMed]
  109. Sabzali, M.; Pilgrim, L. Updated Atmospheric Modelling of Refracted Zenith Angle Using Vertical Temperature Gradient for Refraction Coefficient. J. Geosci. Geomatics 2023, 11, 11–20. [Google Scholar] [CrossRef]
  110. Sabzali, M.; Pilgrim, L. Improved Model of Refracted Horizontal Angle: Dependency on Zenith Angle. Am. J. Civ. Eng. Arch. 2023, 11, 38–44. [Google Scholar] [CrossRef]
  111. Bomford, B.G. Geodesy; Clarendon Press: Oxford, UK, 1962. [Google Scholar]
  112. Reuger, J.M. Electronic Distance Measurements, 3rd ed.; Springer: Berlin/Heidelberg, Germany, 1990. [Google Scholar]
  113. Dvoracek, F. Interpretation and Evaluation of Procedures for Calculating the Group refractive Index of Air by Ciddor and Hill. Section Geodesy and Mine Surveying. 2018. Available online: https://www.sgem.org/index.php/elibrary-research-areas?view=publication&task=show&id=707 (accessed on 20 May 2025).
  114. Dodson, A.H.; Zaher, M. Refraction Effects on Vertical Angle Measurements. Surv. Rev. 1985, 28, 169–183. [Google Scholar] [CrossRef]
  115. Torge, W. Geodesy, 3rd ed.; Walter de Gruyter: Berlin, Germany; New York, NY, USA, 2001. [Google Scholar]
  116. Johnston, A. Lateral Refraction in Tunnels. Surv. Rev. 1991, 31, 201–220. [Google Scholar] [CrossRef]
  117. Nikolitsas, K.; Lambrou, E. A Methodology for Correcting Refraction in Vertical Angles for Precise Monitoring in Tunnels. In Proceedings of the 4th Joint International Symposium on Deformation Monitoring, Athens, Greece, 15–17 May 2019. [Google Scholar]
  118. Brys, H.; Justniyak, N. Mathematical-physical model of horizontal refraction in measuring alignment of elongated engineering objects. Geomat. Landmanag. Landsc. 2016, 25–32. [Google Scholar] [CrossRef]
  119. Bajtala, M.; Sokol, S.; Cernota, P. Estimation of a Horizontal Refraction in a Geodetic Network. J. Pol. Miner. Eng. Soc. 2016, 17, 201–212. [Google Scholar]
  120. Soudarissanane, S.; Lindenbergh, R.; Menenti, M.; Teunissen, P. Scanning geometry: Influencing factor on the quality of terrestrial laser scanning points. ISPRS J. Photogramm. Remote Sens. 2011, 66, 389–399. [Google Scholar] [CrossRef]
  121. Karaszewski, M.; Adamczyk, M.; Sitnik, R. Assessment of next-best-view algorithms performance with various 3D scanners and amnipulator. ISPRS J. Photogramm. Remote Sens. 2016, 119, 320–333. [Google Scholar] [CrossRef]
  122. Lichti, D.D.; Gordon, S.J.; Tipdecho, T. Error Models and Propagation in Directly Georeferenced Terrestrial Laser Scanner Networks. J. Surv. Eng. 2005, 131, 135–142. [Google Scholar] [CrossRef]
  123. Soudarissanane, S.; Lindenbergh, R.C. Optimizing terrestrial laser scanning measurement set-ups. ISPRS-Int. Arch. Photogramm. Remote Sens. Spat. Inf. Sci. 2012, 38, 127–132. [Google Scholar] [CrossRef]
  124. Cabrera-Revuelta, E.; Tavolare, R.; Buldo, M.; Verdoscia, C. Planning for terrestrial laser scanning: Methods for optimal sets of locations in architectural sites. J. Build. Eng. 2024, 85. [Google Scholar] [CrossRef]
  125. Giorgini, M.; Marini, S.; Monica, R.; Aleotti, J. Sensor-Based Optimization of Terrestrial Laser Scanning Measurement Setup on GPU. IEEE Geosci. Remote Sens. Lett. 2019, 16, 1452–1456. [Google Scholar] [CrossRef]
  126. Zeng, Y.; Liu, J.; Cao, Q.; Wu, Z.; Chen, B.; Li, D.; Cheng, G. Optimal planning of indoor laser scans based on continuous optimization. Autom. Constr. 2022, 143, 104552. [Google Scholar] [CrossRef]
  127. Kriegel, S.; Bodenmuller, T.; Suppa, M.; Hirzinger, G. A surface-based Next-Best-View Approach for Automated 3D Model Completion of Unkown Objects. In Proceedings of the IEEE International Conference on Robotics and Automation, Shanghai, China, 9–13 May 2011. [Google Scholar] [CrossRef]
  128. Chen, S.Y.; Li, Y.F. Vision sensor planning for 3D model acquisition. IEEE Trans. Geosci. Remote Sens. 2005, 35, 894–904. Available online: https://personal.cityu.edu.hk/meyfli/Publication/file/CSY_SMC05.pdf (accessed on 20 May 2025).
  129. Collander, C.; Beksi, W.J.; Huber, M. Learning the Next Best View for 3D Point Clouds via Topological Features. arXiv 2021, arXiv:2103.02789. [Google Scholar] [CrossRef]
  130. Soudarissanane, S.; Lindenbergh, R.; Gorte, B. Reducing the errors in terrestrial laser scanning by optimizing the measurement set-up. In Proceedings of the International Archives of the Photogrammetry, Remote Sensing and Spatial Information Sciences, Beijing, China, 3–11 July 2008. [Google Scholar]
  131. Soudarissanane, S.; Ree, J.V.; Bucksch, A.; Lindenbergh, R. Error Budget of Terrestrial Laser Scanning: Influence of the Incidence Angle on the Scan Quality; Delft University: Delft, The Netherlands, 2006. [Google Scholar]
  132. Ling, Z.; Yuqing, M.; Ruoming, S. Study on the resolution of laser scanning point cloud. In Proceedings of the IEEE International Geoscience & Remote Sensing Symposium, IGARSS 2008, Boston, MA, USA, 8–11 July 2008. [Google Scholar]
  133. Chen, M.; Pan, J.; Xu, J. Classification of Terrestrial Laser Scanning Data with Density-Adaptive Geometric Features. IEEE Geosci. Remote Sens. Lett. 2018, 15, 1795–1799. [Google Scholar] [CrossRef]
  134. Schmitz, B.; Kuhlmann, H.; Holst, C. Investigating the resolution capability of terrestrial laser scanners and their impact on the effective number of measurements. ISPRS J. Photogramm. Remote Sens. 2020, 159, 41–52. [Google Scholar] [CrossRef]
  135. Lichti, D.D. A Resolution Measure for Terrestrial Laser Scanners. The International Archives of the Photogrammetry, Remote Sensing and Spatial Information Sciences. 2005. Available online: https://www.isprs.org/proceedings/xxxv/congress/comm5/papers/552.pdf (accessed on 20 May 2025).
  136. Lichti, D.D.; Jamtsho, S. Angular resolution of Terrestrial laser scanners. Photogrammtric Rec. 2006, 21, 141–160. [Google Scholar] [CrossRef]
  137. Yang, R.; Hua, X.; Liu, J.; Wu, H. Research on the three angular resolutions of terrestrial laser scanning. Int. Arch. Photogramm. Remote Sens. Spat. Inf. Sci. 2012, 39, 187–192. [Google Scholar] [CrossRef]
  138. Wehr, A.; Lohr, U. Airborne laser scanning–an introduction and overview. ISPRS J. Photogramm. Remote Sens. 1999, 54, 68–82. [Google Scholar] [CrossRef]
  139. Jelalian, A. Laser Radar Systems; Artech House: London, UK, 1992. [Google Scholar]
  140. Jenn, D. Laser Cross Section (LCS); Naval Postgraduate School: Monterey, CA, USA, 2010. [Google Scholar]
  141. Tan, K.; Zhang, W.; Shen, F.; Cheng, X. Investigation of TLS Intensity Data and Distance Measurement Errors from Target Specular Reflections. Remote Sens. 2018, 10, 1077. [Google Scholar] [CrossRef]
  142. Kamermann, G.W. Active Electro-Optical Systems; Optical Engineering Press: Bellingham, WA, USA, 1993; Chapter 1. [Google Scholar]
  143. McManamon, P.F.; Kamerman, G.; Huffaker, M. A history of Laser Radar in the United States. Int. Soc. Opt. Eng. 2010. [Google Scholar] [CrossRef]
  144. McManamon, P. Review of LADAR: A historic, yet emerging, sensor technology with rich phenomenology. Opt. Eng. 2012, 51, 060901. [Google Scholar] [CrossRef]
  145. Soudarissananae, S.; Lindenbergh, R.; Menenti, M.; Teunissen, P. Incidence Angle Influence on the Quality of Terrestrial Laser Scanning Points. In Laser Scanning, Proceedings of the ISPRS Workshop Laserscanning, Paris, France, 1–2 September 2009; Bretar, F., Pierrot-Deseillignay, M., Vosselman, G., Eds.; TU Delft: Delft, The Netherlands, 2011; Available online: https://resolver.tudelft.nl/uuid:b739bd05-c5bc-4ffa-aedb-318726f15e34 (accessed on 20 May 2025).
  146. Laser Radar: Progress and Opportunities in Active Electro-Optical Sensing; National Research Council (NRC): Washington, DC, USA; The National Academies Press: Washington, DC, USA, 2014.
  147. Lichti, D.D.; Harvey, B.R. The effects of reflecting surface material properties on time-of-flight laser scanner measurements. In Proceedings of the Symposium on Geospatial theory, Processing and Applications, Ottawa, ON, Canada, 8–12 July 2002; Available online: https://www.isprs.org/proceedings/xxxiv/part4/pdfpapers/180.pdf (accessed on 20 May 2025).
  148. Bolkas, D.; Martinez, A. Effect of target color and scanning geometry on terrestrial LiDAR point-cloud noise and plane fitting. J. Appl. Geod. 2017, 12, 109–127. [Google Scholar] [CrossRef]
  149. Tonietto, L.; Gonzaga, L.J.; Veronez, M.R.; Kazmierczak, C.D.S.; Arnold, D.C.C.; Costa, C.A.D. New Method for Evaluating Surface Roughness Parameters Acquired by Laser Scanning. Sci. Rep. 2019, 9, 15038. [Google Scholar] [CrossRef] [PubMed]
  150. Berger, M.; Tagliasacchi, A.; Severesky, L.; Alliez, P.; Guennebaud, G.; Levine, J.; Sharf, A.; Silva, C. A survey of surface reconstruction from point clouds. In Computer Graphics Forum; Wiley: Hoboken, NJ, USA, 2016. [Google Scholar]
  151. Santos, P.M.; Julio, E.N. A state-of-the-art review on roughness quantification methods for concrete surfaces. Constr. Build. Mater. 2013, 38, 912–923. [Google Scholar] [CrossRef]
  152. Moreau, N.; Roudet, C.; Gentil, C. Study and Comparison of Surface Roughness Measurements. 2014. Available online: https://www.researchgate.net/publication/281353260_Study_and_Comparison_of_Surface_Roughness_Measurements (accessed on 20 May 2025).
  153. Mah, J.; Samson, C.; McKinnon, S.D.; Tibodeau, D. 3D laser imaging for surface roughness analysis. Int. J. Rock Mech. Min. Sci. 2013, 58, 111–117. [Google Scholar] [CrossRef]
  154. Voisin, S.; Foufou, S.; Truchetet, F.; Paage, D.; Abidi, M. Study of ambient light influence for three-dimensional scanners based on structured light. Opt. Eng. 2007, 46, 030502. [Google Scholar] [CrossRef]
  155. Clark, J.; Robson, S. Accuracy of measurements made with a Cyrax 2500 Laser Scanner against surfaces of known color. Surv. Rev. 2004, 37, 626–638. [Google Scholar] [CrossRef]
  156. Pfeifer, N.; Dorininger, P.; Haring, A.; Fan, H. Investigating Terrestrial Laser Intensity Data Quality and Functional Relations. 2007. Available online: https://www.researchgate.net/publication/242037767_Investigating_terrestrial_laser_scanning_intensity_data_quality_and_functional_relations (accessed on 20 May 2025).
  157. Yaman, A.; Yilmaz, H.M. The effects of object surface colors on terrestrial laser scanners. Int. J. Eng. Geosci. 2017, 2, 68–74. [Google Scholar] [CrossRef]
  158. Wujanz, D. Intensity calibration method for 3D laser scanner. J. N. Z. Inst. Surv. 2009. Available online: https://espace.curtin.edu.au/handle/20.500.11937/9457 (accessed on 20 May 2025).
  159. Silva, B.B.D.; Braga, A.C.; Braga, C.C.; Olivera, L.M.M.D.; Montenegro, S.M.G.L.; Junior, B.B. Procedure for calculation of the albedo with OLI-Lnadsat 8 images: Application to Brazilian semi-arid. Rev. Bras. Eng. Agric. Ambient. 2016, 20, 3–8. [Google Scholar] [CrossRef]
  160. Fraser, C.S. Photogrammetric Camera Component Calibration: A Review of Analytical Techniques. In Calibration and Orientation of Cameras in Computer Vision; Gruen, A., Huang, T.S., Eds.; Springer Series in Information Sciences; Springer: Berlin/Heidelberg, Germany, 2001; Volume 34. [Google Scholar] [CrossRef]
  161. Alsadik, B.; Abdulateef, N.A. Epi-polar geometry between photogrammetry and Computer vision—A computational guide. ISPRS Ann. Photogramm. Remote Sens. Spat. Inf. Sci. 2022, 5, 25–32. [Google Scholar] [CrossRef]
  162. El-Ashmawy, K.L.A. A comparison study between collinearity condition, coplanarity condition, and direct linear transformation (DLT) method for camera exterior orientation parameters determination. Geod. Cartogr. 2015, 41, 66–73. [Google Scholar] [CrossRef]
  163. El-Ashmawy, K.L.A. Coplanarity Condition for Photogrammetric simultaneous and self-calibration block adjustments. Int. J. Adv. Sci. Res. Eng. (IJASRE) 2021, 7, 1–14. [Google Scholar] [CrossRef]
  164. ISO/IEC Guide 98-3:2008; Uncertainty of Measurement. ISO: Geneva, Switzerland, 2008.
  165. Metropolis, N.; Ulam, S. The Monte Carlo Method. J. Am. Stat. Assoc. 1949, 44, 335–341. [Google Scholar] [CrossRef] [PubMed]
  166. McManamon, P.F. LiDAR Technologies and Systems; SPIE Press Book: Bellingham, WA, USA, 2019. [Google Scholar]
  167. McManamon, P.F. Field Guide to Lidar; SPIE Library: Bellingham, WA, USA, 2015. [Google Scholar]
  168. Hartmann, J.; Alkhatib, H. Uncertainty Modelling of Laser Scanning Point Clouds Using Machine-Learning Methods. Remote Sens. 2023, 15, 2349. [Google Scholar] [CrossRef]
  169. Hartmann, J.; Ernst, D.; Neumann, I.; Alkhatib, H. PointNet-based modeling of systematic distance deviations for improved TLS accuracy. J. Appl. Geod. 2024, 18, 613–628. [Google Scholar] [CrossRef]
Figure 1. Graphical representation of the spherical coordinate system of the TLS [26].
Remotesensing 17 02528 g001
Figure 2. Different range measurement mechanisms (from left to right: time of flight (TOF), phase-based, and waveform digitizer (WFD), respectively) (λ is the wavelength of a signal) [28].
Remotesensing 17 02528 g002
Figure 3. Different classifications of scanners in terms of scanning mechanisms (from left to right: camera, hybrid, and panoramic scanner, respectively) [30].
Remotesensing 17 02528 g003
Figure 5. Calibration steps involved in the study.
Remotesensing 17 02528 g005
Figure 6. Range calibration setup for the TLS [87].
Remotesensing 17 02528 g006
Figure 7. The field measurement setup (according to the DVW instruction sheet 07-2014 in [84,90]).
Remotesensing 17 02528 g007
Figure 8. Geodetic refraction (here, the condition is convex refraction). When the refractive index from the first to second medium drops (n2 < n1), it is the convex condition of the refraction, otherwise, the refractive index rises from the first to second medium (n1 < n2) and the refraction condition is concave, and d v is assumed to be the refracted vertical angle [92].
Remotesensing 17 02528 g008
Figure 9. (a) refracted vertical angle dv on the z plane and (b) refracted horizontal Rangle dh on the xy plane. Since terrestrial laser scanners use an electronic distance measurement (EDM) system to measure the range and digital encoders to record angular measurements, the illustrated instrument resembles a total station in both its design and function [117,118,119].
Remotesensing 17 02528 g009
Figure 10. Resolution in the vertical direction (vertical angle resolution) [134].
Remotesensing 17 02528 g010
Figure 11. The incidence angle α and measured range r of a single measured point [120].
Remotesensing 17 02528 g011
Figure 12. Different reflectivity of surfaces (i.e., diffuse reflection or specular reflection (mirror or regular)) [141].
Remotesensing 17 02528 g012
Figure 13. Incidence angle and tilted target plates [28].
Remotesensing 17 02528 g013
Figure 14. Edge surfaces and laser spot size [28] (i.e., the instrument illustrated in Figure 13 and Figure 14 is the Leica MultiStation MS60 (https://leica-geosystems.com/products/total-stations/multistation/leica-nova-ms60/expert-insight-innovations-to-the-leica-nova-ms60-scanning-total-station, accessed on 20 May 2025) total station. This device is a hybrid terrestrial laser scanner that can be used when a lower level of point density is required).
Remotesensing 17 02528 g014
Table 1. Calibration parameters of TLSs and their impacts on each spherical coordinate (created by the authors).
Calibration Parameters (CPs)RangeAngle
VerticalHorizontal
Beam offset along horizontal and vertical plane (a1z, a1n)
Transit offset (a2)
Mirror offset (a3)
Vertical angle index offset error (a4)
Beam tilt angle along horizontal and vertical plane (a5z, a5n)
Mirror tilt angle (a6)
Transit tilt angle (a7)
Horizontal angle encoder eccentricity along x and y planes (a8x, a8y)
Vertical angle encoder eccentricity along x and y planes (a9x, a9y)
Constant zero error (i.e., zero offset or bird-bath error) (a10)
Second-order scale error in horizontal angle encoder in horizontal and vertical planes (a11a, a11b)
Second-order scale error in vertical angle encoder in horizontal and vertical planes (a12a, a12b)
Disclaimer/Publisher’s Note: The statements, opinions and data contained in all publications are solely those of the individual author(s) and contributor(s) and not of MDPI and/or the editor(s). MDPI and/or the editor(s) disclaim responsibility for any injury to people or property resulting from any ideas, methods, instructions or products referred to in the content.