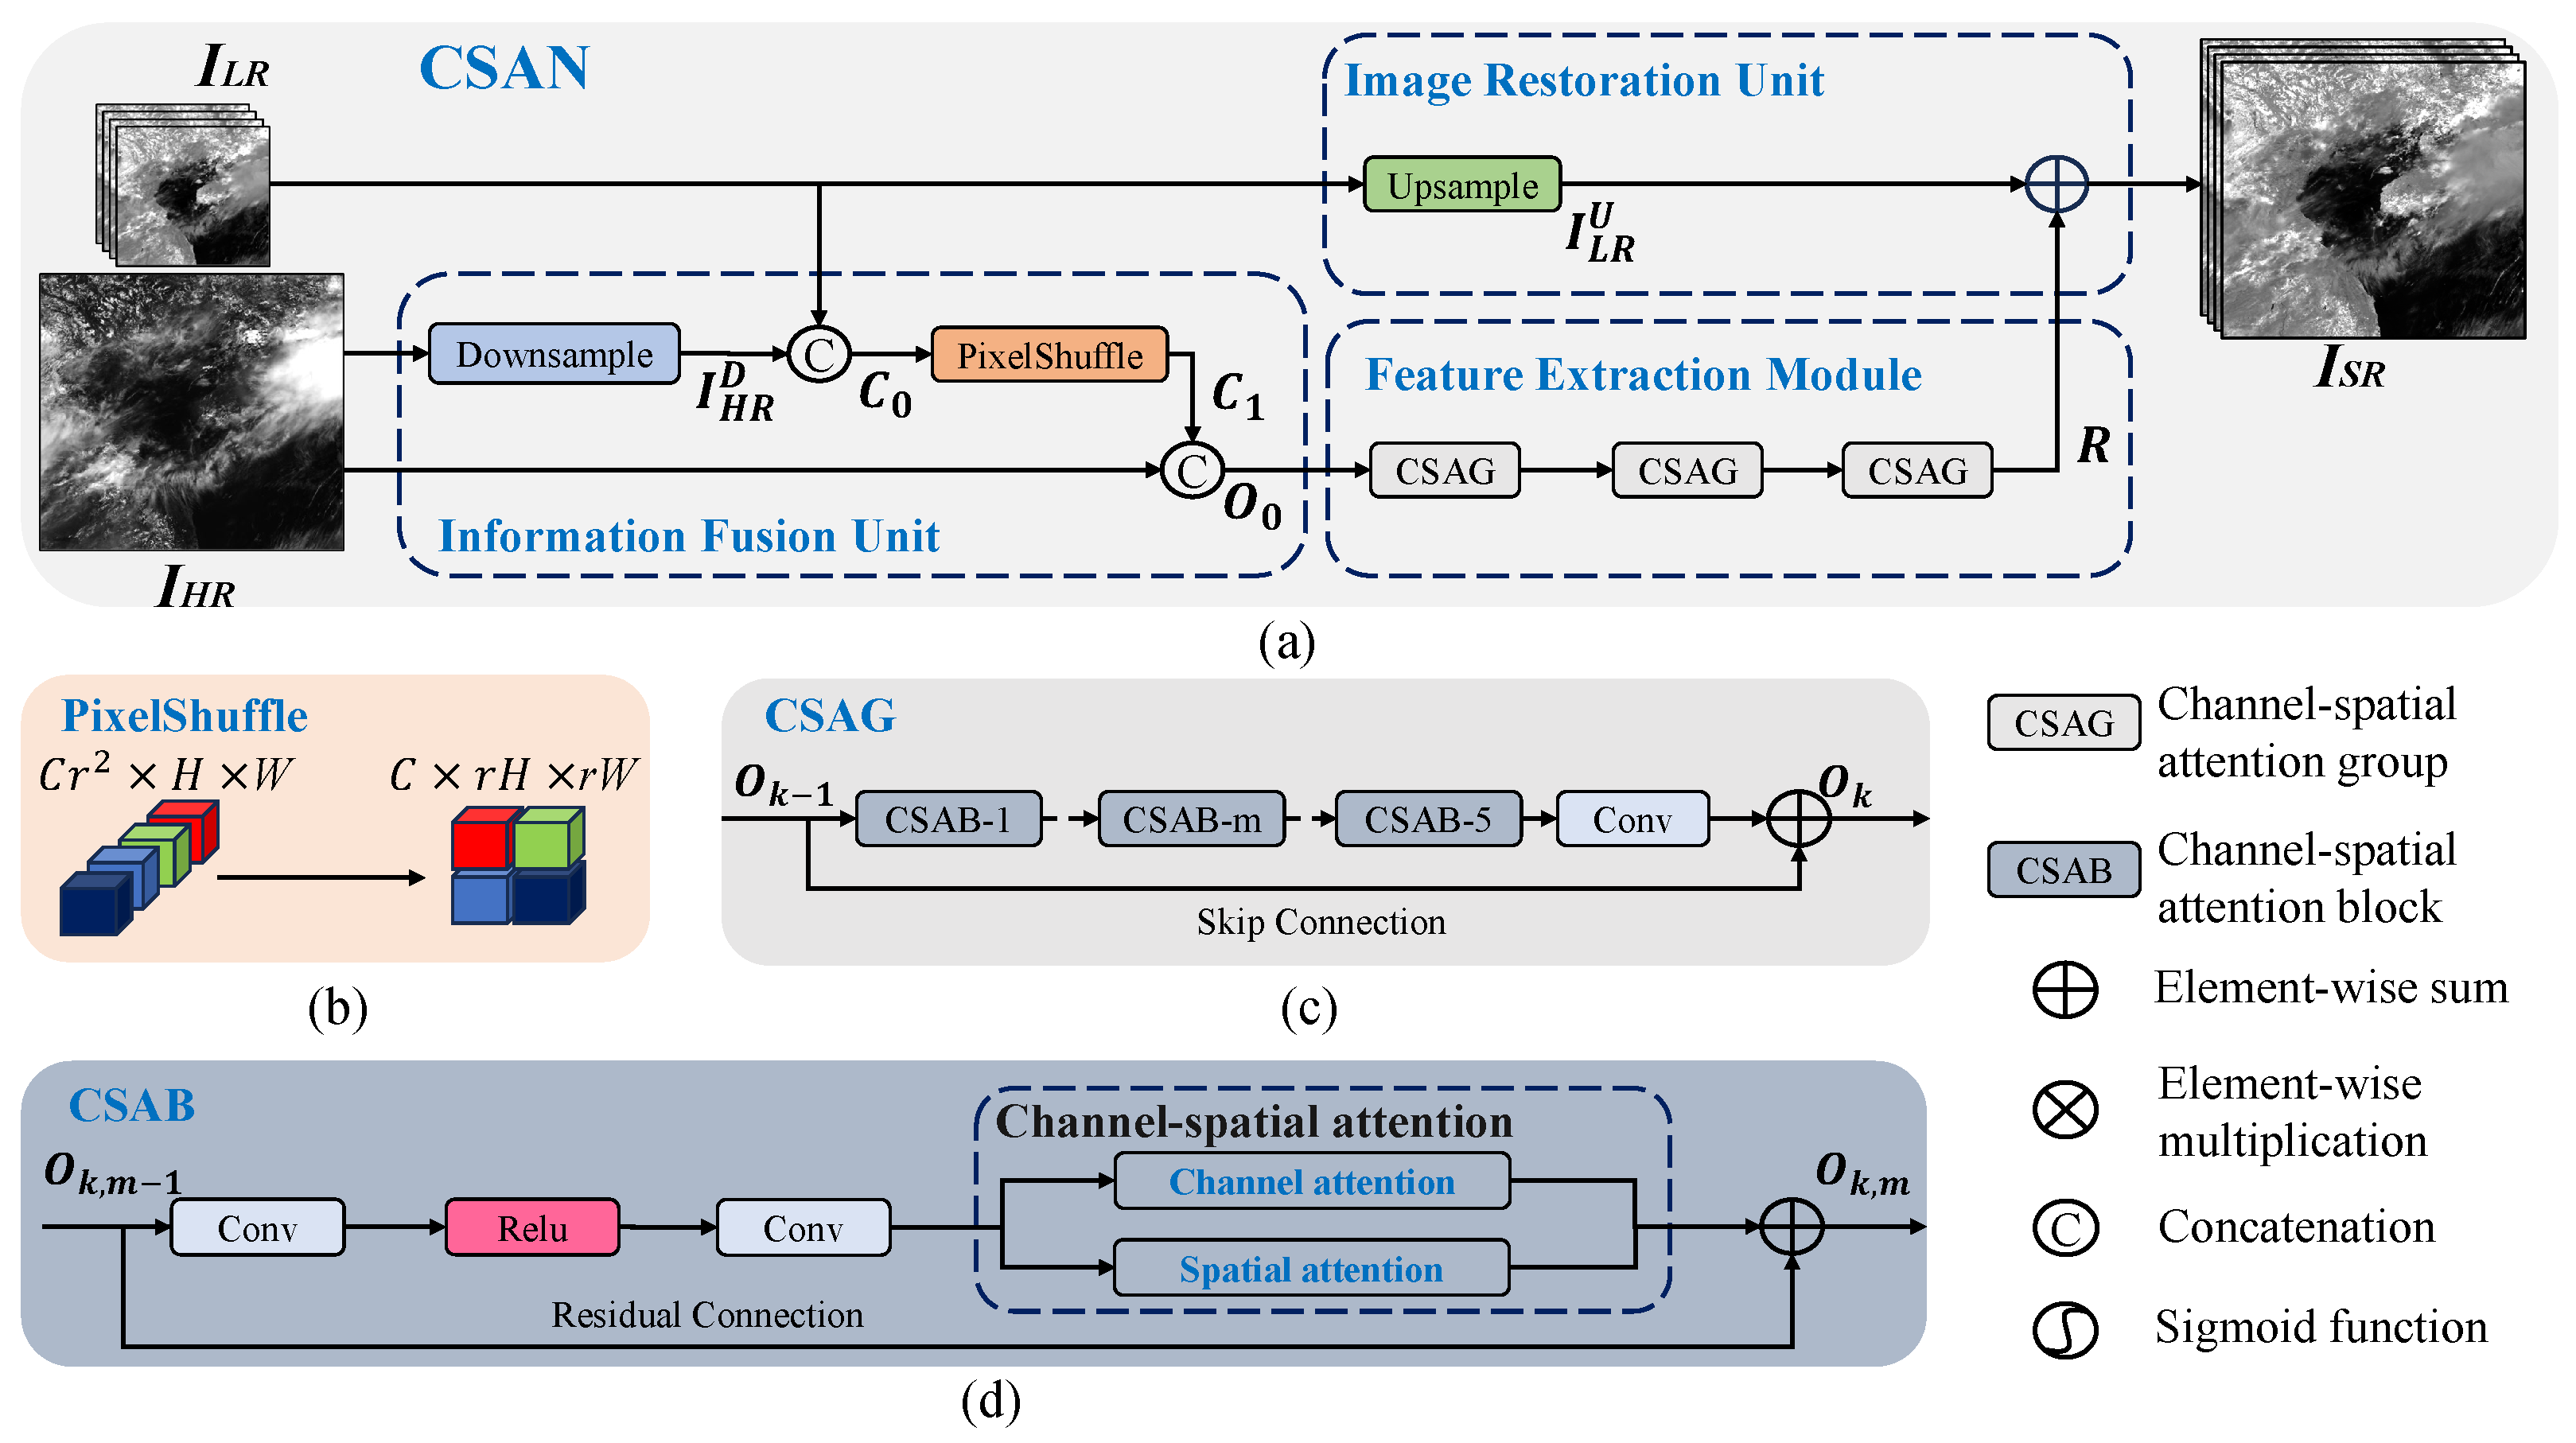
Article

CSAN: A Channel–Spatial Attention-Based Network for Meteorological Satellite Image Super-Resolution

School of Electronic and Information Engineering, South China University of Technology, Guangzhou 510641, China
*
Author to whom correspondence should be addressed.
Remote Sens. 2025, 17(14), 2513; https://doi.org/10.3390/rs17142513
Submission received: 7 May 2025 / Revised: 16 July 2025 / Accepted: 16 July 2025 / Published: 19 July 2025

Abstract

Meteorological satellites play a critical role in weather forecasting, climate monitoring, water resource management, and more. These satellites feature an array of radiative imaging bands, capturing dozens of spectral images that span from visible to infrared. However, the spatial resolution of these bands varies, with images at longer wavelengths typically exhibiting lower spatial resolutions, which limits the accuracy and reliability of subsequent applications. To alleviate this issue, we propose a channel–spatial attention-based network, named CSAN, designed to super-resolve all low-resolution (LR) bands to the available maximal high-resolution (HR) scale. The CSAN consists of an information fusion unit, a feature extraction module, and an image restoration unit. The information fusion unit adaptively fuses LR and HR images, effectively capturing inter-band spectral relationships and spatial details to enhance the input representation. The feature extraction module integrates channel and spatial attention into the residual network, enabling the extraction of informative spectral and spatial features from the fused inputs. Using these deep features, the image restoration unit reconstructs the missing spatial details in LR images. Extensive experiments demonstrate that the proposed network outperforms other state-of-the-art approaches quantitatively and visually.

1. Introduction

Thanks to the rapid advancements in satellite technology, the deployment of sophisticated meteorological satellites has significantly increased, including Himawari-8 [1] by Japan, the Fengyun (FY) series [2] by China, and the GEOstationary Korea Multi-Purpose Satellite 2A (GK2A) [3] by South Korea. Meteorological satellites are widely applied in weather forecasting and analysis [4,5], forest fire detection [6,7,8], cloud monitoring [9], and other Earth observation tasks [10,11]. Given these diverse applications, the effectiveness of satellite observations depends heavily on the technical specifications of the satellites themselves [12], which are primarily assessed by three key parameters: revisit time, spectral range, and spatial resolution.
Meteorological satellites typically have a short revisit time, enabling the acquisition of new observations over the same region within minutes and thereby supporting near real-time monitoring of various atmospheric changes [13,14]. Additionally, equipped with multispectral imagers, these satellites capture a broad spectral range, acquiring dozens of spectral bands spanning from visible to infrared wavelengths. However, the spatial resolution of these images varies across different bands. For example, visible bands often exhibit high spatial resolution, while infrared bands typically have resolutions that are two to eight times coarser [2]. This resolution discrepancy can be attributed to hardware constraints, such as the physical limitations of imaging sensors and optical systems, as well as limitations in onboard storage capacity and data transmission bandwidth [15]. To address these challenges and enhance the utility of meteorological satellite imagery, it is crucial to employ advanced super-resolution (SR) techniques capable of upsampling low-resolution (LR) bands to the highest available spatial resolution.
SR is an image processing technique that enhances spatial resolution to reveal finer details. SR techniques are generally categorized into single-image super-resolution (SISR) and multi-image super-resolution (MISR). While SISR reconstructs a high-resolution (HR) image from a single LR input, MISR leverages multiple LR images to improve resolution through complementary information. SR techniques are predominantly driven by deep learning models, with Convolutional Neural Networks (CNNs), Generative Adversarial Networks (GANs), and Transformers being the most widely used and representative approaches [16,17,18,19].
In the field of remote sensing satellite imagery, numerous SR algorithms have been extensively studied. Liebel et al. [20] demonstrated that a CNN-based end-to-end neural network can be effectively applied to satellite data, achieving superior performance compared to traditional interpolation methods. Lanaras et al. [21] leveraged the multi-spectral and multi-resolution properties of satellite imagery by fusing upsampled LR data with HR data as input to their model, DSen2. This model employs residual CNNs to enhance the spatial resolution of Sentinel-2 satellite images, narrowing the clarity gap between LR and HR images. Subsequent works [22,23,24] built upon DSen2 by adopting a similar strategy of transferring high-frequency spatial details from HR bands to LR bands.
Although substantial progress has been made in super-resolving remote sensing satellite imagery, most existing research has focused on land observation satellites such as Sentinel-2 and Landsat, which primarily capture detailed information about buildings, lakes, and vegetation. In contrast, meteorological satellites provide a broader and more comprehensive view of global atmospheric, terrestrial, and oceanic conditions. Furthermore, meteorological satellites generally cover a wider spectral range than land observation satellites, including long-wave infrared bands that are typically absent in land observation missions, which mainly focus on short-wave and mid-wave infrared imaging.
However, despite these differences, SR techniques developed for land observation satellite imagery may not be directly applicable to meteorological satellite data due to its distinct characteristics. To bridge this gap, we propose a channel–spatial attention-based network (CSAN) in this article, which aims to upsample all LR bands of meteorological satellites to the highest available spatial resolution in a simple and effective manner.
Drawing inspiration from the SR of low-resolution hyperspectral images (LR-HSIs) [25,26], which enhances the spatial resolution of LR-HSIs with the assistance of high-resolution multispectral images (HR-MSIs), we adaptively fuse LR and HR bands to jointly capture inter-band spectral dependencies and high-frequency spatial details. This fused representation serves as the foundation for subsequent feature extraction and reconstruction. To enhance the SR effect, we build upon residual learning frameworks and incorporate both channel attention and spatial attention mechanisms, as proposed in [27,28]. These attention modules enable the network to selectively extract salient spectral and spatial features from the fused inputs. The resulting features are passed to the image restoration unit, which reconstructs the missing spatial details and generates the final super-resolved outputs. In summary, this article consists of three key contributions:
  • We propose the channel–spatial attention-based network (CSAN), a novel and efficient architecture for the SR of meteorological satellite images. CSAN enhances all LR bands to the highest available spatial resolution, thereby unifying the resolution across spectral bands.
  • CSAN integrates channel–spatial attention with residual connections as the network’s backbone. This design facilitates the extraction of valuable features and the effective transfer of high-frequency spatial details from HR to LR bands, improving overall image quality.
  • Through a series of quantitative and visual experiments, we demonstrate that CSAN outperforms other advanced methods. It not only achieves superior results across multiple evaluation metrics, but also delivers enhanced visual fidelity by restoring more fine textures and structural details.
The remainder of this paper is organized as follows. Section 2 provides an overview of the works related to our research. Section 3 introduces the satellite data, presents the architecture of the proposed CSAN model, and describes the training loss and experimental setup. Experimental results are presented in Section 4, and finally Section 5 concludes the paper.

2. Relate Works

2.1. Deep Learning-Based SR

Deep learning-based methods have become the most efficient and popular for SR in recent years. As a seminal work, SRCNN [16] employed a three-layer CNN to learn the mapping between the LR image and the HR image. To improve accuracy and visual quality, VDSR [29] used a very deep CNN with 20 layers. By combining residual learning with GAN, Ledig et al. [17] proposed SRGAN, which enables the recovery of photo-realistic textures from LR images. Lim et al. [18] further proposed EDSR, which removes batch normalization layers from residual blocks and employs residual scaling, simplifying the architecture and enhancing performance. ESRGAN [30] introduced the residual-in-residual dense block (RRDB), combining a multi-level residual network and dense connections. Zhang et al. [31] designed residual dense blocks (RDBs) to fully exploit the hierarchical features from all convolutional layers. Recently, Transformer-based models have gained increasing attention due to their ability to capture long-range dependencies and global contextual information more effectively than CNNs. For instance, SwinIR [19] and Swin2sr [32] leverage hierarchical feature maps and shifted windows to model local and global information for SR tasks.
To further enhance SR performance, attention mechanisms have been integrated into image SR tasks. These mechanisms enable networks to focus on salient information while suppressing irrelevant information [33,34], thereby improving their capacity to reconstruct fine textures and intricate structures. As a result, this leads to the generation of clearer and more accurate HR images from their LR counterparts [27,28,35]. Specifically, RCAN [27] utilizes channel attention to adjust the feature weights of each channel, achieving notable improvements over previous methods. To exploit spatial contextual information from longer distance and more discriminative representations of channel-wise features, Dai et al. proposed a second-order attention network (SAN) [35]. Niu et al. [28] introduced the holistic attention network (HAN), which includes a layer attention module (LAM) to model inter-layer dependencies and a channel–spatial attention module (CSAM) to learn spatial and channel correlations in each layer. More recently, HAT [36] combined channel attention with self-attention, enhancing cross-window information exchange through overlapping cross-attention modules, significantly boosting reconstruction performance.
In general, deep learning-based SR algorithms focus on improving reconstruction accuracy and perceptual quality by exploring network depth, network architecture, and advanced attention mechanisms.

2.2. SR for Remote Sensing Images

Numerous SR methods have been developed for remote sensing imagery. Some works [37,38,39,40] exploit hierarchical features present in LR remote sensing images to reconstruct finer details that are critical for object identification and analysis. To enhance edge clarity and suppress noise or artifacts, various edge enhancement techniques have also been proposed [41,42,43].
Given that different satellites can observe the same region with minimal time difference and negligible observation errors, some studies use HR images from one satellite as a reference to enhance the resolution of LR images from another [44,45,46].
To address the limitations of pansharpening [47], which combines multi-spectral images with a single panchromatic image, recent approaches have turned to learning-based SR frameworks that fuse LR multi-spectral bands with all available HR bands to improve SR performance. For example, DSen2 [21] utilizes cross-band dependencies in Sentinel-2 data and demonstrates improved accuracy over conventional fusion-based methods. Sen2-RDSR [48] further enhances this by employing RRDB to upsample LR bands to the maximum available resolution. Vasilescu et al. [49] proposed a fully CNN-based model that balances consistency and synthesis properties. Instead of fusing raw LR and HR bands, HFN [50] pre-super-resolves LR images before fusion and further improves spatial details. Liu et al. [51] developed a multistage progressive interactive fusion network to generate all 10 m HR bands for Sentinel-2 step by step. In [52], a pixel-wise attention mechanism is introduced to emphasize salient pixel features while suppressing irrelevant ones.

2.3. HSI SR

LR-HSI SR, often aided by HR-MSI, has been a hot topic in the field of SR, aiming to enhance the spatial resolution of HSI while preserving their rich spectral information. In [53], Palsson et al. developed a computationally efficient and noise-robust 3D CNN method to fuse HR-MSI and LR-HSI. Li et al. [54] investigated the relationship between 2D and 3D convolutions, proposing the split adjacent spatial and spectral convolution (SAEC) to mitigate spectral distortion. HSRNet [25] utilizes attention mechanisms to preserve both spatial and spectral information, leading to high-quality SR results. Similarly, SSAU-Net [26] harnesses useful relationships within both the spectral and spatial domains, integrating features from shallow and deep layers through a cascading structure. To reduce network complexity while ensuring stability, GuidedNet [55] recursively and progressively enhances the resolution of LR-HSI under HR-MSI guidance. Additionally, Essaformer [56] aims to super-resolve single HSI inputs without external auxiliary data.
Although prior work has made progress for the SR of land satellite and hyperspectral images, it may not be applicable for meteorological satellite images. In this paper, we explicitly account for the unique characteristics of meteorological satellite data and propose CSAN, a channel–spatial attention-based residual network tailored for the SR of meteorological satellite images. This model effectively super-resolves all LR bands to the highest resolution, filling the gap in this field.

3. Materials and Methods

In this section, we give a comprehensive introduction to satellite data for SR and the proposed CSAN. We start by describing the GK2A satellite data, followed by an explanation of the overall structure of CSAN. Next, we discuss the three main parts of CSAN: the information fusion unit, the feature extraction module, and the image restoration unit. Then, we present the loss function employed for training the model. Finally, we outline the experimental setup, covering dataset preparation, implementation details, and evaluation protocols.

3.1. Satellite Data Description

Among various meteorological satellites, we focus on the GK2A satellite due to its advanced capabilities and public accessibility. GK2A is the third new-generation geostationary meteorological satellite, providing full-disk surveillance over the Northern Hemisphere, Northeast Asia, and the Korean Peninsula. Equipped with an Advanced Meteorological Imager, GK2A offers enhanced radiometric, spectral, and spatiotemporal capabilities compared to its predecessors [8]. It features sixteen bands across five categories: visible, near-infrared, short-wave infrared, water vapor, and infrared. These bands span center wavelengths from 0.47 μ m to 13.31 μ m, with spatial resolutions of 0.5 km, 1.0 km, or 2.0 km, as summarized in Table 1. GK2A data is categorized into three types based on spatial coverage: full-disk (FD), extended local area (ELA), and local area (LA), with FD data updated every 10 min and ELA/LA data updated every 2 min.
Although GK2A offers a short revisit time and a broad spectral range, its spatial resolution is relatively limited. Only one band achieves a resolution of 0.5 km resolution, three bands are at 1 km, and the remaining twelve bands are at 2 km. This resolution limitation may hinder the precision and reliability of meteorological observations. Therefore, an effective SR method is needed to enhance all 1 km and 2 km bands to a unified resolution of 0.5 km.
Several key factors make it feasible to perform SR on GK2A satellite images:
  • The rapid data acquisition capabilities of GK2A enable the collection of large volumes of high-quality images, which supports SR tasks and facilitates the training of a generalizable model. This extensive dataset allows the model to adapt to diverse geographical features, varying cloud coverage, and atmospheric conditions, making it robust and applicable in real-world scenarios.
  • All spectral bands are captured simultaneously over the same geographic region, preserving spatial consistency and eliminating potential misalignment across bands. This alignment is essential for SR tasks, as it ensures accurate spatial correspondence when enhancing resolution.
  • The spectral relationships among bands remain relatively stable under moderate SR scaling, typically within an order of magnitude [21]. This property allows us to synthetically downsample original GK2A images for training, following the Wald protocol [57]. For example, although ground truth data for × 4 SR (from 2 km to 0.5 km) is unavailable, we can simulate training by downsampling 2 km images to 8 km and learning to recover them back to 2 km. The model trained on this synthetic task can then be applied to super-resolve the original 2 km images to 0.5 km resolution.

3.2. Network Architecture

We divide the GK2A bands into three sets based on their native spatial resolution. Set A = {vi006} contains the 0.5 km band, set B = {vi004, vi005, vi008} includes the 1 km bands, and set C = {nr013, nr016, sw038, wv063, wv069, wv073, ir087, ir096, ir105, ir112, ir123, ir133} includes the 2 km bands. The spatial dimensions of bands in set A are W × H . Let y A R W × H × 1 , y B R W / 2 × H / 2 × 3 , and y C R W / 4 × H / 4 × 12 represent the observed digital numbers of the bands in sets A, B, and C, respectively. Our goal is to super-resolve the bands in sets B and C from their resolutions to match the target resolution of set A. To this end, we design two networks: one for × 2 SR and another for × 4 SR. These two networks share the same architecture but differ in their input and output.
It is worth noting that although the model is ultimately designed to enhance the original 1 km and 2 km bands, its training is conducted using synthetically generated training pairs. Following the Wald protocol, we downsample the GK2A images to simulate inputs for the × 2 and × 4 SR, while the original images are used as ground truth. This strategy enables fully supervised learning despite the lack of true 0.5 km ground truth (see Section 3.4.2 for more details). Once trained, the model is directly applied to the original satellite images for inference in real-world scenarios.
The first network, which we refer to as C S A N × 2 , super-resolves y B by combining y A , corresponding to the × 2 SR
C S A N × 2 : R W × H × 1 × R W / 2 × H / 2 × 3 ( y A , y B ) z B R W × H × 3
where z B denotes the super-resolved output of the three bands in set B.
The second network, which we refer to as C S A N × 4 , super-resolves y C by combining y A and z B , corresponding to the × 4 SR
C S A N × 4 : R W × H × 1 × R W × H × 3 × R W / 4 × H / 4 × 12 ( y A , z B , y C ) z C R W × H × 12
where z C is the super-resolved output of the twelve bands in set C.
As shown in Figure 1, our proposed network comprises three parts: the information fusion unit, the feature extraction module, and the image restoration unit. To clarify, let us denote the LR input as I L R , the HR input as I H R , and the output as I S R . For C S A N × 2 , I L R = y B , I H R = y A , and I S R = z B . For C S A N × 4 , I L R = y C , I H R = ( y A , z B ) , and I S R = z C .

3.2.1. Information Fusion Unit

Many existing methods apply interpolation-based upsampling techniques, such as bilinear, bicubic, or nearest-neighbor interpolation, to match the spatial resolution of I L R with I H R before concatenating them for subsequent feature extraction. Despite their widespread use, these techniques generate new pixels based on surrounding known pixels without introducing high-frequency spatial details. As a result, the upsampled images may be spatially larger but not inherently more informative. Furthermore, simple concatenation fails to effectively capture the spectral relationships between I L R and I H R , making it more difficult to transfer high-frequency spatial details from I H R to I L R during feature extraction.
To overcome this issue, inspired by [25], we initially downsample I H R to match the resolution of I L R using a convolutional layer with a 2 × 2 kernel and a stride of 2, which adaptively adjusts the downsampling effect during training:
I H R D = F D S ( I H R )
where F D S denotes the downsampling convolution operation and I H R D is the resulting downsampled HR input.
To fuse the complementary spectral relationships across bands, I H R D is concatenated with I L R to obtain C 0 . We then apply a pixelshuffle module [see Figure 1b] to convert the expanded spectral dimension of C 0 into enhanced spatial resolution
C 1 = F P S ( C 0 )
where F P S is the pixelshuffle operation and C 1 is the output of the pixelshuffle.
Unlike conventional upsampling techniques, pixelshuffle rearranges channel-wise information into the spatial dimension, avoiding interpolation-induced artifacts while preserving spatial dependencies. This allows for a more efficient integration of the complementary information contained in I H R D and I L R . Finally, we concatenate C 1 with the original I H R to obtain O 0 , which serves as the input to the subsequent feature extraction module.
In summary, instead of directly upsampling I L R , our fusion unit adaptively integrates both the high-frequency spatial information from I H R and the spectral correlations across all bands, providing a richer and more informative representation for downstream processing.

3.2.2. Feature Extraction Module

In [18,27], it has been demonstrated that deep networks based on residual learning have delivered excellent SR performance. However, these networks typically involve a large number of parameters. Given that meteorological satellite data often contain multiple spectral bands, it is necessary to super-resolve several images concurrently. Designing such a large network would inevitably result in significant training burdens and practical deployment challenges.
In light of the aforementioned considerations, we propose a novel and lightweight residual network structure to efficiently extract the abundant channel–spatial information contained in O 0 . Our network adopts the channel–spatial attention group (CSAG) as the fundamental module, with three CSAGs connected in series to form the backbone of the CSAN. The feature extraction module is defined as
O = F E X ( O 0 ) = G 3 ( G 2 ( G 1 ( O 0 ) ) )
where F E X represents the feature extraction function, and G 1 , G 2 , and G 3 are the functions of the CSAG.
Within each CSAG, five channel–spatial attention blocks (CSABs) are stacked, followed by a convolutional layer with a 3 × 3 kernel and a stride of 1, as depicted in Figure 1c. To enhance the learning capability of the network and reduce the difficulty of training, skip connections are introduced to leverage the obtained residual information. The k-th CSAG can be expressed as
O k = G k ( O k 1 ) = O k 1 + F c o n v ( G k , 5 ( G k , 4 ( G k , 1 ( O k 1 ) ) ) )
where G k , i , i = 1 , , 5 , are the functions of the i-th CSAB in the k-th CSAG, and F c o n v is the convolutional layer function. O k 1 and O k denote the input and output of the k-th CSAG.
As previously stated, our goal is to extract valuable spectral and high-frequency spatial features, and incorporate them into the LR input. One option is to use 3D convolutions to holistically extract these features, as is common in many HSI SR works. However, they can greatly increase the number of training parameters and the difficulty of training. Meanwhile, selecting an appropriate convolutional kernel to adapt to the specific input data at hand remains challenging. Instead, we utilize channel attention modules and spatial attention modules to extract salient features from the spectral and spatial domains in parallel, as shown in Figure 2.
Let I R c × h × w denote the input feature map with c channels and spatial size h × w . In the channel attention module, I is subjected to a global average pooling operation F s p that reduces its spatial dimensions to 1 × 1 , followed by a convolutional layer F c o n v . We then utilize a sigmoid function F s to introduce the gating mechanism, and the resulting channel weights W c a are multiplied by I channel-wise to yield the rescaled output I ^ c a , which highlights the salient channel features. The entire process is formulated as
I ^ c a = I W c a = F s ( F c o n v ( F s p ( I ) ) )
where ⊗ stands for the element-wise multiplication.
To generate the spatial attention W s a , a channel mean operation F c m is employed to I to reduce its channel dimension to 1, then a 1 × 1 convolutional layer F c o n v and a sigmoid function F s are applied. Finally, W s a is multiplied element-wise with I to yield the spatially attended output I ^ s a . The spatial attention module is formulated as
I ^ s a = I W s a = F s ( F c o n v ( F c m ( I ) ) )
To further exploit both attention types, we integrate channel and spatial attention into residual blocks, forming CSAB, as shown in Figure 1d. Let the input and output of the m-th CSAB in the k-th CSAG be denoted as O k , m 1 and O k , m , respectively. The m-th CSAB in the k-th CSAG is defined as
O k , m = G k , m ( O k , m 1 ) = O k , m 1 + F C S A ( F c o n v 2 ( δ ( F c o n v 1 ( O k , m 1 ) ) )
where G k , m is the function of the k-th CSAG. F C S A denotes the channel–spatial attention function. F c o n v 1 and F c o n v 2 are two stacked convolutional layers. δ represents the ReLU function.
Specifically, the process begins with O k , m 1 being fed through two consecutive convolutional layers, each with a 3 × 3 kernel and a stride of 1. The ReLU activation function is applied following the first convolutional layer to introduce nonlinearity. Then, channel–spatial attention is applied to refine the feature map. To leverage useful residual information, we incorporate residual connections that add the residual back to the input O k , m 1 .
To sum up, by integrating residual learning with channel–spatial attention, we have enhanced the network’s capability to delve deeper into the extraction of spectral features among LR and HR images, as well as to capture spatial features intrinsic to the HR data.

3.2.3. Image Restoration Unit

The core objective of image SR is to reconstruct sharp and detailed images by recovering high-frequency textures that are typically lost during the downsampling process or due to the inherent limitations of the imaging sensor. To achieve this restoration, we first apply bilinear interpolation to upsample the LR input I L R to the target spatial resolution. The resulting upsampled LR input, denoted as I L R U , matches the desired size but still lacks fine-grained textures, as interpolation alone does not reconstruct high-frequency components. Then, to enrich I L R U with the missing details, the high-frequency residual features H extracted by the feature extraction module are added back to I L R U to produce the final super-resolved output I S R . This process is represented as
I S R = I L R U + H

3.3. Loss Function

To ensure both robustness and efficiency during training, we adopt the mean absolute error (MAE), also known as the L 1 norm, as our loss function. This choice has been well studied in previous works [21,27]. Despite its simplicity, the L 1 loss performs particularly well on images with high dynamic range values, which aligns well with the characteristics of the GK2A data. Let the training set be denoted as { I L R i , I G T i } i = 1 n , where I L R i is the i-th LR input and I G T i is the corresponding ground truth. The CSAN model is trained to minimize the L 1 loss defined as follows:
L ( Θ ) = 1 n i = 1 n F CSAN ( I L R i ) I G T i 1
where Θ denotes the set of trainable parameters of the network. The loss function is optimized by the stochastic gradient descent algorithm.

3.4. Experimental Setup

3.4.1. Dataset Preparation

To develop a generalizable SR model applicable to various cloud and terrain conditions, we use the GK2A FD data for both training and testing. Leveraging GK2A’s capacity to collect extensive daily imagery, we sample FD data once per week between 3:00 and 5:00 AM UTC, thereby avoiding periods of darkness and invisibility. Since each FD image exceeds GPU memory limits, we randomly extract smaller patches for training. For the × 2 SR model, we sample 100,000 patches of size 32 × 32 pixels at 1 km resolution. For the × 4 SR model, we extract 40,000 patches of the same size at 2 km resolution. For testing, we select eight regions from the FD data, each of size 2000 × 2000 pixels at 0.5 km resolution. These testing regions encompass varied geographic and atmospheric conditions, including clouds, land, and ocean, to ensure thorough evaluation of the model’s generalization capabilities.

3.4.2. Implementation Details

Our model is implemented using the PyTorch 1.10.1 framework. All experiments are conducted on an NVIDIA GeForce GTX 2080 Ti GPU. We use the Adam optimizer with β 0 = 0.9 , β 1 = 0.999 , and ϵ = 10 8 , and set the learning rate to 1 × 10 4 . The batch size and number of training epochs are set to 16 and 50, respectively. Since ground truth images at 0.5 km resolution are not available in real-world settings, we follow the Wald protocol to generate training data by downsampling the original GK2A data. This allows us to train both the × 2 and × 4 models in a fully supervised manner. For the × 2 SR model, we first downsample the 0.5 km band and the 1 km bands by a factor of 2 to simulate inputs at 1 km and 2 km resolution, respectively. These downsampled bands serve as inputs, while their original counterparts are used as the ground truth. The model is then trained to learn the mapping from downsampled 1 km bands to their original 1 km resolution. The same protocol is used for the × 4 SR model to learn the mapping from downsampled 2 km bands to their original 2 km resolution. Given that the digital numbers in satellite images can range from zero to several tens of thousands, we normalize each image by dividing by its maximum pixel value. This normalization improves numerical stability and accelerates convergence during training.

3.4.3. Evaluation Protocols

We compare CSAN against several representative baselines. Fusion-based models include DSen2 [21], Sen2-RDSR [48], PARNet [52], and HFN [50], all of which combine HR and upsampled LR inputs to achieve SR. We also include additional SISR methods: Bicubic interpolation, EDSR [18], SwinIR [19], and Essaformer [56]. Among them, EDSR and SwinIR represent deep residual and transformer-based approaches, respectively, while Essaformer is a state-of-the-art model for hyperspectral SISR.
To quantitatively assess performance for downsampled images where ground truth is available, we adopt the root mean square error (RMSE), peak-signal-to-noise ratio (PSNR), signal-to-reconstruction error ratio (SRE), spectral angle mapper (SAM), and erreur relative globale adimensionnelle de synthèse (ERGAS).
RMSE measures the average magnitude of the errors between the super-resolved and ground truth images. The formula for RMSE is given by
RMSE = 1 N i = 1 N ( x i y i ) 2
where x i and y i are the pixel values of the super-resolved and ground truth images, respectively, and N is the total number of pixels. The unit of RMSE is the same as that of the pixel value (e.g., digital numbers).
PSNR quantifies the reconstruction quality by comparing the maximum possible signal intensity to the magnitude of reconstruction error. It is calculated as
PSNR = 10 · log 10 M A X I 2 MSE
MSE = 1 N i = 1 N ( x i y i ) 2
where M A X I is the maximum pixel value in ground truth image, and MSE is the mean squared error between the super-resolved and ground truth images. PSNR is measured in decibels (dB).
SRE measures the error relative to the squared mean of the ground truth image:
SRE = 10 · log 10 ( x ¯ ) 2 1 N i = 1 N ( x i y i ) 2
where x ¯ is the mean pixel value of the ground truth image. SRE is given in dB.
SAM measures the spectral similarity by computing the average spectral angle between corresponding pixel vectors in the super-resolved and ground truth images. It is computed as
SAM = 1 N i = 1 N cos 1 x i · y i x i y i
where x i and y i are the spectral vectors of at the i-th pixel in the super-resolved and ground truth images, respectively. SAM is measured in degrees.
ERGAS assesses the global error of reconstructed multispectral images by considering differences in both spectral and spatial resolution. It is defined as
ERGAS = 100 p 1 B i = 1 B R M S E i x i ¯ 2
where p is the resolution ratio between LR and SR images, B is the number of bands, and x i ¯ is the mean pixel value of the i-th band in ground truth image. ERGAS is a unitless metric.
Lower values of RMSE, SAM, and ERGAS, along with higher values of PSNR and SRE, generally indicate better SR results.
For original-scale evaluation without ground truth, we adopt three no-reference perceptual quality metrics: natural image quality evaluator (NIQE), blind/referenceless image spatial quality evaluator (BRISQUE), and perception based image quality evaluator (PIQE), which assess image quality based on deviations from natural image statistics, spatial distortion, and perceptual artifacts, respectively. For all three metrics, lower values indicate better perceptual quality.
We also conduct visual comparisons for both cases. For downsampled images, we visually compare SR outputs to their corresponding ground truth images and visualize pixel-wise absolute error maps to highlight reconstruction differences. The absolute error map is depicted using brightness, where brighter areas indicate larger errors and darker areas represent smaller errors. For original-scale images, where no ground truth exists, we visually inspect SR outputs using the 0.5 km vi006 band as a visual reference, allowing qualitative assessment of spatial clarity and consistency.

4. Results

We evaluate CSAN through a series of experiments. First, we test on downsampled GK2A images with available ground truth, using quantitative metrics and visual comparisons. Results are reported separately for the 1 km and 2 km bands. Then, we assess performance on original-scale GK2A images using no-reference quality metrics and qualitative visual inspection with the 0.5 km vi006 band as reference. We also conduct ablation studies to analyze the impact of key components, and finally compare model complexity in terms of parameters, training, and inference time.

4.1. Evaluation at Lower Scale

4.1.1. Evaluation Results of Super-Resolving Downsampled 1 km Bands

As previously mentioned, since ground truth data are not available in real-world settings, we proceed with our experiments by downsampling the original 1 km images to 2 km and then super-resolving them back to 1 km resolution. The quantitative results for the 1 km bands (vi004, vi005, and vi008), averaged over all testing regions, are reported in Table 2, while visual comparisons are presented in Figure 3 and Figure 4.
As shown in Table 2, CSAN consistently outperforms all competing methods across all metrics for the three 1 km bands. Compared to Bicubic and SISR methods (EDSR, SwinIR, and Essaformer), CSAN achieves at least a twofold reduction in RMSE and ERGAS, and gains over 7 dB in both PSNR and SRE. Compared to fusion-based methods (DSen2, Sen2-RDSR, PARNet, and HFN), CSAN further reduces RMSE by approximately 10% and delivers superior performance across all evaluated metrics.
Notably, while fusion-based methods benefit from access to auxiliary HR bands and thus outperform SISR models, CSAN achieves even better performance by incorporating channel and spatial attention mechanisms, which enhance feature extraction and improve reconstruction fidelity. In contrast, Bicubic, which simply scales images based on neighboring pixel values without learning spatial structures or leveraging HR information, yields inferior results in quantitative evaluations.
Figure 3 presents visual comparisons using false color composites constructed from three 1 km bands. Specifically, vi008 is assigned to the red channel, vi005 to green, and vi004 to blue. This composite enhances visual contrast for qualitative evaluation. Each image represents the composite result of three super-resolved bands from each method. Among the compared methods, CSAN yields the most faithful restoration, capturing fine details in cloud and land structures. In contrast, Bicubic and SISR models generate visibly blurred outputs, lacking important spatial information.
Furthermore, Figure 4 presents the average absolute error maps of the three bands. CSAN results in fewer bright regions, indicating lower reconstruction error. These visual findings align with the quantitative analysis, confirming the effectiveness of CSAN in super-resolving meteorological satellite imagery.

4.1.2. Evaluation Results of Super-Resolving Downsampled 2 km Bands

Following the same protocol, we downsample the original 2 km bands by a factor of four to generate 8 km resolution inputs, which are then super-resolved back to 2 km for evaluating × 4 SR performance. The quantitative results averaged over all testing regions are summarized in Table 3, and visual comparisons are presented in Figure 5 and Figure 6.
As shown in Table 3, due to the longer wavelengths and smoother spatial structures of the 2 km bands, the performance differences among methods are less pronounced than in the 1 km case. Nevertheless, CSAN achieves the best performance across all evaluation metrics. These results confirm that CSAN is also effective for LR spectral data with long wavelengths.
Given the total of 12 bands at 2 km resolution, we select nr106 (1.61 μ m) and ir105 (10.40 μ m) for qualitative visualization in Figure 5, as these bands yield relatively clear spatial patterns. Visually, CSAN produces the sharpest and most faithful reconstructions. However, Bicubic and SISR outputs appear noticeably blurry and lack structural detail. Fusion-based methods deliver improved clarity and are visually close to CSAN.
Additionally, the absolute error maps in Figure 6 further support these findings. CSAN generates fewer high-error regions, highlighting its effectiveness in restoring fine spatial details across diverse spectral bands.

4.2. Evaluation at the Original Scale

Our models are trained on synthetically downsampled data, allowing them to learn priors for × 2 and × 4 SR. To evaluate CSAN’s applicability to real-world GK2A imagery, we directly input the original 1 km and 2 km bands into the trained network and super-resolve them to 0.5 km resolution. As ground truth is unavailable at this scale, we use the original 0.5 km vi006 band as a visual reference to assess the SR results. Visual comparisons are conducted between CSAN and Bicubic.
For the × 2 SR, we select three 1 km bands (vi008, vi005, vi004) and compose them into a false color composite image for visual comparison, as shown in Figure 7. Compared to Bicubic, which produces noticeably blurry outputs and fails to recover fine-grained details, CSAN generates visually sharper and more structured images. The CSAN results closely approximate the visual quality of the reference 0.5 km band.
For the × 4 SR, we select two representative 2 km bands, nr016 and ir105, to evaluate the model’s performance across different spectral characteristics, as illustrated in Figure 8. In the nr016 band, CSAN significantly improves spatial clarity, producing sharper cloud contours and enhanced land features, with visual quality comparable to the 0.5 km vi006 reference. In the ir105 band, CSAN also enhances resolution and reveals typhoon structures more clearly than Bicubic. However, under complex atmospheric conditions (e.g., cyclone regions), minor structural distortions such as irregularities near the cyclone eye can still occur. These issues are likely caused by the inherent properties of infrared bands, including smoother textures, lower spatial frequencies, and reduced signal-to-noise ratios, which make high-scale SR reconstruction more difficult. Despite these challenges, CSAN consistently outperforms Bicubic across both visible and infrared domains, demonstrating strong generalization to original images. Future work may explore incorporating physical priors or spatiotemporal correlations to improve performance in difficult infrared conditions.
In addition to visual comparisons, we employ no-reference perceptual quality metrics including NIQE, BRISQUE, and PIQE to provide auxiliary quantitative evaluation in the absence of ground truth. These metrics are computed independently for each band across all testing regions and then averaged. As summarized in Table 4 and Table 5, CSAN consistently achieves the lowest BRISQUE and PIQE scores and maintains strong performance in NIQE, indicating robust perceptual quality across all no-reference metrics. It should be noted, however, that these metrics were originally developed for natural images and may not fully align with the characteristics of remote sensing data. Therefore, they should be regarded as supplementary indicators of perceptual fidelity rather than definitive benchmarks.

4.3. Ablation Study

To analyze the effectiveness of each core component in our CSAN model, we conduct a comprehensive ablation study under both downsampled 1 km and 2 km SR settings, as shown in Table 6 and Table 7. The study evaluates the impact of the information fusion unit, channel attention, and spatial attention on SR performance. Specifically, w/o-IFU denotes a variant where the information fusion unit is removed and the LR image is directly upsampled and concatenated with the HR band. w/o-CA and w/o-SA denote variants where the channel attention and spatial attention modules are removed, respectively. The evaluation is based on five metrics: RMSE, PSNR, SRE, SAM, and ERGAS. Specifically, RMSE, PSNR, and SRE are computed for each band and then averaged across all bands and testing regions. SAM and ERGAS are calculated at the region level and subsequently averaged across all regions.
As shown in Table 6, the removal of any module leads to performance degradation across evaluation metrics, highlighting their individual contributions. The absence of the information fusion unit leads to the largest increases in RMSE and ERGAS, suggesting its key role in integrating complementary information from LR and HR inputs. The channel attention module mainly contributes to spectral fidelity, as indicated by degraded SAM and ERGAS when removed. Meanwhile, removing the spatial attention module results in lower PSNR and SRE, reflecting its impact on spatial detail reconstruction. The full CSAN model achieves the best overall performance by combining these complementary strengths. Similar trends are observed at 2 km resolution (see Table 7), reinforcing the validity of our component designs across different scales.

4.4. Model Complexity Analyses

Table 8 and Table 9 present the complexity comparison of all evaluated methods in terms of the number of parameters, training time, and inference time. All methods were executed on a single NVIDIA GeForce GTX 2080 Ti GPU. The inference time is defined as the total time required to super-resolve all testing regions. Among these methods, CSAN has fewer parameters than Essaformer, SwinIR, EDSR, HFN, Sen2-RDSR, and DSen2, yet it achieves better results, demonstrating an advantageous trade-off between performance and model size. Furthermore, CSAN efficiently super-resolves 1 km bands in 5.45 h of training and 5.21 s of inference, and 2 km bands in 8.46 h of training and 5.58 s of inference. These results suggest that CSAN is not only effective but also practical for operational deployment in large-scale satellite image processing tasks.

5. Conclusions

We have proposed a channel–spatial attention-based network (CSAN) for the SR of multi-resolution, multi-spectral meteorological satellite images. Specifically, CSAN has been trained to uniformly super-resolve all 1 km and 2 km images from the GK2A satellite to the highest available resolution of 0.5 km. The network adaptively fuses LR and HR images, capturing spectral correlations across bands and high-frequency spatial details from the HR images. By embedding channel attention and spatial attention within a residual network, CSAN extracts salient channel and spatial features from the input, ultimately enhancing the LR images to produce super-resolved outputs. Extensive quantitative and visual experiments have validated CSAN’s high accuracy and superiority over state-of-the-art methods, showing its capability to handle SR tasks across various spectral bands.
Despite these encouraging results, CSAN presents certain limitations that warrant discussion. One practical limitation lies in its reliance on an HR auxiliary band to guide the SR of LR inputs. Although this setup is feasible in meteorological satellites like GK2A, it may limit applicability to sensors lacking HR reference bands. Potential extensions could include cross-sensor fusion, synthetic HR supervision, or self-supervised learning without external HR guidance. Additionally, our results indicate that CSAN’s performance on long-wavelength infrared bands can be less reliable under complex atmospheric conditions. The smoother textures, lower spatial frequency content, and reduced signal-to-noise ratio inherent in these bands make SR more challenging. Incorporating physics-based priors or temporal consistency mechanisms may improve robustness in such scenarios.

Author Contributions

Conceptualization, W.L. and Y.L.; methodology, W.L.; validation, W.L.; writing—original draft preparation, W.L.; writing—review and editing, W.L. and Y.L.; and supervision, Y.L. All authors have read and agreed to the published version of the manuscript.

Funding

This research received no external funding.

Data Availability Statement

The original contributions presented in the study are included in the article, further inquiries can be directed to the corresponding author.

Conflicts of Interest

The authors declare no conflicts of interest.

References

  1. Bessho, K.; Date, K.; Hayashi, M.; Ikeda, A.; Imai, T.; Inoue, H.; Kumagai, Y.; Miyakawa, T.; Murata, H.; Ohno, T.; et al. An introduction to Himawari-8/9—Japan’s new-generation geostationary meteorological satellites. J. Meteorol. Soc. Jpn. Ser. II 2016, 94, 151–183. [Google Scholar] [CrossRef]
  2. Yang, J.; Zhang, Z.; Wei, C.; Lu, F.; Guo, Q. Introducing the new generation of Chinese geostationary weather satellites, Fengyun-4. Bull. Am. Meteorol. Soc. 2017, 98, 1637–1658. [Google Scholar] [CrossRef]
  3. Kim, D.; Gu, M.; Oh, T.H.; Kim, E.K.; Yang, H.J. Introduction of the advanced meteorological imager of Geo-Kompsat-2a: In-orbit tests and performance validation. Remote Sens. 2021, 13, 1303. [Google Scholar] [CrossRef]
  4. Thies, B.; Bendix, J. Satellite based remote sensing of weather and climate: Recent achievements and future perspectives. Meteorol. Appl. 2011, 18, 262–295. [Google Scholar] [CrossRef]
  5. Geer, A.J.; Lonitz, K.; Weston, P.; Kazumori, M.; Okamoto, K.; Zhu, Y.; Liu, E.H.; Collard, A.; Bell, W.; Migliorini, S.; et al. All-sky satellite data assimilation at operational weather forecasting centres. Q. J. R. Meteorol. Soc. 2018, 144, 1191–1217. [Google Scholar] [CrossRef]
  6. Barmpoutis, P.; Papaioannou, P.; Dimitropoulos, K.; Grammalidis, N. A review on early forest fire detection systems using optical remote sensing. Sensors 2020, 20, 6442. [Google Scholar] [CrossRef] [PubMed]
  7. Kang, Y.; Jang, E.; Im, J.; Kwon, C. A deep learning model using geostationary satellite data for forest fire detection with reduced detection latency. GIScience Remote Sens. 2022, 59, 2019–2035. [Google Scholar] [CrossRef]
  8. Chen, J.; Zheng, W.; Wu, S.; Liu, C.; Yan, H. Fire monitoring algorithm and its application on the geo-kompsat-2A geostationary meteorological satellite. Remote Sens. 2022, 14, 2655. [Google Scholar] [CrossRef]
  9. Norris, J.R.; Allen, R.J.; Evan, A.T.; Zelinka, M.D.; O’Dell, C.W.; Klein, S.A. Evidence for climate change in the satellite cloud record. Nature 2016, 536, 72–75. [Google Scholar] [CrossRef] [PubMed]
  10. Lei, H.; Wang, J. Observed characteristics of dust storm events over the western United States using meteorological, satellite, and air quality measurements. Atmos. Chem. Phys. 2014, 14, 7847–7857. [Google Scholar] [CrossRef]
  11. Colston, J.M.; Ahmed, T.; Mahopo, C.; Kang, G.; Kosek, M.; de Sousa Junior, F.; Shrestha, P.S.; Svensen, E.; Turab, A.; Zaitchik, B.; et al. Evaluating meteorological data from weather stations, and from satellites and global models for a multi-site epidemiological study. Environ. Res. 2018, 165, 91–109. [Google Scholar] [CrossRef] [PubMed]
  12. Zhang, C.; Marzougui, A.; Sankaran, S. High-resolution satellite imagery applications in crop phenotyping: An overview. Comput. Electron. Agric. 2020, 175, 105584. [Google Scholar] [CrossRef]
  13. Xie, Z.; Song, W.; Ba, R.; Li, X.; Xia, L. A spatiotemporal contextual model for forest fire detection using Himawari-8 satellite data. Remote Sens. 2018, 10, 1992. [Google Scholar] [CrossRef]
  14. Kim, Y.; Ryu, H.S.; Han, K.H.; Ha, J.H.; Kim, G.; Hong, S. Temporal Resolution Enhancement of COMS Satellite using Geo-Kompsat-2A Satellite through Data-to-Data Translation. IEEE J. Sel. Top. Appl. Earth Obs. Remote Sens. 2024, 17, 9759–9771. [Google Scholar] [CrossRef]
  15. Wang, P.; Bayram, B.; Sertel, E. A comprehensive review on deep learning based remote sensing image super-resolution methods. Earth-Sci. Rev. 2022, 232, 104110. [Google Scholar] [CrossRef]
  16. Dong, C.; Loy, C.C.; He, K.; Tang, X. Image super-resolution using deep convolutional networks. IEEE Trans. Pattern Anal. Mach. Intell. 2015, 38, 295–307. [Google Scholar] [CrossRef] [PubMed]
  17. Ledig, C.; Theis, L.; Huszár, F.; Caballero, J.; Cunningham, A.; Acosta, A.; Aitken, A.; Tejani, A.; Totz, J.; Wang, Z.; et al. Photo-realistic single image super-resolution using a generative adversarial network. In Proceedings of the IEEE Conference on Computer Vision and Pattern Recognition, Honolulu, HI, USA, 21–26 July 2017; pp. 4681–4690. [Google Scholar]
  18. Lim, B.; Son, S.; Kim, H.; Nah, S.; Mu Lee, K. Enhanced deep residual networks for single image super-resolution. In Proceedings of the IEEE Conference on Computer Vision and Pattern Recognition Workshops, Honolulu, HI, USA, 21–26 July 2017; pp. 136–144. [Google Scholar]
  19. Liang, J.; Cao, J.; Sun, G.; Zhang, K.; Van Gool, L.; Timofte, R. Swinir: Image restoration using swin transformer. In Proceedings of the IEEE/CVF International Conference on Computer Vision, Montreal, QC, Canada, 11–17 October 2021; pp. 1833–1844. [Google Scholar]
  20. Liebel, L.; Körner, M. Single-image super resolution for multispectral remote sensing data using convolutional neural networks. Int. Arch. Photogramm. Remote Sens. Spat. Inf. Sci. 2016, 41, 883–890. [Google Scholar] [CrossRef]
  21. Lanaras, C.; Bioucas-Dias, J.; Galliani, S.; Baltsavias, E.; Schindler, K. Super-resolution of Sentinel-2 images: Learning a globally applicable deep neural network. ISPRS J. Photogramm. Remote Sens. 2018, 146, 305–319. [Google Scholar] [CrossRef]
  22. Gargiulo, M.; Mazza, A.; Gaetano, R.; Ruello, G.; Scarpa, G. Fast super-resolution of 20 m Sentinel-2 bands using convolutional neural networks. Remote Sens. 2019, 11, 2635. [Google Scholar] [CrossRef]
  23. Wu, J.; He, Z.; Hu, J. Sentinel-2 sharpening via parallel residual network. Remote Sens. 2020, 12, 279. [Google Scholar] [CrossRef]
  24. Tarasiewicz, T.; Nalepa, J.; Farrugia, R.A.; Valentino, G.; Chen, M.; Briffa, J.A.; Kawulok, M. Multitemporal and multispectral data fusion for super-resolution of Sentinel-2 images. IEEE Trans. Geosci. Remote Sens. 2023, 61, 5406519. [Google Scholar] [CrossRef]
  25. Hu, J.F.; Huang, T.Z.; Deng, L.J.; Jiang, T.X.; Vivone, G.; Chanussot, J. Hyperspectral image super-resolution via deep spatiospectral attention convolutional neural networks. IEEE Trans. Neural Netw. Learn. Syst. 2021, 33, 7251–7265. [Google Scholar] [CrossRef] [PubMed]
  26. Liu, S.; Liu, S.; Zhang, S.; Li, B.; Hu, W.; Zhang, Y.D. SSAU-Net: A spectral–spatial attention-based U-Net for hyperspectral image fusion. IEEE Trans. Geosci. Remote Sens. 2022, 60, 5542116. [Google Scholar] [CrossRef]
  27. Zhang, Y.; Li, K.; Li, K.; Wang, L.; Zhong, B.; Fu, Y. Image super-resolution using very deep residual channel attention networks. In Proceedings of the European Conference on Computer Vision (ECCV), Munich, Germany, 8–14 September 2018; pp. 286–301. [Google Scholar]
  28. Niu, B.; Wen, W.; Ren, W.; Zhang, X.; Yang, L.; Wang, S.; Zhang, K.; Cao, X.; Shen, H. Single image super-resolution via a holistic attention network. In Proceedings of the Computer Vision–ECCV 2020: 16th European Conference, Glasgow, UK, 23–28 August 2020; pp. 191–207. [Google Scholar]
  29. Kim, J.; Lee, J.K.; Lee, K.M. Accurate image super-resolution using very deep convolutional networks. In Proceedings of the IEEE Conference on Computer Vision and Pattern Recognition, Las Vegas, NV, USA, 27–30 June 2016; pp. 1646–1654. [Google Scholar]
  30. Wang, X.; Yu, K.; Wu, S.; Gu, J.; Liu, Y.; Dong, C.; Qiao, Y.; Change Loy, C. Esrgan: Enhanced super-resolution generative adversarial networks. In Proceedings of the European Conference on Computer Vision (ECCV) Workshops, Munich, Germany, 8–14 September 2018; pp. 63–79. [Google Scholar]
  31. Zhang, Y.; Tian, Y.; Kong, Y.; Zhong, B.; Fu, Y. Residual dense network for image super-resolution. In Proceedings of the IEEE Conference on Computer Vision and Pattern Recognition, Salt Lake City, UT, USA, 18–23 June 2018; pp. 2472–2481. [Google Scholar]
  32. Conde, M.V.; Choi, U.J.; Burchi, M.; Timofte, R. Swin2sr: Swinv2 transformer for compressed image super-resolution and restoration. In Proceedings of the European Conference on Computer Vision, Tel Aviv, Israel, 23–27 October 2022; pp. 669–687. [Google Scholar]
  33. Hu, J.; Shen, L.; Sun, G. Squeeze-and-excitation networks. In Proceedings of the IEEE Conference on Computer Vision and Pattern Recognition, Salt Lake City, UT, USA, 18–23 June 2018; pp. 7132–7141. [Google Scholar]
  34. Woo, S.; Park, J.; Lee, J.Y.; Kweon, I.S. Cbam: Convolutional block attention module. In Proceedings of the European Conference on Computer Vision (ECCV), Munich, Germany, 8–14 September 2018; pp. 3–19. [Google Scholar]
  35. Dai, T.; Cai, J.; Zhang, Y.; Xia, S.T.; Zhang, L. Second-order attention network for single image super-resolution. In Proceedings of the IEEE/CVF Conference on Computer Vision and Pattern Recognition, Long Beach, CA, USA, 15–20 June 2019; pp. 11065–11074. [Google Scholar]
  36. Chen, X.; Wang, X.; Zhou, J.; Qiao, Y.; Dong, C. Activating more pixels in image super-resolution transformer. In Proceedings of the IEEE/CVF Conference on Computer Vision and Pattern Recognition, Vancouver, BC, Canada, 17–24 June 2023; pp. 22367–22377. [Google Scholar]
  37. Lei, S.; Shi, Z.; Zou, Z. Super-resolution for remote sensing images via local–global combined network. IEEE Geosci. Remote Sens. Lett. 2017, 14, 1243–1247. [Google Scholar] [CrossRef]
  38. Ma, W.; Pan, Z.; Yuan, F.; Lei, B. Super-resolution of remote sensing images via a dense residual generative adversarial network. Remote Sens. 2019, 11, 2578. [Google Scholar] [CrossRef]
  39. Pan, Z.; Ma, W.; Guo, J.; Lei, B. Super-resolution of single remote sensing image based on residual dense backprojection networks. IEEE Trans. Geosci. Remote Sens. 2019, 57, 7918–7933. [Google Scholar] [CrossRef]
  40. Zhang, D.; Shao, J.; Li, X.; Shen, H.T. Remote sensing image super-resolution via mixed high-order attention network. IEEE Trans. Geosci. Remote Sens. 2020, 59, 5183–5196. [Google Scholar] [CrossRef]
  41. Jiang, K.; Wang, Z.; Yi, P.; Wang, G.; Lu, T.; Jiang, J. Edge-enhanced GAN for remote sensing image superresolution. IEEE Trans. Geosci. Remote Sens. 2019, 57, 5799–5812. [Google Scholar] [CrossRef]
  42. Rabbi, J.; Ray, N.; Schubert, M.; Chowdhury, S.; Chao, D. Small-object detection in remote sensing images with end-to-end edge-enhanced GAN and object detector network. Remote Sens. 2020, 12, 1432. [Google Scholar] [CrossRef]
  43. Qiu, Z.; Shen, H.; Yue, L.; Zheng, G. Cross-sensor remote sensing imagery super-resolution via an edge-guided attention-based network. ISPRS J. Photogramm. Remote Sens. 2023, 199, 226–241. [Google Scholar] [CrossRef]
  44. Salgueiro Romero, L.; Marcello, J.; Vilaplana, V. Super-resolution of sentinel-2 imagery using generative adversarial networks. Remote Sens. 2020, 12, 2424. [Google Scholar] [CrossRef]
  45. Zabalza, M.; Bernardini, A. Super-resolution of sentinel-2 images using a spectral attention mechanism. Remote Sens. 2022, 14, 2890. [Google Scholar] [CrossRef]
  46. Gupta, A.; Mishra, R.; Zhang, Y. SenGLEAN: An End-to-End Deep Learning Approach for Super-Resolution of Sentinel-2 Multi-Resolution Multispectral Images. IEEE Trans. Geosci. Remote Sens. 2024, 62, 1–19. [Google Scholar] [CrossRef]
  47. Vivone, G.; Alparone, L.; Chanussot, J.; Dalla Mura, M.; Garzelli, A.; Licciardi, G.A.; Restaino, R.; Wald, L. A critical comparison among pansharpening algorithms. IEEE Trans. Geosci. Remote Sens. 2014, 53, 2565–2586. [Google Scholar] [CrossRef]
  48. Salgueiro, L.; Marcello, J.; Vilaplana, V. Single-image super-resolution of Sentinel-2 low resolution bands with residual dense convolutional neural networks. Remote Sens. 2021, 13, 5007. [Google Scholar] [CrossRef]
  49. Vasilescu, V.; Datcu, M.; Faur, D. A CNN-based Sentinel-2 image super-resolution method using multiobjective training. IEEE Trans. Geosci. Remote Sens. 2023, 61, 4700314. [Google Scholar] [CrossRef]
  50. Wu, J.; Lin, L.; Zhang, C.; Li, T.; Cheng, X.; Nan, F. Generating Sentinel-2 all-band 10-m data by sharpening 20/60-m bands: A hierarchical fusion network. ISPRS J. Photogramm. Remote Sens. 2023, 196, 16–31. [Google Scholar] [CrossRef]
  51. Liu, X.; Meng, X.; Liu, Q.; Chen, X.; Zhao, R.; Shao, F. Multistage Progressive Interactive Fusion Network for Sentinel-2: High Resolution for All Bands. IEEE J. Sel. Top. Appl. Earth Obs. Remote Sens. 2023, 16, 10191–10202. [Google Scholar] [CrossRef]
  52. Chang, Y.; Chen, G.; Chen, J. Pixel-wise attention residual network for super-resolution of optical remote sensing images. Remote Sens. 2023, 15, 3139. [Google Scholar] [CrossRef]
  53. Palsson, F.; Sveinsson, J.R.; Ulfarsson, M.O. Multispectral and hyperspectral image fusion using a 3-D-convolutional neural network. IEEE Geosci. Remote Sens. Lett. 2017, 14, 639–643. [Google Scholar] [CrossRef]
  54. Li, Q.; Wang, Q.; Li, X. Exploring the relationship between 2D/3D convolution for hyperspectral image super-resolution. IEEE Trans. Geosci. Remote Sens. 2021, 59, 8693–8703. [Google Scholar] [CrossRef]
  55. Ran, R.; Deng, L.J.; Jiang, T.X.; Hu, J.F.; Chanussot, J.; Vivone, G. GuidedNet: A general CNN fusion framework via high-resolution guidance for hyperspectral image super-resolution. IEEE Trans. Cybern. 2023, 53, 4148–4161. [Google Scholar] [CrossRef] [PubMed]
  56. Zhang, M.; Zhang, C.; Zhang, Q.; Guo, J.; Gao, X.; Zhang, J. Essaformer: Efficient transformer for hyperspectral image super-resolution. In Proceedings of the IEEE/CVF International Conference on Computer Vision, Paris, France, 1–6 October 2023; pp. 23073–23084. [Google Scholar]
  57. Wald, L. Data Fusion: Definitions and Architectures: Fusion of Images of Different Spatial Resolutions; Presses des MINES: Paris, France, 2002. [Google Scholar]
Figure 1. Overall network structure of our proposed CSAN. (a) The architecture of CSAN, which consists of three parts: the information fusion unit, the feature extraction module, and the image restoration unit.  I L R represents the set of LR input bands, I H R is the HR input, and I S R is the super-resolved output. For the × 2 model, I L R includes three 1 km bands and I H R is the original 0.5 km band. For the × 4 model, I L R includes twelve 2 km bands and I H R combines the original 0.5 km band and the super-resolved 1 km bands. (b) Schematic diagram of the PixelShuffle module, which converts the channel dimension into the spatial dimension. (c) Illustration of the CSAG module, which includes five CSABs and a convolutional layer. (d) Illustration of the CSAB module containing the channel–spatial attention mechanism.
Remotesensing 17 02513 g001
Figure 2. Illustration of channel attention module and spatial attention module.
Remotesensing 17 02513 g002
Figure 3. Visual results of the × 2 SR for downsampled 1 km bands. To facilitate comparison, a false color composite is constructed using three bands: vi008 is mapped to red, vi005 to green, and vi004 to blue. Each panel shows the composite image formed by the super-resolved outputs of these three bands from the respective method.
Remotesensing 17 02513 g003
Figure 4. Average absolute error map between ground truth and × 2 SR result for all downsampled 1 km bands.
Remotesensing 17 02513 g004
Figure 5. Visual results of the × 4 SR for downsampled 2 km bands. The first and second rows display images from the nr016 band with a central wavelength of 1.61 μ m, while the third and fourth rows display images from the ir105 band with a central wavelength of 10.403 μ m.
Remotesensing 17 02513 g005
Figure 6. Average absolute error map between ground truth and × 4 SR result for all downsampled 2 km bands.
Remotesensing 17 02513 g006
Figure 7. Visual results of CSAN and Bicubic on original 1 km GK2A satellite data, for the × 2 SR. Each row corresponds to a different testing region. From left to right, each column shows the original 0.5 km vi006 band (used as a reference), the original 1 km band (LR input), the result by Bicubic at 0.5 km resolution, and the result by CSAN at 0.5 km resolution.
Remotesensing 17 02513 g007
Figure 8. Visual results of CSAN and Bicubic on original 2 km GK2A satellite data, for the × 4 SR. Each row corresponds to a different test region. From left to right, each column shows the original 0.5 km vi006 band (used as a reference), the original 1 km band, the original 2 km band (LR input), the result for Bicubic at 0.5 km resolution, and the result for CSAN at 0.5 km resolution.
Remotesensing 17 02513 g008
Table 1. Specifications of sixteen GK2A bands.
CategoryBand NumberBand NameCenter Wavelength [ μ m]Spatial Resolution [km]
Visible1vi0040.471
2vi0050.5111
3vi0060.640.5
4vi0080.8561
Near-infrared5nr0131.382
6nr0161.612
Short-wave infrared7sw0383.832
Water vapor8wv0636.2412
9wv0696.9522
10wv0737.3442
Infrared11ir0878.5922
12ir0969.6252
13ir10510.4032
14ir11211.2122
15ir12312.3642
16ir13313.312
Table 2. Quantitative results of RMSE, PSNR, SRE, SAM, and ERGAS values for super-resolving downsampled 1 km bands. The metrics are averaged across all testing regions for the × 2 SR, evaluated at the lower scale (input resolution of 2 km, output resolution of 1 km). Arrows (↑/↓) indicate that higher/lower is better for the corresponding metric. The best results are indicated in bold.
vi004 vi005 vi008SAM↓ERGAS↓
RMSE↓ PSNR↑ SRE↑ RMSE↓ PSNR↑ SRE↑ RMSE↓ PSNR↑ SRE↑
Bicubic32.5835.3727.62 34.2335.0127.01 151.6234.3926.940.352.25
EDSR23.3938.2230.47 24.1138.0630.06 109.6137.2129.770.311.61
SwinIR26.7637.0829.33 28.1436.7228.73 126.0036.0728.630.311.85
Essaformer25.7837.3829.63 27.4136.9328.93 121.8336.2828.840.301.80
DSen27.1448.5240.77 7.5048.1740.17 49.0344.2536.810.220.59
Sen2-RDSR7.0248.6440.89 7.2048.5140.52 47.1344.6037.160.210.57
PARNet7.3748.2440.50 7.6647.9839.99 50.3944.0236.570.220.60
HFN7.1248.5540.80 7.3848.3140.31 49.1044.2536.800.220.59
CSAN (Ours)6.1749.7542.00 6.3749.5541.55 44.7745.0737.620.190.52
Table 3. Quantitative results of RMSE, PSNR, SRE, SAM, and ERGAS values for super-resolving downsampled 2 km bands. The metrics are averaged across all testing regions for the × 4 SR, evaluated at the lower scale (input resolution of 8 km, output resolution of 2 km). Arrows (↑/↓) indicate that higher/lower is better for the corresponding metric. The best results are indicated in bold.
MetricBandsBicubicEDSRSwinIREssaformerDSen2Sen2-RDSRPARNetHFNCSAN (Ours)
RMSE↓nr01343.1434.8760.4034.8128.8426.7031.1327.2825.63
nr01641.2438.7451.3738.8421.5220.8023.2021.2220.17
sw03849.3145.8562.2049.0139.2338.1839.5639.2636.95
wv0634.749.316.387.473.553.553.533.863.40
wv06919.4016.7027.2816.5513.3212.6114.5713.0012.27
wv07333.2226.0647.9926.8921.2820.0222.8520.6719.68
ir087132.20106.69192.14102.4163.9561.3869.6063.4660.15
ir09670.0558.88101.5654.7734.6032.9441.4234.2432.56
ir105148.24119.82213.20115.4272.6069.0178.9471.8068.14
ir112141.40113.82204.82109.2371.5167.9477.6971.7567.12
ir123126.49101.89184.6298.0667.6964.2073.3666.9463.45
ir13385.5468.22122.5466.3649.3946.8153.3048.7946.07
Mean74.5861.74106.2159.9940.6238.6444.0040.1037.98
PSNR↑nr01333.4735.3130.5735.3236.9737.6536.3237.4538.01
nr01627.7628.3025.8528.2833.5233.8232.8433.6334.09
sw03850.5751.2148.5250.5652.7052.9352.0752.6853.21
wv06358.8852.7156.3254.7861.2461.2660.4360.4261.60
wv06952.4853.6849.5553.7655.7156.2054.9455.9356.43
wv07347.6749.7544.5049.4851.5252.0750.9351.7952.22
ir08735.4737.3632.2237.7141.7942.2141.0641.8642.32
ir09640.5742.0637.3642.7046.7147.1546.0346.8047.24
ir10534.2336.1031.0736.4240.4440.8939.7240.5441.00
ir11234.5236.4431.3036.7940.4440.8939.7340.5441.01
ir12335.3137.2232.0337.5540.7441.2140.0540.8441.31
ir13338.5240.4835.4140.7343.3243.7942.6743.4243.90
Mean40.7941.7237.8942.0145.4345.8343.9945.4446.03
SRE↑nr01316.9018.7414.0018.7520.4021.0719.7420.8821.44
nr01620.2520.8018.3520.7826.0226.3225.3426.1326.59
sw03850.3050.9448.2550.2952.4252.6651.8052.4052.94
wv06358.5252.3555.9654.4260.8860.9060.0760.0661.24
wv06951.8153.0148.8853.1055.0455.5354.2855.2655.76
wv07346.7048.7943.5348.5150.5651.1049.9650.8351.25
ir08733.0034.8829.7435.2339.3139.7338.5839.3839.85
ir09639.1840.6735.9741.3145.3245.7644.6445.4245.85
ir10531.1032.9827.9533.2937.3237.7636.6037.4237.87
ir11231.3233.2428.1033.5937.2537.6936.5337.3437.80
ir12332.1334.0428.8534.3737.5638.0236.8737.6638.13
ir13336.0037.9632.8938.2040.7941.2740.1440.9041.38
Mean37.0738.2034.3738.4941.9142.3241.2141.9742.51
SAM ↑ 0.410.350.570.350.230.220.250.230.21
ERGAS ↓ 1.391.191.881.180.860.810.920.830.78
Table 4. No-reference quality assessment for the × 2 SR on original 1 km bands, upsampled to 0.5 km resolution. NIQE, BRISQUE, and PIQE scores are computed for each band and then averaged across all bands and regions. Lower values indicate better perceptual quality. Arrows (↓) indicate that lower is better for the corresponding metric. The best results are highlighted in bold.
MetricBicubicEDSRSwinIREssaformerDSen2Sen2-RDSRPARNetHFNCSAN (Ours)
NIQE↓5.274.394.344.763.833.863.843.873.85
BRISQUE↓32.269.7318.3223.808.598.448.318.237.99
PIQE↓24.925.119.229.553.873.863.973.923.82
Table 5. No-reference quality assessment for the × 4 SR on original 2 km bands, upsampled to 0.5 km resolution. NIQE, BRISQUE, and PIQE scores are computed for each band and then averaged across all bands and regions. Lower values indicate better perceptual quality. Arrows (↓) indicate that lower is better for the corresponding metric. The best results are highlighted in bold.
MetricBicubicEDSRSwinIREssaformerDSen2Sen2-RDSRPARNetHFNCSAN (Ours)
NIQE↓8.535.115.115.614.344.434.584.454.52
BRISQUE↓46.7827.4621.7456.7610.158.2711.919.197.93
PIQE↓58.0226.5617.1316.5913.9114.2015.8914.3413.77
Table 6. Results of the ablation study for the × 2 SR. Arrows (↑/↓) indicate that higher/lower is better for the corresponding metric. The best results are indicated in bold.
Model VariantRMSE↓PSNR↑SRE↑SAM ↓ERGAS↓
w/o-IFU20.0247.8639.930.19910.5450
w/o-CA19.6447.9140.080.20130.5614
w/o-SA19.9547.7639.850.19600.5386
CSAN19.1048.1240.400.19380.5219
Table 7. Results of the ablation study for the × 4 SR. Arrows (↑/↓) indicate that higher/lower is better for the corresponding metric. The best results are indicated in bold.
Model VariantRMSE↓PSNR↑SRE↑SAM ↓ERGAS↓
w/o-IFU38.8145.7942.260.22410.7905
w/o-CA39.2945.7042.180.23040.8099
w/o-SA39.6445.5842.070.22490.7968
CSAN37.9846.0342.510.21920.7782
Table 8. Complexity comparison of methods in terms of parameters, training, and inference time for super-resolving 1 km bands.
EDSRSwinIREssaformerDSen2Sen2-RDSRPARNetHFNCSAN (Ours)
Parameters (K)2403139421441779216283316201268
Training Time (h)9.8044.366.844.089.994.888.645.45
Inference Time (s)6.9039.179.096.0310.8 75.2011.065.21
Table 9. Complexity comparison of methods in terms of parameters, training, and inference time for super-resolving 2 km bands.
EDSRSwinIREssaformerDSen2Sen2-RDSRPARNetHFNCSAN (Ours)
Parameters (K)2414140927921803217484516651280
Training Time (h)14.0056.9517.296.9415.766.2317.798.46
Inference Time (s)6.4036.439.155.858.085.598.135.58
Disclaimer/Publisher’s Note: The statements, opinions and data contained in all publications are solely those of the individual author(s) and contributor(s) and not of MDPI and/or the editor(s). MDPI and/or the editor(s) disclaim responsibility for any injury to people or property resulting from any ideas, methods, instructions or products referred to in the content.

