Article

Shallow Structural Deformation Reveals Intraplate Seismicity Triggered by Graben Motion in the South China Littoral Fault Zone

1
Key Laboratory of Ocean and Marginal Sea Geology, South China Sea Institute of Oceanology, Chinese Academy of Sciences, Guangzhou 510301, China
2
University of Chinese Academy of Sciences, Beijing 100049, China
3
National Joint Local Engineering Research Center for Shale Gas Exploration and Development, Chongqing Institute of Geology and Mineral Resources, Chongqing 401120, China
4
Key Laboratory of Shale Gas Exploration, Ministry of Natural Resources, Chongqing Institute of Geology and Mineral Resources, Chongqing 401120, China
*
Author to whom correspondence should be addressed.
Remote Sens. 2025, 17(13), 2153; https://doi.org/10.3390/rs17132153
Submission received: 29 April 2025 / Revised: 16 June 2025 / Accepted: 17 June 2025 / Published: 23 June 2025

Abstract

High-resolution seismic reflection profiles from the offshore segment of the Littoral Fault Zone (LFZ) near Nan’ao Island were analyzed to investigate fault activity and its potential link to the 1918 M7.3 earthquake. The data reveal a ~19 km-wide graben bounded by seaward- and landward-dipping normal faults, with fault-propagation folds and growth faults reaching the seafloor. Forward modeling of the fault-propagation fold indicates three discrete episodes of normal dip-slip displacement (~20 m per phase), separated by prolonged quiescent periods, suggesting episodic fault activity and seismic-scale strain accumulation. Despite the regional NW–SE compressional stress regime, active normal faulting is observed, implying vertical stress as the dominant driving force. A gravitational seismic model driven by upper crustal loading is proposed to explain both the fault motion and the down-draw tsunami observed during the 1918 event. These findings offer new insights into intraplate seismogenic mechanisms and associated hazards along the South China coast.

1. Introduction

Dozens of destructive earthquakes with magnitudes exceeding 6.0 have been recorded in the coastal region of South China since the 16th century [1]. Among these, the 1604 offshore Quanzhou earthquake (M7.5) stands out as the largest historical seismic event ever recorded along the southeastern coast of China, noted for its extraordinary intensity and widespread impact. Other major events include the 1878 offshore Dongshan earthquake (M6.5), the 1906 offshore Kinmen earthquake (M6.5), and two significant events near Nan’ao Island in 1600 (M7.0) and 1918 (M7.3) (Figure 1). The 1918 event remains one of the most devastating earthquakes in the recorded history of Guangdong Province [1] and generated the only documented tsunami in the northern South China Sea during the 20th century [2]. Collectively, these earthquakes delineate a belt of concentrated large-magnitude earthquakes along the southeastern margin of the South China Block. This seismicity has been widely attributed to a lithospheric-scale fault zone known as the Littoral Fault Zone (LFZ) [3]. Given the dynamics of active faults controlling seismicity, it is crucial to investigate the activity of the LFZ to understand regional seismogenic processes and to inform disaster mitigation strategies.
Figure 1. (a) Regional tectonic map showing the position of the study area between the South China Block and the Philippine Sea Plate. Arrows show plate motion vectors: the blue arrow indicates the Philippine Sea Plate (~82 mm yr−1 toward N306°W [4]); the cyan arrow represents the South China Block (~12 mm yr−1 toward S66°E [5]). (b) Seismotectonic map of the Nan’ao offshore and adjacent areas. Red stars indicate historical earthquake epicenters [6,7]. The Littoral Fault is marked by the red dash–dot line [8]. The Yizhu Fault is a solid red line [9]; focal mechanism solutions are from the Global CMT (www.globalcmt.org, accessed on 3 December 2023).
Remotesensing 17 02153 g001
The LFZ was first defined by Liu [8], who systematically delineated its spatial distribution and tectonic attributes. Extending approximately 1500 km along China’s southeastern coast, the LFZ serves as a primary boundary fault between the stable South China continental block and the thinned continental crust of the northern South China Sea. Over the past few decades, research on the LFZ has steadily advanced, resulting in a substantially improved understanding of its spatial distribution, tectonic attributes, fault geometry, and deep crustal structure [6,7,10,11,12,13,14,15,16,17]. Based on these findings, several hypotheses have been proposed concerning the seismogenic structures and earthquake-generating mechanisms associated with the LFZ. One hypothesis suggests that the intersection of the LFZ with multiple NW-trending faults may lead to localized stress accumulation, potentially triggering seismic activity [6]. Another emphasizes deep tectonic control, proposing that the coupling between the LFZ and intracrustal low-velocity layers could result in strain accumulation and earthquake initiation [12]. Despite this progress, the current understanding of the LFZ’s seismic mechanism remains uncertain. Specifically, research on deep structural activity is still predominantly qualitative, limited by observational resolution and technical capabilities, and lacks effective validation methods. Furthermore, geophysical features such as gravity, magnetic anomalies, or crustal thinning along the LFZ primarily reflect long-term tectonic evolution. They are not reliable indicators of present-day activity. More critically, no definitive structural deformation evidence has yet been identified that directly links the LFZ to historical earthquakes, hindering seismic hazard assessments and further mechanistic studies.
The presence of seawater hinders the direct observation of surface deformation associated with seismic activity along the LFZ. However, compared with terrestrial paleoseismological studies, the underwater environment offers distinct advantages for reconstructing paleo-earthquake records [18]. First, the continuity of submarine sedimentary layers in space and time enables robust stratigraphic correlation across broader spatial scales, allowing for the preservation of complete earthquake event sequences and providing critical data for understanding the long-term recurrence patterns of seismic activity [19,20,21,22,23]. Second, submarine sedimentary systems generally exhibit higher sensitivity and finer temporal resolution (on interannual to seasonal scales) in response to seismic and tsunami events compared to terrestrial settings [24,25,26,27]. Furthermore, human activities minimally disturb underwater regions, thus preserving the original sedimentary structures and deformation features more effectively. Lastly, modern marine geophysical technologies provide efficient, high-resolution submarine structure imaging, with spatial coverage far surpassing traditional onshore trenching methods and sub-meter-resolution imaging capabilities. These sedimentary advantages of the underwater environment effectively mitigate challenges commonly encountered in onshore paleoseismological research, such as stratigraphic discontinuities, anthropogenic disturbances, and incomplete historical records. Therefore, investigating near-surface deformation in areas affected by large earthquakes presents a promising approach for advancing the study of seismic activity along the LFZ.
Very low-magnitude earthquakes adjacent to Nan’ao Island are densely clustered (Figure 2), which provide important constraints on the geometry of deep-seated faults [28,29]. These microearthquakes can often be correlated with deformation features in the shallow basement and the overlying sedimentary cover. To capture these relationships, we acquired high-resolution multichannel seismic profiles of the near-surface sedimentary layers using a marine streamer system along survey lines consistent with previous airgun-based seismic studies [14]. We aim to refine our understanding of the fault geometry and kinematic evolution of this region through a detailed structural interpretation of these shallow seismic data, integrated with existing studies on the deeper crustal structure of the area. Specifically, our study seeks to (1) characterize the present-day structural features and their controlling kinematic processes; (2) provide new constraints on deep fault dynamics through quantitative analyses of shallow deformation; and (3) explore potential links among active faulting, historical large earthquakes, and tsunami generation in the region.
Figure 2. (a) Location map of survey lines in the study area. The base map is generated using the GMT earth_relief_01s global topography dataset [30]. Small circles denote seismic events from 2018 to 2023, sourced from the Fujian Earthquake Agency. (b) Three-dimensional visualization of seismic events within the black-box area in (a), illustrating spatial clustering near the LFZ.
Remotesensing 17 02153 g002

2. Geological Background

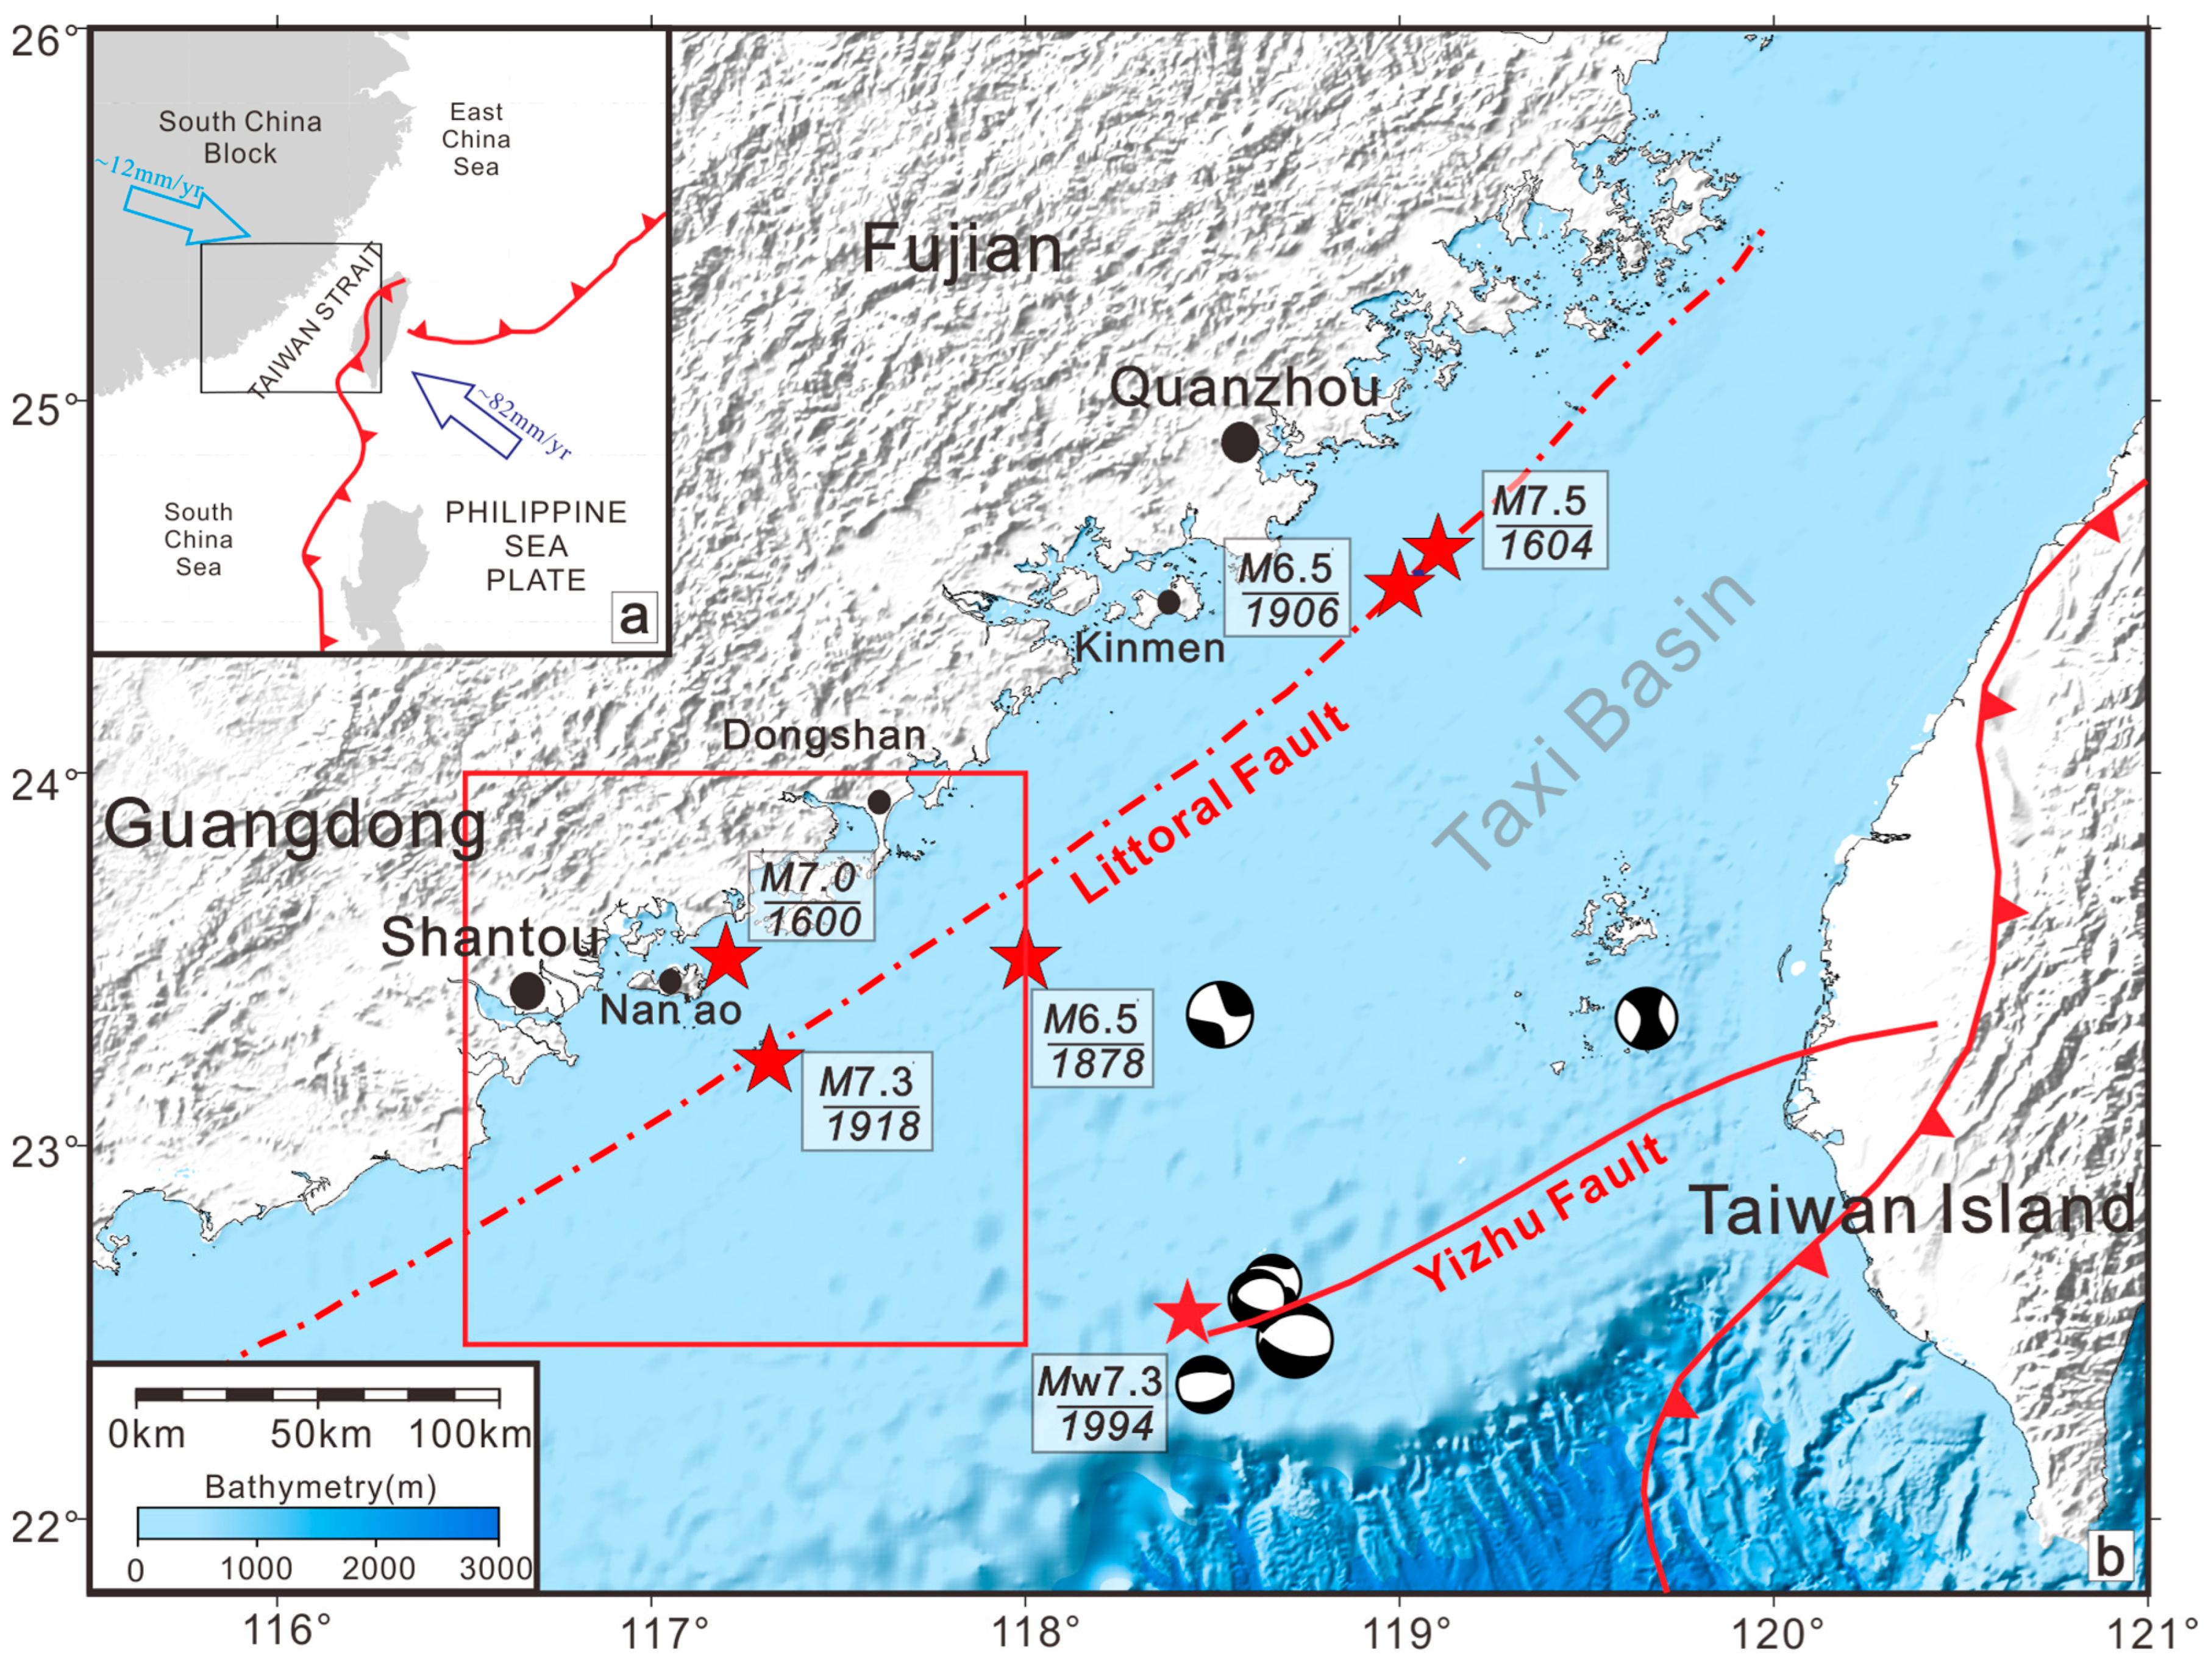
2.1. Regional Tectonic Evolution of the Southeastern South China Margin

The coastal regions of Fujian and eastern Guangdong are located on the southeastern margin of the Eurasian Plate, influenced by the combined effects of the Indian Ocean Plate and the Philippine Sea Plate. Throughout geological history, the region has been affected by multiple overlapping tectonic regimes [31,32,33], with temporal overlaps among the different mechanisms [34].
During the Early to Middle Mesozoic, intracontinental orogenic processes induced a strong compressional regime in the South China coastal area, resulting in mantle upwelling at the continental margin, crustal uplift and denudation, and the widespread exposure of Late Yanshanian granites along the Fujian coast.
In the Late Mesozoic, the subduction and eastward rollback of the Paleo-Pacific Plate caused significant lithospheric extension and thinning in South China, accompanied by extensive intermediate-acidic to intermediate-basic magmatism, forming an NE–SW trending magmatic belt over 1000 km long [32,35,36]. The widespread bimodal volcanic–plutonic associations, alkaline granites, and mafic dikes exposed in the region further support the extensional tectonic setting of the Late Cretaceous [37,38,39].
With ongoing crustal extension, NE–SW trending fault systems became increasingly active, forming a series of east-dipping, half-graben-style faulted basins that constitute the early stage of the Taixi Basin [40]. However, some researchers suggest that these Meso–Cenozoic half-graben basins may have formed under localized compressional conditions in specific tectonic settings [41].
Since the Neogene, the continuous collision and subduction of the Philippine Sea Plate beneath the southeastern Eurasian margin have subjected the Fujian–Taiwan region to a dominant NW–SE compressional stress regime. The South China Sea ceased spreading in the Miocene, and around 6.5 Ma (Late Miocene), arc–continent collision triggered the initial uplift of Taiwan Island, while areas west of the Central Range evolved into foreland basins [42,43].
From the Miocene to the Early Pleistocene, and possibly extending into the Late Pleistocene, a series of basaltic eruptions occurred along NE-trending littoral faults, forming scattered NE-aligned volcanic landforms. Since the Holocene, repeated marine transgressions and regressions have occurred along the South China coast, with an overall shoreline transgression trend. The development of multiple marine terraces indicates intermittent crustal uplift in the region [44,45].
Under this multi-stage, multi-mechanism tectonic evolution, magmatism, fault development, and crustal deformation have interacted closely. The distribution of igneous rocks, active fault zones, and natural seismicity in the study area exhibits strong spatial correlations [14].
During LFZ investigations, localized mid-crustal structures were identified. Relevant studies suggest that the development of active faults and the occurrence of earthquakes are closely related to the presence of ductile layers in the mid-crust. The mechanical properties and deformation behavior of these ductile layers may influence the propagation mode of faults and the nucleation process of earthquakes.

2.2. The Littoral Fault Zone (LFZ)

The LFZ is currently defined as a tectonic belt with a width of several tens of kilometers [16]. This broad extent poses considerable challenges for accurately delineating its position and conducting detailed investigations. In addition, the complex tectonic evolution of the region further increases the uncertainty in understanding the fault zone’s structural characteristics and activity patterns. Two distinct generations of normal faulting have been identified within the LFZ. The older generation of faults was intensely active during the rifting phase of the basin evolution, with average fault displacements reaching ~0.5 km and local offsets approaching 2 km [16,42]. The younger generation of normal faults displays relatively small displacements that are generally less than 100 m [42]. Notably, the extensional centers of the two faulting phases within the Taiwan Strait do not spatially coincide [43,46], which may be a key factor contributing to the ongoing uncertainty regarding the precise location of the LFZ. The fault segment investigated in this study closely aligns with the LFZ delineation proposed by Liu [8] (Figure 1), predominantly distributed along the 30–50 m isobath. This area corresponds to a distinct submarine linear scarp, which may indicate recent tectonic activity along the LFZ.

3. Data and Methods

3.1. Seismic Reflection Data Acquisition

In July 2016, the South China Sea Institute of Oceanology (SCSIO)—Chinese Academy of Sciences (CAS) acquired deep-penetrating seismic reflection profiles reaching the basement of the study area using airgun sources. A subsequent survey was conducted in May 2019 in the same region, during which high-resolution multichannel seismic reflection data were collected using electric spark sources with small channel spacings. This dataset forms the primary basis of the present study and consists of four NW–SE-oriented profiles (N6, N7, N8, and N9; Figure 2), totaling 108 km.
The survey employed the Geo-Spark 2000X sparker source and digital acquisition systems manufactured by Geo Marine Survey Systems (Rotterdam, The Netherlands). The acquisition setup included Geo-Sense multichannel streamers with two Multi-Trace 24 acquisition modules and the Multi-Trace Server software (rev. 1.5). A fully digital towed cable, approximately 150 m long, was deployed from the stern during data collection.
The integrated navigation and positioning system consisted of Hypack 2013 (Coastal Oceanographics Inc., Middletown, CT, USA) navigation software and a Trimble SP351 (Trimble Inc., Sunnyvale, CA, USA) DGPS receiver, providing positioning accuracy better than 5 m. Seismic source triggering was managed via Hypack. Detailed acquisition parameters are listed in Table 1. As the Society of Exploration Geophysicists specified, all seismic data were recorded in the standard SEG-Y format. Within the 0–450 ms depth range, the electric spark source data had a dominant frequency of 332 Hz and a minimum vertical resolution of 1.2 m.

3.2. Seismic Data Processing

The data were processed using RadExpro 2017 (DECO Geophysical Ltd., Moscow, Russia) to obtain high signal-to-noise-ratio seismic profile data. The process and methods of data processing mainly include defining the observation system, static correction, noise attenuation, amplitude compensation, deconvolution, velocity analysis, multiple wave attenuation, pre-stack time migration, post-stack enhancement, filter, and gain.

3.3. High-Precision Earthquake Location

This study utilized the complete earthquake catalogue published by the Fujian Earthquake Agency from 2018 to 2023 (https://www.fjdzj.gov.cn/ca/2017011419000185.htm, accessed on 1 January 2024), with detailed event parameters provided in Supplementary Table S1. No spatial, temporal, or magnitude-based filtering was applied to the data. The selection of this time window reflects a significant enhancement in the region’s seismic monitoring capabilities. In 2018, Fujian completed the construction of an integrated “four-network” real-time system that combines seismic waveform, strong motion, intensity, and GNSS observations. This upgrade reduced station spacing to approximately 30 km (locally, approximately 10 km), lowered the detection threshold to ML < 1.0, and shortened data transmission latency to about 1 s, thereby significantly improving both the completeness and location accuracy of recorded seismic events.
To evaluate the spatial precision of the catalogue, a subset of events was compared with relocated hypocenters obtained by Xia et al. [47] using the double-difference relocation method (HypoDD, version 1.3), applied to data from a dense temporary array. HypoDD is a Fortran-based software package designed for earthquake relocation using the double-difference algorithm developed by Waldhauser and Ellsworth [48]. By applying a local velocity model, the program enables precise earthquake relocation. The most accurate results can then be compared to investigate the seismotectonic implications across different active tectonic settings [49]. The comparison revealed strong spatial consistency, with average horizontal deviations of less than 1 km. This supports the reliability of post-2018 events for characterizing local seismicity and for providing geometric constraints on fault structures. Additionally, the Fujian seismic monitoring network now operates in real-time with monthly data updates, ensuring the continuous availability of high-quality seismic information for future validation and refinement efforts.
The epicentral distribution of events from 2018 to 2023 was visualized and evaluated in relation to previously inferred fault traces in the offshore section of the LFZ. A prominent NE-trending cluster of events aligns closely in both orientation and location with the fault trace delineated by Liu [8] (Figure 2), which was inferred based on integrated gravity and magnetic anomaly patterns together with a pronounced bathymetric break identified in satellite imagery. This spatial correspondence provides a robust reference for constraining the surface position and strike of the fault system in subsequent structural analysis.

3.4. Geological and Stratigraphic Interpretation

This study defines seven stratigraphic units, T1–T7, to illustrate and quantify the geometric morphology of faults and folds. Through the precise measurement of vertical distances on seismic profiles, we present them as individual vertical throw distribution plots (T-Z plots) for the quantitative analysis of fault activity [50,51,52]. To illustrate the geometric evolution of extensional fault-related folds, a series of reference profiles and models are shown in Figure 3.
Figure 3a shows a seismic profile from the offshore segment of the LFZ near Quanzhou (location shown in Figure 1), imaging a basement fault and its upward extension. Figure 3b presents high-resolution sparker data acquired at the same location using the methodology employed in this study, revealing additional folding features within the overlying sedimentary layers. These folds closely resemble the experimentally modeled extensional fault-propagation structures shown in Figure 3c. This structural similarity suggests that the LFZ may exhibit characteristics of fault-propagation folding in its deformation style.
As the fault propagates upward, the pre-existing ductile layer (such as the sedimentary layer) responds in the form of monoclines to the activity of deep basement faults [53,54,55]; the triangular shear model (Figure 3d) can be used to explain the geometric features and kinematic processes of fault-propagation folds [53,56,57]. This model uses the P/S ratio and the apex angle of the triangular shear zone to determine the geometry of normal fault-propagation folds; the P/S ratio represents the ratio between fault-propagation displacement and fault-slip displacement, and the apex angle governs the width of the fold structure [53,57,58,59]. In this model, the defined amplitude of monoclines corresponds directly to the vertical throw of basement fault activity (Figure 3d).
Based on this principle, we measured the amplitude of monoclines and constructed amplitude–depth distribution maps (A-Z plots) to quantify the activity of faults and related folds. Additionally, we quantify the amplitude of compression folds within the triangular shearing zone to illustrate the degree of compression deformation, also expressed as A-Z plots. Furthermore, we employ the balanced cross-section method to restore the position and morphology of sedimentary strata before undergoing compression deformation, thus facilitating a better understanding of the kinematic processes of adjacent strata near faults. The corresponding Python implementation is provided in Supplementary Code S1.
Engineering borehole data from this area indicate that the sedimentary layer overlying the basement is predominantly unconsolidated, with relatively low and stable acoustic velocity. Based on this lithological interpretation, average acoustic velocities of 1800 m/s for the sedimentary layer and 1500 m/s for the water column were adopted for time–depth conversion of the seismic reflection data.
Figure 3. (a) GI-gun source seismic reflection profile imaging of LFZ in the Quanzhou offshore section [60]. (b) Sparker source seismic reflection profile imaging of LFZ in the Quanzhou offshore section [60], in which high-resolution data reveal further folding deformation phenomena. (c) Clay deformation above the concealed basement faults, modified from Withjack et al. [54]. (d) Schematic diagram of the basic elements of the triangular shear model used to illustrate normal fault-propagation folds, modified from Nabavi and Fossen [61].
Remotesensing 17 02153 g003

4. Results

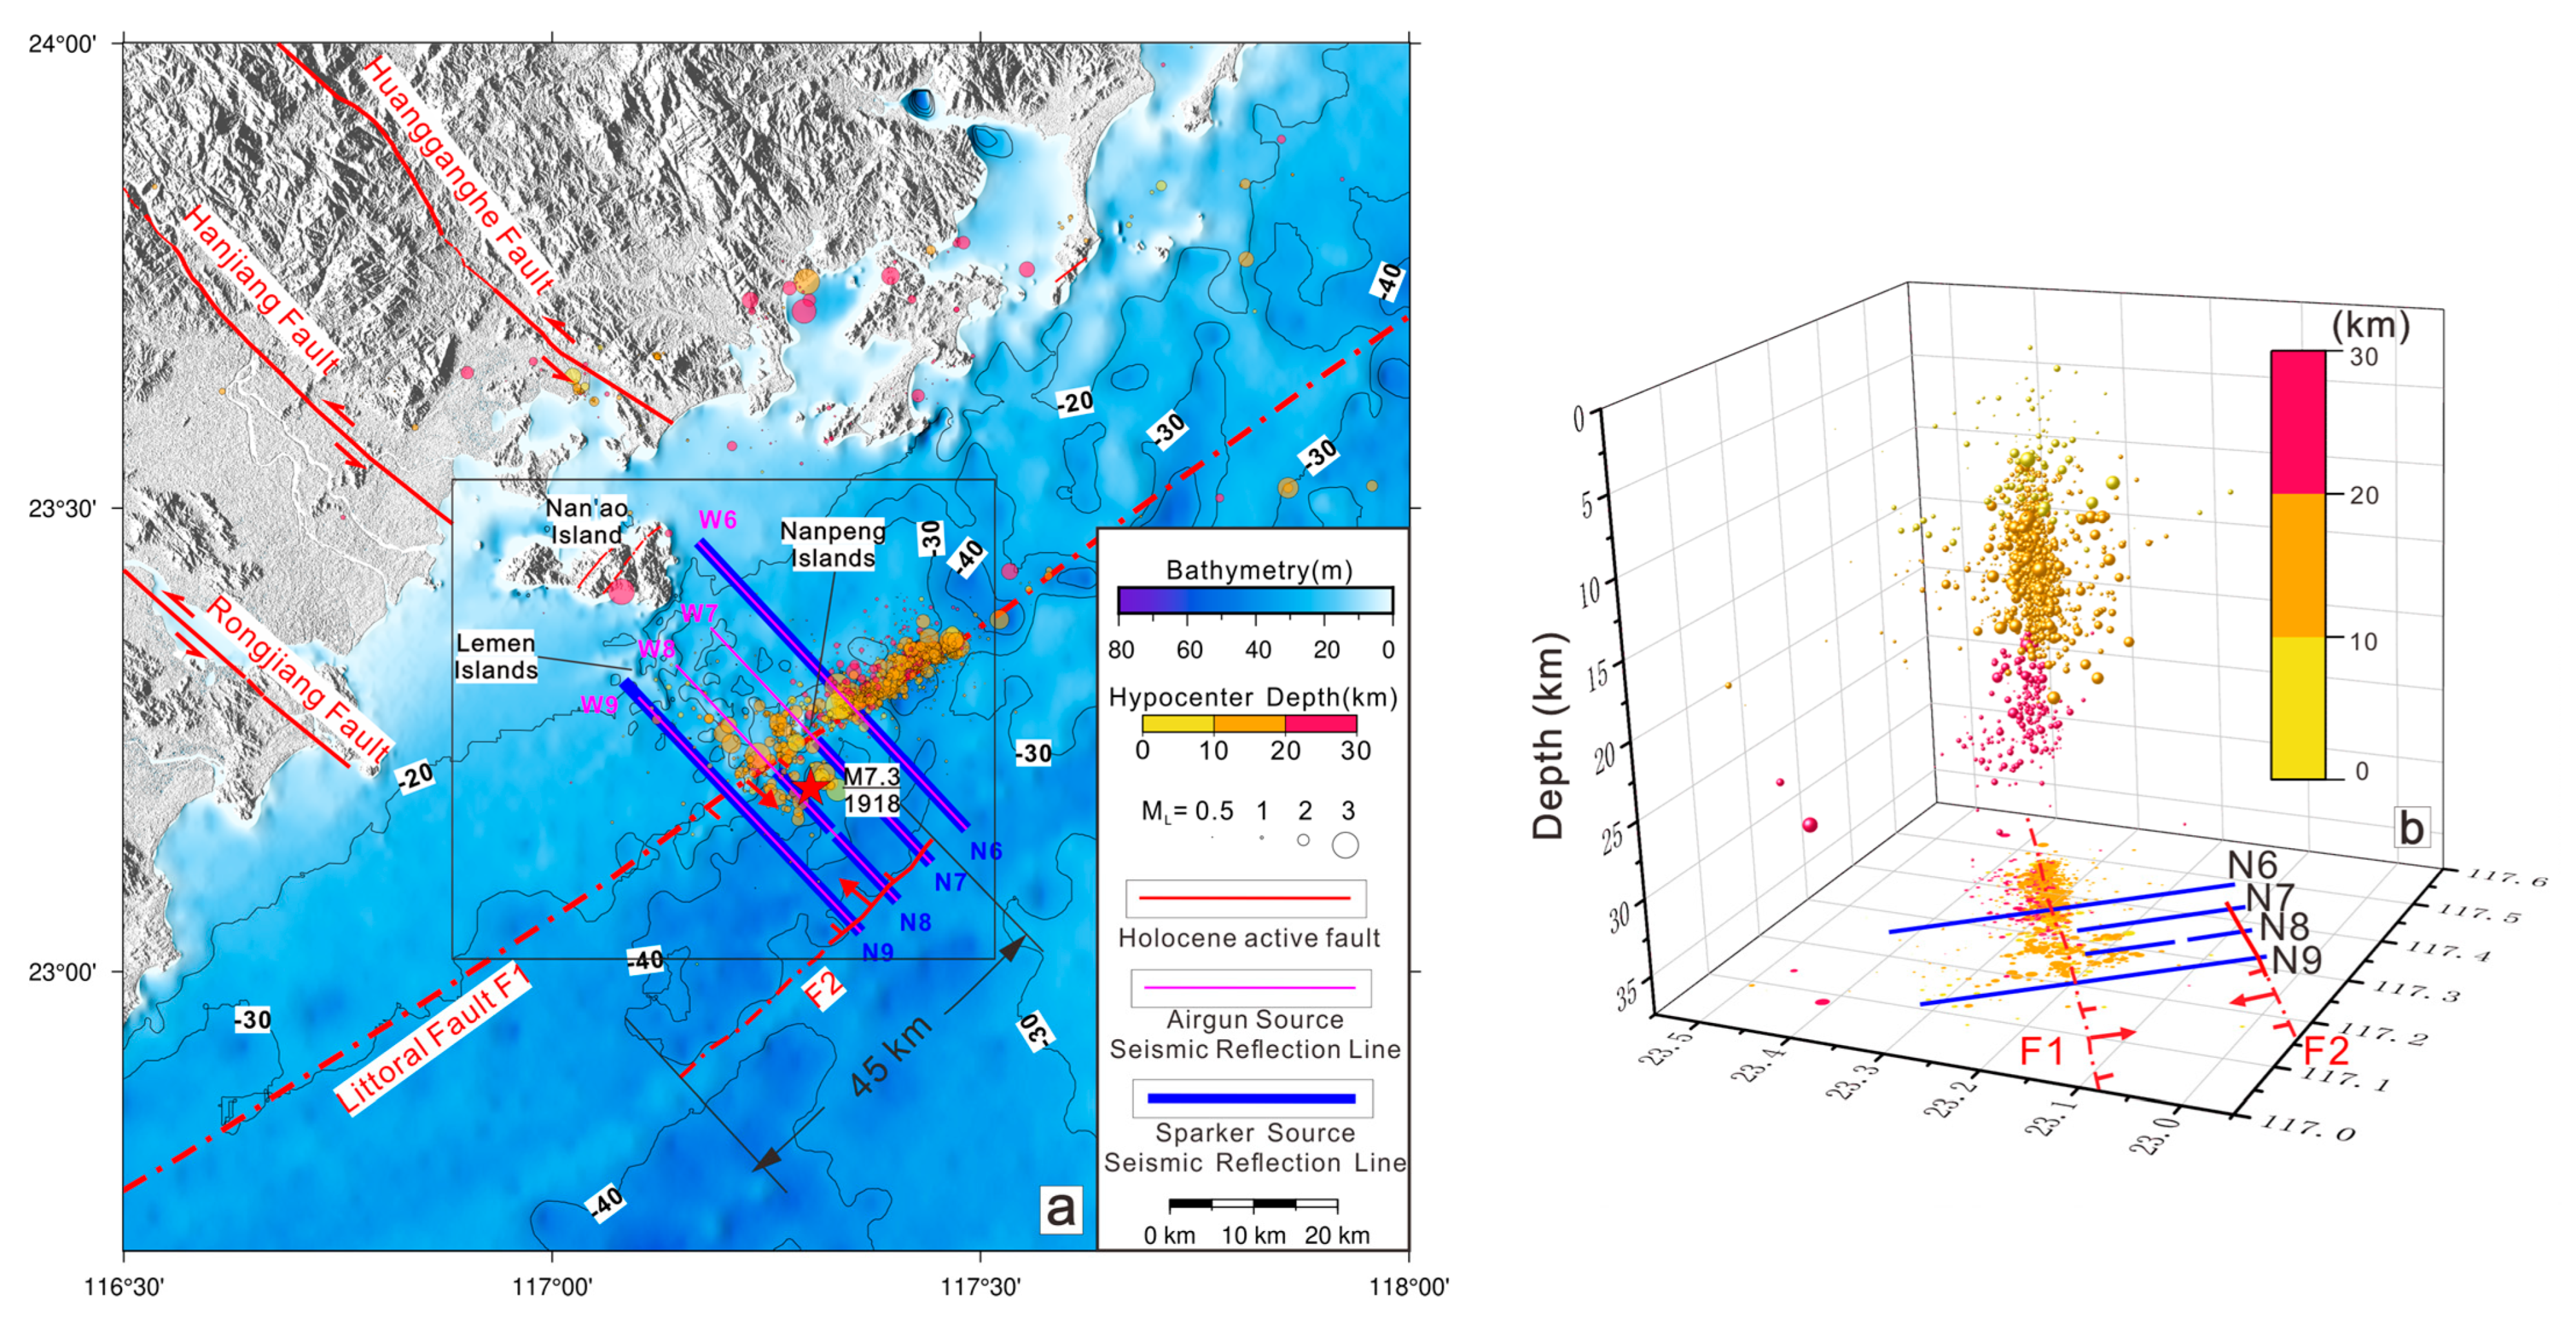
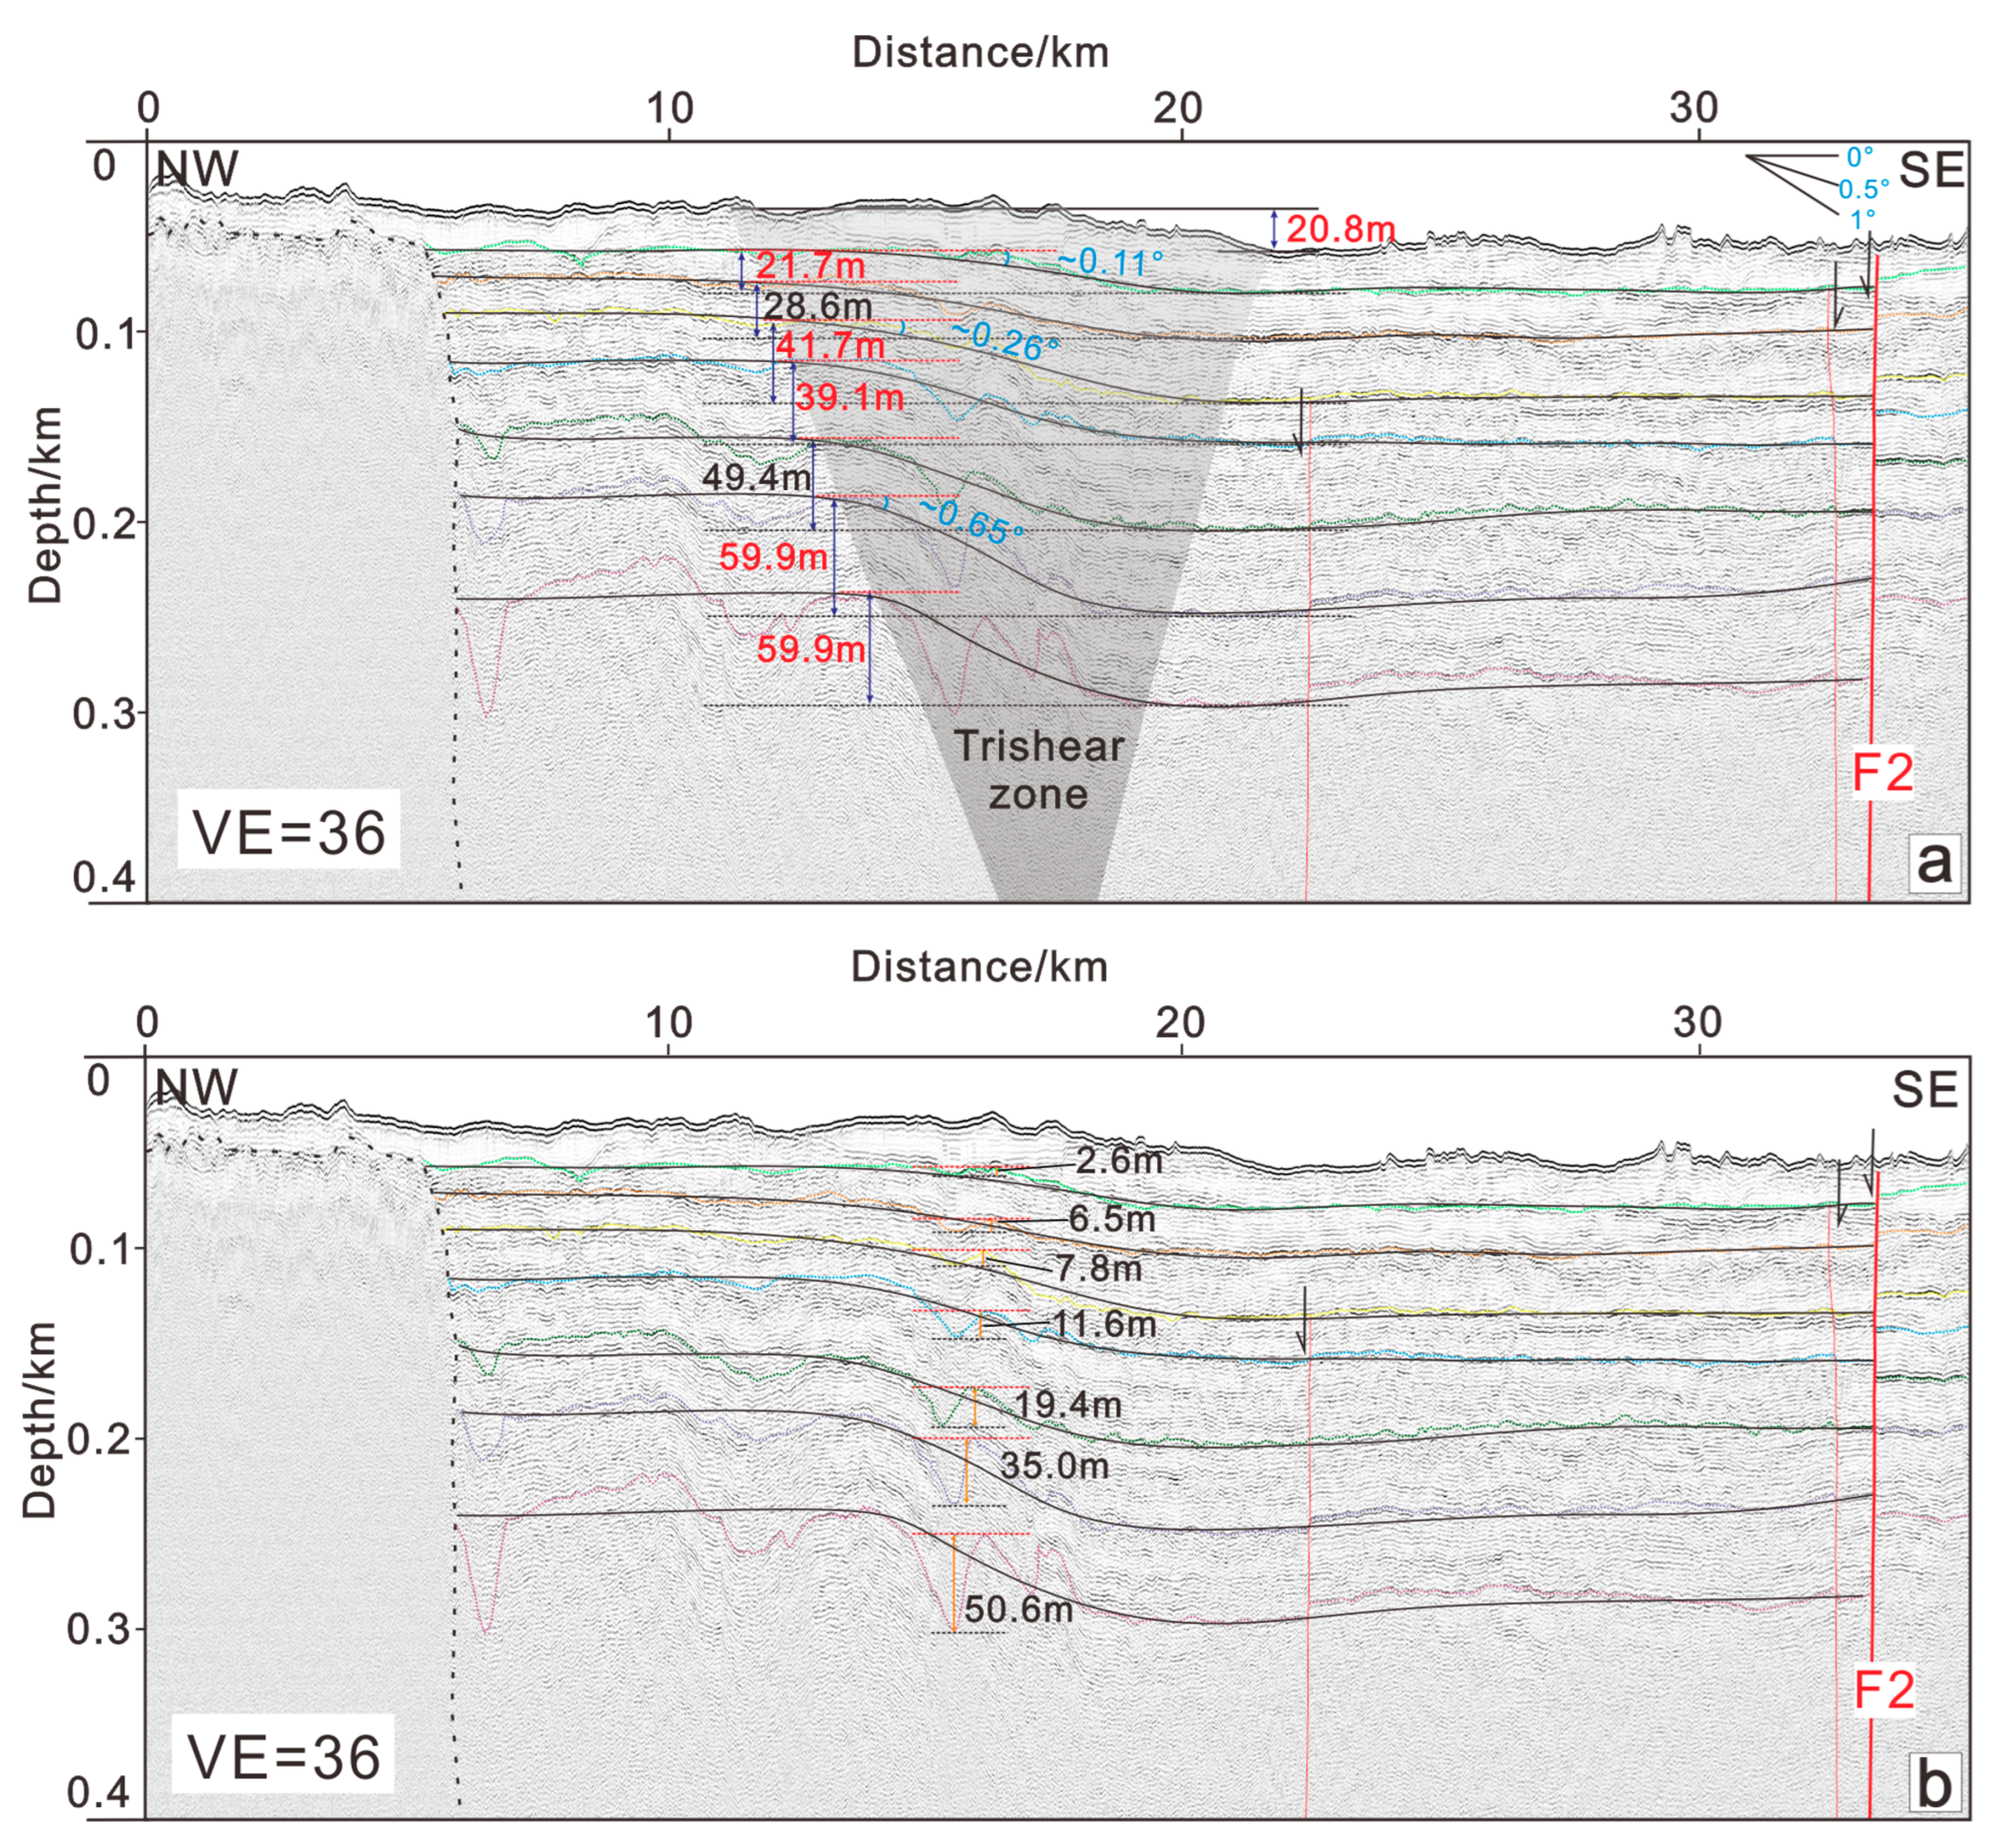
4.1. Structural Characteristics of the Nan’ao Offshore Graben

This study primarily investigates the dislocation and deformation properties of the sedimentary layers and their interactions with the underlying basement structures. The offshore area of Nan’ao can be divided into two regions based on geological composition: the northwest region is underlain by a Paleoproterozoic crystalline basement, while the southeast region is characterized by a Mesozoic basement [62]. These findings suggest that subsequent magmatic intrusions may have influenced tectonic activity in the southeastern study area. The southeastern basement is relatively shallow, and in some places, it even outcrops at the seafloor. However, the effective imaging of tectonic structures in this region is significantly hindered by the weak seismic reflection characteristics of igneous rocks. Among all the collected seismic profiles, only the N9 profile preserves a discernible sedimentary layer at the location of the Littoral Fault (Figure 4a), providing valuable information for analyzing shallow fault activity.
Two separate basement faults, designated as F1 and F2, are identified in the W9 profile (Figure 4b). At the tip of fault F1, the sedimentary layer in sparker profile N9 exhibits signs of recent activity. A feature of extensional fault-propagation folds, an upward-expanding deformation zone is observed at the top end of fault F1, where internal strata progressively form broad monoclinal folds (Figure 4a). This deformation represents the most recent activity of fault F1, manifested as a fault-controlled topographic terrace that is approximately 10 km wide on the seafloor (Figure 4a). Moreover, fault F1 is located in the same place as seismic cluster zones and the previously established position of the Littoral Fault (Figure 2). This allows us to confirm that fault F1 is indeed the previously identified Littoral Fault. On the other hand, fault F2 (Figure 4b) extends from the basement upward into the overlying sedimentary layers (Figure 4a), cutting through to the shallow strata and exhibiting the characteristics of an active growth fault. Although both F1 and F2 are basement-involved normal faults, the distinct shallow deformation styles observed—progressive monocline folding above F1 versus persistent faulting along F2—reflect differences in their underlying kinematic behaviours.

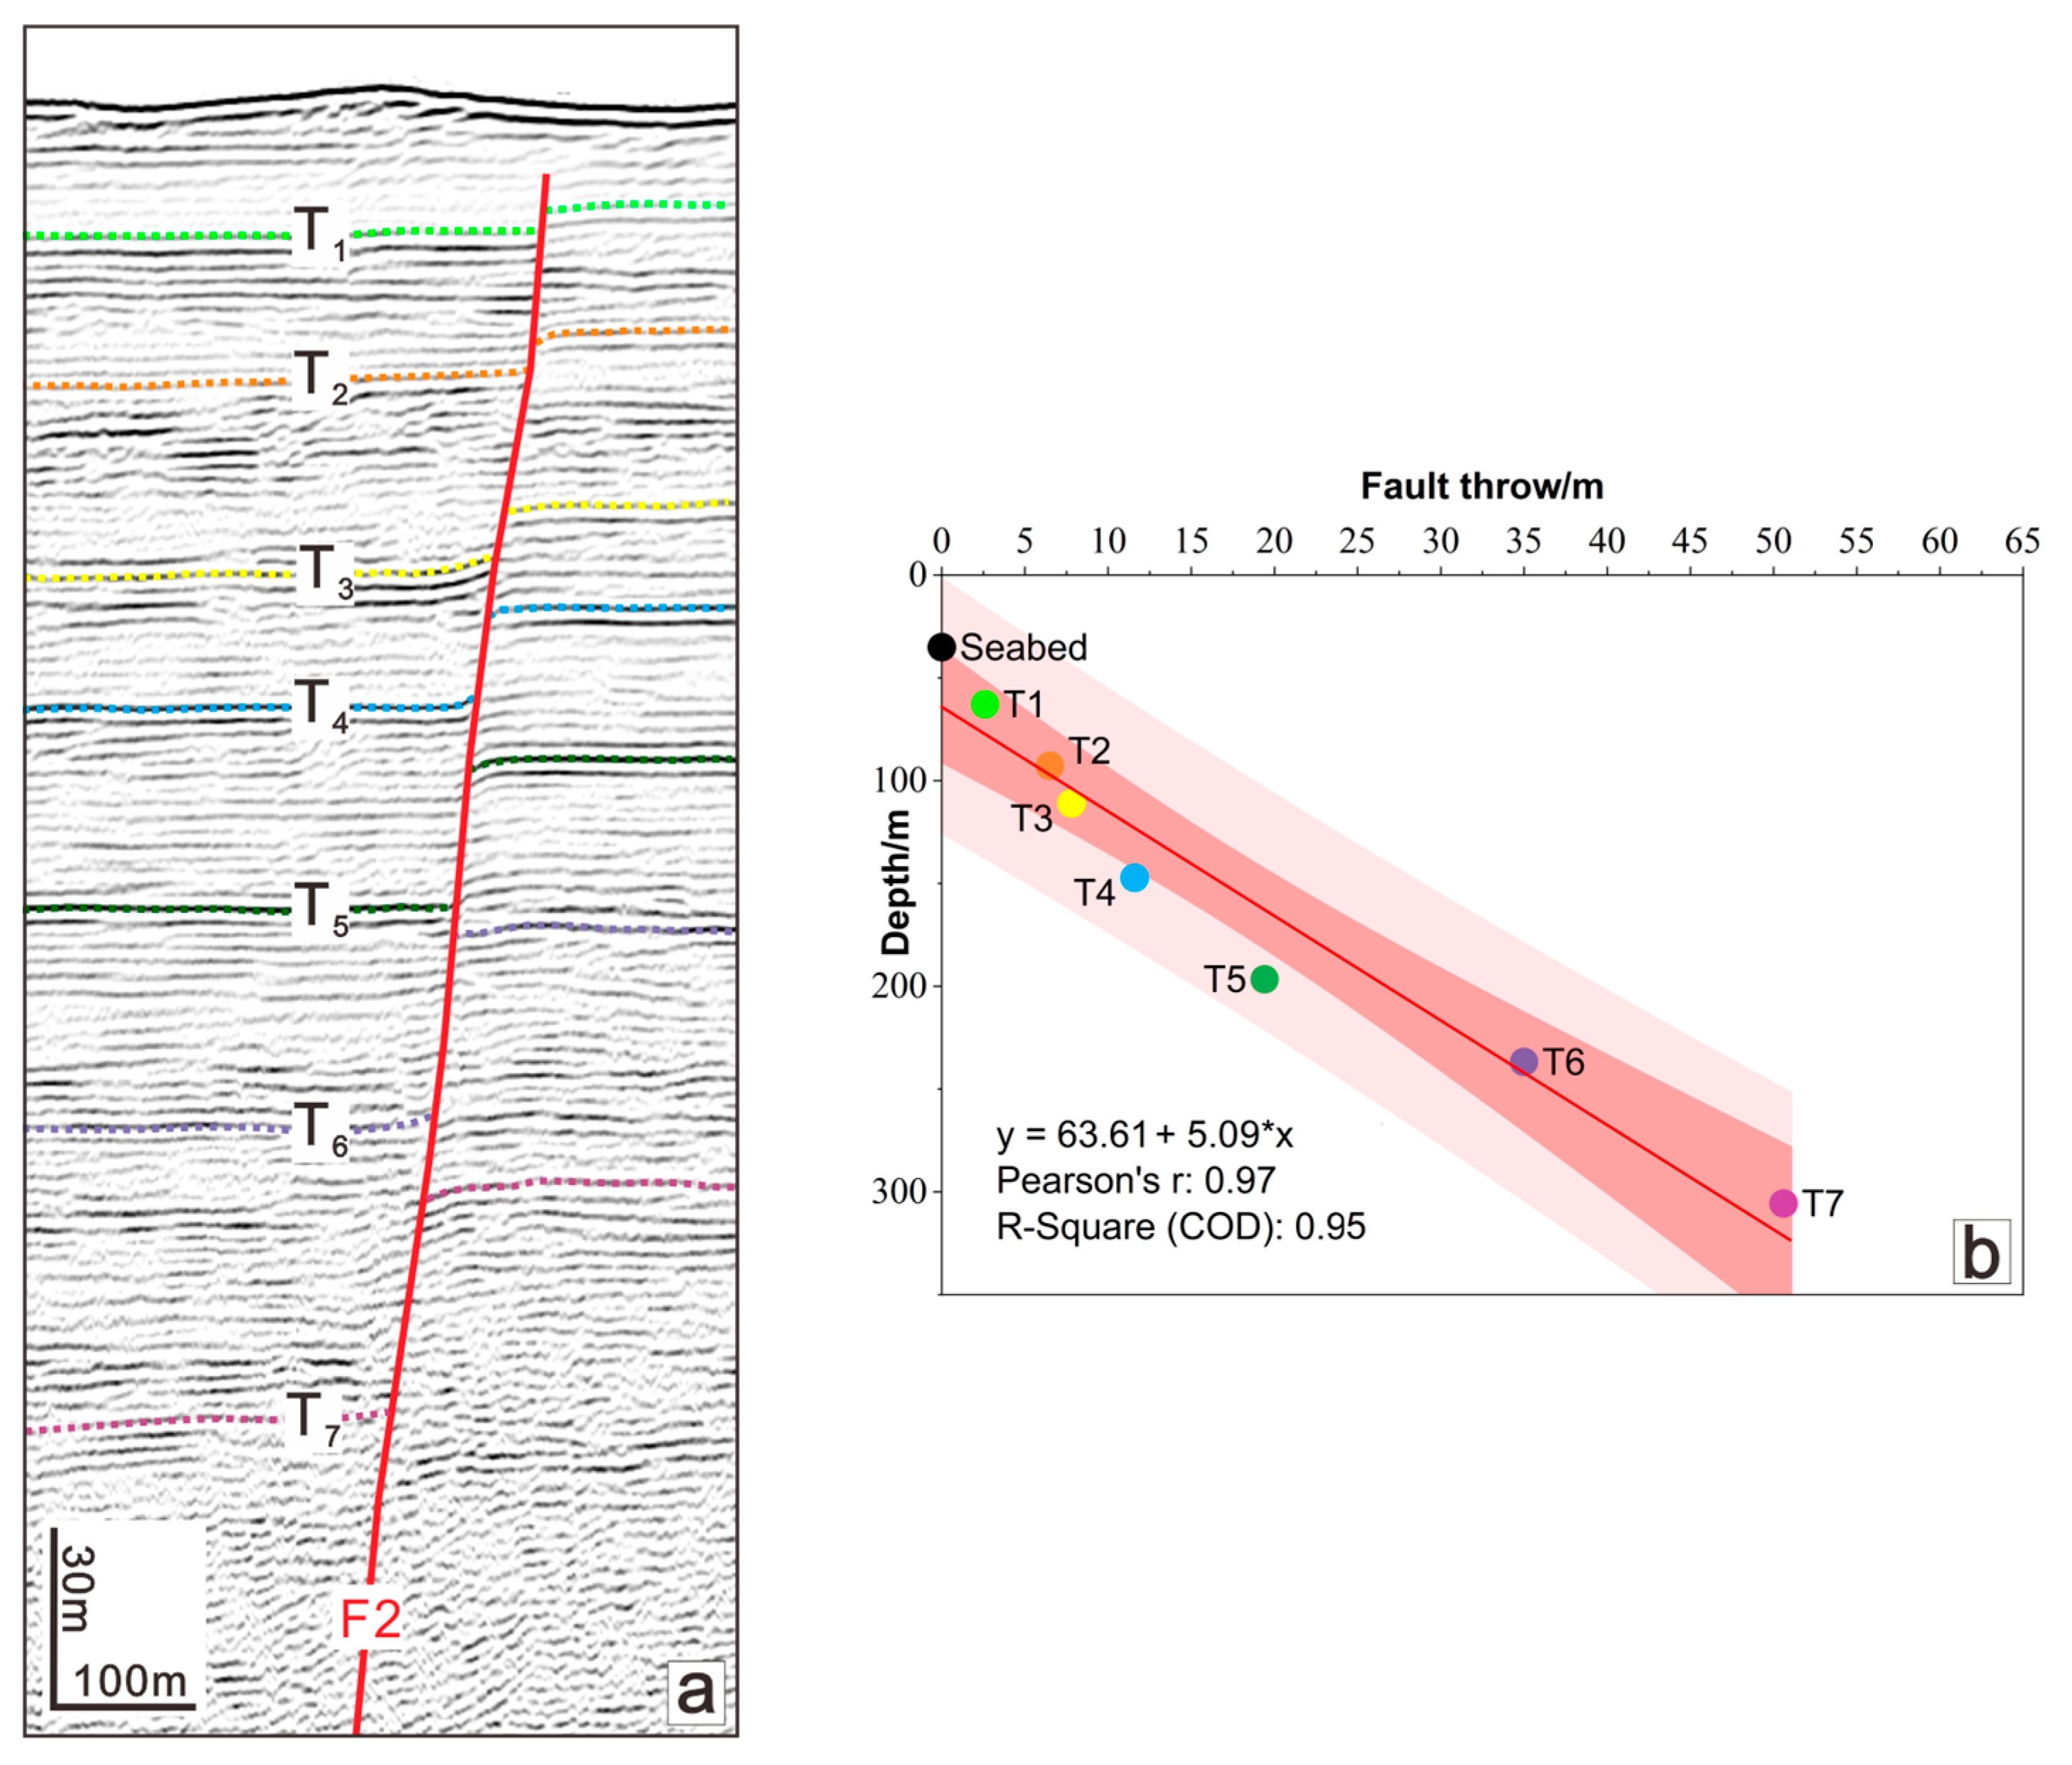
4.2. Kinematic Analysis of Faults and Folds

We performed a statistical analysis to assess the kinematic behavior of faults and folds by examining the relationship between fault throw or fold amplitude and depth. The structures analyzed include the monoclines at the tip of fault F1 (Figure 4a and Figure 5a), the compressional folds within the trishear zone above fault F1 (Figure 4a and Figure 5b), and the antithetic fault F2 located in the hanging wall of fault F1 (Figure 4a). The strata within the trishear zone experience both compressional and extensional stresses. To minimize the influence of compression on the measurement of fold amplitudes, the deformed layers were restored before measurement (Figure 5).
The amplitude and depth of the monoclines and compressional folds were measured, and their relationships were statistically analyzed (Figure 6). Similarly, the throw and depth of the antithetic fault F2 were measured and analyzed (Figure 7b).
Using a structural framework, we further described the spatial relationships among active structures in the study area. Faults F1 and F2 define a substantial graben wedge up to 19 km wide (Figure 4b). A basement-involved anticline is present between the two faults (Figure 4a). A slightly active anticline is also observed in the overlying sedimentary layers above the basement anticline (Figure 4a). In addition, the footwall of fault F1 displays an increase in compressional folding from the shallow sediments to the basement (Figure 4a).
Several key deformation patterns were identified:
  • The monoclines, compressional folds, and antithetic fault F2 all exhibit relatively continuous activity over time, maintaining stable deformation rates (Figure 6 and Figure 7b).
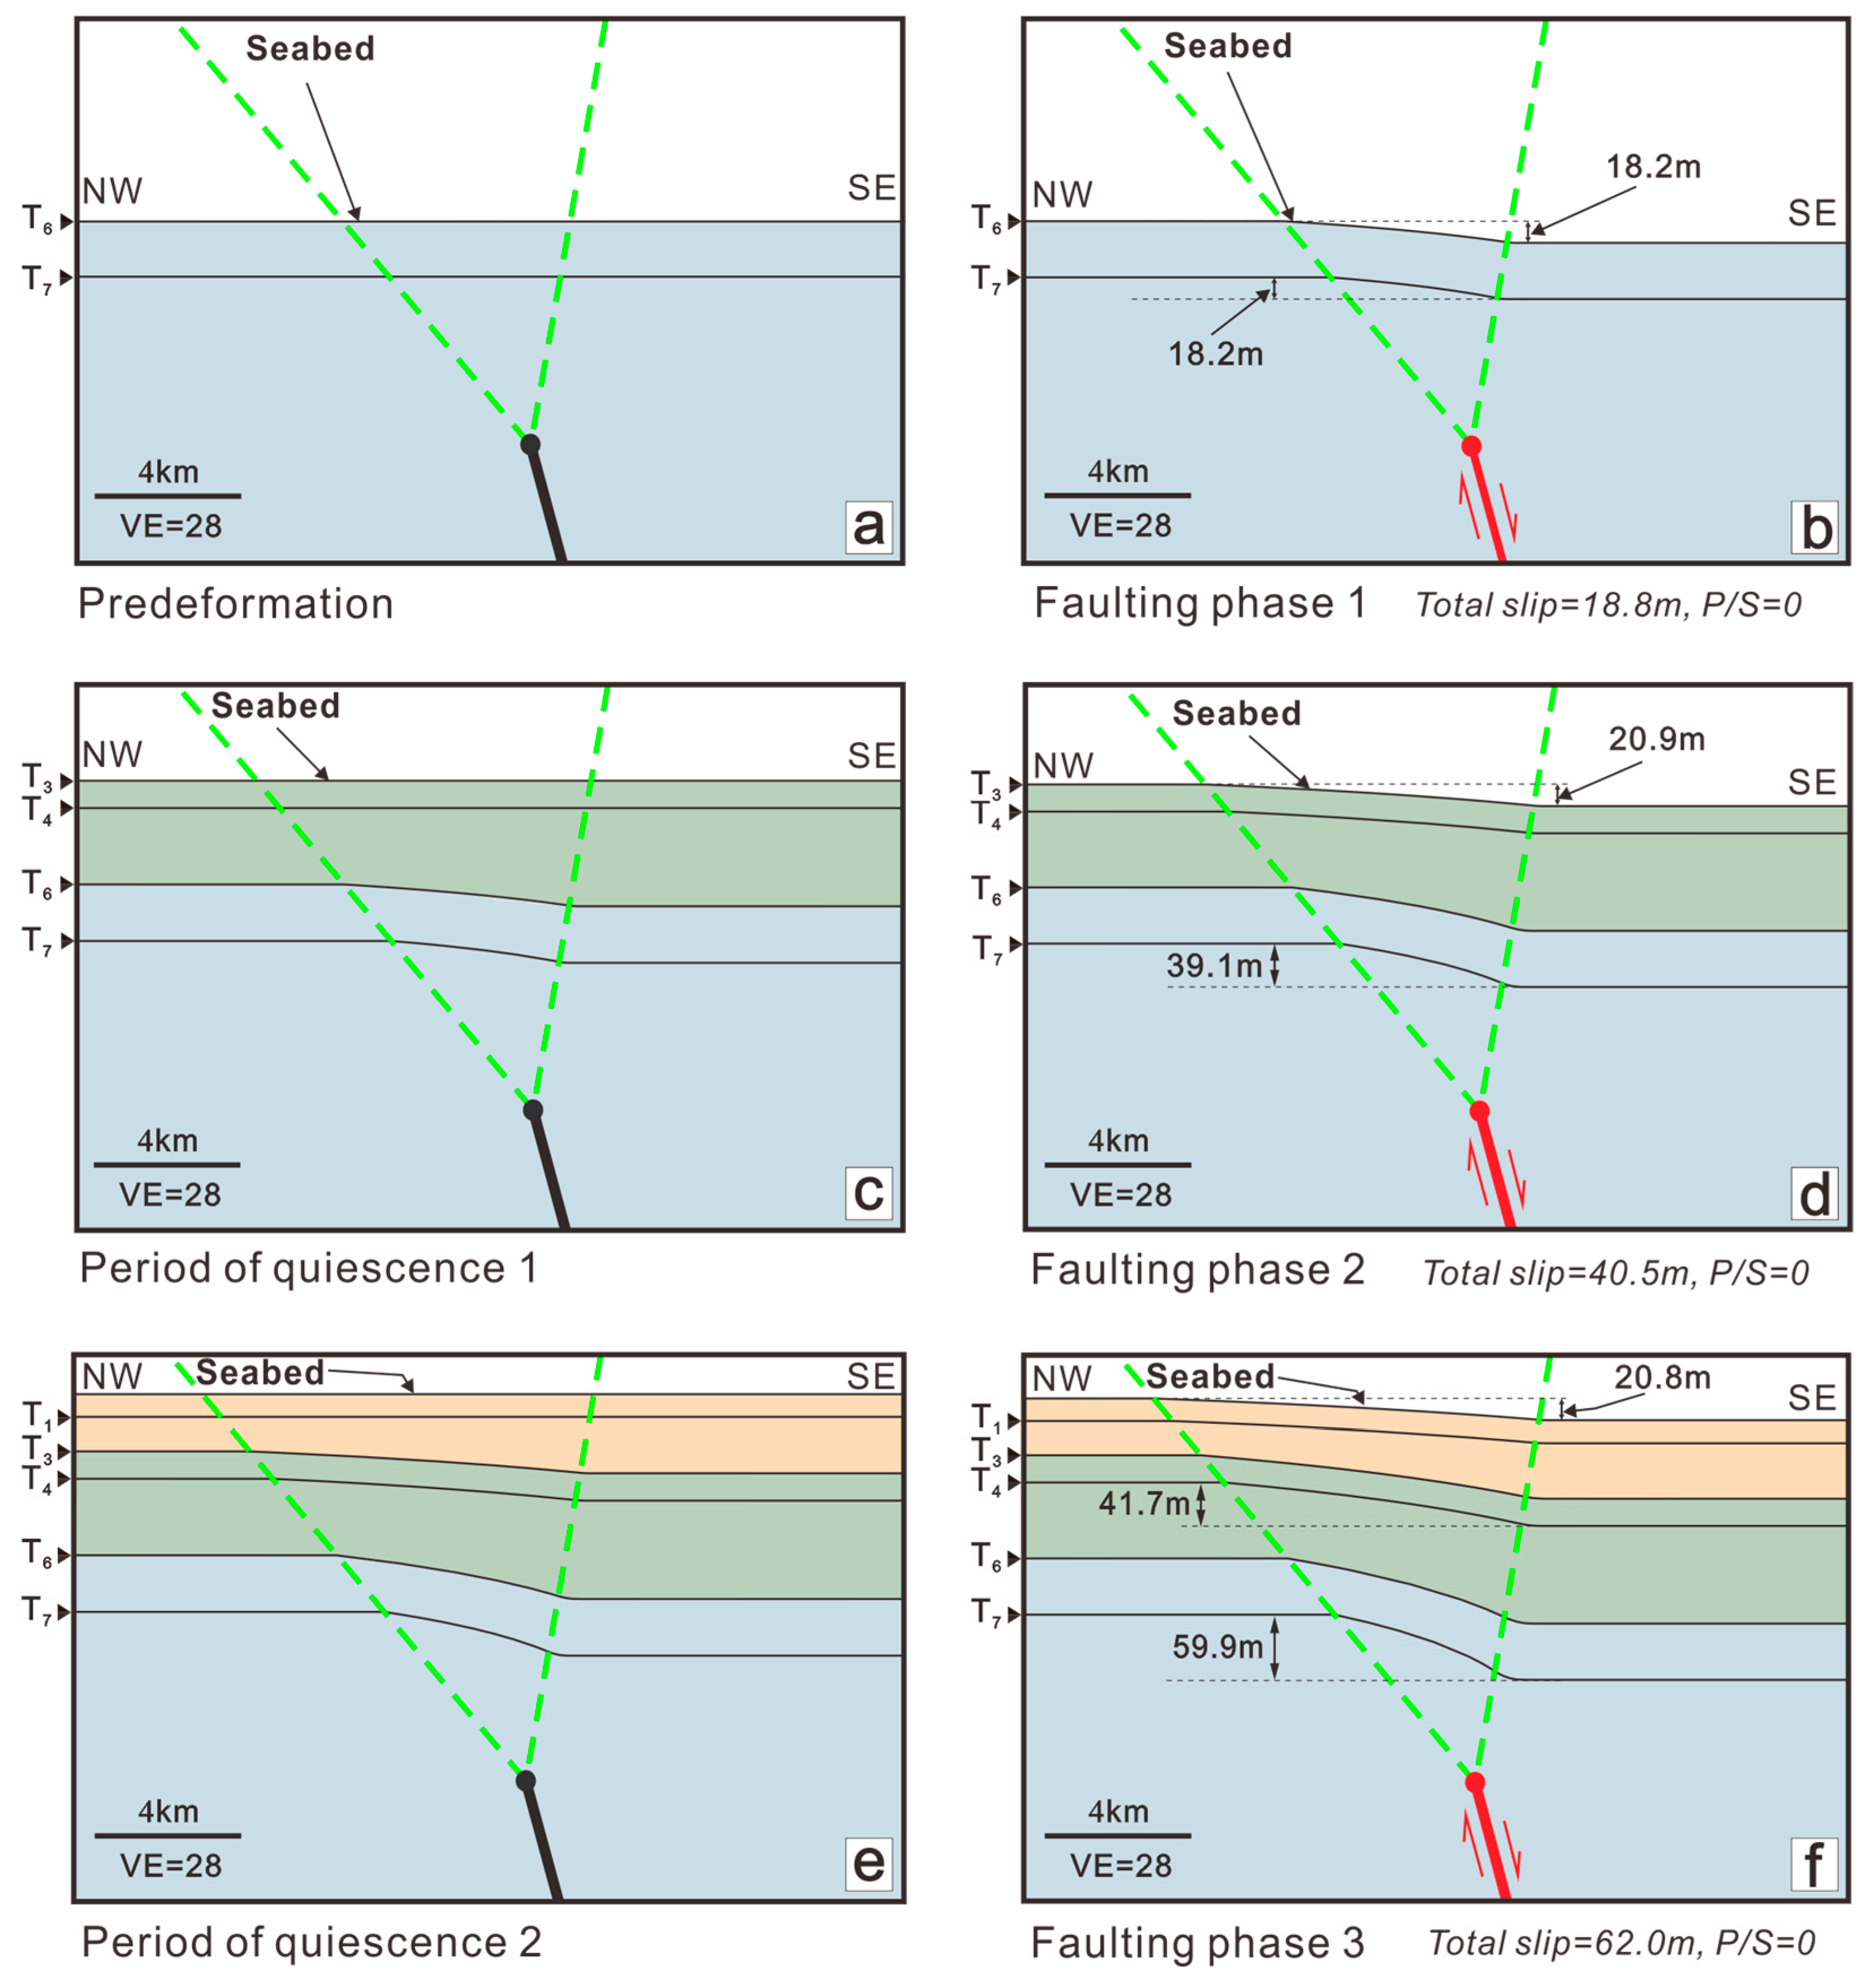
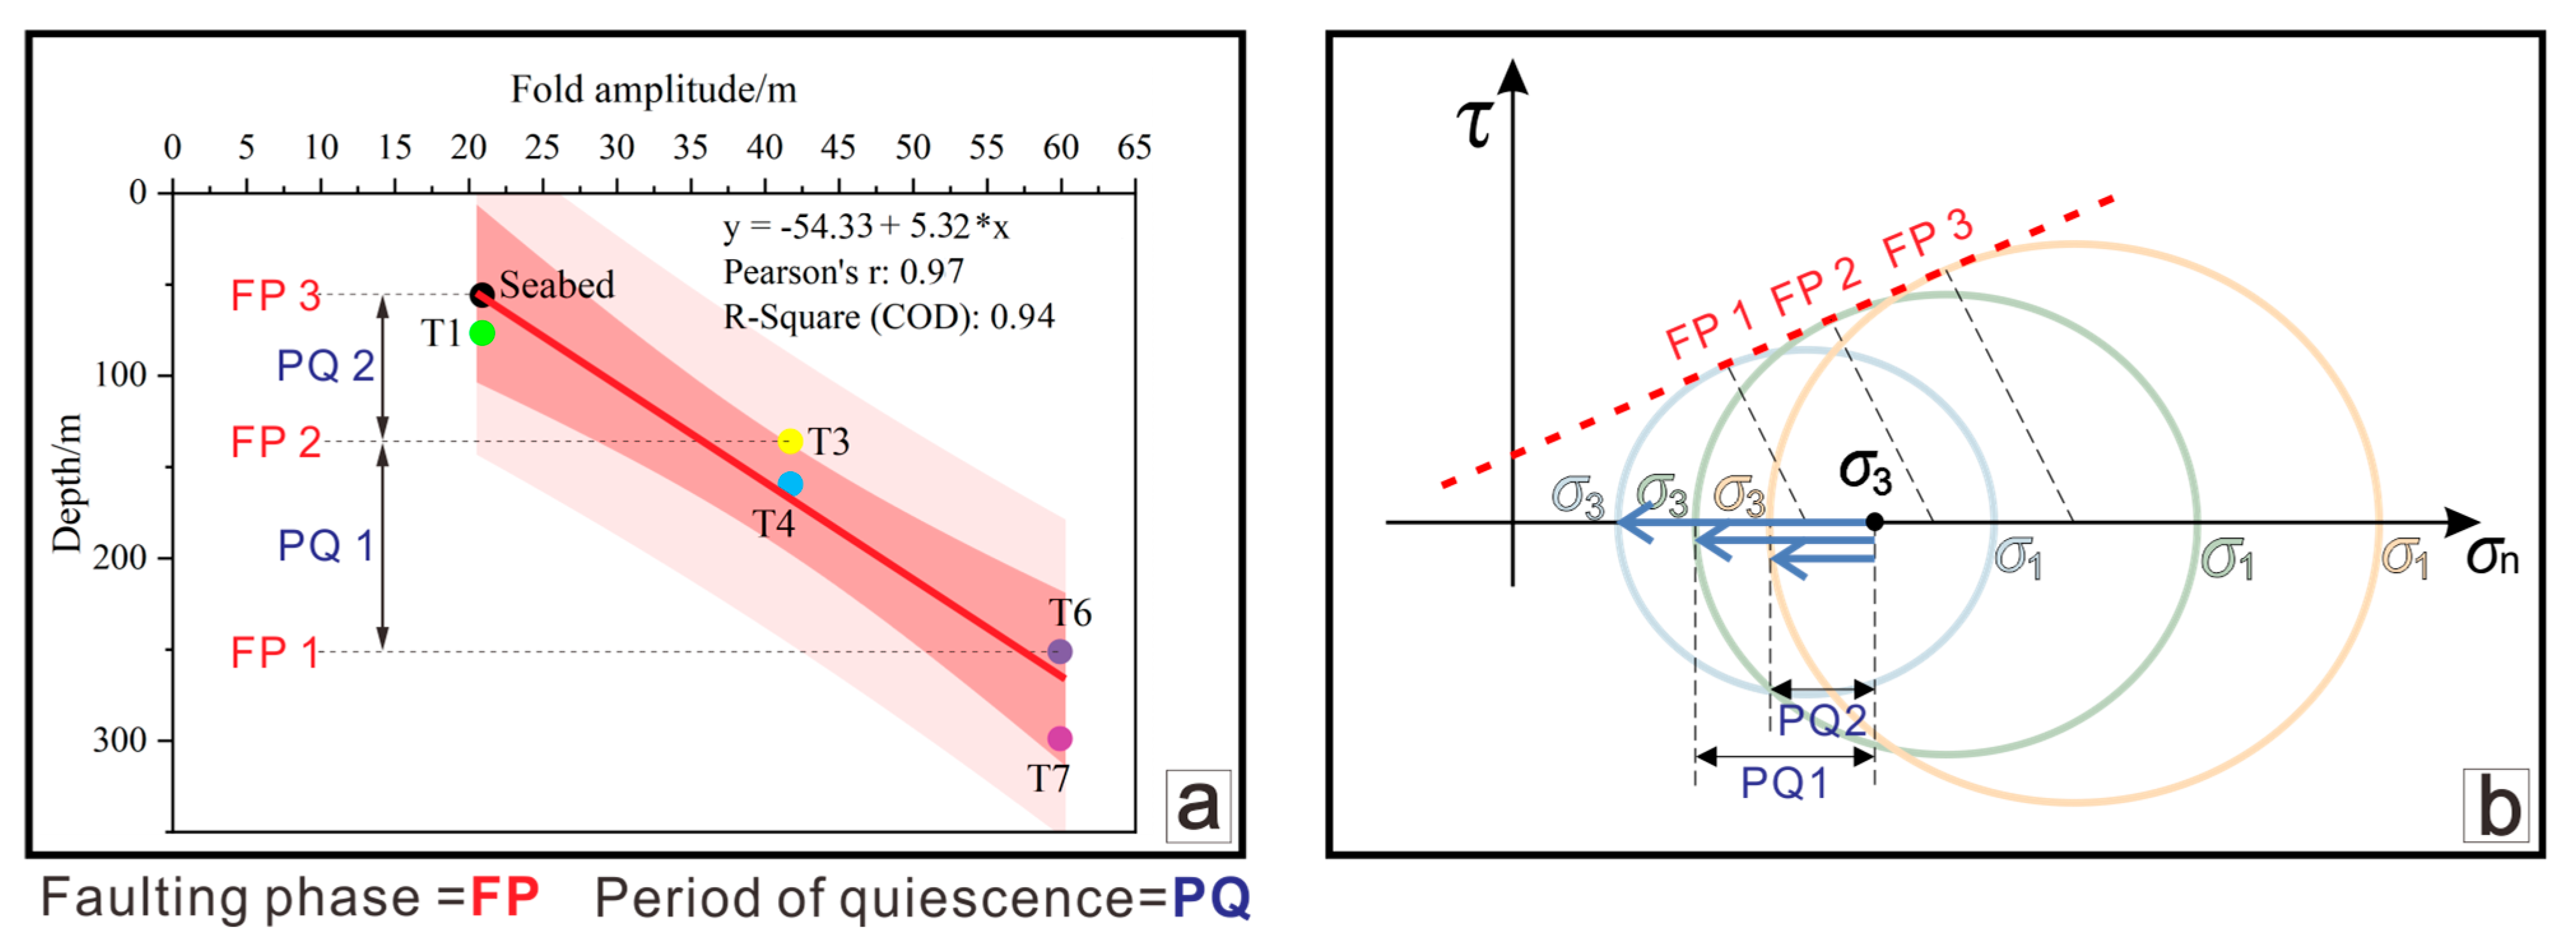
  • Among these structures, the monoclines show the largest deformation amplitudes at comparable depths, indicating their dominant role in the structural system. However, they also display intervals of deformation cessation, suggesting episodic behavior (Figure 6a).
  • By contrast, the antithetic fault F2 and the compressional folds demonstrate more consistent deformation magnitudes and rates throughout the stratigraphic interval (Figure 6b and Figure 7b).
These observations reveal distinct kinematic characteristics for the different structural elements and indicate that the shallow deformation patterns reflect variations in fault activity within the basement structures.

4.3. Forward Modeling of the Shallow Deformation Evolution of the F1

The study of Withjack used physical modeling to simulate the formation of monoclines at the surface due to normal fault activity in the basement [54] (Figure 3c). In this model, a widening deformation zone at the fault tip transmitted throw into the hanging wall as monoclines (Figure 3c,d). This process was reproduced in our study, with fault F1 serving as a natural example of such deformations (Figure 4 and Figure 5a). The seafloor topography, featuring a terrace up to 10 km wide (Figure 4 and Figure 5a), may directly correspond to the basement fault activity. Additionally, activity analyses indicate that fault F1 exhibits episodic activity, as shown in Figure 6a.
It is evident from Figure 6a that a distinct “activity cessation” signal is observed in the correlation between monoclinal folding and depth for the strata between T7–T6, T4–T3, and T1 relative to the seafloor. The amplitude values of the monoclinal folds across these intervals follow an arithmetic progression, with a consistent difference of approximately 20 m. Notably, the seafloor at the F1 fault location exhibits a vertical offset of approximately 20 m, and the 59.9 m vertical displacement at the T7 interface is attributed to fault movement during three distinct periods of rapid activity. These events occurred following the formation of the T6 and T3 interfaces and the present-day seafloor. To validate these observations, we employed the FaultFold V7 trishear numerical modeling software [59] (https://www.rickallmendinger.net/faultfold, accessed on 1 January 2024) to simulate the deformation process of fault F1 (Figure 8). The model incorporates layer thicknesses and slip distances derived from depth-converted seismic profiles (Figure 4). The dip angle of F1 was set at 75° based on previous studies [17]. The apex angle of the trishear model was set at 50° to regulate the strain range above the fault, with no inherent physical significance, but this was determined based on the aspect ratio of Figure 5a. For the sake of simplicity, the P/S ratio was set to 0, representing an idealized end-member case in which deformation is entirely accommodated by folding. This setting was used to correspond to the structural style observed in the N9 profile (Figure 4a), where no upward propagation of fault F1 into the sedimentary layers is identified.
In the resulting model of Figure 8, the dynamic evolution of the recent activities of fault F1 in the model depicted can be elucidated using a six-step model, which delineates three phases of rapid activity interspersed with two comparatively longer periods of quiescence. The seabed in steps b, d, and f exhibits the abrupt development of seafloor terraces, which are understood as the reactivation of the underlying fault. The vertical displacement of the monoclinal fold at the T7 interface is 59.9 m, and the overall displacement from the three periods of fault activity equals 59.9 m. This indicates that the “growth strata” phase in the model does not cause additional displacements, which corresponds to the period of quiescence. The “activity” of the strata is demonstrated by the thickness of the hanging wall under differential subsidence in later phases, which results from the relatively quick sliding phenomena during fault activity periods, increasing the accommodation space for the hanging wall. Using the expansion index analysis to interpret fault activity might result in misjudgment [51]. The model’s results (Figure 8f) align with the observed data (Figure 5a), but they suggest that fault F1 did not exhibit synsedimentary activity. Instead, the model indicates seismic-scale strain, characterized by significant displacements that occur over short timescales.

5. Discussion

5.1. Evidence Linking F1 Shallow Deformation to the 1918 Nan’ao Earthquake

High-resolution seismic reflection data provide detailed insights into the geometric and kinematic characteristics of shallow structures offshore of Nan’ao. Our observations reveal the most recent activities along two basement-involved normal faults, F1 and F2. While growth fault F2 exhibits continuous deformation, fault F1 is characterized by long periods of dormancy interrupted by episodic reactivation, consistent with cycles of stress accumulation and rapid energy release.
Fault F1 spatially coincides with the previously mapped LF fault (Figure 1 and Figure 2), which has been identified as the primary seismogenic structure associated with the 1918 Nan’ao M7.3 earthquake [6,8,14]. Based on seismic intensity distributions and structural analyses, Xu et al. [6] located the epicenter approximately 6 km southeast of the Nanpeng Islands (23.2°N, 117.3°E) at a depth of ~15 km (Figure 1 and Figure 2), consistent with the downward projection of F1. Thus, fault F1 is likely to have acted as a coseismic fault during the 1918 Nan’ao event.
Our seismic profiles indicate that faults F1 and F2 deform the seabed through distinct mechanisms—folding and fault cutting, respectively—both resulting from normal fault movements rooted in the basement. The observed deformation patterns show no evidence of subsequent inversion, suggesting that ongoing normal faulting dominates the present-day tectonic regime of the study area. This framework provides a critical context for understanding the relationship between shallow fault activity, the 1918 Nan’ao earthquake, and the associated “draw-down” tsunami.

5.2. Gravitational Collapse and Seismogenic Structures

The 1994 Mw7.3 earthquake in the Taiwan Strait, which was generated along the Yizhu fault, represents a normal faulting event (Figure 1) and the most significant seismic event recorded by contemporary seismic monitoring systems in the study area [1]. In the same structural stress circumstances in the region, the seismogenic Yizhu fault’s geometry characteristics are similar to those of the Littoral Fault in the Taiwan Strait [9]. Given the recent identification of the active normal faulting offshore of Nan’ao, we investigated whether the 1918 Nan’ao M7.3 earthquake also resulted from normal faulting processes. Based on the shallow fault movement characteristics observed in this study, insights can be drawn using comparisons with normal fault earthquakes from other regions worldwide where extensive seismic monitoring data are available.
Bignami et al. discussed two competing models to explain brittle upper crustal deformations associated with normal faulting: the elastic rebound model and the gravitational collapse model [63]. In the elastic rebound model, elastic strain accumulates during crustal extension until a sudden rupture occurs. In contrast, the gravitational collapse model suggests that gravitational potential energy, rather than elastic strain, is the primary driver of seismic activation, especially in tectonic settings involving wedge-shaped hanging-wall blocks [64,65].
To evaluate which model better explains the ongoing faulting behavior along the LFZ, we comparatively assess the assumptions and predictions of both frameworks against our observational and modeling results.
Compared with the elastic rebound model, which assumes symmetric elastic strain accumulation and release under an extensional stress regime, our investigation indicates that the gravitational collapse model provides a more coherent explanation for the observed fault asymmetry and vertical deformation in the LFZ. In particular, we identified two major active faults, F1 and F2, that bound a graben-like structure together. This configuration aligns well with the gravitational collapse model. Fault F1 displays episodic locking and unlocking, while fault F2 maintains continuous slip even during F1 inactivity. This contrast in fault behavior likely enhances the gravitational potential difference across the graben block, allowing gravity to play an active role in driving the faulting process.
Our investigation supports the gravitational collapse model as a more appropriate framework for explaining the normal faulting seismic activity in the study area. Specifically, we identified two major active faults, F1 and F2, which bound a graben-like block—a structural configuration consistent with the gravitational collapse mode. Fault F1 exhibits episodic locking and unlocking behavior, whereas fault F2 exhibits sustained slip behavior even during periods when F1 remains inactive. This differential activity likely increases the gravitational potential gradient across the graben block, introducing gravity as an active driver of the faulting process.
Furthermore, contemporary extensional tectonics in the region have largely ceased, and the present stress field shows signs of local compression (Figure 1a). Therefore, traditional extensional models cannot sufficiently explain the ongoing normal fault activity offshore of Nan’ao.
The gravitational collapse model also introduces the concept of graviquakes, referring to earthquakes triggered primarily by the release of gravitational potential energy [64,65,66,67,68,69,70,71]. According to this model, the magnitude of graviquakes largely depends on the mass and volume involved in the coseismic collapse [65,72]. Larger volumes are typically associated with increased earthquake magnitudes, especially when the fault length and brittle–ductile transition (BDT) depth increase.
In the study area, satellite-derived bathymetric data reveal the presence of a ~45 km long subsidence feature bounded by the two major faults, F1 and F2 (Figure 2). When combined with the inferred focal depth of approximately 15 km, this observation aligns remarkably well with the characteristic scaling for normal fault earthquakes, where the fault length is typically three times the rupture depth. Interestingly, Bignami et al. [72] investigated this scaling relationship and estimated that a gravity-driven normal fault with a brittle–ductile transition (BDT) depth of around 15 km and a typical depth-to-length ratio of 3 ± 1 could generate earthquakes of up to Mw7.2. This estimate closely matches the magnitude of the 1918 Nan’ao M7.3 earthquake.
Fault F1, characterized by a steep dip and brittle failure behavior within the upper crust, is suitably analyzed using Mohr circle representations, which capture the evolution of shear and normal stresses resulting in rupture. In this tectonic system, the gravitational potential energy stored in the wedge-shaped hanging-wall block primarily governs the accumulation of stress that eventually results in fault rupture. Given that the volume of the wedge and the fault frictional properties remain relatively stable across deformation cycles, both the gravitational energy accumulation and rupture threshold are expected to remain within a consistent range.
As illustrated by the evolution of Mohr circles (Figure 9), the stress state progressively migrates toward failure conditions during the interseismic period as the circle expands. Rupture is initiated once the Mohr circle tangentially contacts the failure envelope, represented by the red dashed line corresponding to a constant frictional strength. This mechanism implies that the differential stress required for fault slip remains approximately constant across successive seismic cycles. This results in relatively uniform magnitudes of energy release and surface displacement during each faulting phase.
Observational data from the sedimentary record substantiate this inference: each activation phase of fault F1 produced a relatively consistent seabed offset, with measured displacements of approximately 18.2 m, 20.9 m, and 20.8 m (Figure 8b,d,f), all clustering around 20 m. This stability in displacement magnitudes supports the interpretation of a consistent rupture threshold. It reinforces the dominance of gravitational loading as the primary driver of fault activity in the study area.
In addition, slight differences in the seabed drops associated with the three periods of activity have been observed (Figure 8b,d,f). According to the gravitational seismic model, with increasing loads, the total seabed drop caused by each period of faulting activity should exhibit a progressive increase [65]. As the load on the hanging wall increases, both the accumulated energy and maximum principal stress increase, shortening the time needed to reach the critical sliding point (Figure 10b). Simulation results show that the thickness of the sedimentary layers deposited during the second quiescent period (PQ2) is less than that during the first quiescent period (PQ1) (Figure 10a), implying that the duration of PQ2 was shorter than that of PQ1.
Our data indicate that the seabed drop during Faulting Phase 2 (Figure 8d) is greater than that during Faulting Phase 1 (Figure 8b) and is similar to the current seabed drop (Figure 8f), implying that the current activation phase may not yet have concluded. The active seismic background observed offshore of Nan’ao along the LFZ supports this interpretation. We have reason to believe that the ongoing normal faulting activity offshore of Nan’ao is closely related to the gravitational effects exerted by the wedge-shaped block above fault F1.
Although the gravitational collapse model provides a compelling explanation for the observed faulting behavior, it also has certain limitations. First, due to the absence of modern instrumental records, no direct seismic evidence supports non-double-couple components typically associated with gravity-driven ruptures. Second, the model depends on several geometric and mechanical assumptions, including the estimated volume of the graben block, the loading rate, and the fault system’s frictional properties. These parameters may vary across space and time, introducing uncertainty into the model. Third, while the model effectively explains vertical collapse, it does not fully account for the influence of lateral tectonic interactions, which may significantly affect fault-slip behavior in structurally complex settings such as the LFZ.

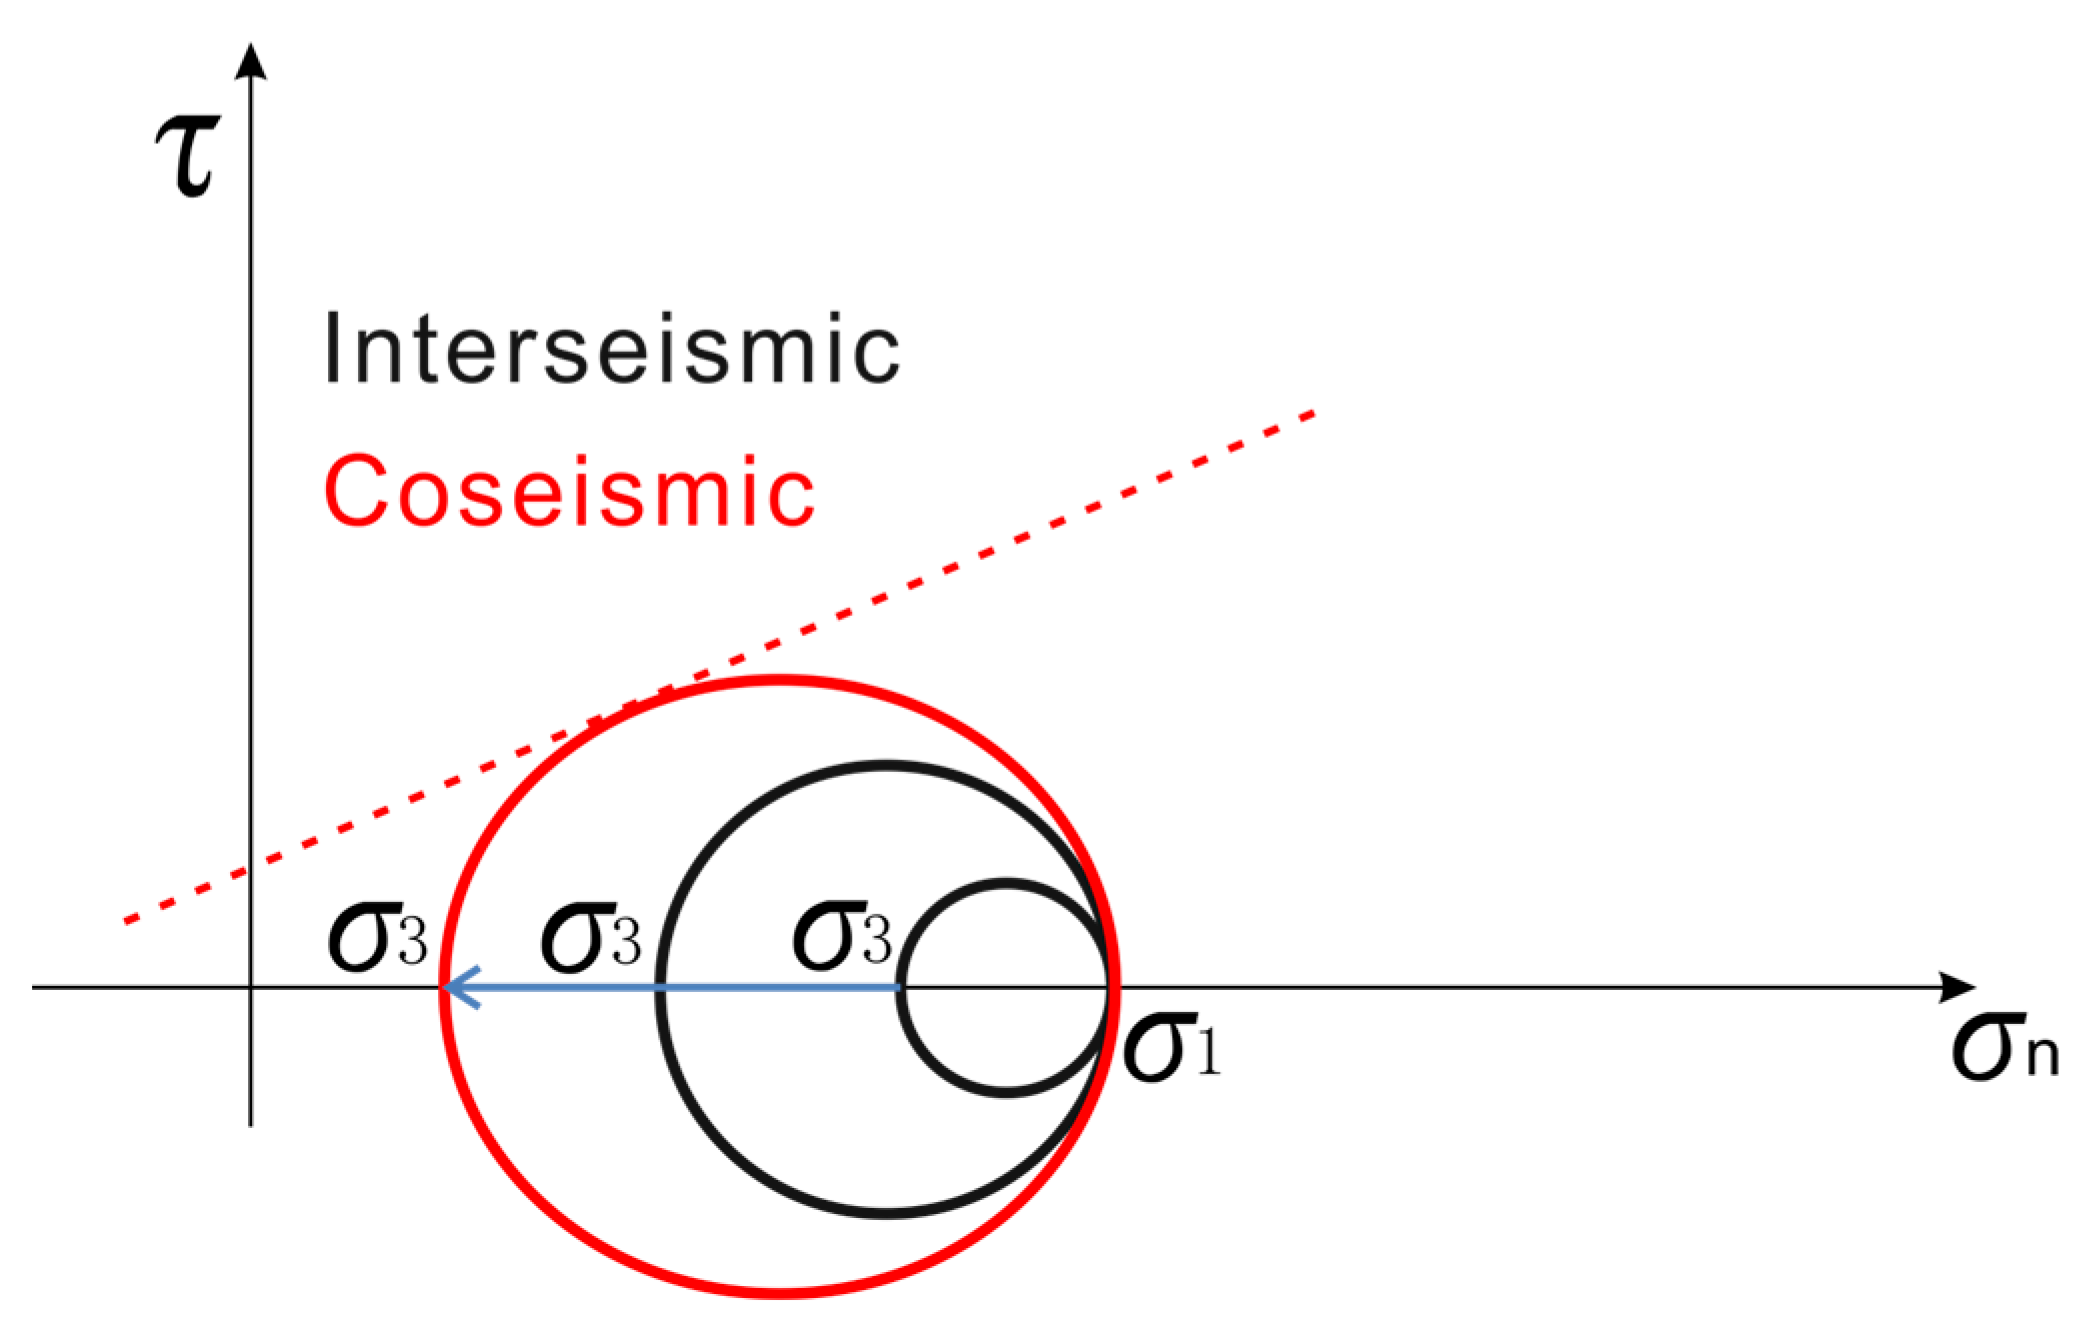
5.3. Coseismic Deformation Model

To better understand the mechanisms driving recent fault activity offshore of Nan’ao, it is essential to construct a deformation model that integrates shallow structural observations with deeper crustal processes. Previous studies have proposed gravitational collapse as a key mechanism explaining many normal faulting earthquakes. However, these models primarily focus on large-scale mass movement and have not fully incorporated shallow deformation features and the effects of mid-crustal rheological structures.
Our investigation refines the classical gravitational collapse model by revealing detailed shallow deformation patterns associated with active faults F1 and F2. Furthermore, new insights into the existence of a ductile layer in the mid-crust beneath the South China continental margin allow us to propose a more complete explanation for the formation and sustained activity of antithetic faults. Based on the integration of high-resolution seismic profiles, wide-angle crustal surveys, and experimental fault-propagation studies, we present a refined coseismic deformation model that captures the multi-layered mechanical interactions governing seismic activity offshore of Nan’ao.

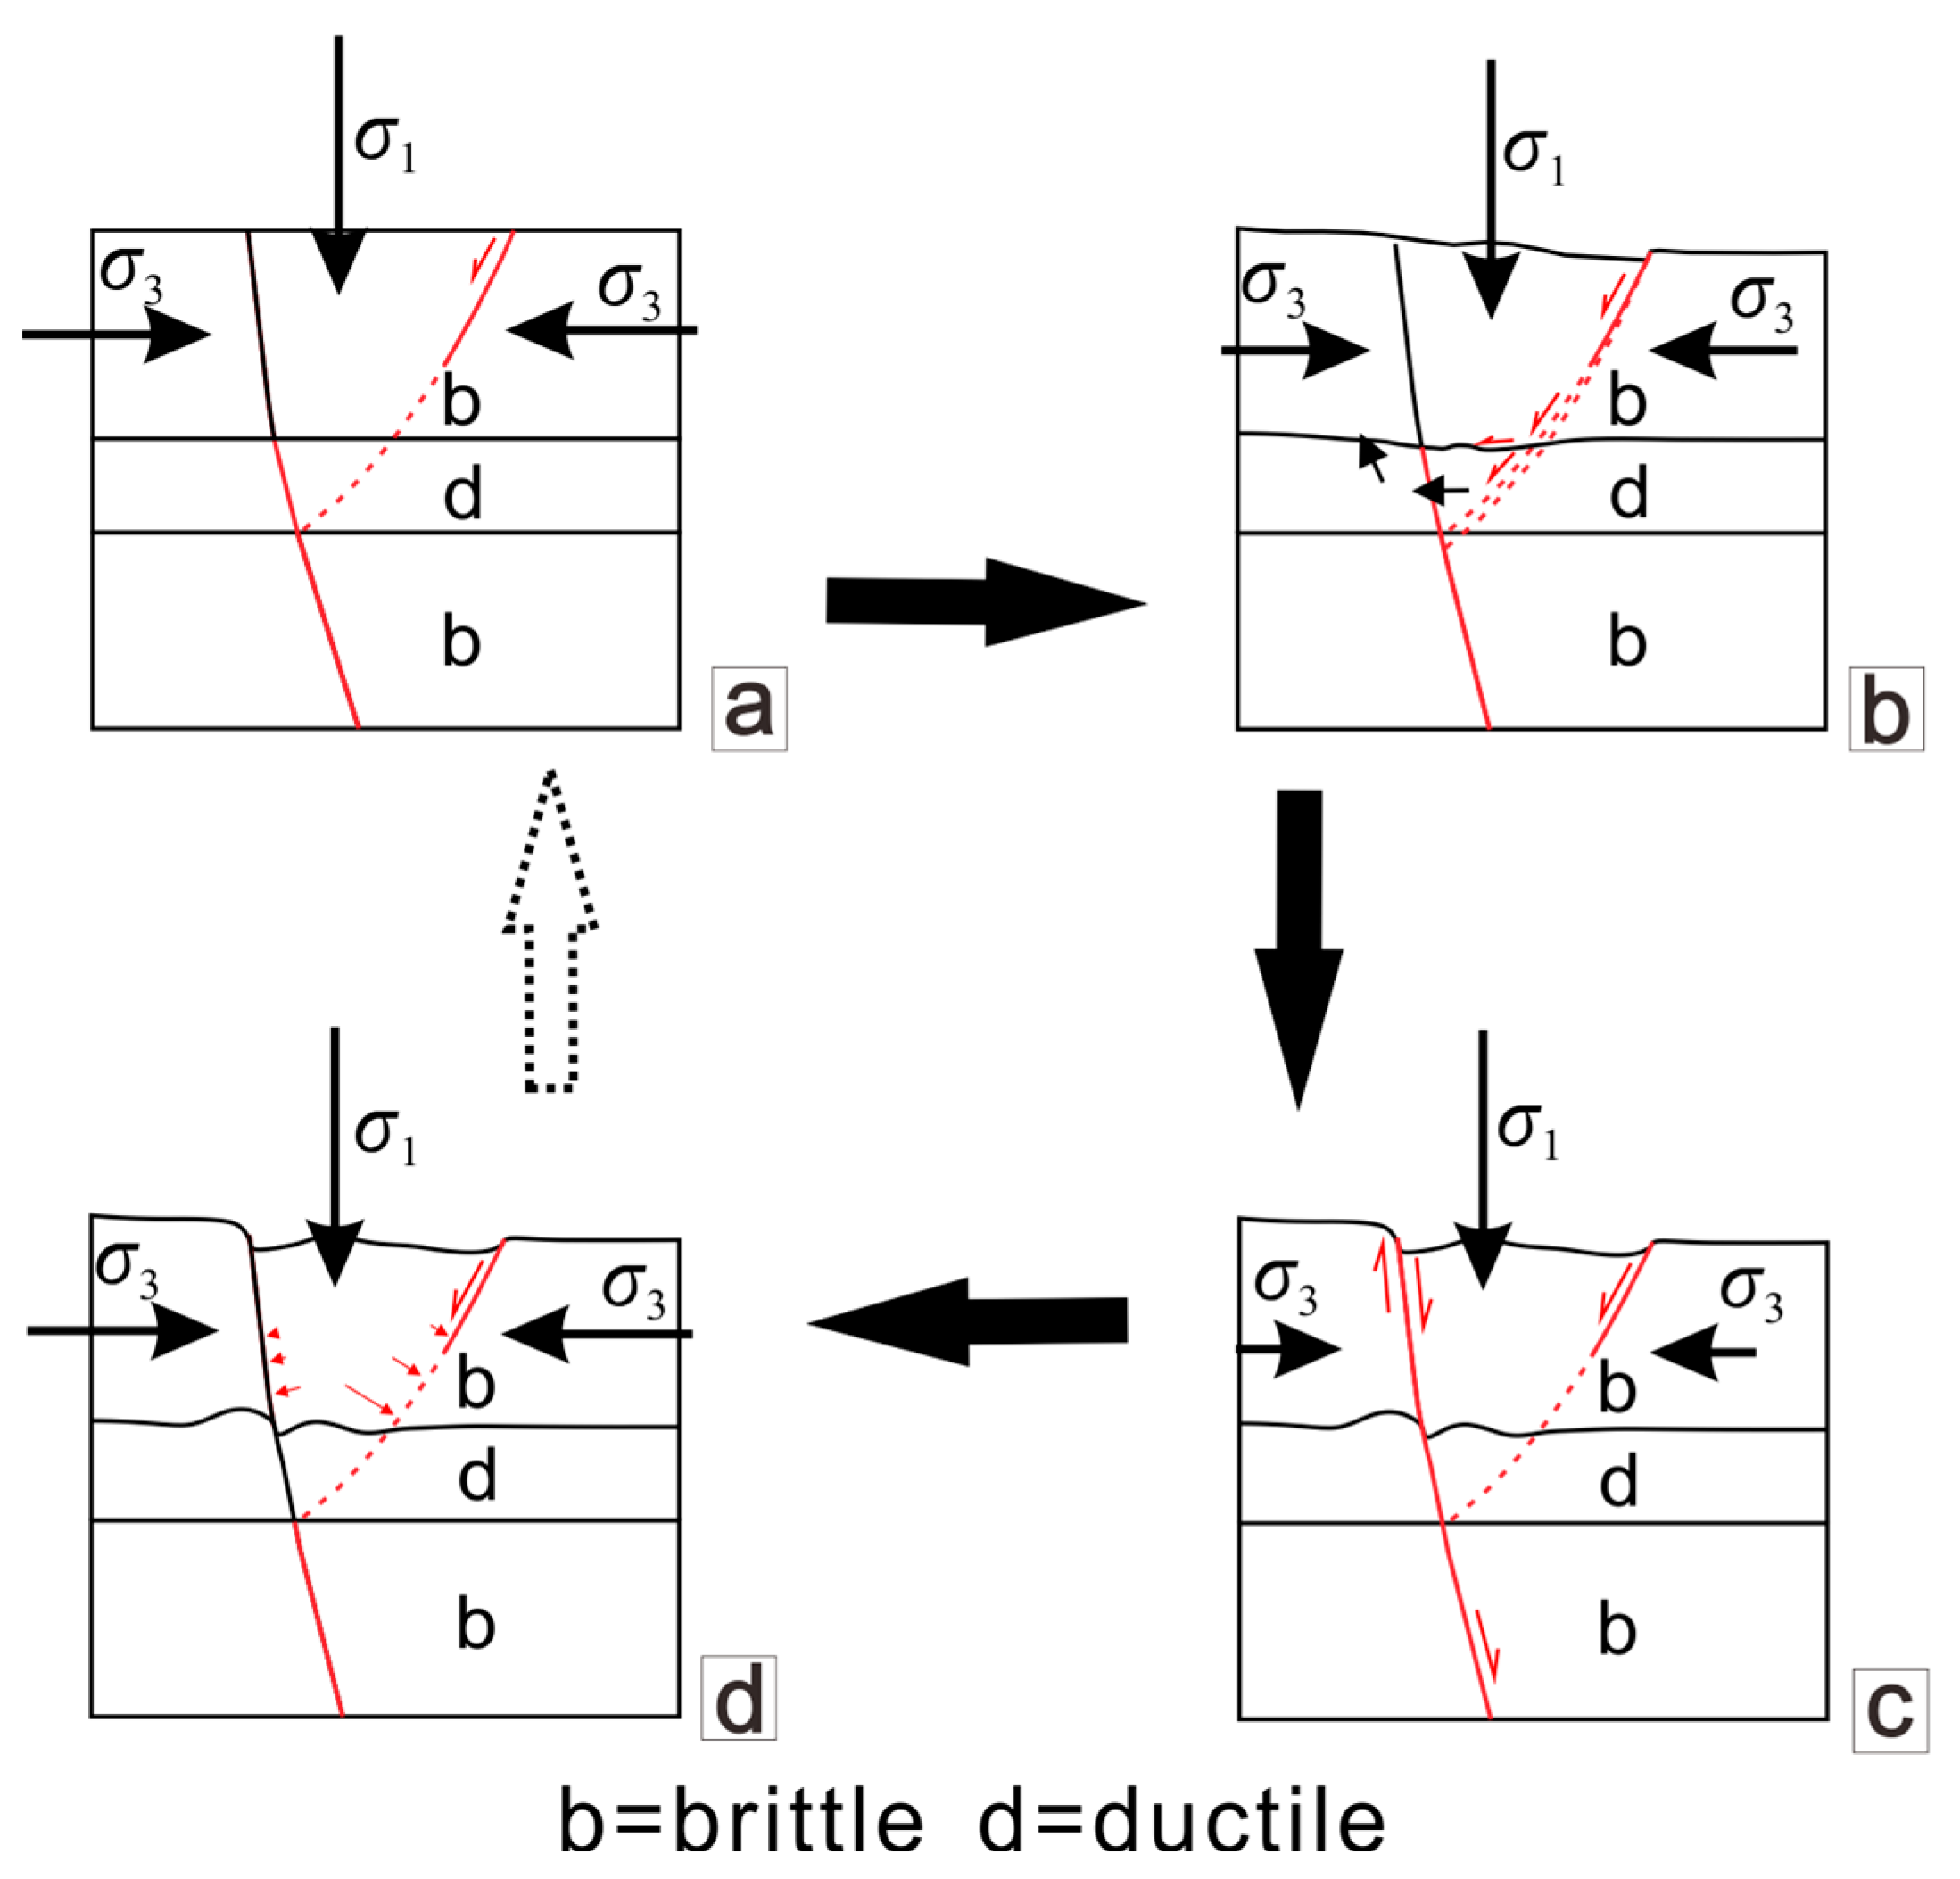
5.3.1. Role of the Mid-Crustal Ductile Layer

A ductile layer within the crust of the South China continental margin, spanning depths of approximately 10–25 km, has been confirmed in several studies [16,36,74,75]. This feature closely resembles the mid-crustal structures observed in normal faulting seismic zones in central Italy [63]. It also aligns with findings from multidisciplinary studies of the 2016 seismic sequence in the region, characterized by a Mw 6.5 mainshock, which employed geological and interferometric methods to characterize fault dynamics and deformation [76]. Wide-angle seismic surveys offshore of Nan’ao have revealed detailed crustal structures in the land-sea transitional zone [13,14], identifying weak mid-crustal zones and localized low-velocity anomalies.
The mechanical property contrasts between weak interlayers and adjacent layers resemble those observed in some experimental simulations. Holland et al. [77] demonstrated the formation of antithetic faults using wet sand physical models, and Hardy [78] replicated similar behavior through discrete element numerical simulations. Although these experimental results are based on simplified materials and scaling, they provide valuable references for understanding how mechanical contrasts and localized weak zones may facilitate antithetic faults’ generation and sustained slip. Such mechanisms offer essential insights for interpreting the formation of antithetic faults and the persistent activity observed offshore of Nan’ao.

5.3.2. Plastic Deformation and Fault-Slip Mechanisms

In the gravitational collapse models of normal faulting earthquakes, the expansion and compression of conjugate fault-bounded wedges are interpreted as mechanisms of energy accumulation and release [66,72]. However, in previous studies, the existence of such conjugate weak zones has largely been inferred from the spatial distribution of seismic events and fault system kinematics, as opposed to direct observation [73]. In contrast, in this study, we identify fault F2 as an actively slipping antithetic fault within the wedge, providing direct structural evidence of a conjugate weak zone.
In this study, we propose an alternative explanation for the generation of gravitational gradients, emphasizing that the continuous sliding of the observed antithetic fault F2 promotes the progressive accumulation of gravitational potential differences within the wedge-shaped graben block, based on integrated shallow structural observations and deeper crustal interpretations offshore of Nan’ao. For the wedge-shaped block bounded by the opposing F1 and F2 faults, the overall compressive environment favors the maintenance of structural stability. Under such conditions, gravity becomes the dominant driving force for block movement, yet why omnipresent gravity results in differential movements on opposite sides of the graben remains a critical question.
To address this phenomenon, we consider the effects of shear stress orientation and material rheology on fault behavior. Under high-angle shear conditions, materials tend to accumulate elastic strain and remain mechanically stable until a brittle rupture is triggered by significant normal stress [79]. Conversely, low-angle shear conditions favor gradual sliding and plastic deformation, as the normal stress component is relatively reduced [80].
Within the offshore Nan’ao graben, fault F1 exhibits a steep dip angle of approximately 70–80° [17], nearly penetrating vertically into the Moho [13], which is consistent with high-angle shear-controlled brittle faulting behavior and episodic ruptures. Fault F2, by comparison, dips at approximately 60° in shallow sediments (Figure 7a) and is inferred to become even gentler at greater depths. This lower-angle shear condition along F2 promotes persistent plastic deformation and continuous downward slip along the ductile interface. Such differences in fault geometry and associated stress regimes provide a mechanical basis for the observed continuous, uniform activity of F2 versus the episodic, locked behavior of F1.
Given this specific structural configuration, the offshore Nan’ao region exhibits a spontaneous, gravity-driven seismic cycle controlled by the interplay between brittle fault locking and ductile layer deformation (Figure 11).
Building on these structural observations, we infer that during interseismic periods, low-angle shear stress acting along the ductile layer interface facilitates sustained plastic deformation (as illustrated in Figure 11b), providing the necessary accommodation space for the gradual downward movement of the antithetic fault. The sliding of F2 induces the compression of the hanging-wall wedge against the footwall of fault F1 (as shown in Figure 4a,b), potentially extruding weak material into the immediate footwall region of fault F1 and resulting in localized uplift adjacent to the fault zone. This process results in a progressive reduction in the confining pressure within the wedge-shaped block, manifested by a decrease in the minimum principal stress (σ3) (Figure 11c), while simultaneously increasing the differential stress, thereby enlarging the leftward Mohr circle (Figure 9). Once the accumulated stress exceeds the critical threshold, a coseismic phase is triggered (Figure 9 and Figure 11d), releasing the pressure gradient between the brittle upper crust and the active ductile layer. Following stress release, the system stabilizes and initiates a new cycle of stress accumulation, returning to an interseismic phase (Figure 11a).

5.3.3. Coseismic Deformation Model and Structural Interpretation

Extending these insights, we constructed a coseismic deformation model scaled to realistic geological proportions based on the shallow deformation features and interpreted deep crustal structure offshore of Nan’ao (Figure 12). This model integrates fault geometries, rheological variations, and observed slip behaviours to capture the key mechanical processes that drive the seismic cycle in the region.
In this model, fault F1 represents the major normal fault penetrating through the entire crust. Within the brittle upper crust, F1 exhibits locking–slipping behavior, whereby elastic strain accumulates during interseismic periods and is abruptly released during coseismic rupture events. In contrast, fault F2 maintains continuous slip behavior, facilitating gravitational collapse and the direct seabed faulting of the hanging-wall wedge. Due to the lack of significant mechanical constraints, F2 can more readily realize mechanical equilibrium compared to F1.
In addition, we infer the presence of a detachment fault—designated F3—developed within the ductile mid-crustal layer. As fault F1 propagates downward and approaches the ductile zone, the dominant vertical compressional stress is progressively replaced by gravitationally induced extensional stress acting obliquely relative to the hanging-wall wedge. This stress transformation promotes the formation of bending–sliding folds, characterized by the flexural bending of the hanging-wall strata accompanied by layer-parallel stretching. In addition to fold development, along-layer shear adjustments are expected to occur, facilitating localized layer-parallel decoupling [81,82]. These two deformation mechanisms create the necessary accommodation space for the initiation and evolution of fault F3, which is interpreted as a major detachment fault converging within the ductile mid-crustal layer.
According to elastic dislocation theory for extensional tectonic environments [83], the emergence of the Lemen Islands may be attributed to the activity of the deep-seated detachment fault (F3), while the formation of the Nanpeng Islands is more likely related to the surface rupture associated with fault F1. These interpretations highlight the intricate interplay between fault slip, ductile flow, and surface morphology evolution in the offshore Nan’ao seismic system.
Moreover, coseismic faulting results in the sudden downward displacement of the graben-shaped hanging-wall wedge bounded by faults F1 and F2. Driven by gravitational instability, the shared hanging-wall graben rapidly subsides, instantaneously creating accommodation space for seawater. This dynamic mechanism provides a plausible explanation for the draw-down tsunami associated with the 1918 Nan’ao earthquake, highlighting the direct link between active fault-slip processes and tsunami generation in the offshore Nan’ao seismic system.
In addition, the spatial distribution of microseismicity recorded between 2018 and 2023 shows good correspondence with the interpreted fault framework, including faults F1, F2, and the inferred detachment fault F3 (Figure 12). This alignment between seismicity patterns and fault structures further supports the reliability of the proposed coseismic deformation model and the ongoing tectonic activity in the study area.

6. Conclusions

In this study, we utilized high-resolution seismic reflection data to reveal the fault activity characteristics of the LFZ offshore of Nan’ao and their association with the 1918 Nan’ao M7.3 earthquake. The main conclusions are as follows:
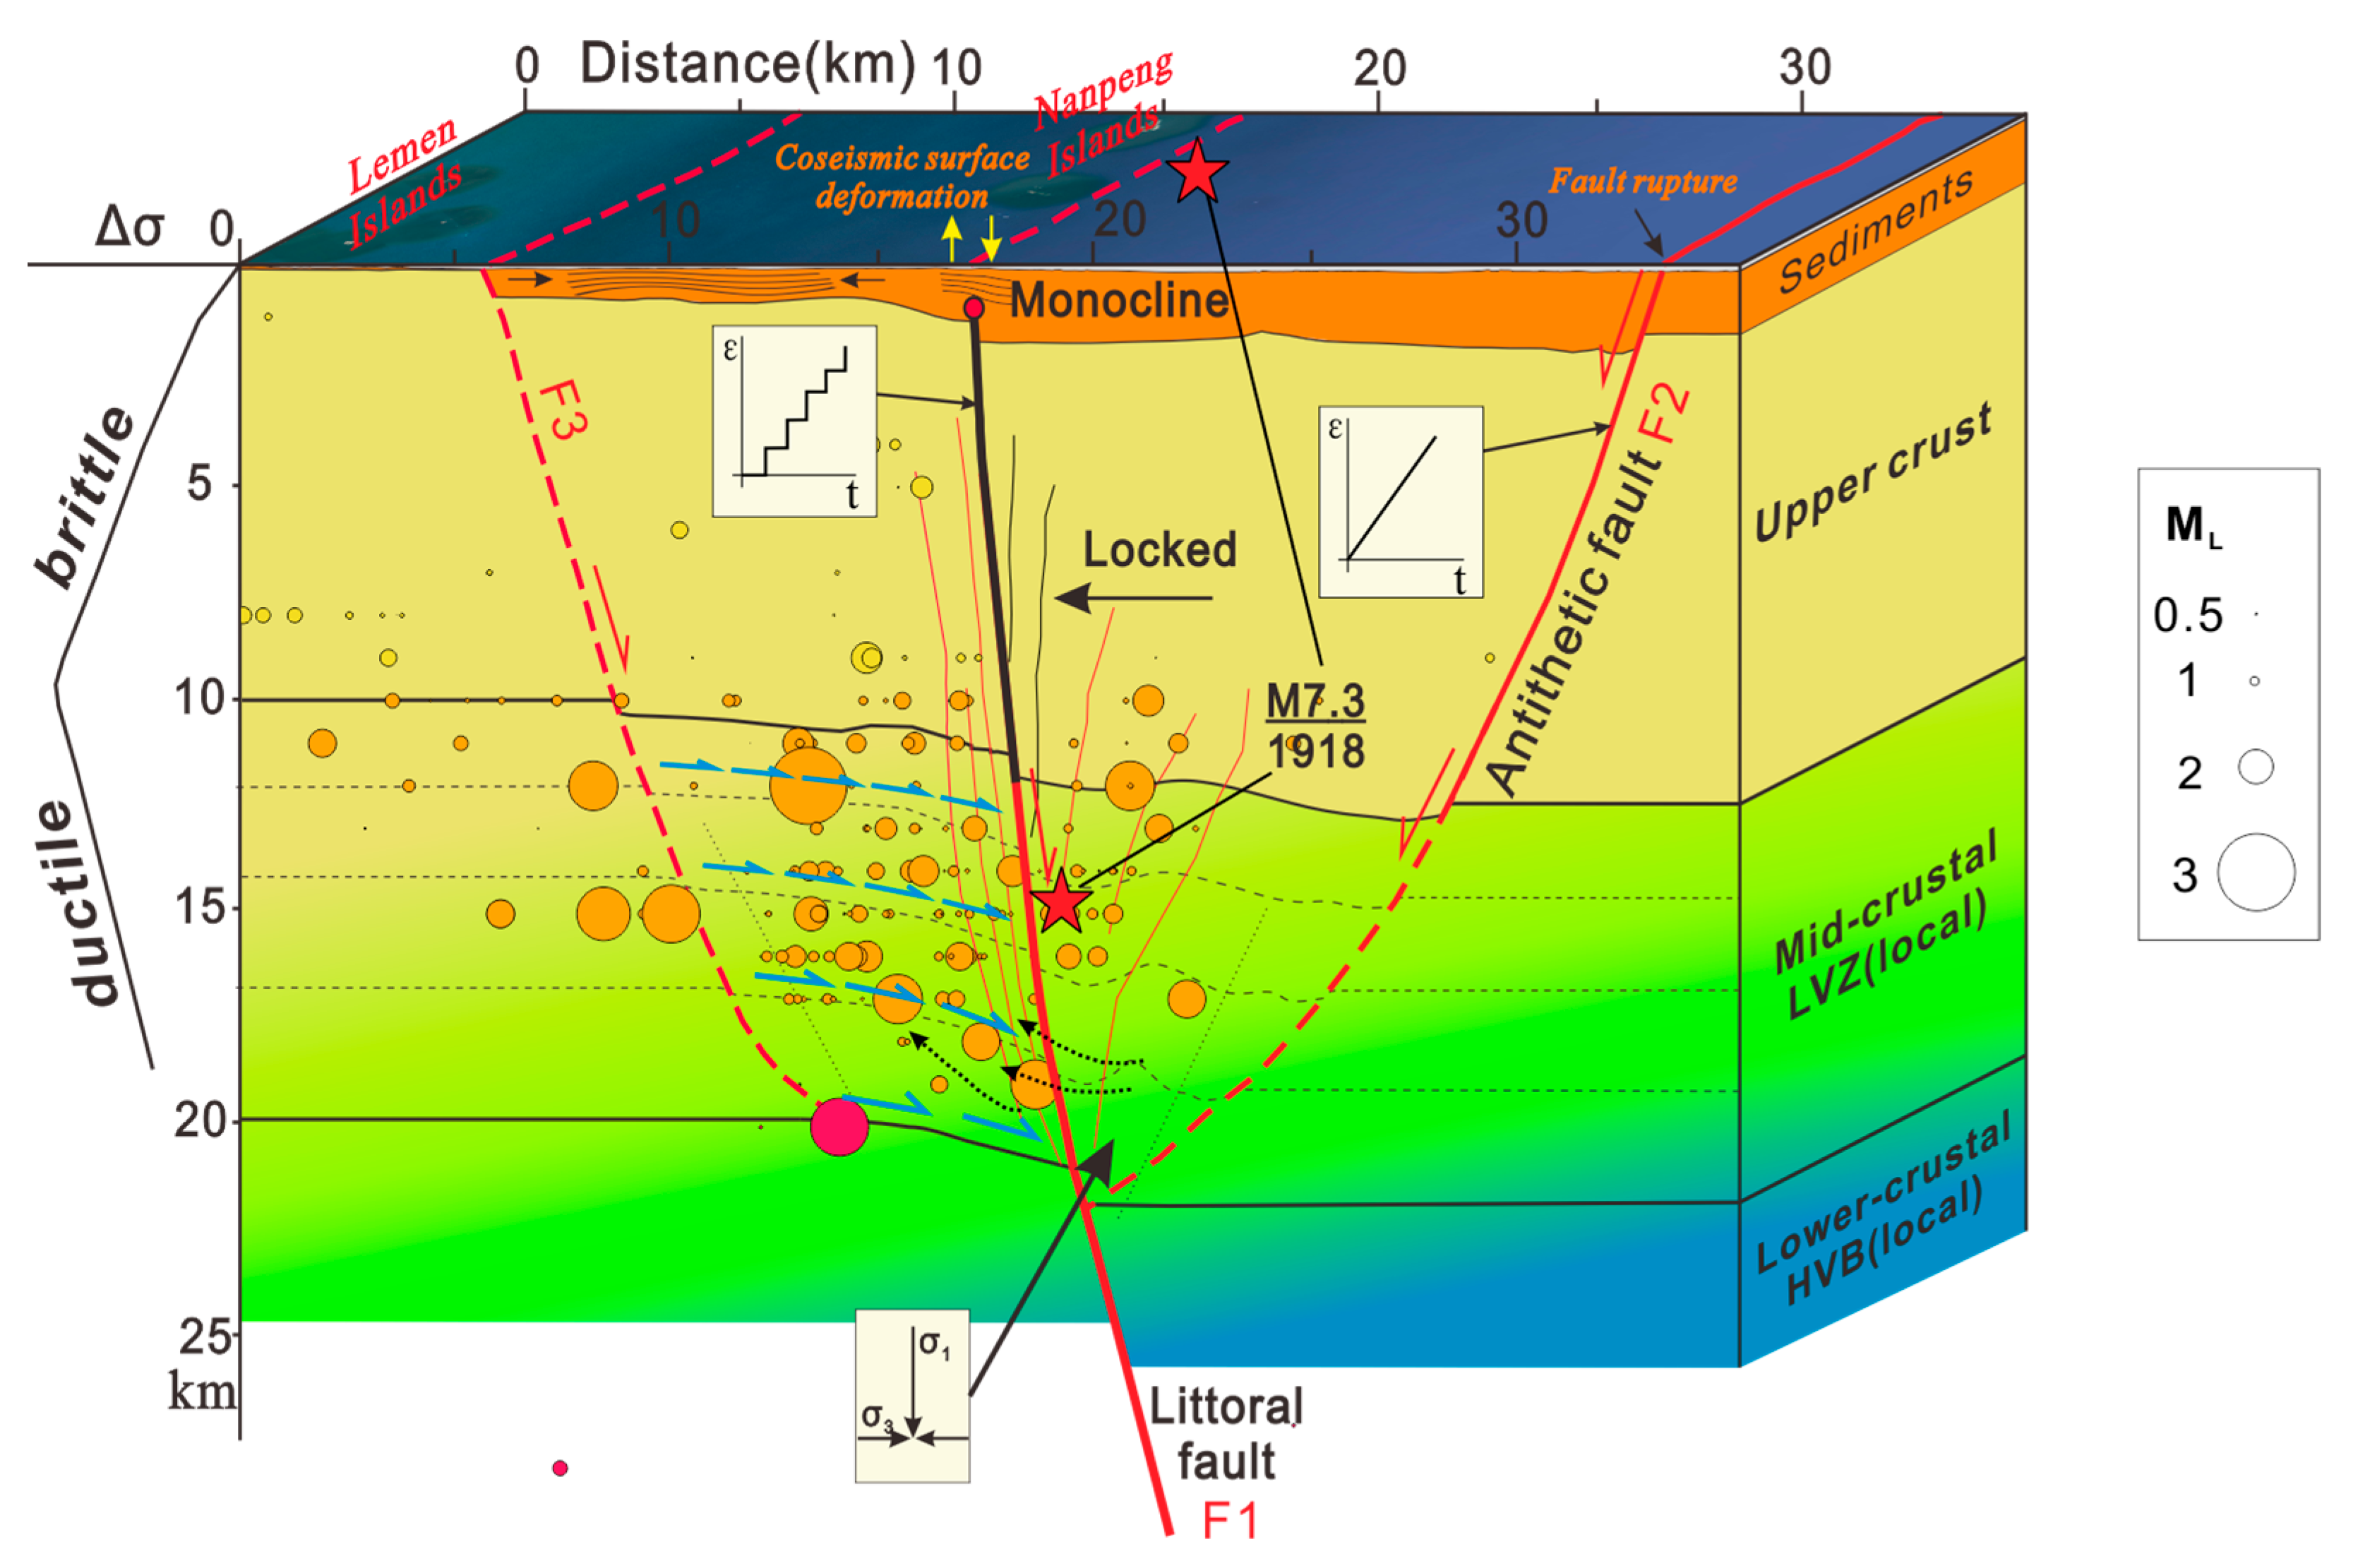
  • Fault F1 exhibits a clear spatial and kinematic correlation with the 1918 Nan’ao earthquake. Its alternating phases of dormancy and activation, identified in shallow strata and seabed morphology, reflect cycles of long-term stress accumulation and sudden energy release, supporting its role as the primary seismogenic fault.
  • Despite the current regional compressive stress regime, active normal faulting is observed offshore of Nan’ao. The lack of strike-slip or reverse faulting signatures suggests that gravitational loading, coupled with deep crustal and upper crustal structural controls, is the dominant driving force behind the ongoing normal fault activity.
  • A gravitational collapse model is proposed based on differences in the movement patterns of faults F1 and F2. The graben-shaped hanging-wall block, bounded by faults F1 and F2, stores potential gravitational energy that is sufficient for producing an M7.2 earthquake, matching the magnitude of the 1918 Nan’ao event. This mechanism also explains the downward-draw tsunami observed during the earthquake.
These findings highlight the necessity of re-evaluating the seismic and tsunami potentials associated with the LFZ. Future studies should integrate high-resolution multibeam bathymetry, direct sediment dating, and the real-time monitoring of fault-slip behavior to constrain shallow-to-deep deformation processes and improve potential assessment in coastal areas.

Supplementary Materials

The following supporting information can be downloaded at: https://www.mdpi.com/article/10.3390/rs17132153/s1, Table S1: Earthquake catalog from January 2018 to April 2025, including origin time, latitude, longitude, magnitude, and focal depth; Code S1: A Python script for geometric restoration and evaluation of compressional strata based on balanced cross-section techniques.

Author Contributions

Conceptualization, H.Y., X.W. and X.Y.; methodology, H.Y., W.Z., X.W. and X.Y.; formal analysis, H.Y.; investigation, H.Y.; data curation, H.Y.; software, H.Y.; validation, H.Y.; writing—original draft preparation, H.Y.; writing—review and editing, J.L. and Y.Y.; visualization, J.H. and Z.J.; supervision, J.S.; project administration, W.Z. and J.S.; funding acquisition, W.Z., Y.Y., X.Y., and J.L. All authors have read and agreed to the published version of the manuscript.

Funding

This research was jointly supported by the National Key R&D Program of China (No. 2022YFC3103800), Key Talents Project of Guangdong Province (No. 2023JC07H110), National Natural Science Foundation of China (Nos. 42206069, 41876067, and 42272098), Science and Technology Projects of Guangzhou (No. 2023A04J0191), Open Fund from SinoProbe Laboratory (No. Sinoprobe Lab 202227), and Hainan Foreign Expert Project (No. G20230607009E).

Data Availability Statement

The original contributions presented in the study are included in the article/Supplementary Material, further inquiries can be directed to the corresponding author.

Acknowledgments

We would like to thank the crew of R/V Haidiao 6 and the science expedition team for their support in data collection. We also sincerely thank Qinqin Tang from the South China Sea Institute of Oceanology, Chinese Academy of Sciences, for her assistance during the writing of this manuscript. We are grateful to Jiangnan Lin from the Guangzhou Marine Geological Survey for his helpful discussions on the focal mechanisms of small-magnitude earthquakes in the Nan’ao offshore region, and to Genggeng Wen from the Earthquake Administration of Guangdong Province for his valuable suggestions on regional seismicity and tectonic interpretations.

Conflicts of Interest

The authors declare no conflicts of interest.

References

  1. Wei, B.L. Characteristics of Seismic Activity in Southeast Coast Area; Seismological Press: Beijing, China, 2001. [Google Scholar]
  2. Peng, C.G.; Li, Y.G.; Wu, M.B. Analysis of Seismogenic Structure Mechanism ofthe Nanao Earthquakein 1918. South China J. Seismol. -Chin. Ed. 2017, 37, 1–14. [Google Scholar] [CrossRef]
  3. Chen, E.M.; Huang, Y.Y. Nineteen strong earthquakes in South China-The summary of continental margin seismic belt along the northern South China Sea. South China J. Seismol. 1984, 4, 14–35. [Google Scholar] [CrossRef]
  4. Yu, S.-B.; Chen, H.-Y.; Kuo, L.-C. Velocity field of GPS stations in the Taiwan Area. Tectonophysics 1997, 274, 41–59. [Google Scholar] [CrossRef]
  5. Kreemer, C.; Holt, W.; Haines, A. An integrated global model of present-day plate motions and plate boundary deformation. Geophys. J. Int. 2003, 154, 8–34. [Google Scholar] [CrossRef]
  6. Xu, H.L.; Qiu, X.L.; Zhao, M.H.; Sun, J.L.; Zhu, J.J. Characteristics of the crustal structure and hypocentral tectonics in the epicentral area of Nan’ao earthquake (M7.5), the northeastern South China Sea. Chin. Sci. Bull. 2006, 51, 95–106. [Google Scholar] [CrossRef]
  7. Zhang, Y.F.; Hao, K.C.; Alvarez-Marron, J.; Brown, D.; Lin, A.T.S.; Xie, Z.Z.; Xing, J. Imaging active faulting in the western Taiwan Strait. Sci. Rep. 2020, 10, 3703. [Google Scholar] [CrossRef]
  8. Liu, Y.X. The active fractures in South China Coast. Mar. Geol. Quat. Geol. 1985, 5, 11–21. [Google Scholar] [CrossRef]
  9. Wang, S.W.; Zhan, W.H.; Zhang, F.; Zhu, J.J. The coulomb stress change associated with the Taiwan Strait MS7. 3 earthquake on Sep. 16, 1994 and the risk prediction of its surrounding faults. Earthq. Res. China 2011, 27, 419–430. [Google Scholar]
  10. Xiong, C.; Cao, J.H.; Sun, J.L.; Xia, S.H.; Wan, K.Y.; Fan, C.Y.; Yan, B.F. Variation characteristics along the strike of the littoral fault zone in offshore Pearl River Estuary. Earth Sci. 2018, 43, 16. [Google Scholar] [CrossRef]
  11. Zhang, Y.; Ye, X.; Wan, K.; Lv, Z.; Wen, G.; Xu, S. Fault structure, seismicity, and magmatism of the Littoral Fault zone, northern South China sea: Insights from high-resolution seismic reflection data. Mar. Pet. Geol. 2023, 160, 106605. [Google Scholar] [CrossRef]
  12. Cao, J.H.; Sun, J.L.; Xu, H.L.; Xia, S.H. Seismological features of the littoral fault zone in the Pearl River Estuary. Chin. J. Geophys. 2014, 57, 498–508. [Google Scholar] [CrossRef]
  13. Zhao, M.H.; Qiu, X.L.; Ye, C.M.; Xia, K.Y.; Huang, C.L.; Xie, J.B.; Wang, P. Analysis on deep crustal structure along the onshore-offshore seismic profile across the Binhai (littoral) fault zone in northeastern South China Sea. Chin. J. Geophys. 2004, 47, 845–852. [Google Scholar] [CrossRef]
  14. Xia, S.H.; Zhou, P.X.; Zhao, D.P.; Cao, J.H. Seismogenic structure in the source zone of the 1918 M7.5 NanAo earthquake in the northern South China Sea. Phys. Earth Planet. Inter. 2020, 302, 106472. [Google Scholar] [CrossRef]
  15. Lv, L.; Wang, D.; Wang, W.; Dai, X.; Zeng, F.; Li, L.; Hao, L.; Hui, G.; Long, W.; Zhang, P. The latest activity of the Slope Fault Zone (Pearl River Mouth) in northern South China Sea and implications for earthquake hazard assessments. Mar. Pet. Geol. 2024, 166, 106937. [Google Scholar] [CrossRef]
  16. Cao, J.; Xia, S.; Sun, J.; Zhao, F.; Wan, K.; Xu, H. Offshore Fault Geometrics in the Pearl River Estuary, Southeastern China: Evidence from Seismic Reflection Data. J. Ocean. Univ. China 2018, 17, 799–810. [Google Scholar] [CrossRef]
  17. Deng, K. Tectonic characteristics of the Binhai Fault Zone in Taiwan Strait. Mar. Geol. Quat. Geol. 2019, 39, 72–80. [Google Scholar] [CrossRef]
  18. Moernaut, J.; Howarth, J.; Kremer, K.; Wils, K. Lacustrine Records of Past Seismic Shaking. In Understanding Past Earthquakes; Elliott, A., Gruetzner, C., Eds.; Springer Nature: Cham, Switzerland, 2025; pp. 169–227. [Google Scholar]
  19. Lu, Y.; Wetzler, N.; Waldmann, N.; Agnon, A.; Biasi, G.; Marco, S. A 220,000-year-long continuous large earthquake record on a slow-slipping plate boundary. Sci. Adv. 2020, 6, eaba4170. [Google Scholar] [CrossRef]
  20. Ghazoui, Z.; Bertrand, S.; Vanneste, K.; Yokoyama, Y.; Nomade, J.; Gajurel, A.; Beek, P. Potentially large post-1505 AD earthquakes in western Nepal revealed by a lake sediment record. Nat. Commun. 2019, 10, 2258. [Google Scholar] [CrossRef]
  21. Praet, N.; Moernaut, J.; Van Daele, M.; Boes, E.; Haeussler, P.J.; Strupler, M.; Schmidt, S.; Loso, M.G.; De Batist, M. Paleoseismic potential of sublacustrine landslide records in a high-seismicity setting (south-central Alaska). Mar. Geol. 2017, 384, 103–119. [Google Scholar] [CrossRef]
  22. Sims, J. Records of prehistoric earthquakes in sedimentary deposits in lakes. Earthq. Inf. Bull. USGS 1979, 11, 228–233. [Google Scholar]
  23. Mérindol, M.; St-Onge, G.; Sultan, N.; Lajeunesse, P.; Garziglia, S. Earthquake-triggered submarine landslides in the St. Lawrence Estuary (Québec, Canada) during the last two millennia and the record of the major 1663 CE M ≥ 7 event. Quat. Sci. Rev. 2022, 291, 107640. [Google Scholar] [CrossRef]
  24. Singleton, D.; Brothers, D.; Haeussler, P.; Witter, R.; Hill, J. Constraining the Earthquake Recording Threshold of Intraslab Earthquakes With Turbidites in South-Central Alaska’s Lakes and Fjords. In Tectonics and Seismic Structure of Alaska and Northwestern Canada: EarthScope and Beyond; John Wiley & Sons, Inc.: Hoboken, NJ, USA, 2024; pp. 389–418. [Google Scholar]
  25. Beigt, D.; Villarosa, G.; Gómez, E.A.; Manzoni, C. Subaqueous landslides at the distal basin of Lago Nahuel Huapi (Argentina): Towards a tsunami hazard evaluation in Northern Patagonian lakes. Geomorphology 2016, 268, 197–206. [Google Scholar] [CrossRef]
  26. Zhang, W.; Hu, J.; Hu, L. Condition prediction model of cumulative energy of seafloor ground motions in the Japan trench subduction zone. Chin. J. Geophys. 2024, 67, 2729–2743. [Google Scholar]
  27. Wetzler, N.; Marco, S.; Heifetz, E. Quantitative analysis of seismogenic shear-induced turbulence in lake sediments. Geology 2010, 38, 303–306. [Google Scholar] [CrossRef]
  28. Piegari, E.; Camanni, G.; Mercurio, M.; Marzocchi, W. Illuminating the Hierarchical Segmentation of Faults Through an Unsupervised Learning Approach Applied to Clouds of Earthquake Hypocenters. Earth Space Sci. 2024, 11, e2023EA003267. [Google Scholar] [CrossRef]
  29. Burnett, H.; Fan, W. Imaging microearthquake rupture processes using a dense array in Oklahoma. Seismica 2024, 3, 1354. [Google Scholar] [CrossRef]
  30. Smith, W.; Sandwell, D. Global Sea Floor Topography from Satellite Altimetry and Ship Depth Soundings. Science 1997, 277, 1956–1962. [Google Scholar] [CrossRef]
  31. Morley, C.K. Major unconformities/termination of extension events and associated surfaces in the South China Seas: Review and implications for tectonic development. J. Asian Earth Sci. 2016, 120, 62–86. [Google Scholar] [CrossRef]
  32. Xu, Y.; Lü, Q.T.; Shi, D.N.; Zhang, Y.Q.; Yan, J.Y.; Xu, Z.W. Upper mantle velocity structure beneath the eastern South China Block and implications for late Mesozoic magmatism. J. Asian Earth Sci. 2022, 224, 105013. [Google Scholar] [CrossRef]
  33. Li, S.Z.; Suo, Y.H.; Li, X.Y.; Zho, J.; Santosh, M.; Wang, P.C.; Wang, G.Z.; Guo, L.L.; Yu, S.Y.; Lan, H.Y.; et al. Mesozoic tectono-magmatic response in the East Asian ocean-continent connection zone to subduction of the Paleo-Pacific Plate. Earth-Sci. Rev. 2019, 192, 91–137. [Google Scholar] [CrossRef]
  34. Qiu, Y.; Huang, W.; Du, W.; Han, B. Analysis on the Formation of the Thin Continental Crust in the South China Sea. Earth Sci. 2021, 46, 899–915. [Google Scholar] [CrossRef]
  35. Li, Z.X.; Li, X.H. Formation of the 1300-km-wide intracontinental orogen and postorogenic magmatic province in Mesozoic South China: A flat-slab subduction model. Geology 2007, 35, 179–182. [Google Scholar] [CrossRef]
  36. Li, J.H.; Dong, S.W.; Cawood, P.A.; Thybo, H.; Clift, P.D.; Johnston, S.T.; Zhao, G.C.; Zhang, Y.Q. Cretaceous long-distance lithospheric extension and surface response in South China. Earth-Sci. Rev. 2023, 243, 104496. [Google Scholar] [CrossRef]
  37. Li, X.H. Cretaceous magmatism and lithospheric extension in Southeast China. J. Asian Earth Sci. 2000, 18, 293–305. [Google Scholar] [CrossRef]
  38. Charvet, J.; Lapierre, H.; Yu, Y. Geodynamic significance of the Mesozoic volcanism of southeastern China. J. Southeast Asian Earth Sci. 1994, 9, 387–396. [Google Scholar] [CrossRef]
  39. Wang, S.; Zhang, D.; Wu, G.G.; Vatuva, A.; Di, Y.J.; Yan, P.C.; Feng, H.B.; Ma, S. Late Paleozoic to Mesozoic extension in southwestern Fujian Province, South China: Geochemical, geochronological and Hf isotopic constraints from basic-intermediate dykes. Geosci. Front. 2017, 8, 529–540. [Google Scholar] [CrossRef]
  40. Ding, R.; Seward, D.; Zou, H. Late Cretaceous-Paleogene rift initiation of the southwestern East China Sea Basin: Implications from a fission-track study of the Changle–Nan’ao Belt. J. Asian Earth Sci. 2023, 256, 105824. [Google Scholar] [CrossRef]
  41. Li, Y.J.; Lin, L.; Zhao, J.B. A new model of the formation of the meso-cenozoic block basins in east China. Oil Gas. Geol. 1988, 9, 334–345. [Google Scholar] [CrossRef]
  42. Chou, Y.W.; Yu, H.S. Structural expressions of flexural extension in the arc-continent collisional foredeep of western Taiwan. Geol. Soc. Am. Spec. Pap. 2002, 358, 1–12. [Google Scholar] [CrossRef]
  43. Lin, A.T.; Watts, A.B.; Hesselbo, S.P. Cenozoic stratigraphy and subsidence history of the South China Sea margin in the Taiwan region. Basin Res. 2003, 15, 453–478. [Google Scholar] [CrossRef]
  44. Pedoja, K.; Shen, J.W.; Kershaw, S.; Tang, C. Coastal Quaternary morphologies on the northern coast of the South China Sea, China, and their implications for current tectonic models: A review and preliminary study. Mar. Geol. 2008, 255, 103–117. [Google Scholar] [CrossRef]
  45. Pedoja, K.; Regard, V.; Husson, L.; Martinod, J.; Guillaume, B.; Fucks, E.; Iglesias, M.; Weill, P. Uplift of quaternary shorelines in eastern Patagonia: Darwin revisited. Geomorphology 2011, 127, 121–142. [Google Scholar] [CrossRef]
  46. Zhang, Y.; Yao, H.; Yang, H.-Y.; Cai, H.-T.; Fang, H.; Xu, J.; Jin, X.; Kuo-Chen, H.; Liang, W.-T.; Chen, K.-X. 3-D Crustal Shear-Wave Velocity Structure of the Taiwan Strait and Fujian, SE China, Revealed by Ambient Noise Tomography. J. Geophys. Res. -Solid. Earth 2018, 123, 8016–8031. [Google Scholar] [CrossRef]
  47. Xia, S.; Lin, J.; Cao, J. Seismicity and Seismogenic Structure in the Northern Coastal Area of the South China Sea. Geotecton. Metallog. 2022, 46, 455–470. [Google Scholar] [CrossRef]
  48. Waldhauser, F.; Ellsworth, W. A Double-Difference Earthquake Location Algorithm: Method and Application to the Northern Hayward Fault, California. Bull. Seismol. Soc. Am. 2000, 90, 1353–1368. [Google Scholar] [CrossRef]
  49. Cirillo, D.; Totaro, C.; Lavecchia, G.; Orecchio, B.; de Nardis, R.; Presti, D.; Ferrarini, F.; Bello, S.; Brozzetti, F. Structural complexities and tectonic barriers controlling recent seismic activity in the Pollino area (Calabria–Lucania, southern Italy)—Constraints from stress inversion and 3D fault model building. Solid. Earth 2022, 13, 205–228. [Google Scholar] [CrossRef]
  50. Muraoka, H.; Kamata, H. Displacement distribution along minor fault traces. J. Struct. Geol. 1983, 5, 483–495. [Google Scholar] [CrossRef]
  51. Jackson, C.; Bell, R.; Rotevatn, A.; Tvedt, A. Techniques to determine the kinematics of synsedimentary normal faults and implications for fault growth models. Geol. Soc. Lond. Spec. Publ. 2016, 439, 187–217. [Google Scholar] [CrossRef]
  52. La Bruna, V.; Agosta, F.; Lamarche, J.; Viseur, S.; Prosser, G. Fault growth mechanisms and scaling properties in foreland basin system: The case study of Monte Alpi, Southern Apennines, Italy. J. Struct. Geol. 2018, 116, 94–113. [Google Scholar] [CrossRef]
  53. Erslev, E.A. Trishear fault-propagation folding. Geology 1991, 19, 617–620. [Google Scholar] [CrossRef]
  54. Withjack, M.O.; Olson, J.; Peterson, E. Experimental-models of extensional forced folds. Aapg Bull.-Am. Assoc. Pet. Geol. 1990, 74, 1038–1054. [Google Scholar] [CrossRef]
  55. Coleman, A.J.; Duffy, O.B.; Jackson, C.A.L. Growth folds above propagating normal faults. Earth-Sci. Rev. 2019, 196, 102885. [Google Scholar] [CrossRef]
  56. Hardy, S.; McClay, K. Kinematic modelling of extensional fault-propagation folding. J. Struct. Geol. 1999, 21, 695–702. [Google Scholar] [CrossRef]
  57. Jin, G.H.; Groshong, R.H. Trishear kinematic modeling of extensional fault-propagation folding. J. Struct. Geol. 2006, 28, 170–183. [Google Scholar] [CrossRef]
  58. Hardy, S.; Ford, M. Numerical modeling of trishear fault propagation folding. Tectonics 1997, 16, 841–854. [Google Scholar] [CrossRef]
  59. Allmendinger, R.W. Inverse and forward numerical modeling of trishear fault-propagation folds. Tectonics 1998, 17, 640–656. [Google Scholar] [CrossRef]
  60. Yi, H.; Zhan, W.H.; Min, W.; Wu, X.C.; Li, J.; Feng, Y.C.; Ren, Z.K. A comparative study of source effect based on mini-multichannel seismic profile in marine active fault detection. Seismol. Geol. 2022, 44, 333–348. [Google Scholar] [CrossRef]
  61. Nabavi, S.T.; Fossen, H. Fold geometry and folding—A review. Earth-Sci. Rev. 2021, 222, 103812. [Google Scholar] [CrossRef]
  62. Yang, S.X.; Qiu, Y.; Zhu, B.D. Atlas of Geology and Geophysics of the South China Sea; China Navigation Publications Press: Tianjin, China, 2015. [Google Scholar]
  63. Bignami, C.; Valerio, E.; Carminati, E.; Doglioni, C.; Tizzani, P.; Lanari, R. Volume unbalance on the 2016 Amatrice—Norcia (Central Italy) seismic sequence and insights on normal fault earthquake mechanism. Sci. Rep. 2019, 9, 4250. [Google Scholar] [CrossRef]
  64. Doglioni, C.; Barba, S.; Carminati, E.; Riguzzi, F. Fault on-off versus strain rate and earthquakes energy. Geosci. Front. 2015, 6, 265–276. [Google Scholar] [CrossRef]
  65. Petricca, P.; Barba, S.; Carminati, E.; Doglioni, C.; Riguzzi, F. Graviquakes in Italy. Tectonophysics 2015, 656, 202–214. [Google Scholar] [CrossRef]
  66. Doglioni, C.; Barba, S.; Carminati, E.; Riguzzi, F. Fault on-off versus coseismic fluids reaction. Geosci. Front. 2014, 5, 767–780. [Google Scholar] [CrossRef]
  67. Savage, J.C.; Walsh, J.B. Gravitational energy and faulting. Bull. Seismol. Soc. Am. 1978, 68, 1613–1622. [Google Scholar]
  68. Albano, M.; Barba, S.; Bignami, C.; Carminati, E.; Doglioni, C.; Moro, M.; Stramondo, S.; Saroli, M. Three-dimensional numerical simulation of the interseismic and coseismic phases associated with the 6 April 2009, Mw 6.3 L’Aquila earthquake (Central Italy). Tectonophysics 2021, 798, 228685. [Google Scholar] [CrossRef]
  69. Albano, M.; Barba, S.; Bignami, C.; Carminati, E.; Doglioni, C.; Moro, M.; Saroli, M.; Samsonov, S.; Stramondo, S. Numerical analysis of interseismic, coseismic and post-seismic phases for normal and reverse faulting earthquakes in Italy. Geophys. J. Int. 2021, 225, 627–645. [Google Scholar] [CrossRef]
  70. Muldashev, I.A.; Pérez-Gussinyé, M.; Sobolev, S.V. Modeling of Continental Normal Fault Earthquakes. Geochem. Geophys. Geosystems 2022, 23, e2022GC010615. [Google Scholar] [CrossRef]
  71. Petricca, P.; Bignami, C.; Doglioni, C. The epicentral fingerprint of earthquakes marks the coseismically activated crustal volume. Earth-Sci. Rev. 2021, 218, 103667. [Google Scholar] [CrossRef]
  72. Bignami, C.; Valerio, E.; Carminati, E.; Doglioni, C.; Petricca, P.; Tizzani, P.; Lanari, R. Are Norm. Fault Earthq. Due Elastic Rebound Or. Gravitational Collapse? Ann. Geophys. 2020, 63, 1–15. [Google Scholar] [CrossRef]
  73. Carminati, E.; Bignami, C.; Doglioni, C.; Smeraglia, L. Lithological control on multiple surface ruptures during the 2016–2017 Amatrice-Norcia seismic sequence. J. Geodyn. 2020, 134, 101676. [Google Scholar] [CrossRef]
  74. Wang, Y. Heat flow pattern and lateral variations of lithosphere strength in China mainland: Constraints on active deformation. Phys. Earth Planet. Inter. 2001, 126, 121–146. [Google Scholar] [CrossRef]
  75. Zhou, D.; Yu, H.S.; Xu, H.H.; Shi, X.B.; Chou, Y.W. Modeling of thermo-rheological structure of lithosphere under the foreland basin and mountain belt of Taiwan. Tectonophysics 2003, 374, 115–134. [Google Scholar] [CrossRef]
  76. Brozzetti, F.; Mondini, A.C.; Pauselli, C.; Mancinelli, P.; Cirillo, D.; Guzzetti, F.; Lavecchia, G. Mainshock Anticipated by Intra-Sequence Ground Deformations: Insights from Multiscale Field and SAR Interferometric Measurements. Geosciences 2020, 10, 186. [Google Scholar] [CrossRef]
  77. Holland, M.; van Gent, H.; Bazalgette, L.; Yassir, N.; Strating, E.H.H.; Urai, J.L. Evolution of dilatant fracture networks in a normal fault—Evidence from 4D model experiments. Earth Planet. Sci. Lett. 2011, 304, 399–406. [Google Scholar] [CrossRef]
  78. Hardy, S. Discrete element modelling of extensional, growth, fault-propagation folds. Basin Res. 2018, 31, 584–599. [Google Scholar] [CrossRef]
  79. Jiang, Y.J.; Zhang, S.H.; Luan, H.J.; Wang, C.S.; Wang, D.; Han, W. Numerical simulation on the 3D surface dynamic contact characteristics of rock discontinuity subject to shear loading. J. China Coal Soc. 2022, 47, 233–245. [Google Scholar] [CrossRef]
  80. Alessi, R.; Freddi, F. Phase-field modelling of failure in hybrid laminates. Compos. Struct. 2017, 181, 9–25. [Google Scholar] [CrossRef]
  81. Ferrill, D.A.; Morris, A.P.; Smart, K.J. Stratigraphic control on extensional fault propagation folding: Big Brushy Canyon monocline, Sierra Del Carmen, Texas. Geol. Soc. Lond. Spec. Publ. 2007, 292, 203–217. [Google Scholar] [CrossRef]
  82. Deckers, J. Decoupled extensional faulting and forced folding in the southern part of the Roer Valley Graben, Belgium. J. Struct. Geol. 2015, 81, 125–134. [Google Scholar] [CrossRef]
  83. Okada, Y. Surface deformation due to shear and tensile faults in a half-space. Bull. Seismol. Soc. Am. 1985, 75, 1135–1154. [Google Scholar] [CrossRef]
Figure 4. (a) Interpretation of sparker source seismic reflection profile N9 (location in Figure 2), showing a topographic terrace, monoclinal folding, and a trishear deformation zone (light grey) above fault F1. (b) Airgun source seismic reflection profile W9 (location in Figure 2), showing basement-involved normal faults F1 and F2. Modified from Xia et al. [14]. The transparent blue area corresponds to the portion of the profile displayed in (a).
Remotesensing 17 02153 g004
Figure 5. (a) Amplitude of monoclinal folds labeled on profile N9. (b) Amplitude of compression folds labeled in the footwall of fault F1 on profile N9.
Remotesensing 17 02153 g005
Figure 6. The relationship between fold amplitude and depth on profile N9, with the best-fit regression line and correlation coefficient (R2) provided. Analyzed features include the following: (a) monoclinal folds at the tip of fault F1; (b) compression folds in the footwall of fault F1.
Remotesensing 17 02153 g006
Figure 7. (a) Enlarged view of the antithetic fault F2 on profile N9. (b) The relationship between fault throw and the depth of the antithetic F2 on the hanging wall of fault F1, with the best-fit regression line and correlation coefficient (R2) provided.
Remotesensing 17 02153 g007
Figure 8. Forward modeling of normal fault-propagation folds at the tip of fault F1. (a) Pre-deformation stage with undeformed stratigraphy and pre-defined fault geometry. (b) Fault phase 1: slip initiates on the main fault segment, producing initial displacement in deeper strata. (c) Period of quiescence 1: fault becomes inactive while sediments accumulate and fill earlier surface relief. (d) Fault phase 2: renewed slip occurs along the same fault segment as in (b), with upward propagation of deformation. (e) Period of quiescence 2: continued sedimentation during a second interval of fault inactivity. (f) Fault phase 3: slip is reactivated along the inherited fault, producing surface deformation while deep-seated displacement continues to accumulate. Red lines indicate fault segments that are in an active state of slip, black lines indicate fault segments that are inactive, and the area enclosed by two green dashed lines delineates the shallow deformation zone influenced by fault control. All panels are outputs from a forward numerical simulation under idealized boundary conditions. Modeling was performed using FaultFold V7 [59].
Remotesensing 17 02153 g008
Figure 9. Mohr circle evolution illustrates the stress path toward fault failure. Black circles represent interseismic stress states in which the minimum principal stress (σ3) progressively decreases, expanding the circle. Fault rupture is triggered when the circle tangentially contacts the red dashed failure envelope, which represents stable gravitational and frictional thresholds. The red circle marks coseismic stress release. Modified from Carminati et al. [73].
Remotesensing 17 02153 g009
Figure 10. Activity pattern of fault F1 offshore of Nan’ao. (a) Monocline fold amplitude versus depth (based on Figure 8f), highlighting two quiescent periods between three phases of fault slip. (b) Mohr circle evolution indicates stress accumulation and shorter recurrence intervals under sedimentary loading.
Remotesensing 17 02153 g010
Figure 11. Conceptual model of a spontaneous gravity-driven seismic cycle in the offshore Nan’ao region. (a) Initial stable phase under vertical compressive stress (σ1). (b) Stress accumulation phase with minor brittle layer deformation. (c) Coseismic slip is triggered upon reaching the critical stress threshold. (d) Stress release and return to a new interseismic period.
Remotesensing 17 02153 g011
Figure 12. Coseismic deformation model for the LFZ offshore of Nan’ao. The cross-section is constructed using seismic reflection profiles N9 and W9. Red stars mark the projection of the 1918 M7.3 earthquake epicenter [6]. Crustal velocity structure is based on Xia et al. [14]. Small circles represent seismic events (2018–2023) within 9 km of profile N9 (Fujian Earthquake Agency). Red single-sided arrows show fault slip; blue arrows show interlayer slip; dashed black arrows indicate soft material extrusion.
Remotesensing 17 02153 g012
Table 1. The main parameters of the seismic acquisition system.
Seismic SourceMinimum Offset
/m
Number of CoverageSample Interval
/ms
Receptor Interval
/m
Shot Interval
/m
Source Sinking Depth
/m
Cable Sinking Depth
/m
sparker
2000 J
0120.23.1256.250.40.3
Disclaimer/Publisher’s Note: The statements, opinions and data contained in all publications are solely those of the individual author(s) and contributor(s) and not of MDPI and/or the editor(s). MDPI and/or the editor(s) disclaim responsibility for any injury to people or property resulting from any ideas, methods, instructions or products referred to in the content.

