Article

Spatiotemporal Variation in Fractional Vegetation Coverage and Quantitative Analysis of Its Driving Forces: A Case Study in the Tabu River Basin, Northern China, 1986–2023

1
Yinshanbeilu Grassland Eco-Hydrology National Observation and Research Station, China Institute of Water Resources and Hydropower Research, Beijing 100038, China
2
State Key Laboratory of Simulation and Regulation of Water Cycle in River Basin, China Institute of Water Resources and Hydropower Research, Beijing 100038, China
3
Institute of Water Resources for Pastoral Area, China Institute of Water Resources and Hydropower Research, Hohhot 010020, China
*
Author to whom correspondence should be addressed.
Remote Sens. 2025, 17(14), 2490; https://doi.org/10.3390/rs17142490
Submission received: 11 June 2025 / Revised: 15 July 2025 / Accepted: 15 July 2025 / Published: 17 July 2025

Abstract

The Tabu River Basin (TRB) is one of the most ecologically fragile areas in the arid regions of northern China; it is a key component of the desert steppe north of the Yinshan Mountains. The fractional vegetation coverage (FVC) represents a vital indicator of ecological health in the TRB. In this study, we explored the impacts of climate change and human activities on vegetation growth and utilized Landsat data (30 m) from the Google Earth Engine to generate a long-term FVC dataset (1986–2023) in the TRB. Furthermore, we established a framework for quantitatively identifying the effects of climate change and anthropogenic activities on the FVC in desert steppe regions. The results revealed that: (1) the FVC exhibits considerable spatial heterogeneity, with higher values observed in the southeastern and southwestern areas and lower values in the northern part; (2) over the past 38 years, the annual average FVC has shown fluctuations, with a slight declining trend, while the Hurst exponent indicates a reverse persistence pattern in the FVC across the TRB; and (3) the correlation between the FVC and the temperature is marginally stronger than that with precipitation, and the influence of climate change on promoting the FVC outweighs the role of human activities. These results offer valuable insights for ecological restoration and sustainable development efforts and provide scientific support for monitoring vegetation in the region.

Graphical Abstract

1. Introduction

Rising global temperatures and intensified human activities may exert positive or negative effects on terrestrial ecosystems [1,2,3]. Vegetation is recognized as a critical component of terrestrial ecosystems, exerting a crucial influence on climate modulation, facilitating water and carbon cycles, and maintaining ecosystem stability [4,5,6,7]. The patterns of vegetation distribution exhibit significant regional differences and are influenced by factors such as climate change, human activities, and soil features [8,9,10,11]. Consequently, numerous academics have striven to dissect the contributions of various factors driving vegetation growth under global climate change [12].
The normalized difference vegetation index (NDVI) is a pivotal component of terrestrial ecosystems that is utilized to study vegetation coverage, spatial distribution, phenological phases, and responses to driving factors [13,14]. The efficacy of the NDVI in regions characterized by diverse vegetation coverage is constrained, primarily because of two distinct phenomena: surface heterogeneity in sparsely vegetated regions and “oversaturation” in densely vegetated zones [15,16,17]. Among various vegetation monitoring indicators, the fractional vegetation cover (FVC) has become one of the most important parameters for measuring vegetation growth [18] due to its intuitiveness and representativeness [19]. Defined as the fraction of the vertical projection of the vegetation canopy within a specified unit area, the FVC provides a standardized measure that facilitates comparative analysis across diverse ecosystems [20]. As an “indicator” of regional environmental changes, the vegetation coverage has been widely used to monitor dynamic changes in terrestrial ecosystems [18] and has become a core quantitative measure of land vegetation ecosystem changes. The commonly used methods for analyzing FVC trends include a regression analysis and a Theil–Sen slope analysis combined with the Mann–Kendall test [21]. In this study, we consolidated the Mann–Kendall test, the Theil–Sen slope, and the Hurst exponent to scrutinize the trends, statistical importance, and anticipated projections of vegetation change [22]. Due to its capacity to offer uninterrupted data sequences, remote sensing technology has arisen as a highly prospective method for monitoring vegetation development [23]. Typically, remote sensing images along with their derived products are applicable for estimating the FVC, which holds substantial advantages for monitoring the vegetation variation in vast watersheds, urban clusters, and grassland regions [24]. With the aid of the GEE, the FVC can be rapidly, batch-processed, and uniformly evaluated, thus enabling long-term dynamic observation of vegetation [25,26].
Numerous studies have delved deeply into the mechanisms by which various driving factors influence vegetation growth [27,28]. Climatic factors profoundly shape the growth dynamics and distribution patterns of regional vegetation, resulting in marked spatial heterogeneity [29,30]. In China, the influence of climatic factors on vegetation clearly displays regional heterogeneities. In cold and humid areas, low temperatures serve as a critical limiting factor for vegetation changes [31]. Conversely, within arid and semi-arid zones, there exists a positive correlation between vegetation development and precipitation [10]. Furthermore, the influence of human activities on vegetation dynamics is equally significant and continues to deepen and expand. Generally, variations in land use/land cover, the enforcement of relevant conservation measures, and the implementation of ecological restoration programs are considered typical manifestations of human activities affecting vegetation dynamics [12]. These factors exert far-reaching effects on vegetation growth, distribution, and succession by altering land use patterns and the ecological environment. The impacts of climate change and anthropogenic actions on vegetation patterns have been comprehensively investigated at various spatial scales [32]. Conventional regression techniques have the ability to discern linear correlations between vegetation dynamics and the driving factors but fail to account for autocorrelations among variables [33]. The residual trend analysis (based on multiple regression) approach, referred to as RESTREND, is regarded as a dependable methodology that indirectly estimates the influence of human activities by simulating the differences between the vegetation dynamics without human disturbance and the actual vegetation dynamics with anthropogenic disturbances [34,35,36]. This method has been employed to assess the impacts of climatic variables and anthropogenic actions on vegetation [37,38].
The Tabu River Basin (TRB) is one of the largest inland rivers in China and a vital part of the desert steppe on the northern foothills of the Yinshan Mountains, with the southern part being a typical agricultural–pastoral transition zone in arid and semi-arid regions. This area serves as an important ecological barrier in the arid and semiarid regions of northern China but is vulnerable to climate change and lacks the fortitude to sustain ecosystem equilibrium. Since the 1950s, socioeconomic development, overgrazing, and the expansion of urban areas have directly or indirectly disrupted the state of vegetation. Additionally, compared with other regions shown on the soil erosion map of China (http://www.resdc.cn), the TRB is severely affected by wind erosion. Different types of vegetation exhibit varying levels of resistance to soil erosion, and augmenting vegetation cover is advantageous for mitigating soil erosion [12]. Consequently, the enhancement of vegetation within the TRB contributes to ecological protection in northern China. A series of reforestation and grassland restoration projects have been implemented to improve the ecosystem services and promote sustainable human development. However, the contributions of various driving factors to vegetation growth changes in the TRB remain unclear. To address this research gap and the vegetation coverage changes in desert steppe areas, the aims of this research were as follows: (1) extract the FVC in the TRB from 1986 to 2023 on the GEE; (2) explore the spatiotemporal patterns and trends of the FVC; and (3) use a residual trend analysis to determine the contributions of each related factor to the vegetation variation. Research in this region is expected to improve the understanding of the interactions between human activities and climate factors, providing valuable references and recommendations for ecological protection.

2. Materials and Methods
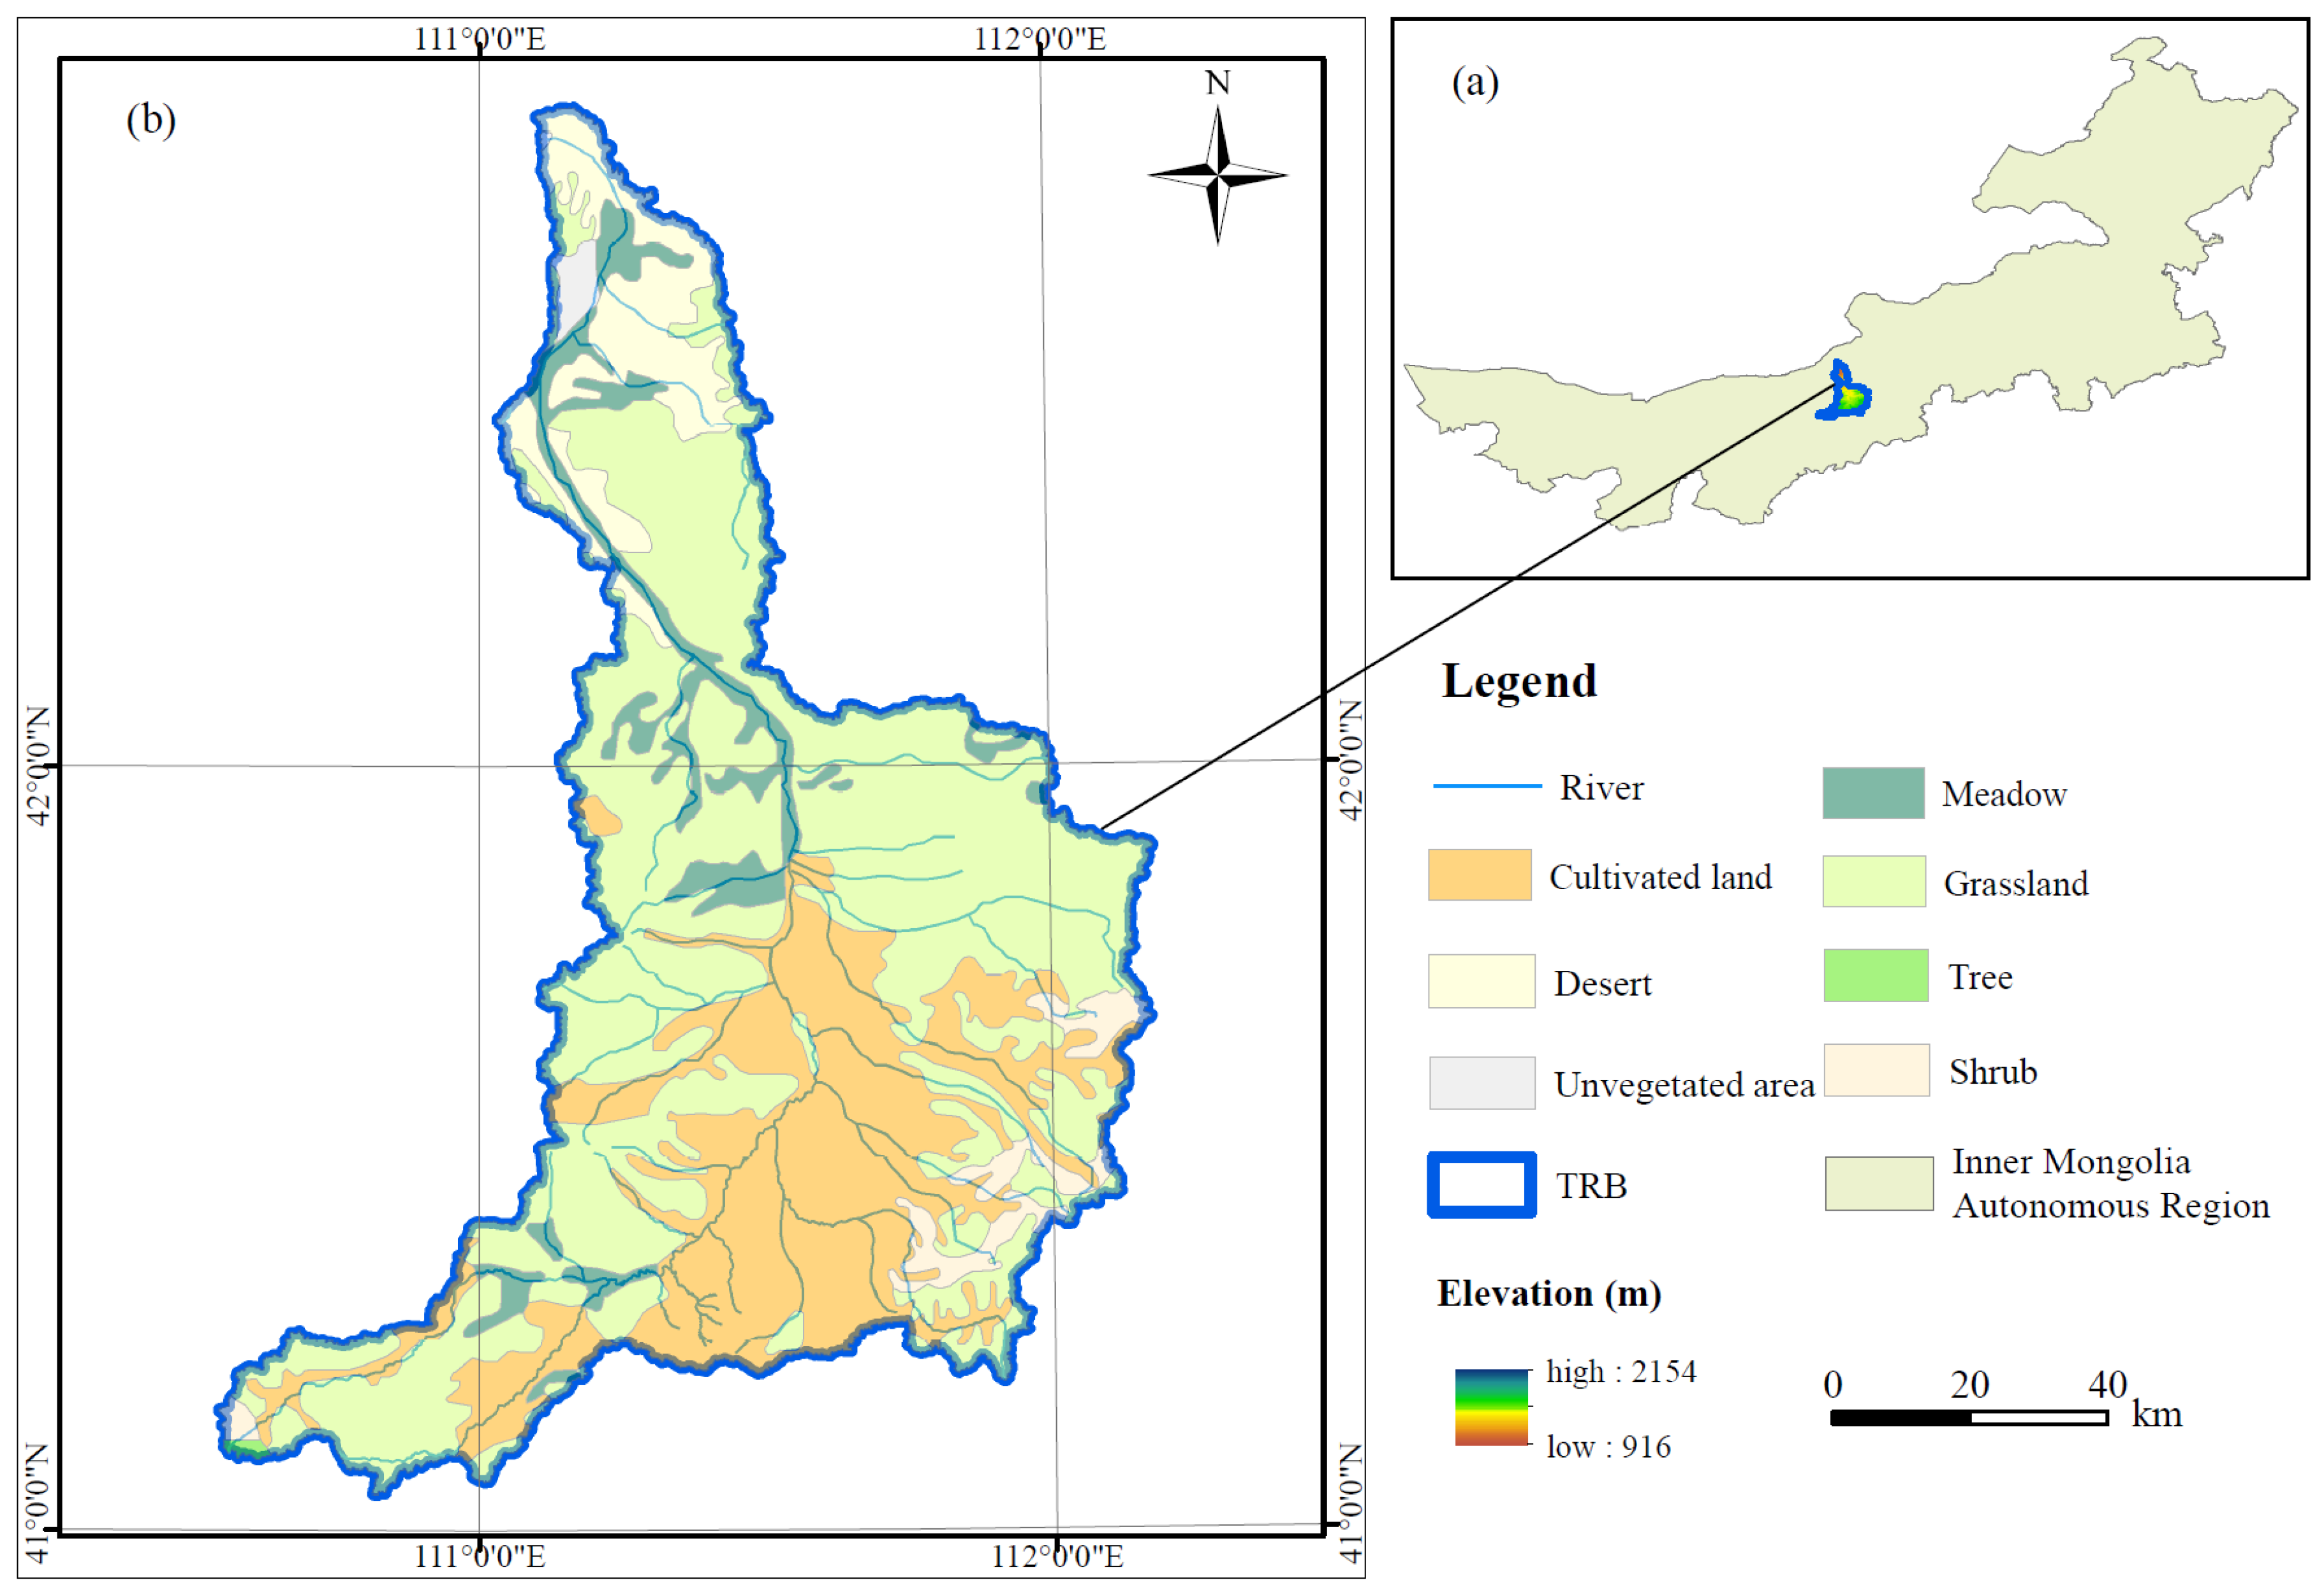
2.1. Study Area

The Tabu River, also known as the Xilamuren River, is one of the largest inland rivers in the Inner Mongolia Autonomous Region. The term “Tabu” is Mongolian, meaning “five”, as it is named for the convergence of five tributaries in its upper reaches. In its upper reaches, it is called the Zhaohe River; in the middle–upper reaches, it is the Dahei River; in the middle reaches, it is the Tabu River or Xilamulun River; and in the lower reaches, it is the Shaermulun River. The TRB is located in central Inner Mongolia and originates south of Housandaogou Village, Sailin Village Committee, Yinhao Town, Guyang County, Baotou City. It flows through Guyang County, Wuchuan County (Hohhot city), and Darhan-Muminggan Joint County (Baotou city), eventually emptying into Huhenur Lake in Siziwang Banner, Ulanqab City. It constitutes a classic confined inland river basin situated within the northern region (Figure 1a). The Tabu River is 332 km long, with an “S”-shaped course and an average gradient of 2.48‰. The study area is characterized by a mid-temperate semi-arid continental climate, with a multi-year average precipitation of 234.9 mm, showing a decreasing trend from south to north. Most precipitation occurs from July to September, accounting for approximately 80% of the annual total. The annual average temperature ranges from 1 °C to 6 °C and gradually increases from south to north as the elevation decreases. The average annual temperature in the southern mountains is less than 2 °C, whereas it reaches 6 °C in the northern regions. The coldest month of the year is January, with average temperatures ranging from −17 °C to −14 °C and a minimum temperature of −39 °C. Based on the data from the Third National Land Survey, grasslands make up 63.59% of the total basin area, while cultivated land accounts for 22.00%. Cultivated land is predominantly located in the mid-to-upper reaches of the basin, whereas grasslands are more extensively distributed, with concentrations in the mid-to-lower reaches and parts of the upper reaches (Figure 1b).

2.2. Datasets

The Landsat surface reflectance (SR) datasets are accessible through the United States Geological Survey (USGS), covering Landsat 5–7 (1986–2012) and Landsat 8–9 (2013–2023) and they were accessed via the GEE platform (https://code.earthengine.google.com/) (Figure 2). The data product underwent atmospheric rectification to eradicate inaccuracies resulting from atmospheric scattering, absorption, and reflection, with a spatial resolution of 30 m × 30 m.
Through the manipulation of the SRTM DEM data, the elevation was produced. The DEM data have a spatial resolution of 30 m. Meteorological data were retrieved from the National Tibetan Plateau Scientific Data Centre (https://data.tpdc.ac.cn). This dataset comprises monthly precipitation and average temperature data at a resolution of 1 km from 1986 to 2023 [39]. Temperature and precipitation data for the TRB were obtained after clipping, resampling, and algebraic processing. The land use/land cover datasets utilized in this study comprised annual land cover datasets for China at a 30 m resolution, spanning the years 1985 to 2023. The datasets were developed by Professors Yang Jie and Huang Xin of Wuhan University [40]. All images were processed for raster projection and resampling using the raster and rgdal packages in R.

2.3. Methods

2.3.1. FVC Calculation

The NDVI is widely used to reflect large-scale vegetation cover and growth conditions [41]. The FVC derived from the NDVI can assist in mitigating the problem of NDVI saturation in areas with high vegetation coverage, as well as addressing the challenges in identifying regions with low vegetation coverage. In this study, on the basis of the GEE cloud platform, the Savitzky–Golay (S–G) smoothing algorithm was employed to remove noise [42], and the maximum value composite (MVC) approach was applied to reconstruct NDVI time series data from 1986 to 2023 [21].
The pixel dichotomy model serves as a swift and efficient approach for computing the FVC [43,44]. It hypothesizes that a pixel is made up of either vegetation or bare ground, and when a pixel is fully covered by vegetation or bare ground, it is labeled as S v e g or S s o i l , respectively.
The mathematical expression for computing the FVC relying on the NDVI is as follows:
S = S v e g × f c + ( 1 f c ) S s o i l
f c = S S s o i l S v e g + S s o i l
f c = N D V I N D V I s o i l N D V I veg + N D V I s o i l
where N D V I s o i l and N D V I veg represent the NDVI values of areas fully covered by bare soil and areas fully covered by vegetation, respectively. Therefore, precise values of N D V I s o i l and N D V I veg are crucial for calculating the FVC using the pixel dichotomy model. In this study, owing to the lack of field-measured endmember data and the unavoidable noise in satellite imagery, and considering the actual vegetation coverage conditions in the study area, the 5% and 95% confidence intervals of the NDVI values for each period were chosen as the endmembers for NDVIsoil and NDVIveg, respectively [45].
On the basis of Classification and Grading Standards for Soil Erosion [46] and relevant studies [21,47], vegetation coverage is categorized into five classes corresponding to distinct landscape types (Table 1).

2.3.2. Sen’s Slope and Mann–Kendall Test

Sen’s slope analysis is a robust non-parametric statistical method that is not easily affected by measurement errors or grouped data [48,49]. This method has been widely applied to investigate slope trends in meteorological and hydrological time series data [50].
The Mann–Kendall (M–K) test serves as a commonly used non-parametric trend detection tool that is often applied to discern monotonic tendencies in time series of climatic, hydrological, or environmental data [51,52]. It has recently been introduced into vegetation change studies [53]. The combination of Sen’s slope and the Mann–Kendall (M–K) test was used to discern upward or downward tendencies in the vegetation coverage throughout the research duration [54]. This integration significantly improved the data’s resistance to noise interference, and the analyzed data series do not need to possess specific distribution characteristics [55].
The equation for Sen’s slope is as follows:
s l o p e = M e d i a n ( F V C j F V C i j i )
where 1 < i < j < n, such that n stands for the number of years during the research period, amounting to 38, and the median denotes the median function. When s l o p e > 0 or s l o p e < 0, there is an increasing or decreasing tendency in the vegetation coverage, respectively. Larger absolute values of s l o p e indicate faster changes in the vegetation coverage.
The formulas for the Mann–Kendall test are presented in Equations (5)–(8):
S = j n 1 i = j + 1 n sgn ( F V C j F V C i )
sgn ( F V C j F V C i ) = 1 F V C j F V C i > 0 0 F V C j F V C i = 0 1 F V C j F V C i < 0
Z = S 1 V a r ( S )   ( S > 0 )     0 ( S = 0 ) S + 1 V a r ( S ) ( S < 0 )
V a r ( S ) = n ( n 1 ) ( 2 n + 5 ) 18
where S stands for the correlation coefficient associated with the M–K test; Z signifies the significance index, which has a range of (−∞, +∞) and follows a standard normal distribution.

2.3.3. The Future Trend of the FVC

The Hurst exponent (H), initially proposed by Hurst [56] and later refined by Mandelbrot and Wallis [57], serves as a statistical measure used to detect the presence of long-term dependence in continuous time series data [58]. It has been widely applied across various fields and numerous vegetation studies [53,59,60]. When 0 < H < 0.5, it indicates future trend reversal; when H = 0.5, it suggests unpredictable variation; and when 0.5 < H < 1.0, it denotes trend continuation [61]. To estimate the annual FVC time series for the study area, the Hurst exponent was calculated using the average FVC data.
The calculation formulas are as follows (Equations (9)–(13)):
The mean sequence of the FVC is as follows:
F V C ( τ ) ¯ = 1 τ t = 1 τ F V C ( τ ) , τ = 1 , 2 , 3 , n
The cumulative deviation U ( t , τ ) is as follows:
U ( t , τ ) = t = 1 τ ( F V C ( τ ) F V C ( τ ) ¯ ) ,   1 t τ
The span ( R τ ) is expressed as follows:
R τ = max U ( t , τ ) min U ( t , τ )
The standard deviation ( S ( τ ) ) is as follows:
S ( τ ) = 1 τ t = 1 τ ( F V C ( τ ) F V C ( τ ) ¯ ) 2
The calculation formula for the Hurst exponent is as follows:
R τ / S ( τ ) = ( a τ ) H
where H denotes the Hurst exponent, which has a value scope that exceeds 0 and is below 1.
The results of the Hurst exponent and Sen’s slope analysis are combined to obtain coupled data on the change trends and consistency. The results are classified into the following categories: (1) when the s l o p e < 0 and 0 < H < 0.5, it indicates a transition from decline to rise; (2) when the s l o p e < 0 and 0.5 < H < 1.0, it indicates a continuous decline; (3) when the s l o p e > 0 and 0 < H < 0.5, it indicates a transition from rise to decline; and (4) when the s l o p e > 0 and 0.5 < H < 1.0, it indicates a continuous rise, (5) when the s l o p e = 0 and H = 0.5, it indicates stabilization.

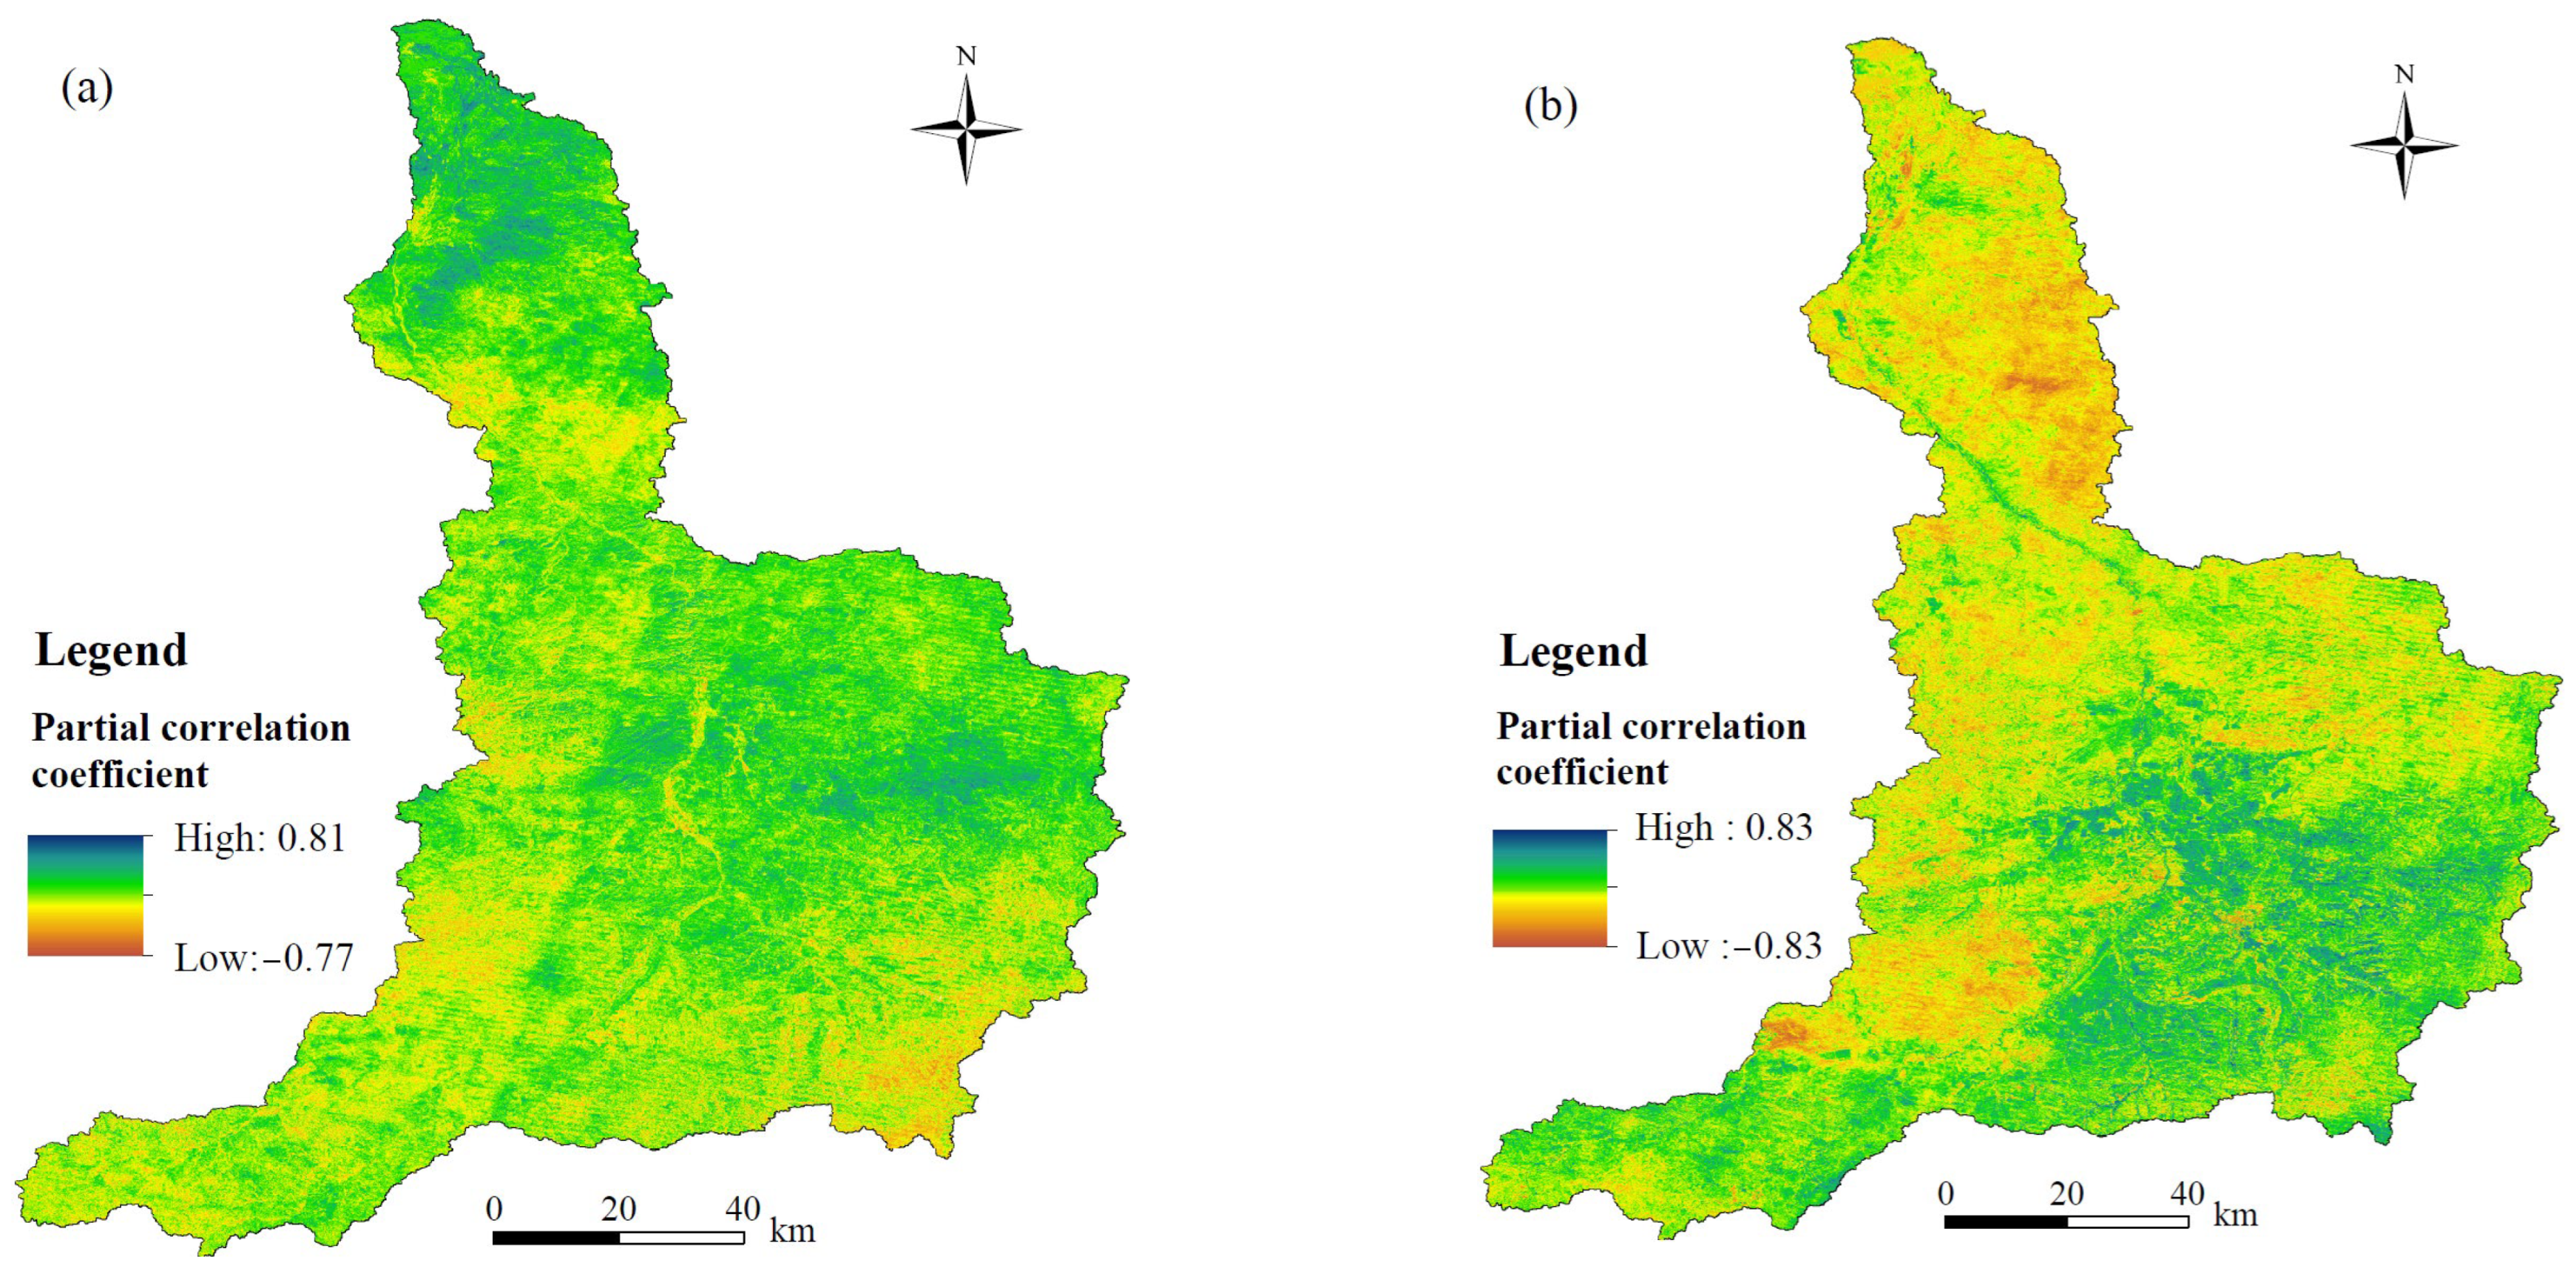
2.3.4. Partial Correlation Analysis

Partial correlation analysis was utilized to evaluate the relationship between climatic factors (temperature and precipitation) and the FVC, effectively eliminating the confounding effects of other variables [62,63]. The formula is calculated as follows:
r x y , z = r x y r x z r y z ( 1 r x z 2 ) ( 1 r y z 2 )
where rxy,z denotes the partial correlation coefficient between x and y, with z serving as the control variable. Meanwhile, rxy, rxz, and ryz denote the Pearson correlation coefficients between x and y, between x and z, and between y and z, respectively. In this study, x, y, and z represent the precipitation, temperature, and FVC, respectively.

2.3.5. Residual Trend Analysis

This study utilized a residual trend analysis to quantitatively assess and disentangle the contributions of climatic factors and anthropogenic forcing to FVC dynamics [34,64]. The main steps are outlined below:
(1) When the FVC is used as the dependent variable, and the temperature and precipitation are used as independent variables, a linear regression model is constructed to estimate the parameters within the model.
(2) By integrating the temperature and precipitation datasets with the calibrated regression model parameters, the climate-influenced FVC ( F V C C C ) is derived to quantify the vegetation response to climatic forcing.
(3) The variance between the observed FVC value ( F V C obs ) and the predicted FVC value ( F V C C C ) is computed, yielding the FVC residual ( F V C H A ), which signifies the influence of human activities on the FVC. The specific formulas are presented as follows:
F V C C C = α · T + β · P + ε
F V C H A = F V C obs F V C C C
F V C s lope = n × i = 1 n ( i × F V C i ) i = 1 n i i = 1 n ( F V C i ) n × i = 1 n i 2 i = 1 n i
C C C = slope ( F V C C C ) / slope ( F V C o b s )
C H A = slope ( F V C H A ) / slope ( F V C o b s )
where F V C C C and F V C obs represent the forecasted FVC value based on the regression model and the measured FVC value obtained from remote sensing imagery (both dimensionless), respectively; α , β , and ε denote parameters of the model; T and p represent the mean temperature and accumulated precipitation, with units of °C and mm, respectively; and F V C H A denotes the residual. F V C slope represents the slope of the univariate linear regression equation that fits the FVC with the time variable, n is the number of years, and i serves as the time variable. C H A and C C C represent the contributions of anthropogenic forcing and climatic factors to the interannual FVC variations, respectively. Moreover, the proportional contributions of anthropogenic forcing and climatic factors to FVC variations are shown in Table 2 [65].

3. Results

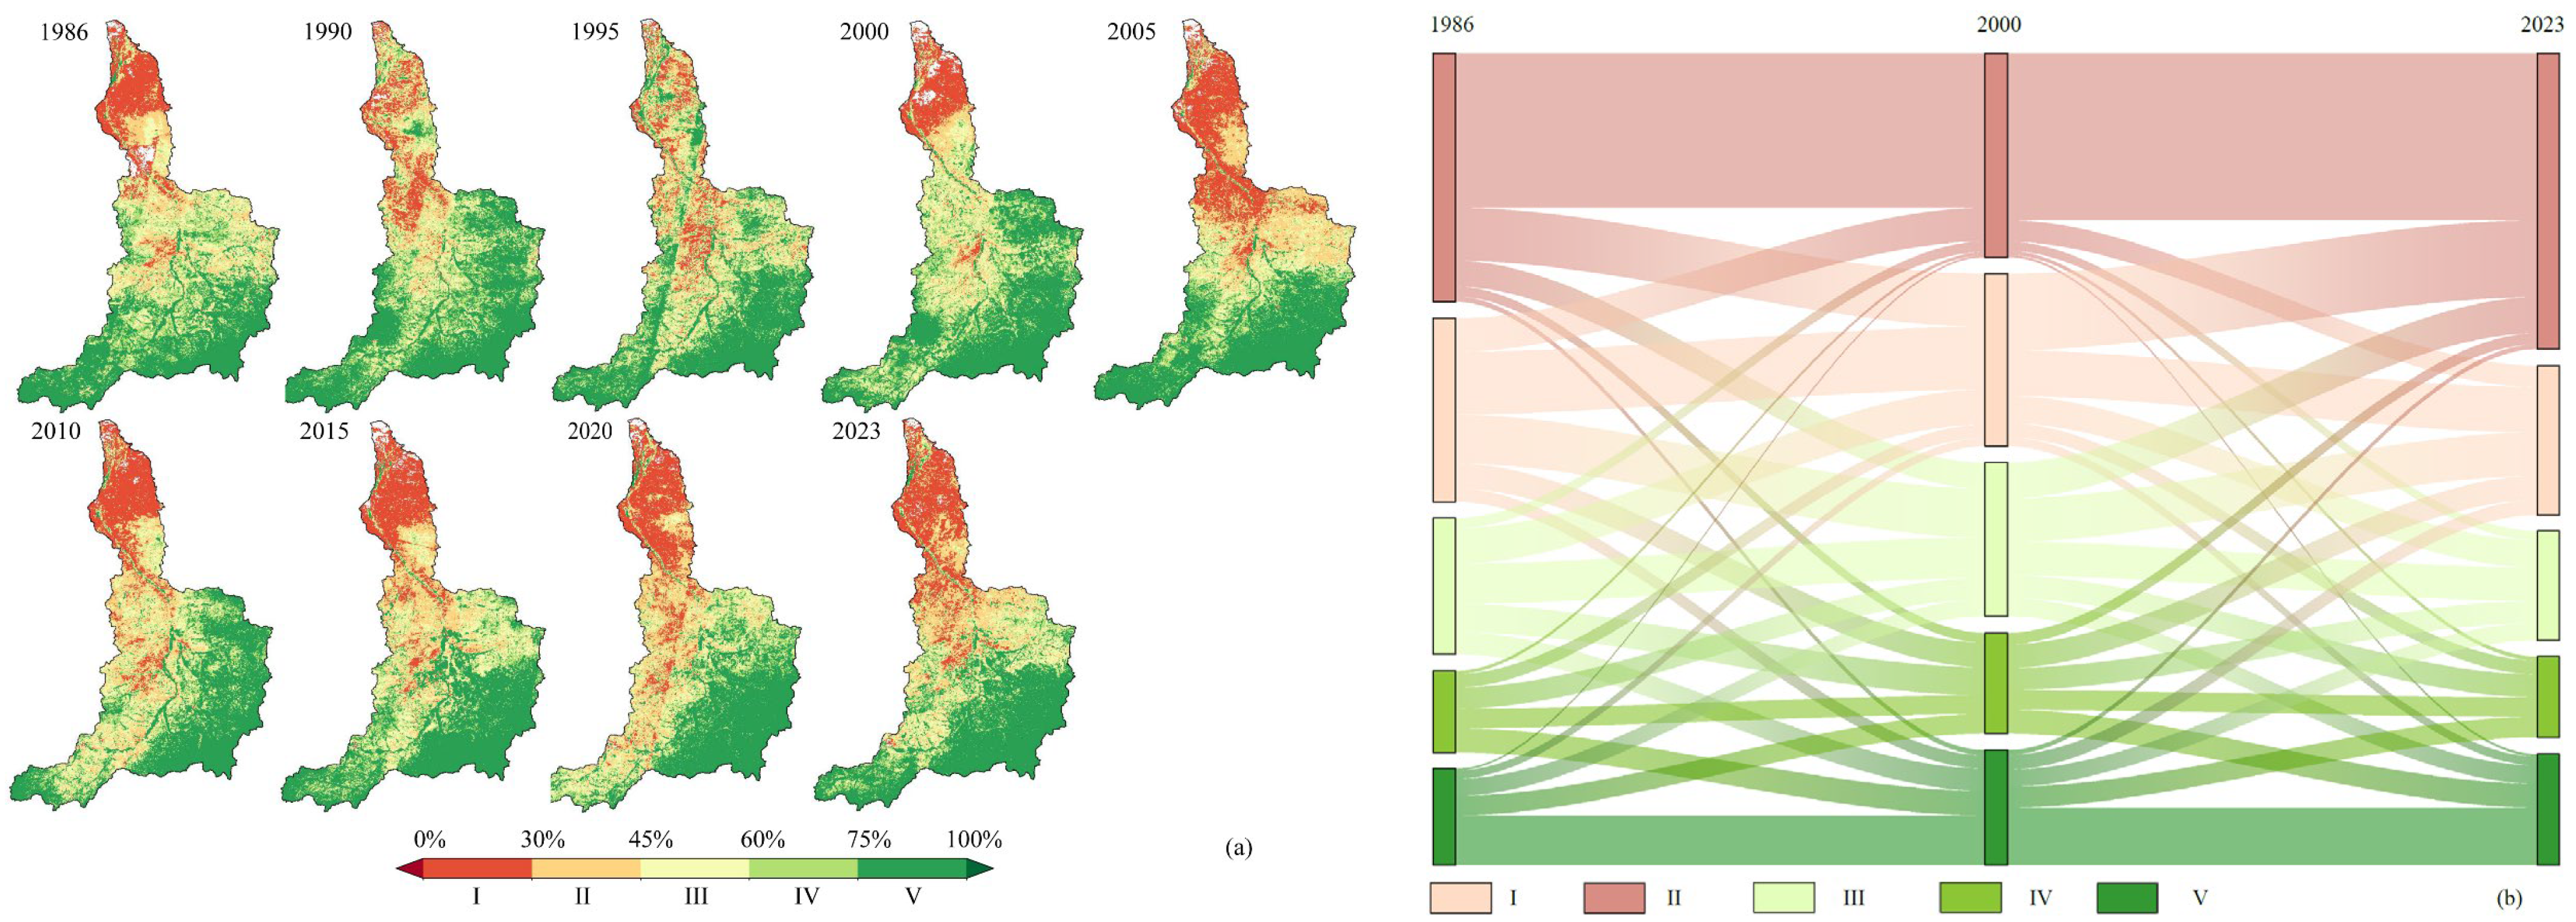
3.1. Spatiotemporal Variation Patterns in FVC

Figure 3a shows the spatial pattern of the FVC in the TRB from 1986 to 2023. Regions with higher FVC values are primarily located in the southeastern and southwestern regions of the TRB, whereas regions with lower FVC values dominate the northern part of the TRB. Class V of the FVC (high vegetation coverage) in 2000 and 2020 increased significantly and was primarily distributed in the central and southern parts of the TRB.
To precisely interpret the patterns in the FVC in the TRB over 1986–2023, the annual average FVC value was employed as an indicator of regional vegetation coverage. The annual average FVC exhibited a fluctuating yet relatively stable trend over the past 38 years (Figure 4a). In 1986, the FVC was 43.41%, which slightly decreased to 42.72% by 2023. During the 38-year period, there was a significant decrease in the FVC in 1996, which was likely associated with climate-related disasters. Taking the year 2000 as a turning point, the FVC showed a slight upward trend from 1986 to 2000, while it demonstrated a declining trend from 2001 to 2023. The execution of ecological policies in 1998, like the Grain for Grass/Forest Program, to some extent facilitated vegetation recovery. However, overgrazing has, to a certain extent, led to vegetation degradation. In 2012, the FVC reached its peak value of 54.90%, whereas the lowest value, 35.16%, was recorded in 1996.
A further analysis was conducted on the changing trends of the FVC in the TRB from 1986 to 2023 based on the FVC levels. The variation in the FVC levels revealed that Classes II, III, and IV experienced decreasing trends, with decreases of 4.22%, 3.94%, and 0.27%, respectively. In contrast, Classes I and V demonstrated notable increasing trends, with Class I increasing from 31.77% in 1986 to 38.14% in 2023 and Class V increasing from 13.45% in 1986 to 15.51% in 2023 (Figure 3b and Figure 4b). The observed FVC improvement trend in the TRB was primarily driven by the persistent increase in Class V vegetation cover.

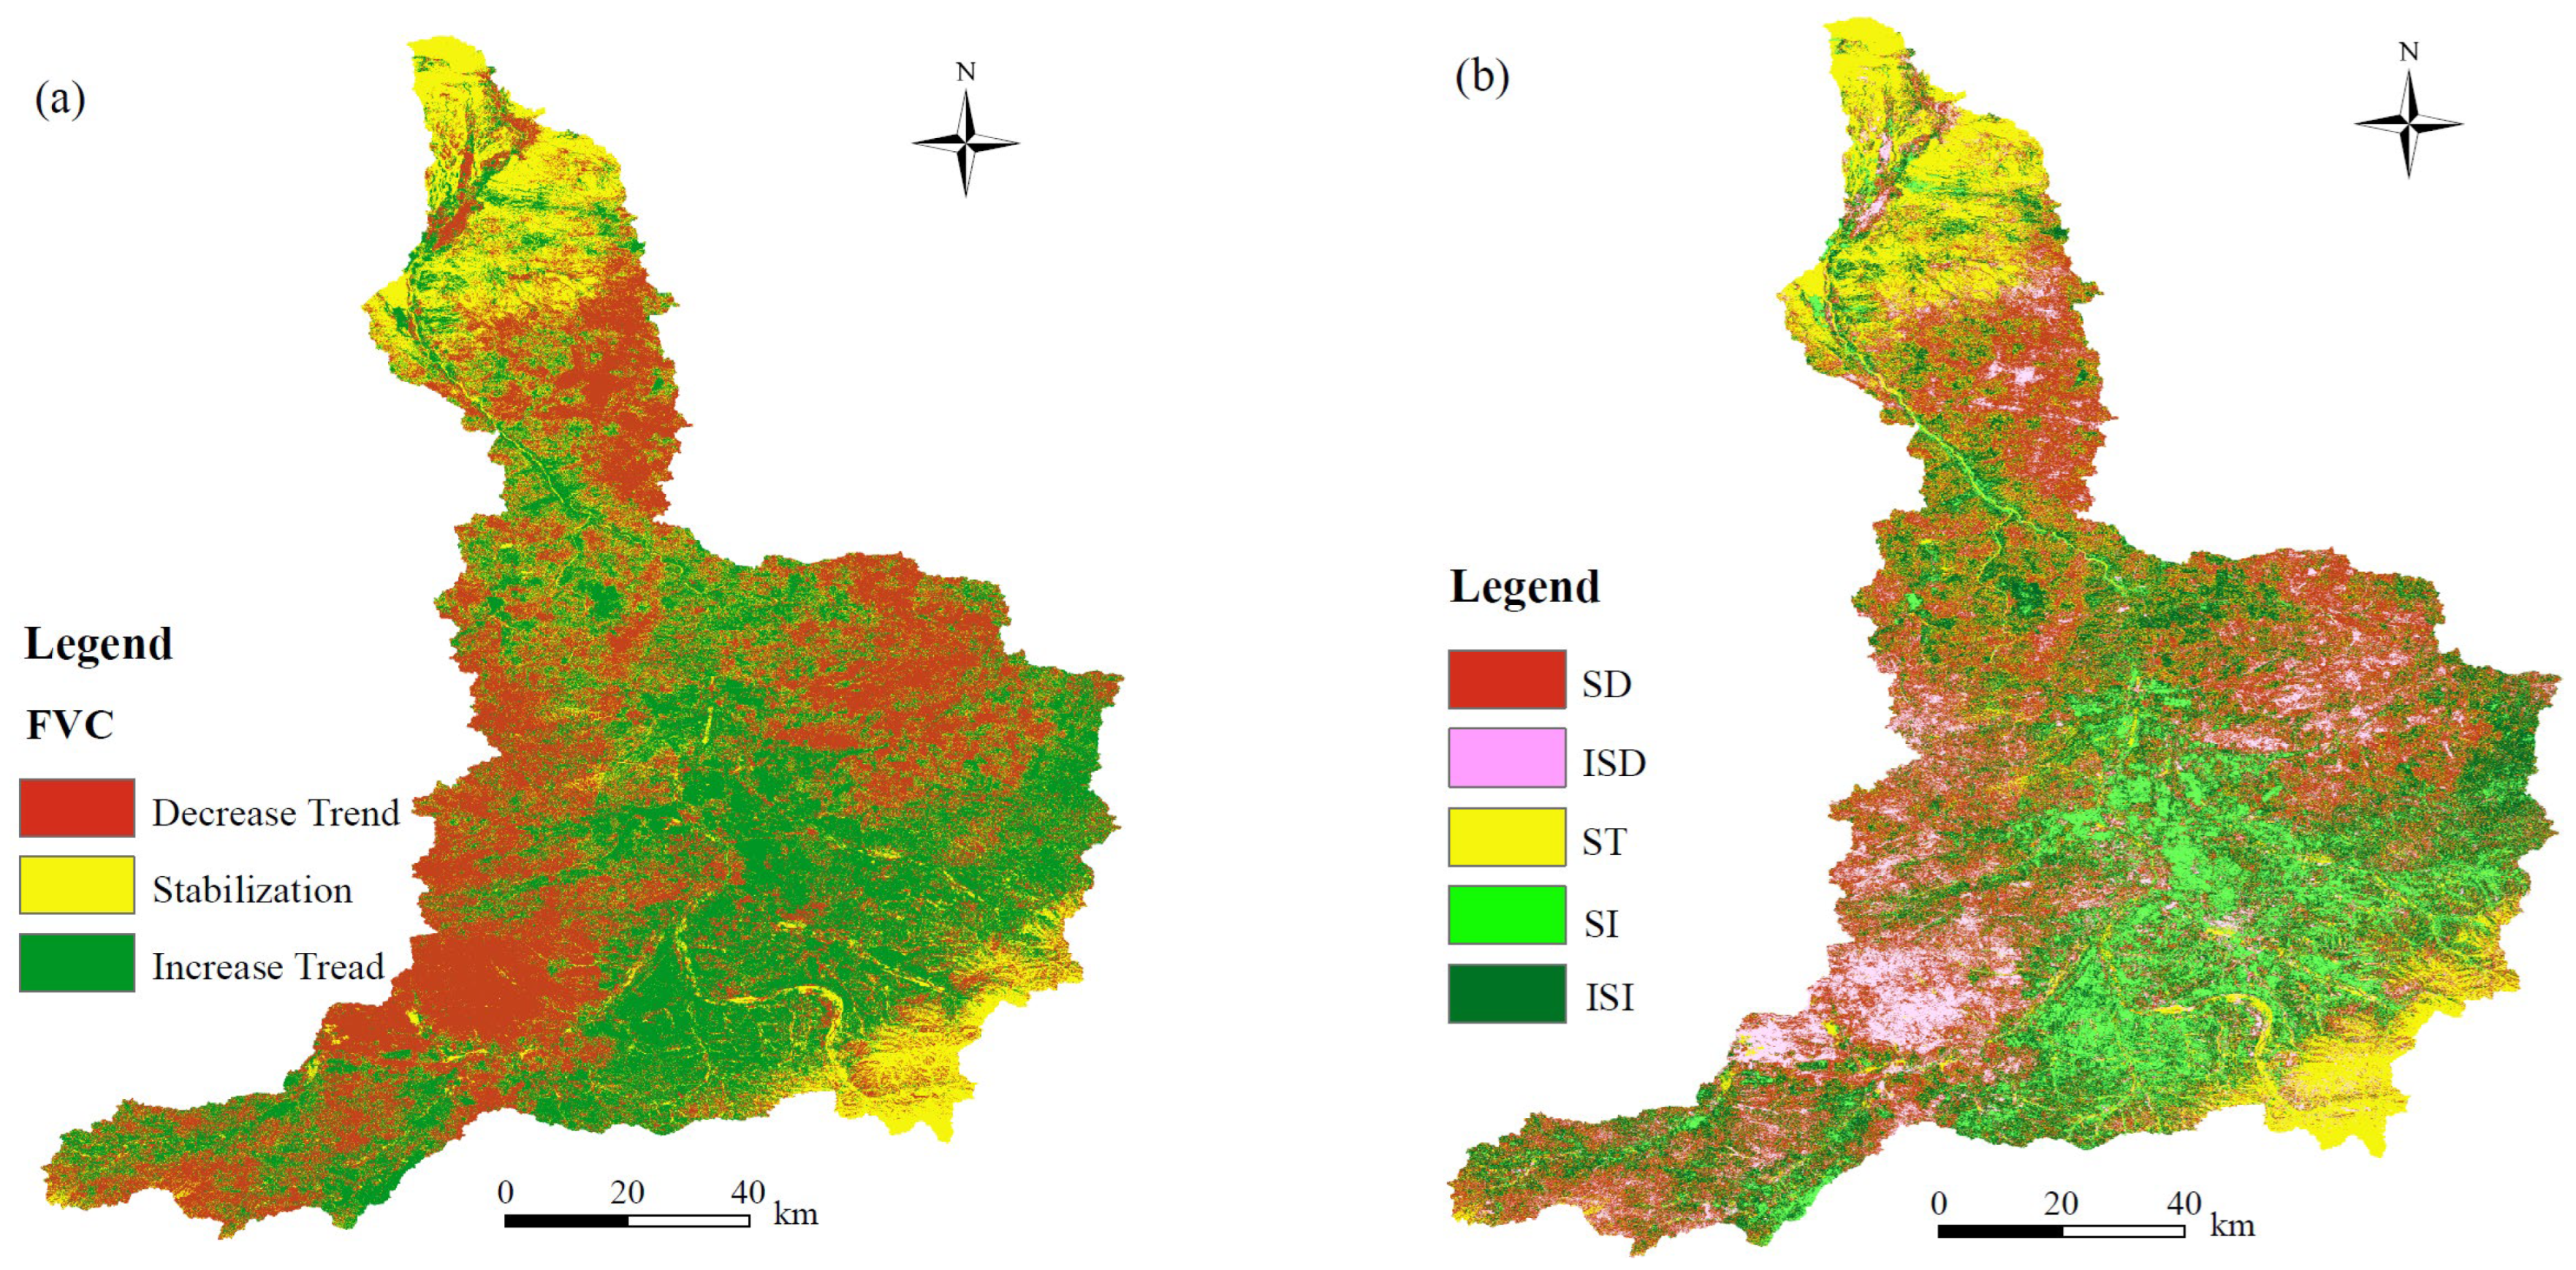
3.2. Analysis of Change Trend of FVC

3.2.1. Trend of FVC Change

On the basis of the results of Sen’s slope analysis, the FVC changes can be classified into three categories: SFVC < −0.0005, −0.0005 < SFVC < 0.0005, and SFVC > 0.0005, representing declining, stable, and ascending tendencies of the FVC, respectively. As shown in Figure 5a, the overall area with rising patterns was 5090.43 km2, and the overall area with falling patterns was 5796.46 km2, accounting for 36.58% and 41.66% of the TRB, respectively. Among the regions, the total areas with non-significantly decreased and significantly decreased FVC values were 1456.54 km2 and 4342.14 km2, respectively, accounting for 10.47% and 31.20% of the TRB (Figure 5b). The regions exhibiting a decline in the FVC were predominantly located in the western and central-eastern TRB, which are strongly affected by grazing. However, the overall area exhibiting a notable increase in the FVC was smaller compared to the overall area showing a marked decline. The total areas with a non-significantly increased and a significantly increased FVC were 1665.01 km2 and 3428.73 km2, respectively, accounting for 11.97% and 24.64% of the TRB (Figure 5b). The areas with vegetation restoration are predominantly situated along both banks of the Tabu River and are mostly agricultural land. In addition, in the northern and southeastern regions of the TRB, the FVC shows insignificant changes.

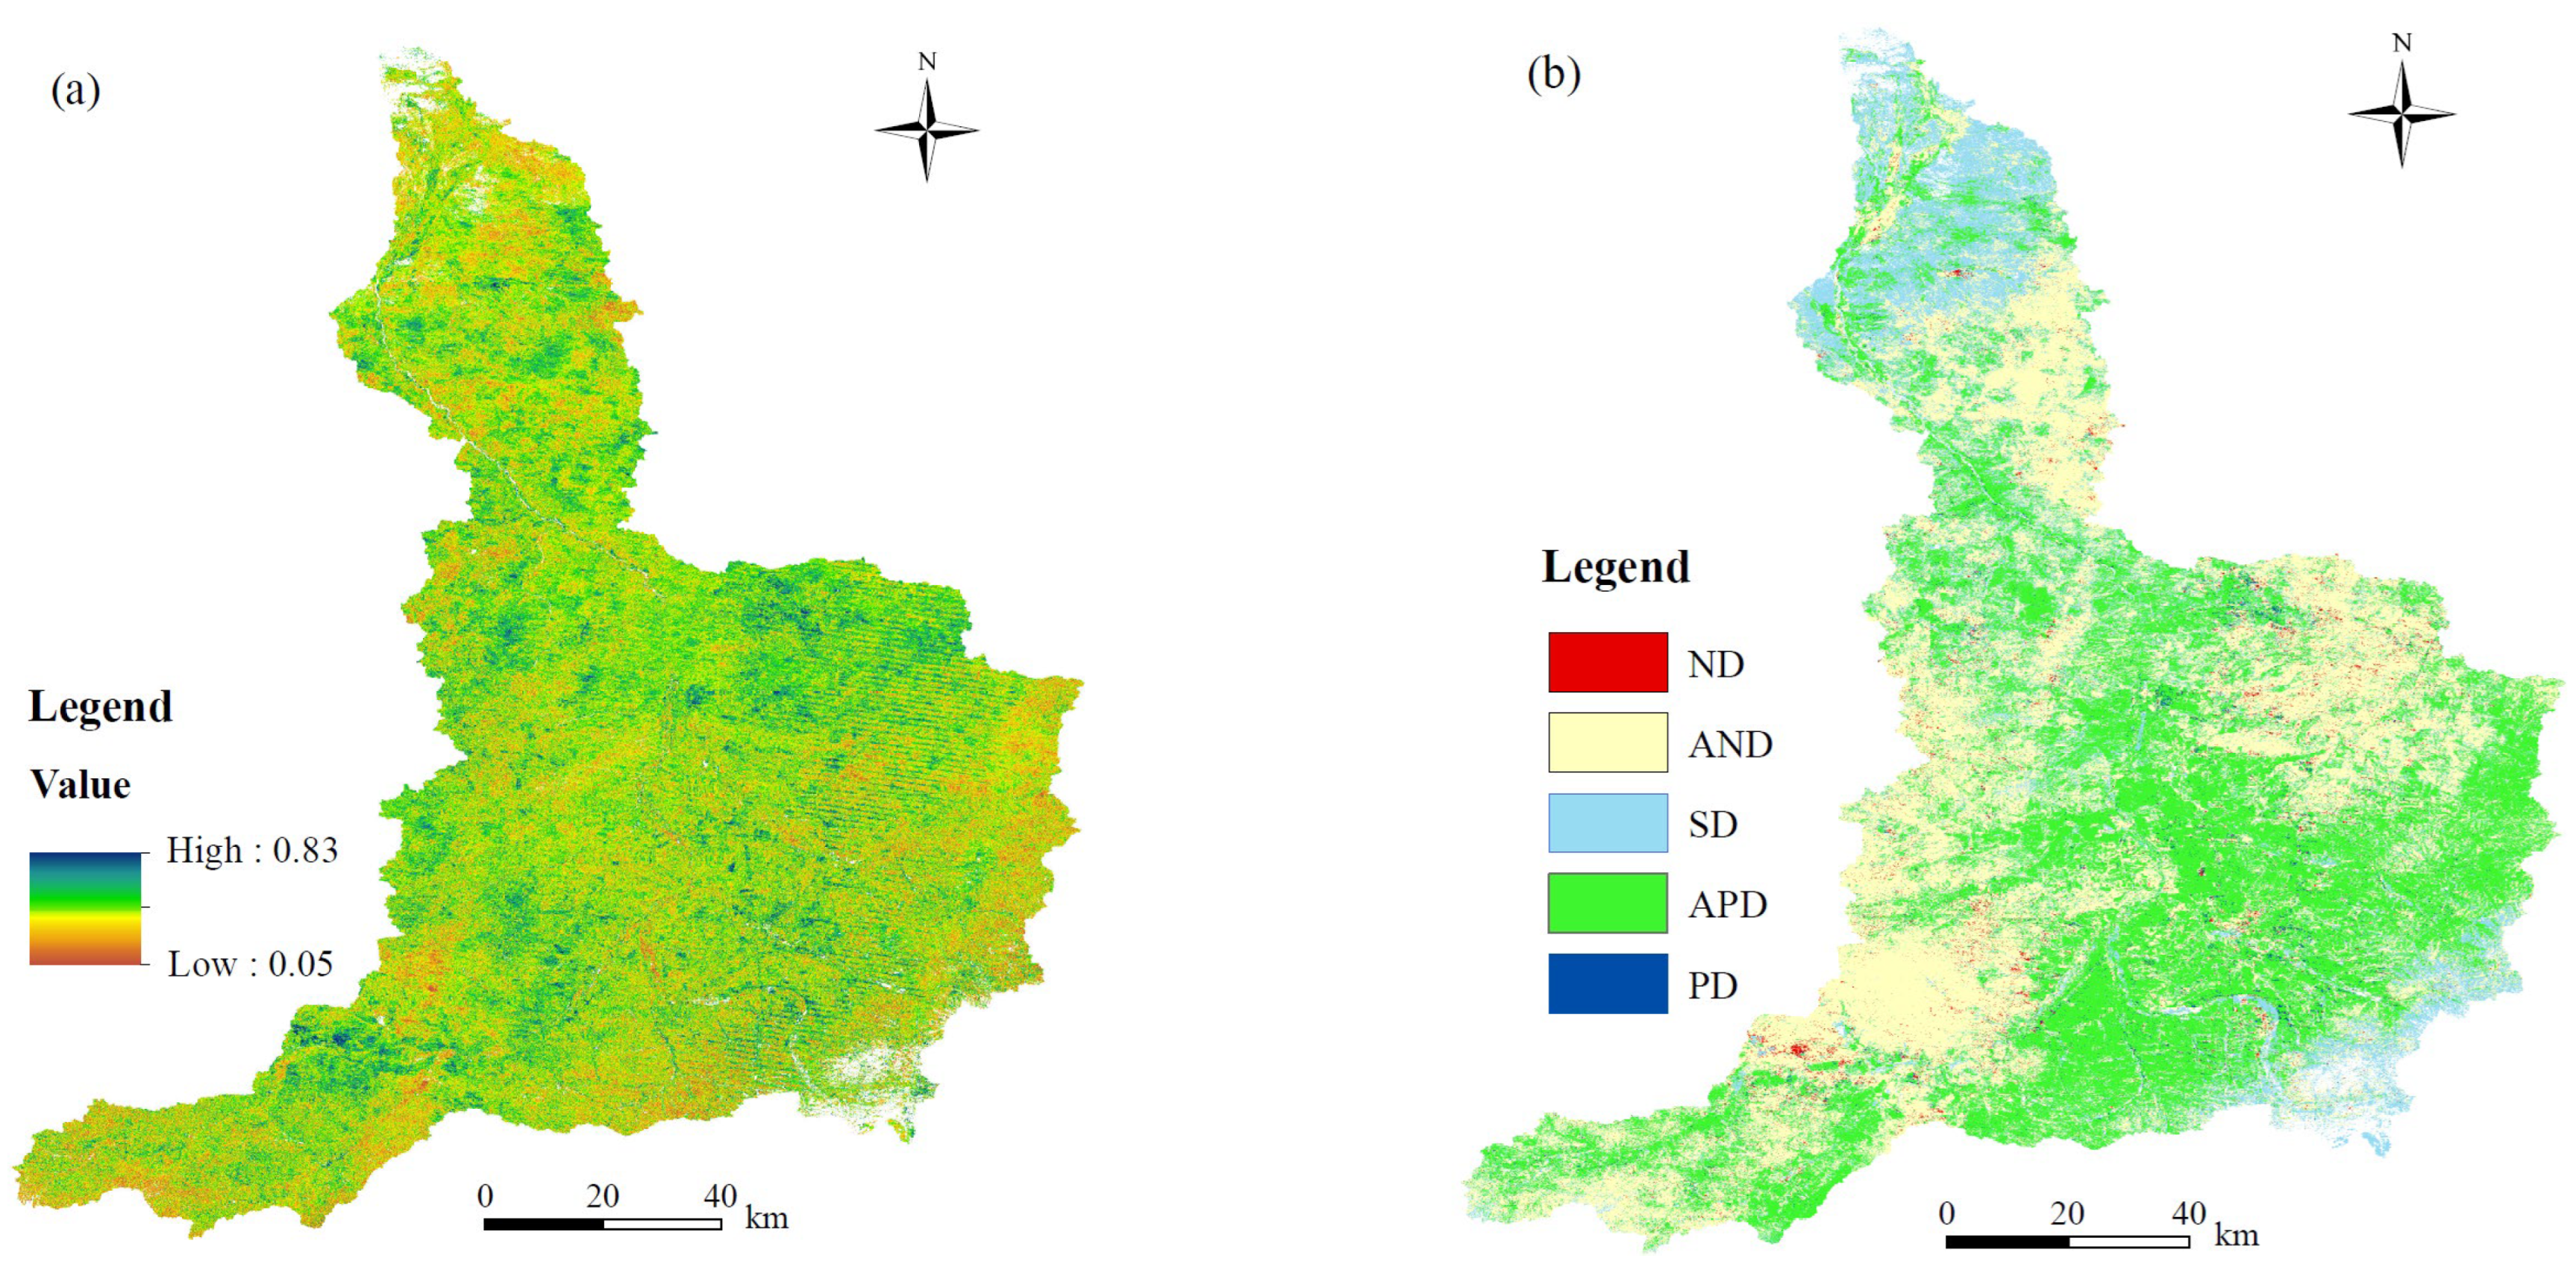
3.2.2. Sustainability of Vegetation Coverage

The future trend of vegetation dynamics in the TRB is inconsistent with the vegetation conditions from 1986 to 2023. This was confirmed by the Hurst exponent (H). In particular, the region showing H < 0.5 constituted 97.28% of the TRB, while the area exhibiting H > 0.5 comprised merely 2.72% (Figure 6a). The outcomes of the Hurst exponent and Sen’s slope analysis were combined to explore the sustainability of the FVC. The results, as shown in Figure 6b, indicate that the area where the FVC shifted from degradation to improvement was 5824.37 km2, and the area with continuous improvement was 133.67 km2, accounting for 41.86% and 0.95% of the TRB, respectively. In contrast, the area where the FVC shifted from improvement to degradation was 5155.60 km2, and the area with continuous degradation was 19.33 km2, accounting for 37.05% and 0.14% of the TRB, respectively. Given that the vegetation tendencies in the majority of regions will change, the distributions of increases and decreases in the FVC in the future will shift from the past trends. This means that, despite some areas experiencing the improvement or degradation of the FVC, overall, vegetation restoration and degradation coexist, and further challenges may be faced in regional improvement.

3.3. Impact of Climate Change on the FVC

The annual average precipitation in the TRB is 234.9 mm, showing a slightly increasing trend with significant interannual variation. The difference between the maximum precipitation (329.7 mm recorded in 2003) and the minimum precipitation (147.3 mm recorded in 2005) was 182.4 mm. Moreover, the annual average temperature is 4.5 °C, exhibiting an oscillatory ascending tendency during the past 38 years. The difference between the highest annual average temperature (5.6 °C in 2007) and the lowest (3.0 °C in 1986) is significant, reaching 2.6 °C (Figure 7b). Spatially, the distribution of precipitation varies drastically across the TRB, with higher precipitation mainly concentrated in the southeast and southwest. The temperature decreases from the northern to the southwestern parts of the TRB and is influenced primarily by topography. The lowest annual average temperature occurs in high-altitude mountainous zones in the southwest, whereas the highest temperature occurs at the northern tail of the Tabu River (Figure 7d).
The areas where the FVC exhibited a positive correlation with precipitation constituted 58.76% of the TRB, whereas the negatively correlated areas accounted for 41.24%. The regions that exhibit positive FVC–precipitation relationships were predominantly concentrated in the central and northern parts, whereas the regions with a negative correlation were principally located in the west and southeast (Figure 8a). In most parts of the TRB (62.27%), the FVC demonstrated a negative correlation with temperature (Figure 8b). The areas with positive correlations were primarily concentrated in the central-eastern and southwestern sectors of the TRB, while negative correlations predominantly occurred in the western desert steppe and the northern tail of the Tabu River. The topographic analysis revealed that the negatively correlated areas were mainly distributed in low-altitude areas. These findings suggest a marginally stronger coupling between the FVC and the temperature compared to the FVC–precipitation relationships across the TRB.

3.4. The Relative Contribution of Climate Factors and Human Activities to FVC

The area where the FVC exhibited an increasing trend, which was propelled by the impacts of climate change and human activities, encompassed approximately 25.97% of the TRB. The region where the FVC increased, which was solely attributed to climate change, accounted for approximately 8.71% of the total area and was predominantly located in the southeastern TRB. The area where the FVC increased, which was caused solely by human activities, accounted for approximately 17.82% of the total area and was chiefly located in the northern region. Additionally, the region where the FVC decreased, which was driven by the joint impacts of climate change and human activities, accounted for approximately 26.89% of the TRB and was primarily concentrated in the western and central TRB. The region where the reduction in the FVC was exclusively attributed to climate change accounted for approximately 14.34%, mostly in the central-northern part, whereas the area where the FVC decreased solely due to human activities accounted for 6.27%, indicating a scattered distribution pattern (Figure 9). Overall, a comprehensive analysis revealed that coupled climate–human dynamics have dominantly governed FVC variations across the TRB during 1986–2023.
The areas where climate change contributed positively to the FVC variation in the TRB constituted approximately 83.06% (Figure 10a). Among these, the areas where the contribution of climate change ranged between 40% and 60% and between 60% and 80% constituted a relatively large proportion, approximately 26.31% and 19.47% of the TRB, respectively; the areas where the contribution ranges from 20% to 40% accounted for approximately 16.99%, and these are mainly distributed in the middle and upper reaches of the TRB. The areas where climate change exerted a negative influence on the variation in the FVC comprised approximately 16.94% of the total area and were mainly distributed in the central-eastern and northern regions.
The areas where human activities contribute positively to the FVC variation in the TRB constituted approximately 80.66% of the total area (Figure 10b). Among these, the areas where the contribution rate of human activities ranged from 40% to 60% accounted for the largest proportion, approximately 24.87% of the TRB. The areas where the contribution ranged from 20% to 40% and from 60% to 80% accounted for 18.70% and 16.96% of the TRB, respectively. The areas with contribution rates exceeding 80% were mainly concentrated in the central-eastern and southwestern parts of the TRB. The areas where human activities contributed negatively to the FVC changes accounted for approximately 19.34% of the total area and were mainly distributed in the central-northern part of the TRB. In most areas, climate change demonstrated a more significant contribution to the FVC than anthropogenic influences.

4. Discussion

4.1. Spatiotemporal Distribution Characteristics of FVC

In the TRB, the areas with lower FVC values were mainly distributed in the central and northern parts. This finding is consistent with the local climate and land use types, as the central-northern TRB was characterized by the lowest rainfall and the highest temperatures, with the land use predominantly consisting of bare land. These climatic factors make these areas more suitable for the growth of low-lying grasslands, which resulted in lower FVC values across the central and northern TRB. In contrast, within the southeastern regions, the majority of the land is allocated for agricultural cultivation. These areas exhibited relatively higher humidity levels compared to the central-northern zones, which fosters a more favorable environment for plant growth. Consequently, this led to an elevated level of vegetation coverage.
During the preceding 38-year period, the annual average FVC in the TRB showed an overall fluctuating, but stable, trend. Using the year 2000 as a dividing point, it can be seen that the FVC showed a slightly ascending tendency from 1986 to 2000, whereas it showed a downward trend from 2001 to 2023. With the launch of ecological policies in 1998, including the Grain for Green Project, vegetation restoration was promoted, but subsequently, overgrazing intensified the vegetation damage. This finding is consistent with other studies in different grassland areas of Inner Mongolia [66]. The spatial pattern of the FVC trends indicates that, owing to the dominance of cultivated vegetation and frequent agricultural activities on both sides of the Tabu River, the vegetation changes on the riverbanks are relatively complex.
The Hurst exponent shows that the FVC exhibits a reverse persistence trend in the TRB. The ecosystems in the central-northern and western regions of the TRB exhibited a relatively high fragility and persisted in confronting pressure stemming from vegetation deterioration, which is affected by both natural processes and anthropogenic activities.

4.2. Effects of Climate Change and Human Activities on FVC Trends

4.2.1. Effects of Climate-Driven Changes on FVC Trends

Precipitation and temperature represent the dominant climatic drivers of vegetation cover dynamics. Numerous research investigations have demonstrated that climate change directly affects the physiological activities of vegetation growth. This study revealed that, compared with temperature, precipitation is the main factor affecting vegetation activity. For example, this is especially true in the central-northern TRB (precipitation < 200 mm) (Figure 7a). In arid regions, water resources, particularly precipitation, play a vital role in vegetation growth by driving photosynthesis and acting as a key driving force for vegetation development. The combined effects of temperature and precipitation helped maintain a balanced water status, supporting the establishment of a relatively stable ecosystem state reflected in the FVC. Moreover, to some extent, increasing temperatures may promote plant development [67]. However, certain research findings suggest that increasing temperatures can lead to increased plant respiration rates [68]. Research has shown that climate warming not only prolongs the vegetation growing season, but also expedites the breakdown of soil organic matter and the liberation of nutrient elements, thereby promoting plant growth (biomass accumulation) [69]. Given the established vegetation coverage–biomass correlation [70], climate-driven phenological changes exert predominantly positive effects on vegetation cover dynamics. However, climate change may also have certain negative impacts on vegetation. Rapid climate warming may exacerbate water resource scarcity issues in certain regions, thereby limiting vegetation growth [71].

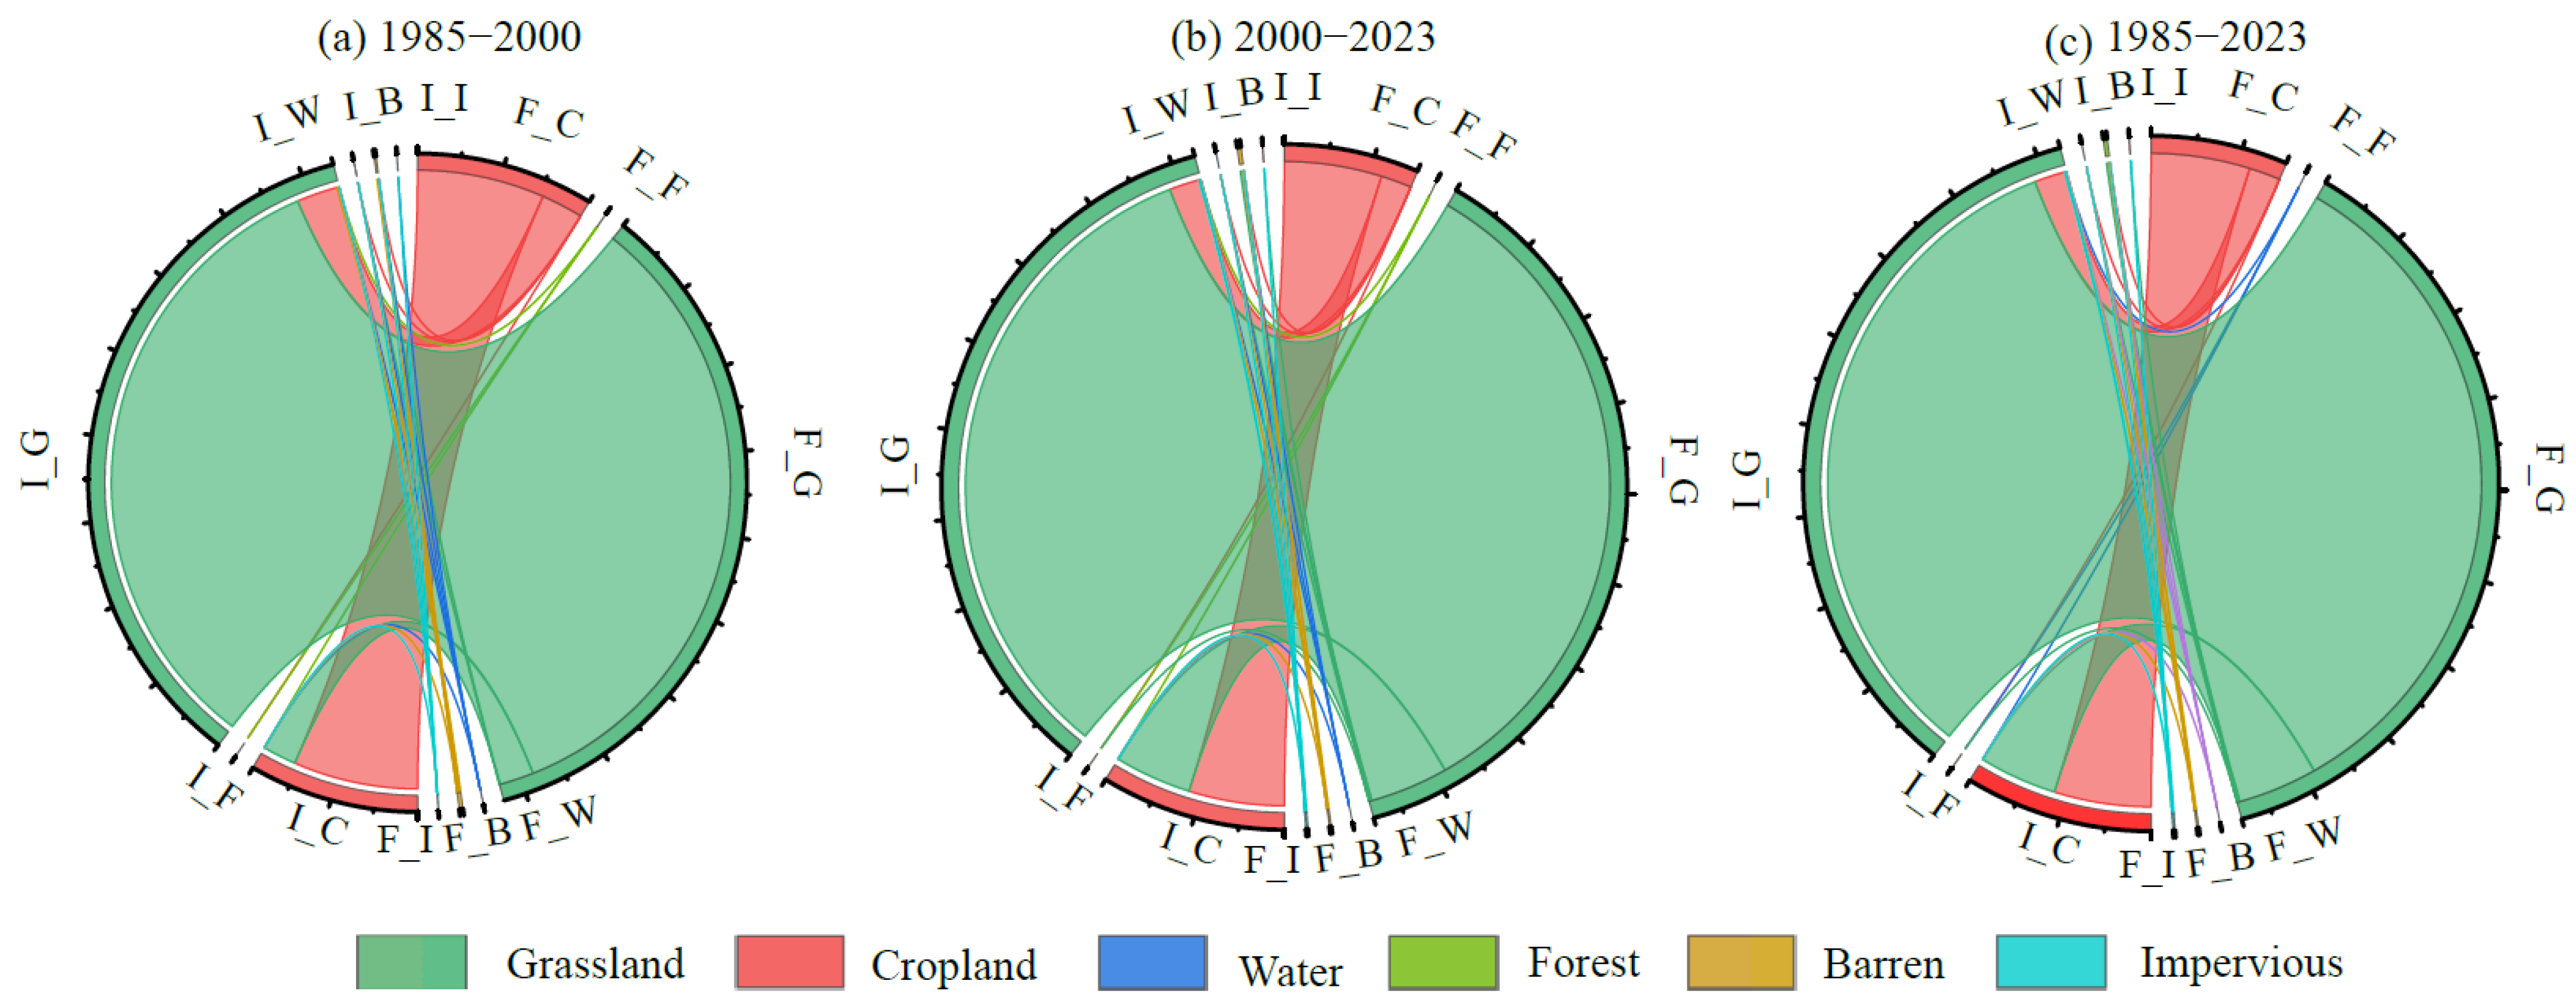
4.2.2. Effects of Anthropogenic Factors on FVC Trends

Land use/land cover (LULC) conversions and ecological rehabilitation initiatives are important human activities that affect vegetation dynamics and are crucial indicators of the intensity of human disturbance [12]. In the study area, cropland is distributed mainly on both sides of the rivers, while grasslands cover a relatively wide distribution, and forests are located in the mountainous regions at the edges of the TRB (Figure 11). From the perspective of LULC dynamic transitions (Figure 12), there is a trend of mutual conversion between grasslands and croplands. Cropland is the main reason for the variation in all LULC types, and the increase in grasslands is attributable mainly to the Grain for Green Project. In addition, anthropogenic activities, including the enhancement of agricultural management practices (e.g., irrigation and fertilization) and the execution of vegetation restoration initiatives (e.g., the Grain for Green Project) can significantly promote vegetation coverage on local and regional scales [72]. Piao et al. [73] reported that climate change exerts a negative influence on vegetation restoration in northern China, whereas greening projects play a crucial role in vegetation restoration, which aligns with the findings of this study. Despite some differences, these studies collectively underscore the significant function of human activities in regional vegetation changes.

4.3. Limitations and Future Work

This study focused primarily on the analysis of long-term vegetation change patterns. However, large-scale studies based on remote sensing imagery are currently still constrained by factors such as low temporal and spatial resolutions and cloud cover. Additionally, although a residual trend analysis has been broadly applied in studies to isolate anthropogenic impacts on the vegetation dynamics, several methodological limitations persist in its application. For example, how to appropriately select climatic factors (such as temperature and precipitation) when establishing multivariate regression equations for the associations between climatic factors and the vegetation coverage is unclear [74]. In analyses of human activities, specific aspects, such as vegetation construction, agricultural technology, and grazing, have not been considered [75]. At present, the vegetation classification in the study area lacks sufficient spatial and thematic resolution, which could be generated by more sophisticated equipment and methodologies in the future. Overall, a comprehensive understanding of anthropogenic and climatic impacts on vegetation cover dynamics in northern arid and semi-arid regions remains incomplete, necessitating further systematic investigation into their relative contributions and controlling mechanisms.

5. Conclusions

The TRB serves as a vital ecological security barrier in the arid and semi-arid regions of northern China, playing a unique ecological role with significant implications for regional and even global ecological conservation and sustainable development. This study explored the spatiotemporal distribution of the FVC in the TRB from 1986 to 2023. It predicted the trend of FVC changes using the Hurst exponent and identified the driving factors influencing variations in vegetation coverage and their respective contributions through a residual trend analysis. Spatially, areas with higher FVC values are predominantly situated in the southeastern and southwestern parts of the TRB, whereas the northern TRB has a lower FVC. Temporally, the average FVC decreased slightly from 43.41% in 1986 to 42.72% in 2023, indicating an overall declining trend in the vegetation conditions. Over the 38-year period, areas exhibiting a positive correlation between the FVC and precipitation constituted 58.76% of the TRB, whereas areas with a negative correlation accounted for 41.24%. For the relationship between the FVC and the temperature, areas with a positive correlation made up 37.73% of the basin, whereas areas with a negative correlation constituted 62.27%.
Approximately 25.97% of the TRB shows an increase in FVC, primarily driven by the combined effects of climate change and human activities. Conversely, approximately 26.89% of the TRB indicates that combined effects are driving factors for the decrease in the FVC; these areas are predominantly distributed in the southwestern and eastern regions of the TRB. Among the climatic factors, precipitation emerged as the predominant determinant of the vegetation dynamics. Considering human activities, the dynamic characteristics of land use/land cover (LULC) are reflected in the increase in grassland and vegetation coverage. Regarding future tendencies, the changes in the vegetation dynamics of the TRB are inconsistent. Moreover, areas with continuous improvement are predominantly distributed in the central and southwestern regions of the TRB.
Overall, climate change and human activities have significantly influenced vegetation coverage changes in the TRB. Future research could delve deeper into the interactions between these factors and offer recommendations to the government for sustainable ecological management.

Author Contributions

Conceptualization, Z.W. and Y.J.; methodology, Z.W. and Y.J.; software, Z.W. and J.L.; validation, Y.J. and G.L.; formal analysis, Z.W.; investigation, Z.L., M.W. and J.Z.; data curation, Z.W.; writing—original draft preparation, Z.W.; writing—review and editing, Z.W., Y.J. and C.N.; visualization, Z.W., J.L. and J.J.; supervision, Y.J. All authors have read and agreed to the published version of the manuscript.

Funding

This research was jointly supported by: the IWHR Research and Development Support Program (Grant no. MK2023J12), the Natural Science Foundation of Inner Mongolia Autonomous Region (Grant no. 2024MS05042), National Key Research and Development Program of China (Grant no. 2023YFF1304201), National Key Research and Development Program of China (Grant no. 2024YFE0213100),the Science and Technology Plan Projects of Inner Mongolia (Grant no. MK0143A012022) and the National Natural Science Foundation of China (Grant no. 42072291).

Data Availability Statement

The original contributions presented in this study are included in the article. Further inquiries can be directed to the corresponding author.

Conflicts of Interest

The authors declare no conflicts of interest. The funders had no role in the design of the study; in the collection, analyses, or interpretation of data; in the writing of the manuscript; or in the decision to publish the results.

References

  1. Ge, W.; Han, J.; Zhang, D.; Wang, F. Divergent impacts of droughts on vegetation phenology and productivity in the Yungui Plateau, southwest China. Ecol. Indic. 2021, 127, 107743. [Google Scholar] [CrossRef]
  2. Ramzan, M.; Abbasi, K.R.; Salman, A.; Dagar, V.; Alvarado, R.; Kagzi, M. Towards the dream of go green: An empirical importance of green innovation and financial depth for environmental neutrality in world’s top 10 greenest economies. Technol. Forecast. Soc. Change 2023, 189, 122370. [Google Scholar] [CrossRef]
  3. Xin, Y.; Khan, R.U.; Dagar, V.; Qian, F. Do international resources configure SMEs’ sustainable performance in the digital era? Evidence from Pakistan. Resour. Policy 2023, 80, 103169. [Google Scholar] [CrossRef]
  4. Islam, M.M.; Khan, M.K.; Tareque, M.; Jehan, N.; Dagar, V. Impact of globalization, foreign direct investment, and energy consumption on CO2 emissions in Bangladesh: Does institutional quality matter? Environ. Sci. Pollut. Res. 2021, 28, 48851–48871. [Google Scholar] [CrossRef] [PubMed]
  5. Liu, Y.; Lei, H. Responses of natural vegetation dynamics to climate drivers in China from 1982 to 2011. Remote Sens. 2015, 7, 10243–10268. [Google Scholar] [CrossRef]
  6. Turan, V.; Schröder, P.; Bilen, S.; Insam, H.; Ju’arez, M.-D. Co-inoculation effect of Rhizobium and Achillea millefolium L. oil extracts on growth of common bean (Phaseolus vulgaris L.) and soil microbial-chemical properties. Sci. Rep. 2019, 9, 15178. [Google Scholar] [CrossRef]
  7. Xie, M.; Irfan, M.; Razzaq, A.; Dagar, V. Forest and mineral volatility and economic performance: Evidence from frequency domain causality approach for global data. Resour. Policy 2022, 76, 102685. [Google Scholar] [CrossRef]
  8. Guo, D.; Yu, E.; Wang, H. Will the Tibetan Plateau warming depend on elevation in the future? J. Geophys. Res.-Atmos. 2016, 121, 3969–3978. [Google Scholar] [CrossRef]
  9. Jin, X.; Liu, J.; Wang, S.; Xia, W. Vegetation dynamics and their response to groundwater and climate variables in Qaidam Basin, China. J. Remote Sens. 2016, 37, 710–728. [Google Scholar] [CrossRef]
  10. Jiang, H.; Xu, X.; Guan, M.; Wang, L.; Huang, Y.; Jiang, Y. Determining the contributions of climate change and human activities to vegetation dynamics in ago-pastural transitional zone of northern China from 2000 to 2015. Sci. Total Environ. 2020, 718, 134871. [Google Scholar] [CrossRef]
  11. Qiao, B.; Cao, X.; Yang, H.; Wang, N.; Liu, X.; Zhou, B.; Zhao, H.; Liu, X.; Wang, Y.; Wang, Z.; et al. Nonlinear threshold effects of environmental drivers on vegetation cover in mountain ecosystems: From constraint mechanisms to adaptive management. Ecol. Indic. 2025, 173, 113328. [Google Scholar] [CrossRef]
  12. Zhu, L.; Sun, S.; Li, Y.; Liu, X.; Hu, K. Effects of climate change and anthropogenic activity on the vegetation greening in the Liaohe River Basin of northeastern China. Ecol. Indic. 2023, 148, 110105. [Google Scholar] [CrossRef]
  13. Xiong, Q.; Xiao, Y.; Halmy, M.W.A.; Dakhil, M.A.; Liang, P.; Liu, C.; Zhang, L.; Pandey, B.; Pan, K.; El Kafraway, S.B.; et al. Monitoring the impact of climate change and human activities on grassland vegetation dynamics in the northeastern Qinghai-Tibet Plateau of China during 2000–2015. J. Arid Land 2019, 11, 637–651. [Google Scholar] [CrossRef]
  14. Zhang, Z.; Chang, J.; Xu, C.; Zhou, Y.; Wu, Y.; Chen, X.; Jiang, S.; Duan, Z. The response of lake area and vegetation cover variations to climate change over the Qinghai-Tibetan Plateau during the past 30 years. Sci. Total Environ. 2018, 635, 443–451. [Google Scholar] [CrossRef]
  15. Gao, X.; Huete, A.R.; Ni, W.G.; Miura, T. Optical-biophysical relationships of vegetation spectra without background contamination. Remote Sens. Environ. 2000, 74, 609–620. [Google Scholar] [CrossRef]
  16. Lehnert, L.; Meyer, H.; Wang, Y.; Miehe, G.; Thies, B.; Reudenbach, C.; Bendix, J. Retrieval of grassland plant coverage on the Tibetan Plateau based on a multiscale, multi-sensor and multi-method approach. Remote Sens. Environ. 2015, 164, 197–207. [Google Scholar] [CrossRef]
  17. Liu, Y.; Li, Z.; Chen, Y.; Li, Y.; Li, H.; Xia, Q.; Kayumba, P.M. Evaluation of consistency among three NDVI products applied to High Mountain Asia in 2000–2015. Remote Sens. Environ. 2022, 269, 112821. [Google Scholar] [CrossRef]
  18. Liu, Q.; Qiao, J.; Li, M.; Dun, Y.; Zhu, X.; Ji, X. Spatiotemporal evolution of ecological environmental quality and its dynamic relationships with landscape pattern in the Zhengzhou Metropolitan Area: A perspective based on nonlinear effects and spatiotemporal heterogeneity. J. Clean. Prod. 2024, 2024, 144102. [Google Scholar] [CrossRef]
  19. Zhou, Q.; Chen, W.; Wang, H.; Wang, D. Spatiotemporal evolution and driving factors analysis of fractional vegetation coverage in the arid region of northwest China. Sci. Total Environ. 2024, 954, 176271. [Google Scholar] [CrossRef]
  20. Wang, K.; Zheng, H.; Zhao, X.; Sang, Z.; Yan, W.; Cai, Z.; Xu, Y. Landscape ecological risk assessment of the Hailar River basin based on ecosystem services in China. Ecol. Ind. 2023, 147, 109795. [Google Scholar] [CrossRef]
  21. Liu, C.; Zhang, X.; Wang, T.; Chen, G.; Zhu, K.; Wang, Q.; Wang, J. Detection of vegetation coverage changes in the Yellow River Basin from 2003 to 2020. Ecol. Indic. 2022, 138, 108818. [Google Scholar] [CrossRef]
  22. Zhu, B.; Liao, J.; Shen, G. Combining time series and land cover data for analyzing spatio-temporal changes in mangrove forests: A case study of Qinglangang Nature Reserve, Hainan, China. Ecol. Indic. 2021, 131, 1835. [Google Scholar] [CrossRef]
  23. Chu, H.; Venevsky, S.; Wu, C.; Wang, M. NDVI-based vegetation dynamics and its response to climate changes at Amur-Heilongjiang River Basin from 1982 to 2015. Sci. Total Environ. 2019, 650, 2051–2062. [Google Scholar] [CrossRef]
  24. Geng, X.; Wang, X.; Fang, H.; Ye, J.; Han, L.; Gong, Y.; Cai, D. Vegetation coverage of desert ecosystems in the Qinghai-Tibet Plateau is underestimated. Ecol. Indic. 2022, 137, 108780. [Google Scholar] [CrossRef]
  25. Hansen, M.; Potapov, P.; Moore, R.; Hancher, M.; Turubanova, S.; Tyukavina, A.; Thau, D.; Stehman, S.; Goetz, S.; Loveland, T.; et al. High-resolution global maps of 21st-century forest cover change. Science 2013, 42, 850–853. [Google Scholar] [CrossRef] [PubMed]
  26. Fu, B.; Yang, W.; Yao, H.; He, H.; Lan, G.; Gao, E.; Qin, J.; Fan, D.; Chen, Z. Evaluation of spatiotemporal variations of FVC and its relationship with climate change using GEE and Landsat images in Ganjiang River Basin. Geocarto Int. 2022, 37, 13658–13688. [Google Scholar] [CrossRef]
  27. Tian, H.; Cao, C.; Chen, W.; Bao, S.; Yang, B.; Myneni, R. Response of vegetation activity dynamic to climatic change and ecological restoration programs in Inner Mongolia from 2000 to 2012. Ecol. Eng. 2015, 82, 276–289. [Google Scholar] [CrossRef]
  28. Turan, V. Arbuscular mycorrhizal fungi and pistachio husk biochar combination reduces Ni distribution in mungbean plant and improves plant antioxidants and soil enzymes. Physiol. Plant. 2021, 173, 418–429. [Google Scholar] [CrossRef]
  29. Jiapaer, G.; Liang, S.; Yi, Q.; Liu, J. Vegetation dynamics and responses to recent climate change in Xinjiang using leaf area index as an indicator. Ecol. Indic. 2015, 58, 64–76. [Google Scholar] [CrossRef]
  30. Dagar, V.; Khan, M.K.; Alvarado, R.; Usman, M.; Zakari, A.; Rehman, A.; Murshed, M.; Tillaguango, B. Variations in technical efficiency of farmers with distinct land size across agro-climatic zones: Evidence from India. J. Clean. Prod. 2021, 315, 128109. [Google Scholar] [CrossRef]
  31. Sun, Y.; Yang, Y.; Zhang, Y.; Wang, Z. Assessing vegetation dynamics and their relationships with climatic variability in northern China. Phys. Chem. Earth. 2015, 87–88, 79–86. [Google Scholar] [CrossRef]
  32. Shi, S.; Yu, J.; Wang, F.; Wang, P.; Zhang, Y.; Jin, K. Quantitative contributions of climate change and human activities to vegetation changes over multiple time scales on the Loess Plateau. Sci. Total Environ. 2021, 755, 142419. [Google Scholar] [CrossRef] [PubMed]
  33. Zhao, S.; Pereira, P.; Wu, X.Q.; Zhou, J.X.; Cao, J.H.; Zhang, W.X. Global karst vegetation regime and its response to climate change and human activities. Ecol. Indic. 2020, 113, 106208. [Google Scholar] [CrossRef]
  34. Jiang, L.; Jiapaer, G.; Bao, A.; Guo, H.; Ndayisaba, F. Vegetation dynamics and responses to climate change and human activities in Central Asia. Sci. Total Environ. 2017, 599–600, 967–980. [Google Scholar] [CrossRef]
  35. Mahmoud, S.; Gan, T. Impact of anthropogenic climate change and human activities on environment and ecosystem services in arid regions. Sci. Total Environ. 2018, 633, 1329–1344. [Google Scholar] [CrossRef]
  36. Wang, F.; Duan, K.; Fu, S.; Gou, F.; Liang, W.; Yan, J.; Zhang, W. Partitioning climate and human contributions to changes in mean annual streamflow based on the Budyko complementary relationship in the Loess Plateau, China. Sci. Total Environ. 2019, 665, 579–590. [Google Scholar] [CrossRef]
  37. Wu, J.; Li, M.; Zhang, X.; Fiedler, S.; Gao, Q.; Zhou, Y.; Cao, W.; Hassan, W.; Mărgărint, M.C.; Tarolli, P. Disentangling climatic and anthropogenic contributions to nonlinear dynamics of alpine grassland productivity on the Qinghai-Tibetan plateau. J. Environ. Manag. 2021, 281, 111875. [Google Scholar] [CrossRef]
  38. Xu, D.; Li, C.; Song, X.; Ren, H. The dynamics of desertification in the farming-pastoral region of North China over the past 10 years and their relationship to climate change and human activity. Catena 2014, 123, 11–22. [Google Scholar] [CrossRef]
  39. Peng, S. 1-km Monthly Precipitation Dataset for China (1901–2023); National Tibetan Plateau/Third Pole Environment Data Center: Beijing, China, 2020. [Google Scholar]
  40. Yang, J.; Huang, X. The 30m annual land cover datasets and its dynamics in China from 1985 to 2023. Earth Syst. Sci. Data 2024, 13, 3907–3925. [Google Scholar] [CrossRef]
  41. Vulova, S.; Rocha, A.; Meier, F.; Nouri, H.; Schulz, C.; Soulsby, C.; Tetzlaff, D.; Kleinschmit, B. City-wide, high-resolution mapping of evapotranspiration to guide climate-resilient planning. Remote Sens. Environ. 2023, 287, 113487. [Google Scholar] [CrossRef]
  42. Shao, Y.; Lunetta, R.; Wheeler, B.; Iiames, J.; Campbell, J. An evaluation of time-series smoothing algorithms for land-cover classifications using MODIS-NDVI multi-temporal data. Remote Sens. Environ. 2016, 174, 258–265. [Google Scholar] [CrossRef]
  43. Hill, M.; Guerschman, J. Global trends in vegetation fractional cover: Hotspots for change in bare soil and non-photosynthetic vegetation. Agric. Ecosyst. Environ. 2022, 324, 107719. [Google Scholar] [CrossRef]
  44. Rouse, J.; Haas, R.; Schell, J.; Deering, D. Monitoring vegetation systems in the Great Plains with ERTS. NASA Spec. Publ. 1974, 351, 309. [Google Scholar]
  45. Li, F.; Chen, W.; Zeng, Y.; Zhao, Q.; Wu, B. Improving estimates of grassland fractional vegetation cover based on a pixel dichotomy model: A case study in inner Mongolia, China. Remote Sens. 2014, 6, 4705–4722. [Google Scholar] [CrossRef]
  46. SL 190–2007; Ministry of Water Resources of the People’s Republic of China. Standard for Classification and Gradation of Soil Erosion. China Water & Power Press: Beijing, China, 2008. (In Chinese)
  47. Yang, S.; Song, S.; Li, F.; Yu, M.; Yu, G.; Zhang, Q.; Cui, H.; Wang, R.; Wu, Y. Vegetation coverage changes driven by a combination of climate change and human activities in Ethiopia, 2003–2018. Ecol. Inform. 2022, 71, 101776. [Google Scholar] [CrossRef]
  48. Peng, J.; Li, Y.; Tian, L.; Liu, Y.; Wang, Y. Vegetation dynamics and associated driving forces in eastern China during 1999–2008. Remote Sens. 2015, 7, 13641–13663. [Google Scholar] [CrossRef]
  49. Sen, P. Estimates of the regression coefficient based on Kendall’s tau. J. Am. Stat. Assoc. 1968, 63, 1379–1389. [Google Scholar] [CrossRef]
  50. Zhou, X.; Yamaguchi, Y.; Arjasakusuma, S. Distinguishing the vegetation dynamics induced by anthropogenic factors using vegetation optical depth and AVHRR NDVI: A crossborder study on the Mongolian Plateau. Sci. Total Environ. 2018, 616–617, 730–743. [Google Scholar] [CrossRef]
  51. Luo, M.; Sa, C.; Meng, F.; Duan, Y.; Liu, T.; Bao, Y. Assessing extreme climatic changes on a monthly scale and their implications for vegetation in Central Asia. J. Clean. Prod. 2020, 271, 122396. [Google Scholar] [CrossRef]
  52. Mohammed, S.; Gill, A.; Alsafadi, K.; Hijazi, O.; Yadav, K.; Hasan, M.; Khan, A.; Islam, S.; Cabral-Pinto, M.; Harsanyi, E. An overview of greenhouse gases emissions in Hungary. J. Clean. Prod. 2021, 314, 127865. [Google Scholar] [CrossRef]
  53. Jiang, W.; Yuan, L.; Wang, W.; Cao, R.; Zhang, Y.; Shen, W. Spatio-temporal analysis of vegetation variation in the Yellow River Basin. Ecol. Indic. 2015, 51, 117–126. [Google Scholar] [CrossRef]
  54. Zhang, M.; Wu, X. The rebound effects of recent vegetation restoration projects in Mu Us Sandy land of China. Ecol. Indic. 2020, 113, 106228. [Google Scholar] [CrossRef]
  55. Zhang, Y.; He, Y.; Li, Y.; Jia, L. Spatiotemporal variation and driving forces of NDVI from 1982 to 2015 in the Qinba Mountains, China. Environ. Sci. Pollut. Res. 2022, 29, 52277–52288. [Google Scholar] [CrossRef] [PubMed]
  56. Hurst, H.E. Long-term storage capacity of reservoirs. Trans. Am. Soc. Civ. Eng. 1951, 116, 770–799. [Google Scholar] [CrossRef]
  57. Mandelbrot, B.; Wallis, J. Robustness of the rescaled range R/S in the measurement of noncyclic long run statistical dependence. Water Resour. Res. 1969, 5, 967–988. [Google Scholar] [CrossRef]
  58. Bashir, B.; Cao, C.; Naeem, S.; Joharestani, M.; Bo, X.; Afzal, H.; Jamal, K.; Mumtaz, F. Spatio-temporal vegetation dynamic and persistence under climatic and anthropogenic factors. Remote Sens. 2020, 12, 2612. [Google Scholar] [CrossRef]
  59. Gu, Z.; Duan, X.; Shi, Y.; Li, Y.; Pan, X. Spatiotemporal variation in vegetation coverage and its response to climatic factors in the Red River Basin, China. Ecol. Indic. 2018, 93, 54–64. [Google Scholar] [CrossRef]
  60. Qu, S.; Wang, L.; Lin, A.; Yu, D.; Yuan, M.; Li, C. Distinguishing the impacts of climate change and anthropogenic factors on vegetation dynamics in the Yangtze River Basin, China. Ecol. Indic. 2020, 108, 105724. [Google Scholar] [CrossRef]
  61. Tong, S.; Zhang, J.; Bao, Y.; Lai, Q.; Lian, X.; Li, N.; Bao, Y. Analyzing vegetation dynamic trend on the Mongolian Plateau based on the Hurst exponent and influencing factors from 1982–2013. J. Geogr. Sci. 2018, 28, 595–610. [Google Scholar] [CrossRef]
  62. Huang, Y.; Jiang, N.; Shen, M.; Guo, L. Effect of preseason diurnal temperature range on the start of vegetation growing season in the Northern Hemisphere. Ecol. Indic. 2020, 112, 106161. [Google Scholar] [CrossRef]
  63. Piao, S.; Tan, J.; Chen, A.; Fu, Y.H.; Ciais, P.; Liu, Q.; Janssens, I.A.; Vicca, S.; Zeng, Z.; Jeong, S.J.; et al. Leaf onset in the northern hemisphere triggered by daytime temperature. Nat. Commun. 2015, 6, 6911. [Google Scholar] [CrossRef]
  64. Wang, J.; Xie, Y.; Wang, X.; Guo, K. Driving Factors of Recent Vegetation Changes in Hexi Region, Northwest China Based on a New Classification Framework. Remote Sens. 2020, 12, 1758. [Google Scholar] [CrossRef]
  65. Sun, W.; Song, X.; Mu, X.; Gao, P. Spatiotemporal vegetation cover variations associated with climate change and ecological restoration in the Loess Plateau. Agric. For. Meteorol. 2015, 209–210, 87–99. [Google Scholar] [CrossRef]
  66. Yu, Z.; Liu, Q.; Zhang, Y.; Ju, L.; Miao, L. Changes of NDVI and driving factors in different grasslands in the Inner Mongolia. Acta Ecol. Sin. 2024, 44, 10068–10082. [Google Scholar]
  67. Wei, Y.; Lu, H.; Wang, J.; Wang, X.; Sun, J. Dual influence of climate change and anthropogenic activities on the spatiotemporal vegetation dynamics over the qinghai-tibetan plateau from 1981 to 2015. Earths Future 2022, 10, e2021EF002566. [Google Scholar] [CrossRef]
  68. Hua, W.; Lin, Z.; Guo, D.; Fan, G.; Zhang, Y.; Yang, K.; Hu, Q.; Zhu, L. Simulated longterm vegetation-climate feedbacks in the tibetan plateau. Asia-Pac. J. Atmos. Sci. 2019, 55, 41–52. [Google Scholar] [CrossRef]
  69. Li, J.; Liu, H.; Li, C.; Li, L. Changes of green-up day of vegetation growing season based on GIMMS 3g NDVI in northern China in recent 30 years. Sci. Geogr. Sin. 2017, 37, 620–629. [Google Scholar]
  70. Qin, Y.; Xiao, X.; Wigneron, J.; Ciais, P.; Canadell, J.; Brandt, M.; Li, X.; Fan, L.; Wu, X.; Tang, H.; et al. Large loss and rapid recovery of vegetation cover and aboveground biomass over forest areas in Australia during 2019–2020. Remote Sens. Environ. 2022, 278, 113087. [Google Scholar] [CrossRef]
  71. An, Y. Vegetation NDVI and Phenology Change in Northern China Based on Remote Sensing; East China Normal University: Shanghai, China, 2014. [Google Scholar]
  72. Xin, Z.; Xu, J.; Wei, Z. Spatiotemporal variations of vegetation cover on the Chinese Loess Plateau (1981–2006): Impacts of climate changes and human activities. Sci. China Ser. D 2008, 51, 67–78. [Google Scholar] [CrossRef]
  73. Piao, S.; Yin, G.; Tan, J.; Cheng, L.; Huang, M.; Li, Y.; Liu, R.; Mao, J.; Myneni, R.; Peng, S.; et al. Detection and attribution of vegetation greening trend in China over the last 30 years. Glob. Change Biol. 2015, 21, 1601–1609. [Google Scholar] [CrossRef]
  74. Tian, H. Assessment of Non-Climate Triggered Vegetation Trends in China from Time Series of Remotely Sensed Data: A Case Study of Government-Dominated Forest Construction; Institute of Remote Sensing and Digital Earth, Chinese Academy of Sciences: Beijing, China, 2017. [Google Scholar]
  75. Liu, X.; Zhu, X.; Pan, Y.; Li, S.; Ma, Y.; Nie, J. Vegetation dynamics in Qinling-Daba Mountains in relation to climate factors between 2000 and 2014. J. Geogr. Sci. 2016, 26, 45–58. [Google Scholar] [CrossRef]
Figure 1. Schematic diagram of the study area. (a) Location map of the study area; (b) Distribution of main vegetation types.
Remotesensing 17 02490 g001
Figure 2. Study framework. Notes: Step 1, data acquisition; Step 2, data processing; Step 3, analysis methods; Step 4, results and discussion.
Remotesensing 17 02490 g002
Figure 3. Spatial distribution of FVC in the TRB. (a) Spatial distribution of FVC levels from 1986 to 2023; (b) Sankey diagram of FVC levels transfer from 1986 to 2023.
Remotesensing 17 02490 g003
Figure 4. Temporal variations and trends of FVC in the TRB. (a) Annual average FVC from 1986 to 2023; (b) Percentages of FVC under different levels from 1986 to 2023.
Remotesensing 17 02490 g004
Figure 5. The spatial patterns of FVC trends across the TRB from 1986 to 2023: (a) Sen’s slope analysis results and (b) FVC trends based on the combination of Sen’s slope and MK. Notes: SD, significant decrease; ISD, insignificant decrease; ST, stabilization; ISI: insignificant increase; SI, significant increase.
Remotesensing 17 02490 g005
Figure 6. Spatial distributions of future vegetation dynamics in the TRB: (a) the Hurst exponent of FVC and (b) sustainability of FVC. Notes: ND, negative development; AND, anti-persistent negative development; SD: stable development, APD, anti-persistent positive development; PD, positive development.
Remotesensing 17 02490 g006
Figure 7. Spatiotemporal characteristics of precipitation and temperature in the TRB from 1986 to 2023: (a) annual average precipitation; (b) spatial pattern of precipitation; (c) annual average temperature; (d) spatial pattern of temperature.
Remotesensing 17 02490 g007aRemotesensing 17 02490 g007b
Figure 8. Spatial pattern of the partial correlation coefficients between FVC and (a) precipitation and (b) temperature in the TRB from 1986–2023.
Remotesensing 17 02490 g008
Figure 9. Drive factors of vegetation cover change in TRB during 1986–2023 (CC and HA represent climatic change and human activities, respectively).
Remotesensing 17 02490 g009
Figure 10. Spatiotemporal patterns of climate (a) versus anthropogenic contributions (b) to vegetation coverage (FVC) changes in the TRB (1986−2023).
Remotesensing 17 02490 g010
Figure 11. Spatial pattern of LULC types in the TRB during 1985–2023.
Remotesensing 17 02490 g011
Figure 12. Chord diagrams of LULC transfer in the TRB: (a) 1985–2000; (b) 2000–2023; (c) 1985–2023. Notes: Beginning with I and F for the initial and final period of the land use, respectively. I_G: I_Grassland, I_C: I_Copland, I_F: I_Forest, I_W: I_Water, I_B: I_Barren, I_I: I_Impervious, F_G: F_Grassland, F_C: I_Copland, F_F: I_Forest, F_W: F_Water, F_B: F_Barren, F_I: I_Impervious.
Remotesensing 17 02490 g012
Table 1. Classification standard for FVC.
Vegetation Cover (%)Categories (Level)Landscape Features
0 ≤ FVC < 30%Extremely low coverage (I)Deserts, bare land
30% ≤ FVC < 45%Low coverage (II)Sparse vegetation, sparse grassland, built-up areas
45% ≤ FVC < 60%Middle coverage (III)Middle-yield grassland, cropland
60% ≤ FVC < 75%Middle high coverage (IV)High-yield grassland, cropland, shrubland
75% ≤ FVC < 100%High coverage (V)Lush vegetation, high-yield grassland, dense (irrigated) woodland
Table 2. Determination criteria and quantification of contributions for the driving factors of FVC change.
Slope (FVCobs)Driving FactorsDivision CriteriaContribution Rate/%
Slope (FVCCC)Slope (FVCHA)Climate Change (CC)Human Activity (HA)
>0CC and HA>0>0CCCCHA
CC>0<01000
HA<0>00100
<0CC and HA<0<0CCCCHA
CC<0>01000
HA>0<00100
Disclaimer/Publisher’s Note: The statements, opinions and data contained in all publications are solely those of the individual author(s) and contributor(s) and not of MDPI and/or the editor(s). MDPI and/or the editor(s) disclaim responsibility for any injury to people or property resulting from any ideas, methods, instructions or products referred to in the content.

